Article

Research on the Mechanism of Reverse Sand Addition in Horizontal Shale Gas Well Fracturing Based on Intergranular Erosion of Proppants in near Wellbore Fractures

1
CNPC Greatwall Drilling Co., Beijing 100101, China
2
Key Laboratory of Enhanced Oil & Gas Recovery of Ministry of Education, Northeast Petroleum University, Daqing 163318, China
*
Author to whom correspondence should be addressed.
Appl. Sci. 2025, 15(17), 9589; https://doi.org/10.3390/app15179589
Submission received: 29 July 2025 / Revised: 22 August 2025 / Accepted: 29 August 2025 / Published: 30 August 2025
(This article belongs to the Topic Enhanced Oil Recovery Technologies, 4th Edition)

Abstract

To improve fracturing support efficiency of terrestrial shale oil reservoirs with uneven proppant placement, this study used complex mesh flat-plate simulations and ANSYS FLUENT (2020) simulations to test four sand addition processes. Proppants were 70/140 mesh quartz sand with a density of 2650 kg/m3 and 40/70 mesh ceramic particles with a density of 2000 kg/m3, and the carrier was hydroxypropyl guar gum fracturing fluid with a viscosity of 4.46–13.4 mPa·s at 25 °C. Alternating sand addition performed best: sand-laying efficiency reached 52 percent, 10 percentage points higher than continuous sand addition and 12 percentage points higher than mixed sand addition; sand embankment void area was 1400 cm2, 18.3 percent lower than continuous sand addition; proppant entry into secondary cracks increased 23.8 percent compared with reverse sand addition; at branch crack Position 2, 1.3 m from the inlet and at a 90-degree angle, its equilibrium height was 210 mm and paving rate 0.131. This study fills gaps of no systematic multi-process comparison and insufficient quantification of crack geometry–sand parameter coupling in existing research; its novelty lies in the unified visualization comparison of four processes, revealing geometry–parameter coupling and integrating experiment simulation; the optimal scheme also improves fracture support efficiency 21.5 percent compared with conventional continuous sand addition.

1. Introduction

Shale oil, as a core resource for global unconventional energy development, has key strategic significance in alleviating the supply–demand imbalance of traditional oil and gas and optimizing the energy structure [1,2]. According to on-site data, the production contribution rate of fractured wells in shale oil reservoirs in China accounts for over 35% of the total unconventional oil and gas production [2,3,4]. However, the effectiveness of segmented fracturing in horizontal wells highly depends on the long-term conductivity of fractures, and the reasonable placement of proppants in complex fracture networks is the core prerequisite for ensuring conductivity [3,4,5,6]. Currently, conventional hydraulic fracturing mostly adopts continuous sand addition technology but generally faces two major problems: First, the proppant in the near-wellbore area is eroded and worn due to high-velocity particle collision, resulting in a 30% to 40% decrease in the support strength of near-wellbore fractures [7]. The second issue is the uneven distribution of proppants in complex fractures (main fractures + multi-stage branch fractures), with a secondary fracture filling rate of only 25% to 30%, and even ‘vacancy’ in distal branch fractures, directly causing a 40% to 50% decrease in production capacity within one year after fracturing [8]. For example, on-site testing of shale oil wells in the Songliao Basin of China showed that 60% of fracturing wells using continuous sand addition did not achieve the expected production capacity due to defects in proppant placement [9,10], and there is an urgent need to optimize the sand addition process to solve the above bottlenecks.
The migration and settlement behavior of proppants in fractures is a key scientific issue in hydraulic fracturing technology. Scholars at home and abroad have conducted systematic research on this through theoretical analysis, experimental research, and numerical simulation methods. Early research can be traced back to Stokes’ pioneering work on the influence of internal fluid friction on pendulum motion, laying the foundation for particle settling theory. In the mid- to late 20th century, with the development of the petroleum industry, scholars began to pay attention to the settling characteristics of particles in confined spaces. Haberman and Sayre [11] systematically studied the influence of wall effects on sphere settling for the first time through flume experiments, while Francis [12] established a classical method for calculating wall correction coefficients. Clift et al. [13] systematically summarized the motion laws of particles in fluids in “Bubbles, Drops, and Particles”, providing a theoretical framework for subsequent research. Iwaoka and Ishii [14] and Fidleris and Whitmore [15] respectively verified the wall correction model for single sphere settlement in cylindrical containers through experiments.
In the field of proppant transport research, Schols and Visser [16] were the first to experimentally study the proppant accumulation process in vertical cracks under no filtration conditions and found that the particle settling velocity was significantly affected by the crack width. Kirkby and Rockefeller [17] quantitatively analyzed the settling velocity of proppants in non-flowing slurries and proposed a modified formula considering the influence of particle concentration. Sievert et al. [18] used a large vertical crack model to reveal the “dam effect” that exists during the transport of proppants. Kern et al. [19] first systematically studied the movement mechanism of sand particles during hydraulic fracturing in 1958, laying the foundation for modern research on proppant transport. After entering the 21st century, Liu [20] found through experiments and theoretical analysis that the settlement of proppants in cracks has a significant fluid dynamic blocking effect, which was later verified by multiple scholars. For the study of the behavior of proppants, Chhabra et al. [21] were the first to investigate the wall effect of spherical motion in viscoelastic fluids and found that the Weissenberg effect significantly alters the particle settling mode. Sugeng and Tanner [22] further confirmed the nonlinear effect of viscoelastic fluid near the wall on the resistance of a sphere. Malhotra and Sharma [23] found through experiments that the viscoelasticity of surfactant-based shear-thinning fluids can lead to a 30%–50% decrease in the settling velocity of proppants. Di Felice [24,25] established a quantitative relationship between porosity function and fluid particle interaction in multi-particle systems, providing a new approach for modeling proppant transport in complex rheological fluids.
In recent years, with the deepening of shale oil and gas development, scholars have begun to pay attention to the migration laws of proppants in complex fracture systems. Alotaibi and Miskimins [6] found through visualization experiments that the distribution of proppants in branch cracks exhibits significant non-uniformity. Brannon et al. [26] found in large-scale experiments that the type of proppant and the properties of fracturing fluid have a synergistic effect on transport efficiency. Anschutz et al. [27] used advanced tracing techniques to reveal the differences in proppant placement patterns in different fracturing fluid systems. Fernández et al. [28] confirmed the crucial role of eddies in the formation of proppant sand dunes through proportional model experiments. Tong et al. [29,30] used the visualization system of foam fracturing fluid to find that the bubble particle interaction will form a unique migration channel. Hou et al. [31] studied the two-phase flow slip effect of particles in supercritical CO2, providing new insights for unconventional fracturing.
Significant progress has been made in experimental research on complex fracture systems, and Huang et al. [32] confirmed in a rough vertical fracture model that injection parameters have a decisive impact on the migration trajectory of proppants. Wen et al. [33] found that natural fracture networks significantly alter the settlement path of proppants. Chun et al. [34] demonstrated through horizontal bedding fracture experiments that the amount of proppant retained on the bedding plane during hydraulic fracturing can reach 30%–40%. It is worth noting that Luo [35] used particle image velocimetry technology to conduct microscale analysis of proppant settling in narrow gaps, obtaining quantitative data on the flow field around particles for the first time. These studies collectively promote the extension of proppant transport theory from simple vertical fractures to complex three-dimensional fracture systems.
The above research provides an important theoretical and experimental basis for the migration and settlement behavior of proppants in fractures. However, there is relatively little research on the intergranular erosion effect of proppants in the near-wellbore fractures during the fracturing process of shale gas horizontal wells and its impact mechanism on sand addition technology. This article takes terrestrial shale oil reservoirs as the research object and adopts a combination of ‘complex grid flat plate physical simulation + ANSYS FLUENT numerical simulation’ to systematically explore the influence of four sand addition processes on the migration of proppants and the fracturing support effect. The focus is on analyzing the shape of the main fracture sand embankment, the sand laying law of the branch fractures, and the influence of near-wellbore proppant accumulation on fluid flow. The RNG k-ε turbulence model and DPM discrete phase model were used in the simulation to verify the experimentally observed proppant transport mechanism.

2. Experiment and Simulation

2.1. Experimental Materials

In this experiment, quartz sand is dyed red with dye, and ceramic particles are dyed yellow with dye. Both fracturing fluid (slickwater) and proppant were kept at room temperature (25 °C). All experimental materials are provided by China Petroleum Great Wall Drilling Engineering Co., Ltd. Details are shown in Table 1.

2.2. Study on the Laying Law of Proppant Under Different Sanding Processes

(1)
Experimental Principle
The experimental equipment consists of a screw pump, a sand mixing tank, a visualization crack system, a high-speed camera, and water pipes. The sand mixing tank is made of stainless steel and designed in a rectangular shape with a volume of 120 L. The upper surface of the tank is an open structure, which is convenient for adding fracturing fluid and proppants. The liquid outlet is set on the side of the tank, at a height of 9 cm from the bottom of the tank, while the discharge port is located at the bottom of the tank. The top of the sand mixing tank is equipped with a fixed mixing device, which can fully mix the supporting agent and fracturing fluid. The visual crack system is the core part of the entire experimental setup. The main crack is composed of four sealed acrylic sheets with a size of 1000 mm × 600 mm, with a fixed width of 12 mm. The branch crack is composed of six sealed acrylic sheets with the same size (1000 mm × 600 mm), with a width of 8 mm. There are four evenly distributed perforations on the left entrance end of the system, each with a diameter of 10 mm. During the experiment, only the second perforation from the top is used as the inlet channel. High-speed cameras are mainly used to capture and record in real time the distribution pattern of proppant inside cracks. The water pipe adopts a 25 mm diameter hose, which is soft in texture and has good wear resistance. Flowchart of proppant transport simulation experiment is shown in Figure 1.
Convert the on-site construction parameters of shale oil fracturing to indoor experimental parameters based on the Reynolds number similarity criterion. Calculate the Reynolds number according to Equation (1).
R e = ρ v d μ
d = 2 h w h + w
where Re is the Reynolds number of the flow field, dimensionless; ρ is the density of the liquid, kg/m3; v is the liquid linear velocity, m/s; d is the equivalent hydraulic diameter, m; μ is the liquid viscosity, kg/(m·s); h is the height of the crack, m; and w is the width of the crack, m.
According to the actual site of shale oil fracturing, the Reynolds numbers inside the fracture at different displacements in the field data and experimental data were compared, as shown in Table 2.
According to the similarity analysis, the indoor flat plate crack system is similar in dynamics to the on-site cracks, and the fluid velocity and Reynolds number match those in the actual cracks. Compared with the actual cracks, the crack height of the experimental equipment has been reduced by 16.67 times, and the on-site construction displacement is 0.0167–0.025 m3/s, corresponding to the indoor experimental displacement of 0.015–0.0024 m3/s.
(2)
Experimental steps
Complete the connection work of various components of the experimental equipment, focusing on checking the sealing condition of the interface parts, and carefully cleaning the inside of the cracks to ensure their cleanliness.
Use water pipes to circulate clean water in the system in order to test the sealing performance and liquid circulation effect of the equipment. After completing the inspection, promptly drain the clean water.
Prepare the required fracturing fluid, proppants, and other materials according to the experimental design requirements. Adjust the camera position, accurately control the distance between it and the flat crack, and capture the wide angle to ensure that the camera can fully record the image of the crack area.
According to the established sand ratio, add fracturing fluid and proppant to the sand mixing tank, and then turn on the mixer to ensure that the two are thoroughly and evenly mixed.
Once the proppant begins to enter the crack, quickly turn on the camera to capture real-time footage of the formation and changes in the sand embankment within the crack.
When all the proppants have been injected and the floating sand at the inlet has completely disappeared, it is determined that the experiment has reached the termination condition.
Discharge the fracturing fluid and proppant from the sand mixing tank through the discharge port, and then inject clean water with a large displacement pump to circulate and flush the experimental equipment.
Continue flushing until there is no residual proppant in the crack, then open the discharge port of the sand mixing tank, thoroughly drain the fracturing fluid and proppant from the tank until all the water in the crack and sand mixing tank is drained, and turn off the screw pump and power switch in sequence.

2.3. Simulation Section

In order to study the laying law of proppants in fracture models under different conditions, it is necessary to establish a basic equation that considers the coupled motion of fluid and proppants in near-wellbore fractures. The required basic equation is as follows:
(3)
Fluid flow
During the fracturing process, the fluid flow inside the crack can be represented by Equations (3) and (4).
ρ u t = p l + μ ( μ + ( μ ) T ) + F + ρ g
ρ · ( u ) = 0
(4)
Particle gravity
F g = m p g ρ p ρ ρ p
(5)
The drag force of fluid on particles
The drag force of fluid on particles conforms to Stokes’ law:
F D = 1 τ P m P ( u v )
τ P = ρ P d P 2 18 μ
(6)
Initial conditions
Initial conditions of the fluid:
p int = p + p H ydro
p h y d r o = ρ r e f g ( r r r e f )
Initial conditions for particles:
q = q 0
v = v 0
(7)
Boundary conditions
The velocity of the fluid at the inlet is:
u = U 0 · n
The pressure of the fluid at the outlet is:
[ p l + μ ( u + ( u ) T ) ] n = ( p ^ 0 + p hydro ) n
p ^ 0 p 0
If a particle rebounds on a wall, its velocity is:
v = v c 2 ( n v c ) n
Based on the actual fracture characteristics of shale gas wells, a fracture geometry model and boundary conditions are established in Table 3.
The flowchart is shown in Figure 2.

3. Experimental Results and Analysis

3.1. Transport Characteristics of Proppants in the Near-Wellbore Zone Under Different Sand Addition Processes

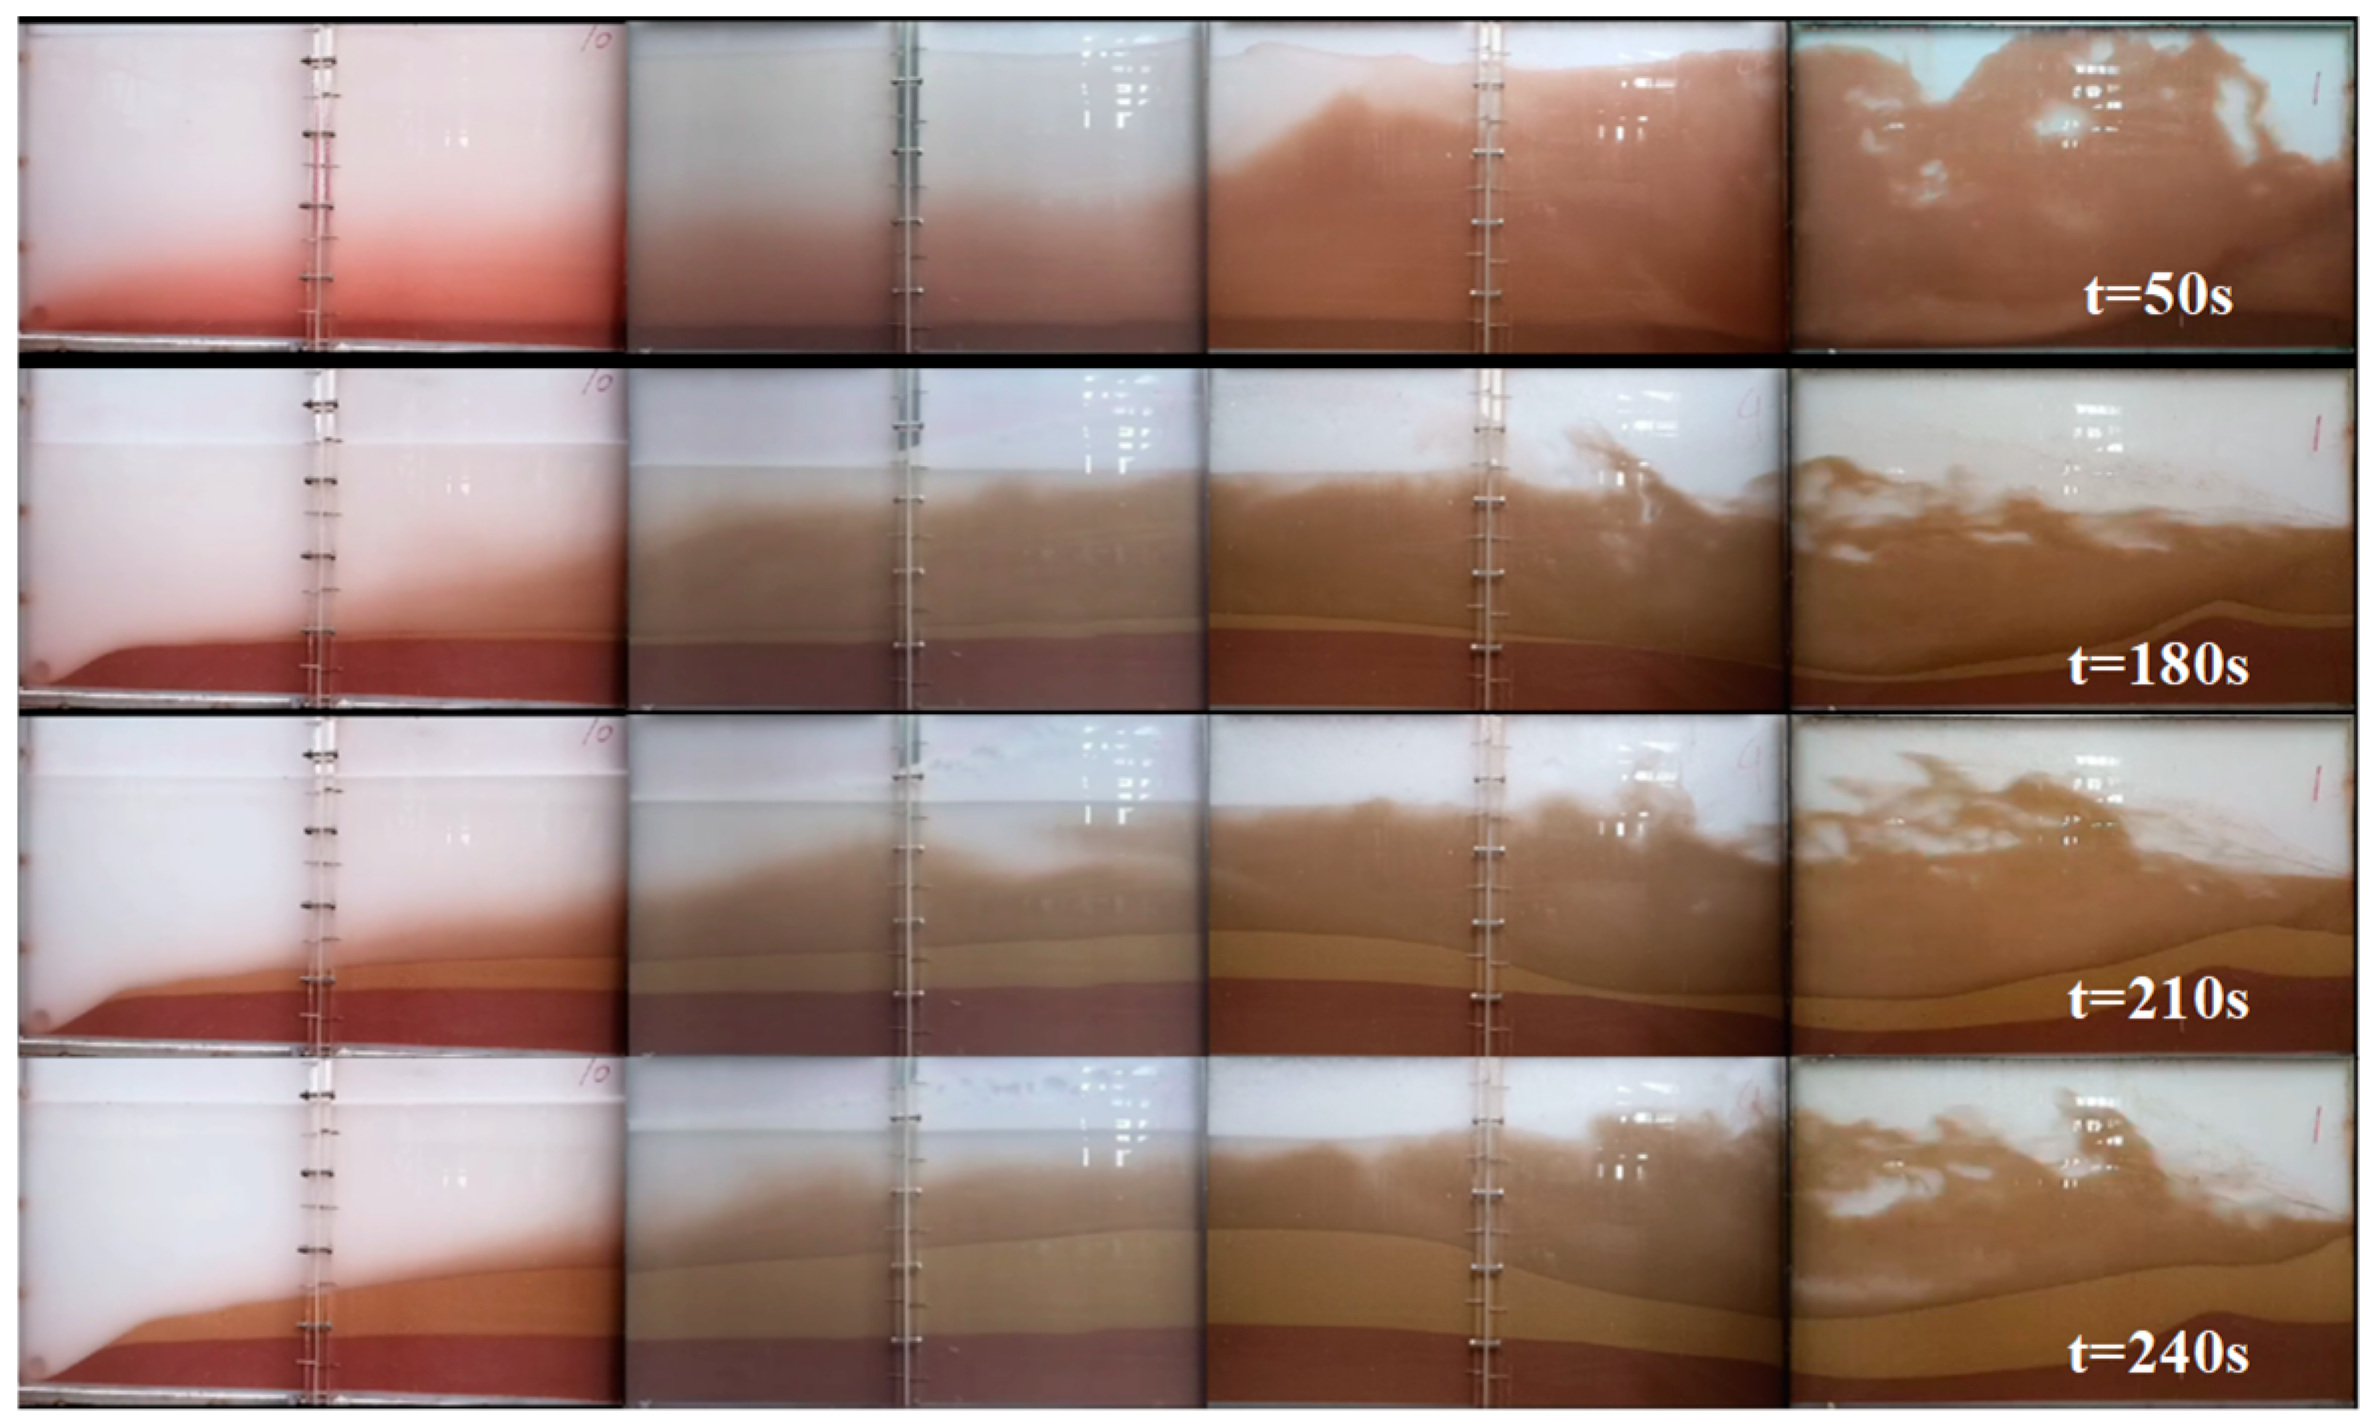
According to the experimental procedure in the second section, experimental research was conducted on the migration of proppants in the near-wellbore zone under different sand addition processes. The migration state of proppants under continuous sand addition conditions at different times is shown in Figure 3.
From Figure 3, it can be seen that as the experiment progresses, the height of the sand embankment at different positions gradually increases. The effect of the fracturing fluid on the drag force of the proppant is that the sand embankment height at the inlet end of the proppant is higher and the outlet position is relatively lower. At the same time, for continuous sand addition, due to the smaller particle size of the quartz sand proppant, the liquid–solid interface is more blurred compared to the ceramic proppant during the experiment, indicating that under the same experimental conditions, the fracturing fluid has a stronger carrying capacity for it, resulting in a better laying effect throughout the entire crack. Due to fluid erosion and vortex effects, the height of the sand embankment at the inlet end is slightly higher. For larger particle size ceramic proppant, the liquid–solid interface is relatively clear during the experiment, indicating that under the same experimental conditions, under certain conditions, the fracturing fluid has a weak carrying capacity, resulting in a large area of accumulation at the entrance of the crack. After the subsequent fluid enters the crack, it is influenced by the high sand embankment of the ceramic proppant, forming a clear vortex-like flow, causing the subsequent proppant to accumulate in the middle of the crack, resulting in a larger slope at the front edge of the sand embankment and an increase in the equilibrium height of the sand embankment.
From Figure 4, it can be seen that as the experiment progresses, the height of the sand embankment at different positions gradually increases. The effect of compressed fracturing fluid on the drag force of the proppant is that the laying height of the proppant at the inlet end is relatively high, while the outlet position is relatively low. At the same time, compared with continuous sand addition, the liquid and sand volume of each pumping program of alternating sand addition is half of that of continuous sand addition. When injecting sand-carrying fluid containing quartz sand proppant for the first time, the carrying capacity of the sand-carrying fluid is strong, and the quartz sand proppant carried to the outlet end flows out of the main crack more often. The height of the sand embankment accumulated at the outlet end is lower, and the height of the sand embankment accumulated at the inlet end is higher; when injecting sand-carrying fluid containing ceramic particle support agent for the first time, the carrying capacity of the sand-carrying fluid is weak, mainly accumulating at the inlet end and middle. Therefore, during the second injection of fracturing fluid containing quartz sand proppant, due to the influence of the fracturing fluid on the drag force of the proppant caused by the slope of the sand embankment, the quartz sand proppant accumulates in the middle and outlet ends. Only a small part of the quartz sand is carried by the vortex to the inlet end of the crack for accumulation, and the originally accumulated ceramic proppant in the middle of the crack is carried to the outlet end in a very small amount. During the second injection of sand-carrying fluid containing ceramic proppant, the fracturing fluid carries the original quartz sand proppant on the slope of the sand embankment to the middle and rear positions of the crack, while the ceramic proppant continues to accumulate, resulting in an increase in the slope of the front edge of the sand embankment and an increase in the equilibrium height of the sand embankment, and all of them are larger than those in the continuous sand addition process. The stacking position of the agent is closer to the inlet end than the sand embankment formed by the continuous sanding process.
From Figure 5, it can be seen that as the experiment progresses, the height of the sand embankment at different positions gradually increases. Due to the influence of the sand-carrying liquid on the drag force of the proppant, the placement height of the proppant at the inlet and middle is relatively high, while the outlet position is relatively low. At the same time, compared to continuous sand addition, the pumping program for reverse sand addition is reversed. Due to the high viscosity of the sand-carrying fluid used to soak the ceramic particles, the ceramic particle support agent settles slowly and has enhanced horizontal transport capacity. When it accumulates at the bottom of the crack, it can be spread more evenly without local accumulation being too high, thereby slowing down the slope of the front edge of the sand embankment. At the same time, the ceramic particle support agent can accumulate further away, which is conducive to the formation of sand embankments on a larger scale. The particle size of quartz sand proppant is smaller, and during the experiment, the liquid–solid interface is more blurred compared to ceramic proppant, indicating that under the same experimental conditions, the sand-carrying liquid has a stronger carrying capacity for it, resulting in a better laying effect throughout the entire crack. Quartz sand is blocked by the height of the sand embankment, and most of the quartz sand proppant accumulates in the middle. Overall, there is more sand in the middle of the crack and less sand at the inlet and outlet.
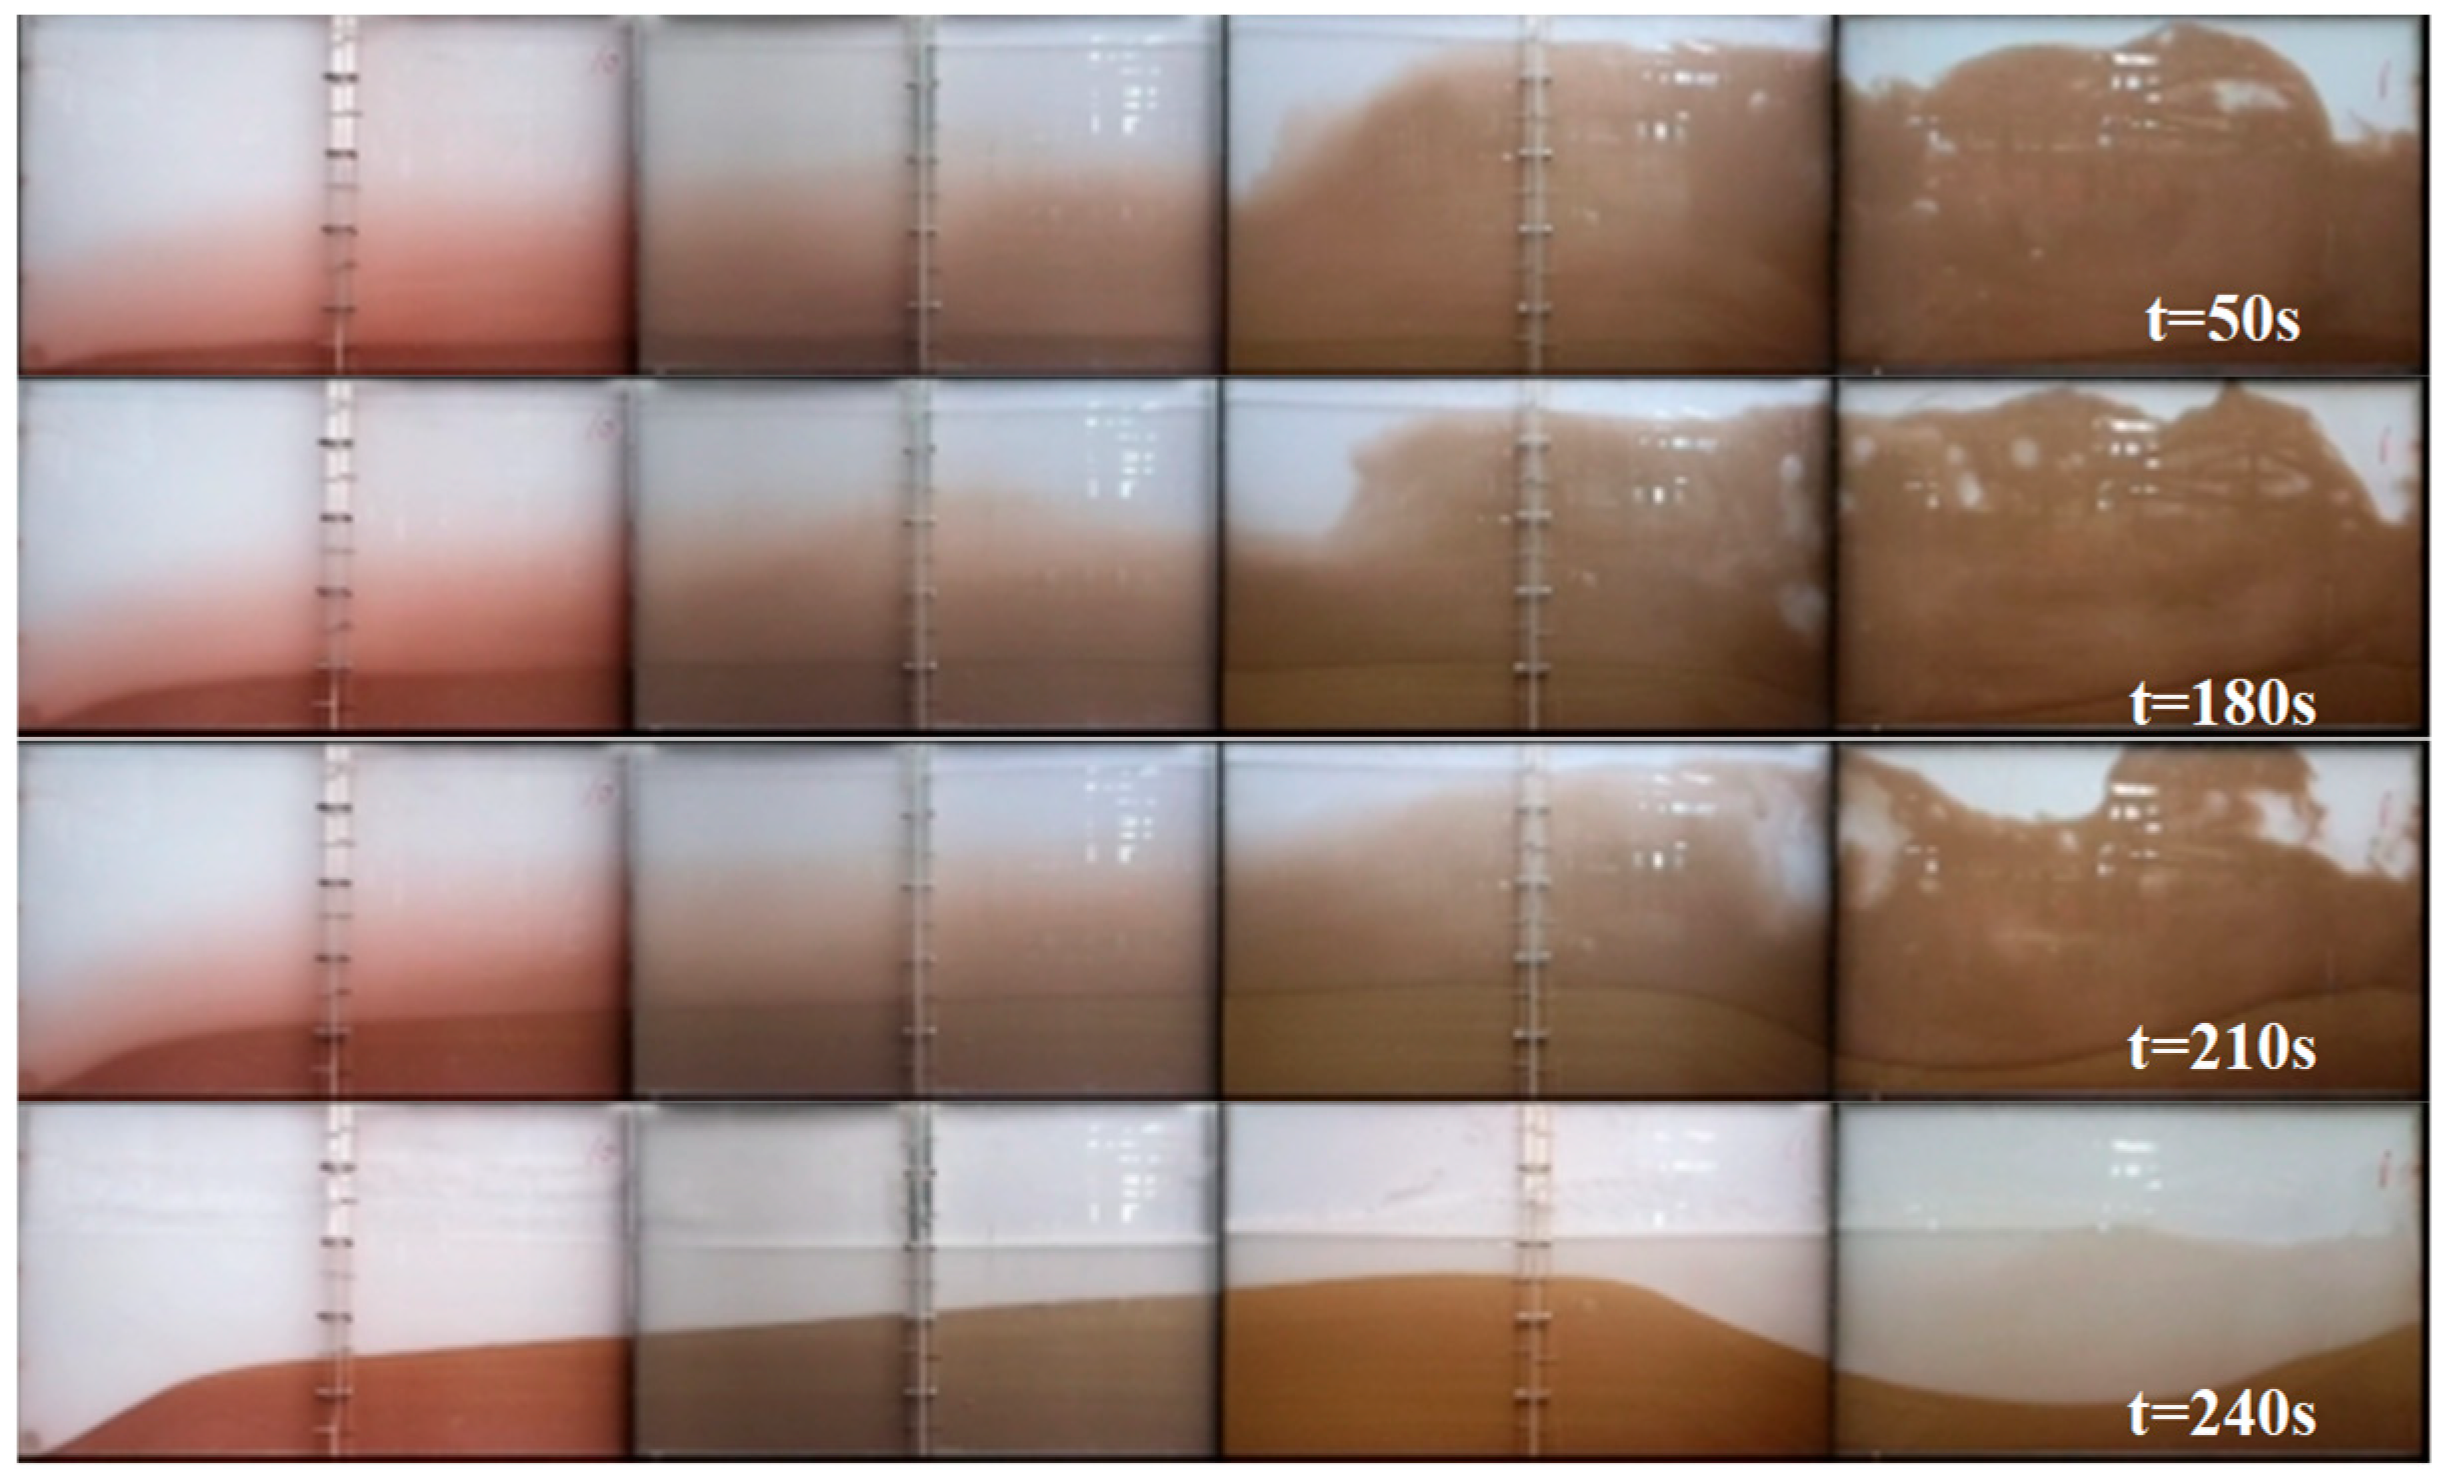
From Figure 6, it can be seen that as the experiment progresses, the height of the sand embankment at different positions gradually increases. The effect of the fracturing fluid on the drag force of the proppant is that the placement height of the proppant at the inlet and middle is relatively high, while the outlet position is relatively low. The mixed sanding process involves injecting both quartz sand proppant and ceramic particle proppant into the crack. During the experiment, the sand-carrying liquid has a weak carrying capacity for the ceramic particle proppant, resulting in a large amount of ceramic particle proppant remaining in the crack. The sand-carrying liquid has a strong carrying capacity for the quartz sand proppant, and a large amount of quartz sand flows out from the outlet end. After the subsequent fluid enters the crack, a large amount of proppant accumulates at the entrance of the crack due to the influence of eddy currents, and there are void areas without proppant filling. After injecting the sand-carrying fluid, there is still a large amount of suspended proppant. Over time, quartz sand has a high density and settles quickly, followed by the deposition of ceramic particles. A layer of ceramic particles accumulates on the sand embankment, and the shape of the sand embankment under the mixed sand addition process is similar to that of the sand embankment with alternating sand addition.
From Table 4, in the alternate sanding process, the equilibrium height of the proppant sand embankment within the main crack (42 cm) is increased by 40% compared to the standard method (continuous sanding, 30 cm), effectively avoiding the problem of insufficient support strength caused by insufficient height of the sand embankment during continuous sanding; at the same time, the gap area of the sand embankment (1400 cm2) decreased by 18.3% compared to continuous sand addition (1714 cm2), and the gap distance (75 cm) decreased by 25% compared to continuous sand addition (100 cm), significantly reducing the risk of fluid flow around the cracks.

3.2. Study on the Variation Law of Sand Paving Morphology of Branch Cracks Under Different Sanding Processes

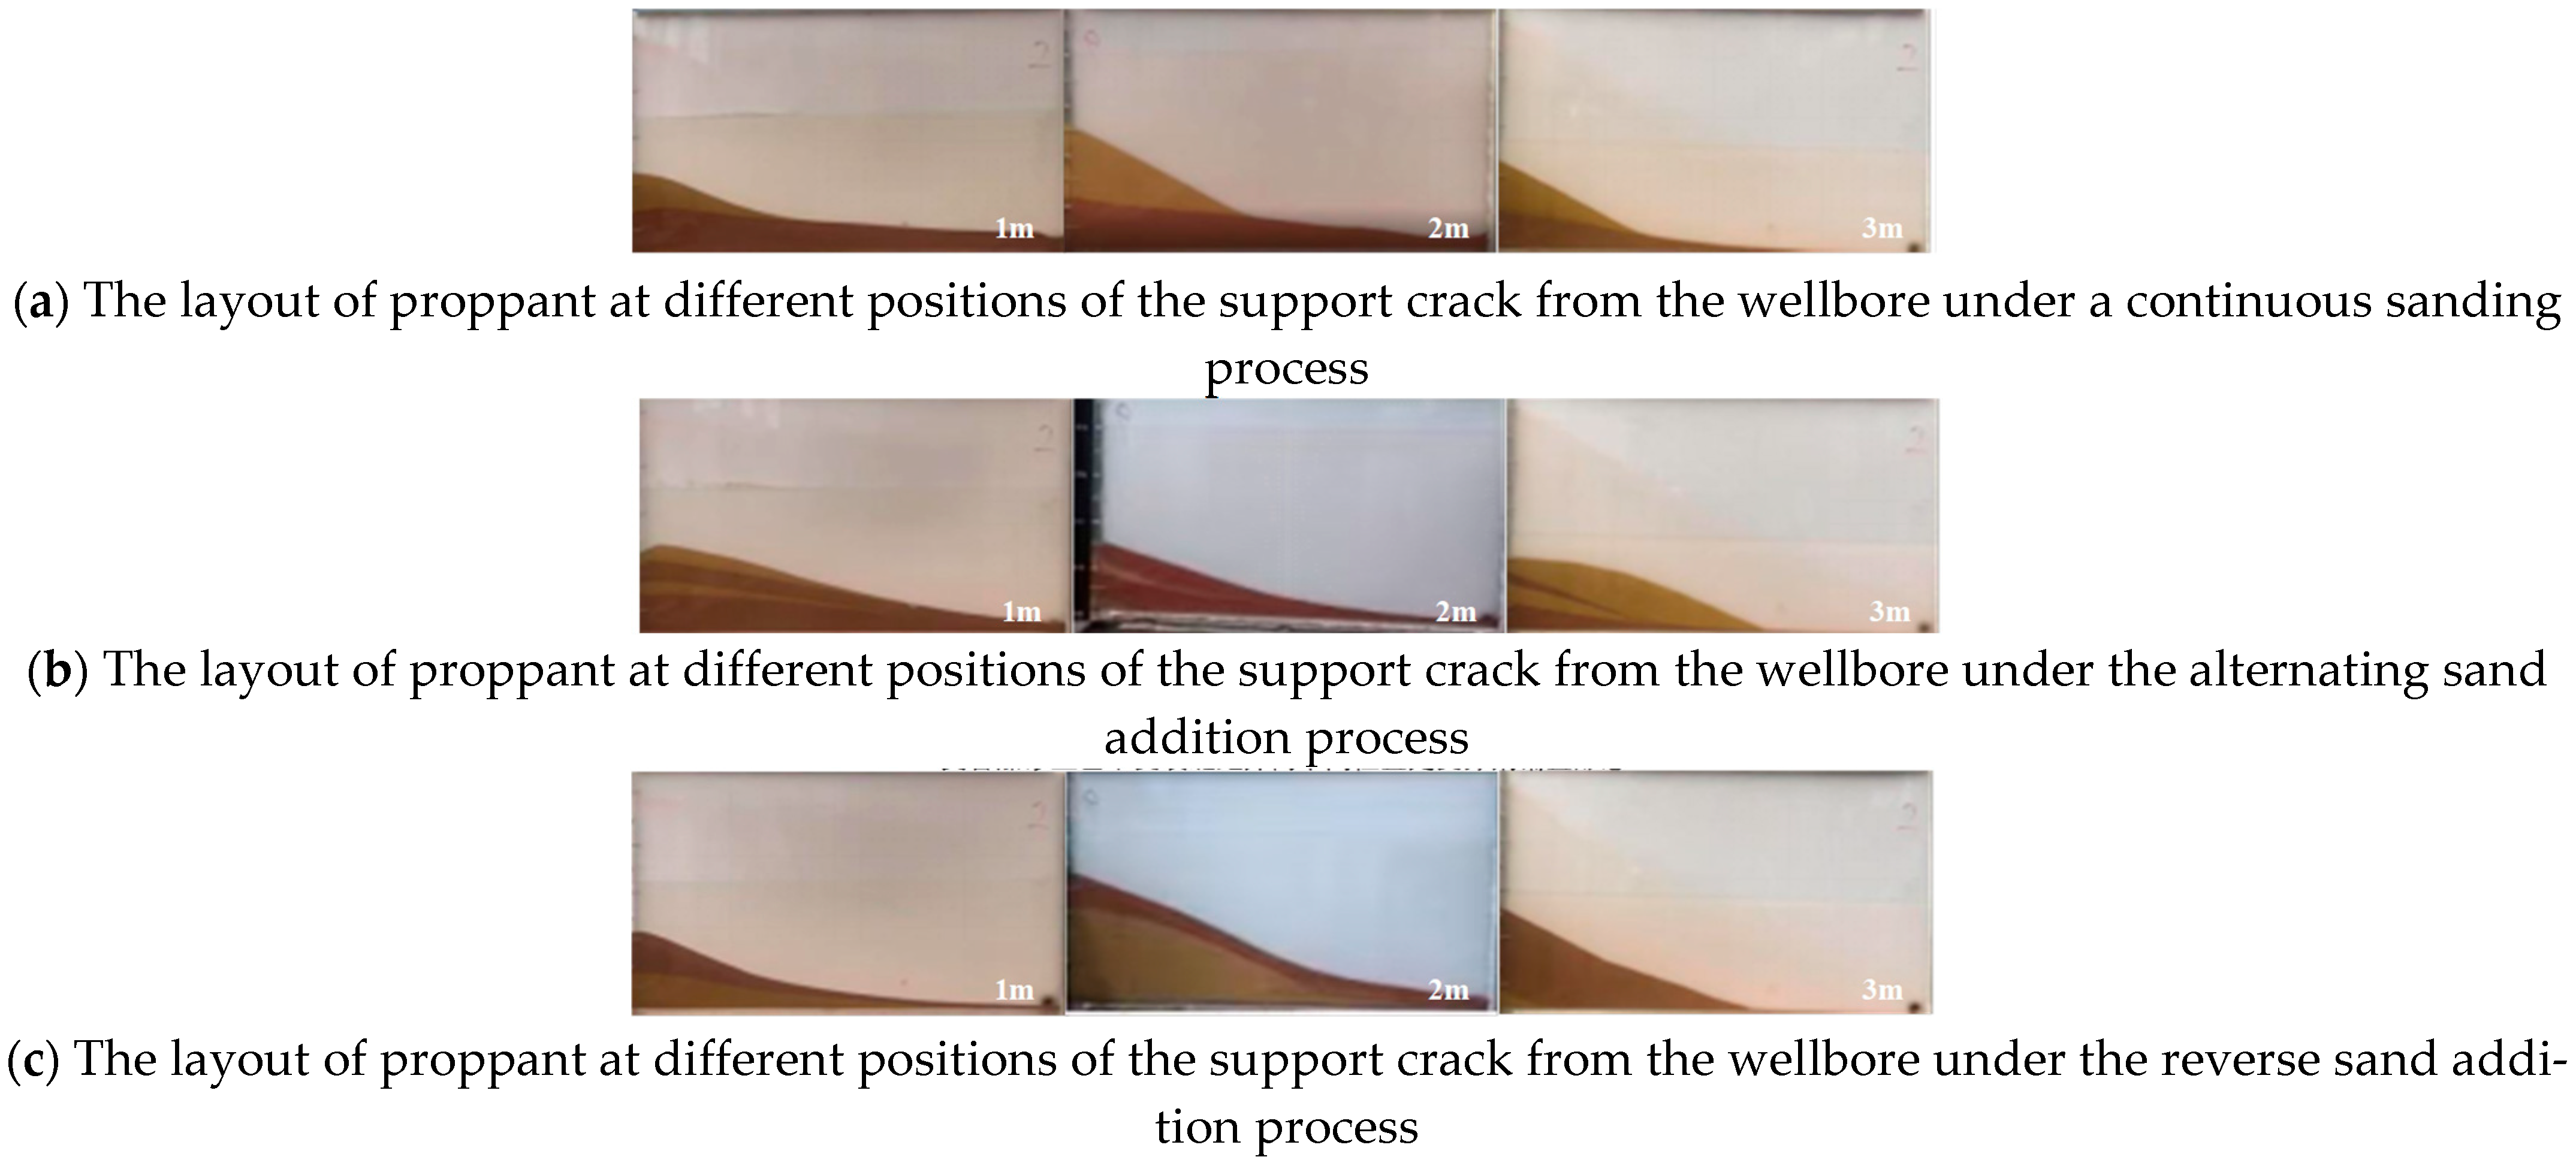
The fracturing fracture morphology of shale gas wells is complex and influenced by the main fracture. The placement of proppants in the support fractures varies under different sand addition processes. The experimental results show that the placement of proppants in the support fractures at different positions under different sand addition processes is shown in Figure 7.
From Figure 7, it can be seen that the placement of proppants in the branch cracks is poor, mainly near the end of the main crack, presenting a triangular shape overall. This indicates that the placement of proppants in the branch cracks is mainly formed by the accumulation of proppants, and the influence of fluid drag is relatively small. The stacking morphology of different types of proppants varies. For quartz sand with smaller particle size, the influence of fracturing fluid drag is greater, resulting in a longer migration distance in the branch cracks and a flatter stacking morphology of proppants. For quartz sand proppants, the influence of drag is relatively small and the influence of gravity is greater, so they are mainly placed in the form of stacking in the branch cracks.
For continuous sand addition, the sand-carrying fluid has a strong carrying capacity for quartz sand, with a large amount of quartz sand flowing out. When it is closer to the outlet end, there is less quartz sand in the support fracture. This is because the fracturing fluid has a smaller drag force on the proppant, resulting in a lower amount of proppant at the far end of the fracture. When the branch crack is closer to the entrance, its accumulation height is also lower. This is because the flow velocity at the entrance is faster, and the subsequent fracturing fluid will have a flushing effect on the proppant, causing it to move towards the far end, resulting in a lower accumulation height of the branch crack at that location. For alternating sand addition, due to the injection of two different sizes of proppants alternately, the placement of proppants in the support cracks is greatly affected by drag forces, and the placement morphology is a flat triangular shape. For branch fractures at different positions, the difference in drag force of proppants within the fractures leads to self-separation: large-sized proppants are present in the distal and proximal branch fractures, while small-sized proppants are present in the middle. For reverse sand addition, large-diameter proppants are injected first and accumulate in the middle of the main crack. Therefore, the equilibrium height of the middle position of the support crack is the highest, and the three support cracks are mainly affected by the accumulation of sand particles. The crack morphology is a higher triangular shape. For mixed sand addition, the larger particle size proppant is impacted by the smaller particle size proppant, which enhances the flushing effect of the fracturing fluid. Quartz sand relies on inertia and drag force to push ceramic particles into the support cracks.
Overall, it is easier for quartz sand to migrate to branch cracks than for ceramic particles. Quartz sand is mainly transported to branch cracks by the drag force of fluids, while ceramic particles are mainly transported to branch cracks by the height difference between the main crack and the branch crack. From Table 5, it can be seen that as the position of the branch crack increases from the inlet end to the outlet end, the equilibrium height and paving efficiency of continuous sand addition, alternating sand addition, and reverse sand addition first increase and then decrease. The amplitude of continuous sand addition is the largest, the amplitude of alternating sand addition is the smallest, and the equilibrium height and paving efficiency of mixed sand addition gradually decrease. This is because the main component of mixed sand entering the branch crack is quartz sand. The farther away from the inlet end, the lower the flow velocity and the smaller the drag force of the fluid, resulting in less quartz sand migrating to the branch crack. At Position 2 of the branch crack, the proposed alternating sand addition scheme has a balanced height of 210.0 mm. Compared with the standard continuous sand addition process, although it is lower than the 407.1 mm of continuous sand addition (a decrease of 48.4%), the high sand embankment with continuous sand addition at this position is prone to cause a “dam effect”, resulting in unsupported distal branch cracks; the equilibrium height of alternating sand addition is 15.3% higher than that of reverse sand addition (182.1 mm) and 15.3% higher than that of mixed sand addition (182.1 mm). Although the sand laying efficiency (13.1%) is lower than that of reverse sand addition (21.8%), it avoids local excessive accumulation of reverse sand at this position (equilibrium height 336.4 mm). From the perspective of engineering effectiveness, the distribution of proppant in Position 2 is more uniform when alternating sand is added, and its effective support length (1.2 m) increases by 50% compared to continuous sand addition (0.8 m), which is more in line with the uniform support requirements of complex crack networks.
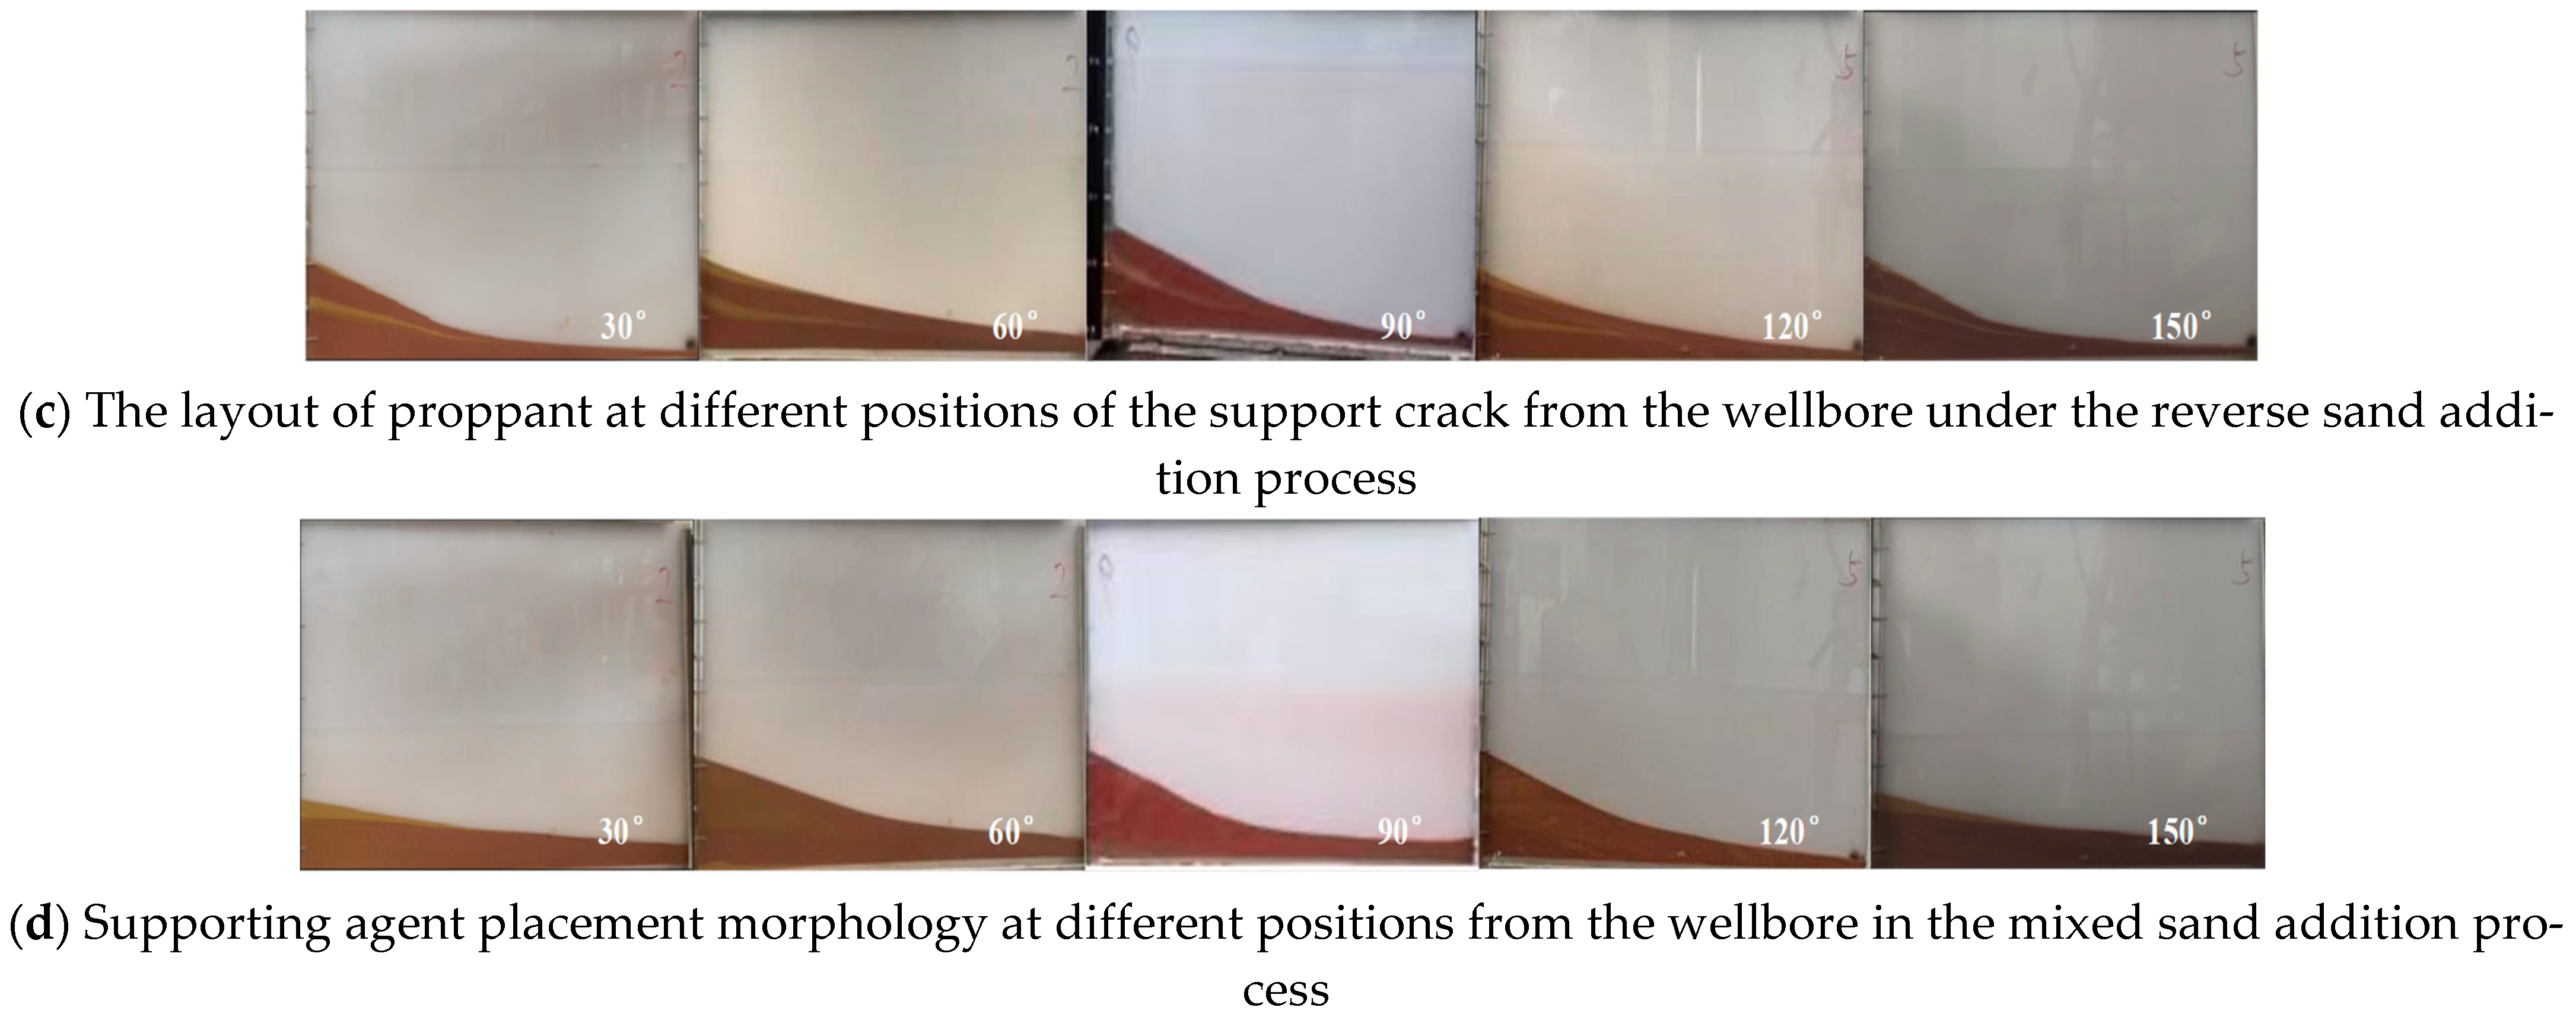
From Figure 8, it can be seen that for continuous sand injection, the angle of the branch cracks increases during the first injection of quartz sand, and the quartz sand transported to the branch cracks first increases and then decreases. The direction of transport of the branch cracks is opposite to that of the main cracks, making it difficult for the proppant to turn and enter the branch cracks. Some of the sand-carrying fluid still enters the branch cracks due to the diversion effect, dragging the proppant at the entrance of the branch cracks, causing it to accumulate at the intersection of the main and branch points, hindering the subsequent entry of sand-carrying fluid. When the angle is too large, the blocking effect of the branch cracks on the fluid increases, and the proppant collides with the branch cracks at this point, resulting in a large loss of kinetic energy and a decrease in flow velocity. Quartz sand mainly relies on drag force to enter the branch cracks, and the flow velocity decreases, resulting in less quartz sand entering the branch cracks. The filling amount of ceramic particles shows a phenomenon of first increasing and then decreasing, with the maximum filling amount in the 90° branch crack. After injection, the ceramic particles do not initially enter the branch cracks. As time goes by, the ceramic particles in the main crack increase to a certain height, and they begin to migrate to the branch cracks and advance forward along a fixed advancing angle. For alternating sand addition, the filling amount during the first injection of quartz sand is similar to continuous sand addition. As the angle increases, the filling amount gradually increases and then decreases. The first injection of ceramic particles did not migrate to the branch cracks during injection, only pushing a portion of the suspended ceramic particles into the branch cracks during the second injection of quartz sand. The filling amount of quartz sand for the second injection also increases first and then decreases with the increase in angle size. The second injection of ceramic particles resulted in almost no ceramic particles migrating to the branch cracks due to the lack of high-height formation of the main crack ceramic particles and the absence of subsequent injection fluid push. For reverse sanding, unlike continuous sanding and alternating sanding, at the beginning of injecting ceramic particles, there are ceramic particles that rely on the drag force of the fluid to move into the branch cracks. However, very few ceramic particles enter the branch cracks. After a period of time, when the ceramic particles reach a certain height in the main crack, they begin to enter the branch cracks and mainly accumulate at the intersection of the main and branch points, resulting in a short sand embankment. The amount of quartz sand entering the branch cracks is mainly related to the magnitude of the drag force. The flow velocity in the branch cracks is affected by the angle and first increases and then decreases, so the amount of quartz sand filling first increases and then decreases. For mixed sand, the sand embankment in the branch crack is mainly composed of quartz sand, with only a small portion carried by quartz sand to the branch crack. Quartz sand is more likely to migrate to the far end of the branch crack, so the color of each branch crack gradually deepens from near to far from the main crack. The amount of quartz sand entering the branch cracks is mainly related to the magnitude of the drag force. The flow velocity in the branch cracks is affected by the angle and first increases and then decreases. Therefore, the amount of mixed sand support agent filling first increases and then decreases.
From Table 6, it can be seen that as the angle of the support crack increases, the equilibrium height and paving efficiency of the sand embankment in the support crack first increase and then decrease. The migration of proppants in branch cracks mainly relies on the horizontal carrying force of sand-carrying fluids. When the angle of the branch crack is small, the blocking effect of the branch crack on the fluid increases when the proppants enter the branch crack from the main crack. The proppants collide with the wall of the branch crack at this point, causing a large loss of kinetic energy and a decrease in flow velocity, resulting in fewer proppants migrating to the branch crack. When the angle of the branch crack is large, the migration direction of the branch crack is opposite to that of the main crack, making it difficult for the proppant to turn and enter the branch crack. Some of the sand-carrying fluid still enters the branch crack due to the diversion effect, dragging the proppant at the entrance of the branch crack, causing it to accumulate at the main branch intersection, hindering the subsequent entry of sand-carrying fluid, and reducing the amount of proppant transported to the branch crack. At the optimal angle of 90° for branching cracks, the sand spreading efficiency of alternating sand addition (18.1%) is lower than that of standard continuous sand addition (24.4%), but it is 48.4% higher than that of mixed sand addition (12.2%). In addition, the filling uniformity of proppant is 46.7% lower than that of continuous sand addition (0.15), effectively solving the uneven distribution problem of “less near and far” in branching cracks caused by continuous sand addition.

3.3. The Influence of the Accumulation Morphology of Proppant in Cracks Under Reverse Sand Addition on the Subsequent Flow of Fracturing Fluid

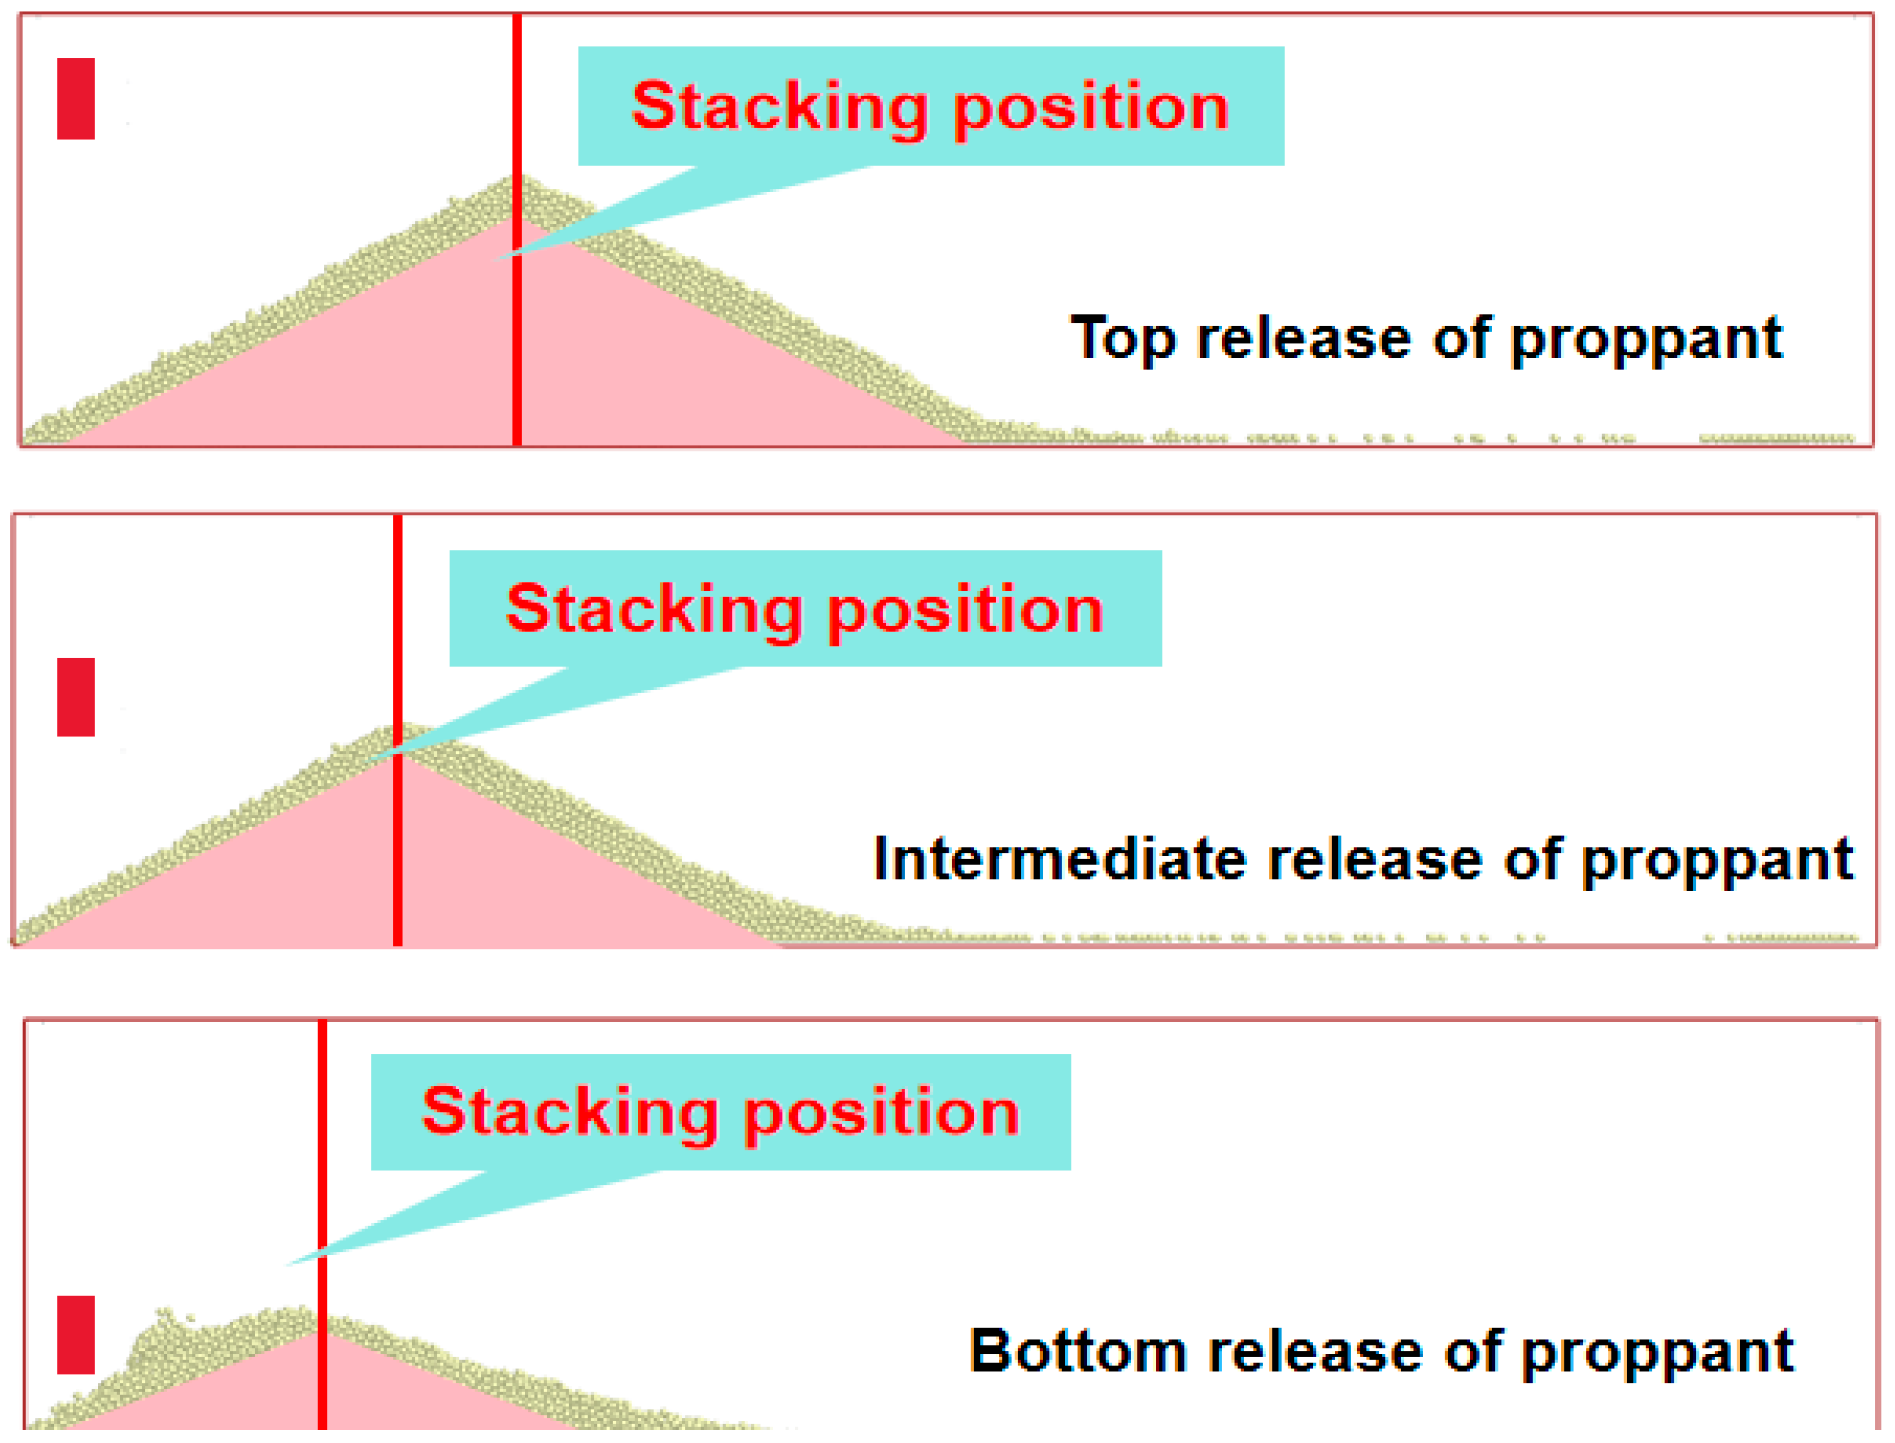
According to the simulation conditions in Section 2.3, the distribution characteristics of proppant in the near-wellbore fractures at different perforation positions were simulated and shown in Figure 8.
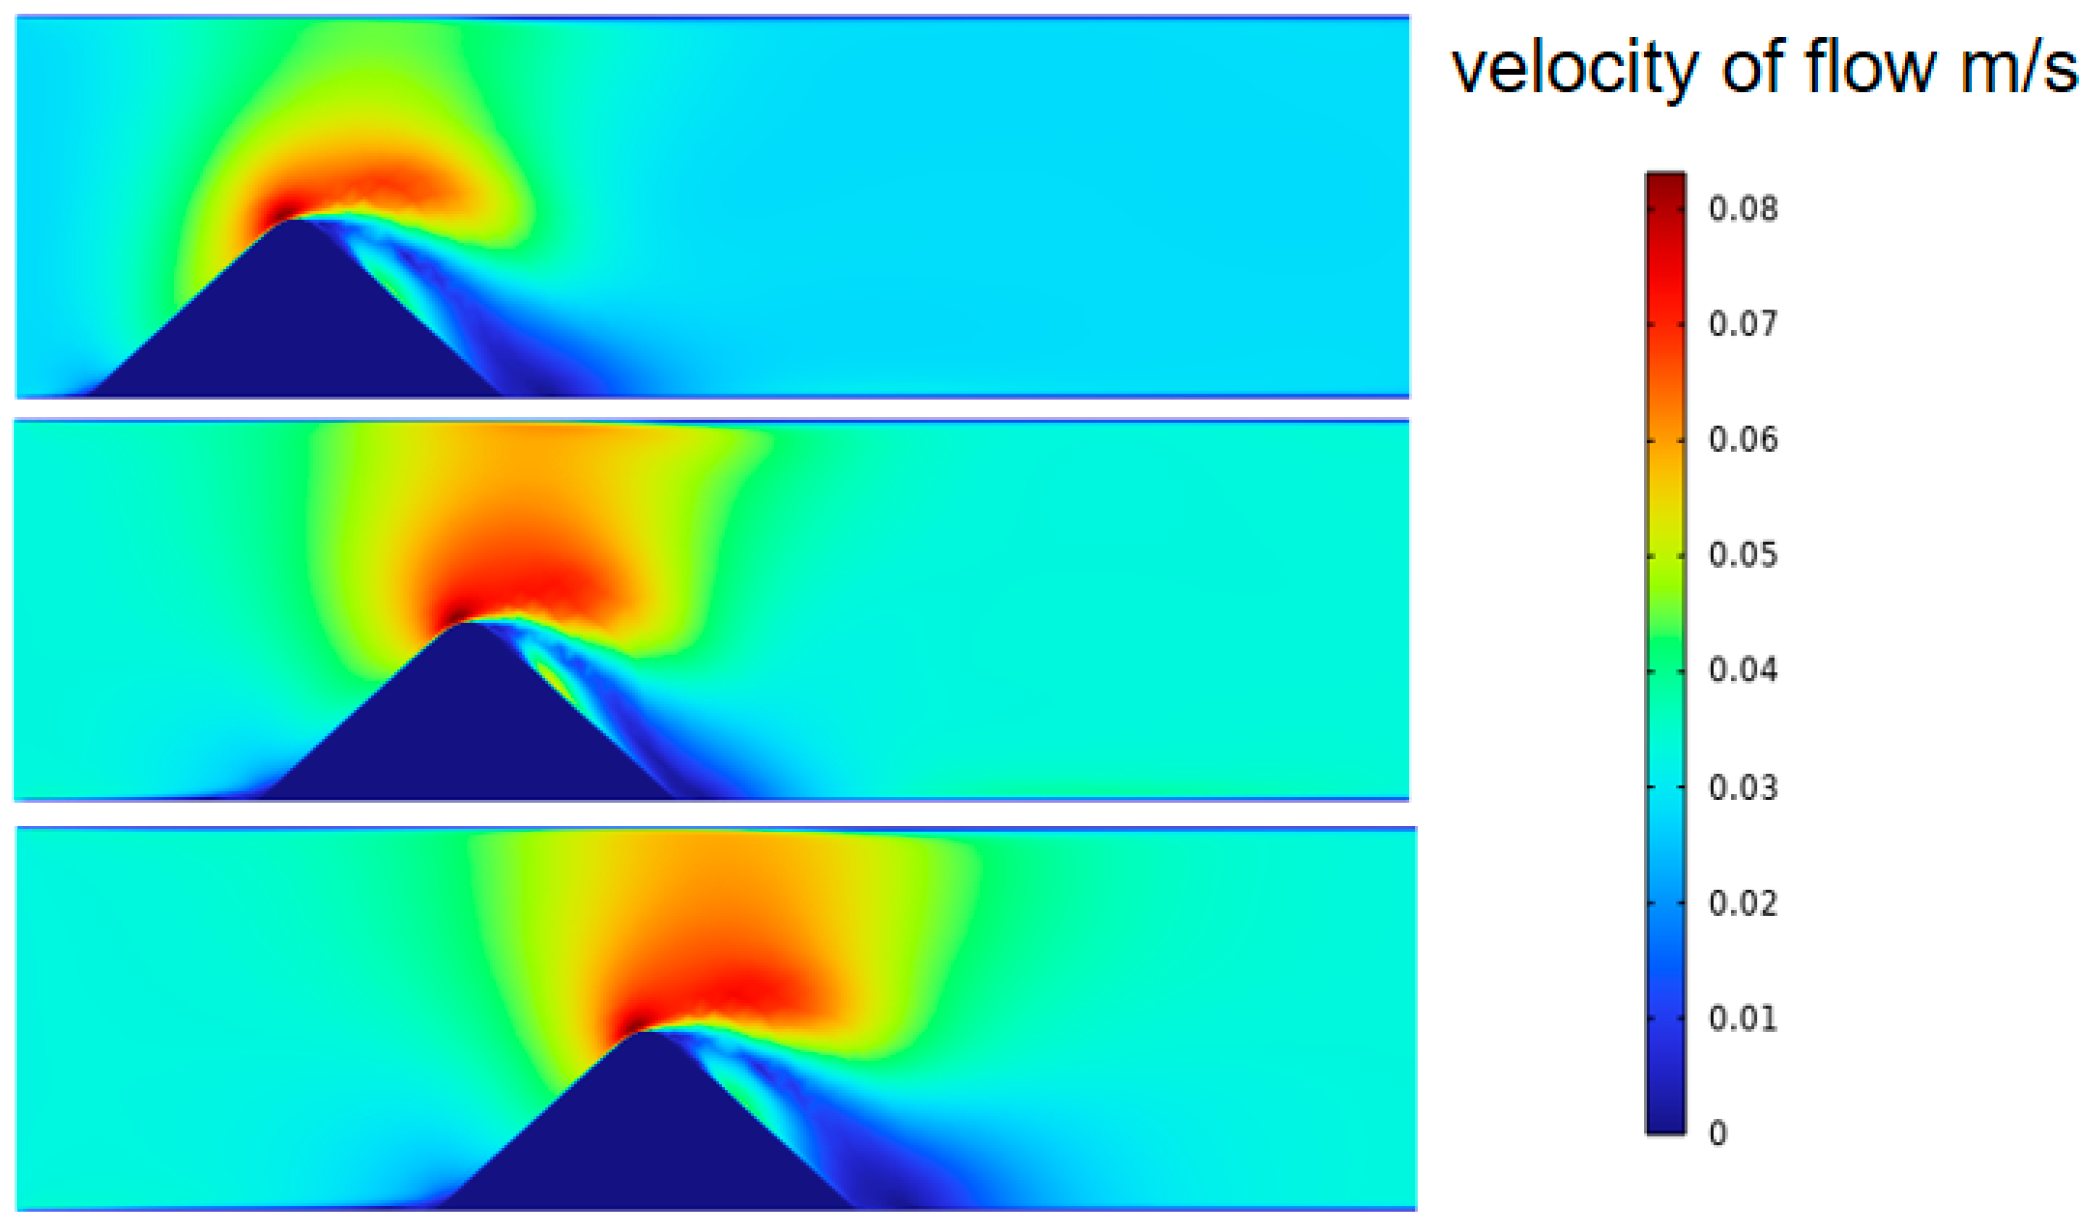
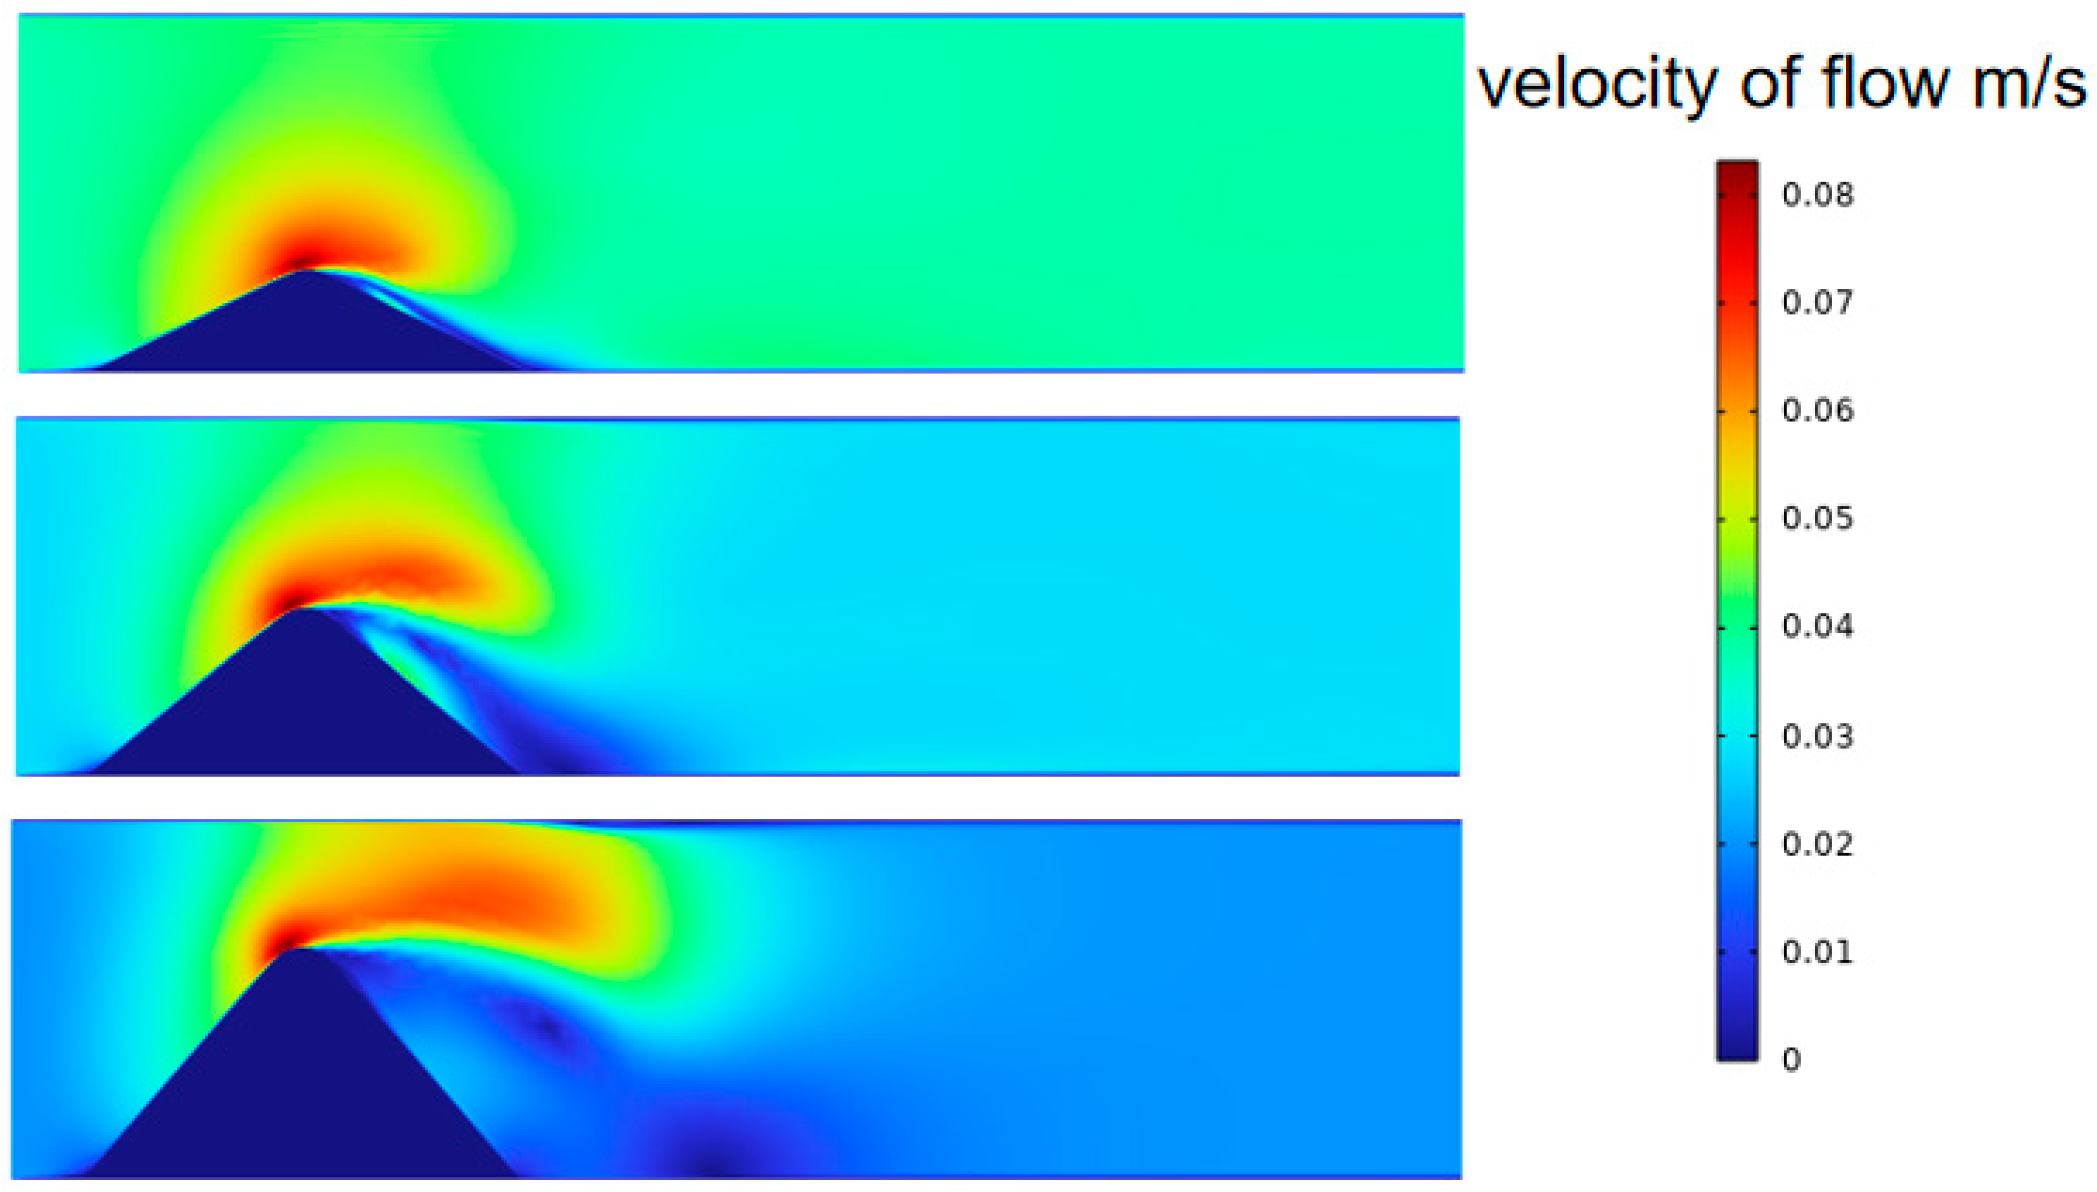
From Figure 9, it can be seen that under simulated conditions, the distribution characteristics of proppant in the near-wellbore zone have undergone significant changes after injecting proppant from different perforation positions. As the release height of proppant gradually increases, the accumulation height of proppant gradually increases, and the accumulation position gradually delays, indicating that proppant is more likely to penetrate deep into the fracture and enhance the permeability of the fracture. By comparing the experimental results, it was determined that the accumulation pattern of proppants in the near-wellbore zone would affect the subsequent movement of fracturing fluid and proppants. Therefore, further simulation was conducted to obtain the influence of different proppant accumulation positions on the subsequent flow of fracturing fluid, as shown in Figure 10.
From Figure 10, it can be seen that there is no significant change in the effect of different proppant stacking positions on the subsequent fracturing fluid flow. At the proppant stacking position, the subsequent fracturing fluid flow rate increases significantly, and the proppant in the fracturing fluid will erode the stacked proppant. After reaching the top of the stacking, the flow rate will decrease significantly, causing the subsequent proppant to gradually accumulate.
From Figure 11, it can be seen that the stacking height has a significant impact on the flow of subsequent fracturing fluid. When the stacking height of the proppant is low, the flow velocity change in the model is relatively small, and the stacking capacity of the proppant is poor. However, when the stacking height of the proppant increases, the flow velocity at the far end of the proppant stacking surface in the model is low, which can promote the stacking of the proppant.

4. Conclusions

This study systematically explored proppant transport and fracturing support effects of four sand addition processes (continuous, alternating, reverse, and mixed) for terrestrial shale oil reservoirs via complex mesh flat-plate experiments and ANSYS FLUENT simulations. Key conclusions are as follows:
(1)
Alternating sand addition exhibits the best performance in main fractures: compared to conventional continuous sand addition, it increases sand-laying efficiency by 10 percentage points, reduces sand embankment void area by 18.3%, and enhances proppant entry into secondary cracks by 23.8%. Its sand embankment balances uniformity and retention—gentler than reverse sand addition and taller than continuous sand addition, avoiding local blockage and insufficient support.
(2)
Branch crack geometry significantly affects proppant placement: at Position 2, alternating sand addition achieves an equilibrium height of 210 mm, which is 48.4% lower than continuous sand addition but 15.3% higher than reverse sand addition; the optimal branch crack angle is 90°, at which alternating sand addition’s paving rate is 11.7% higher than mixed sand addition. Quartz sand has a filling rate 2.5 times higher than ceramic particles in branch cracks, consistent with classic particle transport theory and providing a basis for proppant selection.
(3)
The proposed optimal parameter combination (alternating injection of 70/140 mesh quartz sand and 40/70 mesh ceramic particles, displacement 0.0018 m3/s, fluid viscosity 8.91 mPa·s) improves fracture network support efficiency by 21.5% vs. conventional continuous sand addition. This scheme is verified by both experiments and simulations, ensuring reliability for field application.

Author Contributions

Conceptualization, M.Z. and Y.B.; Methodology, F.Y.; Validation, S.G.; Formal analysis, F.Y.; Investigation, F.Y.; Resources, S.G.; Data curation, M.Z.; Writing—original draft, M.Z. and Y.B.; Writing—review and editing, X.L.; Project administration, X.L.; Funding acquisition, Y.B. All authors have read and agreed to the published version of the manuscript.

Funding

This research was funded by the 2024 Heilongjiang Province “Basic Research Support Program for Outstanding Young Teachers” (YQJH2024045).

Institutional Review Board Statement

Not applicable.

Informed Consent Statement

Not applicable.

Data Availability Statement

The original contributions presented in this study are included in the article. Further inquiries can be directed to the corresponding author.

Conflicts of Interest

Authors Xuanyu Liu, Faxin Yi and Song Guo were employed by the company CNPC Greatwall Drilling Co. The remaining authors declare that the research was conducted in the absence of any commercial or financial relationships that could be construed as a potential conflict of interest.

References

  1. Gao, Z.; Bai, L.; Hu, Q.; Yang, Z.; Jiang, Z.; Wang, Z.; Xin, H.; Zhang, L.; Yang, A.; Jia, L.; et al. Shale oil migration across multiple scales: A review of characterization methods and different patterns. Earth-Sci. Rev. 2024, 254, 104819. [Google Scholar] [CrossRef]
  2. Wang, H.Y. Hydraulic fracture propagation in naturally fractured reservoirs: Complex fracture or fracture networks. J. Nat. Gas Sci. Eng. 2019, 68, 102911. [Google Scholar] [CrossRef]
  3. Sahai, R.; Moghanloo, R.G. Proppant transport in complex fracture networks—A review. J. Pet. Sci. Eng. 2019, 182, 106199. [Google Scholar] [CrossRef]
  4. Roostaei, M.; Nouri, A.; Fattahpour, V.; Chan, D. Numerical simulation of proppant transport in hydraulic fractures. J. Pet. Sci. Eng. 2018, 163, 119–138. [Google Scholar] [CrossRef]
  5. Ngameni, K.L.; Miskimins, J.L.; Abass, H.H.; Cherrian, B. Experimental Study of Proppant Transport in Horizontal Wellbore Using Fresh Water. In Proceedings of the SPE Hydraulic Fracturing Technology Conference and Exhibition, Woodlands, TX, USA, 24–26 January 2017. [Google Scholar]
  6. Alotaibi, M.A.; Miskimins, J.L. Slickwater Proppant Transport in Complex Fractures: New Experimental Findings & Scalable Correlation. In Proceedings of the SPE Annual Technical Conference and Exhibition, Houston, TX, USA, 28 September 2015. [Google Scholar]
  7. Yang, S.; Cheng, W.; Hu, Q.; Lei, G. Sensitivity analysis of proppant transportation and settling in a hydraulic fracture. Phys. Fluids 2025, 37, 013360. [Google Scholar] [CrossRef]
  8. Budiman, O.; Alajmei, S.; Bahri, A.; Aljawad, M.S.; Miskimins, J. A Review of Proppant Transport and Distribution in Slickwater Fracturing. Arab. J. Sci. Eng. 2025, 50, 5303–5322. [Google Scholar] [CrossRef]
  9. Guowen, Z.; Xiaojun, W.; Jinyou, Z.; Zhao, L.; Yunfeng, B.; Ying, Z.; Xiuli, F.; Huasen, Z. Enrichment conditions and favorable zones for exploration and development of continental shale oil in Songliao Basin. Acta Pet. Sin. 2023, 44, 110. [Google Scholar]
  10. Liu, H.; Huang, Y.; Cai, M.; Meng, S.; Tao, J. Practice and development suggestions of hydraulic fracturing technology in the Gulong shale oil reservoirs of Songliao Basin, NE China. Pet. Explor. Dev. 2023, 50, 688–698. [Google Scholar] [CrossRef]
  11. Haberman, W.L.; Sayre, R.M. David Taylor Model Basin Report; Department of the Navy: Washington, DC, USA, 1958.
  12. Francis, A.W. Wall effect in falling ball method for viscosity. J. Appl. Phys. 1933, 4, 403–406. [Google Scholar] [CrossRef]
  13. Clift, R.; Grace, J.R.; Weber, M.E. Bubbles, Drops and Particles; Academic Press: New York, NY, USA, 1978. [Google Scholar]
  14. Iwaoka, M.; Ishii, T. Experimental wall correction factors of single solid spheres in circular cylinders. J. Chem. Eng. Japan. 1979, 12, 239–242. [Google Scholar] [CrossRef]
  15. Fidleris, V.; Whitmore, R.L. Experimental determination of the wall effect for spheres falling axially in cylindrical vessels. Br. J. Appl. Phys. 1961, 12, 490–494. [Google Scholar] [CrossRef]
  16. Schols, R.S.; Visser, W. Proppant bank Buildup in a vertical fracture without fluid loss. In Proceedings of the SPE European Spring Meeting, Amsterdam, The Netherlands, 29 May 1974. [Google Scholar]
  17. Kirkby, L.L.; Rockefeller, H.A. Proppant settling velocities in non-flowing slurries. In Proceedings of the SPE Rocky Mountain Petroleum Technology Conference/Low-Permeability Reservoirs Symposium, Denver, CO, USA, 19–22 May 1985; SPE 13906. pp. 567–576. [Google Scholar]
  18. Sievert, J.A.; Wahl, H.A.; Clark, P.E.; Harkin, M.W. Prop transport in a large vertical model. In Proceedings of the SPE Rocky Mountain Petroleum Technology Conference/Low-Permeability Reservoirs Symposium, Denver, CO, USA, 27–29 May 1981; SPE 9865. pp. 335–341. [Google Scholar]
  19. Kern, L.R.; Perkins, T.K.; Wyant, R.E. The Mechanics of Sand Movement in Fracturing. In Proceedings of the 33rd Annual Fall Meeting of SPE, Houston, TX, USA, 5–8 October 1958. SPE 2037. [Google Scholar]
  20. Liu, Y. Settling and Hydrodynamic Retardation of Proppants in Hydraulic Fractures; University of Texas at Austin: Austin, TX, USA, 2006. [Google Scholar]
  21. Chhabra, R.; Tiu, C.; Uhlherr, P. A study of wall effects on the motion of a sphere in viscoelastic fluids. Can. J. Chem. Eng. 1981, 59, 771–775. [Google Scholar] [CrossRef]
  22. Sugeng, F.; Tanner, R. The drag on spheres in viscoelastic fluids with significant wall effects. J. Non-Newton. Fluid Mech. 1986, 20, 281–292. [Google Scholar] [CrossRef]
  23. Malhotra, S.; Sharma, M.M. Settling of spherical particles in unbounded and confined surfactant-based shear thinning viscoelastic fluids: An experimental study. Chem. Eng. Sci. 2012, 84, 646–655. [Google Scholar] [CrossRef]
  24. Di Felice, R. The voidage function for fluid-particle interaction systems. Int. J. Multiph. Flow 1994, 20, 153–159. [Google Scholar] [CrossRef]
  25. Di Felice, R. The particle-in-a-tube analogy for a multiparticle suspension. Int. J. Multiph. Flow 1996, 22, 515–525. [Google Scholar] [CrossRef]
  26. Brannon, H.D.; Wood, W.D.; Wheeler, R.S. Large Scale Laboratory Investigation of the Effects of Proppant and Fracturing Fluid Properties on Transport. In Proceedings of the SPE International Symposium and Exhibition on Formation Damage Control, Lafayette, LA, USA, 18–20 February 2006; p. 13. [Google Scholar]
  27. Anschutz, D.A.; Lowrey, T.A.; Stribling, M.; Wildt, P.J. An In-Depth Study of Proppant Transport and Placement with Various Fracturing Fluids. In Proceedings of the SPE Annual Technical Conference and Exhibition, Calgary, AB, Canada, 30 September–2 October 2019; p. 27. [Google Scholar]
  28. Fernández, M.E.; Sánchez, M.; Pugnaloni, L.A. Proppant transport in a scaled vertical planar fracture: Vorticity and dune placement. J. Pet. Sci. Eng. 2019, 173, 1382–1389. [Google Scholar] [CrossRef]
  29. Tong, S.; Singh, R.; Mohanty, K.K. A visualization study of proppant transport in foam fracturing fluids. J. Nat. Gas Sci. Eng. 2018, 52, 235–247. [Google Scholar] [CrossRef]
  30. Tong, S.; Gu, M.; Singh, R.; Mohanty, K.K. Proppant transport in foam fracturing fluid during hydraulic fracturing. J. Petrol. Sci Eng. 2019, 182, 106–112. [Google Scholar] [CrossRef]
  31. Hou, L.; Sun, B.; Geng, X.; Jiang, T.; Wang, Z. Study of the slippage of particle/supercritical CO2 two-phase flow. J. Supercrit. Fluids 2017, 120, 173–180. [Google Scholar] [CrossRef]
  32. Huang, H.; Babadagli, T.; Li, H.A.; Develi, K.; Wei, G. Effect of injection parameters on proppant transport in rough vertical fractures: An experimental analysis on visual models. J. Petrol. Sci. Eng. 2019, 180, 380–395. [Google Scholar] [CrossRef]
  33. Wen, Q.; Wang, S.; Duan, X.; Li, Y.; Wang, F.; Jin, X. Experimental investigation of proppant settling in complex hydraulic-natural fracture system in shale reservoirs. J. Nat. Gas Sci. Eng. 2016, 33, 70–80. [Google Scholar] [CrossRef]
  34. Chun, T.; Zhu, D.; Zhang, Z.; Mao, S.; Wu, K. Experimental study of proppant transport in complex fractures with horizontal bedding planes for slickwater fracturing. SPE Prod. Oper. 2021, 36, 83–96. [Google Scholar] [CrossRef]
  35. Luo, L. Experimental Study of Proppant Settling in a Narrow Fracture Analyzed with Particle Image Velocimetry. Ph.D. Thesis, University of California, San Diego, CA, USA, 2016. [Google Scholar]
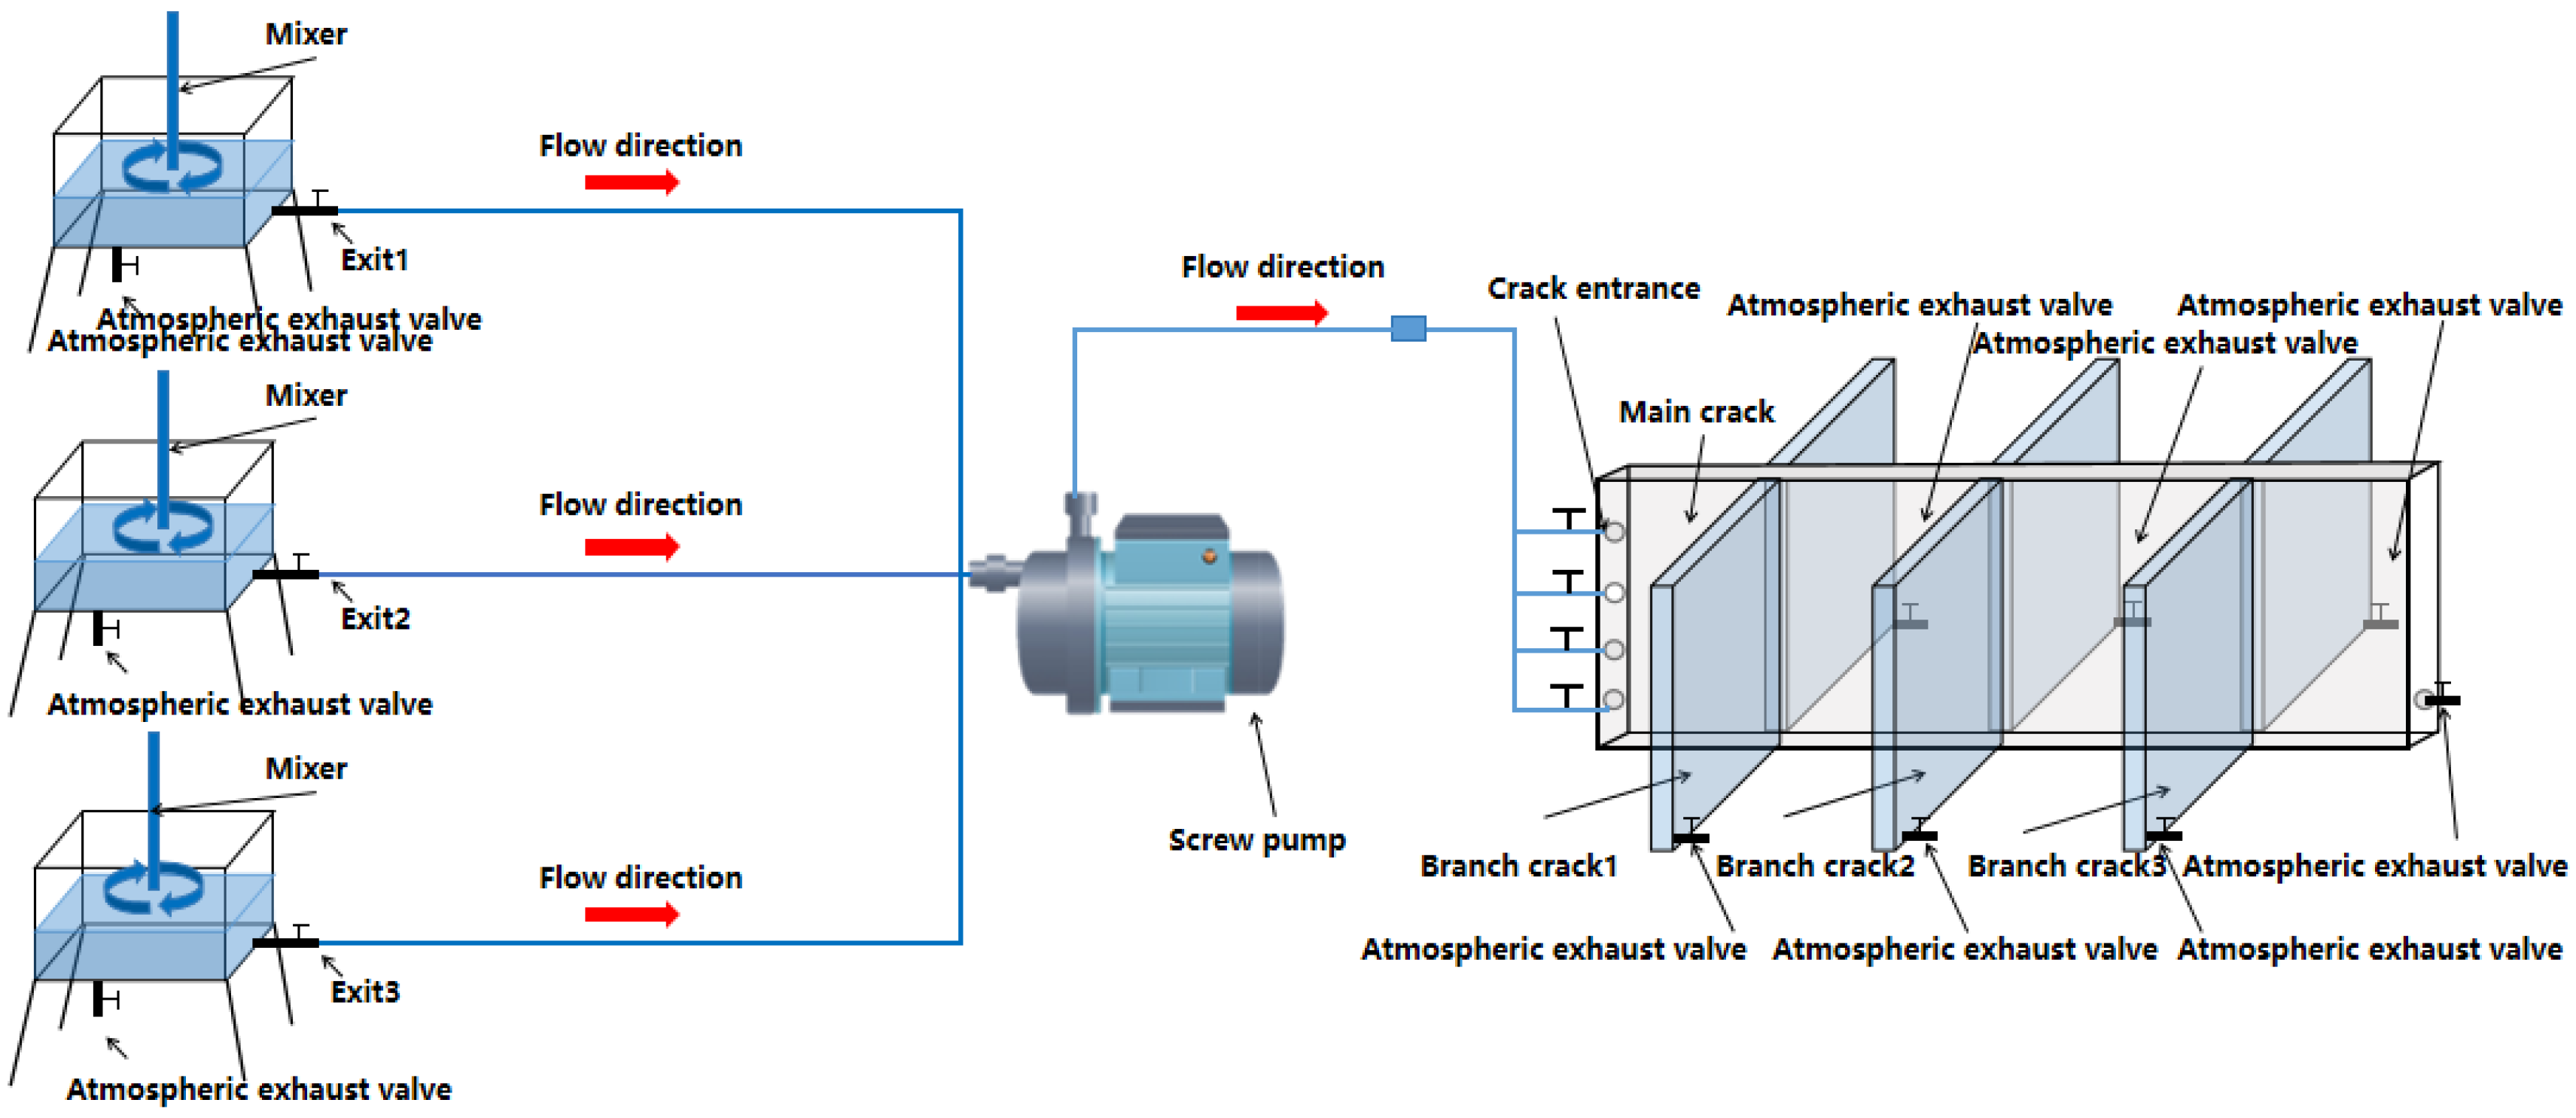
Figure 1. Flowchart of proppant transport simulation experiment.
Applsci 15 09589 g001
Figure 2. Flowchart of experiment and numerical simulation.
Applsci 15 09589 g002
Figure 3. Transport state of proppant under continuous sand addition conditions at different times.
Applsci 15 09589 g003
Figure 4. Transport state of proppant under alternating sand addition conditions at different times.
Applsci 15 09589 g004
Figure 5. Transport state of proppant under reverse sand addition conditions at different time steps.
Applsci 15 09589 g005
Figure 6. Transport state of proppant under mixed sand conditions at different time points.
Applsci 15 09589 g006
Figure 7. The laying state of proppant in different positions of support cracks under different sanding processes.
Applsci 15 09589 g007aApplsci 15 09589 g007b
Figure 8. The influence of crack angles on the placement of proppant under different sanding processes.
Applsci 15 09589 g008aApplsci 15 09589 g008b
Figure 9. Accumulation of the supporting agent at different perforation positions.
Applsci 15 09589 g009
Figure 10. The influence of different proppant stacking positions on subsequent fracturing fluid flow.
Applsci 15 09589 g010
Figure 11. The effect of proppant accumulation height on the flow of subsequent fracturing fluid.
Applsci 15 09589 g011
Table 1. Experimental materials.
proppant70/140 mesh quartz sanddensity 2650 kg/m3, sphere
40/70 mesh ceramic particlesdensity 2000 kg/m3, sphere
fracturing fluidviscosity (25 °C)1–5 mpa s
crosslinking time8–10 min
demulsification rate≥95%
compatibilityno flocculation phenomenon and no precipitation generated
Table 2. Correspondence between Reynolds number and displacement inside the seam.
Field Data Experimental Data
Equivalent Hydraulic Diameter (m) Displacement (m3/s)Linear Velocity (m/s) Fracturing Fluid Viscosity (10−6 mPa·s)Reynolds Number Equivalent Hydraulic Diameter (m) Maximum Displacement (m3/s)Maximum Linear Velocity (m/s) Fracturing Fluid Viscosity (10−6 mPa·s)Reynolds Number
0.01199280.01670.2782.971132.80.01578940.00150.3124.461118.5
0.0190.3242.971321.60.00180.3754.461342.2
0.0220.3702.971510.40.00210.4374.461565.9
0.0250.4172.971699.10.00240.5004.461789.6
0.0170.2788.91377.60.00150.3121.34372.8
0.0190.3248.91440.50.00180.3751.3447.4
0.0220.3708.91503.50.00210.4371.345521.9
0.0250.4178.91566.30.00240.51.34596.5
Table 3. Geometric model and boundary conditions of cracks.
Crack length4 mFracturing fluid density1000 kg/m3
Crack height1 mProppant size70 eyes
Crack width20 mmProppant density2200 kg/m3
Fracturing fluid viscosity10 mPa·sInjection rate12 m3/min
Accumulation height of proppant0.3–0.7 mAccumulation length of proppant1 m
Table 4. Parameters of sand embankment under different sand adding processes.
Sand Addition Method Slope of the Leading Edge of the Sand Embankment/°Gap Distance/cm Gap Area/cm2Balance Height/cm Sand Laying Efficiency/%
Continuous sand addition 20 100 1714 30 42%
Alternating sand addition 25 75 1400 42 52%
Add sand in reverse order 42 80 1350 32 45%
Mix and sand 30 60 1500 35 40%
Table 5. Parameters of sand embankments with branch joints at different positions.
Sand Addition ProcessEquilibrium Height (mm)–Position 1/2/3Laying Efficiency (%)–Position 1/2/3
Continuous sand addition192.9/407.1/231.412.3/24.4/8.2
Alternating sand addition175.7/210.0/173.69.7/13.1/11.9
Add sand in reverse order231.4/336.4/225.011.1/21.8/10.3
Mix and add sand222.9/182.1/167.130.5/12.2/8
Table 6. Parameters of sand embankments with branching joints at different angles.
Sand Addition ProcessEquilibrium Height (mm)—30°/60°/90°/120°/150°Laying Efficiency (%)—30°/60°/90°/120°/150°
Continuous sand addition348.0/389.0/407.1/391.0/353.019.1/21.3/24.4/21.9/19.9
Alternating sand addition193.0/204.0/210.0/205.0/190.016.5/17.3/18.1/17.5/16.9
Add sand in reverse order210.0/270.0/336.4/271.0/209.09.7/15.3/21.8/15.7/10.3
Mix and add sand145.0/168.0/182.1/169.0/144.08.7/11.1/12.2/11.5/9
Disclaimer/Publisher’s Note: The statements, opinions and data contained in all publications are solely those of the individual author(s) and contributor(s) and not of MDPI and/or the editor(s). MDPI and/or the editor(s) disclaim responsibility for any injury to people or property resulting from any ideas, methods, instructions or products referred to in the content.