Featured Application
This work proposes combining the efficient and adaptable analytical technique of LIBS with a robust, accurate multivariate non-linear model. This approach offers a valid method for rapidly analyzing lithium in situ in various lithium-rich waste materials, such as ceramics, lubricants, and pharmaceuticals.
Abstract
Although approximately half of global lithium consumption is used in the rechargeable battery industry, lithium is also in demand for other specialized applications, such as high-temperature lubricants, ceramics, glass, and pharmaceuticals. The growing need for efficient lithium recovery and recycling underscores the importance of fast and accurate analytical tools for determining lithium concentrations in non-compliant and waste materials generated by industrial processes. In this paper, we present a machine learning-based procedure utilizing Laser-Induced Breakdown Spectroscopy (LIBS) to accurately quantify lithium concentrations in lithium-rich non-compliant materials derived from the industrial production of enamels used for coating metallic surfaces. This procedure addresses challenges such as strong self-absorption and matrix effects, which limit the effectiveness of conventional univariate calibration methods. By employing a multivariate approach, we developed a single model capable of quantifying lithium content across a wide concentration range. A comparison of the LIBS results with those obtained using conventional laboratory analysis (Inductively Coupled Plasma–Optical Emission Spectrometry, ICP-OES) confirms that LIBS can deliver the speed, precision, and reliability required for potential routine applications in the lithium recovery and recycling industry.
1. Introduction
Lithium (Li) is considered one of the most important strategic raw materials, primarily due to its widespread use in electric energy storage. Given its limited availability, the efficient recovery and recycling of lithium are essential [1,2,3,4,5]. While spent batteries represent the most significant source of lithium for recycling, alternative sources include various types of glass and ceramic materials containing lithium, such as lithium aluminosilicate (LAS), lithium-rich glass, and enamels [6].
In these materials, lithium is typically present as a glass modifier in the form of lithium oxide (Li2O), at concentrations ranging from 1 to 3 wt.%, and is used for coating metallic surfaces [7,8]. These enamels are composed of electrostatically applied micron-sized powders that are deposited onto metal surfaces—such as oven chassis and other domestic or industrial items—and then fired to form a smooth, durable coating. During the application or firing process, some enamel batches may experience technical defects, rendering them unsuitable for use and classifying them as non-compliant materials. Recovering lithium from these discarded products offers both environmental and economic benefits, contributing to circular economy practices and enabling zero-waste processes.
While lithium battery recycling is well-established, the extraction and recycling of lithium from other industrial lithium-rich materials, such as glass and glass-ceramics, remain underexplored. In recent years, only a few studies have proposed lithium extraction protocols for LAS materials [9,10,11,12]. To the best of our knowledge, no existing studies within the literature address lithium extraction from enamel. However, before developing efficient extraction procedures, it is essential to establish fast and accurate analytical methods for determining lithium content, ideally through in situ techniques that require no sample preparation.
Laser-Induced Breakdown Spectroscopy (LIBS) presents a promising solution for this purpose, offering speed, portability, and robustness, making it well-suited for on-site applications [13]. However, LIBS-based lithium analysis faces significant challenges, particularly due to matrix effects and strong self-absorption [14], which complicate traditional univariate calibration approaches [15].
In this paper, we present a methodology that employs machine learning (ML) techniques to develop a single multivariate model capable of accurately quantifying lithium across the full concentration range expected in non-compliant enamel. The robustness of this model, combined with the advantages of LIBS—such as rapid analysis and portable instrumentation—highlights its potential for routine on-site applications, whether in manufacturing facilities or recycling plants.
2. Materials and Methods
The training and testing of the non-linear model for determining lithium (Li) concentrations from the corresponding LIBS spectra were conducted using non-compliant enamel samples provided by a major Tuscany-based international industrial manufacturer (Colorobbia Group, Empoli, Italy), within the framework of the LiCycle (Lithium Recovery from Non-Compliant Material) project.
The samples consist of a series of powder materials that have been stockpiled due to non-compliance with industrial quality standards, specifically related to inadequate performance during metal surface coating processes. Previous mineralogical analyses confirmed that non-compliance is not attributable to structural alterations of the material, as the powders keep their original glassy phase. Furthermore, ICP-OES analysis, which was performed to quantify lithium, confirmed that non-compliance did not alter the elemental concentration within the materials. This is critical for accurately assessing the lithium recovery potential in subsequent recycling processes. Despite minor variations in the overall chemical composition—attributable to the need for specific colors and coating types—the samples constitute a homogeneous class of materials intended for the same production line, and thus, are suitable candidates for a unified recycling process.
In detail, the nominal composition of the enamel samples is reported in Table 1. In addition, two certified reference glass standards—BCR 126A (lead glass) and NBS SRM 1412 (multicomponent glass)—were analyzed, with their compositions shown in Table 2.

Table 1.
Nominal composition of the non-compliant enamels as expected by the manufacturing recipe (© Colorobbia group). The concentrations are expressed in weight percent (wt.%).
Table 2.
Composition of the reference glass standards. The concentrations are in wt.%. Values in parentheses are not certified and are given for information only.
LIBS analysis was performed using the Modì double-pulse instrument, (Marwan Tech., Pisa, Italy) [16], equipped with a double-pulse Nd:YAG laser that emits two collinear pulses, each with an energy of 30 mJ at a wavelength of 1064 nm and a pulse duration of 15 ns (FWHM). The delay between the two laser pulses was set to 1 μs. The laser beam was focused on the sample using a 50 mm focal length lens. Plasma emission was collected using an optical fiber positioned at a 45° angle to the laser beam, 2 cm from the target. The fiber was connected to a dual-grating Avantes spectrometer, which offers a spectral resolution of 0.1 nm between 190 and 430 nm and 0.3 nm between 430 and 950 nm. For each sample, 60 LIBS spectra were acquired (20 consecutive spectra at three different locations). The spectral acquisition was triggered 300 ns after the second pulse, with an integration time of approximately 2 ms (time-integrated measurement).
Li concentrations in the non-compliant enamel samples were also determined using conventional Inductively Coupled Plasma–Optical Emission Spectrometry (ICP-OES), following total digestion of the samples. A representative aliquot (~0.1 g) of finely ground material was digested in Teflon vessels on a temperature-controlled hotplate, following sequential heating and evaporation steps using a mixture of concentrated acids [17]. Four stages of acid additions were carried out using varying concentrations of nitric acid (HNO3), hydrofluoric acid (HF), and hydrochloric acid (HCl) until complete dissolution was achieved. Each acid addition was followed by overnight heating in closed vessels at 140–150°C and daytime evaporation to near dryness in open vessels at 90–100°C. Suprapure HCl (30%) and HNO3 (65%) from Merck and reagent-grade HF (40%) from Sigma-Aldrich were used. For quality control, digestion was also performed on blank samples (empty Teflon vessels containing the acid mixture), sample replicates, and certified reference materials (NBS SRM 1412). This procedure ensured the gradual and complete dissolution of all mineral phases in the sample matrix. Final solutions were diluted as necessary for instrumental analysis based on expected Li concentration ranges. Elemental analysis was conducted using a Thermo Fisher iCAP PRO XP ICP-OES instrument.(Thermo Fisher Scientific Inc, Massachusetts, USA). Operating conditions were as follows: RF power = 1.15 kW, nebulizer pressure = 5 bar, sample uptake rate = 45 rpm, and exposure time = 5 s. Measurements were taken in radial mode using the Li emission line at 670.78 nm. Relative standard errors were below 5%, and reproducibility was better than 10%.
3. Results
A conventional univariate calibration approach [18] was initially applied to the analysis of both enamels (Table 1) and glass standards (Table 2). A typical LIBS spectrum of samples is shown in Figure 1. It is worth noting that no background subtraction or other form of processing was applied to the acquired LIBS spectra, since, in multivariate analysis, the background is actually processed as physical information during feature selection and training of the artificial neural network.
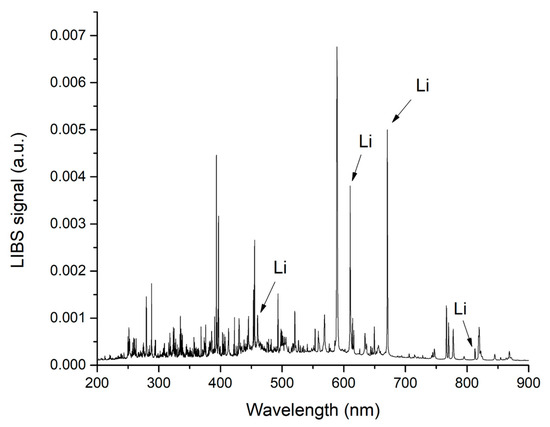
Figure 1.
LIBS spectrum acquired on a non-compliant enamel sample (NC-E_3). The main Li lines are indicated by an arrow.
The proper choice of the analytical line is fundamental in univariate LIBS analysis. The line selected should be, in principle, intense, unaffected by self-absorption, and free from spectral interferences in the whole range of analyte concentration.
One of the intense resonance lithium lines at 670.78 nm or 610.36 nm is often used in the analysis of samples at low lithium concentrations [19], where the effect of self-absorption is not dominant [14].
In a recent paper, Molina et al. [20] determined the Li concentration in pelletized brine samples from the Lithium Triangle region in South America. The authors used the 670.78 nm line to obtain a non-linear calibration curve, which showed an almost linear trend up to Li concentrations of about 400 μg/g (0.04 w%) but demonstrated acceptable analytical performances up to lithium concentrations of 1400 μg/g (0.14 w%). The author noticed that an extension of the linearity of the calibration curve could be obtained using the non-resonant Li line at 812.62 nm.
Another interesting paper dealing with the determination of the Li concentration in Beauvoir rare-metal granite was published by Mezoued et al. [21]. The authors used a hand-held LIBS instrument and built both univariate and multivariate models to determine the Li concentration. They noticed the presence of two resonant lines at 610.36 nm and 670.78 nm in the LIBS spectrum and two non-resonant lines in the near-infrared spectrum at 812.62 nm and 922.40 nm. The triplet around 460 nm was also considered. The authors found that the best analytical lines referred to samples with a lithium content < 1 w%, which were the two resonant lines at 610.36 nm and 670.78 nm.
In our case, since the most intense lithium emission lines at 670.78 nm and 610.36 nm are typically subject to strong self-absorption [15], and in some cases, may also exhibit self-reversal effects [14] for Li concentration larger than 1 w%, we selected the weaker Li I line at 812.62 nm, which is free from spectral interferences and not significantly affected by self-absorption.
Figure 2 shows the calibration curve obtained by plotting the integrated intensity of the Li I line at 812.62 nm—normalized to the total intensity of the LIBS spectrum—against the Li2O weight percentage in the enamel samples (Table 1). The continuum background was removed by fitting the line with a Voigt profile. Three points per sample were considered.
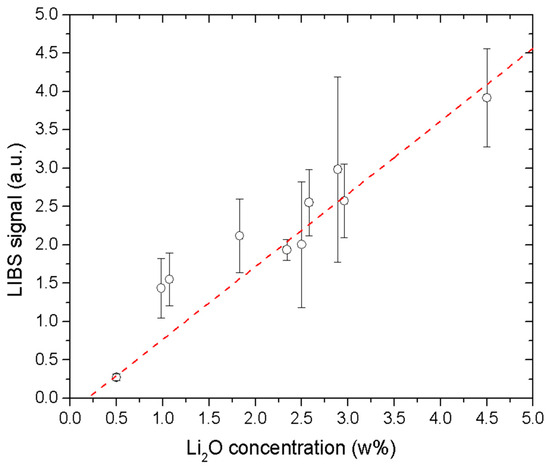
Figure 2.
Univariate calibration curve obtained using the normalized intensity of the Li I line at 812.62 nm. The error bars are the standard deviation of the line intensity measured on three points per sample.
The considerable scattering of data points around the best-fit line in Figure 2 indicates a pronounced matrix effect [22]. This is expected, given the substantial compositional differences between the enamel samples and the certified glass standards (Table 1 and Table 2).
To address the matrix effect, a machine learning approach—similar to the one described in [15]—was used to develop a model that correlates selected spectral features with the Li2O concentrations in the samples.
Feature selection was conducted using MATLAB’s fsrftest algorithm (MathWorks, v. R2024a), which ranks spectral features based on their relevance to the target variable. The algorithm performs an F-test to assess whether the response values, grouped by predictor values, come from populations with different means. Predictors with smaller p-values are considered more significant. The algorithm reports scores as –log (p), so higher scores indicate greater importance.
Figure 3 presents all spectral features (wavelengths) from the LIBS spectra, ranked in decreasing order of relevance based on their scores. A higher score denotes a more significant spectral feature for quantitative analysis.
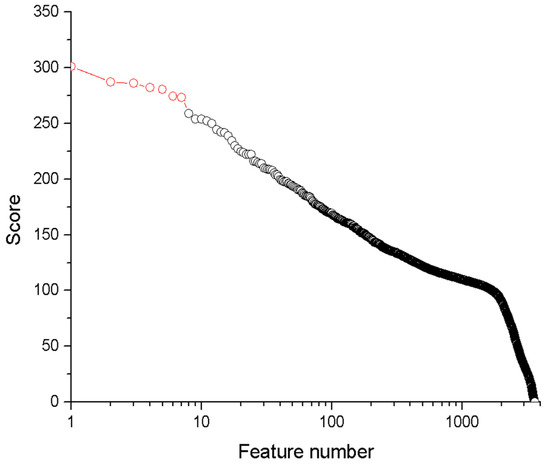
Figure 3.
Scores of the LIBS spectral features for Li analysis. The seven most important features are depicted in red. Note the logarithmic scale on the x-axis.
The selected features are indicated on the LIBS spectrum in Figure 4. All marked points correspond to the three most intense Li I emission lines. However, for the Li I lines at 670.78 nm and 610.36 nm, the algorithm does not identify the peak intensity as significant for the analysis. This is because the peak values of LIBS spectral lines are more susceptible to self-absorption compared to the line wings [23]. In contrast, the Li I line at 413.26 nm appears to be less affected by self-absorption, and, therefore, one of the relevant spectral features corresponds to its peak intensity.
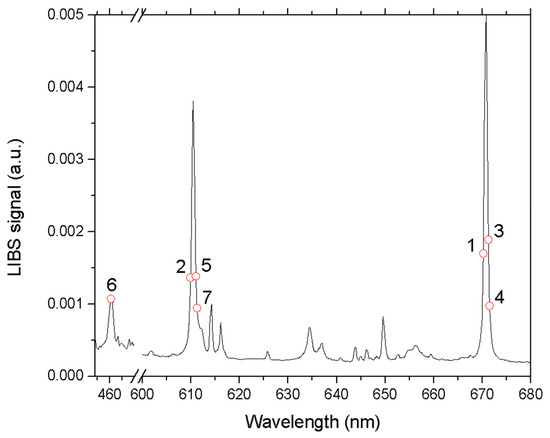
Figure 4.
The seven spectral features selected by the fsrftest algorithm (see also Figure 3). The numbers in the figure represent the rank of the line for the analysis (1 higher and 7 lower).
The spectral features selected by the fsrftest algorithm were used as inputs for a simple feed-forward, back-propagation artificial neural network (ANN) [24].
In its simpler realization (see Figure 5), a feed-forward, back-propagation artificial neural network determines a non-linear relationship between relevant LIBS spectral features (inputs) and the concentration of the analyte in the samples (output).
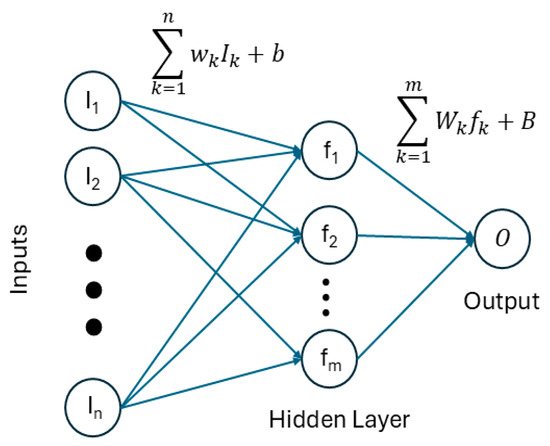
Figure 5.
Schematic representation of the ANN used for lithium concentration determination.
This non-linear relationship is sought in the form of a linear combination of the inputs, which is propagated to a “neuron” in the so-called hidden layer of the ANN; a non-linear function, called the activation function, is applied to the linear combination, usually in the form of a sigmoid or hyperbolic tangent function. More non-linearities can be added to the model by adding additional neurons to the hidden layer, the results of which are then linearly combined to obtain the ANN output. The parameters of the linear combinations (weights and bias) are found through an iterative process, called training, where these parameters are optimized to minimize the difference between the predicted and known concentrations of a set of samples similar to the ones being measured. Once the parameters are optimized, the resulting model can be applied to unknown samples by following the same flow (linear combination of inputs, application of the non-linear activation function in the hidden neurons, and linear combination of the hidden neuron results to obtain the output, i.e., elemental concentration of the analyte).
To ensure the generality and robustness of the model and minimize the risk of overfitting, it was essential to keep the number of neurons in the hidden layer as low as possible. Several models were tested, with the number of neurons varying from 3 to 15. The best compromise between prediction accuracy and model simplicity was achieved with six neurons in the hidden layer, although slightly better performance was observed with a larger number of neurons. A hyperbolic tangent function was used as the activation function. Figure 6 shows the predicted Li2O concentrations obtained using this model.
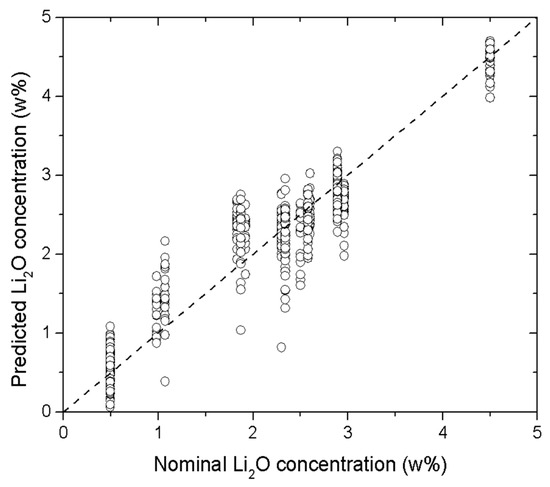
Figure 6.
Predicted vs. nominal Li2O concentration (wt.%) obtained using 6 neurons in the hidden layer. The points in the graph correspond to the Li2O concentration predicted from all the LIBS spectra acquired for the corresponding sample. The dashed line corresponds to the perfect coincidence of predicted and nominal concentrations.
The validation of the model was performed using the Leave-One-Out cross-validation method (LOO), which is a procedure commonly applied to validate ANN models when the number of reference samples is too small to allow for external validation on separate datasets [25]. In the LOO method, one sample is removed from the training set in each iteration; the ANN is trained on the remaining n − 1 samples; and the excluded sample is used for external validation. This process is repeated for all samples, ensuring that each sample is used once for validation and providing a robust assessment of the ANN model. As expected, the correspondence between the nominal and predicted Li2O concentrations obtained using the LOO procedure (Figure 7) is slightly less accurate than that shown in Figure 6, which was obtained by training the ANN on all available samples. However, the predictive performance of the ANN remains strong, especially considering the substantial variability among the enamel samples and the certified glass standards used for training (see Table 1 and Table 2).
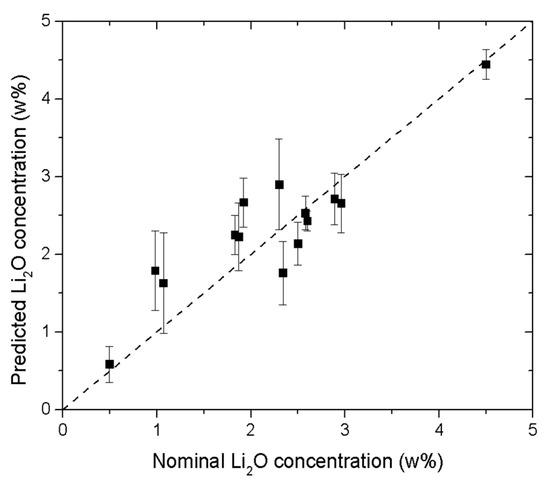
Figure 7.
Predicted vs. nominal Li2O concentration obtained after Leave-One-Out validation. The error bars correspond to the standard deviation of the predicted values for all the spectra considered.
The comparison between the LIBS results obtained using a univariate linear calibration curve (Figure 2) and ANN (Figure 7) is shown in Figure 8.
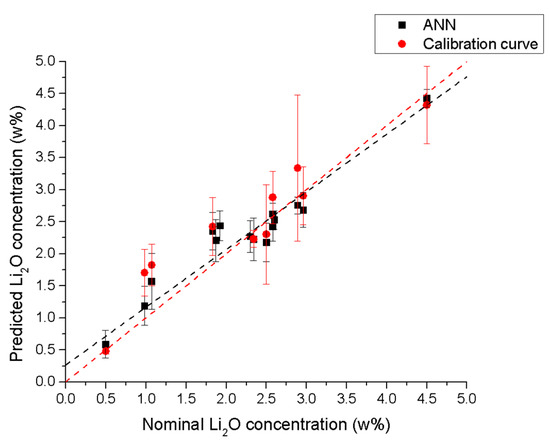
Figure 8.
Comparison of the predicted vs. nominal concentrations for the ANN (black squares) and the univariate calibration (red circles) models. The error bars correspond to the standard deviation of the predictions from all the LIBS spectra considered.
The analytical performance of the ANN is clearly superior to that of the univariate calibration curve, as summarized in Table 3. While the slope and intercept of the two models cannot be directly compared—since the predicted concentrations from the univariate calibration curve were calculated assuming a slope of 1 and an intercept of 0—the correlation coefficient (R) for the ANN is slightly higher than that of the univariate model.
Table 3.
Comparison of the results obtained by ICP-OES and LIBS (univariate calibration curve and ANN). The samples marked with the asterisk are the reference samples.
Moreover, the Root Mean Square Error (RMSE) is defined as follows:
where n is the number of samples; Cp is the predicted concentration; and Cn is the nominal concentration of the analyte, which is significantly lower for the ANN (RMSE = 0.97 wt.%) compared to the univariate calibration curve (RMSE = 1.27 wt.%).
Similarly, the bias is defined as follows:
where is b = 0.22 wt.% for the univariate calibration curve and b = 0.07 wt.% for the ANN.
The mean absolute and relative errors for the Li2O weight concentration are also lower for the ANN compared to the univariate approach. The analytical parameters for both models—used to determine Li concentrations in enamel via LIBS and ICP-OES—are summarized in Table 3.
Finally, the LIBS results are compared with those obtained using the ICP-OES technique, as reported in Table 4 and graphically illustrated in Figure 9.
Table 4.
Analytical parameters of the models used for the determination of Li concentration in enamel.
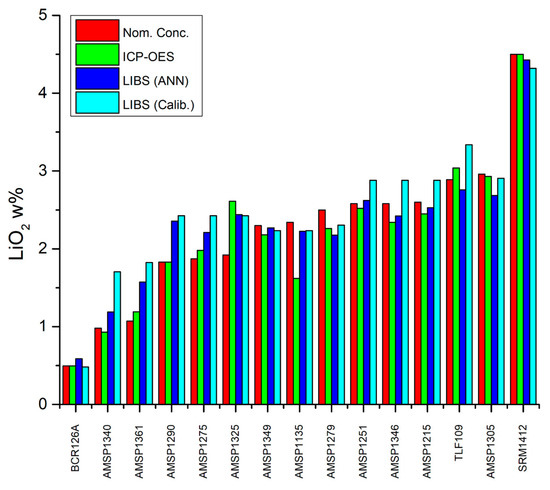
Figure 9.
Comparison of analytical parameters of the models used to determine Li concentration in enamel across different samples.
4. Conclusions
The development of fast, robust, and accurate methods for determining lithium concentration is crucial for the efficient recovery and recycling of this critical raw material. With the increasing demand for lithium across various industries—including energy storage, electronics, and pharmaceuticals—the ability to accurately and efficiently quantify its concentration in different materials is essential. Laser-induced Breakdown Spectroscopy (LIBS) offers a rapid, in situ alternative with minimal sample preparation, making it highly attractive for real-time lithium analysis. However, its high sensitivity to self-absorption and matrix effects poses challenges for conventional univariate calibration methods.
These limitations can lead to inaccuracies in lithium quantification, particularly when analyzing complex matrices that vary significantly in composition. Addressing these issues is critical to enhancing the reliability of LIBS for lithium concentration measurements, especially in non-compliant materials where matrix variations can introduce substantial analytical errors.
In this study, we present a procedure for constructing a robust and accurate multivariate non-linear analytical model that significantly reduces the impact of self-absorption and matrix effects. By employing advanced data processing techniques and machine learning algorithms, the proposed approach improves the predictive accuracy of LIBS-based lithium analysis. Multivariate calibration methods enable the extraction of meaningful spectral features correlated with lithium concentration while compensating for matrix effects. This enhancement in analytical precision makes LIBS a more viable tool for the lithium recycling and recovery industries, where rapid and accurate elemental analysis is essential.
The simplicity of the proposed approach makes it well-suited for on-site LIBS applications that determine lithium concentration in non-compliant materials, as demonstrated in this work. The analytical performance of the combined LIBS and ANN approach is comparable—especially for medium-to-high lithium concentrations—to that of traditional trace element analysis techniques requiring lengthy acid digestion procedures (e.g., ICP-OES). Unlike conventional laboratory-based methods, the approach presented does not require chemical treatment of samples and enables rapid decision-making in industrial and field settings, facilitating more efficient lithium recovery and quality control processes.
Furthermore, this methodology can be easily adapted for analyzing lithium in other lithium-rich waste materials, including ceramics, lubricants, and pharmaceuticals, thereby broadening its applicability in lithium recycling and recovery. As demand for lithium continues to rise, the development of efficient and adaptable analytical techniques will play a crucial role in ensuring the sustainable use of this valuable resource.
Author Contributions
Conceptualization, V.P., S.L. and S.R.; methodology, V.P. and S.L.; validation, V.P., S.L. and S.R.; formal analysis, V.P.; investigation, F.P., G.L., V.R. and G.M.; resources, V.P., S.L., S.R., P.C., V.R. and G.M.; data curation, V.P., S.L. and S.R.; writing—original draft preparation, V.P. and S.R.; writing—review and editing, S.R., V.P., F.P., G.L., B.C., P.C., V.R., G.M. and S.L.; funding acquisition, S.R. All authors have read and agreed to the published version of the manuscript.
Funding
This research was funded by University of Florence in the framework of the LiCycle project, DR n. 1234/2024 (Prot. N 0222455-23/09/2024).
Data Availability Statement
The data presented in this study are available on request from the corresponding author.
Acknowledgments
The authors acknowledge Colorobbia group for providing enamel samples. M. Chiari (LABEC, INFN, Italy) is acknowledged for providing standard reference, certified lithium glass.
Conflicts of Interest
The authors declare no conflicts of interest.
References
- Alessia, A.; Alessandro, B.; Maria, V.G.; Carlos, V.A.; Francesca, B. Challenges for sustainable lithium supply: A critical review. J. Clean. Prod. 2021, 300, 126954. [Google Scholar] [CrossRef]
- Balaram, V.; Santosh, M.; Satyanarayanan, M.; Srinivas, N.; Gupta, H. Lithium: A review of applications, occurrence, exploration, extraction, recycling, analysis, and environmental impact. Geosci. Front. 2024, 15, 101868. [Google Scholar] [CrossRef]
- Tabelin, C.B.; Dallas, J.; Casanova, S.; Pelech, T.; Bournival, G.; Saydam, S.; Canbulat, I. Towards a low-carbon society: A review of lithium resource availability, challenges and innovations in mining, extraction and recycling, and future perspectives. Miner. Eng. 2021, 163, 106743. [Google Scholar] [CrossRef]
- Garcia, L.V.; Ho, Y.C.; Myo Thant, M.M.; Han, D.S.; Lim, J.W. Lithium in a Sustainable Circular Economy: A Comprehensive Review. Processes 2023, 11, 418. [Google Scholar] [CrossRef]
- Swain, B. Recovery and recycling of lithium: A review. Sep. Purif. Technol. 2017, 172, 388–403. [Google Scholar] [CrossRef]
- Holland, W.; Beall, G. Glass-ceramic technology. In The American Ceramic Society, 1st ed.; The American Ceramic Society: Westerville, OH, USA, 2002. [Google Scholar]
- Kyrl, H. Handbook for Bayer Enamels; Bayer AG: Leverkusen, Germany, 1976. [Google Scholar]
- Volf, M.B. Chemical Approach to Glass; Glassworks, I., Ed.; Elsevier: Amsterdam, The Netherlands, 2011; Available online: https://books.google.com/books/about/Chemical_Approach_to_Glass.html?hl=it&id=Zh0EfAEACAAJ (accessed on 15 March 2025).
- Lee, D.; Joo, S.-H.; Shin, D.J.; Shin, S.M. Evaluation of leaching characteristic and kinetic study of lithium from lithium aluminum silicate glass-ceramics by NaOH. J. Environ. Sci. 2021, 107, 98–110. [Google Scholar] [CrossRef] [PubMed]
- Lee, D.; Joo, S.-H.; Shin, D.J.; Shin, S.M. Recovery of Li from lithium aluminum silicate (LAS) glass-ceramics after heat treatment at 1000 °C and Ca salt-assisted water leaching in two stages before and after calcination at 600 °C. Hydrometallurgy 2022, 211, 105876. [Google Scholar] [CrossRef]
- Kim, Y.; Han, Y.; Kim, S.; Jeon, H.-S. Green extraction of lithium from waste lithium aluminosilicate glass-ceramics using a water leaching process. Process Saf. Environ. Prot. 2021, 148, 765–774. [Google Scholar] [CrossRef]
- Tao, X.; Li, B.; Peng, A.; Zhang, H.; Wang, J.; Zheng, Y.; Yang, L.; Luo, X.; Luo, S.; Shao, P. High-efficiency and environment-friendly extraction of lithium from waste LAS glass-ceramics by roasting with KOH at low temperature. Resour. Conserv. Recycl. 2024, 209, 107775. [Google Scholar] [CrossRef]
- Cremers, D.A.; Radziemski, L.J. Handbook of Laser-Induced Breakdown Spectroscopy; Wiley: Hoboken, NJ, USA, 2013. [Google Scholar]
- Touchet, K.; Chartier, F.; Hermann, J.; Sirven, J.B. Laser-induced breakdown self-reversal isotopic spectrometry for isotopic analysis of lithium. Spectrochim. Acta Part B At. Spectrosc. 2020, 168, 105868. [Google Scholar] [CrossRef]
- Galli, E.; Massa, M.; Zanoletti, A.; De Iuliis, S.; Bontempi, E.; Depero, L.E.; Palleschi, V.; Borgese, L. Determination of lithium concentration in black mass using laser-induced breakdown spectroscopy hand-held instrumentation. Sci. Rep. 2025, 15, 17483. [Google Scholar] [CrossRef] [PubMed]
- Bertolini, A.; Carelli, G.; Francesconi, F.; Francesconi, M.; Marchesini, L.; Marsili, P.; Sorrentino, F.; Cristoforetti, G.; Legnaioli, S.; Palleschi, V.; et al. Modì: A new mobile instrument for in situ double-pulse LIBS analysis. Anal. Bioanal. Chem. 2006, 385, 240–247. [Google Scholar] [CrossRef] [PubMed]
- Balaram, V.; Subramanyam, K.S.V. Sample preparation for geochemical analysis: Strategies and significance. Adv. Sample Prep. 2022, 1, 100010. [Google Scholar] [CrossRef]
- Legnaioli, S.; Botto, A.; Campanella, B.; Poggialini, F.; Raneri, S.; Palleschi, V. Univariate Linear Methods. In Chemometrics and Numerical Methods in LIBS; John Wiley & Sons: Hoboken, NJ, USA, 2022; pp. 259–276. ISBN 978-1-119-75957-7. [Google Scholar]
- Fabre, C.; Boiron, M.C.; Dubessy, J.; Chabiron, A.; Charoy, B.; Martin Crespo, T. Advances in Lithium Analysis in Solids by Means of Laser-Induced Breakdown Spectroscopy: An Exploratory Study. Geochim. Cosmochim. Acta 2002, 66, 1401–1407. [Google Scholar] [CrossRef]
- Molina, J.M.; Sarchi, C.; Tesio, A.Y.; Costa-Vera, C.; Díaz Pace, D.M. Quantitative Analysis of Lithium in Natural Brines from the Lithium Triangle by Laser-Induced Breakdown Spectroscopy. Atoms 2025, 13, 56. [Google Scholar] [CrossRef]
- Mezoued, N.; Fabre, C.; Cauzid, J.; Kahou, Z.S.; Rocher, O. Handheld LIBS Contribution to Quantify Critical Elements during Mining Operations: The Beauvoir Granite Case Study. J. Geochem. Explor. 2025, 271, 107689. [Google Scholar] [CrossRef]
- Lepore, K.H.; Fassett, C.I.; Breves, E.A.; Byrne, S.; Giguere, S.; Boucher, T.; Rhodes, J.M.; Vollinger, M.; Anderson, C.H.; Murray, R.W.; et al. Matrix Effects in Quantitative Analysis of Laser-Induced Breakdown Spectroscopy (LIBS) of Rock Powders Doped with Cr, Mn, Ni, Zn, and Co. Appl. Spectrosc. 2017, 71, 600–626. [Google Scholar] [CrossRef] [PubMed]
- Rezaei, F.; Cristoforetti, G.; Tognoni, E.; Legnaioli, S.; Palleschi, V.; Safi, A. A review of the current analytical approaches for evaluating, compensating and exploiting self-absorption in Laser Induced Breakdown Spectroscopy. Spectrochim. Acta Part B At. Spectrosc. 2020, 169, 105878. [Google Scholar] [CrossRef]
- Zhang, T.; Tang, H.; Li, H. Chemometrics in Laser-Induced Breakdown Spectroscopy. J. Chemom. 2018, 32, e2983. [Google Scholar] [CrossRef]
- Senesi, G.S.; Allegretta, I.; Marangoni, B.S.; Ribeiro, M.C.S.; Porfido, C.; Terzano, R.; De Pascale, O.; Eramo, G. Geochemical Identification and Classification of Cherts Using Handheld Laser Induced Breakdown Spectroscopy (LIBS) Supported by Supervised Machine Learning Algorithms. Appl. Geochem. 2023, 151, 105625. [Google Scholar] [CrossRef]
Disclaimer/Publisher’s Note: The statements, opinions and data contained in all publications are solely those of the individual author(s) and contributor(s) and not of MDPI and/or the editor(s). MDPI and/or the editor(s) disclaim responsibility for any injury to people or property resulting from any ideas, methods, instructions or products referred to in the content. |
© 2025 by the authors. Licensee MDPI, Basel, Switzerland. This article is an open access article distributed under the terms and conditions of the Creative Commons Attribution (CC BY) license (https://creativecommons.org/licenses/by/4.0/).