Article

Dependence of Interface Shear Strength of Sand on Surface Roughness and Particle Size

Department of Engineering Mechanics, Dalian University of Technology, Dalian 116024, China
*
Author to whom correspondence should be addressed.
Appl. Sci. 2025, 15(17), 9575; https://doi.org/10.3390/app15179575 (registering DOI)
Submission received: 10 May 2025 / Revised: 24 August 2025 / Accepted: 26 August 2025 / Published: 30 August 2025

Abstract

The evaluation of the interfacial shear strength between sand and steel materials plays a fundamental role in the design of geotechnical foundations and structures. However, testing equipment cannot consider the dual effects of particle size and steel roughness on a uniform stress state. In this study, a novel torsion shear apparatus was designed that can measure arbitrary displacement within the interface. On this basis, the influence of the sand particle size and contact surface roughness on interface shear behavior was studied, and the sand–steel interface mechanical responses, including stress state, sample deformation, and friction properties, were evaluated. The results of the torsional interface shear test (TIST) were compared with those of the conventional direct interface shear test (DIST). The results indicate that the shear strength of rough interfaces exceeds that of smooth interfaces but remains below the shear strength observed in pure soil shear tests. Moreover, a critical value of relative roughness exists, beyond which the peak shear stress or friction angle does not significantly increase. Despite variations in the sand grain sizes used in the tests, the corresponding friction angles were approximately equal. In pure soil shear tests, the friction angle was positively correlated with grain size, indicating that grain size directly affects the friction angle in pure soil shear. Additionally, the normalized interface friction angles obtained from the torsional interface shear tests showed good agreement with those derived from interface direct shear tests.

1. Introduction

The shear interaction between soil and structures is a common topic in geotechnical engineering [1,2,3,4,5]. The soil–steel interface is extensively applied in geotechnical engineering, including applications such as submarine pipelines, pile foundations, and soil nailing [6,7,8]. The soil–steel interaction has a significant effect on the stress–strain predictions, stability assessments, and the bearing capacity of engineering sites. The soil–steel interaction has become the focus of geotechnical engineering research [9,10,11]. Therefore, it is imperative to investigate the mechanical interaction behavior between steel structures and soil.
The interface shear test has been extensively employed to investigate the shear behavior of soil–structure interaction. The shear strength of the soil–steel interface is influenced by factors such as steel surface geometry, particle size distribution, stress state, shear rate, and other variables. Given that the surfaces of structures in practical engineering applications typically have irregular undulations, the influence of surface roughness has garnered significant attention from researchers. Li et al. [12] found that the effect of surface roughness on unsaturated silt is mainly reflected in the moisture content, which is largely due to the effect of matrix suction. They also noted that the impact of matrix suction on peak strength is greater than its influence on residual strength. Hamid and Miller [13] improved the direct interface shear apparatus and developed a control method for matrix suction at the interface under varying roughness conditions. They observed that roughness induced local differences in matrix suction and soil sample structure, which in turn affected the strength. Hu and Pu [14] highlighted the concept of critical relative roughness to determine the boundary between smooth and relatively rough interfaces. They used a visual direct shear test to demonstrate that roughness contributes to strain localization in sand. The impact of roughness on calcareous sand is primarily evident when evaluating peak shear strength, particularly during stages of smaller shear displacements [15]. The roughness caused by the degree of corrosion also increases the peak shear strength of the interface with the increase of roughness [16]. The geometric asymmetry of a snakeskin bionic steel interface affects its roughness and the peak friction angle of the calcareous sand interface [17]. The traditional equipment used to study small interface roughness includes the direct interface shear apparatus. Considering the dual effects of particle size and surface roughness of the structure, studies using the direct interface shear apparatus must minimize the influence of particle size. As a result, large-scale direct shear tests are typically employed [12]. Despite this, defects in the structural design of the direct shear apparatus make it difficult to avoid strength limitations when the interface undergoes large deformation, even with large-scale testers. Additionally, contact surface migration in direct shear tests leads to shear area loss, causing damage that does not occur uniformly across the entire preset interface. Seiphoori et al. proposed that surface roughness can induce both the sliding and rotation of particles at the interface in torsion shear tests and direct shear tests, as well as a combination of these two motion modes. Relative roughness can still be used to quantify the interaction between particle size and contact surface [18]. Therefore, it is essential to develop an interface torsion shear apparatus to simulate the large-scale sliding interface behavior in real-world conditions and characterize the dual effects of particle size and large surface roughness [19,20,21].
This study utilized a self-developed torsional interface shear apparatus, which provides a constant shear area and allows for arbitrary shear displacement during the shear processes. To investigate the surface roughness of steel and the particle-size-dependent interface shear strength of sand, a series of interface shear tests were conducted using different sand samples with varying mean particle sizes in contact with a steel interface. By comparing the observed trends with those from the direct interface and pure sand shear tests, several mechanical responses from the interface shear tests, such as stress state, sample deformation, and friction properties, were analyzed. The findings provide valuable insights for the development of torsional interface shear apparatuses and enhance the understanding of the interaction between dry sand and structures in engineering applications.

2. Methods and Materials

2.1. Experimental Setup

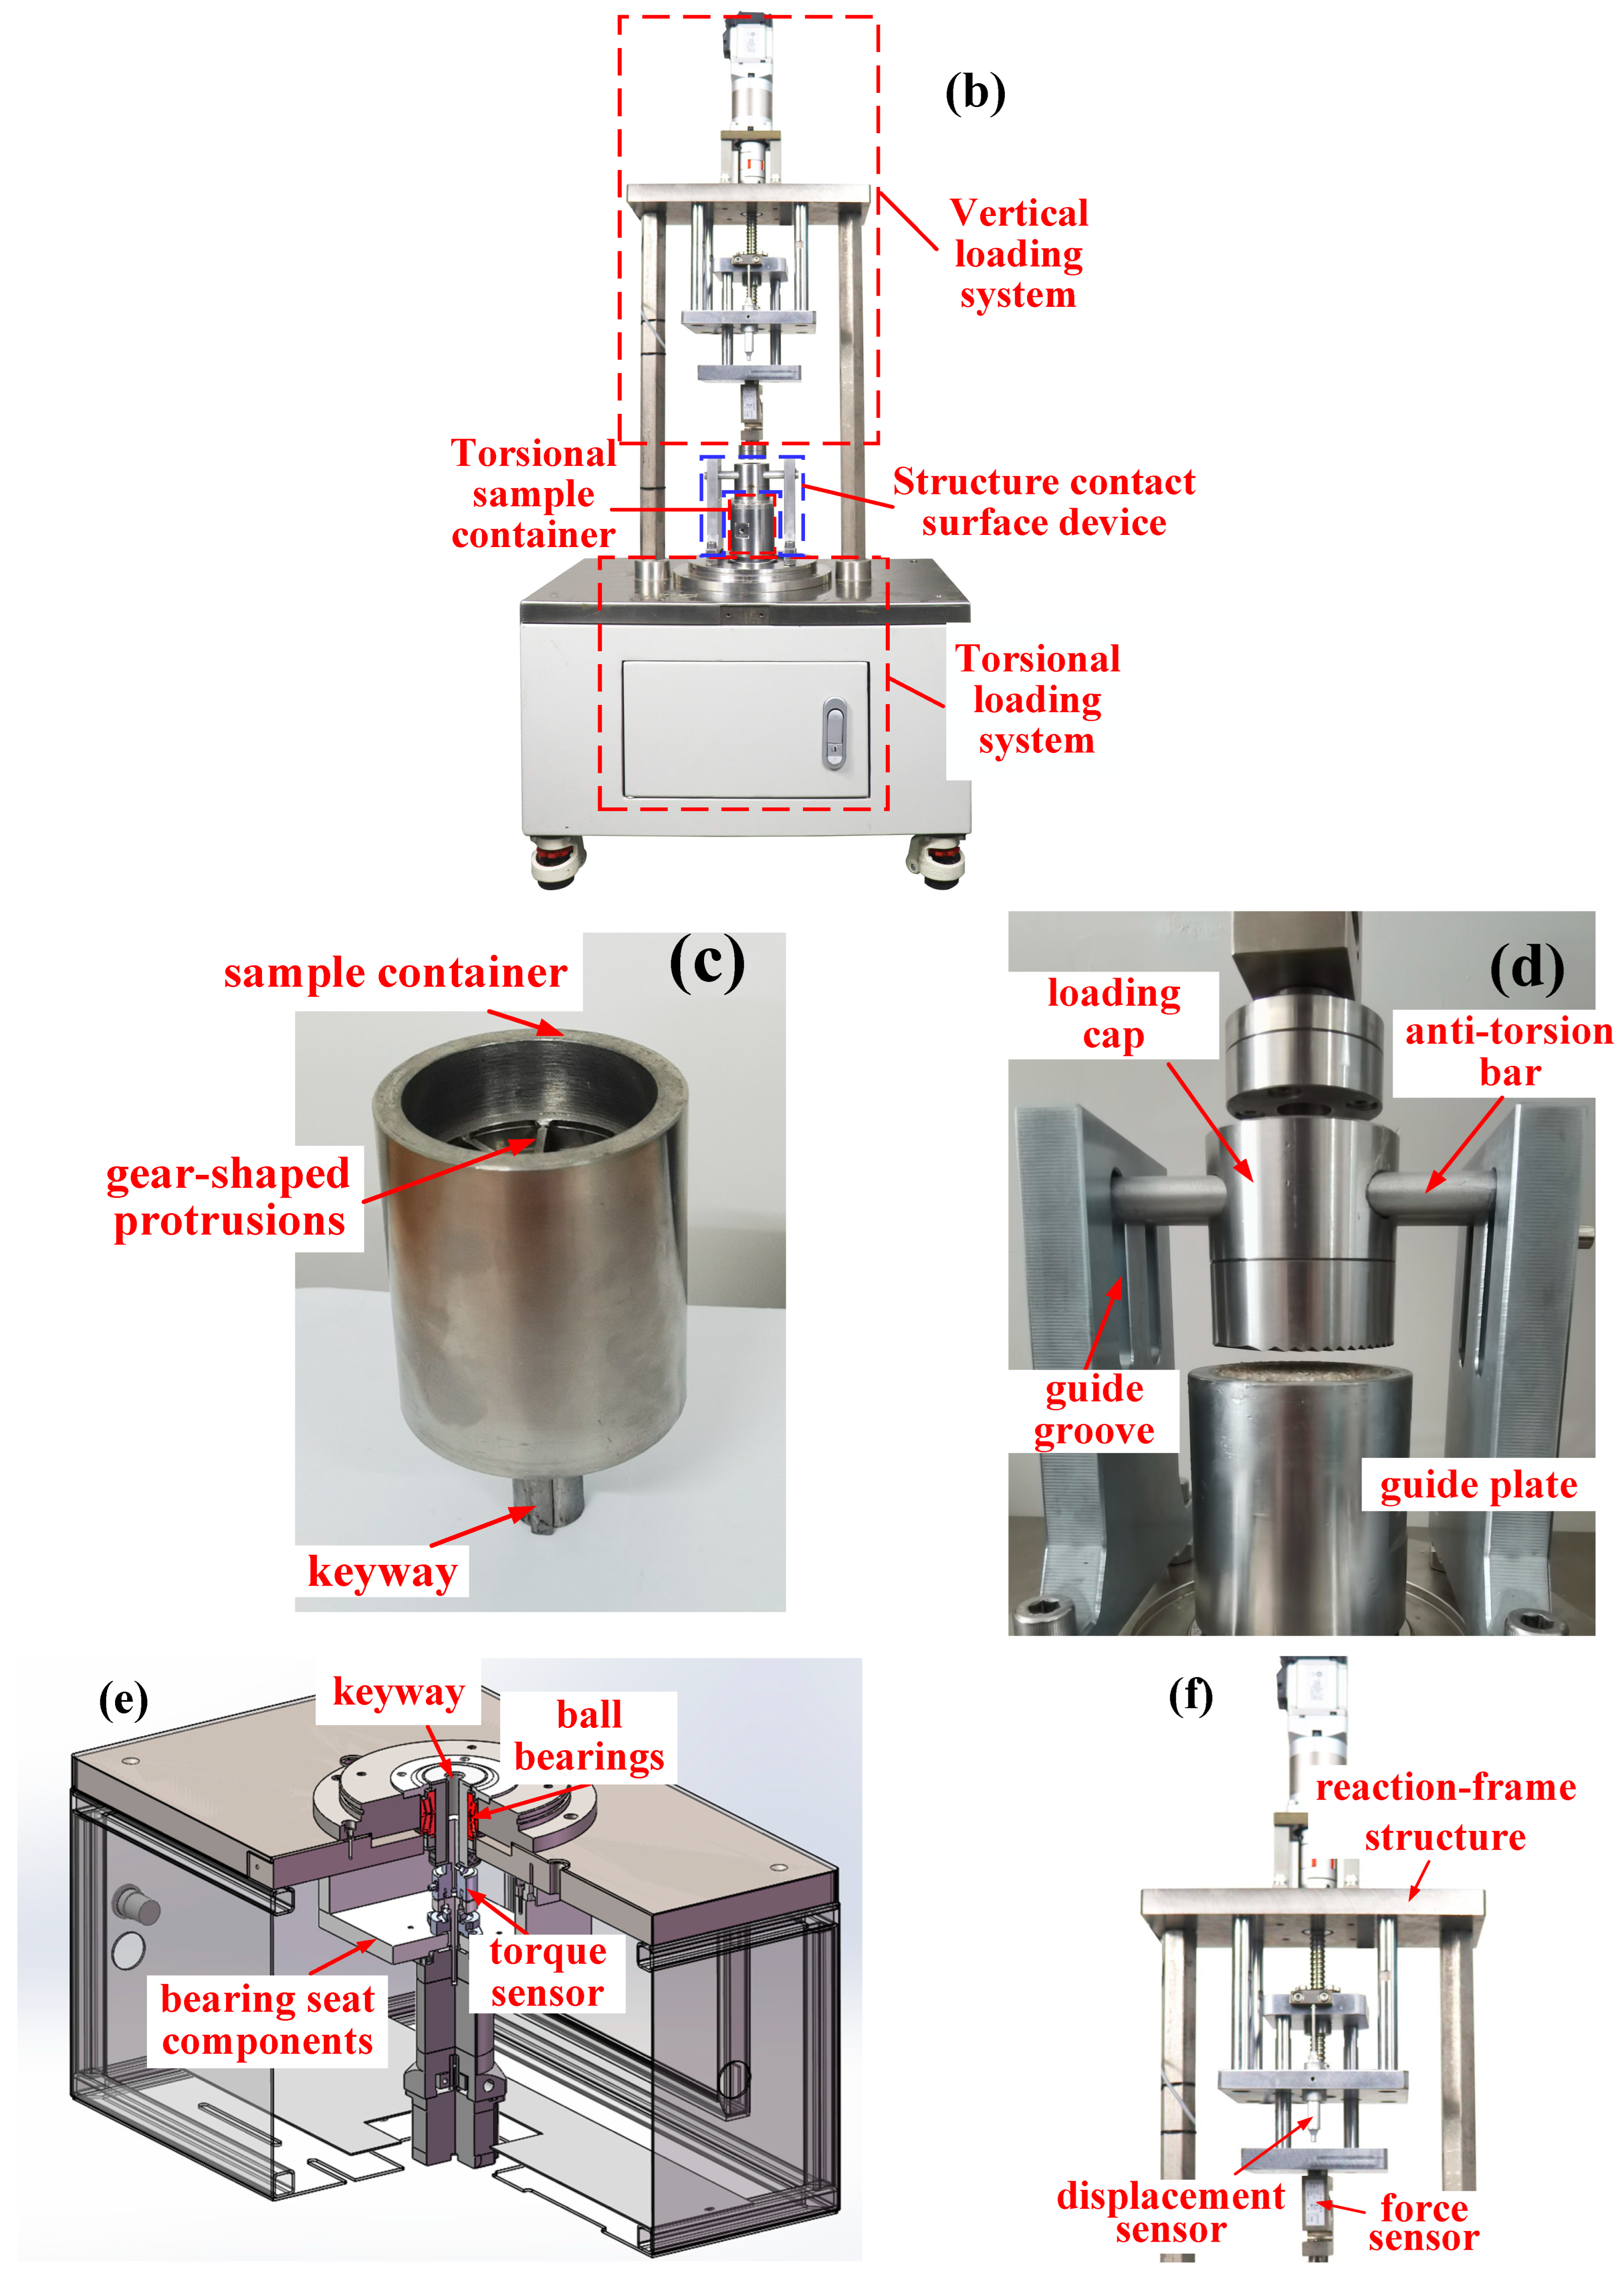
Figure 1a presents the schematic diagram of the experimental system, while Figure 1b shows the overall setup, which comprises four main components: a torsional shear sample container (Figure 1c), a structural contact surface device (Figure 1d), a torsional loading system (Figure 1e), and a vertical loading system (Figure 1f). As illustrated in Figure 1a, during testing, a control program on the computer sends signals to a controller that drives the axial servo motor. The normal force and displacement at the interface between the soil specimen and the loading cap are measured by an axial force sensor and a displacement sensor, respectively. These signals are converted into digital format via a programmable logic controller (PLC) and fed back to the control program. Once the predefined normal force is achieved, the control program activates the torsion stepper motor. The torque applied at the interface is recorded by a torque sensor, and the rotational angle and torque signals are similarly transmitted back to the computer through the PLC. When the preset rotational angle is reached, the control program commands the torsion stepper motor to stop.
As shown in Figure 1c, the interior bottom of the sample container features gear-shaped protrusions to enhance soil contact, and the inner sidewalls are smooth to ensure consistent boundary conditions. For a specimen with an aspect ratio of 0.4, a uniform vertical stress distribution is maintained. The connecting rod at the bottom of the container includes a raised flat key that engages with a ball screw bearing, ensuring stable mechanical transmission during the test.
As shown in Figure 1d, the loading cap is equipped with an anti-torsion bar and a guide plate. The guide plate includes a guide groove through which the anti-torsion bar passes. This configuration ensures that the loading cap moves exclusively in the vertical direction, effectively restricting any rotational displacement. To accommodate interchangeable rough-surface steel plates, the loading cover is designed as a two-part assembly, with the upper portion serving as the displacement-limiting end and the lower portion holding the rough-surface steel plate. The vertical loading system simulates the normal stress conditions at the soil–structure interface under realistic working environments by precisely controlling both the loading rate and amplitude. Depending on the experimental requirements, vertical loads can be applied under either stress-controlled or strain-controlled modes.
As illustrated in Figure 1e, the transmission mechanism primarily consists of ball bearings and bearing seat components. A torque sensor is installed between the ball bearing and the housing assembly to monitor torque transmission accurately. A flat key connection system is employed: this is a specially designed keyway allows the connecting rod at the bottom of the sample container to be securely inserted, ensuring stable mechanical coupling during the test. As shown in Figure 1f, the axial loading system is a reaction-frame structure equipped with a force sensor and displacement sensor.

2.2. Materials

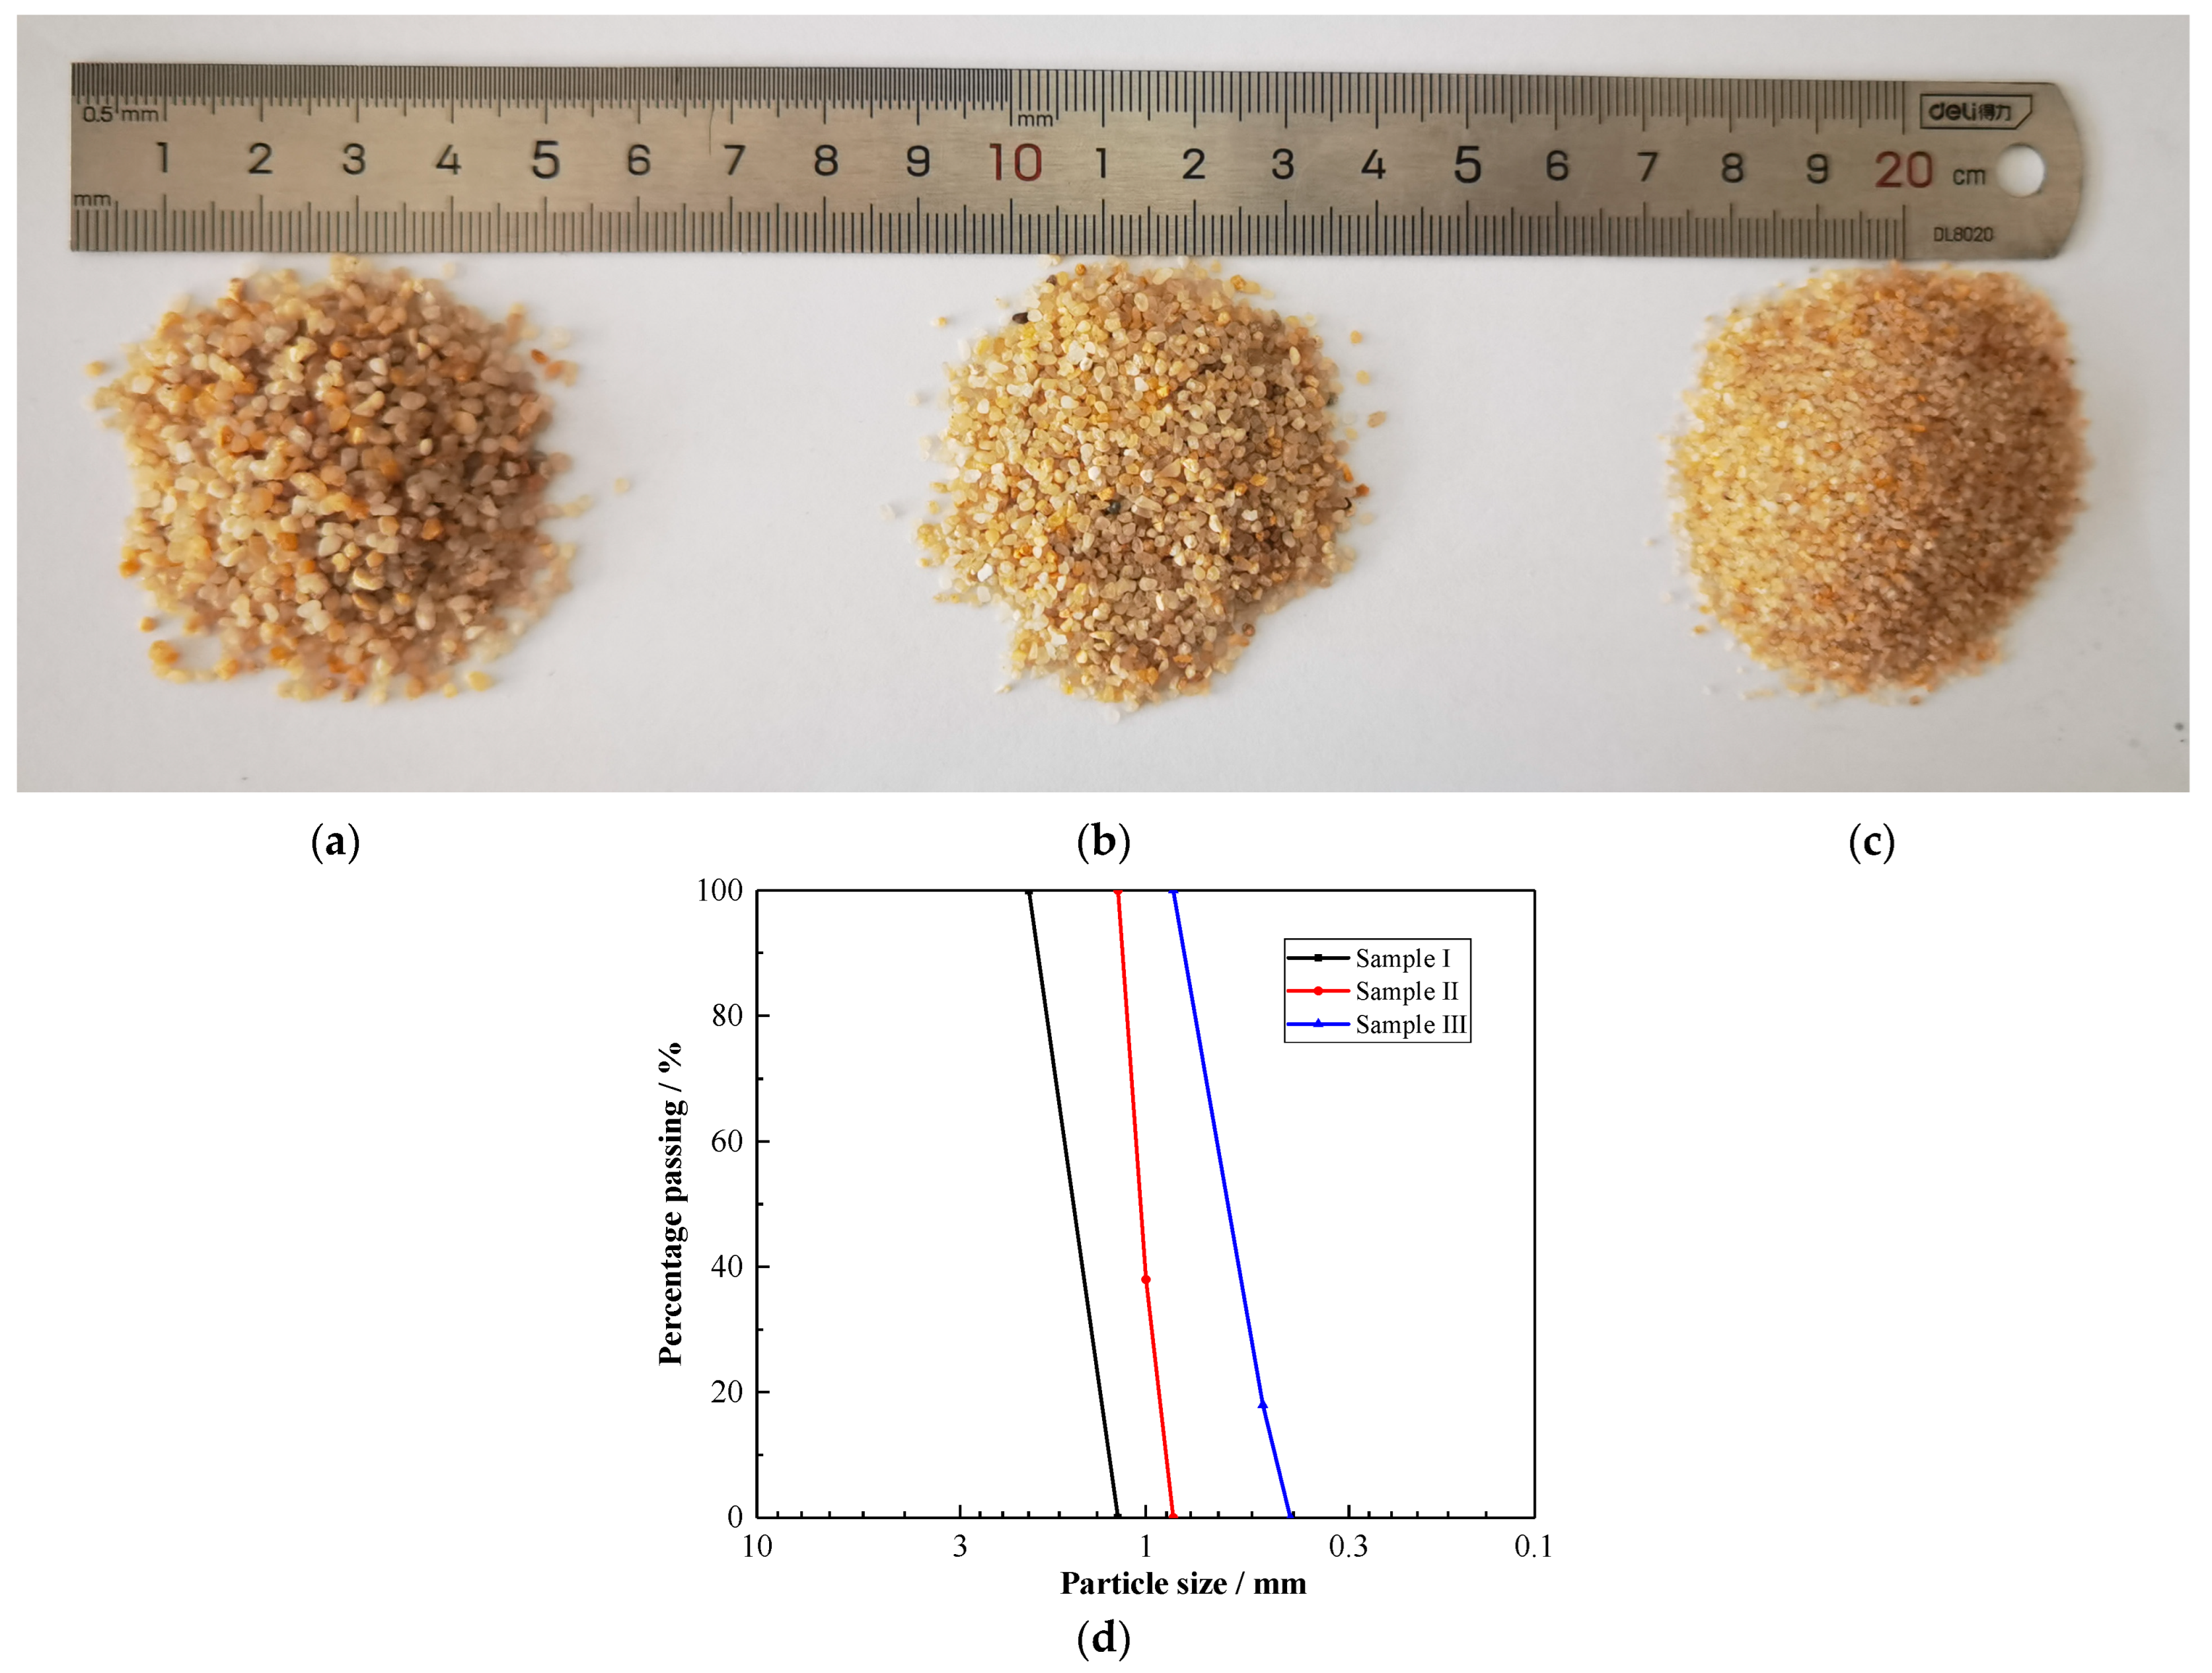
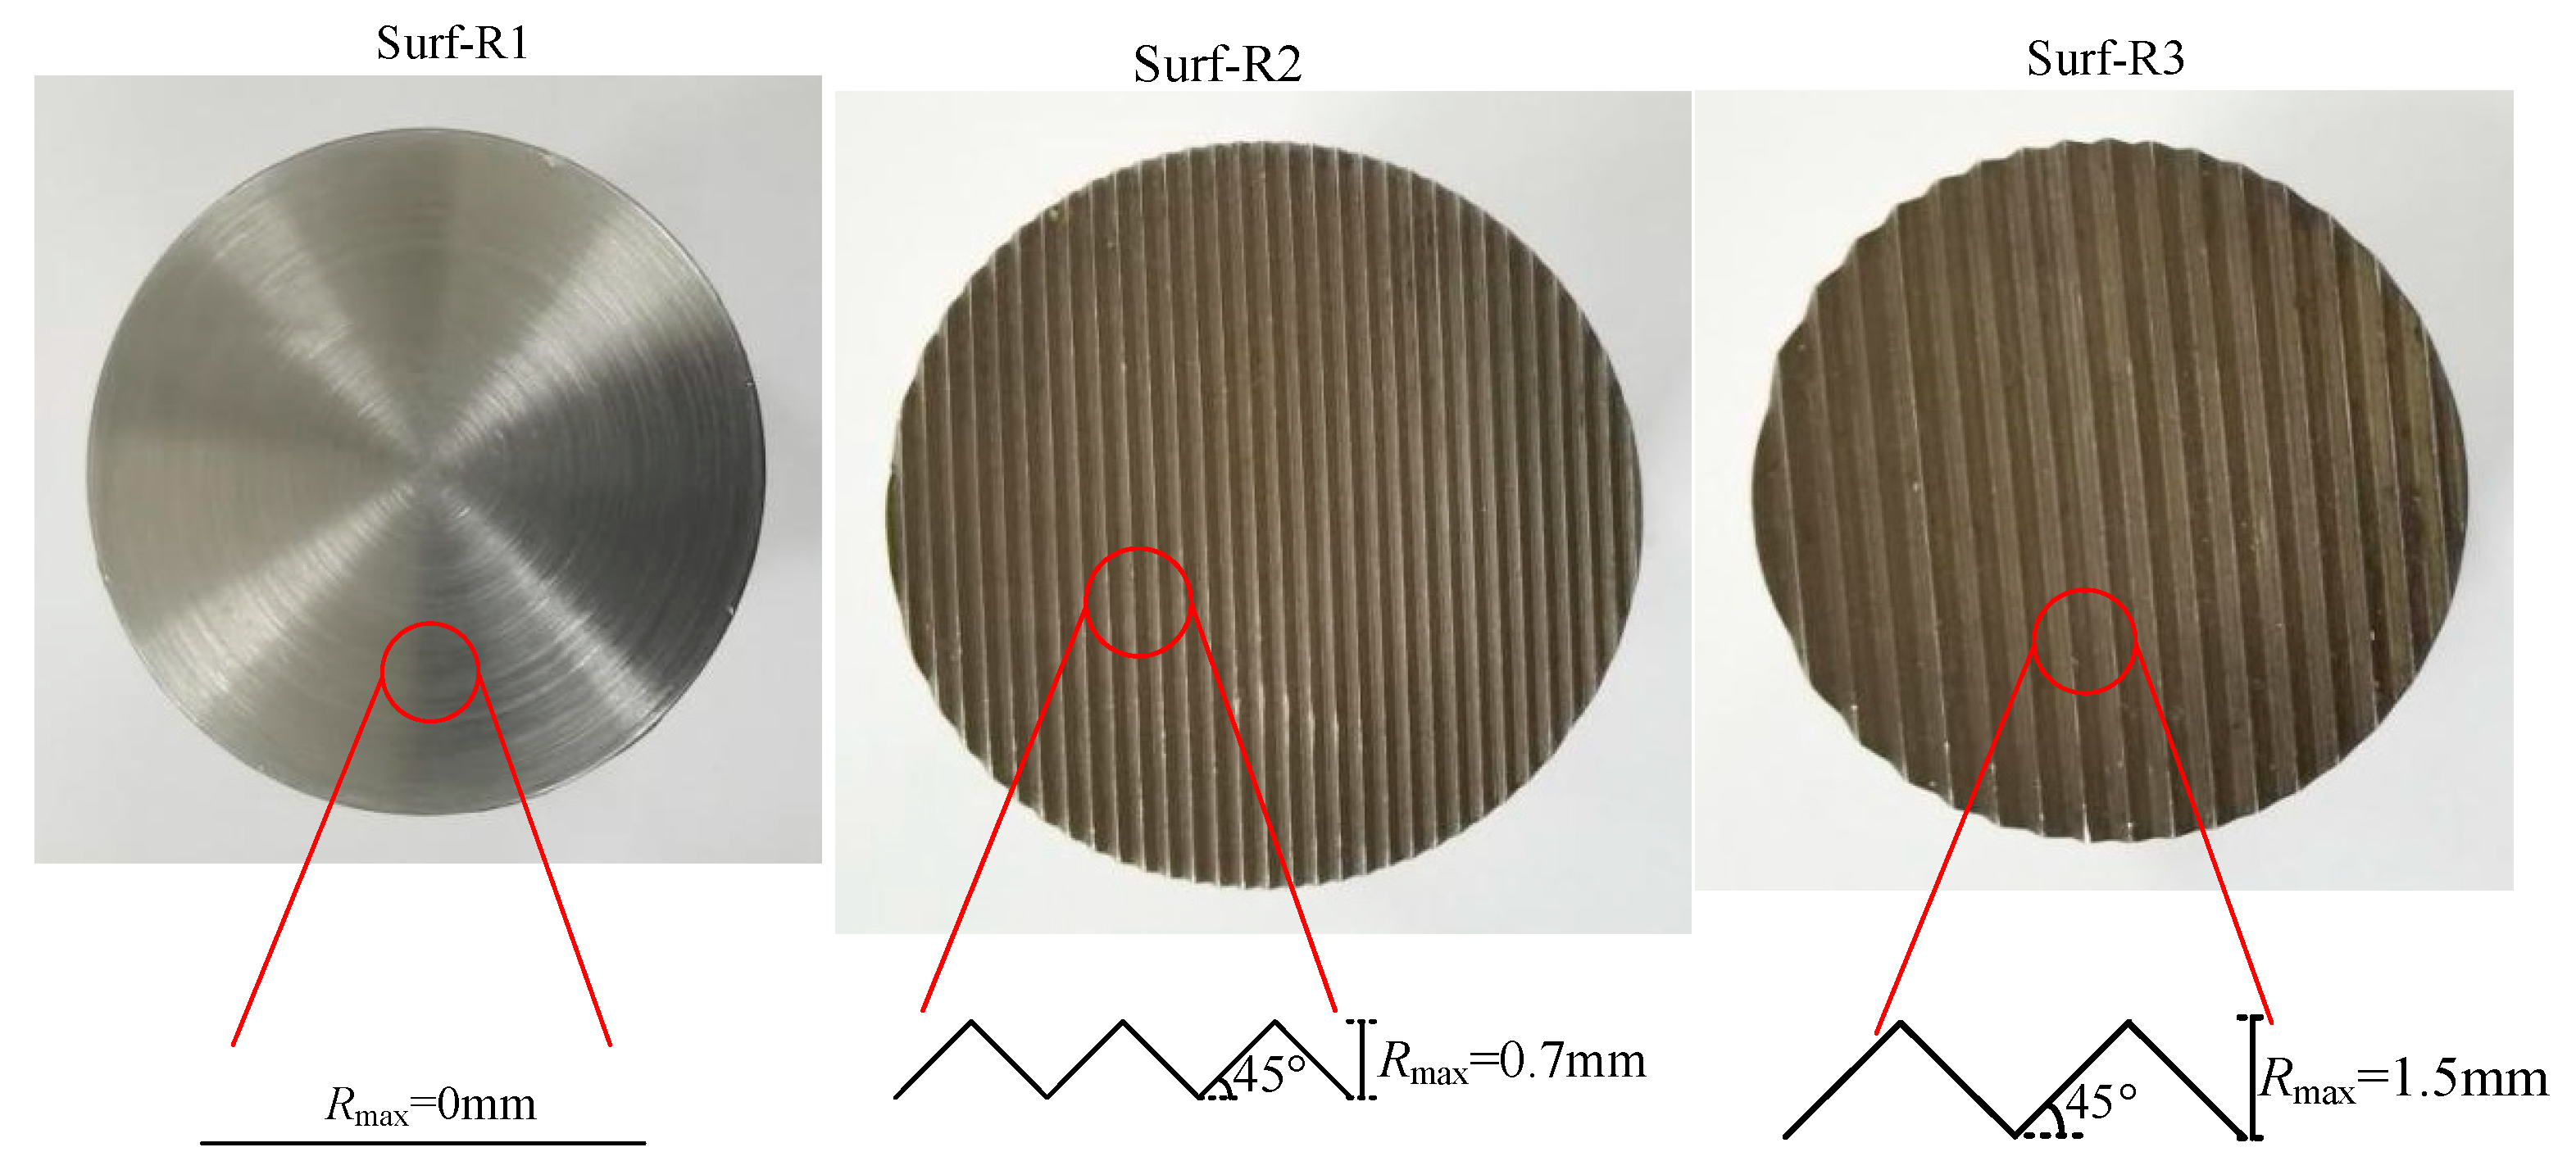
In this study, the ISO standard sand was used, characterized by high sphericity and a relatively uniform particle size distribution. Sands with different particle sizes were used for the test: sample I (2–1.18 mm), sample II (1.18–0.85 mm), and sample III (0.85–0.425 mm), as illustrated in Figure 2. The basic physical properties of the samples are summarized in Table 1. The dry maximum density, dry minimum density, and specific gravity were determined according to ASTM standards D4253-16, D4254-16, and D854-23 [22,23,24]. To comprehensively evaluate the interface shear behavior under varying roughness conditions, steel surfaces were fabricated in both smooth and rough forms, as illustrated in Figure 3. The rough surfaces were prepared with two distinct levels of roughness. Detailed specifications and fabrication procedures for these surfaces are provided in Section 2.3.

2.3. Methods

Surface roughness parameters, such as Ra, Rz, Rt and Rmax, are commonly used in industrial and scientific applications to quantify the texture and quality of surfaces [25,26,27]. A single surface roughness parameter may not fully capture the shear properties at the interface between soil particles and surrounding surfaces. To address this limitation, the normalized roughness parameter Rn, introduced by Uesugi and Kishida, accounts for both surface roughness and the corresponding particle size [28]. The normalized surface roughness Rn was defined as:
R n = R max / D 50
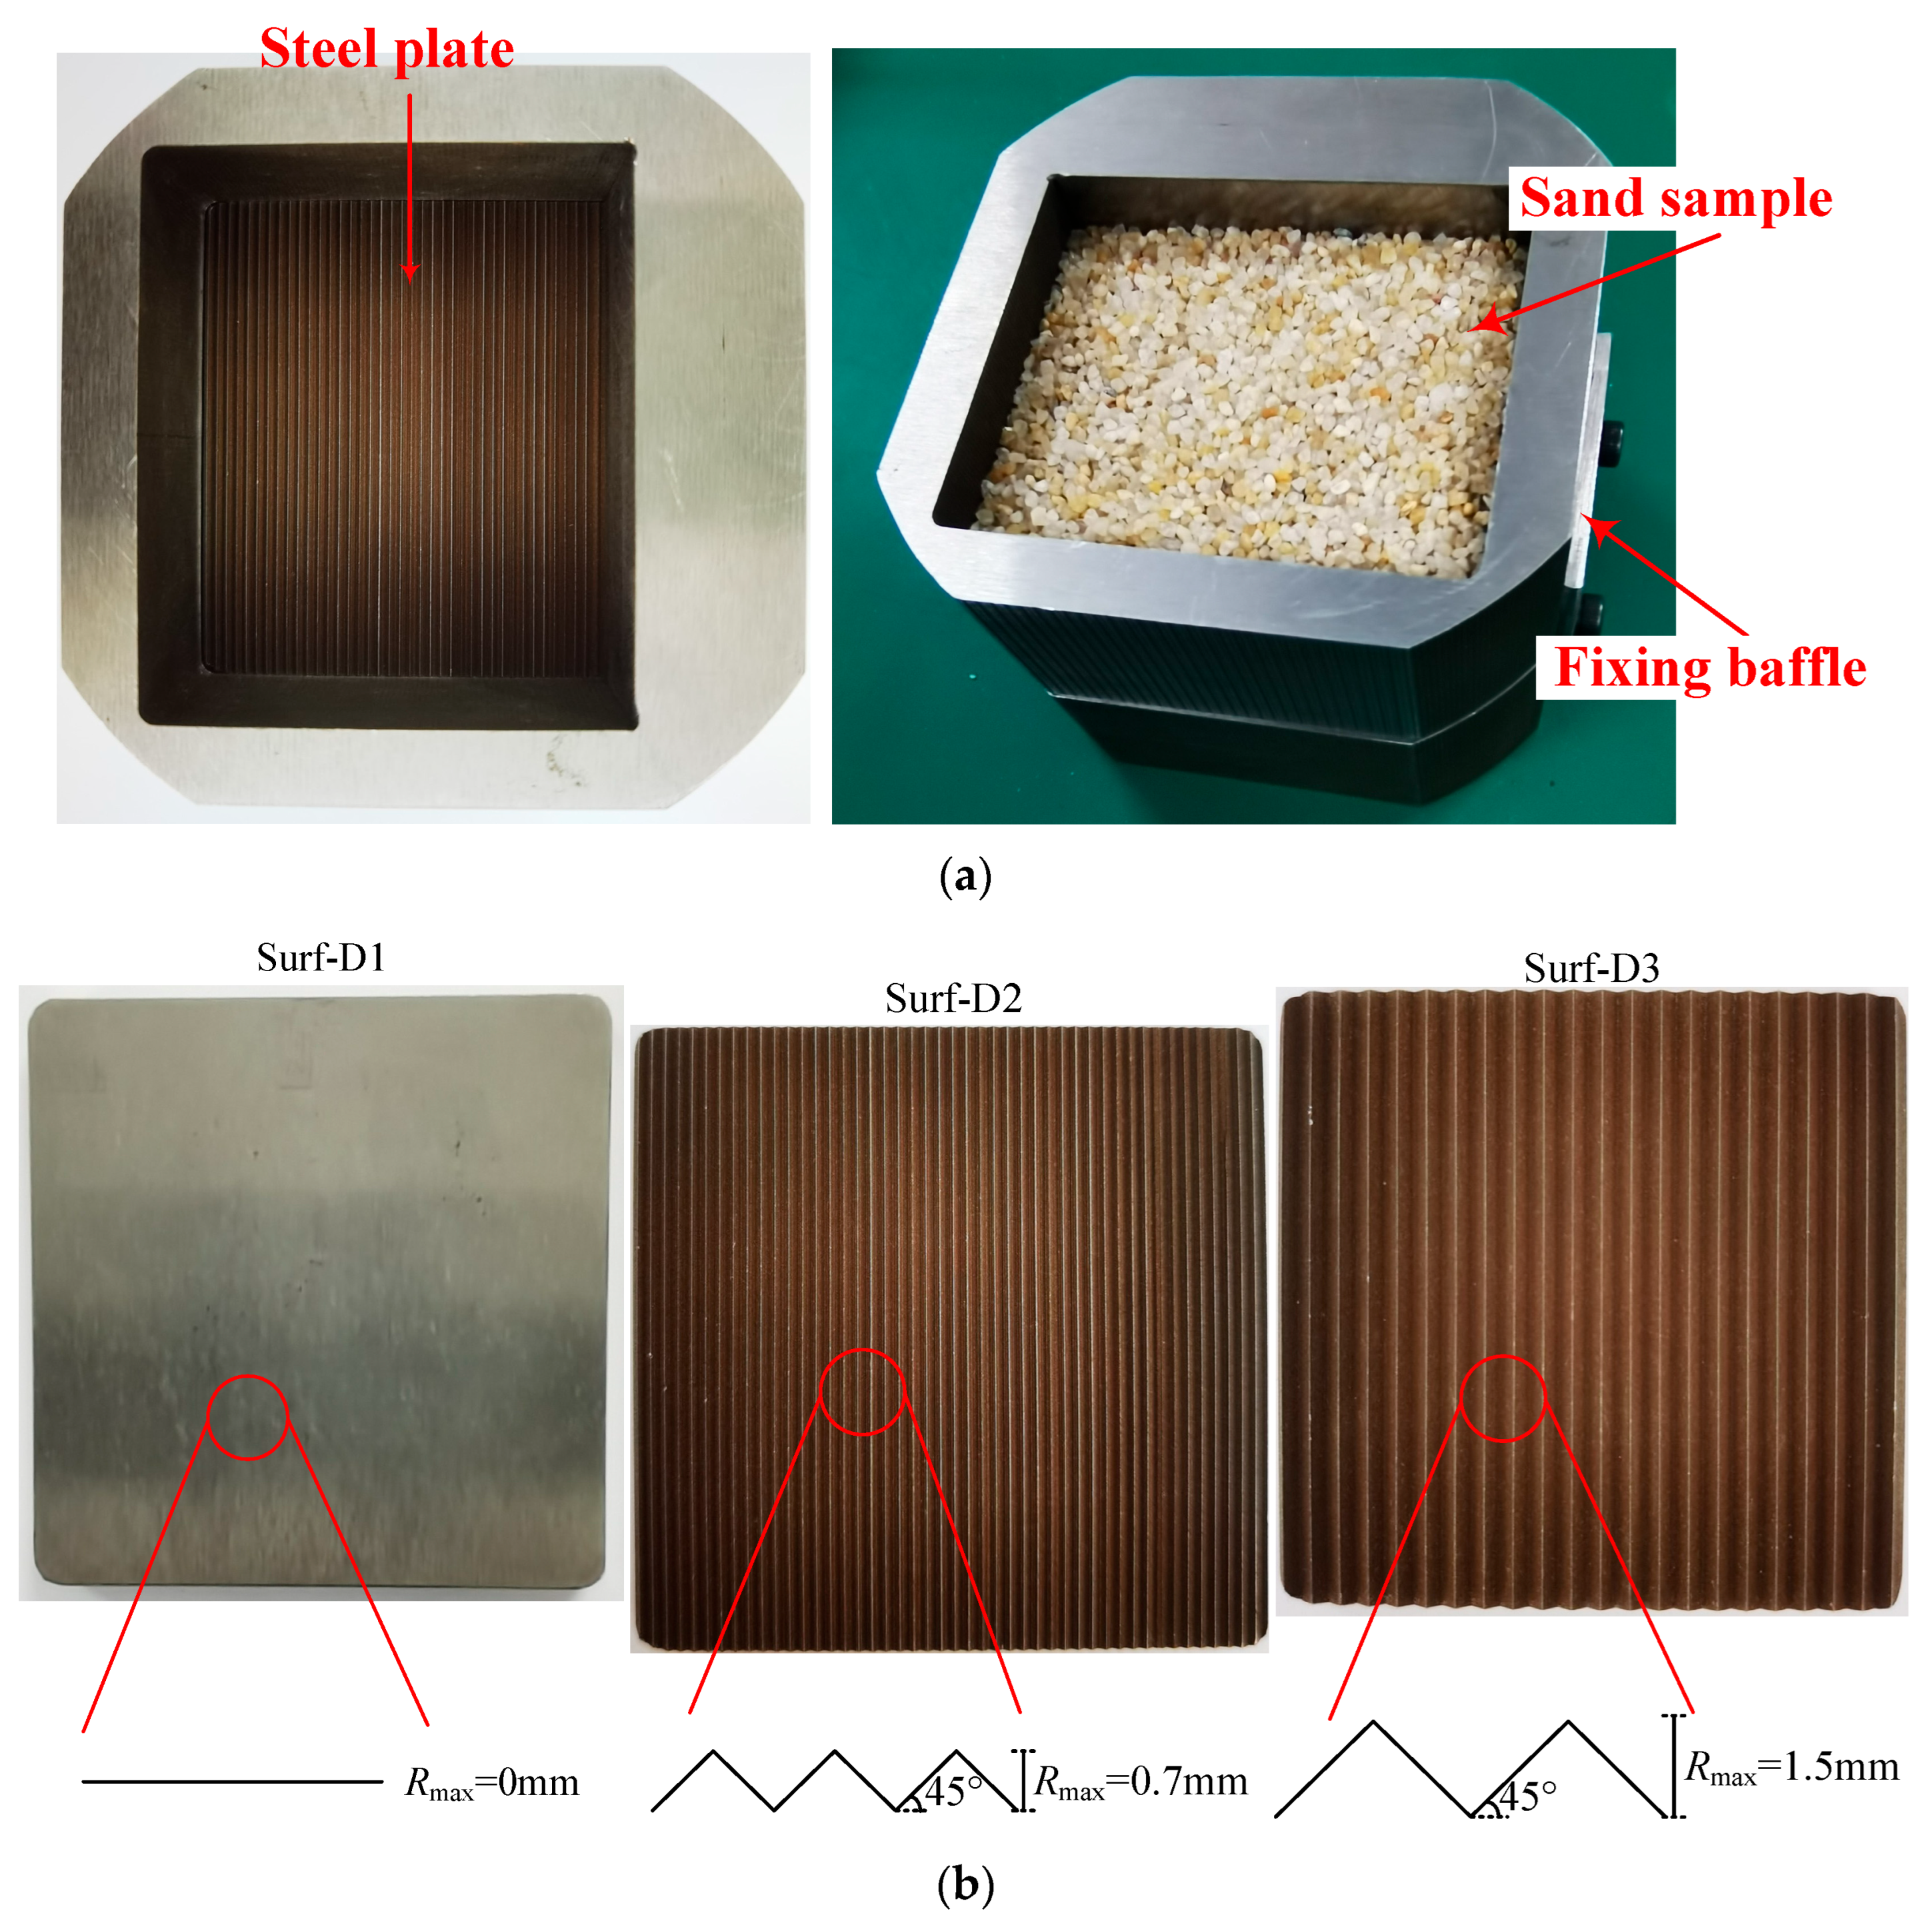
where D50 is the average grain diameter and Rmax is the maximum height vertical span between the highest peak and the lowest valley on the surface. Referring to the preparation process for achieving the relative roughness of steel plates as described by Su et al., the surfaces of the steel plates were uniformly designed with an asperity angle of 45°, as shown in Figure 3. Three steel plates numbered from Surf-R1 to Surf-R3 with different surface roughness values were adopted in this study. The variations in the widths and heights of the surface grooves are as marked for Surf-R1 to Surf-R3. In order to compare the difference in shear strength between the torsional interface shear test proposed in this study and the traditional direct interface shear test, an improved direct shear interface shear apparatus was developed, as shown in Figure 4.
As shown in Figure 4a, the upper shear box is a container for holding soil samples, and the lower shear box is embedded in the rough shear plane entity. Fixing baffles are set on both sides of the lower shear box, so that the upper shear box can move in one direction. In Figure 4b, three steel plates numbered from Surf-D1 to Surf-D3 with different surface roughness values were adopted in the interface direct shear test. Surf-R1 has the same surface roughness as Surf-D1, as do Surf-R2 and Surf-D2, and Surf-R3 and Surf-D3. Table 2 summarizes the detailed information of all plates used in the tests. Six pieces of plate for each range of the soil sample, with Rn = 0.001, 0.440, 0.686, 0.943, 1.097, 1.471 and 2.351, were used in the interface shear test. It may be noted that relatively large values of Rn were selected in this study, and the findings are expected to provide more insights into the interface behavior between the soil and a structure possessing relatively rough surfaces.

2.4. Test Process

The torsional interface shear apparatuses employed in this study maintain a consistent shear area throughout the shearing process, ensuring that the diameter of the soil sample aligns with that of the loading interface. Torsional interface tests (TIST) between sand and steel were conducted with reference to ASTM D6467 [29]. To ensure the dry sand samples reached the required dry density during sample preparation, a rubber mallet was used to compact the samples to a preset volume. The dry sand was placed into the sample container in three layers. Axial loads were applied to the steel loading caps with different roughness levels and transferred to the dry sand samples. The normal stresses were set at three levels used in geotechnical testing: 100, 200, and 300 kPa. The shear loading rate was 3.428°/min until the torsional angle reached 100°. The sample container was placed in the recess of the base on the shear apparatus platform. The base rotates under the torque generated by the motor, causing both the sample container and the base to rotate synchronously. This movement facilitates rotational shearing of the soil sample at the structure’s interface. The shear stress at the interface, induced by the torque, is balanced by the shear strength developed within the interface sample. The shear stress τ at the steel–sand interface is calculated using the following formula [30,31]:
τ = M / 0 R 2 π r 2 d r = 3 M / 2 π R 3
where M is the torque of interface sample and R is the radius of the loading cap. To demonstrate the accuracy of testing the sand–steel interface in torsional shear, direct interface shear tests (DIST) were conducted using the same sand–steel interface. The loading rate for the direct shear tests was 0.5 mm/min, and the normal stresses were consistent at 100 kPa, 200 kPa, and 300 kPa.

3. Results and Discussion

3.1. Comparison of Shear Behavior

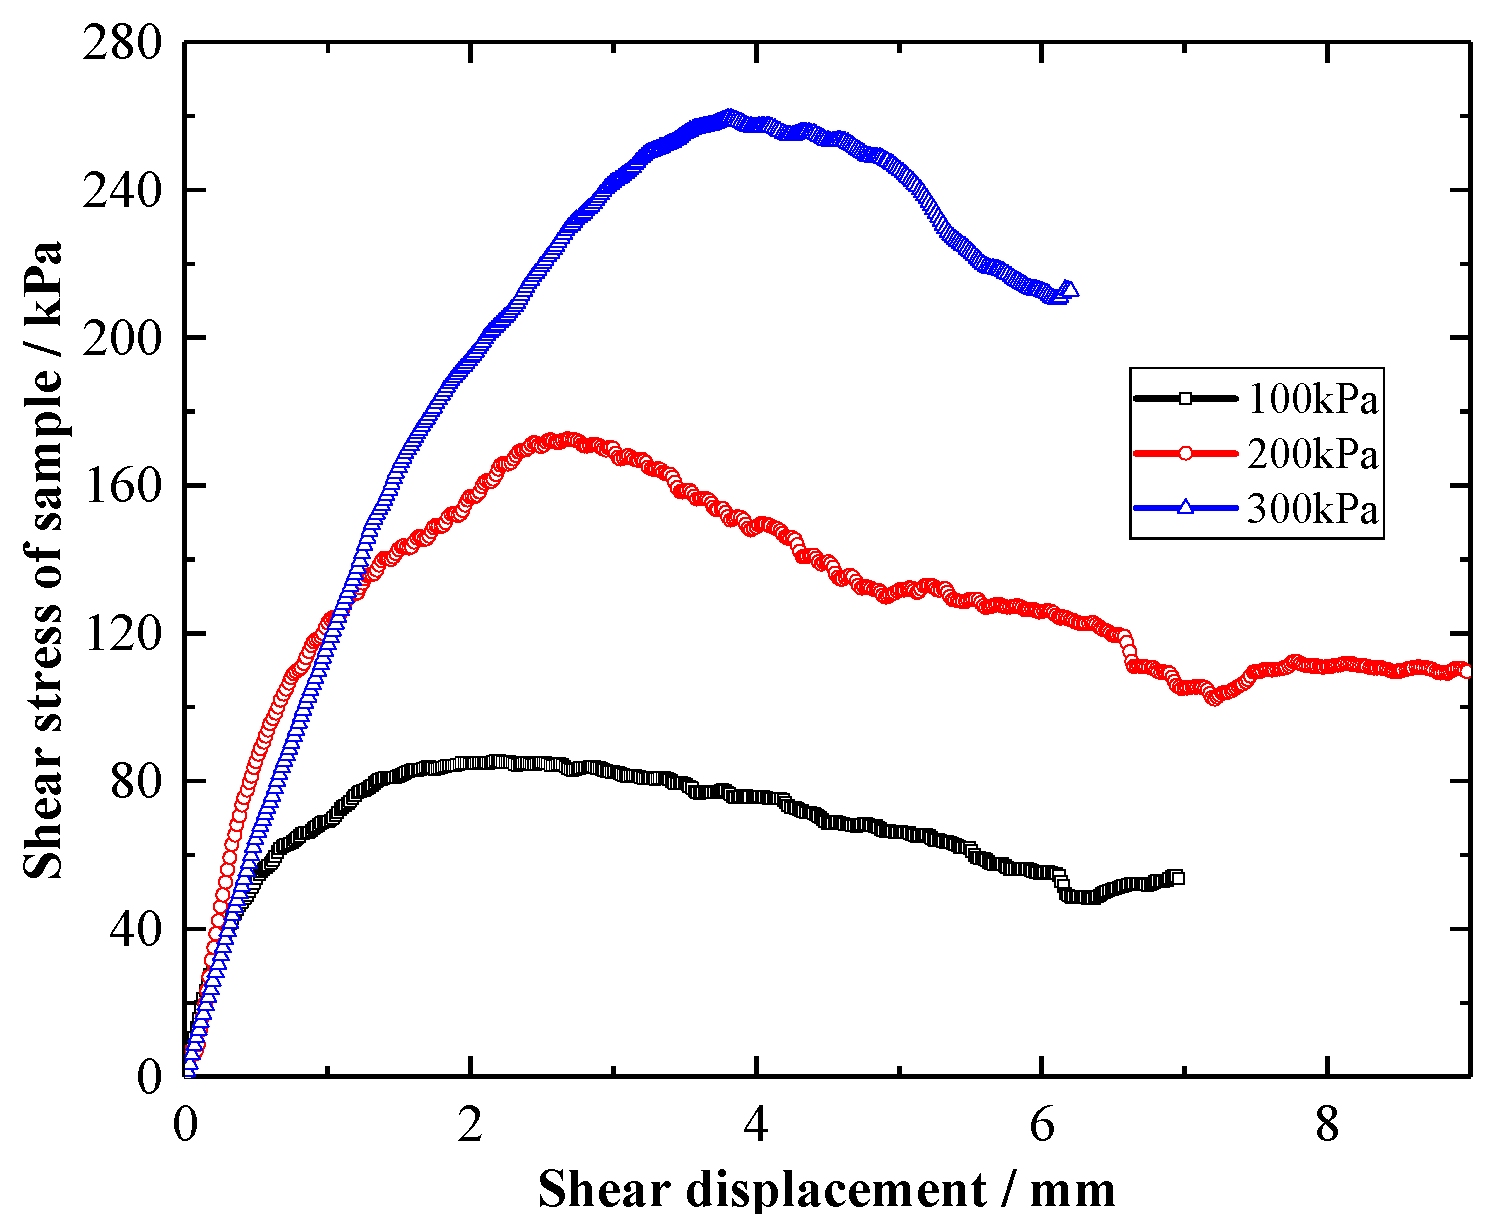
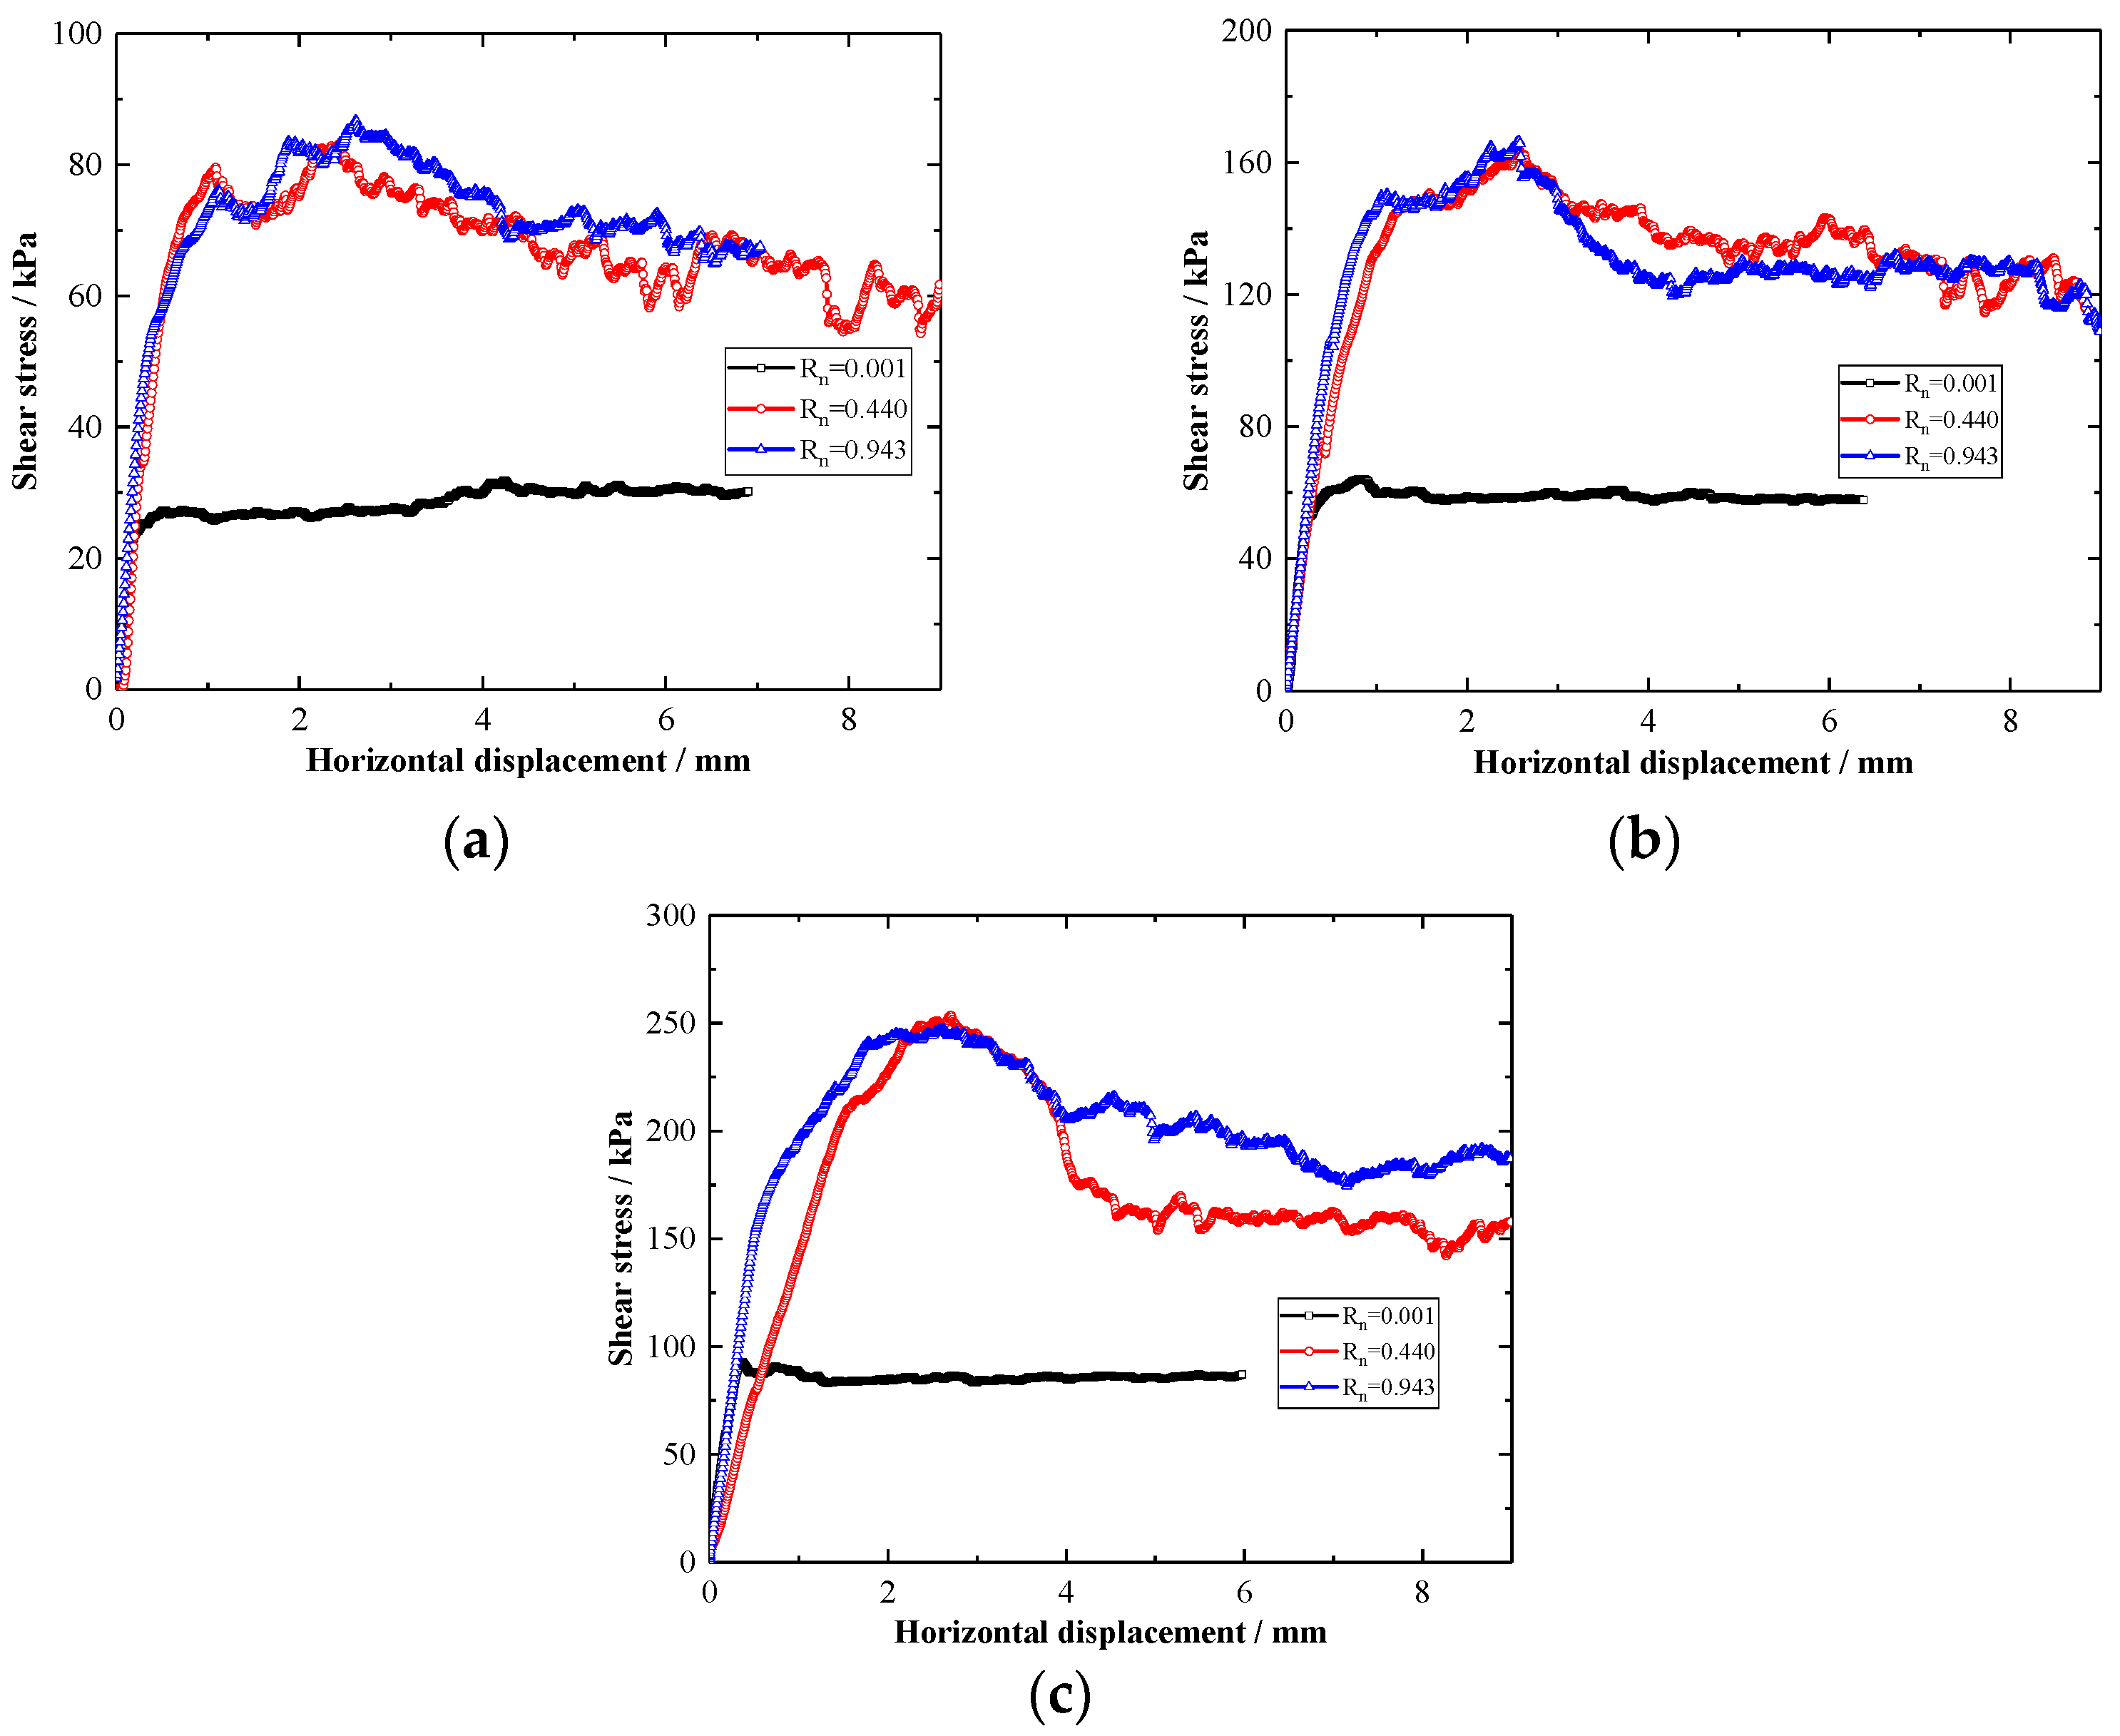
Figure 5 presents the shear angle–shear stress curves for sand sample I (D50 = 1.509 mm) under three levels of normal stress and different relative roughness (Rn). For comparison, the stress–deformation curves from the direct shear experiments on pure sand under the same conditions are shown in Figure 6. For the smooth interface, the shear stress initially increases with the shear angle until it reaches a maximum value, before gradually stabilizing. For rough interfaces, the shear stress increases with the shear angle, reaches a maximum value, then gradually decreases and fluctuates within a specific range. Under identical normal stress conditions, both the interface peak stress and residual stress remain largely consistent at relative roughness values of 0.44 and 0.943. The peak stress is typically reached within a rotation angle of approximately 10 degrees. This experimental phenomenon has also been observed in direct interface shear tests [32,33,34]. When the relative roughness increases from 0.440 to 0.943, the peak shear stress remains basically unchanged as surface roughness increases. This difference likely stems from the varying shear mechanisms at the interface. The contact between sand particles and structural surfaces is often point or line contact, with soil particles being more likely to slide on smooth surfaces. In contrast, for rough interfaces, shear strength results from a combination of sliding friction and particle interlocking [35]. As a result, the difference in the shear test of the interface specimens does not change the failure mode of sand particles on smooth and rough surfaces, which evolves with the increase in the interface roughness.
Figure 7 shows shear stress versus displacement plots for the direct interface shear tests performed with Sample Ⅰ. Different relative roughness interfaces under the same normal stress are considered. Under different normal stresses, the shear displacement required to reach the peak state and form the critical interface shear stress is basically the same. For sample I, the average particle size is the same as that of FS Ohio 10–16 (D50 = 1.59 mm) reported in the literature [16]. When the normal stress is 200 kPa, the displacement values of the two sands at the peak and critical states are relatively consistent, with the range for reaching peak stress between 2 and 3 mm. Comparing Figure 5 and Figure 7, it can be observed that the trends in shear stress and shear displacement at the steel–sand interface remain unchanged regardless of the shear direction applied at the interface. At both smooth and rough interfaces, for the same normal stress, the peak shear stress at the direct interface shear is greater than that at the torsional interface shear, thereby influencing the peak shear strength of the interface.
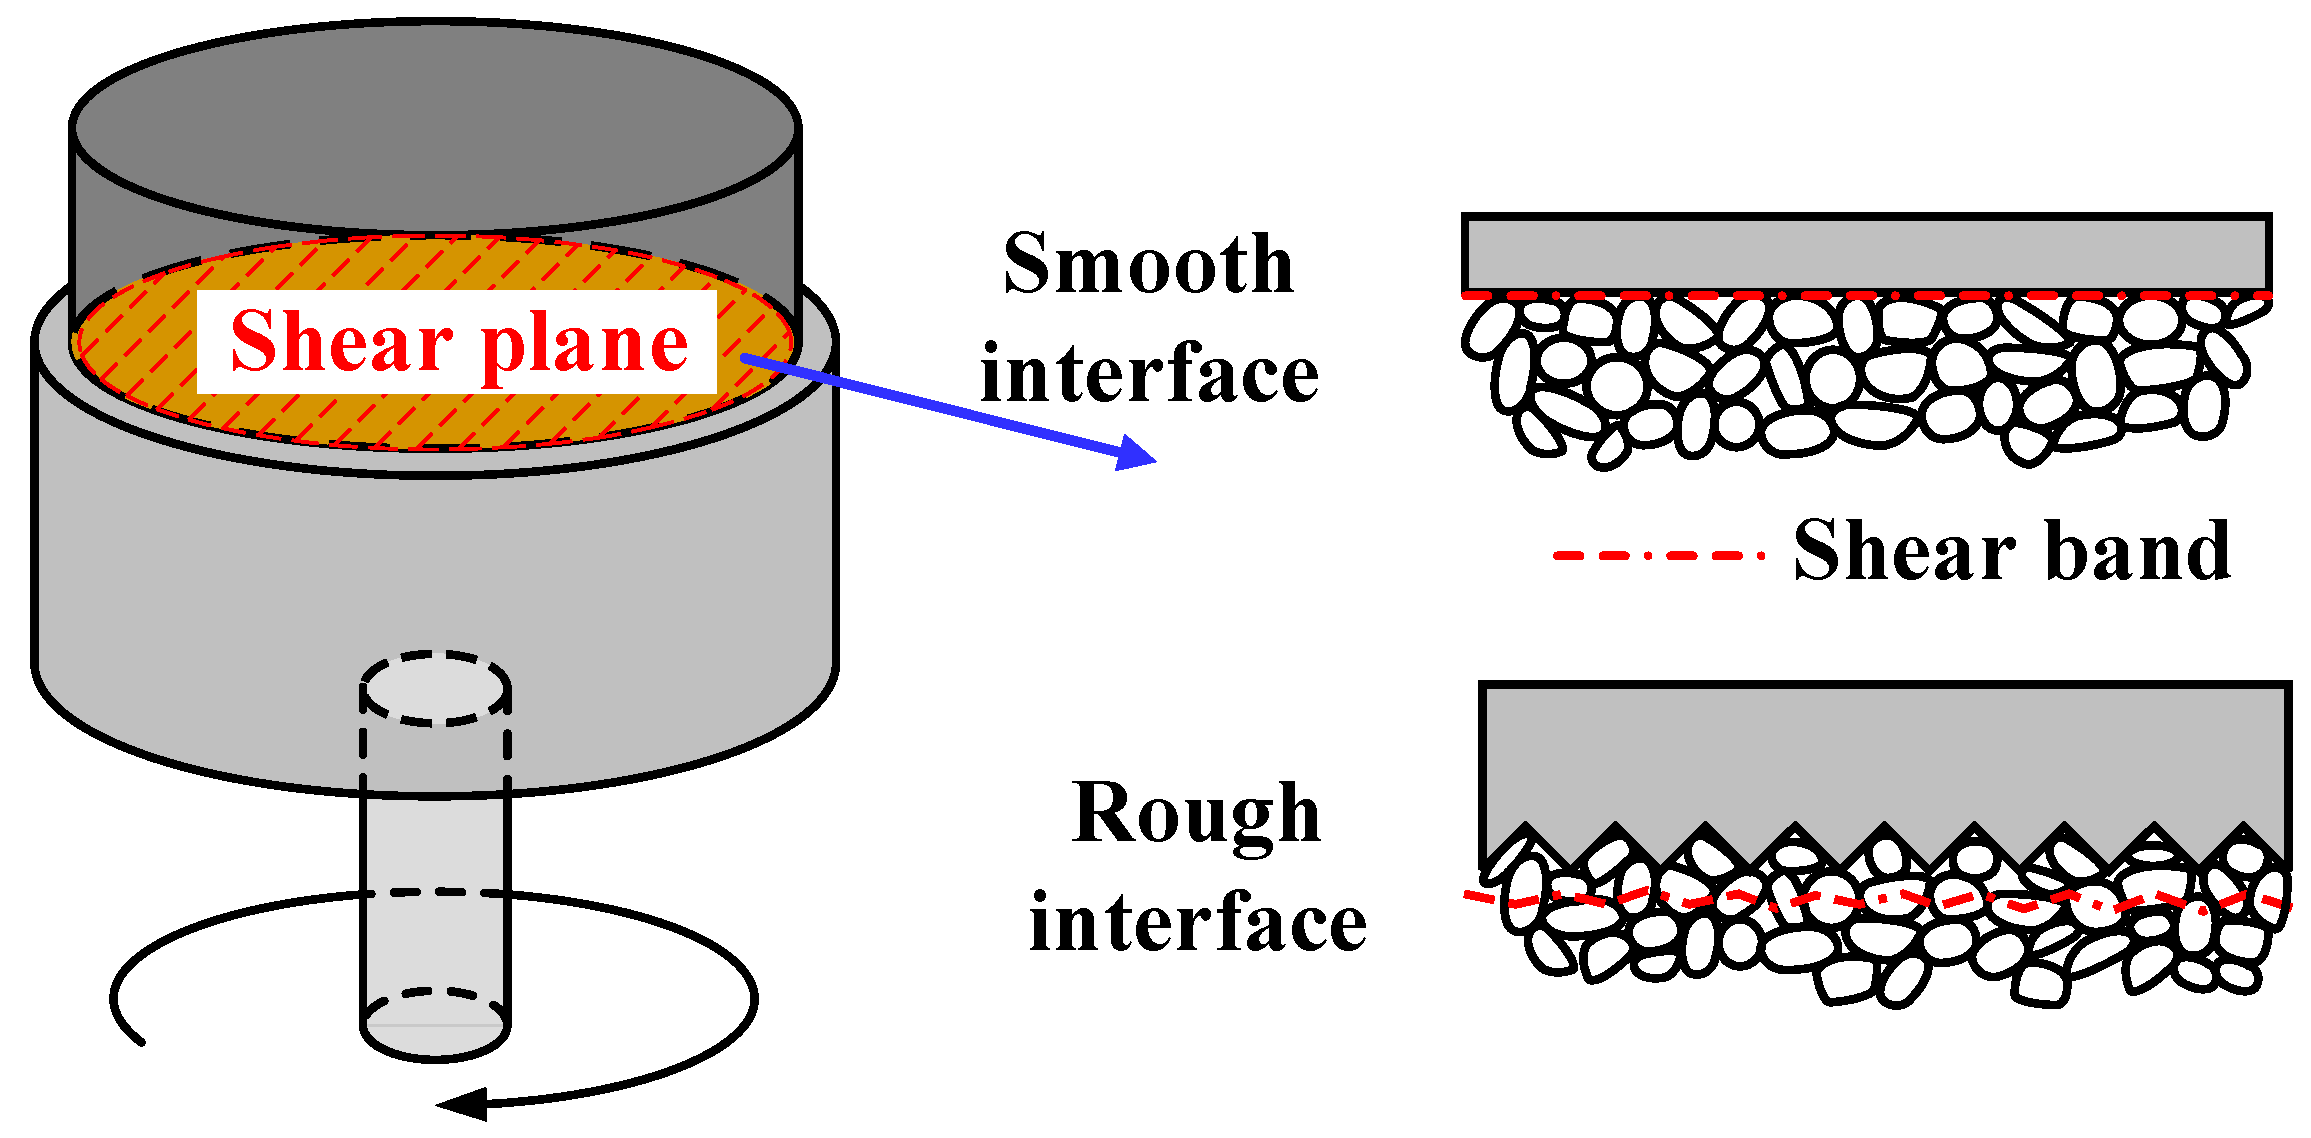
Strain localization is the reason for the difference in shear failure planes between smooth and rough interfaces, as shown in Figure 8. The shear failure surface is located at the smooth interface of the structural surface, meaning that the contact surface and the shear surface lie in the same plane. When the relative roughness (Rn) ranges from 0 to the critical value (Rcr), a localized shear zone forms within a certain distance from the contact surface, with the shear failure plane appearing within the soil sample. In these cases, the interface shear stress closely approximates that of pure sand. As Rn increases, the interface shear resistance also increases, leading to higher interface shear strength. However, when Rn values exceed Rcr, the rough steel surface exhibits larger sawtooth spacing. This allows the soil particle skeleton to fill the rough surface and become confined within it. The confined particles reduce the effective roughness of the surface during shearing. As a result, the shear failure plane location resembles that observed when Rn equals Rcr. For Rn values greater than Rcr, the interface shear strength may slightly decrease, rather than increase.
The deformation of the sand skeleton can be classified into expansion and contraction during the torsional shear process, a characteristic that is crucial for stability analysis and must be accurately described [36]. Figure 9a illustrates the volumetric change in a smooth interface under varying normal stresses. Positive vertical displacement denotes sand dilation, while negative displacement indicates compression. As normal stress increases, the amount of compression during shearing also increases. This is likely due to greater adjustments in the sand particle skeleton, with particles filling the gaps in the interface roughness. Figure 9b–d depict the volumetric changes in sand under constant normal stress but varying relative roughness. As the interface roughness increases from 0.001 to 0.943, the volume change in the sand shifts from contraction to significant dilation. At a relative roughness of 0.001, the vertical displacement increases gradually, indicating that the sand undergoes compression with a reduced pore volume during torsional shear tests on a smooth interface. For rough interfaces, the deformation of the sand skeleton transitions from shear contraction to shear dilation. Comparing Figure 9b–d, it is evident that normal stress primarily affects the magnitude of vertical dilation during shear. As the interface relative roughness (Rn) increases from 0.001 to 0.440, the dilation magnitude increases. Meanwhile, it stabilizes or slightly decreases when roughness reaches Rn = 0.943. This pattern is closely related to the progression of sand particle adjustments, such as sliding, rotation, and movement. Notably, during the interface shear process, sand particles may undergo these adjustments simultaneously. Interface roughness significantly impacts the adjustment of sand particles, with wider and deeper serrations providing greater space for particle rotation and movement. When the dimensions of serrations exceed the sand particle’s D50, sand particles fill and become constrained within the rough surface. This reduces the number of particles involved in shear, thereby diminishing the effect of the serrations on dilation. Previous studies have shown that, for Yongding River sand, composed of sub-angular coarse quartz particles, the maximum vertical displacement at Rn = 0.5 exceeds that at Rn = 0.01, 0.05, 0.1, and 0.2 [14]. Similarly, interface shear tests on South China Sea calcareous sand revealed that the maximum soil deformation at Rn = 0.67 is greater than at Rn= 0.083, 0.33, and 0.89 [37]. These findings, combined with the experimental results of this study, suggest that the dilation phenomenon in interface shear is influenced not only by relative roughness but also by factors such as particle shape and size distribution.
It is noteworthy that the peak shear stress of the interface shear samples is only one-third of that observed in the rough interface test. For a smooth interface specimen with a height of 20 mm, the deformation is less than 0.06 mm, and the strain is under 0.003, which is negligible. The peak shear stress is primarily attributed to the friction between the soil skeleton and the steel surface, with the frictional force determined by the stress state and the friction coefficient. The sliding of the soil skeleton on the smooth surface constitutes sliding friction, where the coefficient of friction remains constant. Consequently, the shear strength of the interface sample on the smooth surface is directly proportional to the applied normal stress. Once peak shear stress is attained, sand particles merely slide over the surface, as dilation at the interface does not occur. In contrast to tests with varying relative roughness values, the smooth interface shear test reaches peak shear stress the earliest.

3.2. Effect of Relative Roughness Rn

The interface shear test followed principles similar to those in conventional geotechnical shear tests. It can be represented by the Mohr–Coulomb failure criterion to delineate the shear strength between the sand sample and the structure. The equation is given by:
τ f = c + σ tan δ
where τf is the interface peak shear strength, σ is the normal stress applied to the interface sample, δ is the interface friction angle, and c is the interface cohesion. The cohesion of sand is influenced by the intrinsic forces between particles, which are typically weak and often negligible, particularly under dry conditions. Similarly, the cohesion between dry sand and steel depends on the interaction between particles and steel surface, which also tends to be minimal. Therefore, the cohesion values derived from the failure criterion may reflect the sliding or rotation of soil particles at the interface under low normal stress.
Shoushtari et al. [38] studied the interface strength between geosynthetics and sand and proposed a shear strength criterion in which only the internal friction angle is considered relevant. The equation is expressed as follows:
δ = tan 1 τ f / σ
In this context, the nonlinear response of the sand–steel interface can be described using the variable interface friction angle δ.
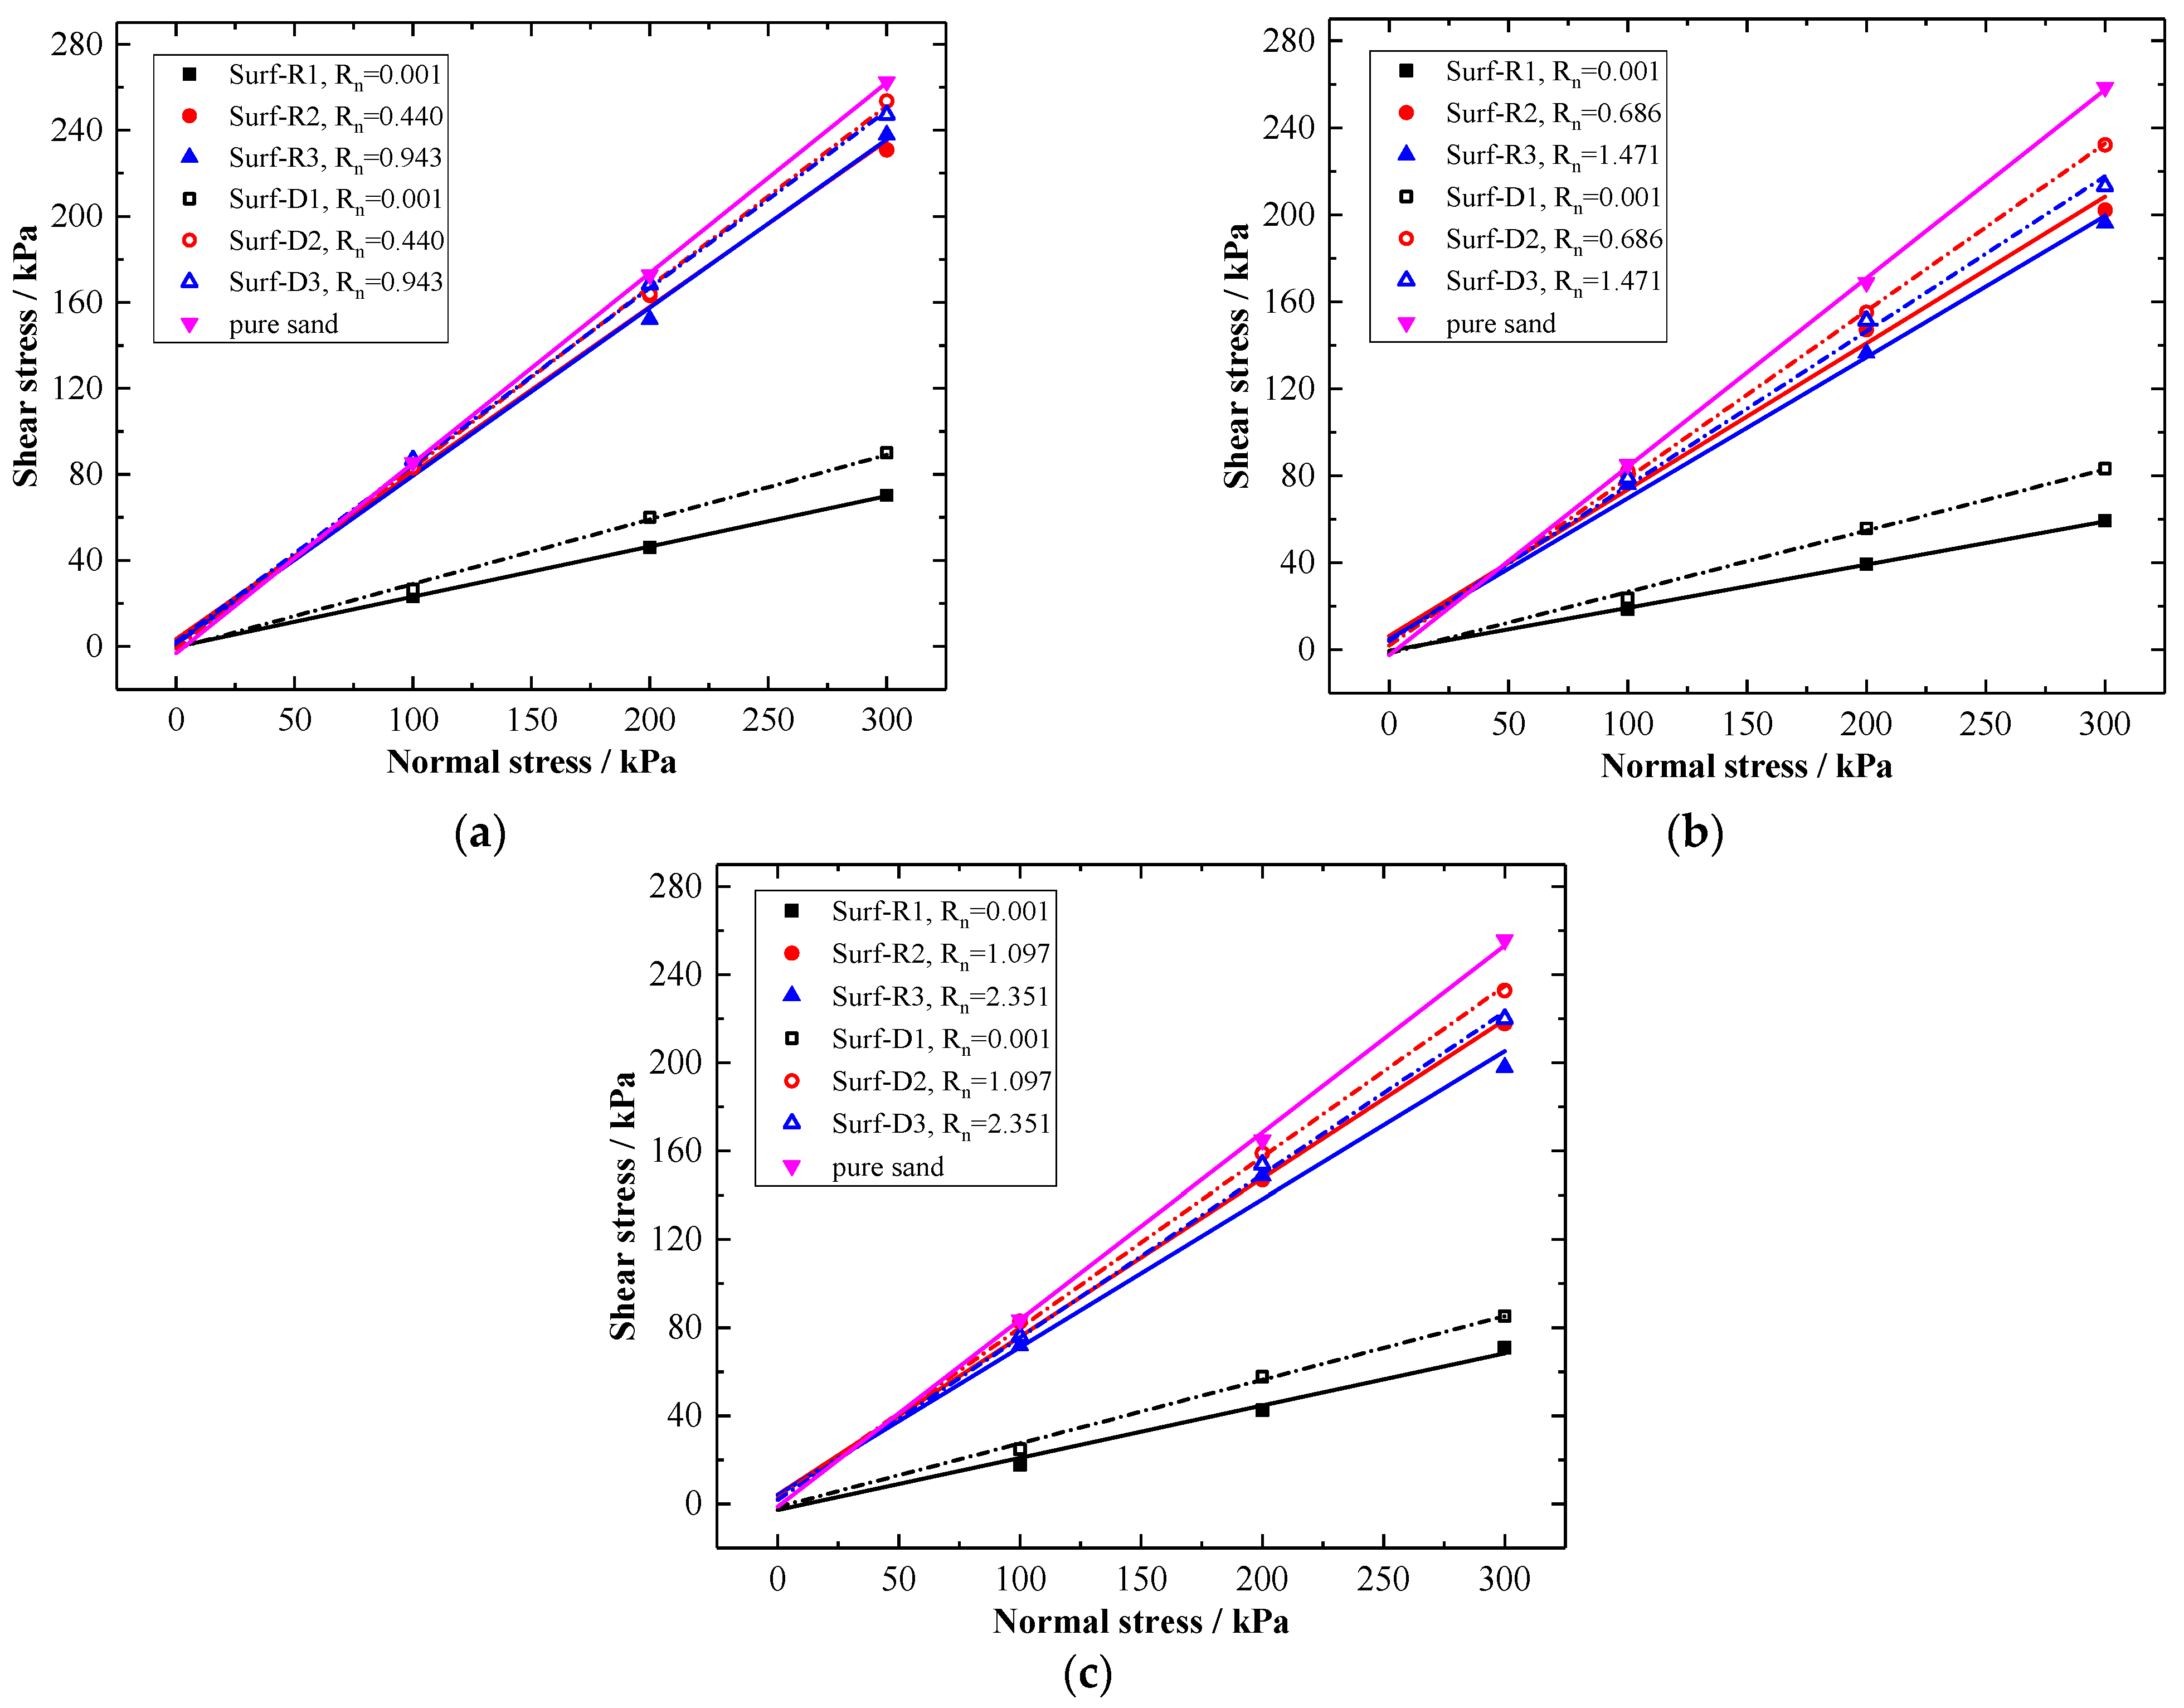
To quantitatively evaluate the effect of interface roughness, the peak shear stress under three normal stress conditions is shown in Figure 10. The findings reveal that the peak shear stress at the sand–rough steel interface significantly exceeds that observed at the sand–smooth surface. Specifically, the shear strength on rough steel interfaces (with Rn values of 0.440, 0.686, 0.943, 1.097, 1.471, and 2.351) is approximately four times greater than that on smooth steel interfaces (Rn = 0.001), due to the distinct soil–steel contact modes between the two interface types [39,40]. Additionally, the peak shear stress observed in direct shear tests on pure sand is higher than observed in interface shear tests. In direct interface shear tests, the peak interface strength is consistent with that observed in torsion tests under the same normal stress and relative interface roughness. As the normal stress increases, the direct shear stress becomes greater in magnitude compared to the torsion stress. At a normal stress of 300 kPa, the shear stress at which the smooth interface strength increases is approximately 20 kPa, a value that is essentially the same for the rough interface.
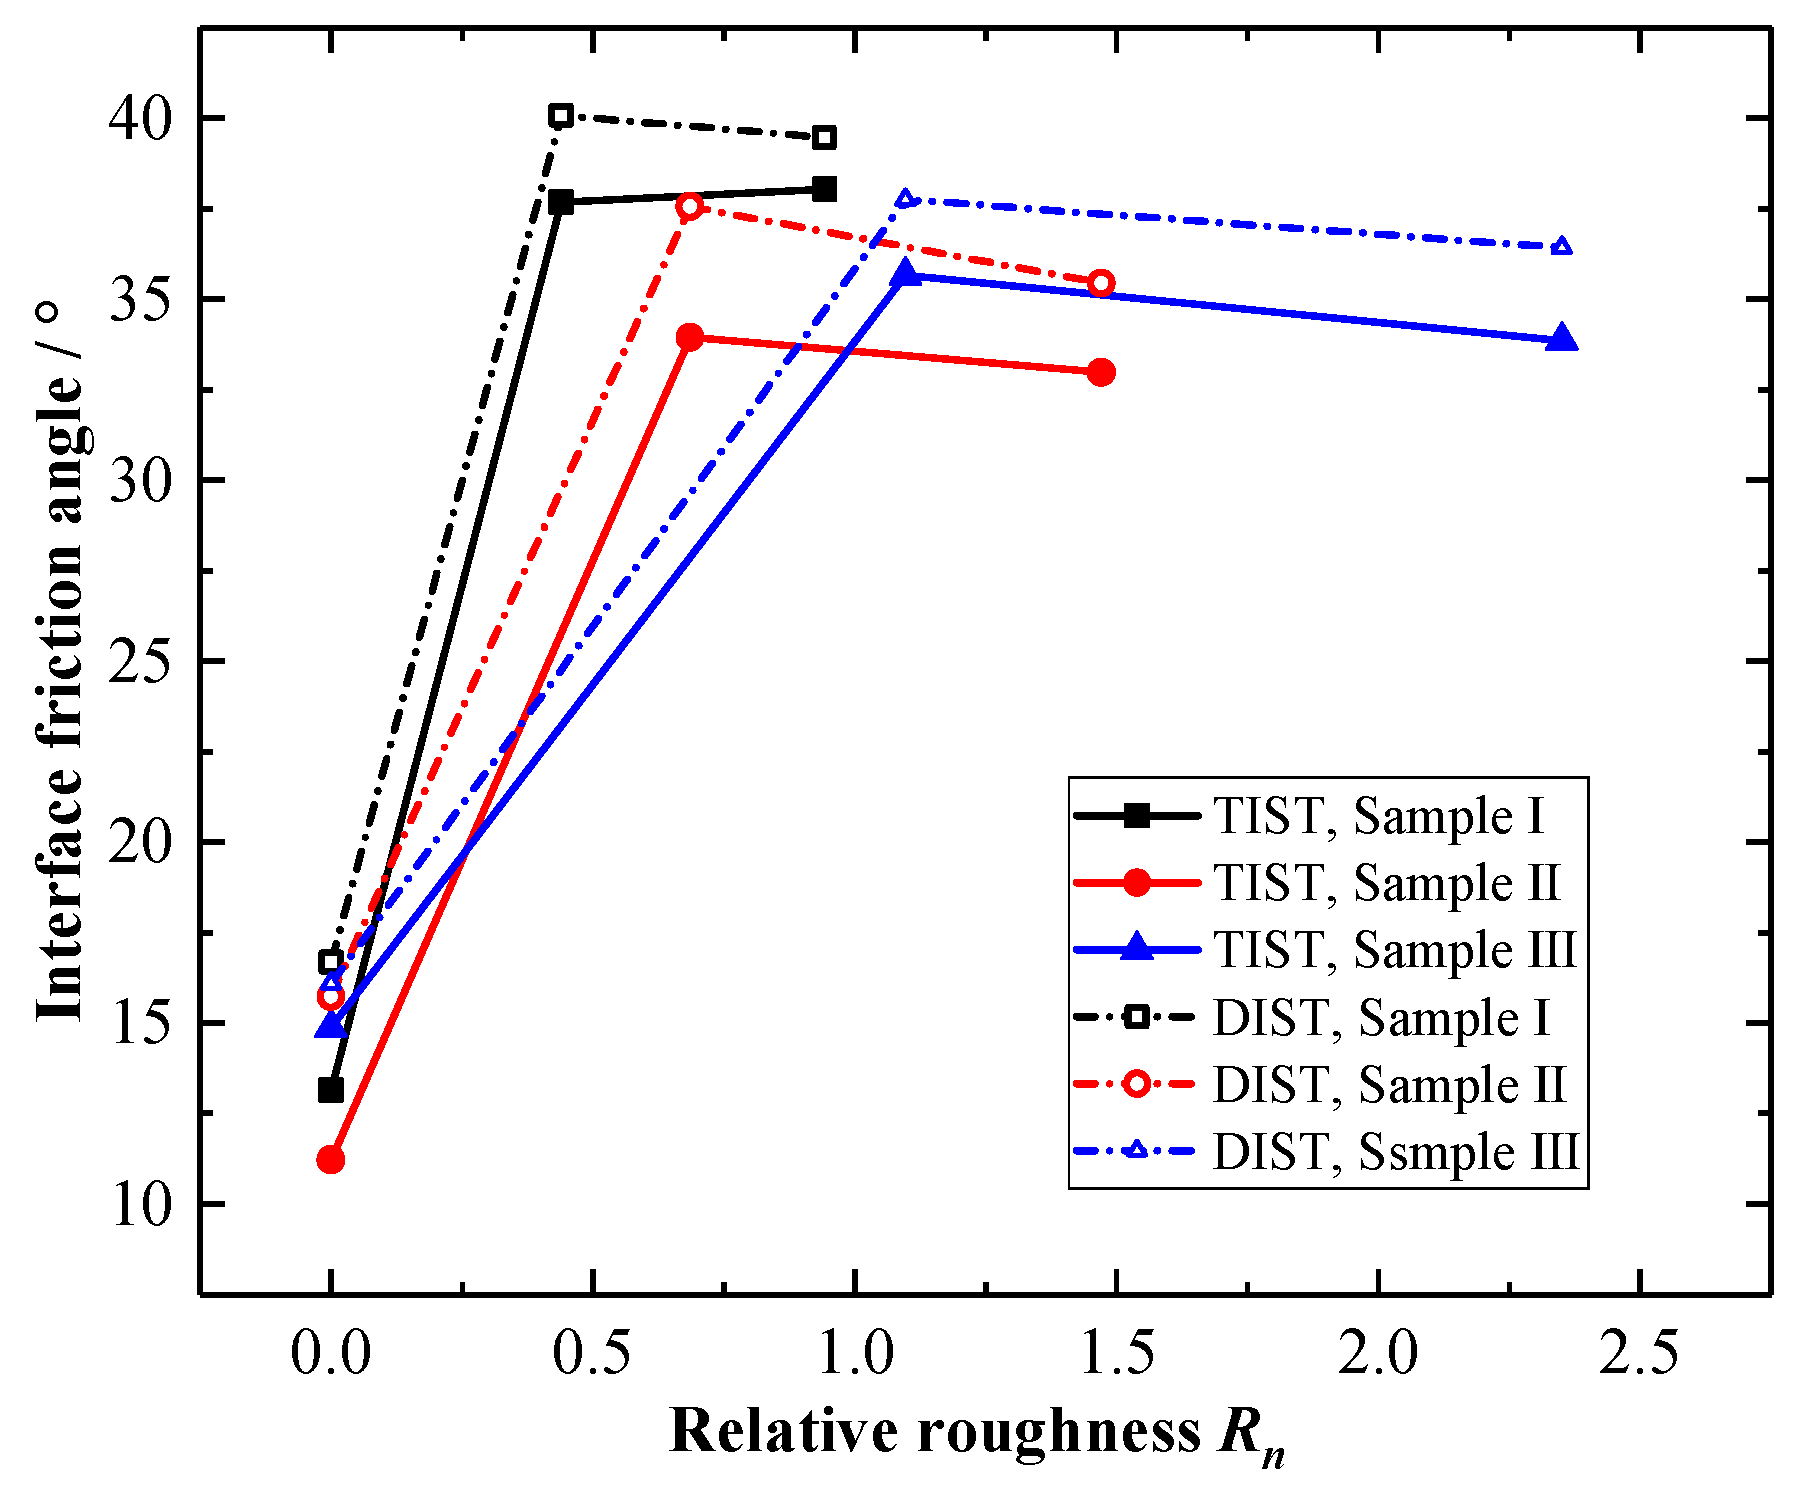
Figure 11 illustrates the variation in the interface friction angle across different levels of relative roughness. Consistently with the pattern observed in Figure 11, the relationship between the friction angle (δ) and normalized roughness (Rn) for specimens I, II, and III follows a similar trend. As Rn increases, δ similarly increases, but it decreases when Rn exceeds 1. On a smooth surface, the shear force corresponds to the frictional force between the soil sample and the steel plane. For example, in specimen II, the δ value on the smooth surface is relatively low, approximately 11.2°. However, when the soil is sheared on a rough interface at Rn = 0.686, δ gradually rises to around 33.9° and then decreases to about 32.9° when Rn reaches 1.471. Therefore, it can be observed that, with the increase in Rn, δ sharply increases and then stabilizes at a nearly constant value beyond a critical relative roughness value Rcr. That is, when Rn exceeds Rcr, δ no longer increases. The existence of critical relative roughness is also evident from the results of the direct shear interface tests. Compared to the torsional interface friction angle, the direct shear interface friction angle is approximately 6% higher.
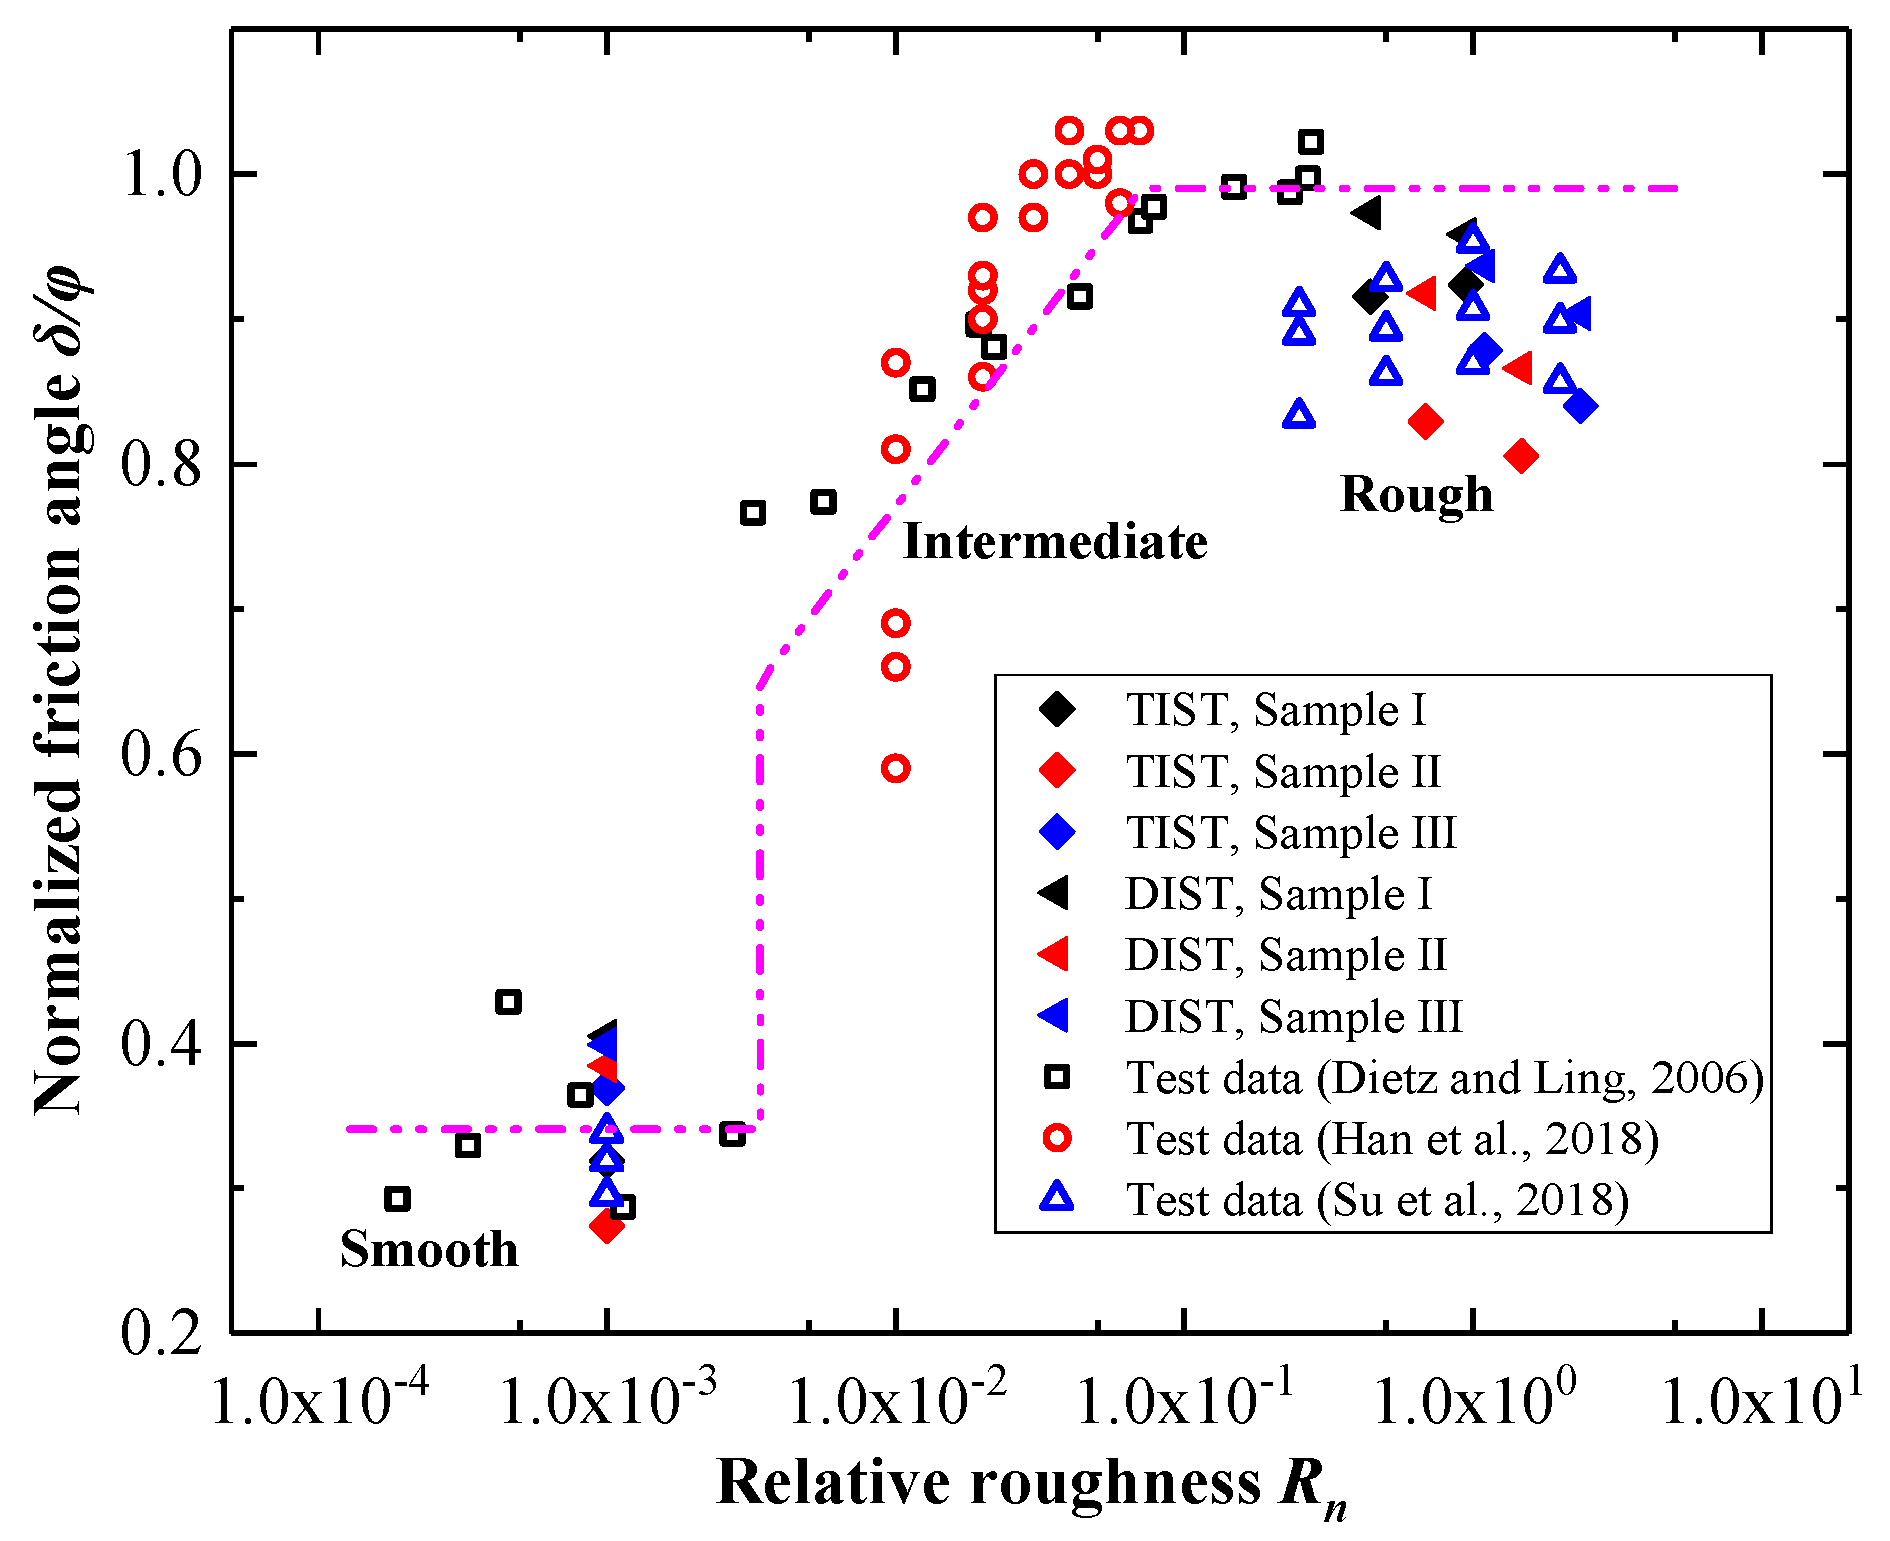
As shown in Figure 12, this study adopts the definition of the normalized friction angle proposed to investigate the influence of relative roughness. The normalized friction angle is defined as the ratio of the interface friction angle (δ) to the internal friction angle (φ) of pure sand. By comparing the normalized friction angles obtained from two interface tests conducted on the same sand, we observed that the direct shear interface exhibited significantly higher shear compared to the torsional interface. When the experimental results from the literature were combined with the trend line, it was found that the trend could be divided into three distinct stages: smooth interface, intermediate interface, and rough interface [16,32,41]. The relative roughness of the intermediate interface ranges from greater than 0.003 to less than 0.1, with values less than 0.003 classified as smooth interfaces and values greater than 0.1 classified as rough interfaces. It is evident that the normalized friction angles (δ/φ) obtained in this study are nearly identical to the results from all direct interface shear tests. Specifically, for smooth interfaces with Rn less than 0.003, δ/φ ranges from 0.27 to 0.36, and, for rough interfaces with Rn greater than 0.1, δ/φ ranges from 0.81 to 0.92. This suggests that, under both smooth and rough interface conditions, the torsional shear and direct shear methods have minimal effect on the friction between the sand and steel interface.

3.3. Effect of Mean Particle Size

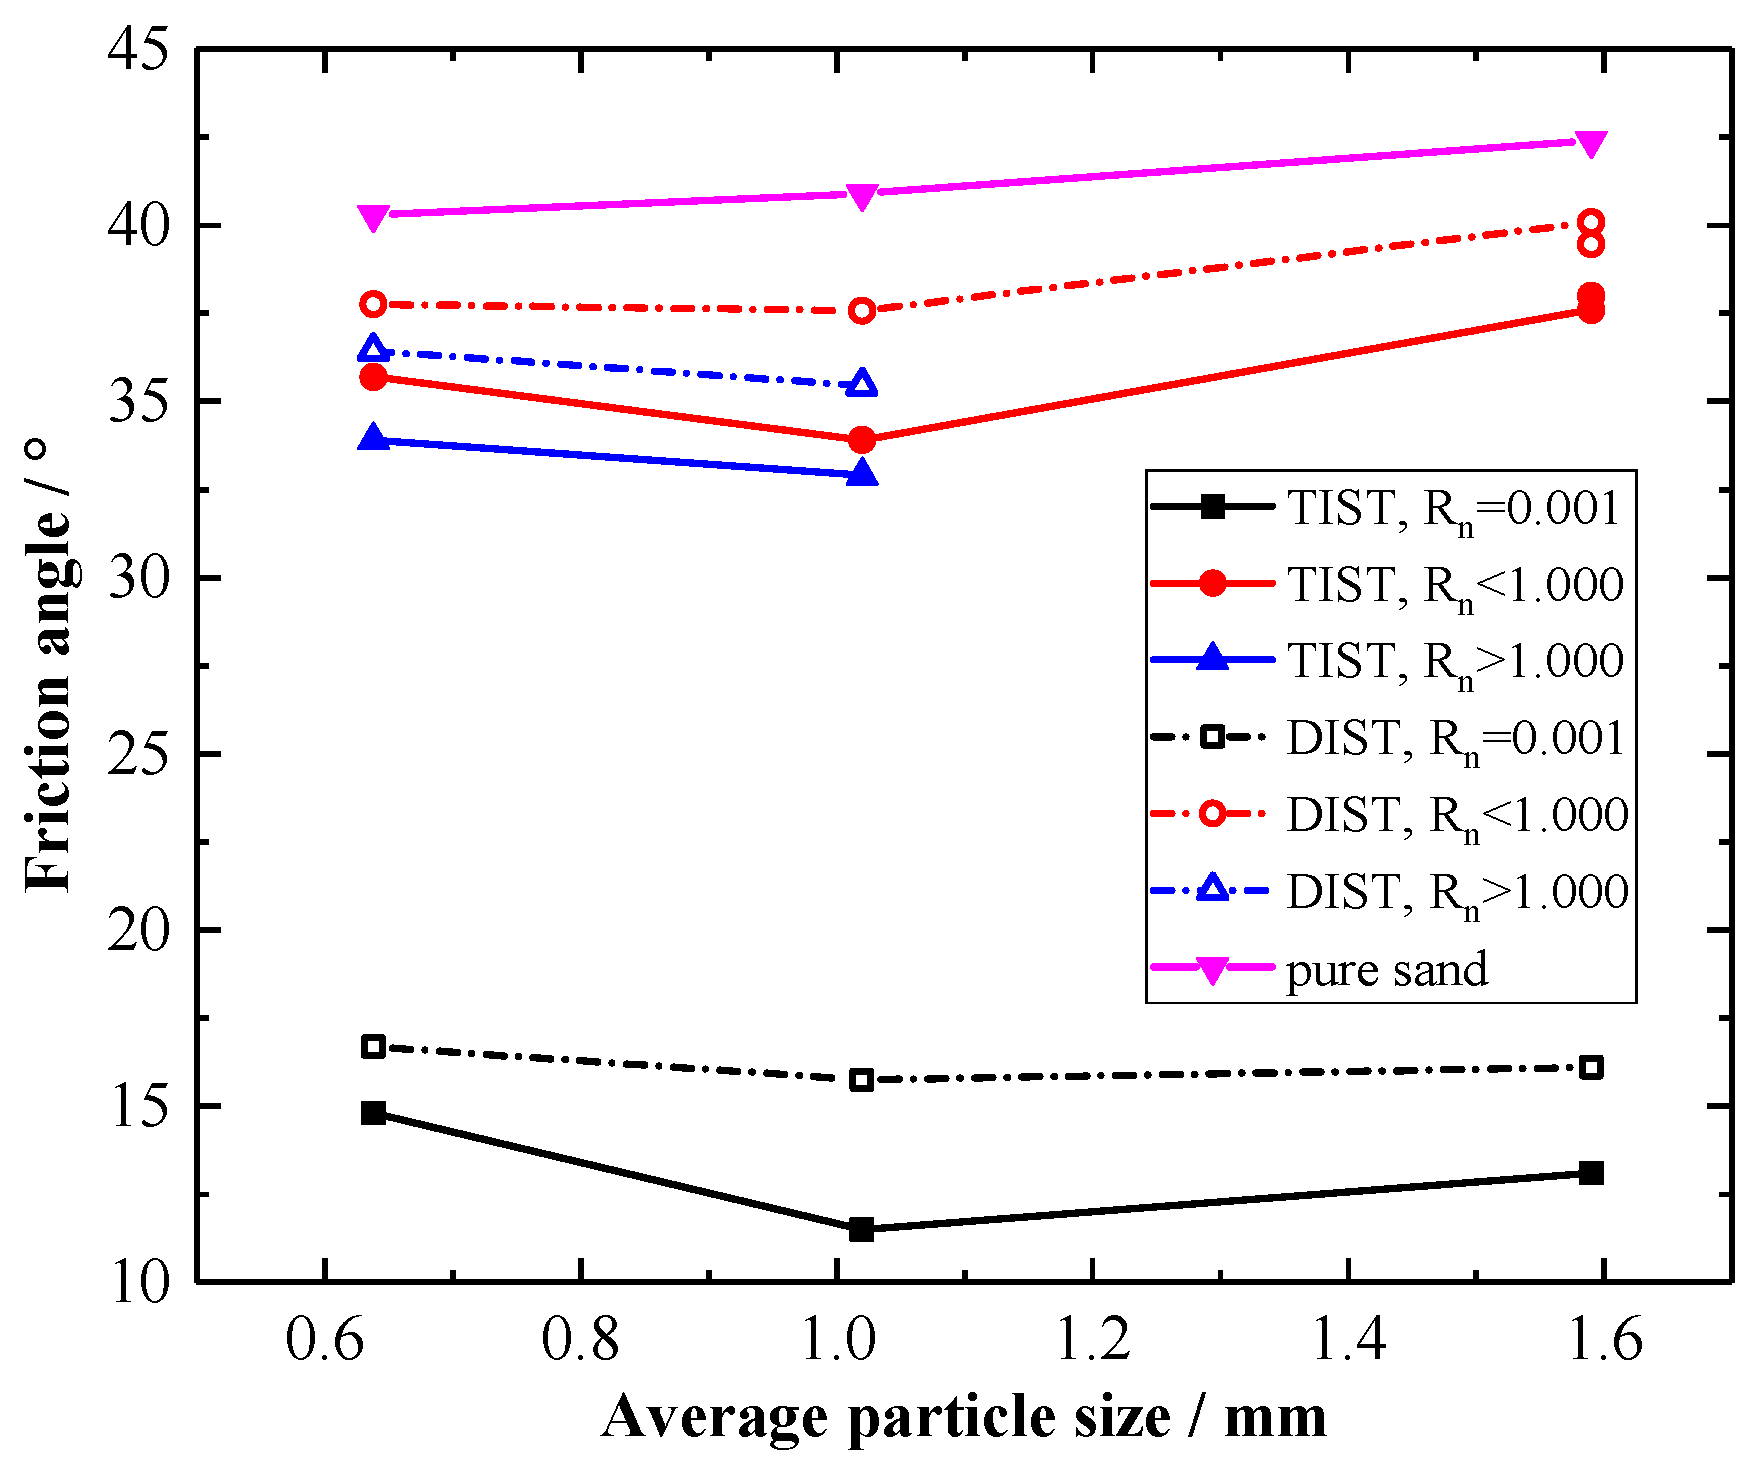
Figure 13 presents the mean particle size (D50) and interface friction angle (δ) derived from two interface shear tests conducted at different relative roughness (Rn) levels, along with the results from pure sand shear tests. The relative roughness is categorized into three ranges: Rn = 0.001, Rn < 1, and Rn > 1. As depicted in the Figure 13, the interface friction angle (δ) initially increases with particle size (D50) but then decreases. This trend suggests that δ is not directly proportional to D50; instead, it is influenced by the coupling factor represented by the relative roughness (Rn). However, D50 directly influences the φ value obtained from pure soil tests, with the φ value significantly increasing as D50 increases in pure soil shear tests. Su et al. [37] observed that the interface friction angle in direct shear tests remains approximately constant across different D50 conditions. This pattern is also evident in this study under torsional shear conditions. Therefore, it can be concluded that the particle size has an insignificant effect on the interface friction angle in interface shear tests.

4. Conclusions

In this study, we designed a dual-motor-driven interface torsional shear apparatus to investigate the surface roughness of steel and the particle size-dependent interface torsional shear behavior of sand. The main conclusions are as follows:
(1) Based on different levels of relative roughness (Rn), the interface can be categorized as smooth or rough. The smooth interface stabilizes after reaching peak shear stress, while the rough interface decreases to a stable fluctuation after reaching peak stress. Dilation occurs during the interface shear process, with the soil skeleton experiencing shear compression at the smooth interface and shear dilation at the rough interface. The failure modes of the two types of interfaces differ in direct shear.
(2) The shear strength of the rough interface exceeds that of the smooth interface but remains lower than that observed in pure soil shear. A critical relative roughness value (Rcr) exists in the different shear tests. The interface friction angle (δ) increases rapidly with Rn until it reaches the critical value (Rcr), after which it stabilizes.
(3) The tests of torsional shear and direct shear have almost no impact on the friction between the sand and steel interface. The range of variation in the normalized friction angle is consistent, ranging from 0.27 to 0.36 for smooth interfaces and from 0.81 to 0.92 for rough interfaces. Particle size has an insignificant effect on the interface friction angle in interface shear tests.

Author Contributions

Conceptualization, Y.H.; Methodology, Y.H.; Resources, X.G.; Writing—original draft, Y.H.; Writing—review & editing, L.S. and X.G.; Funding acquisition, L.S. All authors have read and agreed to the published version of the manuscript.

Funding

This research received no external funding.

Data Availability Statement

The original contributions presented in this study are included in the article. Further inquiries can be directed to the corresponding author.

Conflicts of Interest

The authors declare no conflict of interest.

References

  1. Randolph, M.F. Science and Empiricism in Pile Foundation Design. Géotechnique 2003, 53, 847–875. [Google Scholar] [CrossRef]
  2. Zhou, W.; Yin, J. A Simple Mathematical Model for Soil Nail and Soil Interaction Analysis. Comput. Geotech. 2008, 35, 479–488. [Google Scholar] [CrossRef]
  3. Kishida, H.; Uesugi, M. Tests of the Interface Between Sand and Steel in the Simple Shear Apparatus. Géotechnique 1987, 37, 45–52. [Google Scholar] [CrossRef]
  4. Roodi, G.H.; Morsy, A.M.; Zornberg, J.G. Soil-Geosynthetic Interface Shear in Different Testing Scales. Transp. Res. Rec. 2018, 2627, 129–141. [Google Scholar] [CrossRef]
  5. Meehan, C.L.; Tiwari, B.; Brandon, T.L.; Duncan, J.M. Triaxial Shear Testing of Polished Slickensided Surfaces. Landslides 2011, 8, 449–458. [Google Scholar] [CrossRef]
  6. Desai, C.S.; Nagaraj, B.K. Modeling for Cyclic Normal and Shear Behavior of Interfaces. J. Eng. Mech. 1988, 114, 1198–1217. [Google Scholar] [CrossRef]
  7. Potyondy, J.G. Skin Friction Between Various Soils and Construction Materials. Géotechnique 1961, 11, 339–353. [Google Scholar] [CrossRef]
  8. Desai, C.S.; Drumm, E.C.; Zaman, M.M. Cyclic Testing and Modeling of Interfaces. J. Geotech. Eng. 1985, 111, 793–815. [Google Scholar] [CrossRef]
  9. Maitra, S.; Chatterjee, S.; White, D.; Choudhury, D. Uplift Resistance of Buried Pipelines: The Contribution of Seepage Forces. Ocean Eng. 2022, 250, 111037. [Google Scholar] [CrossRef]
  10. Ansari, Y.; Kouretzis, G.; Sloan, S.W. Physical Modelling of Lateral Sand-Pipe Interaction. Géotechnique 2021, 71, 60–75. [Google Scholar] [CrossRef]
  11. Jung, J.K.; O’Rourke, T.D.; Olson, N.A. Lateral Soil-Pipe Interaction in Dry and Partially Saturated Sand. J. Geotech. Geoenviron. Eng. 2013, 139, 2028–2036. [Google Scholar] [CrossRef]
  12. Li, Y.; Lv, M.; Guo, Y.; Huang, M. Effects of the Soil Water Content and Relative Roughness on the Shear Strength of Silt and Steel Plate Interface. Measurement 2021, 174, 109003. [Google Scholar] [CrossRef]
  13. Hamid, T.B.; Miller, G.A. Shear Strength of Unsaturated Soil Interfaces. Can. Geotech. J. 2009, 46, 595–606. [Google Scholar] [CrossRef]
  14. Hu, L.; Pu, J. Testing and Modeling of Soil-Structure Interface. J. Geotech. Geoenviron. Eng. 2004, 130, 851–860. [Google Scholar] [CrossRef]
  15. Kou, H.; Diao, W.; Zhang, W.; Zheng, J.; Ni, P.; Jang, B.; Wu, C. Experimental Study of Interface Shearing Between Calcareous Sand and Steel Plate Considering Surface Roughness and Particle Size. Appl. Ocean Res. 2021, 107, 102490. [Google Scholar] [CrossRef]
  16. Han, F.; Ganju, E.; Salgado, R.; Prezzi, M. Effects of Interface Roughness, Particle Geometry, and Gradation on the Sand-Steel Interface Friction Angle. J. Geotech. Geoenviron. Eng. 2018, 144, 04018096. [Google Scholar] [CrossRef]
  17. Xiao, Y.; Cui, H.; Shi, J.; Qiao, W.; Stuedlein, A.W. Shear Response of Calcareous Sand-Steel Snake Skin-Inspired Interfaces. Acta Geotech. 2024, 19, 1517–1527. [Google Scholar] [CrossRef]
  18. Seiphoori, A.; Duong, T.N.; Geyin, M. A mechanistic understanding of interface shear behavior of cohesionless materials using torsional ring shear test. In Proceedings of the 3rd Vietnam Symposium on Advances in Offshore Engineering, Hanoi, Vietnam, 12–14 December 2024; pp. 313–322. [Google Scholar]
  19. Eid, H.T.; Al-Nohmi, N.M.; Wijewickreme, D.; Amarasinghe, R.S. Drained Peak and Residual Interface Shear Strengths of Fine-Grained Soils for Pipeline Geotechnics. J. Geotech. Geoenviron. Eng. 2019, 145, 06019010. [Google Scholar] [CrossRef]
  20. Li, D.; Hou, X.; Zhang, Y. Shearing Behavior of Suction Caisson Wall-Sand Interface throughout the Suction Caisson Life-Cycle. Appl. Ocean Res. 2024, 142, 103852. [Google Scholar] [CrossRef]
  21. Ke, L.; Gao, Y.; Li, D.; Zhang, Y.; Zhang, J.; Ji, J. An Experimental Study on Monotonic Shear Behavior of the Interface Between Fine Sea Sand and Steel. Int. J. Geomech. 2023, 23, 06022034. [Google Scholar] [CrossRef]
  22. ASTM D4253-16; Standard Test Methods for Maximum Index Density and Unit Weight of Soils Using a Vibratory Table. ASTM International: West Conshohocken, PA, USA, 2019.
  23. ASTM D4254-16; Standard Test Methods for Minimum Index Density and Unit Weight of Soils and Calculation of Relative Density. ASTM International: West Conshohocken, PA, USA, 2016.
  24. ASTM D854-23; Standard Test Methods for Specific Gravity of Soil Solids by Water Displacement Method. ASTM International: West Conshohocken, PA, USA, 2023.
  25. Hebeler, G.L.; Martinez, A.; Frost, J.D. Shear Zone Evolution of Granular Soils in Contact with Conventional and Textured CPT Friction Sleeves. KSCE J. Civ. Eng. 2016, 20, 1267–1282. [Google Scholar] [CrossRef]
  26. Frost, J.D.; DeJong, J.T.; Recalde, M. Shear Failure Behavior of Granular-Continuum Interfaces. Eng. Fract. Mech. 2002, 69, 2029–2048. [Google Scholar] [CrossRef]
  27. Yi, C.; Wang, C.; Zhang, L.; Chen, Z.; Xie, H. Study on Description Index System of Rough Surface Based on Bi-Body Interaction. Chin. J. Rock Mech. Eng. 2006, 25, 2481–2492. [Google Scholar]
  28. Uesugi, M.; Kishida, H. Frictional Resistance at Yield Between Dry Sand and Mild Steel. Soils Found. 1986, 26, 139–149. [Google Scholar] [CrossRef]
  29. ASTMD 6467; Standard Test Method for Torsional Ring Shear Test to Determine Drained Residual Shear Strength of Fine-Grained Soils. ASTM International: West Conshohocken, PA, USA, 2021.
  30. Li, D.; Hou, X.; Li, Y.; Zhang, Y. Influences of the Normal Loading Condition and Surface Texture on Interface Shear Behavior between Sand and Suction Caisson Wall. Ocean Eng. 2024, 312, 119277. [Google Scholar] [CrossRef]
  31. Li, L.; Xu, M.; Lu, H.; Zhang, Y.; Guo, Z. Seepage Effect on Caisson-Soil Interface Cyclic Shearing: Testing and Modeling. Soil Dyn. Earthq. Eng. 2025, 195, 109382. [Google Scholar] [CrossRef]
  32. Su, L.; Zhou, W.; Chen, W.; Jie, X. Effects of Relative Roughness and Mean Particle Size on the Shear Strength of Sand-Steel Interface. Measurement 2018, 122, 339–346. [Google Scholar] [CrossRef]
  33. Ari, A.; Akbulut, S. Effect of Fractal Dimension on Sand-Geosynthetic Interface Shear Strength. Powder Technol. 2022, 401, 117349. [Google Scholar] [CrossRef]
  34. Farhadi, B.; Lashkari, A. Influence of Soil Inherent Anisotropy on Behavior of Crushed Sand-Steel Interfaces. Soils Found. 2017, 57, 111–125. [Google Scholar] [CrossRef]
  35. Pham, H.H.G.; Impe, P.V.; Impe, W.; Menge, P.; Haegeman, W. Shear and Interface Shear Strengths of Calcareous Sand. In Proceedings of the 19th International Conference on Soil Mechanics and Geotechnical Engineering, Seoul, Republic of Korea, 17–22 September 2017; pp. 389–392. [Google Scholar]
  36. Wang, X.; Shan, Y.; Cui, J.; Zhong, Y.; Shen, J.; Wang, X.; Zhu, C. Dilatancy of the Foundation Filling Material of Island-Reefs in the South China Sea. Constr. Build. Mater. 2022, 323, 126524. [Google Scholar] [CrossRef]
  37. Feng, W.; Zhang, T.; Li, Y.; Xu, D. Experimental Study of Interface Performance Between Calcareous Sand and Steel Pile with Different Surface Roughness and Temperatures. Ocean Eng. 2024, 292, 116469. [Google Scholar] [CrossRef]
  38. Shoushtari, M.R.; Lashkari, A.; Martinez, A. Effect of Gas-Oil Contamination on the Mechanical Behavior of Sand-Woven Geotextile Interface: Experimental Investigation and Constitutive Modeling. Geotext. Geomembr. 2023, 51, 56–71. [Google Scholar] [CrossRef]
  39. Stutz, H.H. Hypoplastic Models for Soil-Structure Interfaces: Modelling and Implementation. Ph.D. Thesis, Christian-Albrechts-Universität zu Kiel, Kiel, Poland, 2016. [Google Scholar]
  40. Zhang, W.; Jing, H.; Kou, H. Effects of Relative Roughness and Particle Size on the Interface Behavior of Concrete Suction Caisson Foundation for Offshore Wind Turbines. Energies 2020, 13, 5866. [Google Scholar] [CrossRef]
  41. Dietz, M.S.; Lings, M.L. Postpeak Strength of Interfaces in a Stress-Dilatancy Framework. J. Geotech. Geoenviron. Eng. 2006, 132, 1474–1484. [Google Scholar] [CrossRef]
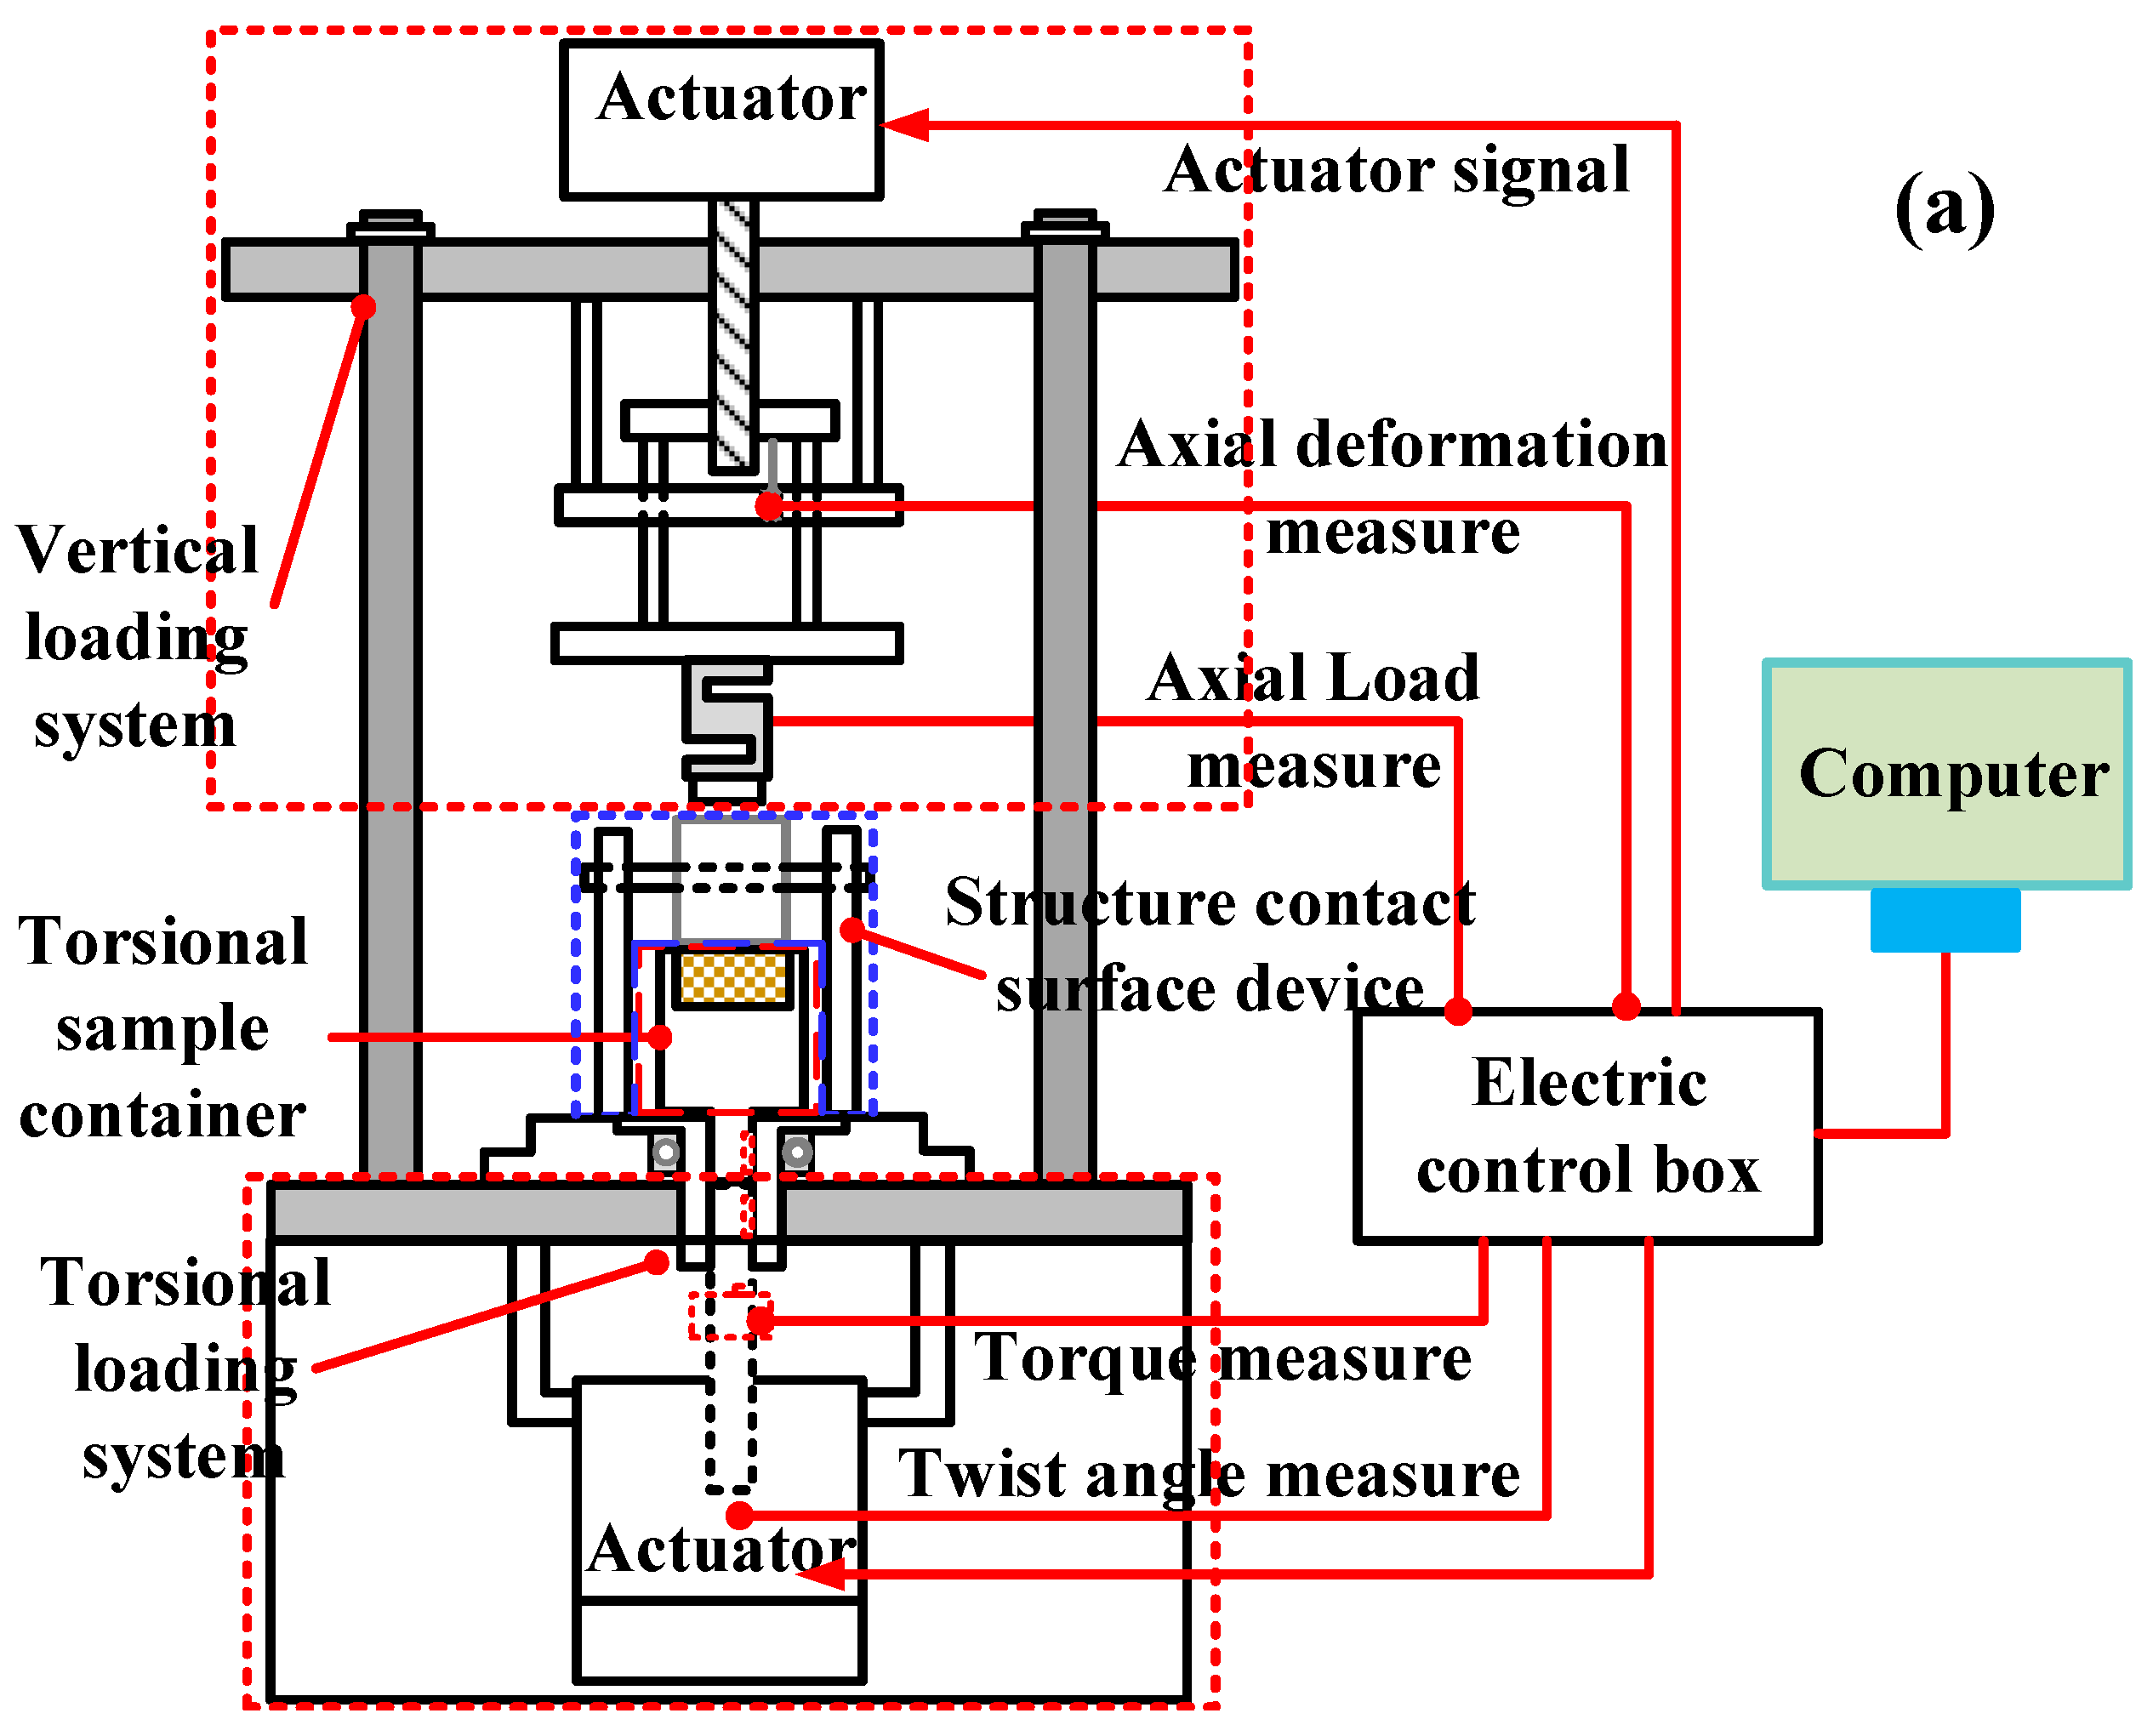
Figure 1. A novel torsional shear apparatus: (a) schematic diagram of a novel torsional shear apparatus, (b) overall diagram of a novel torsional shear apparatus, (c) torsional shear sample container, (d) structural contact surface device, (e) torsional loading system, (f) vertical loading system.
Applsci 15 09575 g001aApplsci 15 09575 g001b
Figure 2. Sand particles with different particle size ranges: (a) Sample Ⅰ, (b) Sample Ⅱ, (c) Sample Ⅲ, (d) particle size distribution curve.
Applsci 15 09575 g002
Figure 3. Steel surfaces with different roughness.
Applsci 15 09575 g003
Figure 4. Images of (a) interface direct shear test setup of sand sample and (b) three different groove widths of steel interface rough plates.
Applsci 15 09575 g004
Figure 5. Shear angle–shear stress curves obtained from the torsional interface shear test: normal stress of (a) 100 kPa, (b) 200 kPa, (c) 300 kPa.
Applsci 15 09575 g005
Figure 6. Direct shear test of pure sand for sample I.
Applsci 15 09575 g006
Figure 7. Shear stress versus shear displacement curves obtained from the direct interface shear test: normal stress of (a) 100 kPa, (b) 200 kPa, (c) 300 kPa.
Applsci 15 09575 g007
Figure 8. Schematic diagram of shear band on smooth or rough interface.
Applsci 15 09575 g008
Figure 9. Shear angle–vertical displacement curves for sample I: (a) smooth interface, (b) normal stress 100 kPa, (c) normal stress 200 kPa, (d) normal stress 300 kPa.
Applsci 15 09575 g009
Figure 10. Mohr–Coulomb strength envelope of interface shear behavior: (a) Sample Ⅰ, (b) Sample Ⅱ, (c) Sample Ⅲ.
Applsci 15 09575 g010
Figure 11. Interface friction angle at different relative roughness levels.
Applsci 15 09575 g011
Figure 12. Normalized interface friction angle versus relative roughness [16,32,41].
Applsci 15 09575 g012
Figure 13. Relationship between the average particle size D50 of pure sand internal friction angle φ and interface friction angle δ.
Applsci 15 09575 g013
Table 1. Basic physical parameters of the soil sample.
SpecimenParticle Size Range/mmD50/
mm
Specific GravityDry Maximum Density ρdmax/g·cm−3Dry Minimum Density ρdmin/g·cm−3Relative Density Dr/%
Sample Ⅰ2~1.181.5902.661.871.4380
Sample Ⅱ1.18~0.851.0202.651.891.4880
Sample Ⅲ0.85~0.4250.6382.661.91.4780
Table 2. Relative roughness index design.
Steel SurfaceSand SampleD50Rn
Surf-R1Sample Ⅰ1.5900.001
Sample Ⅱ1.0200.001
Sample Ⅲ0.6380.001
Surf-R2Sample Ⅰ1.5900.440
Sample Ⅱ1.0200.686
Sample Ⅲ0.6381.097
Surf-R3Sample Ⅰ1.5900.943
Sample Ⅱ1.0201.471
Sample Ⅲ0.6382.351
Surf-D1Sample Ⅰ1.5900.001
Sample Ⅱ1.0200.001
Sample Ⅲ0.6380.001
Surf-D2Sample Ⅰ1.5900.440
Sample Ⅱ1.0200.686
Sample Ⅲ0.6381.097
Surf-D3Sample Ⅰ1.5900.943
Sample Ⅱ1.0201.471
Sample Ⅲ0.6382.351
Disclaimer/Publisher’s Note: The statements, opinions and data contained in all publications are solely those of the individual author(s) and contributor(s) and not of MDPI and/or the editor(s). MDPI and/or the editor(s) disclaim responsibility for any injury to people or property resulting from any ideas, methods, instructions or products referred to in the content.