Article

Lifting-Line Predictions for Optimal Dihedral Distributions in Ground Effect †

by
Amanda K. Olsen
*,
Zachary S. Montgomery
and
Douglas F. Hunsaker
Mechanical and Aerospace Engineering Department, Utah State University, 4130 Old Main Hill, Logan, UT 84322, USA
*
Author to whom correspondence should be addressed.
This article is a revised and expanded version of a paper entitled “Lifting-Line Predictions for Optimal Dihedral Distributions in Ground Effect”, which was presented at the AIAA SciTech Forum, Orlando, FL, USA, 6–10 January 2025.
Appl. Sci. 2025, 15(17), 9558; https://doi.org/10.3390/app15179558
Submission received: 29 July 2025 / Revised: 22 August 2025 / Accepted: 27 August 2025 / Published: 30 August 2025

Abstract

When a flying wing comes within close proximity to the ground, a phenomenon called ground effect occurs where the lift is increased and the induced drag is decreased. This research seeks to determine the optimal dihedral distribution predicted by lifting-line theory that minimizes induced drag in ground effect. Despite some limitations, using lifting-line theory for this study allows for quick results across a large range of design variables, which would be infeasible for high-fidelity methods. The SLSQP optimization method is used along with a numerical lifting-line code to find the dihedral distribution that minimizes induced drag. Results are presented showing how the wing height, taper ratio, lift coefficient, and aspect ratio impact the induced drag and optimal dihedral distributions. For a given geometry, lifting-line theory predicts that there is a certain height above ground where the optimal solutions for a wing below this height result in bell-shaped wings with large section dihedral angles corresponding to a significant induced-drag reduction. For example, a wing with R A = 8 and height of h / b = 0.25 can benefit from a reduction in induced drag of nearly 50% by employing an optimal dihedral distribution compared to a wing with no dihedral distribution.

1. Introduction

It is well known in the aerospace industry that the proximity of an aircraft to the ground can have a significant impact on the aerodynamics [1,2]. This impact is mainly characterized by a reduction in induced drag and an increase in the lift slope of the lifting surface [3]. This phenomenon is referred to as ground effect. All aircraft, when taking off or landing, will experience ground effect, but some aircraft are designed to exclusively operate within close proximity of the ground in order to utilize these benefits. An understanding of ground effect began as early as the Wright brothers who noted experiencing a “cushioning effect” upon aircraft landing [4]. This “cushioning effect” is due to an increase in pressure on the lower surface of the wing caused by proximity to the ground [5]. Various research projects have been conducted to analyze the pressure changes caused by wings in ground effect such as the study by Ahmed and Sharma [6] or the study by Qu et al. [7].
The Russian Ekranoplane, built around the late 1980s, was the first ground-effect vehicle (GEV) used for military purposes, but it was discontinued in the early 1990s [8]. The main reason for discontinuing the aircraft was due to issues in stability when flying near the ground. Since then, much research has been conducted on how to improve the stability of a GEV such as the study by Divitiis [9] or the study by Boschetti and Cardenas [10]. Currently, there are various GEVs in development, including the REGENT Viceroy Seaglider scheduled to begin service between 2026 and 2027. Similarly, in 2021, the Defense Advanced Research Projects Agency (DARPA) sent out a request for information regarding GEVs, then, in 2023, DARPA awarded contracts to various companies to build the Liberty Lifter, the first operational GEV for the United States. Figure 1 shows an artist’s depiction of the proposed Liberty Lifter aircraft.
In addition to stability analysis, it is also important to recognize that GEVs rarely fly over a perfectly flat surface. Therefore, various studies have attempted to quantify the forces encountered over uneven terrain. The research performed by Molina and Zhang [11] and the study by He et al. [12] analyzed the effects of an aircraft flying close to an uneven ground. Similarly, the research performed by Qu et al. [13] compared the forces of a wing over an uneven surface to that over a flat surface. It is also common for GEVs to be designed to fly over water, so Zhi et al. [14] analyzed wings flying in close proximity to water waves. There has also been research performed to determine optimal geometry of a GEV. For example, in the research conducted by Church and Hunsaker [15], the twist was analyzed to find the optimal distribution along the main lifting surface.
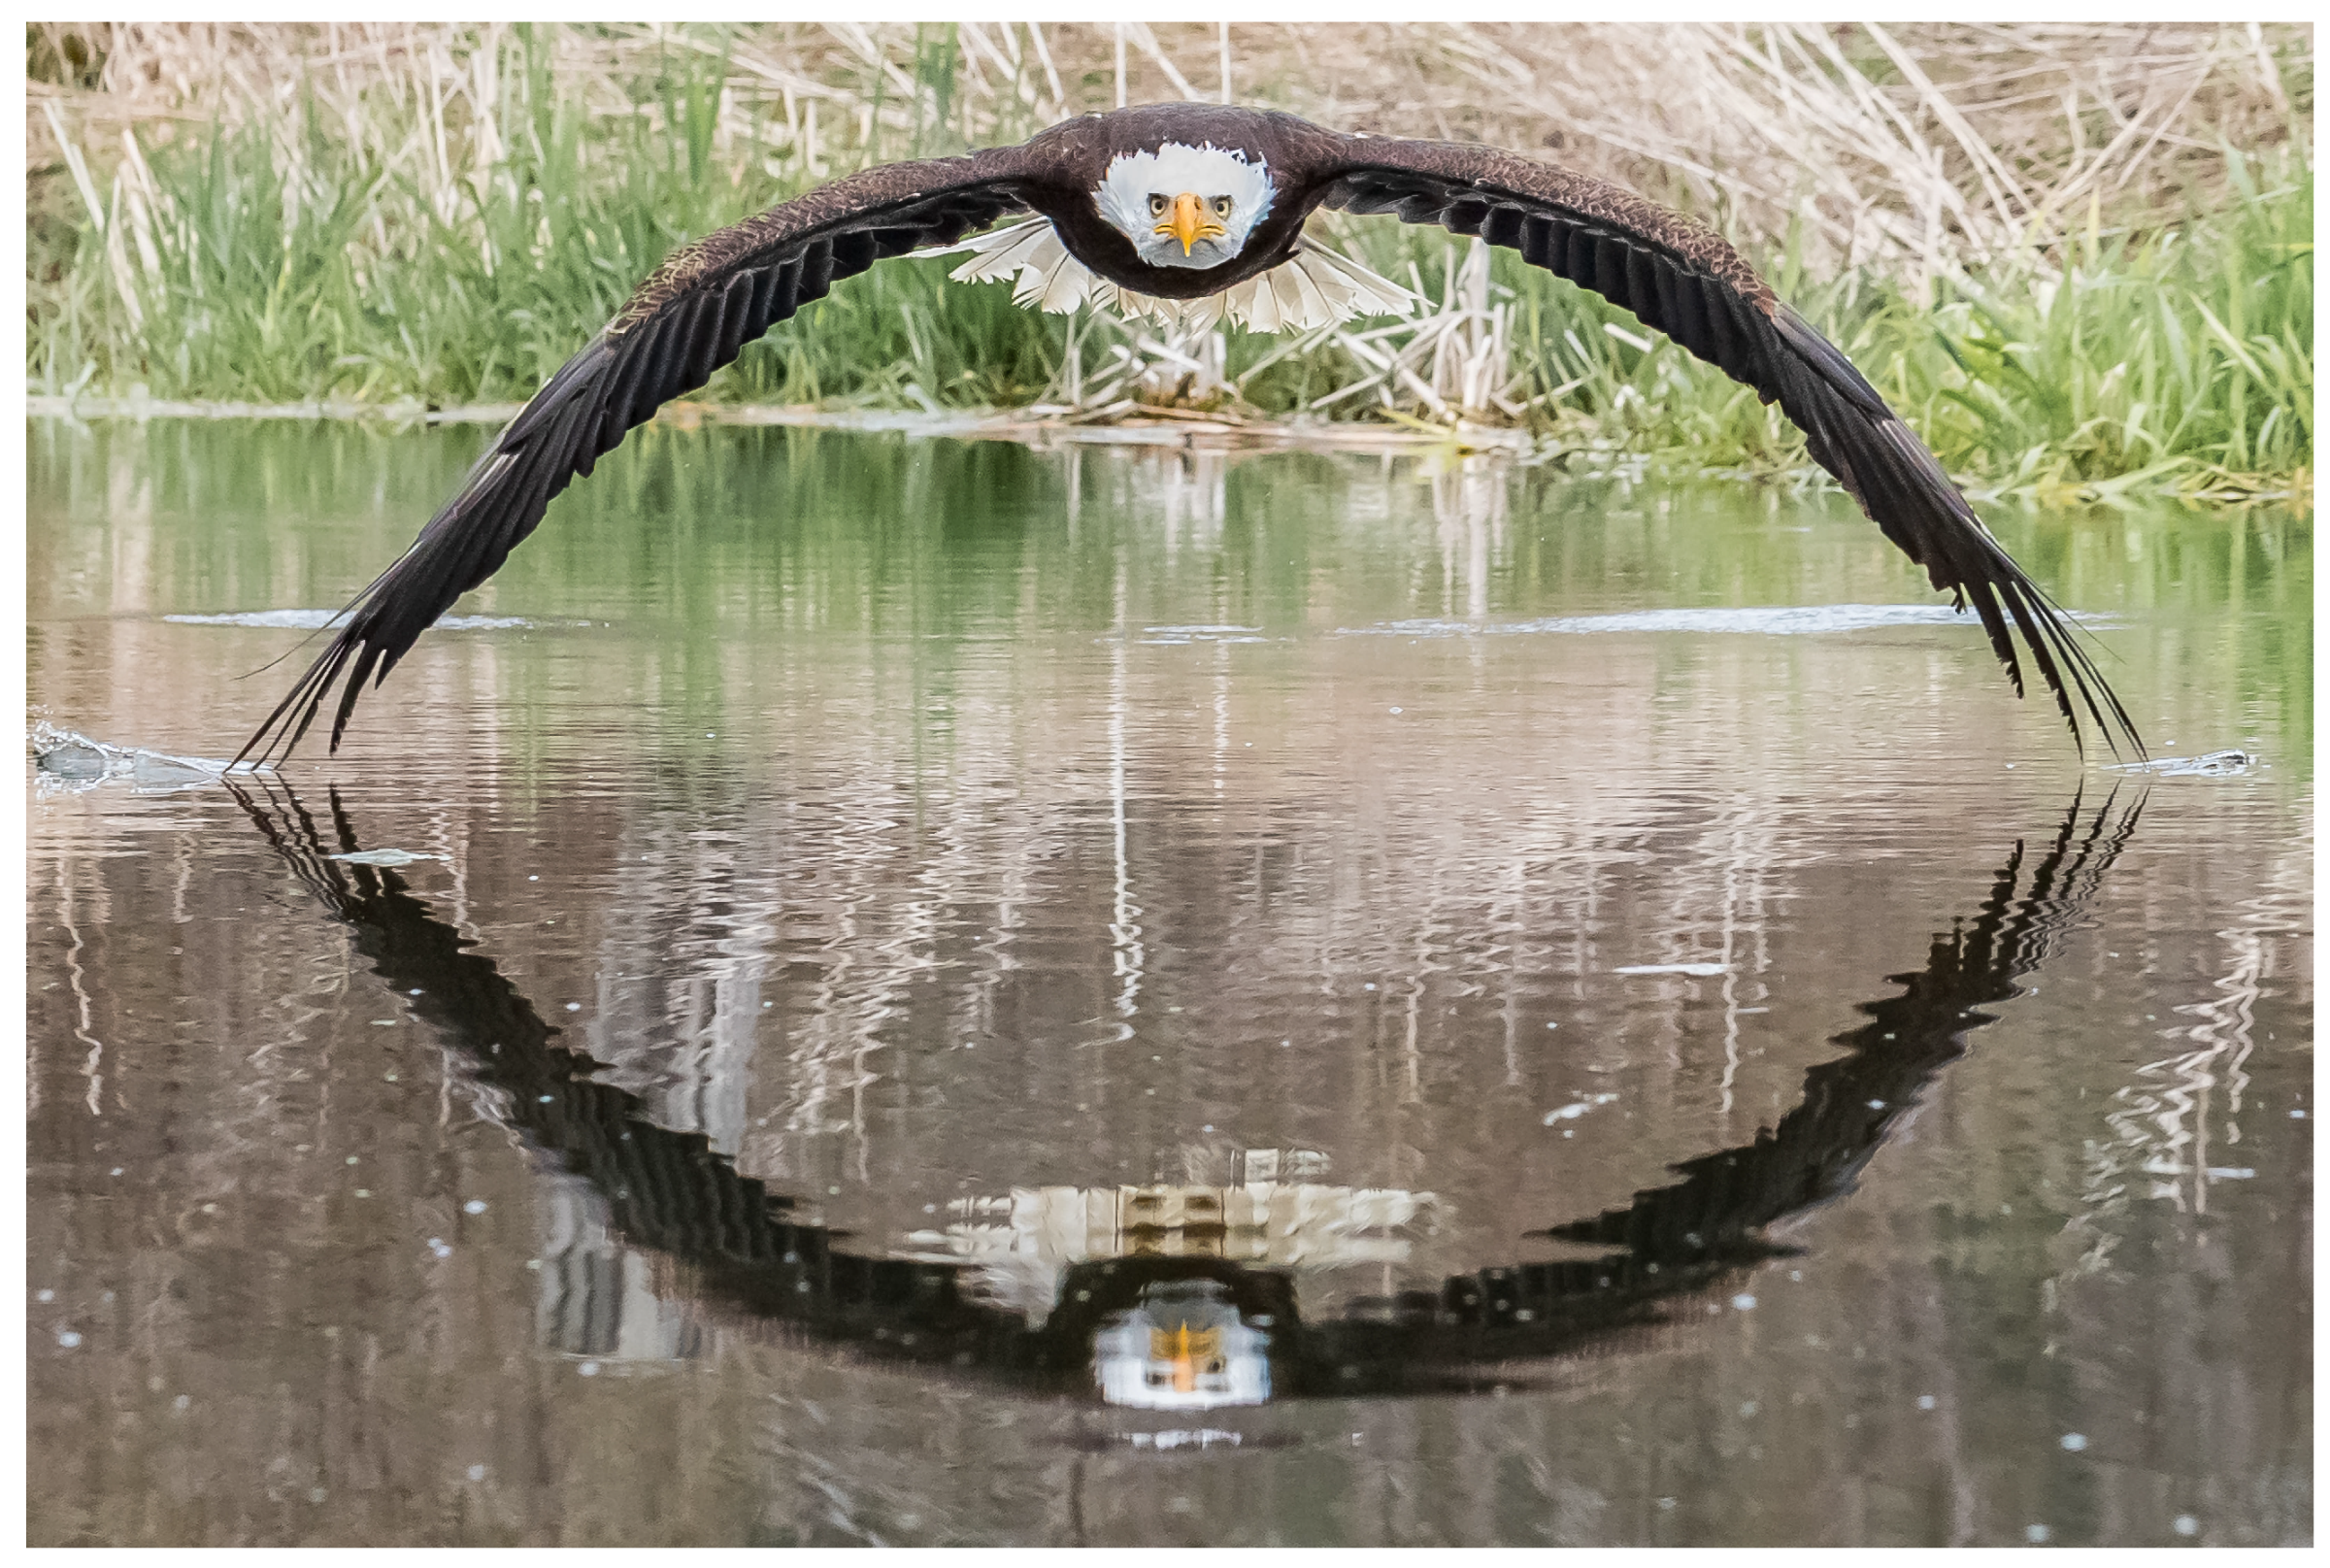
Some birds droop their wings when flying near the ground, as seen in Figure 2. This suggests that there may be a further reduction in induced drag by adding a negative dihedral distribution to a lifting surface. For example, research by Jesudasan et al. [16] looked at the optimal planform and static height stability of a wing in ground effect by allowing the section dihedral to change at a single location out towards the wingtips. Similarly, the research of Park and Lee [17] used numerical analysis to show that drag can be reduced even further in ground effect when utilizing an end plate at the tip of a wing. The use of an end plate provides a similar benefit to negative wingtip dihedral by reducing the amount of airflow around the wingtips, thus reducing the wingtip vortices which contribute to the induced drag. As discussed by Lee et al. [18], an end plate may reduce drag, but it can have a negative impact on the static height stability.
The purpose of this research is to take a more general approach to analyzing the optimal dihedral distribution. Rather than restricting the design space to altering the section dihedral at a single location towards the wingtips, this research allows the section dihedral to change at multiple locations along the wingspan. There are various important parameters to consider when designing a ground-effect vehicle; however, this research uses a single-objective optimization approach to determine the optimal dihedral distribution that produces the minimum induced drag, as predicted by lifting-line theory. The design space is analyzed by altering four parameters including wing height, taper ratio, lift coefficient, and aspect ratio, corresponding to h / b , R T , C L , and R A respectively.
The aerodynamic software used in this study is based on a modern numerical lifting-line method capable of modeling the effects of dihedral distributions and ground effect on the aerodynamic lift and induced drag of a finite wing. Although lifting-line theory is considered a low-fidelity aerodynamic prediction method, it has traditionally been used to find optimal wing configurations. For example, the infamous elliptic-lift distribution was derived from lifting-line theory [19,20], as was the lesser-known bell-shaped lift distribution [21]. These lift distributions are still widely used as a comparison for modern aircraft design, although once elastic and low-aspect-ratio effects are considered, they do not represent the optimum solutions for all cases. In a similar manner, the results from this study offer comparative distributions that can be used to inform the design of future ground-effect vehicles or to understand the benefits that birds may be exploiting in their behaviors. One additional benefit for using lifting-line theory is that the computational cost of the method is very low in comparison to other typical aerodynamic prediction methods. An engineering study of this magnitude, including design parameters of h / b , R T , C L , and R A , over the large range analyzed in this study, would be extremely computationally expensive to obtain from Computational Fluid Dynamics (CFD). However, the results presented here can be used to inform future CFD studies, as well as to compare optimal results predicted by other computational or experimental methods.

1.1. Numerical Lifting-Line Theory

Any wing with finite span will produce downwash as a result of vortices around the wingtips. This downwash is directly responsible for the creation of induced drag, C D i , on a wing. Because the main difference in the flowfield around a wing in ground effect is dominated by the suppression of wingtip vortices, and because such effects can accurately be modeled using potential-flow approximations, it is expected that lifting-line theory can be used to obtain reasonable results for induced drag in ground effect. Within classical lifting-line theory developed by Ludwig Prandtl [19,20], the lift and induced drag on a wing with no sweep or dihedral distributions can be estimated for a lifting surface by modeling the wing as an infinite number of horseshoe vortices. Each horseshoe vortex has two trailing lines parallel with the freestream and one portion, referred to as the bound vortex filament, aligned with the wing quarter-chord, as shown in Figure 3. Because circulation and section dihedral are commonly represented by the symbol Γ , in order to avoid confusion in this paper, the shed vorticity of trailing vortex segments will be represented by the symbol g ( θ ) and the vorticity about the lifting line will be represented by the symbol G ( θ ) , where θ is a change of variables for the spanwise coordinate.
The local lift force, L ˜ , at any location on the wing is found using the Kutta–Joukowski law [22,23] given by
L ˜ = ρ V G
where ρ is the air density, V is the freestream velocity, and G is the circulation.
In order to use Equation (1), the bound circulation, G, must be known. The general solution to classical lifting-line theory gives the vortex strength distribution along the lifting line as a Fourier sine series:
G ( θ ) = 2 b V j = 1 n A j sin ( j θ ) ,           θ = cos 1 ( 2 z / b )
where b is the wingspan, n is the total number of lifting-line nodes, j is the current lifting-line node index, and z is the spanwise coordinate along the wingspan. The Fourier coefficients, A j , are determined from
j = 1 n A j 4 b C ˜ L , α c ( θ ) + j sin ( θ ) sin ( j θ ) = α ( θ ) α L 0 ( θ )
which is a function of the local lift slope, C ˜ L , α , local chord length, c, and the difference between the geometric twist, α , and the zero-lift angle of attack, α L 0 .
This method results in a system of linear equations that are solved to determine the lift distribution for a given wing, although assumptions are made that the lifting line is perfectly aligned with the z-axis and that the trailing vortex sheet occurs only in the xz plane. A wing with a dihedral or sweep distribution does not fit this assumption, so in order to accurately measure the lift distribution, a three-dimensional geometric model must be used. This original theory also only accounts for downwash coming directly from the wing being analyzed. It does not account for the downwash effects of other wings that may be in the vicinity. Numerical lifting-line theory, developed by Phillips and Snyder [24], utilizes a modified approach to the classical method to generalize the solution to a system with multiple wings of arbitrary shape and position. This approach was shown to have comparable results to higher fidelity methods like that of inviscid CFD.
Figure 4 shows a swept wing with a single arbitrary horseshoe vortex. The direction of the trailing vortex vectors are defined by u , which is the unit vector aligned with the local freestream velocity, while the bound vortex lies along the wing quarter-chord. Each lifting surface is divided into N v horseshoe vortices placed side by side, usually cosine clustered around the wingtips.
To find the local lift force vector, d F , rather than using the two-dimensional Kutta–Joukowski law, the numerical approach utilizes the three-dimensional vortex lifting law [25] given by
d F = ρ G V × d l
where V is the local velocity vector, and d l is the bound portion of the vortex filament along the quarter-chord line.
The induced velocity at a control point, j, from a given horseshoe vortex, k, is proportional to the strength of the horseshoe vortex. Therefore, the total velocity at a control point is the sum of the freestream and induced velocities from each horseshoe vortex, as
V j = V + k = 1 n G k ν k j
where ν k j is an influence vector dependent on the geometry of the horseshoe vortex, k, and the relative position of the control point, j.
Furthermore, the section lift coefficient at each control point, C ˜ L j , is written as a function of the local flap deflection, δ j , and angle of attack, α j . Using this relationship, the local force vector magnitude at a given point is defined as
| d F j | = 1 2 ρ V 2 C ˜ L j ( α j , δ j ) d S j
where d S j is the local spanwise planform area for the j th horseshoe segment. Equation (6) is equated to the magnitude of Equation (4) to obtain the final relationship,
2 | ρ G j V + k = 1 n G k ν k j × d l j | ρ V 2 C ˜ L j ( α j , δ j ) d S j = 0
which produces a nonlinear system of equations. Using this formulation, an iterative numerical process must be used to solve for each vortex strength, G k . Once G k is known for each vortex, this information can be used to directly compute the lift and induced-drag distributions along the wing, and integrated to yield the total lift and induced-drag.

1.2. Theory of Ground Effect

The potential-flow effects of the presence of the ground plane can be simulated by perfectly mirroring a wing across the ground plane, as shown in Figure 5. As downwash is generated by the main wing, an equal and opposite amount of upwash is created by the mirrored wing. Along the ground plane, or plane of symmetry, the interactions between the two wings create a sheet of streamlines of the flow field where no flow is able to cross. Therefore, this method allows for the main wing to be analyzed as if it were in close proximity of a flat ground [3].
As discussed by Li et al. [26], wingtip vortices directly influence the amount of induced drag on a wing. Therefore, when these vortices interact with another object, the total induced drag can be impacted. In the case of ground effect, as the vortices interact with the ground plane, the trailing vorticity is reduced significantly compared to the same wing at high altitudes. This effectively reduces the total downwash and increases the overall wing lift slope.
It is common to define the wing height in terms of the non-dimensional value h / b , where h is the height of the wing above the ground and b is the wingspan. There is no defined value for when the onset of ground effect begins, although ground effect is generally considered to become significant between values of h / b = 0.5 and h / b = 1.0 . This can vary depending on factors such as planform shape, twist, or dihedral distribution.
There is no closed-form solution when solving for the forces on a wing in ground effect, although some analytical equations have been presented that can closely approximate the lift and induced drag. Phillips and Hunsaker [27] presented an updated relation for a ground effect influence ratio which compares the lift and induced drag on a wing in ground effect to a wing outside of ground effect. Along with the wing height defined by h / b , the influence ratio was also determined to be a function of aspect ratio, R A , and lift coefficient, C L . A similar study was performed by Valenzuela and Takahashi [28]. In order to directly solve for the lift and induced drag on a wing in ground effect, this research utilizes the numerical lifting-line method presented in the previous section.

2. Methods

MachUp Pro is a numerical lifting-line code written in Fortran which is based on the algorithm presented by Phillips and Snyder [24]. It allows the user to easily determine the forces and moments on a wing as well as lift and induced drag distributions for arbitrary wing geometries. Furthermore, a ground plane can be specified in order to automatically mirror a wing for use in an analysis of ground effect. This research was accomplished by pairing MachUp Pro with an optimization algorithm. The optimizer was allowed to change the section twist and section dihedral values of the wing at various control points along the semispan while attempting to minimize induced drag. The code was configured to vary the twist linearly between these control points. One limitation of using lifting-line theory with a non-zero dihedral distribution is that sharp changes in the lifting-line can produce discontinuities in the lift distribution [29]. To avoid this, the dihedral distribution was forced to vary quadratically, with a continuous section dihedral slope at each control point.

2.1. Grid Convergence

Before each optimization case, the wing was updated with a specified height, h / b , taper ratio, R T , lift coefficient, C L , and aspect ratio, R A . A standard baseline wing was defined with the properties shown in Table 1. All grid resolution data was based on these defined parameters and all of the final results are variations of the baseline.

2.1.1. Numerical Lifting-Line Convergence

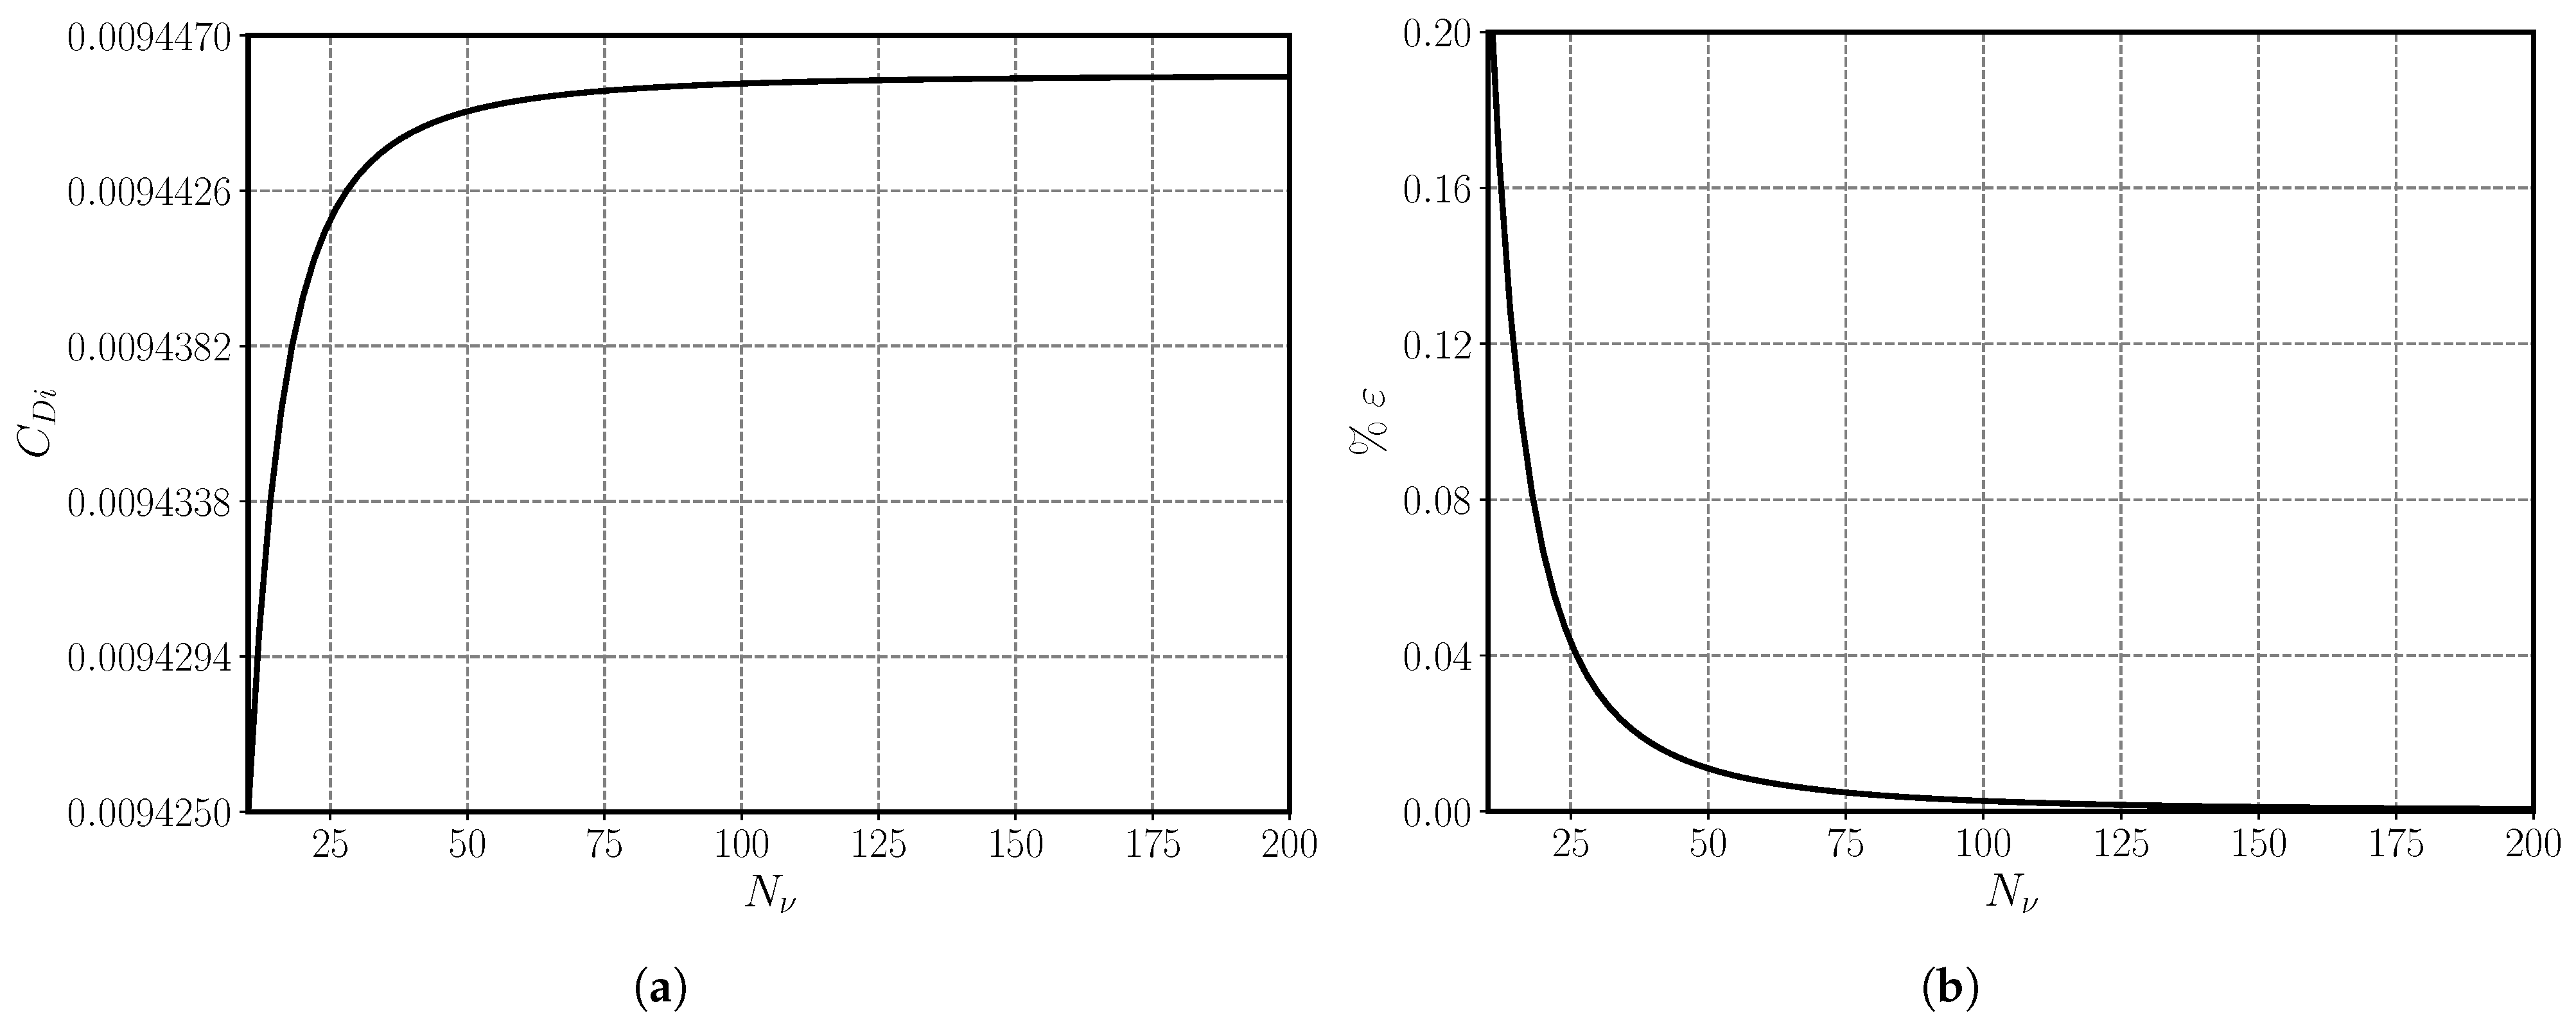
In order to determine the optimal number of horseshoe vortices along the semispan, N v , a grid convergence study was performed for the baseline case given by Table 1 with a wing mounting angle of 6 degrees and no twist or dihedral distribution. The induced drag coefficient was recorded using values of N v from 10 to 200 cosine clustered along the semispan. A single case of N v = 500 points was used as the truth value, to which all induced drag outputs were compared in order to find the grid resolution error. Figure 6 shows the resulting induced drag and error percentage, ε , for increasing lifting-line control points.
In Figure 6a, there is little difference in induced drag calculations for values of N v larger than 50. In Figure 6b, a value of N v = 100 corresponds to a percent error in induced drag of ε = 0.0027 %. This is well within the known accuracy of lifting-line theory for real-world scenarios. Using a higher grid resolution would therefore unnecessarily increase computation time without significantly increasing the accuracy of the study. Hence, a value of N v = 100 points was chosen throughout this research in order to ensure convergence of the lifting-line algorithm while maintaining an efficient optimization algorithm.

2.1.2. Control Points for Section Dihedral and Twist

Any number of control points for section dihedral and twist along the wing may be specified, but having too many can significantly slow down the code and may not necessarily converge to a desired answer. This is because an increase in optimization variables can also have an impact on the overall design space by increasing the number of local minima. Because of this problem, it was necessary to perform a grid convergence study for the number of changing section dihedral points per semispan, N Γ , where the control points were evenly spaced along the wing. The section dihedral at the root chord was constrained to be constant at zero degrees, so the value of N Γ refers to only those section dihedral points that were altered during the optimization process. For example, a value of N Γ = 4 refers to a total of 5 equally spaced points along the semispan. The section dihedral point at the root is not considered a control point so it is not counted. On the other hand, the twist was allowed to change at the root, so a value of N Γ = 4 would correspond with 5 control points for twist at the same locations. The results of this study were used to both determine if the optimizer was well conditioned and to choose a sufficient number of control points that provided an accurate answer without unnecessary computational power.
In order to perform the grid convergence study, the baseline wing was initialized with a constant section dihedral of zero degrees and a root angle of attack of six degrees. The optimization was repeated for increasing N Γ values while solving for the optimum induced drag in each case using all integer values from N Γ = 1 to N Γ = 8 . One high-fidelity simulation was performed using a value of N Γ = 16 . Figure 7 shows how the minimum induced drag changes with an increasing value of N Γ .
Figure 7 shows that the induced drag estimate decreases as more points are added along the wingspan. This suggests that the optimization algorithm is behaving as expected rather than converging to other local minima. There is a large decrease in induced drag between N Γ = 2 to N Γ = 4 , but values higher than N Γ = 8 do not seem to significantly alter the solution. It is also important to consider the computational power needed for each grid resolution. The time to convergence exponentially increases as more points are added. Because of the significant time to convergence needed to compute the induced drag on a wing with more than 5 nodes, a value of N Γ = 4 was chosen to be used for each optimization unless otherwise specified. The nomenclature for this configuration is 4D5T, corresponding to four section dihedral and five section twist control points. Figure 8 shows the location for each of these section dihedral and twist control points as a fraction of the semispan.

2.2. Optimization

This study employed scipy.optimize.minimize (version 1.13.1) [30], which is a Python package with methods for both constrained and unconstrained optimization. The need for constraints limited the usable methods to Sequential Least Squares Programming (SLSQP) and Constrained Optimization by Linear Approximation (COBYLA). One key difference between these two methods is that SLSQP is capable of applying both equality and inequality constraints, whereas COBYLA can only use ineqaulity constraints. This does not inherently preclude the use of COBYLA for this project. An equality constraint can still be applied by creating two inequality constraints with opposing signs. With this in mind, both of these methods were tested to determine which had a better convergence. Due to the limitations of COBYLA, the SLSQP method, which uses a gradient-based optimization algorithm, provided more robust and consistent results.
For this research, the objective function took an array of inputs, x , containing the dihedral and twist distribution information, and the output was the total induced drag prediction from MachUp Pro, C D i . The code always created an equal distribution of control points along the semispan for both section dihedral and twist starting from the wing root out to the wingtip. Furthermore, the section dihedral at the root was fixed to zero and, thus, did not change during the optimization process.
For most results in the subsequent section, the initial guess was defined as a wing with no dihedral distribution, no washout distribution, and a root angle of attack of six degrees. When varying h / b , two local minima were initially observed. Because of this, portions of the data were obtained by initializing to the previous optimized case from a lower h / b value. The results show only the minimum induced drag that resulted from testing both of these initial conditions.
Some optimization methods allow for bounds and constraints to be defined to force the function to avoid certain areas of the design space that are not feasible. Bounds set limits on the range of optimization variables, effectively bounding the optimization space, and constraints force the output of the objective function to meet certain criteria. For the purpose of this research, the bounds for the section dihedral variables were set to be 90 Γ i 90 and the bounds for the twist were set to 40 α i 40 , which prevented the code from testing any values outside of this range. No final solutions were obtained along the bounds, so this was not a limiting factor for the results.
Furthermore, a constraint function, q, may be defined as either an equality or an inequality constraint. An equality constraint function is only satisfied if the returned result is equal to zero, as shown by
q ( x ) = 0
On the other hand, an inequality constraint is satisfied as long as the constraining function is greater than or equal to zero such that
q ( x ) 0
A total of three constraints were used for this optimization problem. The first constraint ensured that the total wing lift coefficient was equal to a target value. This was implemented as an equality constraint equal to C L , target C L , true . The optimizer altered the section dihedral and twist values such that this constraint was met.
The second constraint prevented any portion of the wing from becoming too close or intersecting the ground plane by ensuring that the current lowest wing section did not drop below a certain height. As the optimizer altered the dihedral distribution, there was a possibility that the wing could intersect the ground plane, which is an unrealistic scenario. Therefore, an inequality constraint was implemented to prevent this from happening.
The height of the quarter-chord above the ground plane was found directly using built-in functions in MachUp Pro. Due to twist and dihedral distributions in the wing, both the leading and trailing edges of each spanwise section needed to be checked in order to find the minimum height above ground. The height of the leading and trailing edge of the section airfoil is a function of both the section dihedral and section twist. Figure 9 shows the airfoil section geometry defined with the corresponding section dihedral angle.
By using basic trigonometry and the diagram in Figure 9, the location of the trailing edge was found with
h t e = h c / 4 3 4 c sin ( α ( θ ) ) cos ( Γ ( θ ) )
and the location of the leading edge was found with
h l e = h c / 4 + 1 4 c sin ( α ( θ ) ) cos ( Γ ( θ ) )
where α ( θ ) is the section twist and Γ ( θ ) is the section dihedral. These equations were evaluated at each spanwise section of the wing to find the location closest to the ground plane. Rather than simply allowing the minimum h location to be higher than the ground plane, an offset was applied to the constraint equal to h / b = 0.01 . Without the offset, the minimum point on the wing could become unrealistically close to the ground.
Finally, the third constraint ensured that the section lift coefficient did not go above a set stall lift coefficient of C ˜ L = 1.4 . All results utilized a thin airfoil which has no stall prediction, but without this constraint, it was observed that the wing optimized to a shape where the root section produced the vast majority of the total lift coefficient and would likely be stalled, while most of the wing towards the tips produced almost no lift. It was then determined that this constraint was necessary to produce realistic lift distributions. This was set as an inequality constraint that was satisfied if the section lift was below the stall limit. This constraint was not a limiting factor for the results shown.
When adding constraints, it is possible for the optimizer to prioritize the constraint equation over the objective function. This may happen if the objective function value is significantly smaller than the constraint value as well as if the optimization and constraint equation tolerances are not chosen appropriately. If a constraint has been satisfied and has a restrictive tolerance compared to the optimization tolerance, the optimization is more likely to terminate early without fully solving for the minimum solution. Because induced drag is much smaller than lift, especially in ground effect, the induced drag was multiplied by a factor of 10,000 and the optimization tolerance was set to 10 12 to ensure a fully optimized solution.

3. Results and Discussion

The following data presents the key findings based on the optimization process outlined in the methods section. First, the final results of the baseline wing are presented. Following the baseline data, results for varying values of h / b , R T , C L , and R A are presented, respectively, to show sensitivity of the baseline solution to these parameters. Plots are provided showing how the total induced drag changes with each nondimensional parameter. Unless otherwise specified, each simulation uses the section dihedral and twist control points defined in Figure 8. Each optimized wing shape is plotted using the height of the quarter chord above the ground plane.

3.1. Baseline Wing

This section presents data for a wing with the nondimensional parameters defined in Table 1. It is important to note that the baseline height of h / b = 0.25 is chosen in order to analyze a wing with the larger section dihedral changes that result when closer to the ground. The other baseline parameters are arbitrarily chosen as common values within the median of the design space. The resulting optimal wing shape and corresponding dihedral distribution for the baseline wing are given in Figure 10. The dihedral distribution is compared to the data found from optimizing a wing out of ground effect. For each plot, the horizontal axis shows the z location along the wing nondimensionalized by the wingspan. Because of this, the wingtips for a wing with a large dihedral distribution do not extend as far as a wing with no dihedral distribution.
First, in Figure 10a it can be seen that the optimal wing is a bell shape with portions of the wing nearly touching the ground plane at h / b = 0 . The corresponding dihedral distribution in Figure 10b shows that the wing root and tips have close to −5 degrees section dihedral. Towards the center of each semispan, the section dihedral increases significantly to values of around −60 degrees. This is different than the optimal dihedral distribution for a wing out of ground effect, which is essentially zero across the entire wingspan.

3.2. Design Space Analysis

3.2.1. Influence of h / b

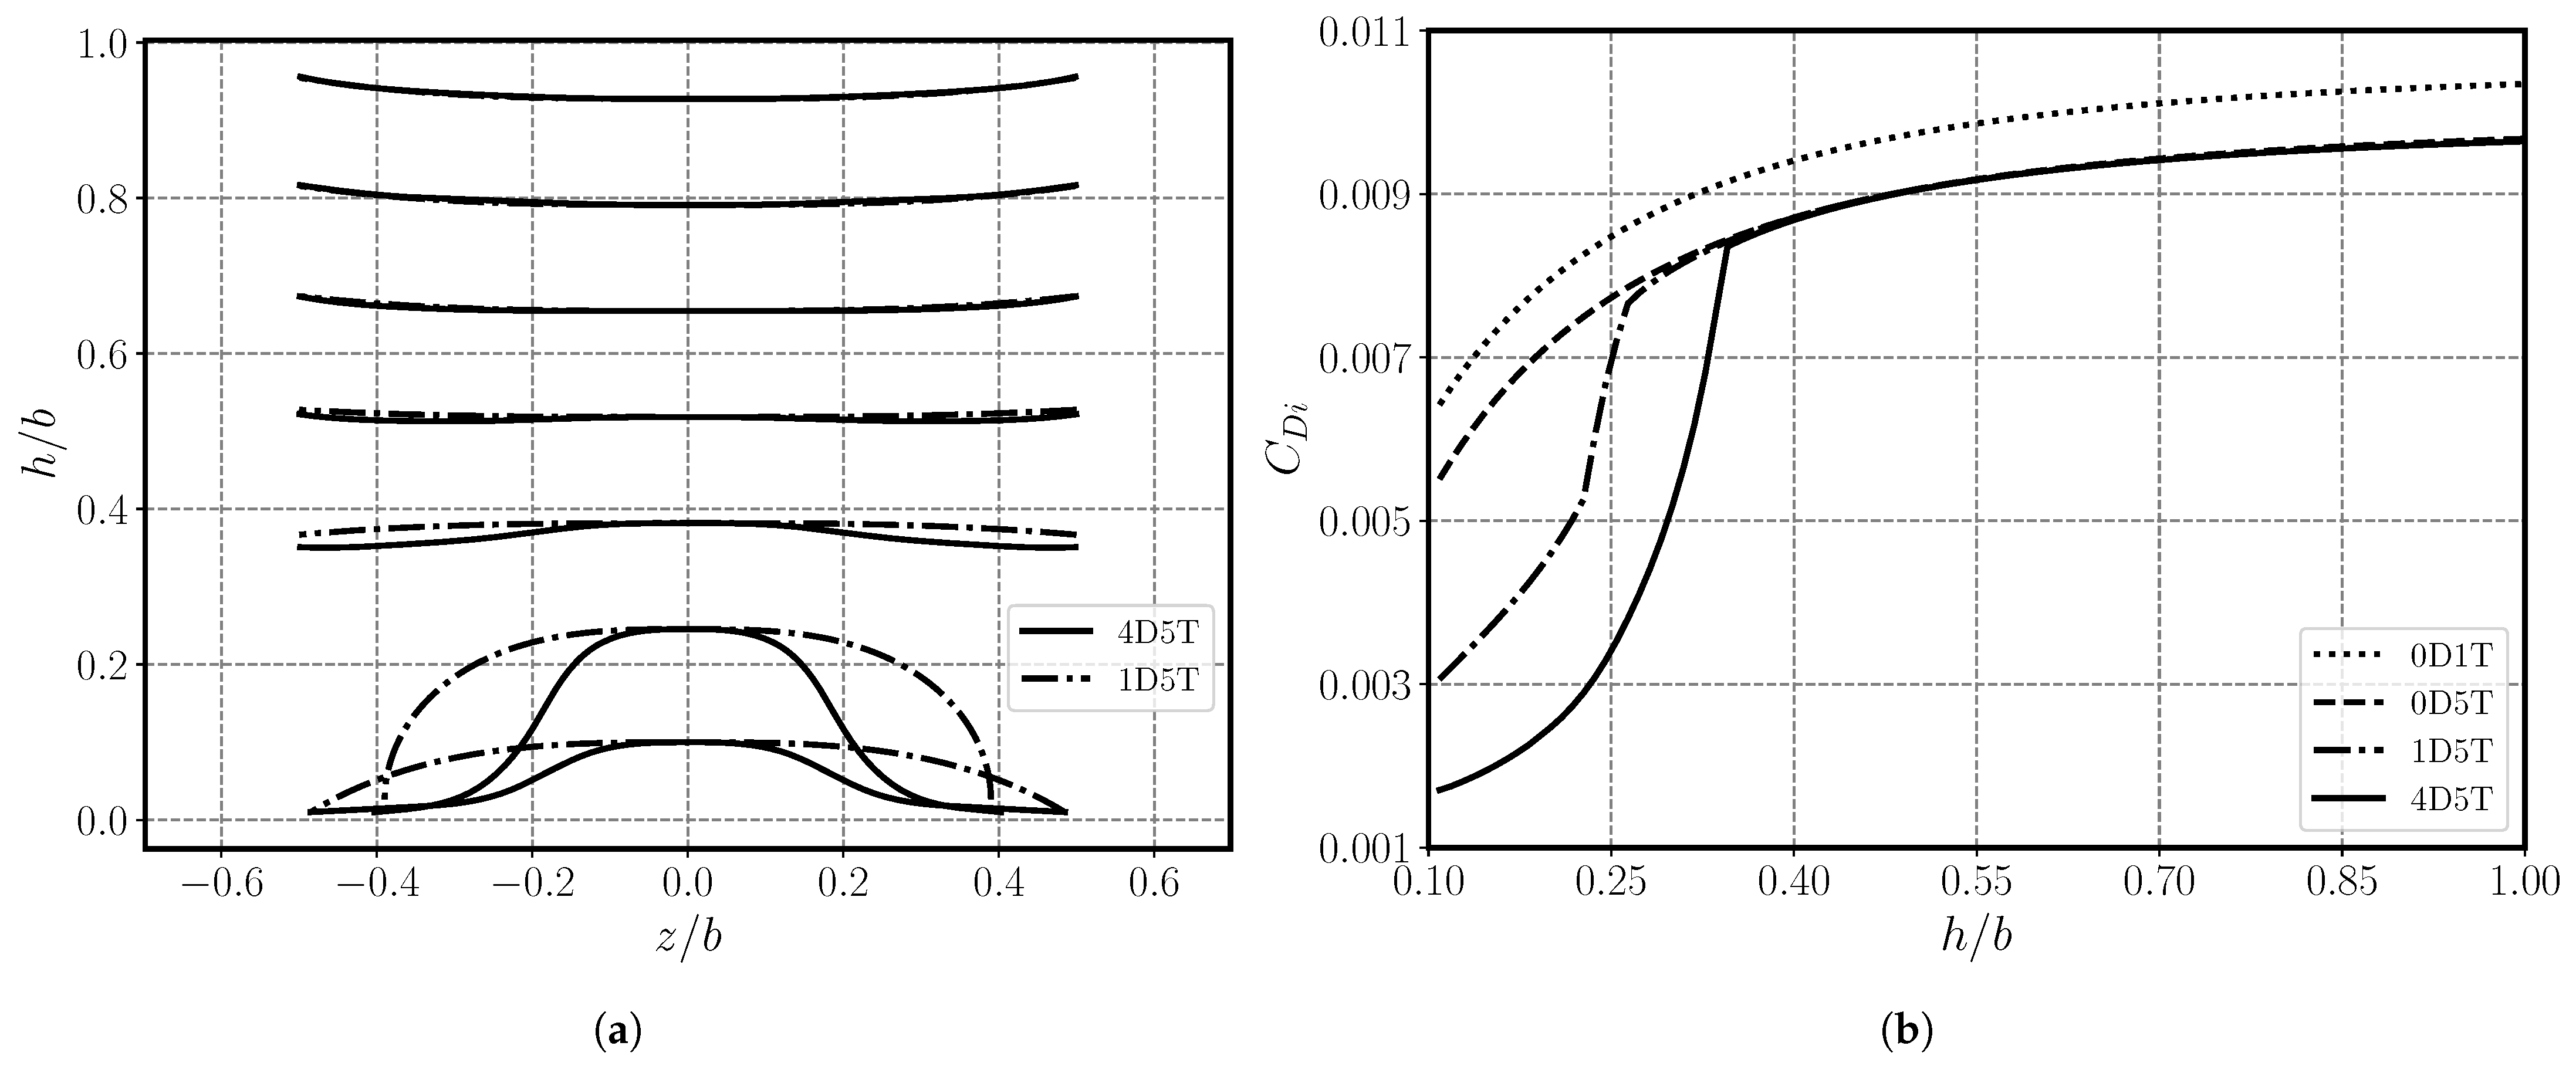
The baseline wing from Table 1 was adjusted by changing the height using 100 evenly spaced values from h / b = 0.1 to h / b = 1.0 . Along with the 4D5T wing defined in the grid convergence section, the influence of h / b is shown in comparison to three other wings defined with various control point configurations. The first is a wing with the same number of twist control points but only a single section dihedral control point at the tip. Two datasets are also represented for a wing with no dihedral distribution. The first shows a wing with the same number of twist control points as the standard, and the second maintains a constant mounting angle across the entire wingspan. Table 2 shows how both the dihedral and twist distributions are controlled along with the identifier associated with each case. Figure 11a shows the optimal wing shapes for a 4D5T and 1D5T wing at a few select heights, while Figure 11b shows how the induced drag on all wing configurations changes as a function of h / b .
In Figure 11b, the 0D5T wing is able to optimize for twist at the same control points as the 4D5T wing. The 0D1T does not have any washout distribution but is still able to alter the twist at the root in order to maintain the target lift coefficient. Even without a dihedral distribution, these two datasets show a continuous decrease in induced drag as the wing is lowered closer to the ground plane. This matches results of previous studies [31].
For the 1D5T and 4D5T wings, both with a dihedral distribution applied, there is a sharp corner point that corresponds to a change in optimal geometry. For the 4D5T wing, when h / b < 0.34 , Figure 11a shows that the wing geometry produces a large bell-shaped distribution with the wing tips nearly touching the ground plane. Above the critical height, the geometry still appears to produce a bell shape, but the wing tips no longer touch the ground and the section dihedral angles are much smaller. The 1D5T wing has a critical point at approximately h / b = 0.26 , where values of h / b less than the critical value produce shapes with wingtips approaching the ground, similar to the 4D5T wing. Above each respective critical height, the 4D5T and 1D5T wings produce similar distributions. As seen in Figure 11b, compared to a wing with an optimal twist distribution and no dihedral distribution, there is no significant difference in induced drag between the 0D5T, 1D5T, and 4D5T wings when h / b is greater than the critical height. Below this height, the wings with an optimal dihedral distribution produce significantly less induced drag.
The wing shapes produced by the 1D5T wing would likely be more realistic from a manufacturing and structural perspective compared to the 4D5T wing. The shapes produced by the 1D5T wing appear to resemble the general trends found by Jesudasan et al. [16] , who used a vortex lattice method for a related study. On both the 1D5T and 4D5T wings, it appears that below a certain height, the optimized solution results in wingtips nearly touching the ground. This is likely to reduce the wingtip vortices which contribute to the overall downwash.

3.2.2. Influence of Taper Ratio, R T

A total of 100 taper ratios were tested with evenly spaced values between R T = 0.2 and R T = 1.0 . Figure 12a shows the optimal wing shape for a few select taper ratios of R T = 0.4 , R T = 0.8 , and the baseline taper ratio of R T = 1.0 . Figure 12b shows a plot of the total induced drag as a function of taper ratio for each tested value.
Figure 12a shows that, regardless of the taper ratio, the final optimized wing shapes are nearly identical. In Figure 12b, the difference in induced drag between R T = 0.2 and R T = 1.0 is approximately 0.0001. This implies that the taper ratio has little to no impact on the optimal lift distribution in ground effect.

3.2.3. Influence of Lift Coefficient, C L

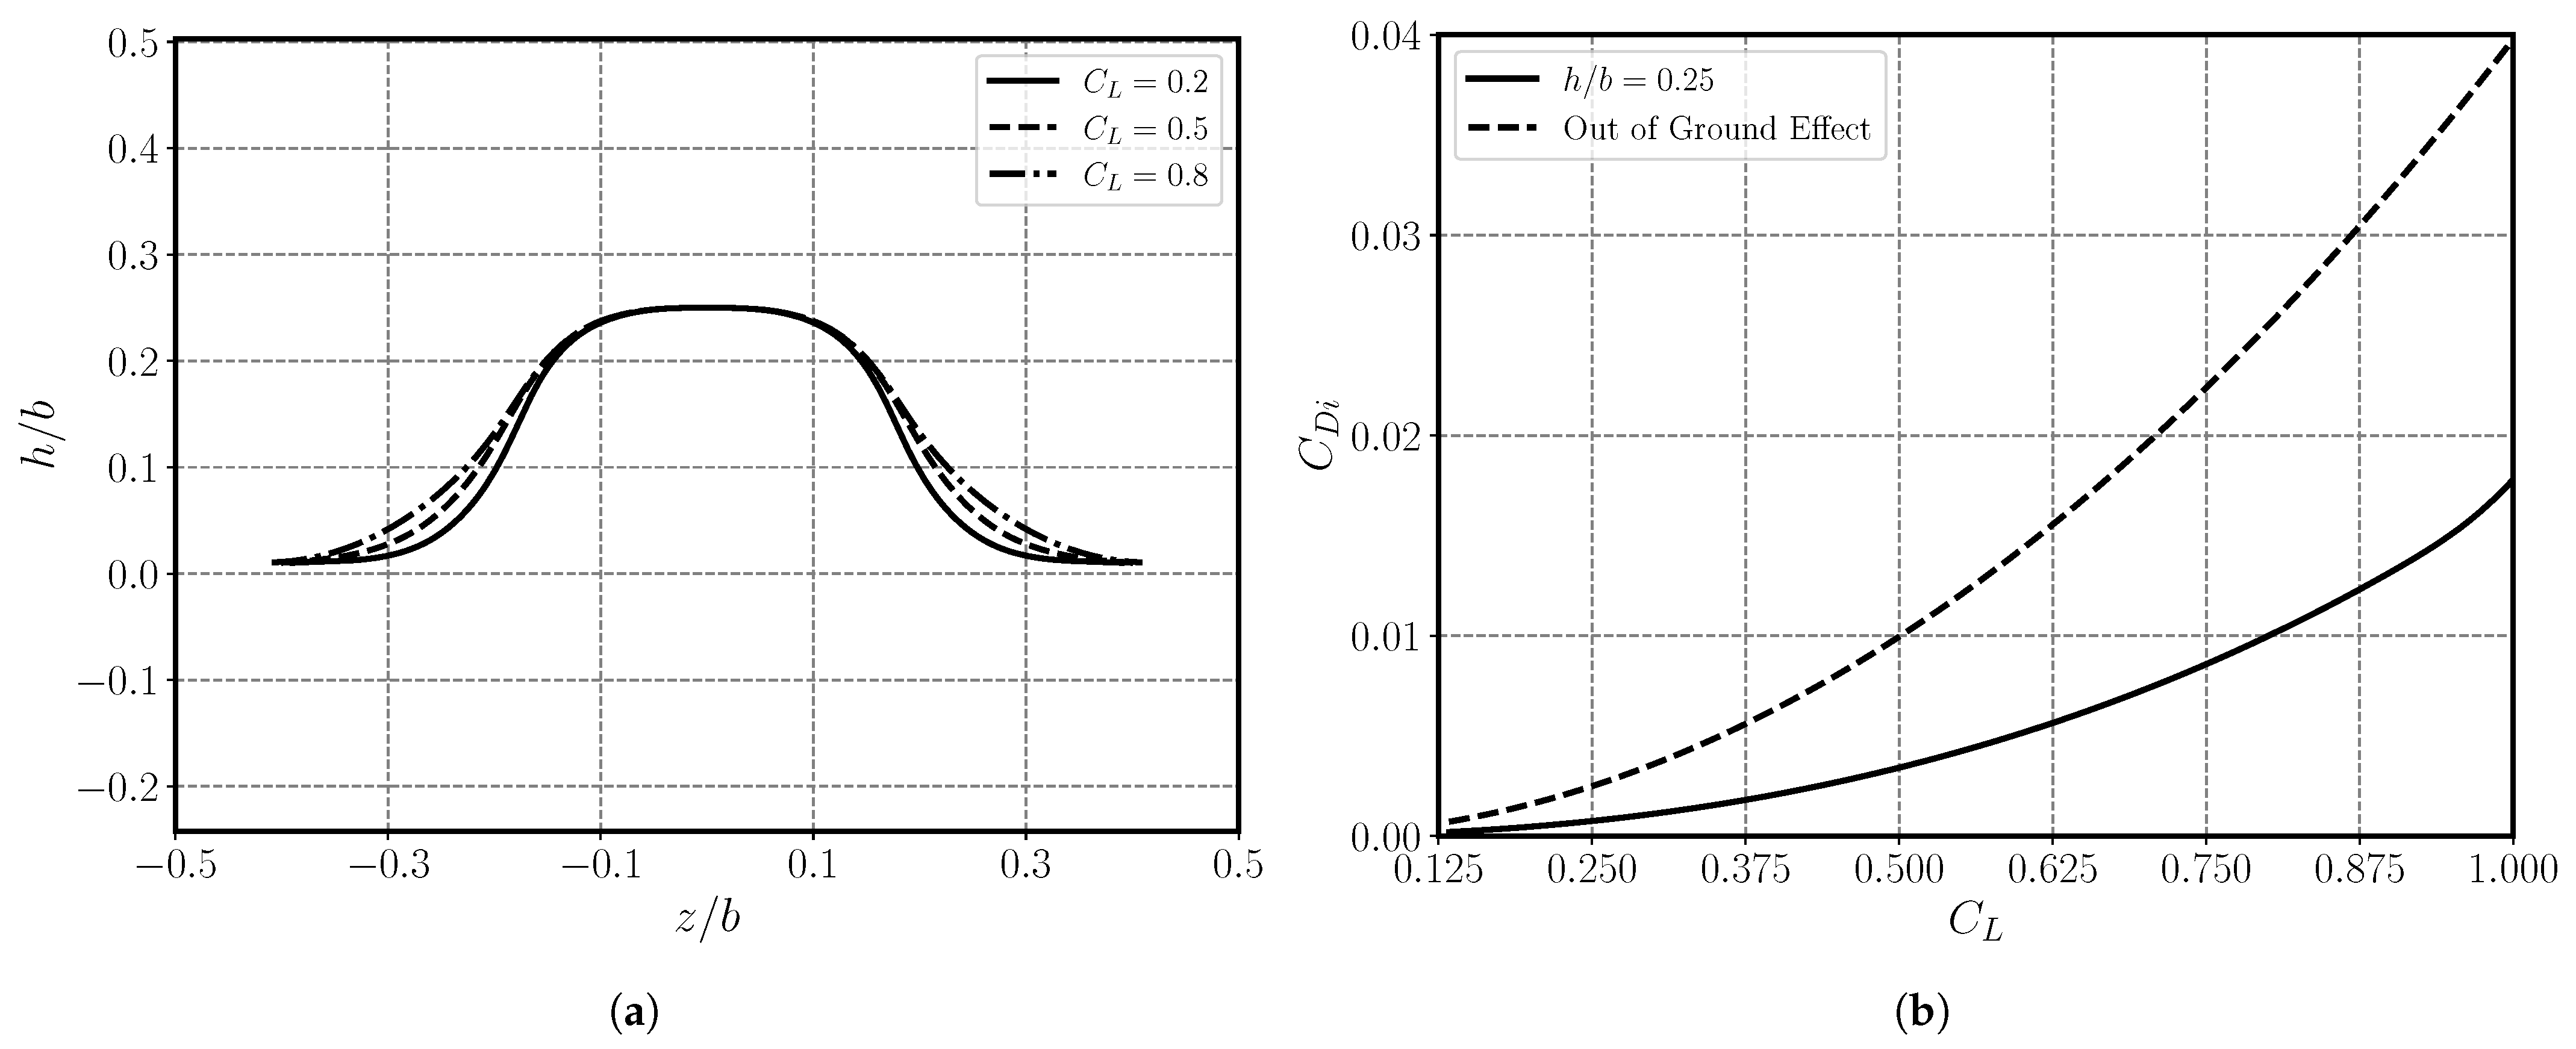
This study was repeated over a range of wing lift coefficients from C L = 0.125 to C L = 1.0 . This range was limited to a maximum lift coefficient of C L = 1.0 because anything higher than a target lift coefficient of 1.0 would likely require portions of the lift distribution to be at or greater than the set stall section lift coefficient of C ˜ L = 1.4 . Figure 13 shows the final results for the optimal wing geometry and induced drag as a function of C L . Along with a baseline value of C L = 0.5 , Figure 13a shows the optimized wing shapes at values of C L = 0.2 and C L = 0.8 . Figure 13b gives a relationship between the various lift and induced drag coefficients using all 100 of the tested values. This is in comparison to an elliptic wing with optimal induced drag outside of ground effect given by the equation
C D i = C L 2 π R A ( 1 + κ D )
where κ D is the induced drag factor. This factor corresponds to the percentage increase of the total induced drag compared to an optimal wing. For an elliptic wing out of ground effect, κ D = 0 .
The wing shapes in Figure 13a for various values of C L are relatively similar, although the center of each semispan drops closer to the ground plane for lower values of C L . It is important to note that this could potentially be due to the constraints which prevent the leading or trailing edge from descending below the ground plane as well as the constraint to prevent section stall. The section twist must increase in order to achieve higher lift coefficients. Therefore, the trailing edge of the wing will naturally be closer to the ground. In order to meet both the section lift constraint and the minimum height constraint, the optimal wing geometry may have portions of the wing higher above the ground at larger lift coefficients.
Figure 13b shows that the optimal lift and induced drag in ground effect have a nearly parabolic relationship, similar to the relationship for a wing outside of ground effect. By fitting a quadratic equation to the data, a value of κ D = 0.4345 was calculated. This shows that for a wing in ground effect with R A = 8 , there is an approximately 43 % decrease in induced drag compared to the optimal wing outside of ground effect.

3.2.4. Influence of Aspect Ratio, R A

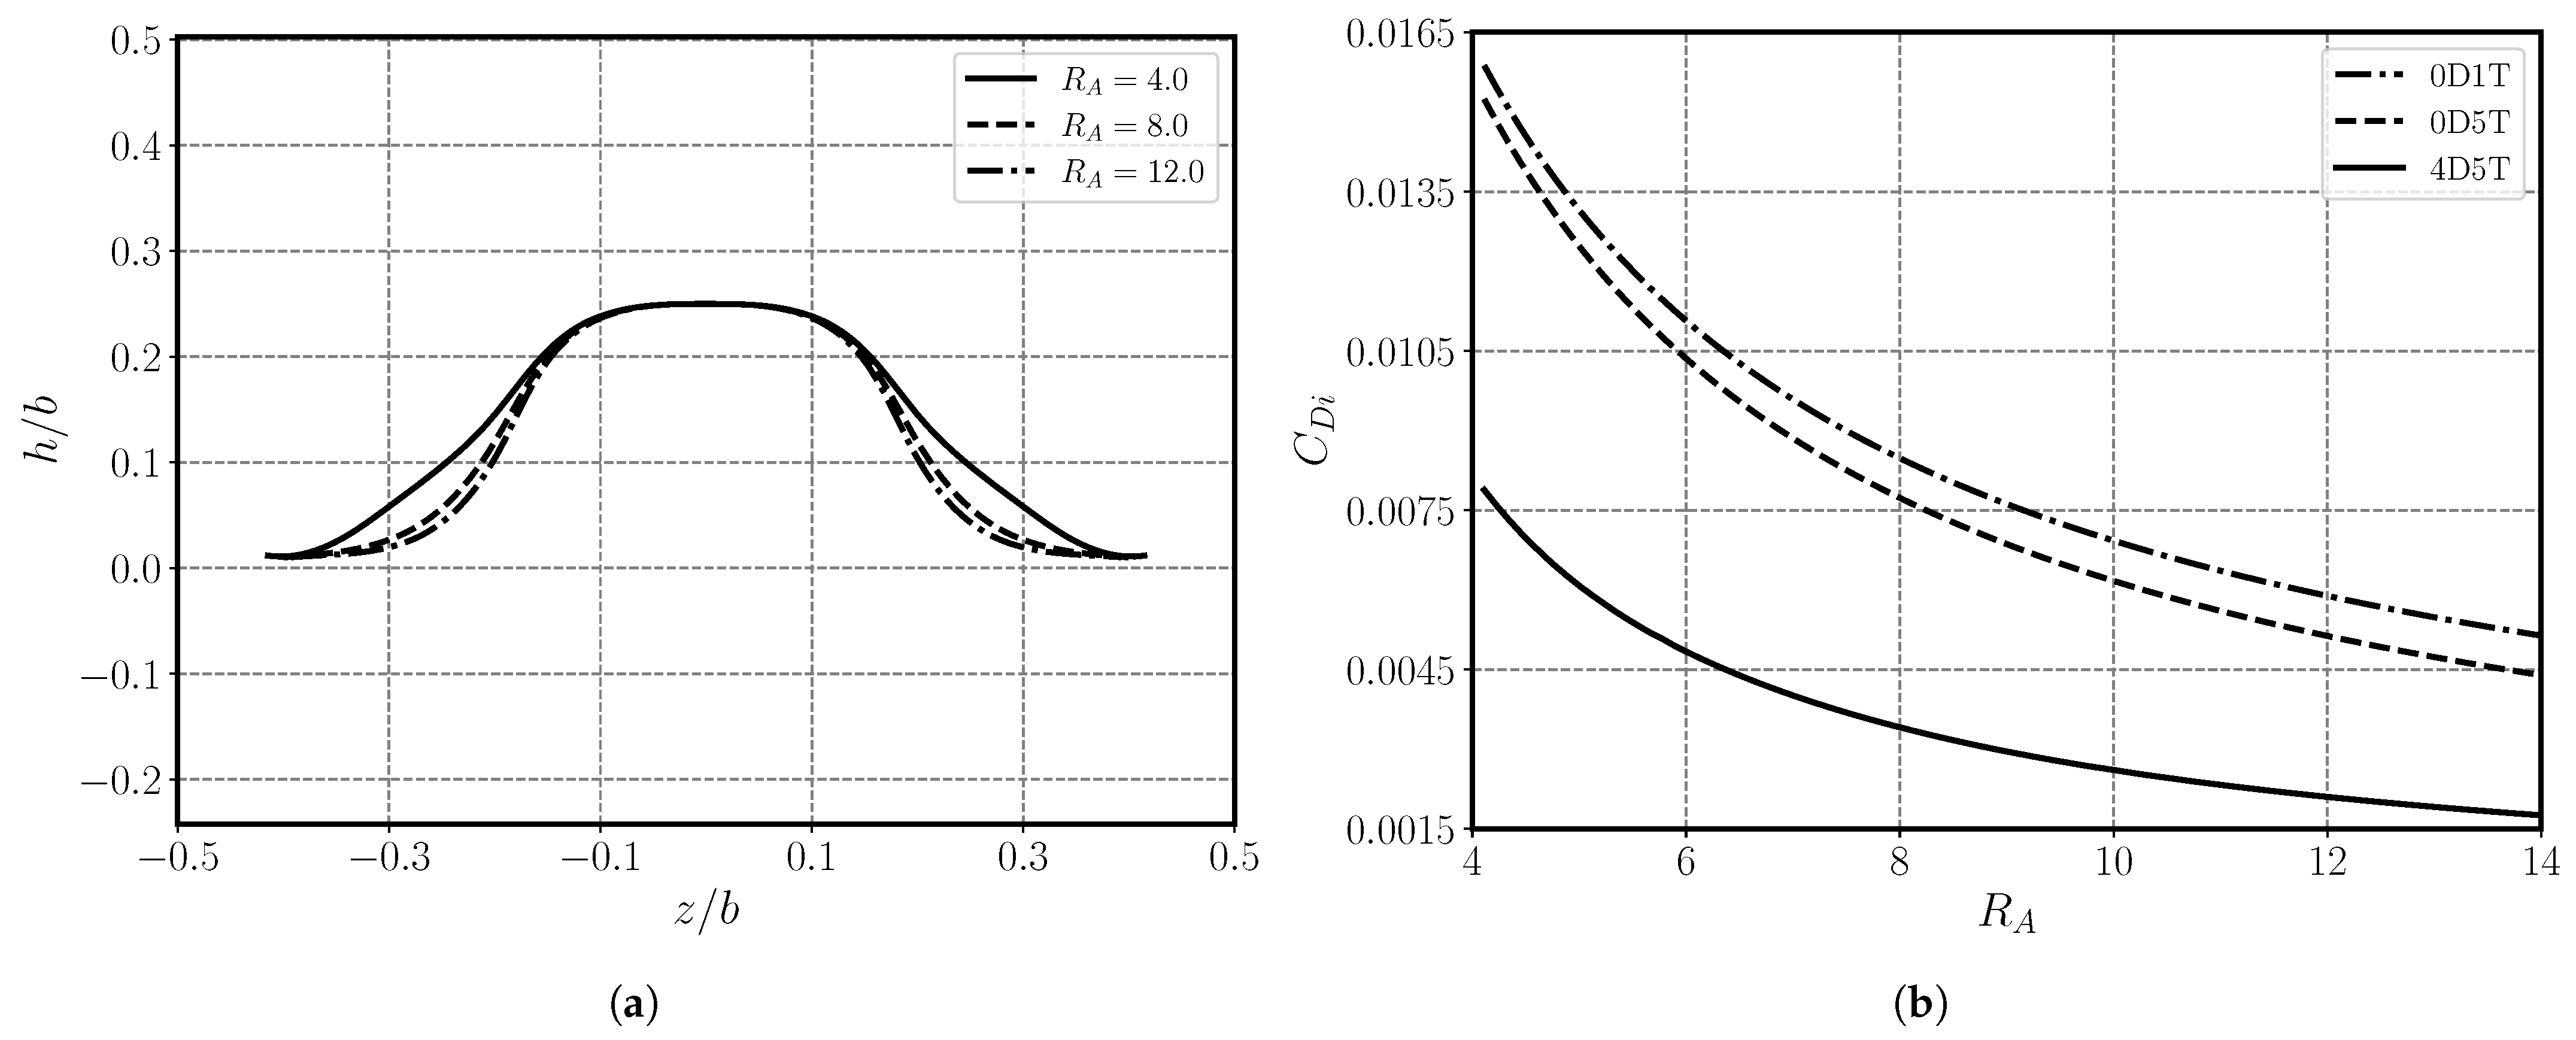
A total of 100 different aspect ratios were tested between R A = 4.0 and R A = 14.0 . An aspect ratio of 4.0 is approximately the minimum limit for where lifting-line theory is valid, so anything below this value was not tested. Figure 14a shows the final optimized geometry for a wing with values of R A = 4.0 and R A = 12.0 in comparison to the baseline of R A = 8.0 . Figure 14b shows how the induced drag changes as a function of the aspect ratio for three control point configurations. Compared to the 0D1T wing with constant twist and no dihedral distribution, a percent reduction in induced drag was calculated for the 0D5T and 4D5T wing. Figure 15 shows the percent induced drag reduction as a function of the aspect ratio.
In Figure 14a, lower aspect ratios optimize to geometries where portions of the wing semispan are higher above the ground. As the aspect ratio is increased, a smaller section lift coefficient at each lifting-line node is needed to reach the total wing lift coefficient. Therefore, a wing with higher aspect ratio is able to have portions of the semispan closer to the ground before stalling. The data shown in Figure 14b shows that increasing the aspect ratio corresponds to a decrease in the induced drag. This is expected, since this is what lifting-line theory predicts when out of ground effect [19,20].
Figure 15 shows the percent reduction in induced drag for a 0D5T and 4D5T wing compared to the 0D1T wing with no twist or dihedral distributions. From the results, it can be seen that the 0D5T wing with an optimal twist distribution and no dihedral distribution creates a slight reduction in induced drag compared to a wing with constant twist. This correlates closely to what would be expected for a wing with optimal twist outside of ground effect. When adding an optimal dihedral distribution, the percent reduction in induced drag compared to the 0D1T wing becomes significantly larger. For R A = 4.0 , there is a 50% reduction in induced drag which increases to 66% for R A = 14.0 . At an aspect ratio of R A = 8.0 , the percent reduction in induced drag for a 4D5T wing compared to the 0D5T wing is approximately 50%. The reader is reminded that the present study includes only an estimate for the change in induced drag. The change in total drag in real-world scenarios would be impacted by viscosity in the flow, including viscous boundary layers on both the wing and the surface of the ground. Hence, real-world reductions in total drag would differ from those shown here.
The research performed by Torenbeek [32] as well as Phillips and Hunsaker [27], suggests that the ground effect influence ratio is a function of C L and R A , not just h / b . The results presented in this paper support this conclusion.

4. Summary and Conclusions

An aircraft flying close to the ground can experience a significant reduction in induced drag due to interaction of the shed vorticity with the ground. All aircraft temporarily experience ground effect during take-off and landing, but this phenomenon has also created a basis for the design and manufacture of ground-effect vehicles (GEVs). It has also been observed that some species of birds tend to droop their wings when gliding over water or flying close to the ground. This research was inspired by this avian behavior to determine the optimal dihedral distribution on a lifting surface when in ground effect. MachUp Pro, which implements a numerical lifting-line solver, was utilized to find the forces and moments on a wing modeled in ground effect.
This research utilized the SLSQP optimization algorithm. For this optimization problem, the objective function calculated the induced drag by using an input of the section twist and dihedral angles at defined control points. The design space was restricted by implementing three separate constraints in order to achieve realistic results. The first constraint forced the wing to maintain a constant defined lift coefficient. The optimizer was allowed to change the twist at each control point until this was achieved. Second, a constraint was applied to prevent the lifting surface from crossing the ground plane. Finally, the third constraint prevented any portion of the wing from using a section lift coefficient higher than 1.4.
Starting with a baseline wing, the parameter h / b was altered using values between h / b = 0.1 and h / b = 1.0 . Below a certain height, the wings optimized to a distinct bell shape. At higher values, the optimal wings still showed a bell shape but with much smaller section dihedral angles. Rather than a smooth transition between the two shapes at different heights, there was a large jump corresponding to a corner point when comparing h / b with the induced drag. This data was also shown in comparison to a wing which used the same number of twist control points but only allowed for the section dihedral to change at the wing tip. The minimum induced drag varied, but the general trend stayed the same. This data is also shown in comparison to wings with no dihedral distribution.
Similar studies were performed by altering the other non-dimensional parameters, R T , C L , and R A . Figure 15 shows that if an optimal dihedral distribution is used, the induced drag can be significantly decreased relative to a wing with no dihedral distribution. For example, on a wing with both optimal twist and optimal dihedral distributions, there can be a reduction in drag of between 50 and 70 percent over a range of aspect ratios. The taper ratio did not appear to have any significant affect on the optimal geometry. The optimum dihedral distributions were only a weak function of lift coefficient and aspect ratio.
These results can be used in the early phases of aircraft design for GEVs. For example, many current GEVs apply some form of negative dihedral distribution similar to that shown in Figure 11a for a wing with one dihedral control point. However, Figure 11b shows that, compared to an optimal twist distribution, an optimal dihedral distribution with one control point provides no benefits to induced drag unless h / b is less than 0.25. For a wing with four dihedral control points, there is no benefit unless h / b is less than 0.3. In both cases, the optimal wing below these heights has wingtips nearly touching the ground. For a GEV designed to travel over land, an optimal dihedral distribution is likely impractical due to the possibility for the wings to hit the ground. Many GEVs are designed to travel over water, which would make an optimal dihedral distribution a more realistic option. Overall, a designer would need to take into account various flight conditions, such as the possibility of cross wind or an uneven ground when determining the height at which the aircraft flies. Depending on the expected height of the aircraft, a designer may determine that incorporating a dihedral distribution does not provide sufficient benefit considering other design constraints such as the stability and maneuverability of the aircraft.
Although lifting-line theory has limitations, it is very useful for rapidly producing large datasets and can be used in an optimization framework for producing and assessing design trends. It is suggested that future research involve comparing these results to those obtained using higher fidelity aerodynamic modeling methods. It would also be beneficial to extend this research using multi-objective optimization to account for other design parameters such as structural characteristics and stability.

Author Contributions

Conceptualization, D.F.H.; methodology, A.K.O., Z.S.M. and D.F.H.; software, A.K.O. and Z.S.M.; validation, A.K.O.; formal analysis, A.K.O.; investigation, A.K.O.; resources, D.F.H.; data curation, A.K.O.; writing—original draft preparation, A.K.O.; writing—review and editing, A.K.O., Z.S.M. and D.F.H.; visualization, A.K.O.; supervision, D.F.H.; project administration, D.F.H. and Z.S.M.; funding acquisition, D.F.H. and A.K.O. All authors have read and agreed to the published version of the manuscript.

Funding

This research was partially funded by the Utah State University EURP scholars program, Cohort 19 Admitted Fall 2022.

Data Availability Statement

The raw data supporting the conclusions of this article will be made available by the authors on request.

Conflicts of Interest

The authors declare no conflicts of interest.

Nomenclature

AFourier coefficient
bWingspan
C D i Induced drag coefficient
C L Lift coefficient
C ˜ L Section lift coefficient
C ˜ L , α Section lift slope
cChord
d F Local lift force vector
d l Bound vortex filament length
d S Local planform area
GCirculation
gShed vorticity
hWing height above ground
jLifting-line node index
kVortex filament index
L ˜ Local lift force
N v Number of lifting-line control points
N Γ Number of section dihedral control points
qConstraint function
R A Aspect ratio
R T Taper ratio
u Local freestream unit vector
V Freestream velocity
V Velocity vector
zSpanwise coordinate
x Objective function optimization variable
α Geometric twist
α L 0 Zero-lift angle of attack
Γ section Dihedral angle
δ Flap deflection
ε Error percentage
θ Change of variables for spanwise coordinate
κ D Induced drag factor
ν Influence vector
ρ Air density

References

  1. Olsen, A.K.; Montgomery, Z.S.; Hunsaker, D.F. Lifting-Line Predictions for Optimal Dihedral Distributions in Ground Effect. In Proceedings of the AIAA SciTech 2025 Forum, Orlando, FL, USA, 6–10 January 2025. [Google Scholar] [CrossRef]
  2. Jamei, S.; Maimun, A.; Mansor, S.; Sidik, N.A.C. Numerical Investigation on Aerodynamic Characteristics of a Compound Wing-in-Ground Effect. J. Aircr. 2012, 49, 1297–1305. [Google Scholar] [CrossRef]
  3. Phillips, W.F. Ground Effect, Elevator Sizing, and CG Limits. In Mechanics of Flight, 2nd ed.; John Wiley & Sons, Inc.: Hoboken, NJ, USA, 2010; Chapter 6; pp. 646–661. [Google Scholar]
  4. Rozhdestvensky, K.V. Wing-in-ground effect vehicles. Prog. Aerosp. Sci. 2006, 42, 211–283. [Google Scholar] [CrossRef]
  5. Dakhrabadi, M.T.; Seif, M. Influence of main and outer wings on aerodynamic characteristics of compound wing-in-ground effect. Aerosp. Sci. Technol. 2016, 55, 177–188. [Google Scholar] [CrossRef]
  6. Ahmed, M.R.; Sharma, S.D. An investigation on the aerodynamics of a symmetrical airfoil in ground effect. Exp. Therm. Fluid Sci. 2005, 29, 633–647. [Google Scholar] [CrossRef]
  7. Qu, Q.; Wang, W.; Liu, P.; Agarwal, R.K. Airfoil Aerodynamics in Ground Effect for Wide Range of Angles of Attack. AIAA J. 2015, 53, 1048–1061. [Google Scholar] [CrossRef]
  8. Yun, L.; Bliault, A.; Doo, J. WIG Craft and Ekranoplan: Ground Effect Craft Technology; Springer: Berlin/Heidelberg, Germany, 2010. [Google Scholar]
  9. De Divitiis, N. Performance and stability of a winged vehicle in ground effect. J. Aircr. 2005, 42, 148–157. [Google Scholar] [CrossRef]
  10. Boschetti, P.J.; Cardenas, E.M. Ground effect on the longitudinal stability of an unmanned airplane. In Proceedings of the 50th AIAA Aerospace Sciences Meeting Including the New Horizons Forum and Aerospace Exposition, Nashville, TN, USA, 9–12 January 2012; p. 1051. [Google Scholar] [CrossRef]
  11. Molina, J.; Zhang, X. Aerodynamics of a Heaving Airfoil in Ground Effect. AIAA J. 2011, 49, 1168–1179. [Google Scholar] [CrossRef]
  12. He, W.; Guan, Y.; Theofilis, V.; Li, L.K.B. Stability of Low-Reynolds-Number Separated Flow Around an Airfoil Near a Wavy Ground. AIAA J. 2018, 57, 29–34. [Google Scholar] [CrossRef]
  13. Qu, Q.; Lu, Z.; Liu, P.; Agarwal, R.K. Numerical Study of Aerodynamics of a Wing-in-Ground-Effect Craft. J. Aircr. 2014, 51, 913–924. [Google Scholar] [CrossRef]
  14. Zhi, H.; Xiao, T.; Deng, S.; Tong, M.; Chen, P.; Wu, B. Distinct Wing-in-Ground Effect of Airfoil in Proximity to Water Waves. AIAA J. 2022, 60, 3789–3804. [Google Scholar] [CrossRef]
  15. Church, K.; Hunsaker, D.F. Lifting-Line Predictions for Lift and Twist Distributions to Minimize Induced Drag in Ground Effect. In Proceedings of the AIAA SCITECH 2023 Forum, National Harbor, MD, USA & Online, 23–27 January 2023; p. 1574. [Google Scholar]
  16. Jesudasan, R.; Hanifi, A.; Mariani, R. Investigating Planar and Nonplanar Wing Planform Optimisation for Ground Effect Aircraft. Aerospace 2023, 10, 969. [Google Scholar] [CrossRef]
  17. Park, K.; Lee, J. Influence of endplate on aerodynamic characteristics of low-aspect-ratio wing in ground effect. J. Mech. Sci. Technol. 2008, 22, 2578–2589. [Google Scholar] [CrossRef]
  18. Lee, J.; Han, C.s.; Bae, C.H. Influence of Wing Configurations on Aerodynamic Characteristics of Wings in Ground Effect. J. Aircr. 2010, 47, 1030–1040. [Google Scholar] [CrossRef]
  19. Prandtl, L. Tragflügel Theorie. In Nachrichten von der Gesellschaft der Wisseschaften zu Göttingen; Geschäeftliche Mitteilungen, Klasse; Berlin Weidmannsche Buchhandlung: Berlin, Germany, 1918; pp. 451–477. [Google Scholar]
  20. Prandtl, L. Applications of Modern Hydrodynamics to Aeronautics; NACA TR-116: Göttingen, Germany, June 1921. Available online: https://ntrs.nasa.gov/citations/19930091180 (accessed on 26 August 2025).
  21. Prandtl, L. Uber Tragflugel kleinstein induzierten Widerstandes. Z. Flugtech. Mot. 1933, 24, 305–306. [Google Scholar]
  22. Kutta, M.W.K. Auftriebskräfte in Strömenden Flüssigkeiten. Illus. Aeronaut. Mitteilungen 1902, 6, 133–135. [Google Scholar]
  23. Joukowski, N.E. Sur les Tourbillons Adjionts. TRaraux Sect. Phys. Soc. Imp. Amis Sci. Nat. 1906, 13, 261–284. [Google Scholar]
  24. Phillips, W.; Snyder, D. Modern Adaptation of Prandtl’s Classic Lifting-Line Theory. J. Aircr. 2000, 37, 662–670. [Google Scholar] [CrossRef]
  25. Saffman, P.G. Vortex Dynamics; Cambridge University Press: Cambridge, UK, 1992; p. 02744. [Google Scholar]
  26. Li, Y.H.; Sun, S.L.; Ren, H.L.; Hu, J. Aero-elastic characteristics of a wing in different proximity to the free surface. Ocean Eng. 2025, 316, 119912. [Google Scholar] [CrossRef]
  27. Phillips, W.; Hunsaker, D. Lifting-Line Predictions for Induced Drag and Lift in Ground Effect. J. Aircr. 2013, 50, 1226–1233. [Google Scholar] [CrossRef]
  28. Valenzuela, J.V.; Takahashi, T.T. Wing Design Strategies for Vehicles Designed to Operate in Ground Effect. In Proceedings of the AIAA SCITECH 2024 Forum, Orlando, FL, USA, 8–12 January 2024; p. 0003. [Google Scholar] [CrossRef]
  29. Goates, C.D.; Hunsaker, D.F. Modern Implementation and Evaluation of Lifting-Line Theory for Complex Geometries. J. Aircr. 2022, 60, 490–508. [Google Scholar] [CrossRef]
  30. Kraft, D. A Software Package for Sequential Quadratic Programming; Tech. Rep. DFVLR-FB 88-28; DLR German Aerospace Center—Institute for Flight Mechanics: Koln, Germany, 1988. [Google Scholar]
  31. Sakornsin, R.; Thipyopas, C.; Atipan, S. Experimental Investigation of the Ground Effect of WIG Craft—NEW1 Model. In Proceedings of the Innovation Aviation & Aerospace Industry—International Conference 2020 (IAAI 2020), Chumphon, Thailand, 13–17 January 2020. [Google Scholar] [CrossRef]
  32. Torenbeek, E. Ground Effects. In Synthesis of Subsonic Airplane Design; Delft University Press: Delft, The Netherlands, 1982; pp. 551–554. [Google Scholar]
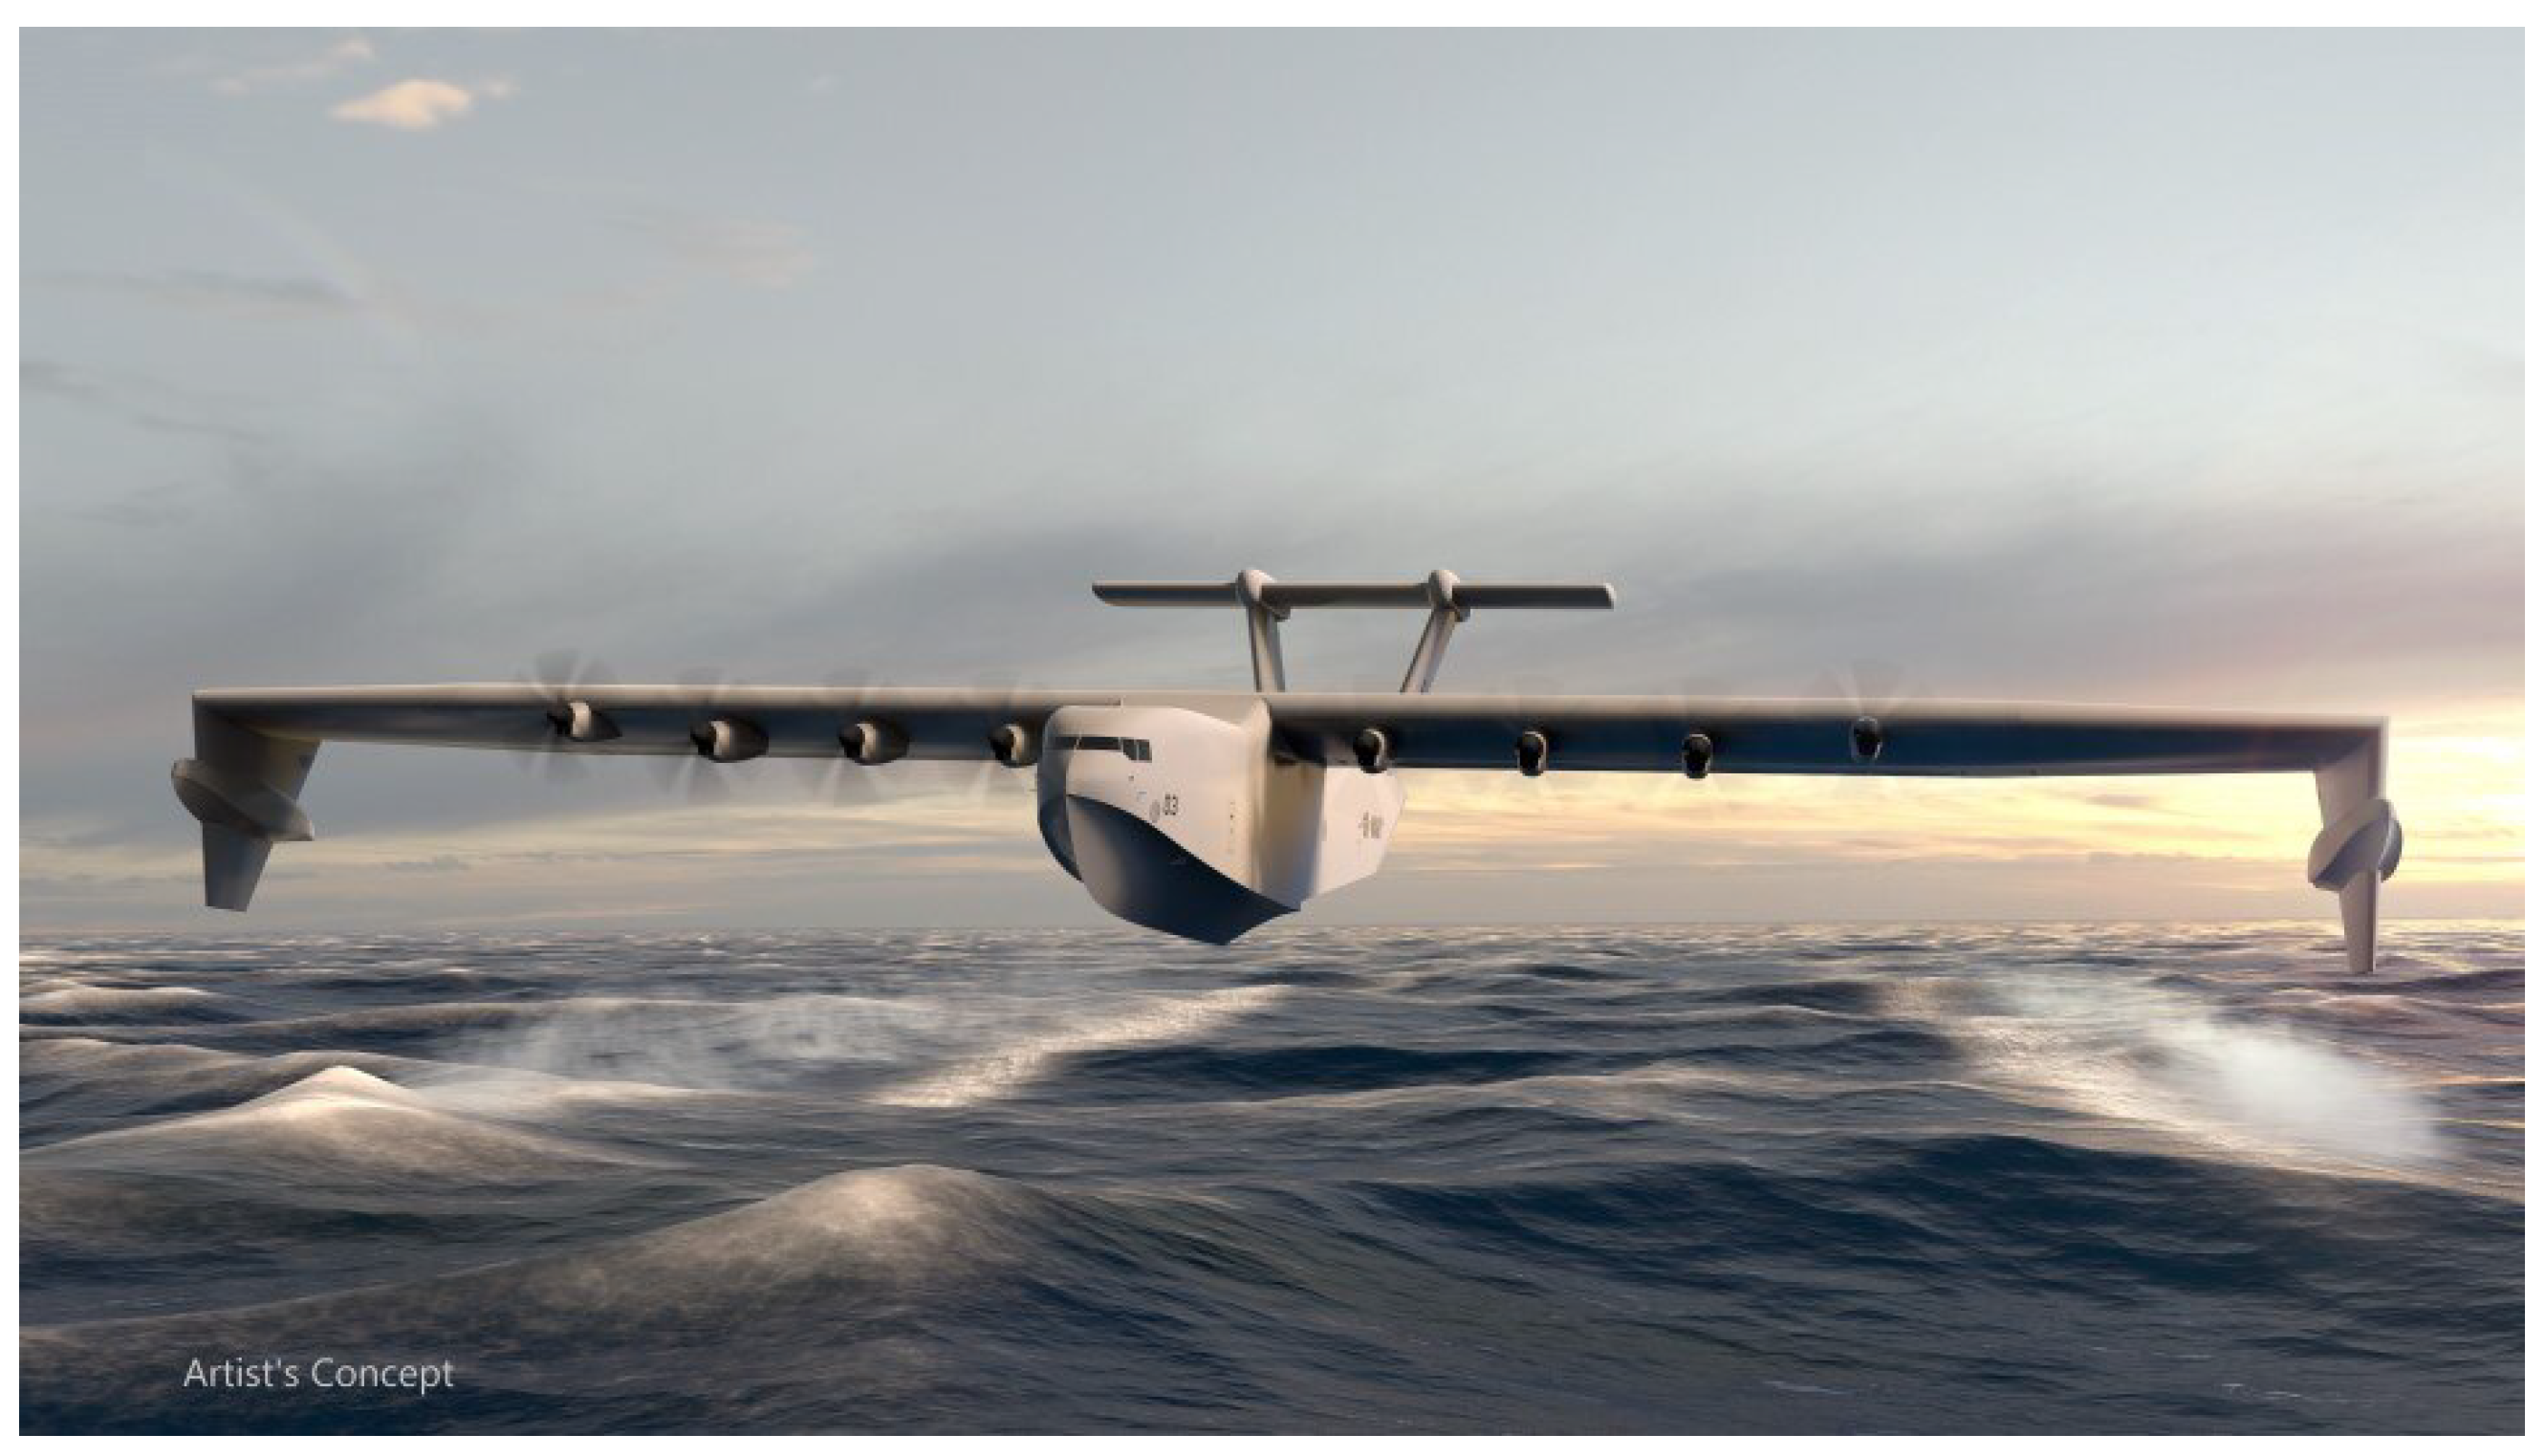
Figure 1. Liberty Lifter concept design (image within public domain).
Applsci 15 09558 g001
Figure 2. Drooped wings on an eagle flying in ground effect (photo courtesy of Steve Biro).
Applsci 15 09558 g002
Figure 3. Prandtl’s lifting-line model for a single finite wing with no sweep or dihedral distributions.
Applsci 15 09558 g003
Figure 4. Single horseshoe filament for numerical lifting-line analysis.
Applsci 15 09558 g004
Figure 5. Mirrored wing for simulating ground effect.
Applsci 15 09558 g005
Figure 6. Grid convergence results for the numerical lifting-line method: (a) Induced drag as a function of N v . (b) Percent error as a function of N v .
Applsci 15 09558 g006
Figure 7. Grid convergence results for increasing section dihedral and twist control points.
Applsci 15 09558 g007
Figure 8. Section dihedral and twist control points for a 4D5T wing.
Applsci 15 09558 g008
Figure 9. Wing section geometry at a given dihedral angle.
Applsci 15 09558 g009
Figure 10. Optimal distributions for the baseline wing in and out of ground effect: (a) Optimized baseline wing shape. (b) Optimal baseline dihedral distribution.
Applsci 15 09558 g010
Figure 11. Optimal results for a range of h / b values at R T = 1.0 , C L = 0.5 , and R A = 8.0 . (a) Optimized 4D5T and 1D5T wing shapes. (b) Minimum induced drag.
Applsci 15 09558 g011
Figure 12. Optimal results for a range of R T values at h / b = 0.25 , C L = 0.5 , and R A = 8.0 . (a) Wing shapes. (b) Minimum induced drag.
Applsci 15 09558 g012
Figure 13. Optimal results for a range of C L values at h / b = 0.25 , R T = 1.0 , and R A = 8.0 . (a) Wing shapes. (b) Minimum induced drag.
Applsci 15 09558 g013
Figure 14. Optimal results for a range of R A values at h / b = 0.25 , R T = 1.0 , and C L = 0.5 . (a) Wing shapes. (b) Minimum induced drag.
Applsci 15 09558 g014
Figure 15. Percent induced drag reduction for a 0D5T and 4D5T wing.
Applsci 15 09558 g015
Table 1. Baseline wing coefficients.
CoefficientValue
h / b 0.25
R T 1.0
C L 0.5
R A 8.0
Table 2. Dihedral and twist distributions for all wing configurations.
NameDihedral DistributionTwist Distribution
0D1Tnoneat root
0D5Tnoneoptimal
1D5Tat tipoptimal
4D5Toptimaloptimal
Disclaimer/Publisher’s Note: The statements, opinions and data contained in all publications are solely those of the individual author(s) and contributor(s) and not of MDPI and/or the editor(s). MDPI and/or the editor(s) disclaim responsibility for any injury to people or property resulting from any ideas, methods, instructions or products referred to in the content.