1. Introduction
A significant transformation in the space sector is the increasing participation of private investors in an industry that was once exclusively funded by public investments. One motivation for this change is the emergence of space tourism, which calls for comfortable and visually attractive environments. Recent initiatives include observatories with large transparent surfaces, providing not only a unique viewing experience but also a powerful marketing advantage, as they offer stunning views of Earth and outer space from low orbits.
These transparent components are engineered as slender, lightweight structures to reduce mass—a critical requirement for space applications. However, their thin profiles and large surface areas make them susceptible to thermal gradients, which can degrade mechanical performance while also inducing high thermal stresses. These factors present major challenges to structural stability. Addressing these issues is at the forefront of current research in aerospace engineering, particularly in the analysis, modeling, and optimization of slender structures operating in extreme environments.
To date, spacecraft glazing systems have predominantly utilized two materials: fused silica and acrylic glass.
Fused silica (FS) has been used since the Project Mercury (1958–1963), in the form of very small circular multilayered windows, composed of panes of FS with high silica content and tempered glass [
1,
2]. The Gemini capsules (1961–1966) introduced improved glazing, made of a multilayer assembly consisting of three FS panes [
2,
3], to enhance durability, transparency, and thermal insulation. The Apollo Command Modules, including the most famous Apollo 11 (1969), had five windows as part of the spacecraft’s primary pressure vessel (habitable), made of multilayered assemblies combining an outer fused silica pane, and two inner panes made of aluminosilicate glass [
4,
5], with structural and heat-shield function, to enable Earth and lunar observation.
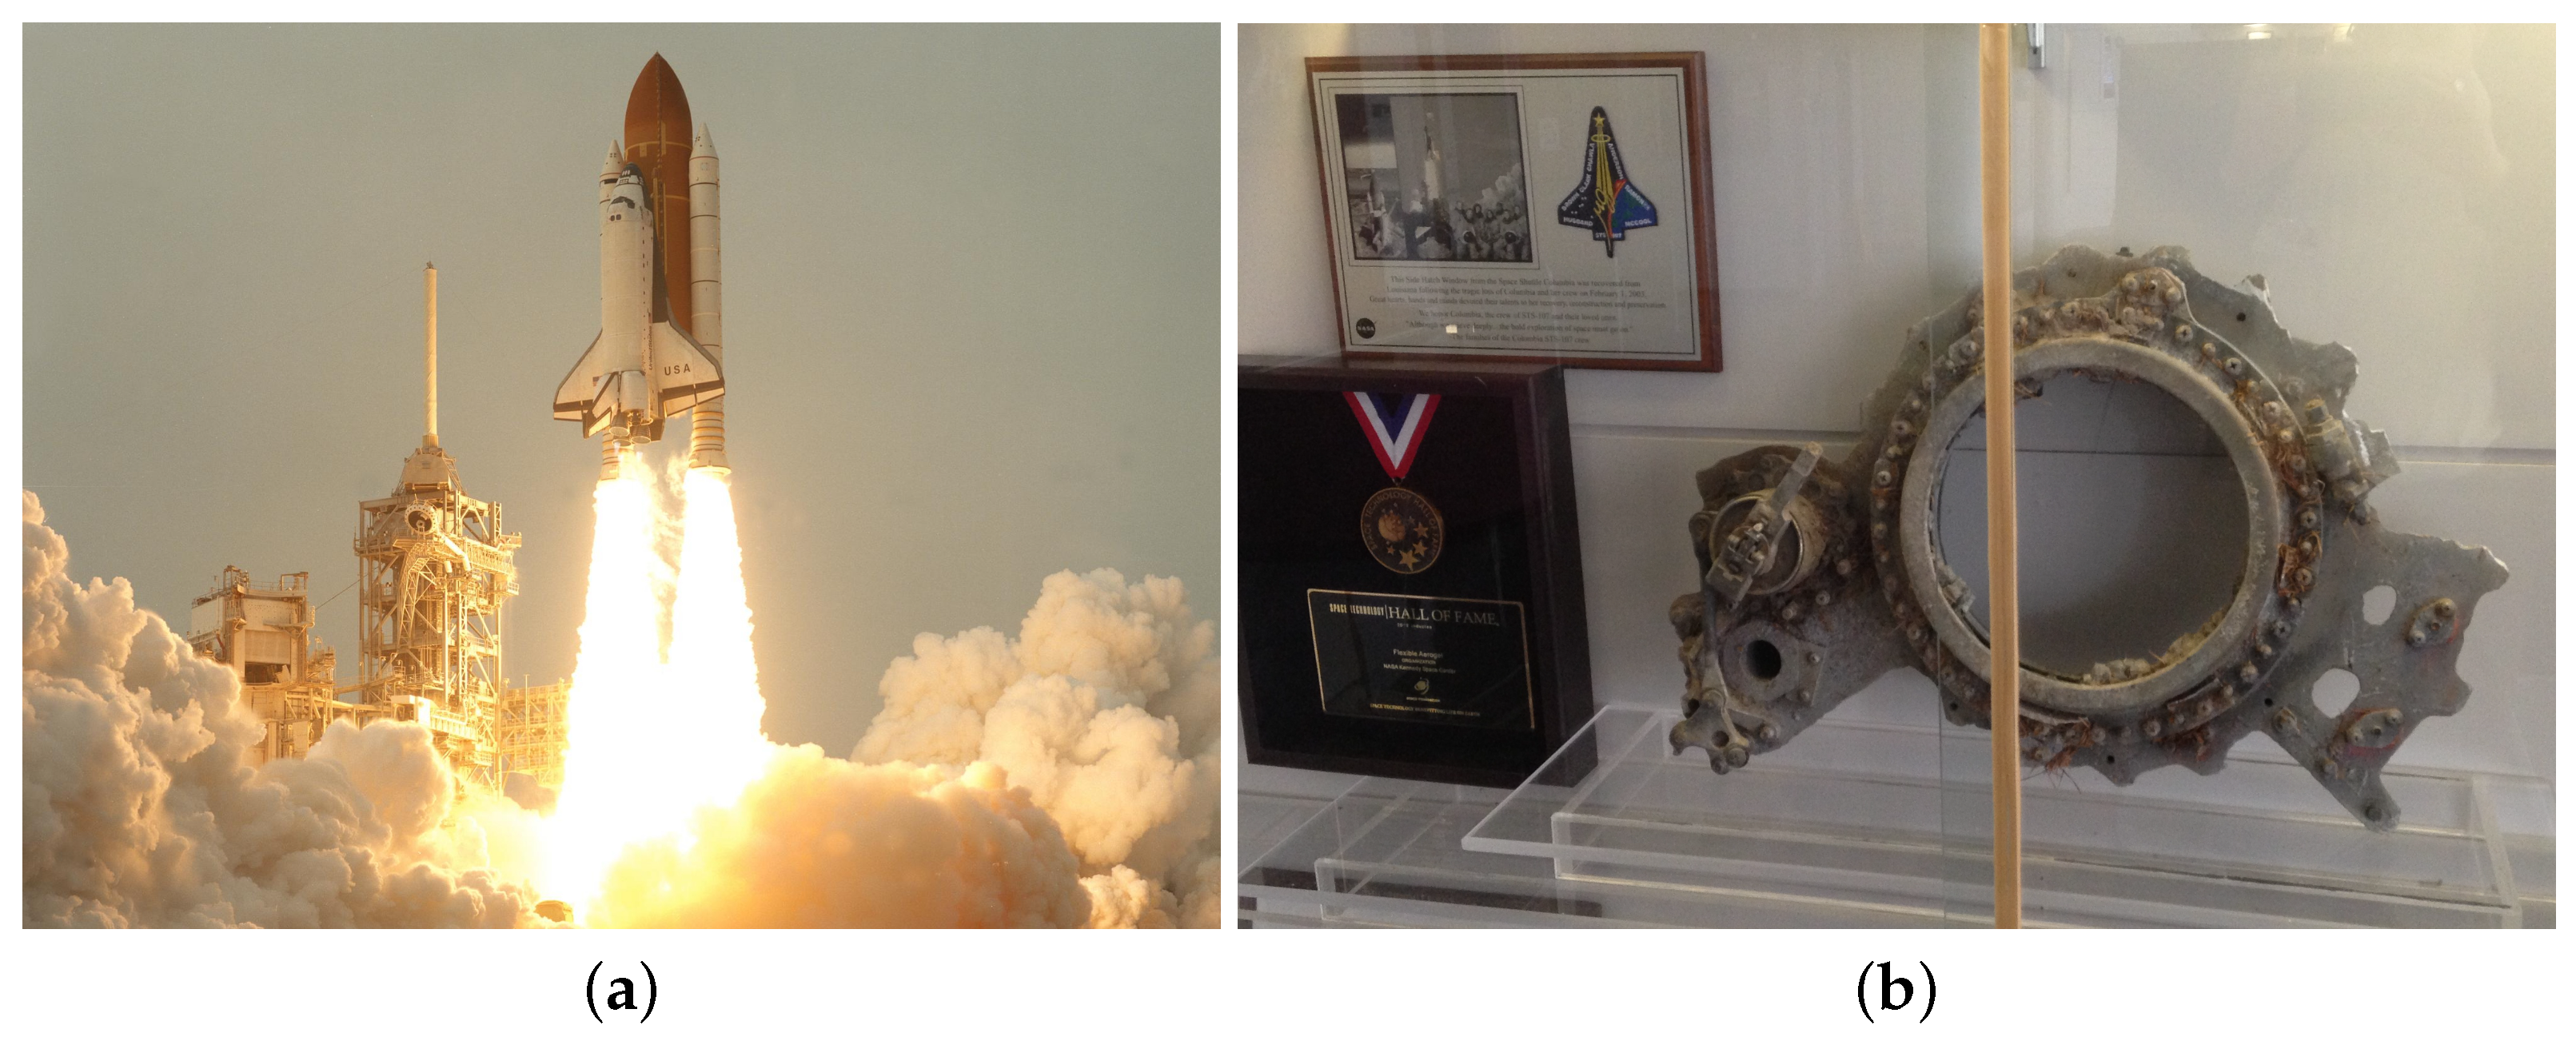
Space Shuttle Columbia (1979–2003), represented in
Figure 1a, used a multilayered system made of aluminosilicate glass, FS, and borosilicate glass for the main structural windows, requiring extreme thermal and mechanical resistance. Acrylic glass (AG) was used for the secondary crew access window, not part of the primary forward-facing flight windows. Remarkably, the “B” Hatch internal window, made of acrylic glass, survived the catastrophic breakup of Columbia in 2003 [
6]. This is now on display at the NASA Kennedy Space Center Headquarters lobby, as shown
Figure 1b. This event established the prevailing view that acrylic glass can endure substantial thermal and mechanical loading under specific conditions, thanks to its inherent ductility and low density.
With the successive Space Shuttle Atlantis (1985–2011), window systems became larger and more complex. This version of the Shuttle used multiple FS panes enclosed in a pressure-sealed retainer [
7], for frontal and overhead visibility during docking and orbital operations, combining optical clarity with high mechanical strength. The Space Shuttle fleet was retired in 2011.
For long-duration orbital windows in Low Earth Orbit (LEO), the International Space Station’s Cupola module currently represents the most advanced implementation of space glazing technology. The module is designed for shirt-sleeve operations and incorporates six trapezoidal lateral windows and a circular top window, 80 cm in diameter. Each window assembly comprises three functional layers: (1) an interior scratch-resistant pane to mitigate cabin-side damage; (2) dual structural pressure panes (with the outer pane functioning as a backup); and (3) an external debris pane dedicated to micrometeoroid and orbital debris protection. All panes were originally made of FS, but scratch panes were recently replaced with AG [
8,
9].
In recent years, newer spacecraft, like SpaceX’s Dragon and NASA’s Orion, both introduced in the 2020s, have adopted AG for their glazing [
6]. Compared to FS, this material is easier to mold into complex geometries, offering substantial weight and cost advantages. However, AG can become brittle at temperatures below 0 °C, with pronounced embrittlement occurring around −40 °C [
10,
11], while its stiffness and strength significantly decrease above the glass transition temperature, approximately 100 °C [
12,
13]. With some companies considering AG for the large windows of future Low Earth Orbit (LEO) space stations to enhance observational capabilities, interest in this material continues to grow. Yet this shift requires careful structural and thermal analysis, especially given the slender geometry and exposure conditions of such elements.
While AG has been successfully used for spacecraft windows, to the best of our knowledge, there is no prior experience with space stations. There is a significant difference in the exposure conditions for the windows. A spacecraft for LEO missions is typically designed for short-term stays in space. Moreover, it often performs a “rôtisserie maneuver” during flight, with a rotation frequency that balances exposure to sunlight and shade, thus reducing the effects of radiation. In contrast, a space station, designed for a multi-decade lifespan in LEO, follows an elliptical orbit and maintains as constant an orientation as possible with respect to the Sun, not only for observation purposes but also to optimize the efficiency of the solar cell arrays that provide energy.
These peculiar conditions, which have received limited attention in the technical literature, provide a motivation for the present study. Since the current docking duration of spacecraft at the ISS can range from just a few days to more than one month [
14], depending on mission objectives and vehicle type, the thermal and mechanical conditions considered here are also relevant for spacecraft windows during extended stays in an LEO environment.
The heating of elements in LEO is primarily caused by radiation from the Sun, terrestrial albedo, and Earth’s emitted radiation. The transmittance and absorption capacity for panes made of either FS or AG, or a combination of both, was calculated in [
15], accounting for the dependence of material properties on the specific wavelength of the radiation spectra. It was demonstrated that FS exhibits minimal radiation energy absorption across varying thicknesses, while AG displays significantly higher absorption—a trend that intensifies proportionally with pane thickness. The temperature in monolithic FS or AG windows was evaluated in [
16] under the transient conditions of an object operating in LEO, at an altitude comparable to that of the ISS. Following [
17], the worst scenario was considered the one corresponding to the longest period of eclipse and the highest variation of the solar radiation in time. It was found that temperatures in AG windows cyclically vary with the orbital period, remaining within acceptable limits because the variability of the radiation is much faster than the time required by the pane to reach a steady state under a constant source.
For highly transparent, thermally stable materials like FS, which exhibit minimal thermal absorption and maintain structural integrity at elevated temperatures, considering that the fixing system generally permits free thermal expansion, the determination of peak operational temperatures is generally unnecessary. The primary concerns are limited to thermal gradients and spatial temperature variations, which become most severe during periods of maximal solar-to-eclipse transition. The non-uniform temperature fields may, in fact, produce an incompatible strain, leading to potential thermal stress development. In contrast, materials such as AG, which exhibit significant radiation absorption and temperature-sensitive mechanical behavior, require careful evaluation of orbital conditions inducing maximum thermal loading. The most severe heating occurs when the orbital plane approaches orthogonality with solar incidence, maximizing radiation exposure duration. This critical scenario warrants detailed analysis, which was not conducted in [
16].
This article investigates the operating temperatures of an acrylic glass pane of a space station exposed to electromagnetic radiation in different low Earth orbits, and evaluates its implications for the material’s temperature-dependent structural capacity. Specifically,
Section 2 details how the radiation flux depends on orbit plane and window orientation, identifying the most critical scenarios for the thermal state. In
Section 3, we solve the transient thermal problem for acrylic glass panes with different thicknesses, considering the penetration depth of the radiation.
Section 4 examines the effect of the calculated temperatures on the temperature-dependent material properties (strength and stiffness), identifying operational limits. Finally,
Section 5 summarizes the main findings and highlights their implications for the design of glazing systems operating in LEO.
2. Critical Scenarios for the Thermal State
A space object in LEO is exposed to three main external radiative heat sources [
16]: solar radiation, albedo radiation, and planetary infrared radiation.
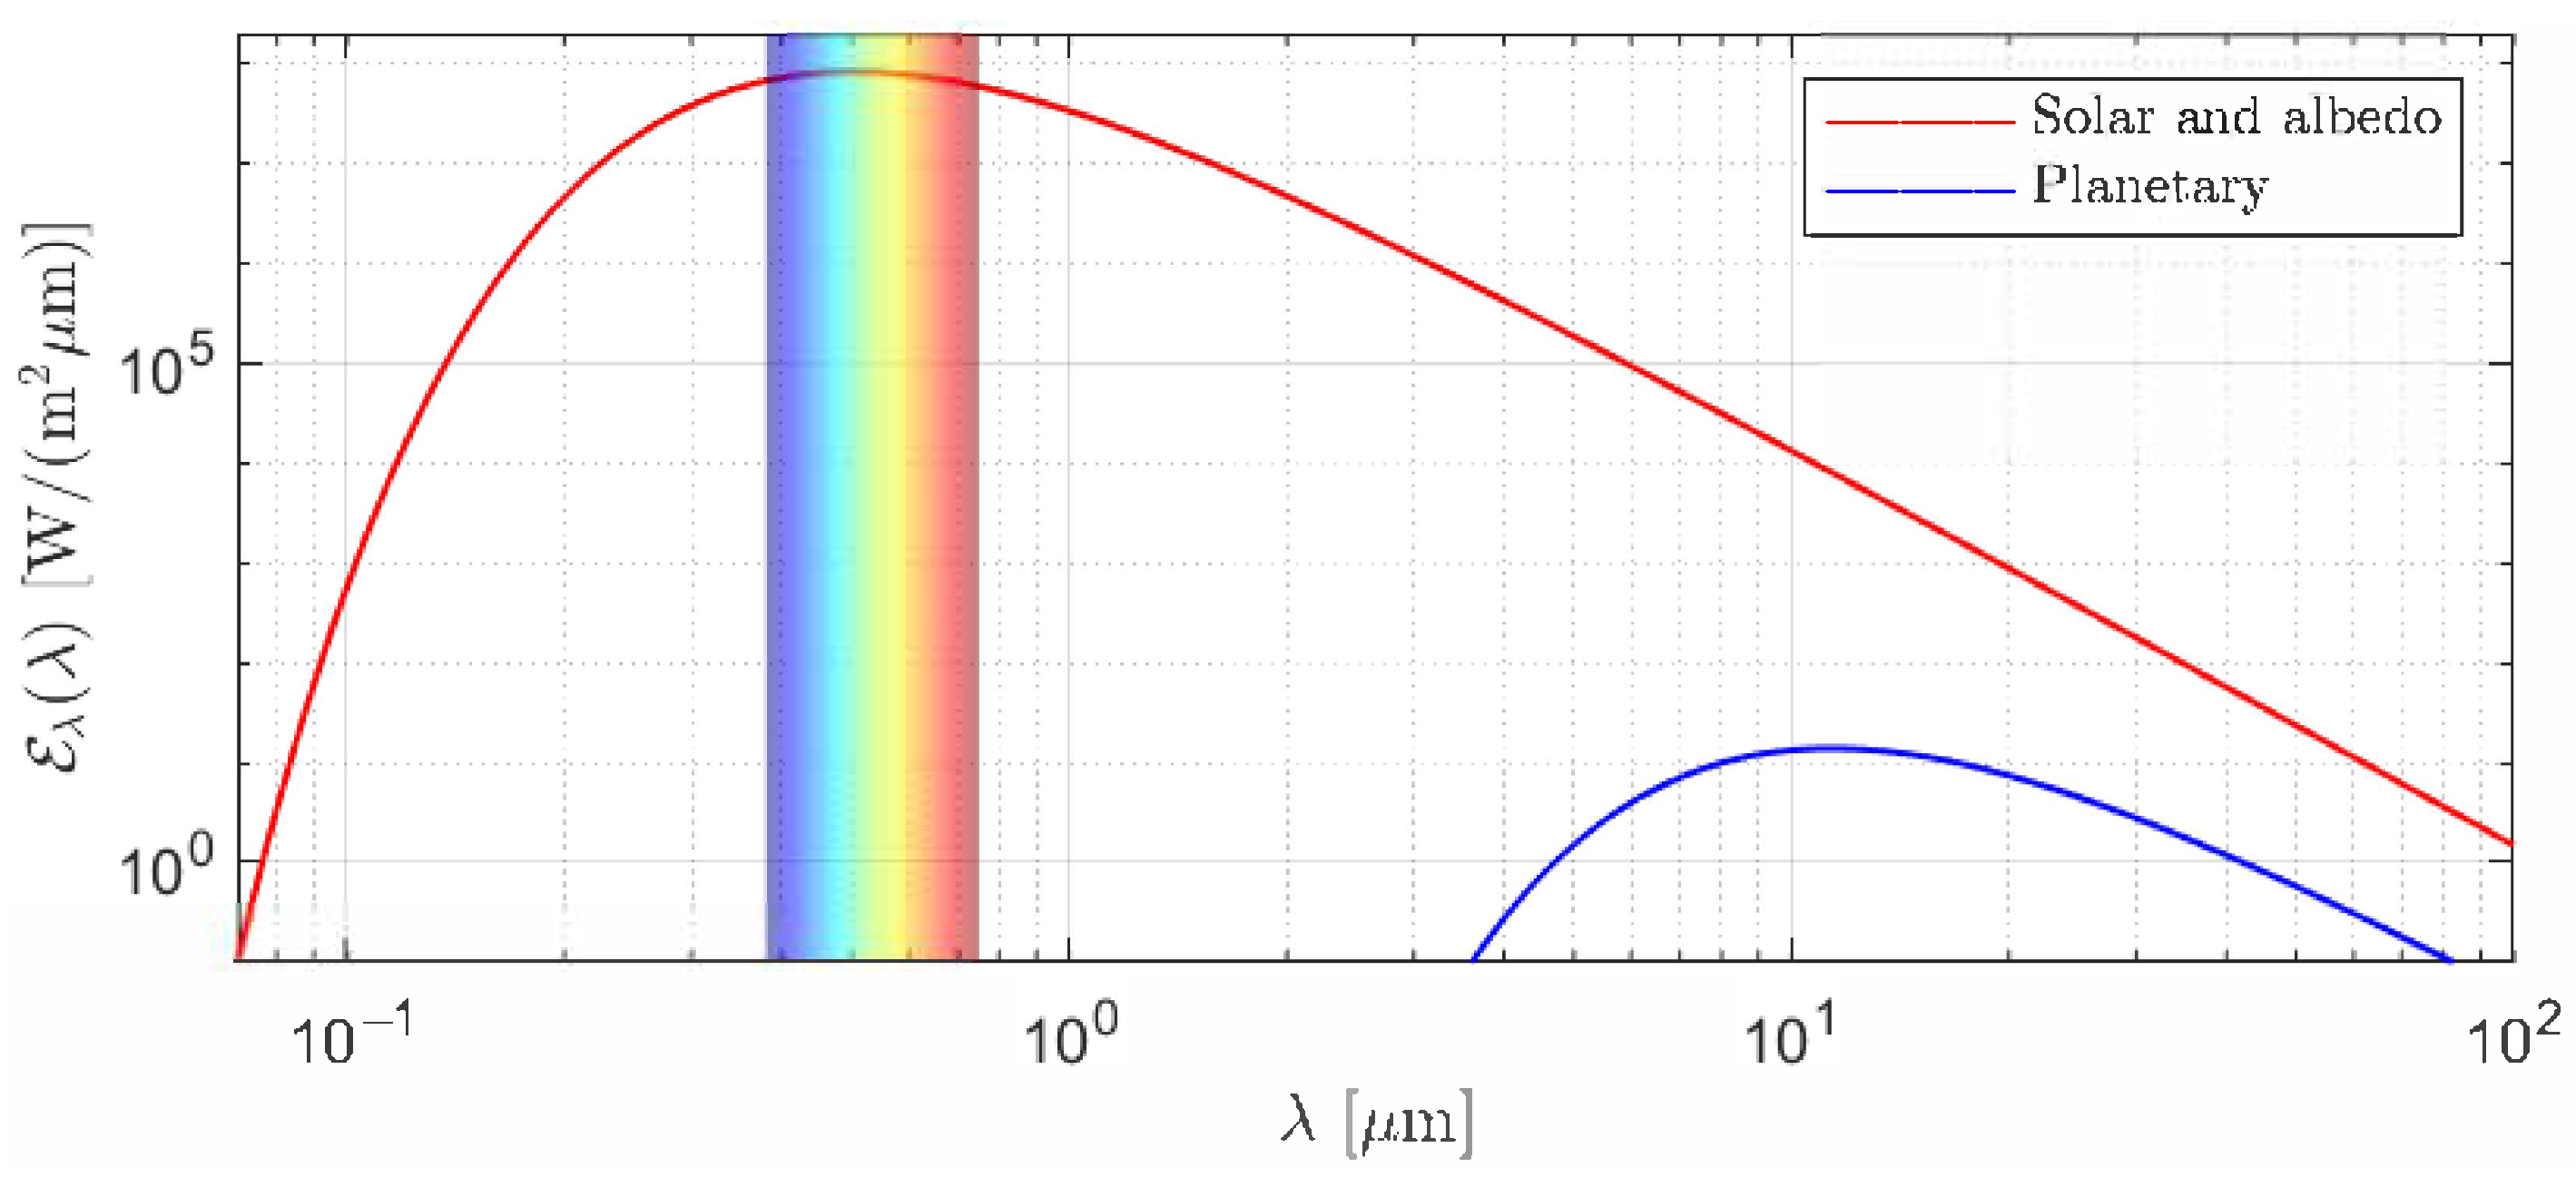
Solar radiation is the most significant contribution. The spectrum of radiant energy per unit area [
)], usually evaluated by considering the Sun as a blackbody at a temperature of 5777 K [
18], is shown in
Figure 2. It spans from the ultraviolet through the visible to the near-infrared wavelengths, with a peak in the visible range. Albedo radiation represents the fraction of solar radiation reflected by Earth’s surface. Its intensity varies with surface reflectivity, typically modeled as uniform [
17] and spectrally neutral, resulting in a spectral distribution that mirrors the solar spectrum. Planetary radiation, by contrast, consists of thermal emissions from Earth at longer wavelengths, peaking in the thermal infrared region (approximately 10
).
Figure 2 presents a comparative visualization of both spectral distributions.
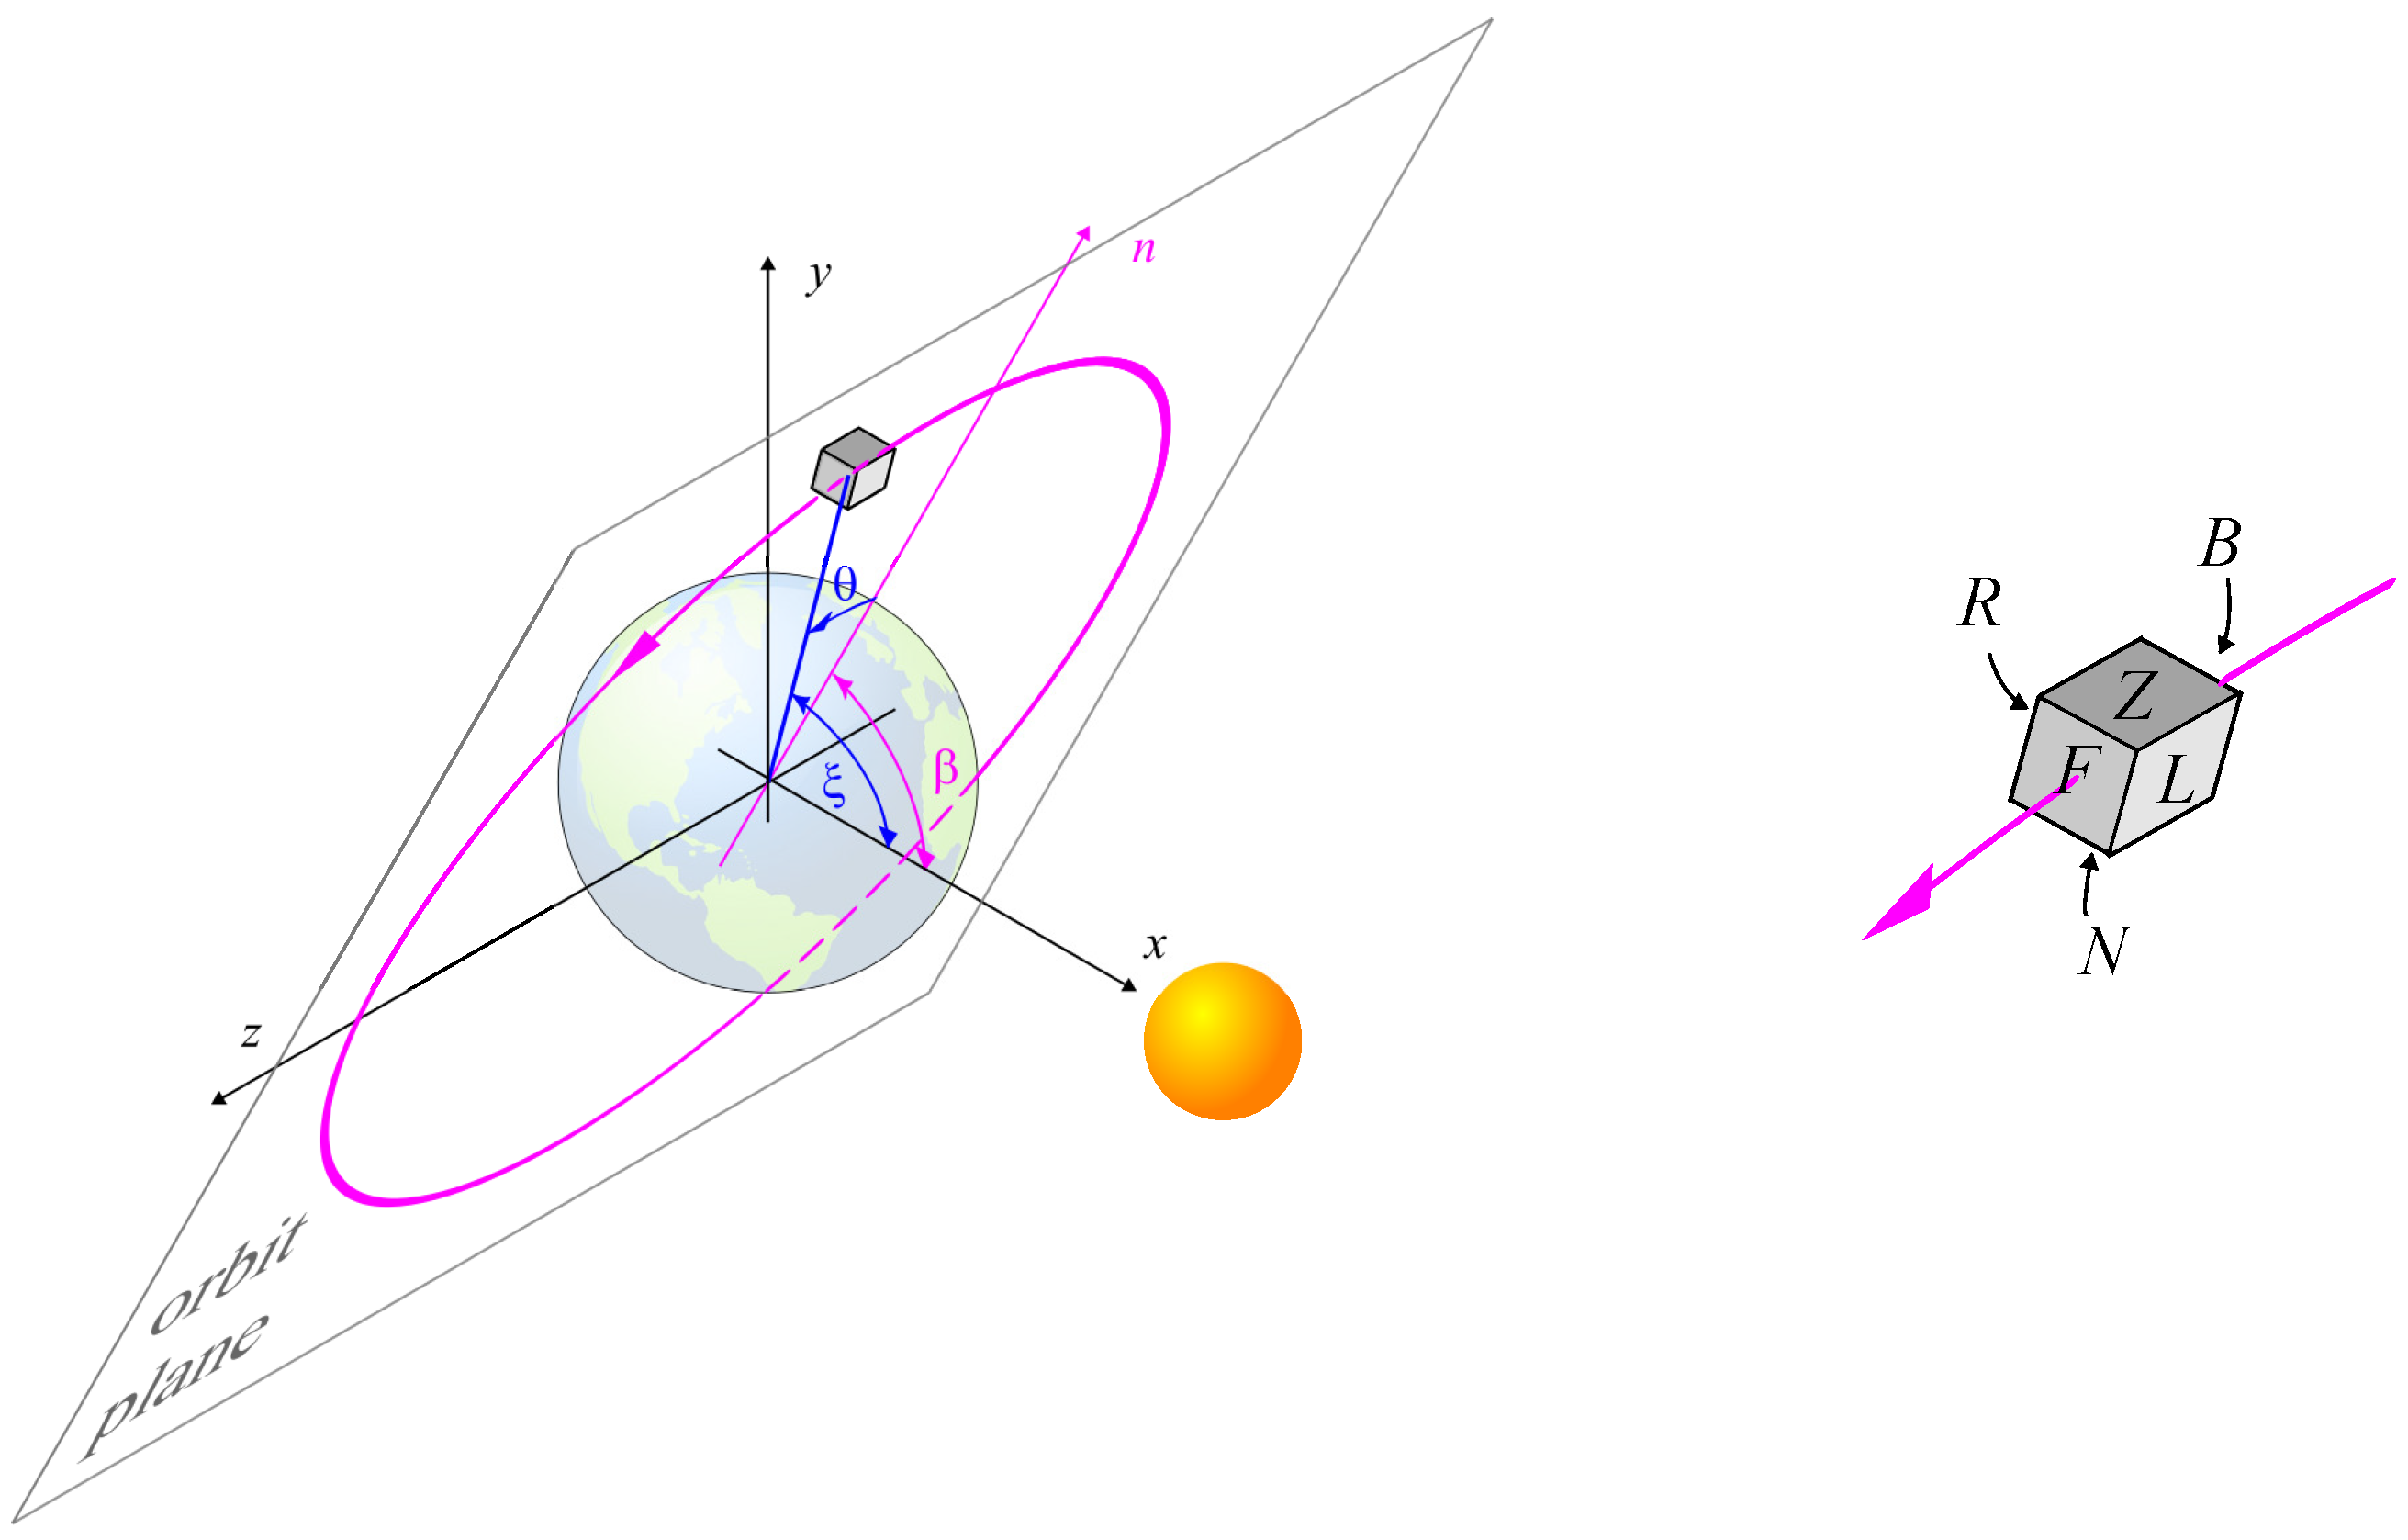
The amount of energy hitting an object in space depends on its distance and orientation with respect to the Sun and the Earth. To evaluate it, it is convenient to consider the celestial reference frame
, indicated in
Figure 3, where
x points toward the Sun and
z is the axis perpendicular to
x lying in the orbital plane. Let
represent the angle between
x and the orbital plane. Denote by
n the vector connecting the Earth’s center with the position of the station closest to the Sun, and refer to it to define the angular coordinate
, identifying the position of the station in the orbit plane.
While conventional thermal analyses typically assess energy balance at the spacecraft level, our focus on glazing performance necessitates explicit consideration of surface orientation relative to solar incidence. This directional dependence critically influences radiation inputs across transparent components. Therefore, we model the station as a cubic “orbiting box” [
16,
17], indicated in
Figure 3, defining six principal orientations: the Zenith- and Nadir-facing surfaces
Z and
N; the forward-facing surface
F (with normal in the direction of the station motion); its opposite backward-facing surface
B; and the lateral left- and right-facing surfaces
L and
R. Windows with orientations different from these can be analyzed similarly. The energy received by a window depends on the surface exposure, specifically the angles
and
.
Due to changes in season and the equatorial bulge, over the course of a year, the
angle varies approximately within ≃
[
17,
19]. The worst-case scenario is typically identified when the space station’s orbit lies parallel to the Sun’s rays, i.e.,
in
Figure 3, leading to extended eclipse periods and the largest time variation of solar radiation [
17]. These conditions allow the problem to be treated as two-dimensional within the orbit plane. Accordingly, the orbiting box can be schematized as a rectangle, defining four surfaces:
Z, for which the higher variability of heat fluxes is obtained,
B,
N, and
F. This is the case analyzed in [
16]. On the contrary, when
, it is necessary to treat the station as a three-dimensional object.
Using arguments similar to those in [
16], the solar heat flux incident on the six surfaces can be calculated, as a function of the solar constant
and of the solar heating multiplier
(set equal to 0 when the station is in the eclipse region, and 1 otherwise [
16,
20]), as
The heat flux from the Earth’s albedo radiation hitting the
i surface (
) can be written as a function of the the albedo parameter
, and of the angle
defining the station position with respect to the solar vector, indicated in
Figure 3, in the form
where
F represents the view factor. Following [
16], this can be set equal to
for the
N surface, facing Earth, and to
for the lateral (
B,
F,
L,
R) surfaces, while it is zero for surface
Z.
The Earth’s infrared radiation on the
i surface is evaluated as
where
is the effective average Earth temperature [
17,
21], and
is the Stefan–Boltzmann constant [
18].
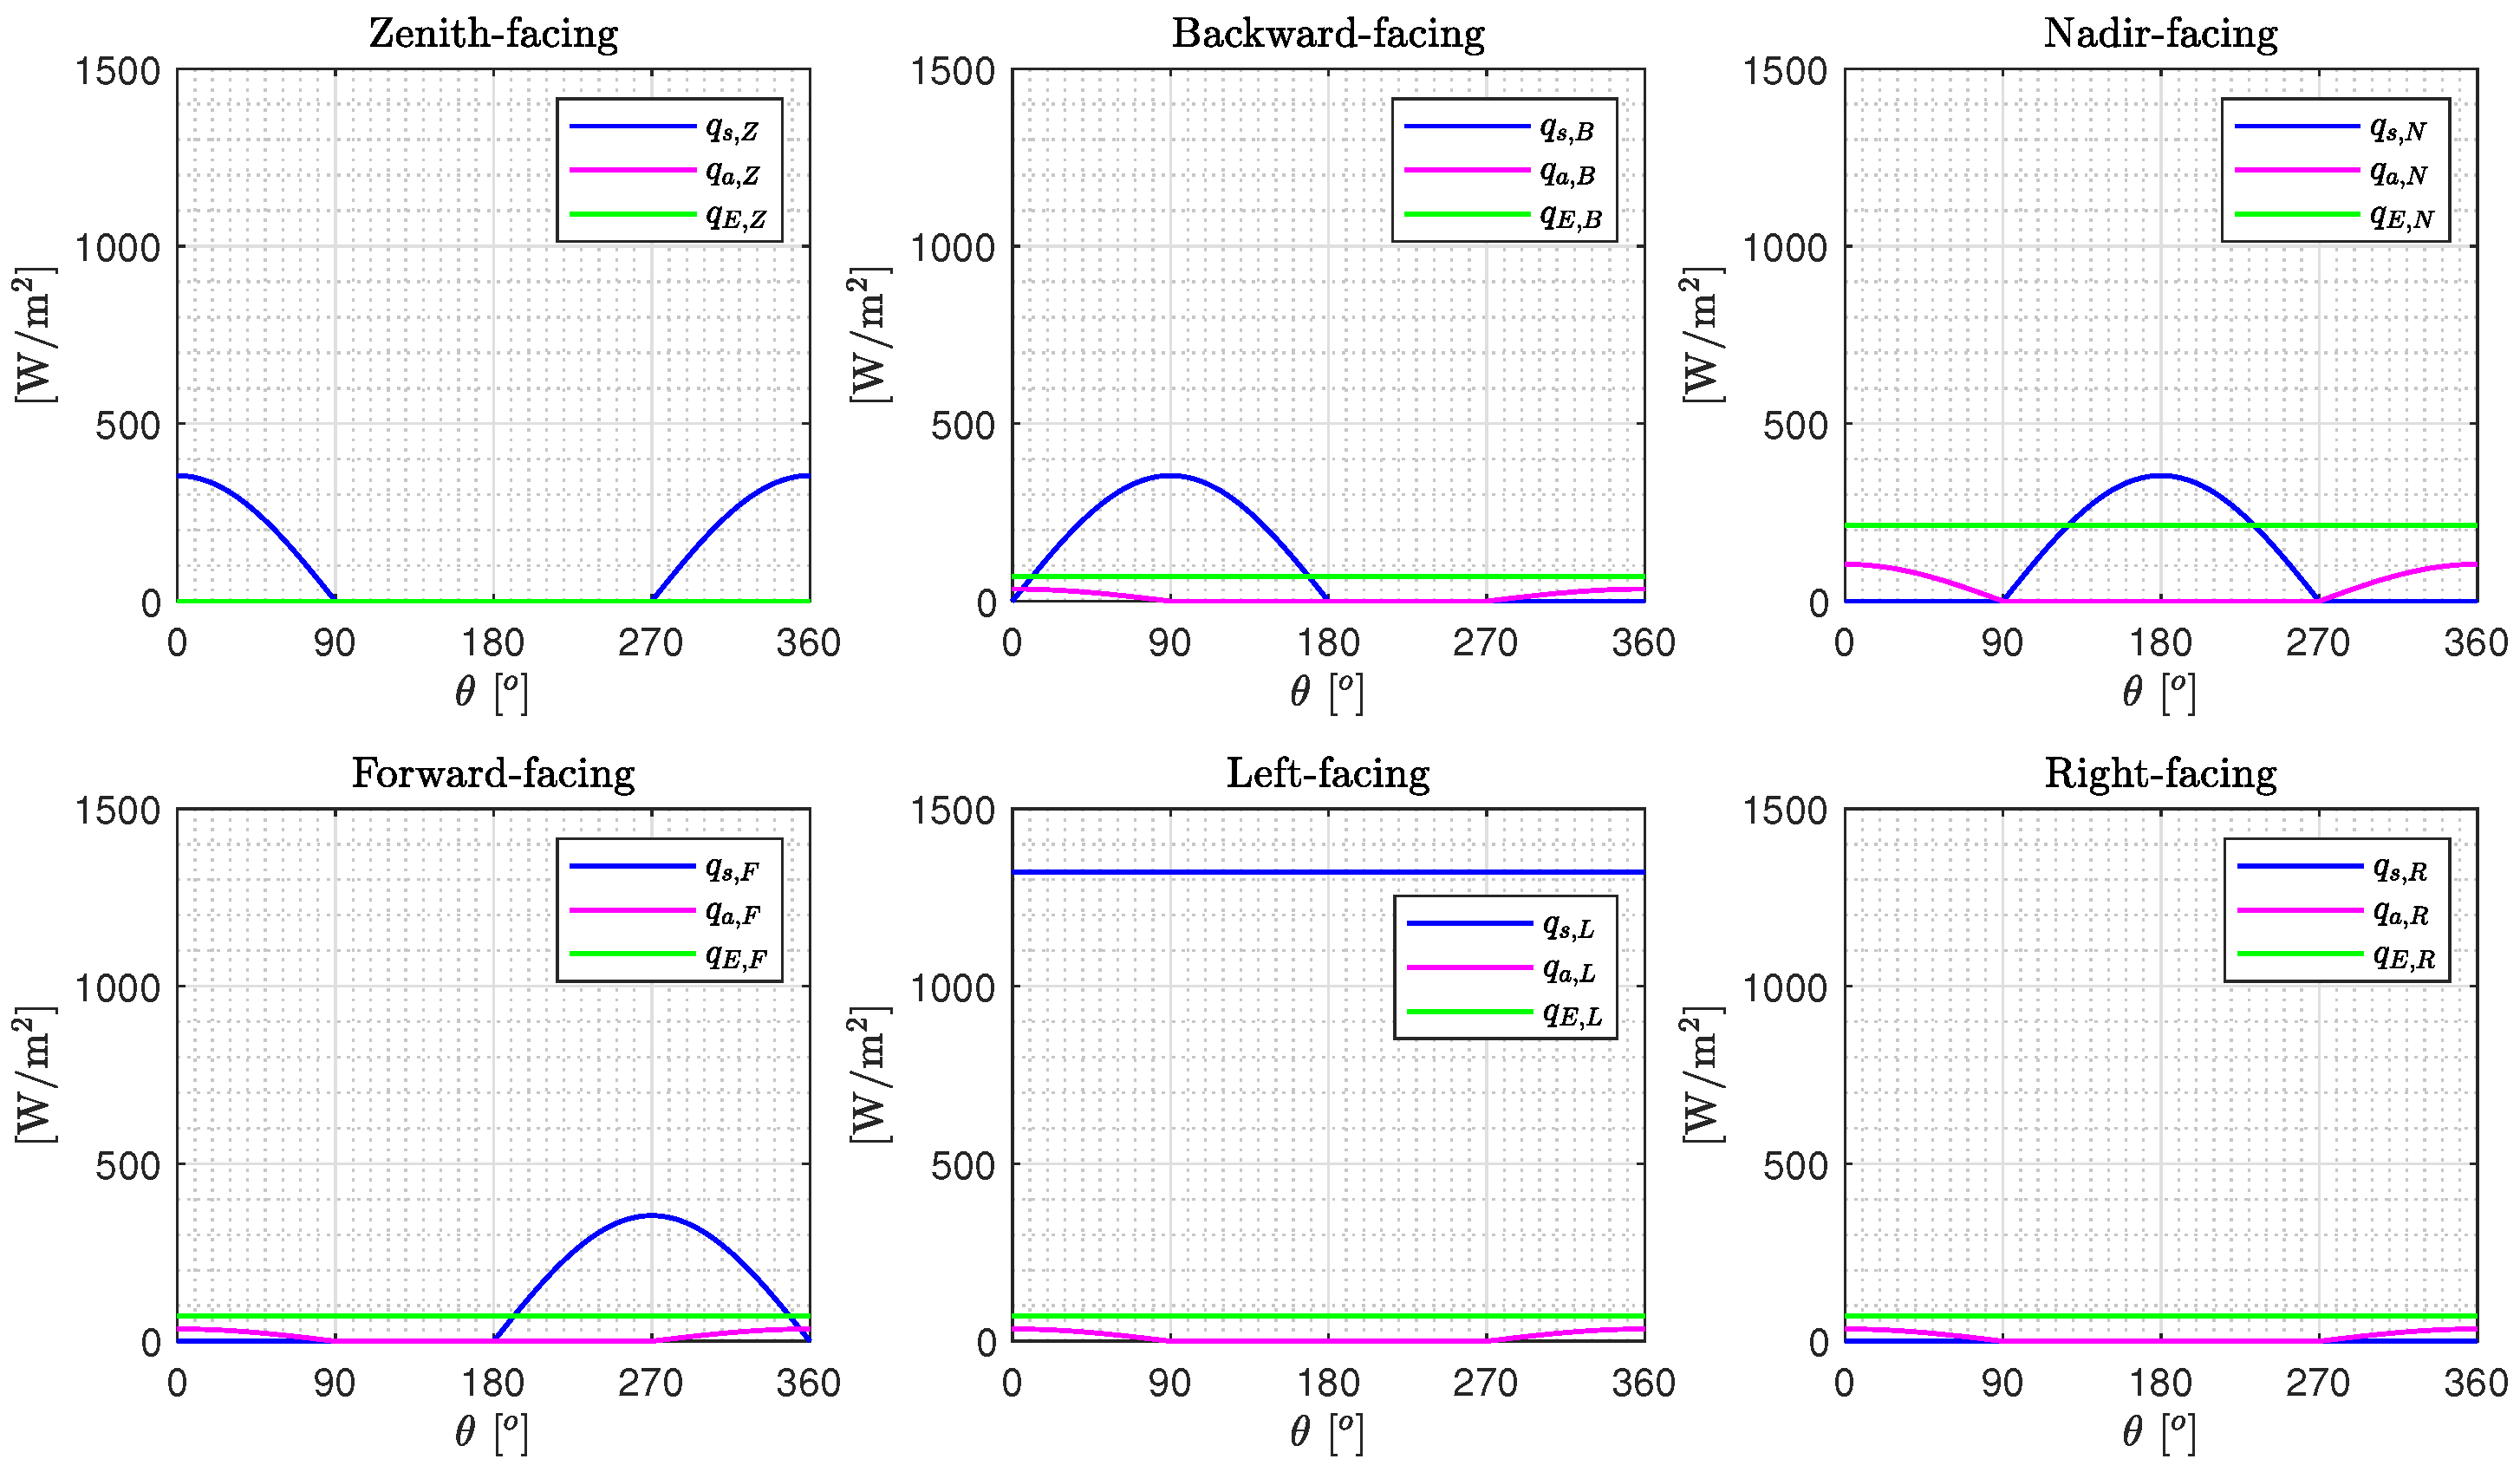
The configuration for which at least one of the surfaces receives the greatest amount of radiation corresponds to the limit case
(the case
is equivalent). For this case,
Figure 4 shows the radiation contributions (solar, albedo, Earth’s) on the different surfaces of the orbiting box. The most critical condition is for the
L surface, closest to the Sun; the contribution is nil on the opposite
R surface. This is because the
L surface maintains continuous solar exposure throughout orbit. The sole time-dependent component arises from Earth’s albedo radiation, which varies as only the sunlit hemisphere reflects solar energy. However, this albedo contribution remains secondary to both direct solar radiation and planetary infrared emissions.
4. Temperature Effects on Mechanical Behavior and Implications for Structural Design
This section analyzes the impact of temperature on structural performance, linking thermal demand to material properties and design. It begins by reviewing the temperature-dependent stiffness and strength of acrylic glass. Based on these properties, structural verification methods are developed for representative examples. Finally, operational limits are defined to identify conditions where structural integrity may be compromised.
4.1. Temperature-Dependent Mechanical Properties
The mechanical properties of acrylic glass exhibit a strong temperature dependence. At room temperature, the material shows appreciable strength, stiffness, and toughness, but its modulus of elasticity, tensile strength, and impact resistance decrease markedly with increasing temperature. Approaching the glass transition temperature (around 100 °C [
12,
13]), the polymer undergoes a change from a stiff, glassy state to a rubbery state, causing severe mechanical property degradation. Conversely, at temperatures below 0 °C, AG becomes increasingly brittle due to reduced molecular chain mobility, resulting in decreased fracture toughness and impact resistance [
10,
11]. This can limit its performance in cryogenic or sub-ambient conditions.
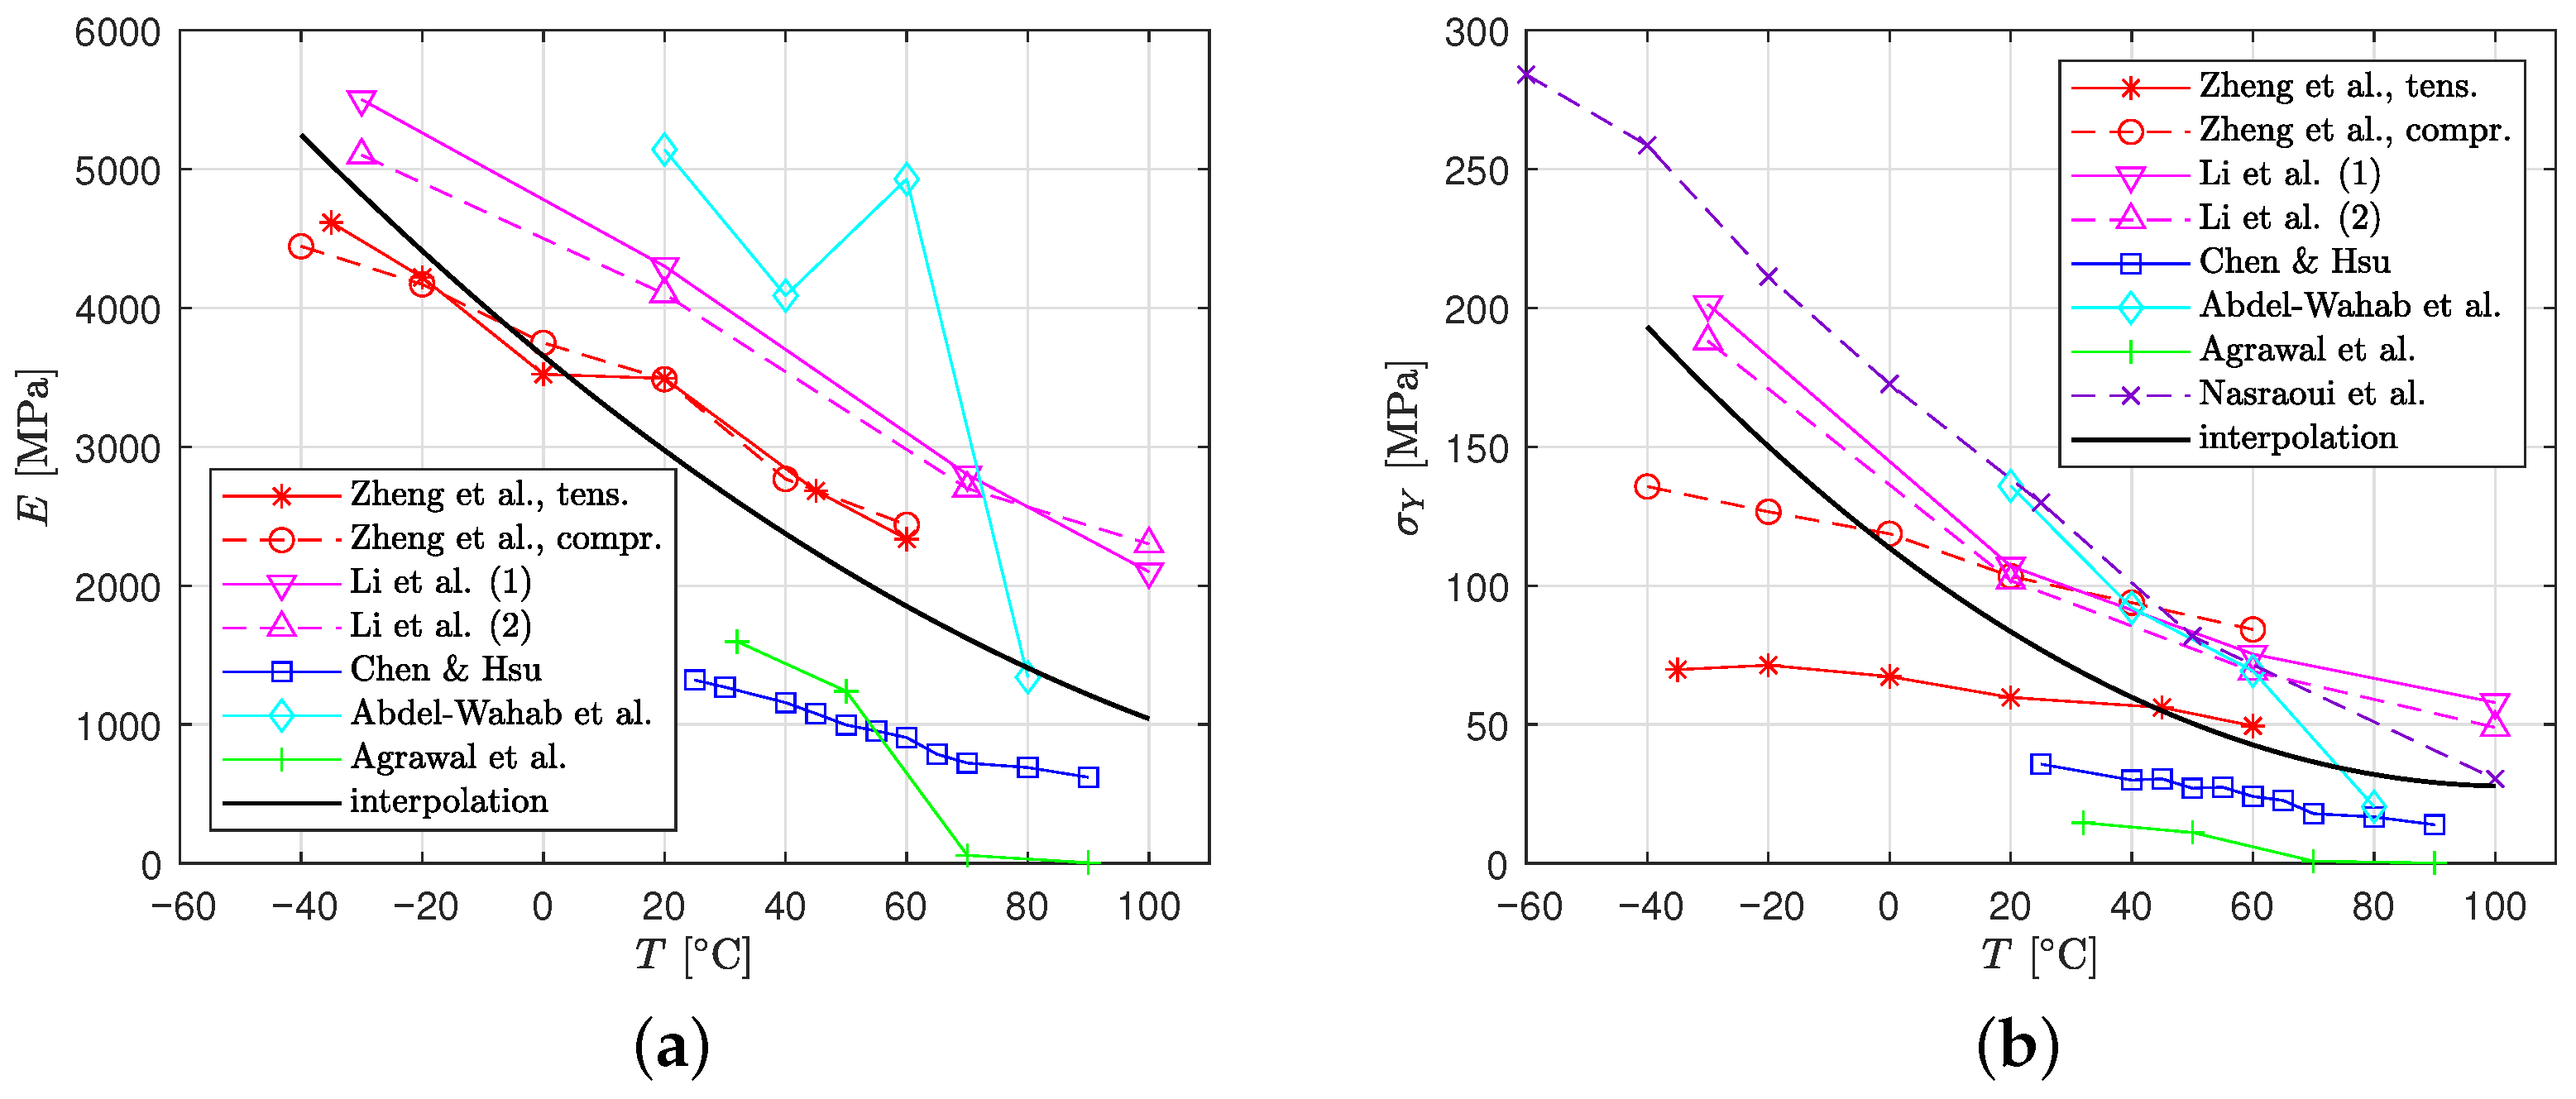
There are many types of AG, for which the literature reports different mechanical properties, collected in the following graphs.
Figure 9a shows the temperature-dependent decay of the Young’s modulus
E, as reported in [
10,
11,
23,
24,
25,
26]. The data reveal a decay in stiffness as the temperature approaches the glass transition region.
Figure 9b presents the corresponding reduction in mechanical (tensile, compressive, or flexural) strength with increasing temperature. The strength degradation follows a trend similar to that of the elastic modulus. Data are taken from Zheng et al. [
10], where uniaxial tensile and compressive tests were performed, with strain rates of approximately 0.1 min
−1 and 0.02 min
−1, respectively, and Li et al. [
11], where investigation on the strain rate and temperature dependent mechanical behavior was conduced through Dynamic Mechanical Analysis (DMA) tests, on two different material types (data correspond to a strain rate of 1200 s
−1). We also report the experimental results from Chen and Hsu [
23], obtained through quasi-static tensile tests on thin (125 μm) specimens. Abdel-Wahab et al. [
24] recorded data from three-point bending tests. Agrawal et al. [
25] used DMA to obtain the stress–strain relation.
Figure 9b also records yielding stress obtained by Nasraoui et al. [
26] in quasi-static uniaxial compression tests.
The experimental data exhibit significant scatter, which can be attributed to variations in experimental conditions (type of test, specimen geometry), material factors (molecular weight, additives), and especially strain rate, as AG is a rate-sensitive polymer. Despite this dispersion, all datasets consistently confirm the decay of both stiffness and strength with increasing temperature.
Figure 9 also reports the best-fit approximations of the experimental data with quadratic functions of the temperature. These were obtained through least-squares regression on the combined experimental datasets, with the coefficients determined using MATLAB’s polyfit function [
22]. The expressions are
where
T is in °C. Notice that, according to this approximation, when transitioning from an ambient temperature of 20 °C to 100 °C, the Young’s modulus decreases by approximately 2.85 times, while the yield strength undergoes a more pronounced reduction of about 3 times. These trends emphasize the need for careful thermal considerations in PMMA-based design applications.
4.2. Worked Examples
In space glazing systems, transparent portholes and windows are subjected to pressure differentials of the order of 1 atm due to the internal–external pressure imbalance, about two orders of magnitude higher than in architectural windows. Building upon the material characterization of
Section 4.1, we consider the structural design of space windows. Specifically, we evaluate the two thicknesses considered in
Section 3 (36 mm and 150 mm), examining how temperature-dependent properties govern deflection limits and stress verification.
Consider, as a representative example, a simply supported circular plate of radius R and thickness h, under a uniform pressure atm. No specifically dedicated national or international standards are available for space glazing. Design is typically based on program-specific or agency-specific requirements, defined by the space agency or contractor responsible for the mission (e.g., NASA, ESA).
Here, the following design criteria are considered: (
i) maximum deflection
must not exceed
, to ensure structural stiffness but also to prevent excessive deformation that could compromise sealing performance or damage peripheral gaskets under pressure differentials; (
ii) maximum stress
must remain below the allowable limit
, where a material partial factor
is usually applied under operational loads. The design is referred to a temperature
T = 100 °C, representing the worst case for the mechanical properties recorded in the literature, collected in
Figure 9.
Since the limit
for deflections is low enough to justify the assumption of geometrically linear response (a posteriori verification confirms that the deflection is less than 0.75 times the thickness), here the classical linear plate theory [
27,
28] is used. In this context, the maximum deflection
and maximum radial and circumferential stresses,
, attained at the center of the circular plate, are
where
is the flexural stiffness of the plate, and
is the Poisson’s ratio.
Here, the Expressions (8) are used to model the temperature dependence of Young’s modulus and material strength, while
can be considered constant up to the glass transition temperature [
10,
29], and can be assumed equal to
[
24].
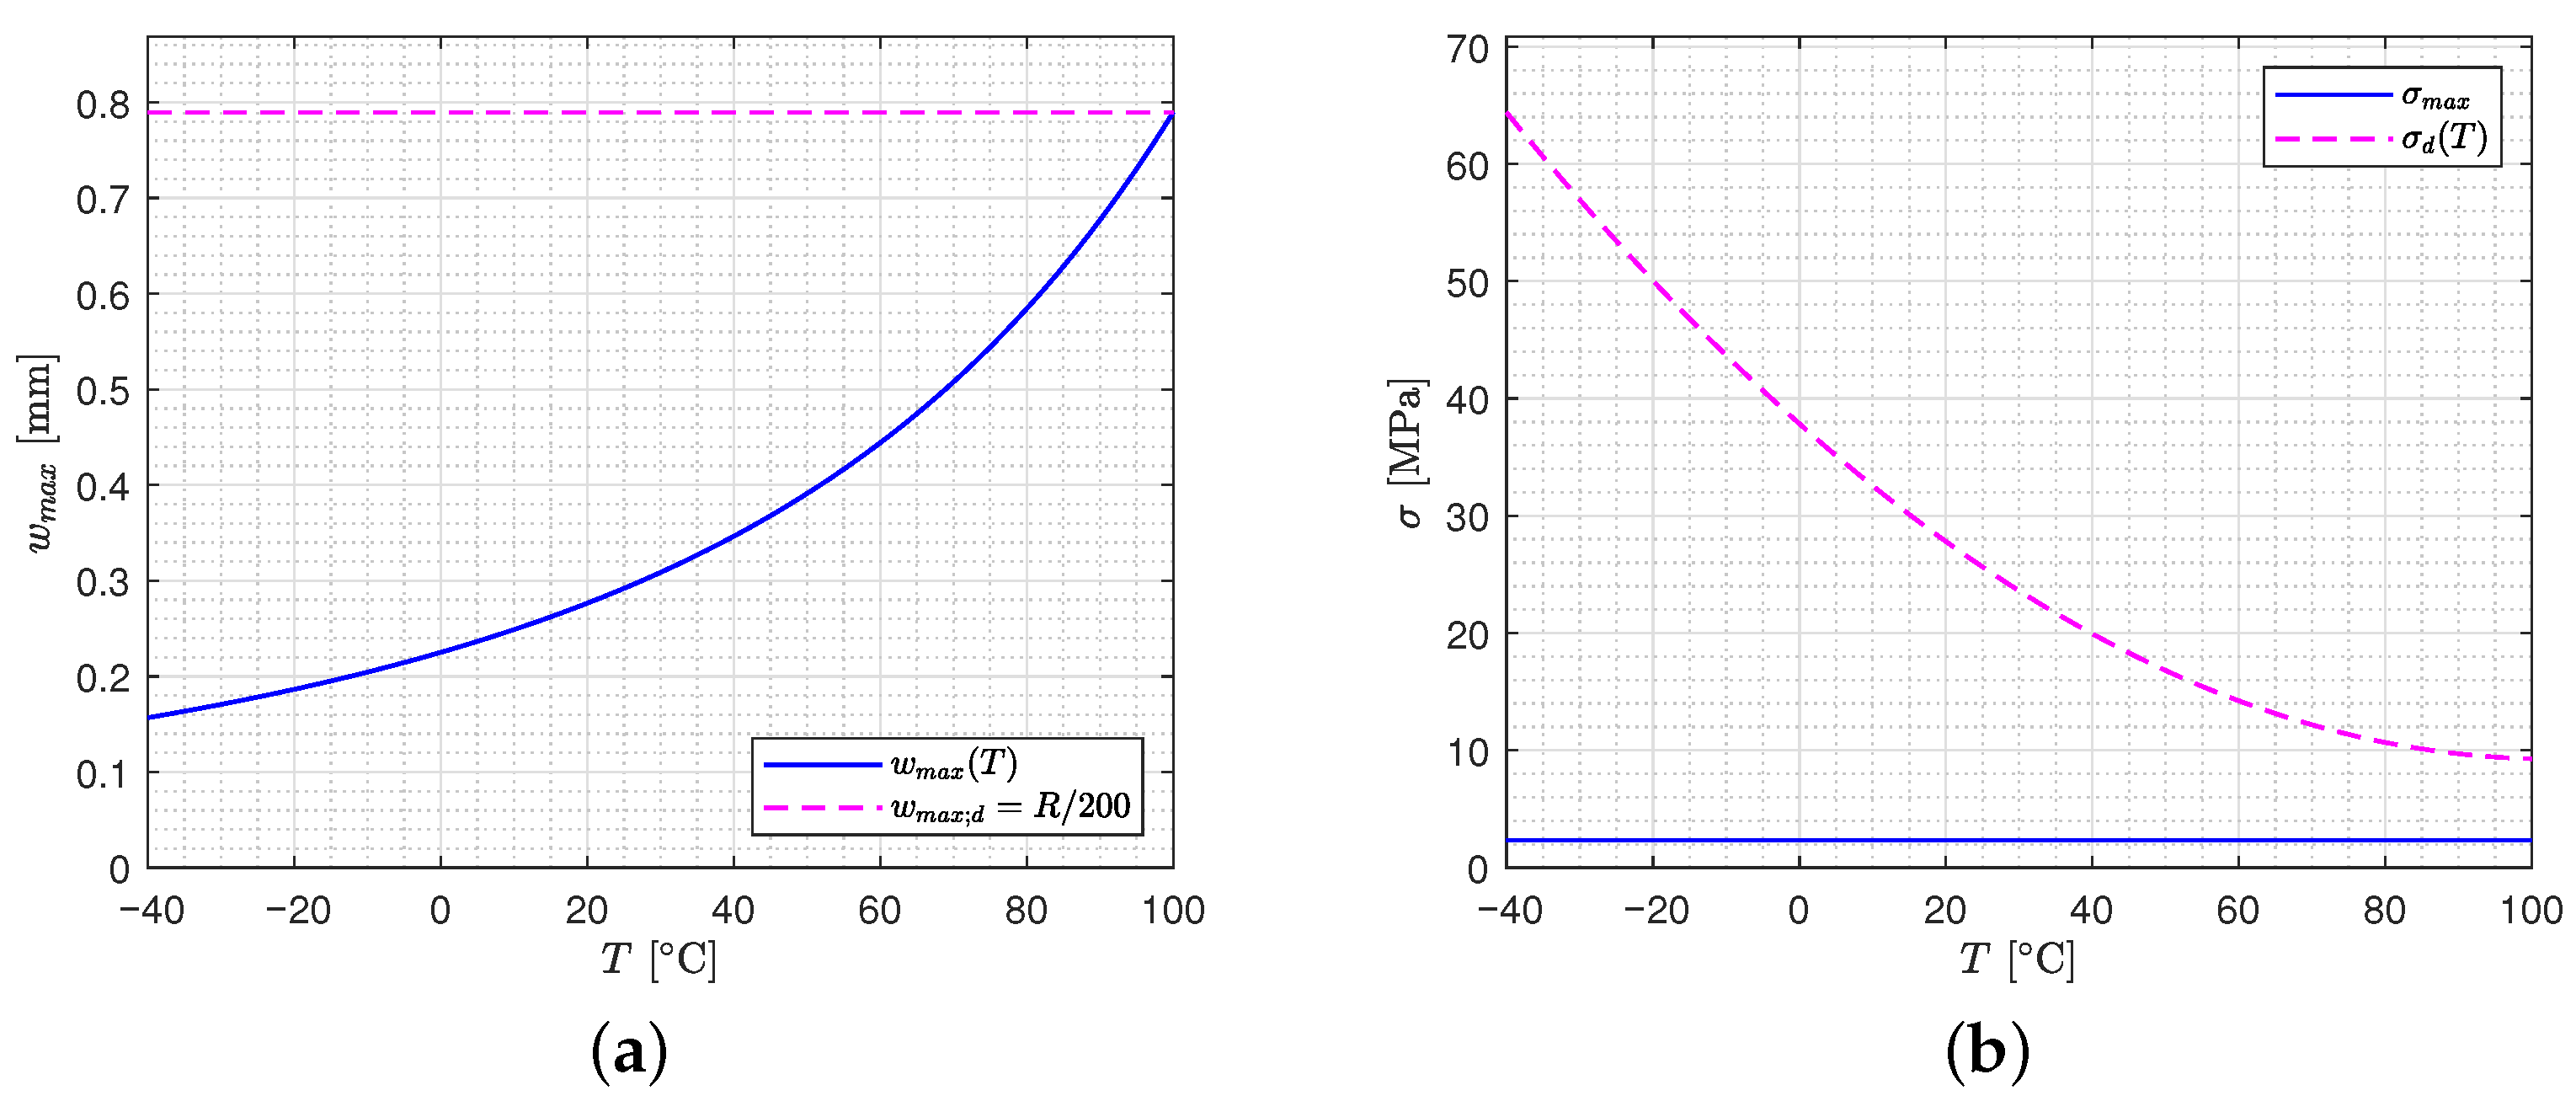
For a
mm thick pane, at a temperature
T = 100 °C, the maximum radius for the deflection verification is 158 mm, while for the stress verification, one finds
mm. Consequently, a plate with radius
mm shall be considered. For this value,
Figure 10a shows the maximum deflection at different temperature values, compared with its limit value.
Figure 10b shows the corresponding maximum stress, equal to 2.34 MPa, compared with the temperature-dependent design strength
.
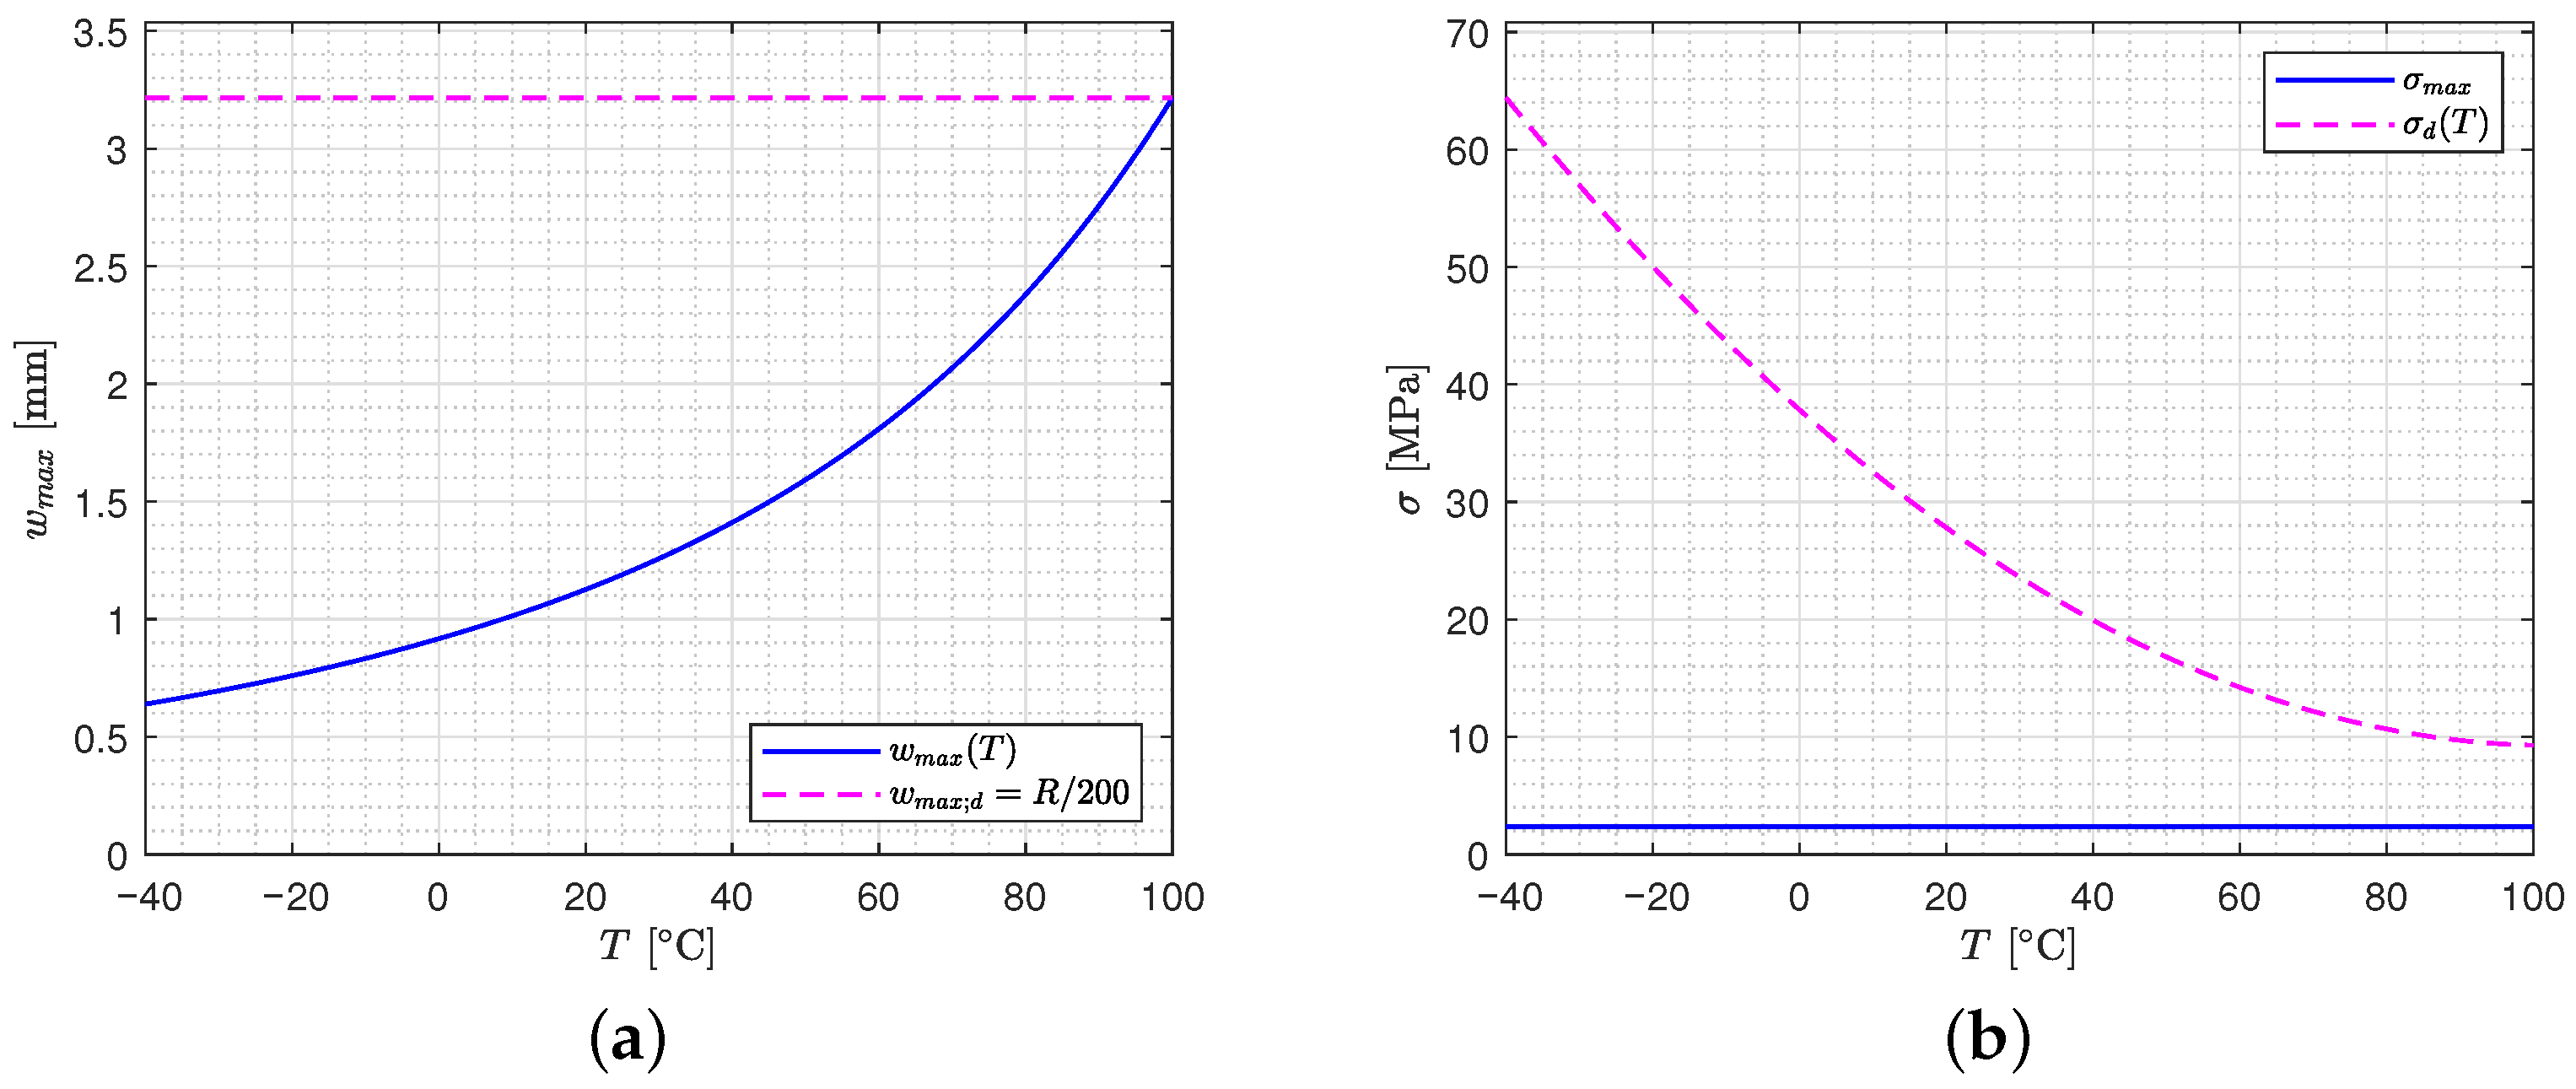
For the thicker pane (
mm) at
T = 100 °C, the deflection verification requires
mm, whereas the stress requirement indicates
mm. Again, the deformability limit governs the design, providing a geometry comparable with the size of the ISS Cupola top window [
30]. The plate response, in terms of deflection and stress, is shown in
Figure 11 as a function of the window temperature.
For both geometries ( mm and mm), deflection is critical. Although the design strength decreases with increasing temperature, maximum stress remains below allowable limits. Observe that the deflection exhibits strong thermal sensitivity, increasing by a factor of 2.85 when transitioning from 20 °C to 100 °C. Neglecting this temperature-dependent behavior would result in significant underdesign, as room-temperature calculations would underestimate the actual service deflections by nearly threefold. Agency-specific structural requirements may alter absolute values but do not change the fundamental hierarchy: deflection limits remain the dominant constraint due to their stringent thresholds and temperature-driven amplification.
4.3. Temperatures and Structural Feasibility Limits
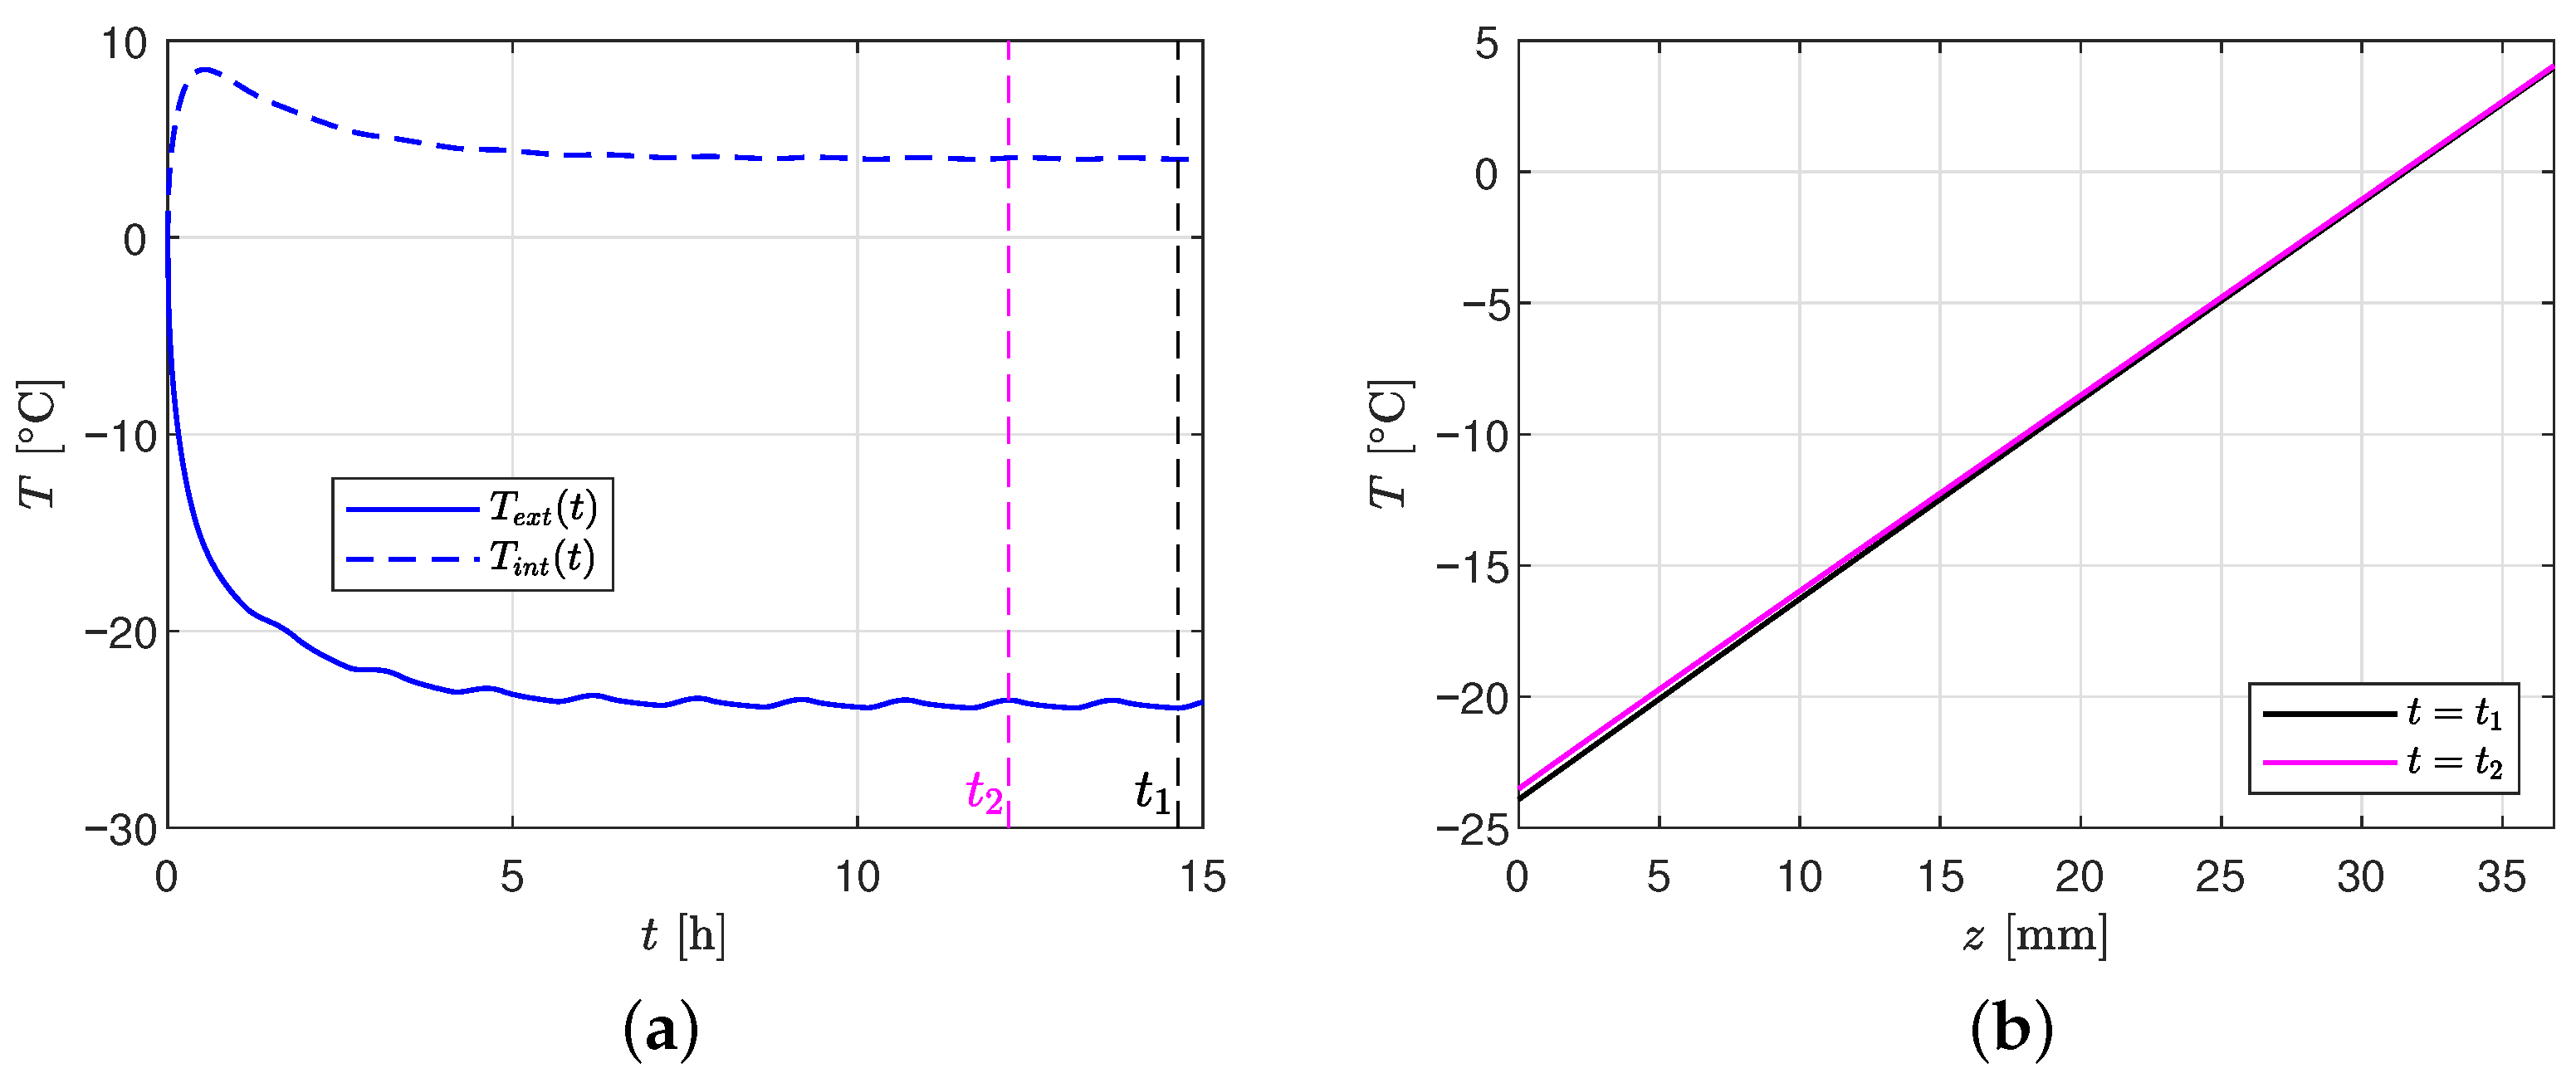
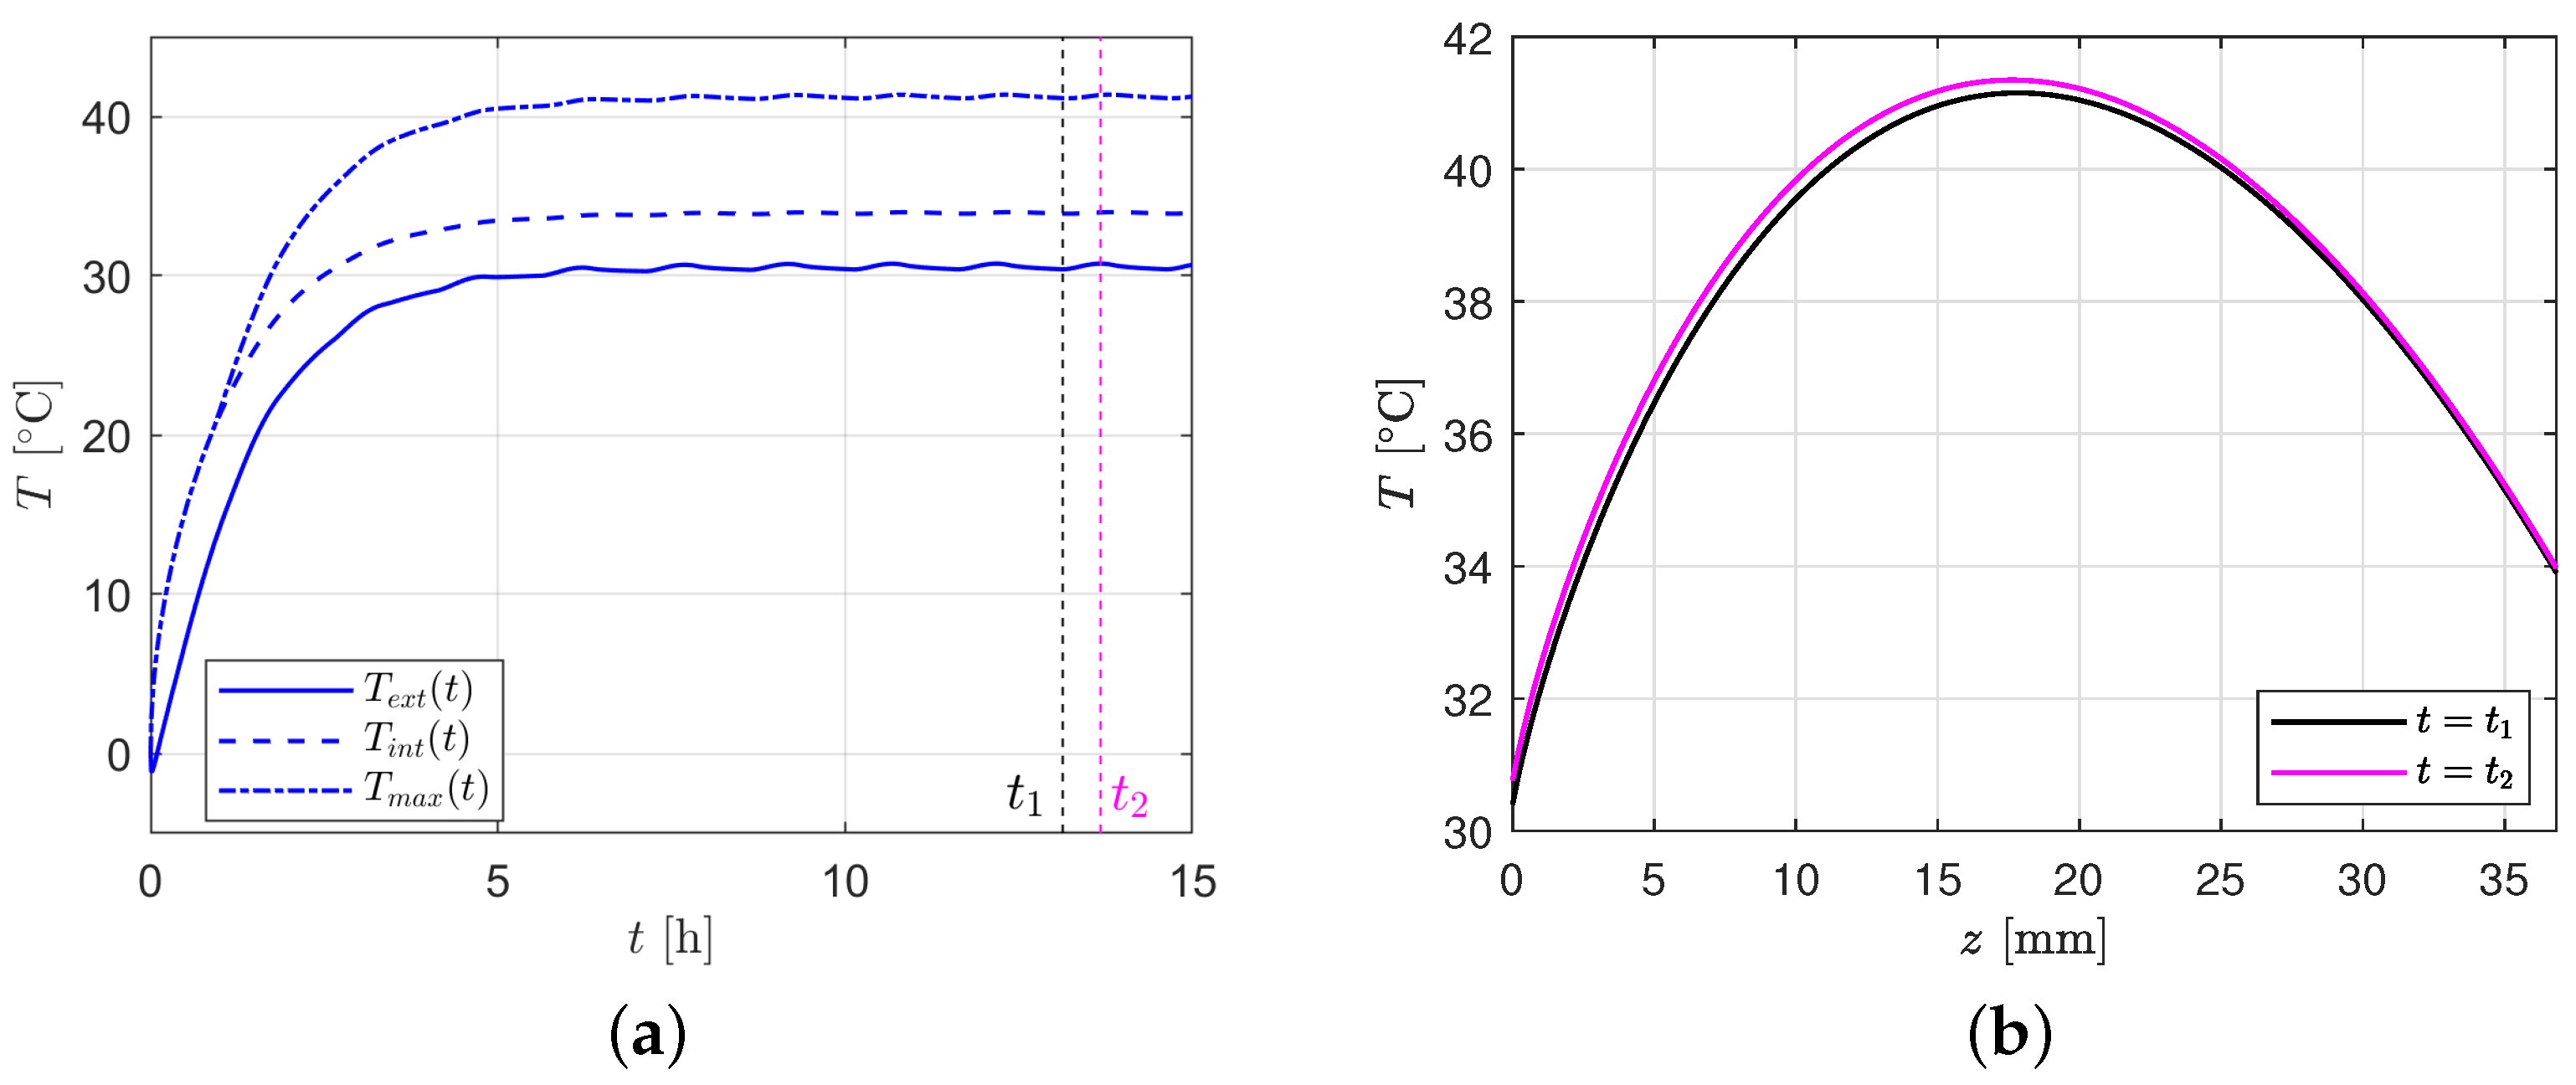
Table 1 collects, for the 36.83 mm thick AG pane, the temperature ranges at the surfaces in contact with the external and internal environment, respectively,
and
, as well as the maximum temperatures
attained in the interior of the panel. Results corresponding to the
R and
L surfaces for
are compared to those obtained in [
16] for the most critical
Z surface, for
.
For the less irradiated R surface, the temperature trend is almost linear in the panel thickness: maximum temperature is recorded at the internal surface (). Observe that temperatures attained on the R surface for are consistently lower than those corresponding to . On the other hand, those attained at the L surface are consistently higher. Since for the solar heating is almost constant in time, the amplitude of cyclic oscillations is lower than for .
In
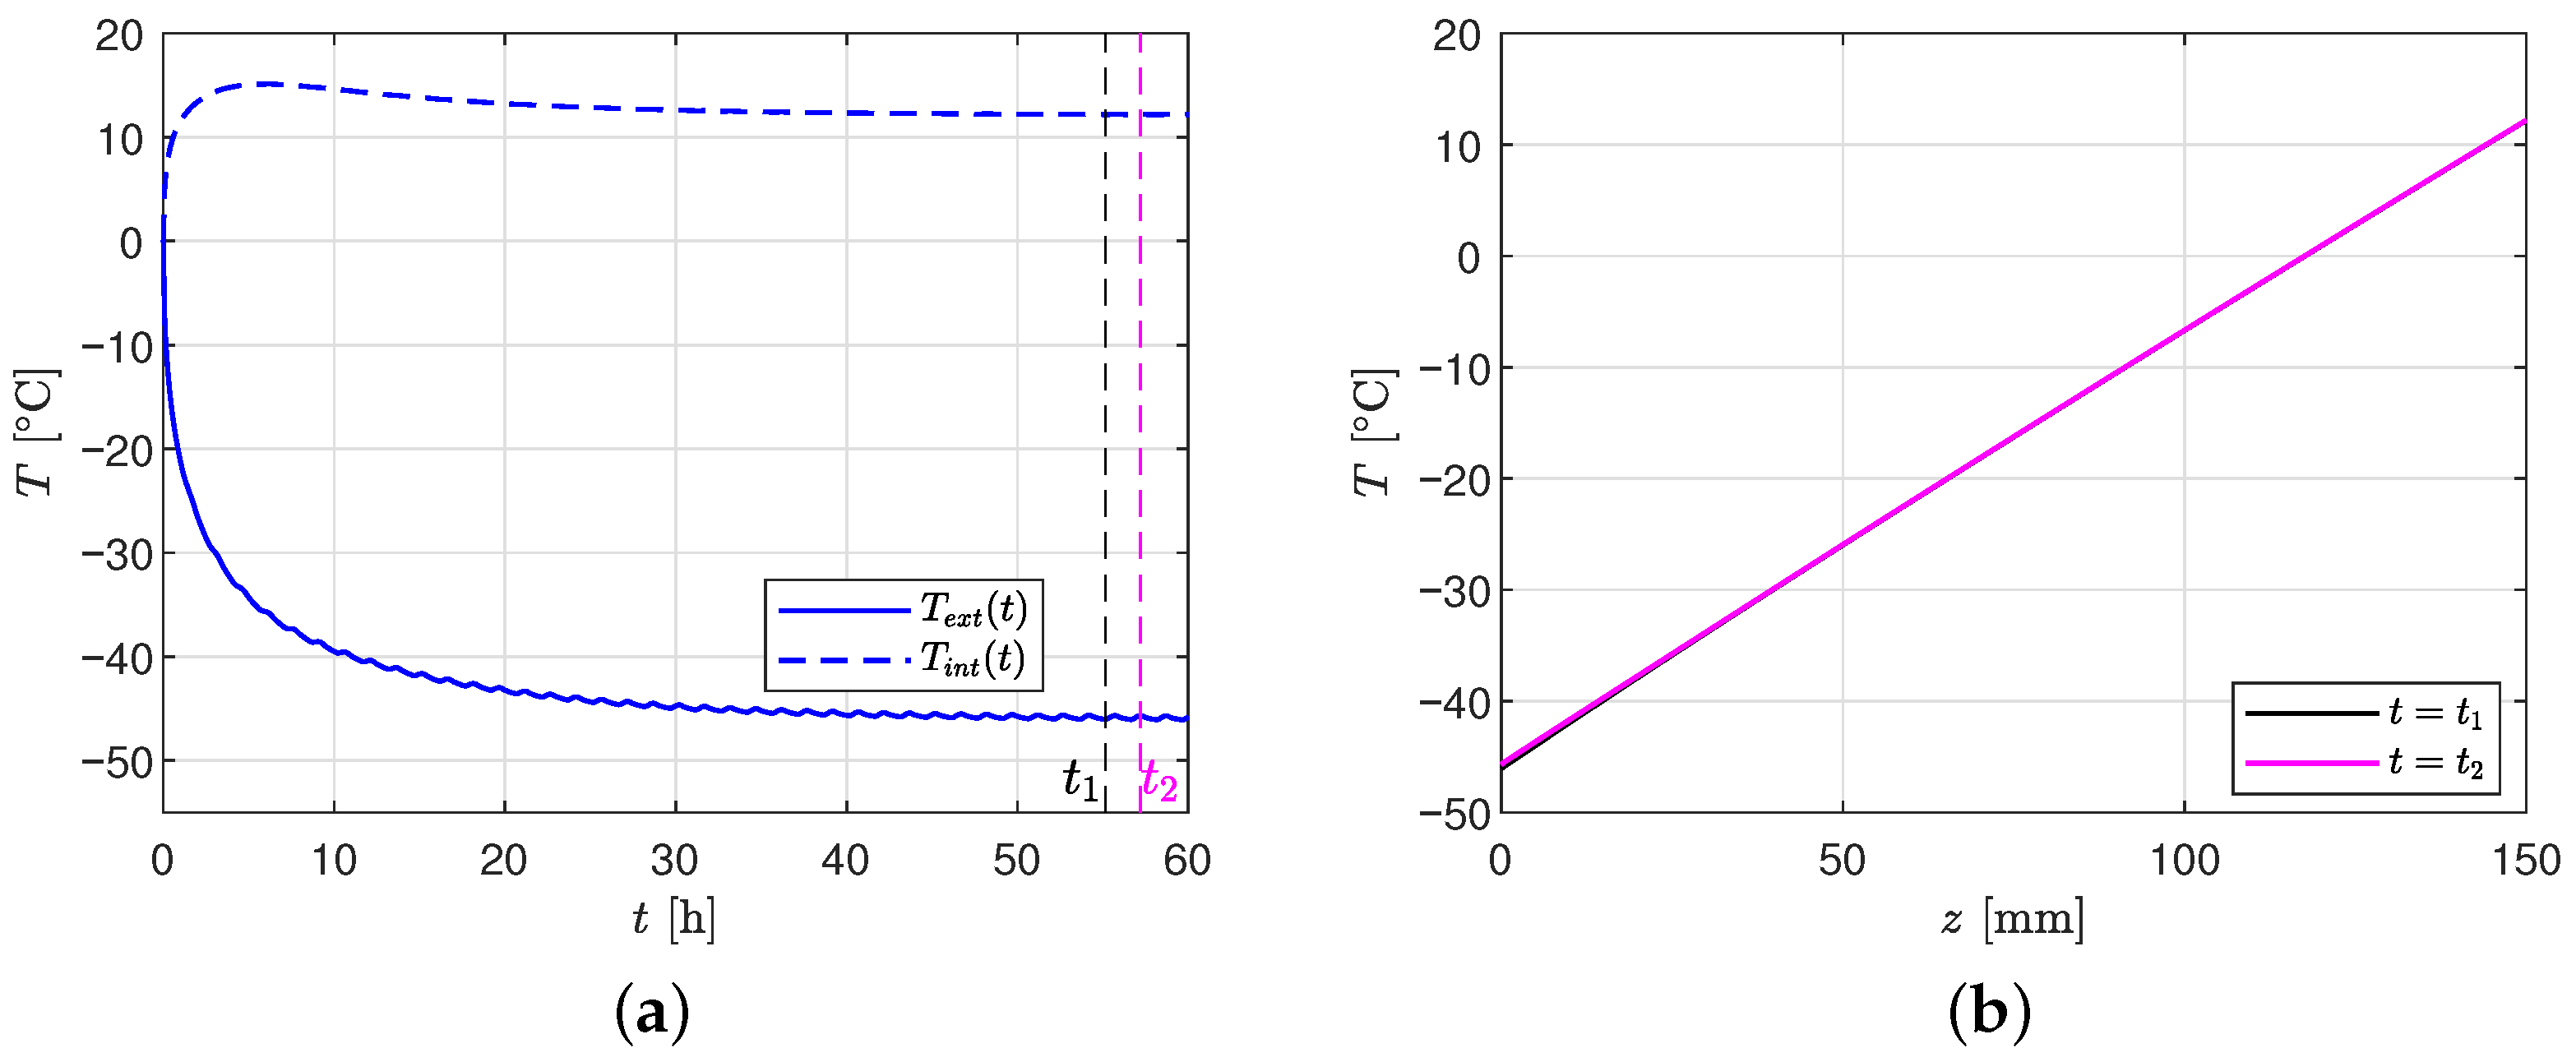
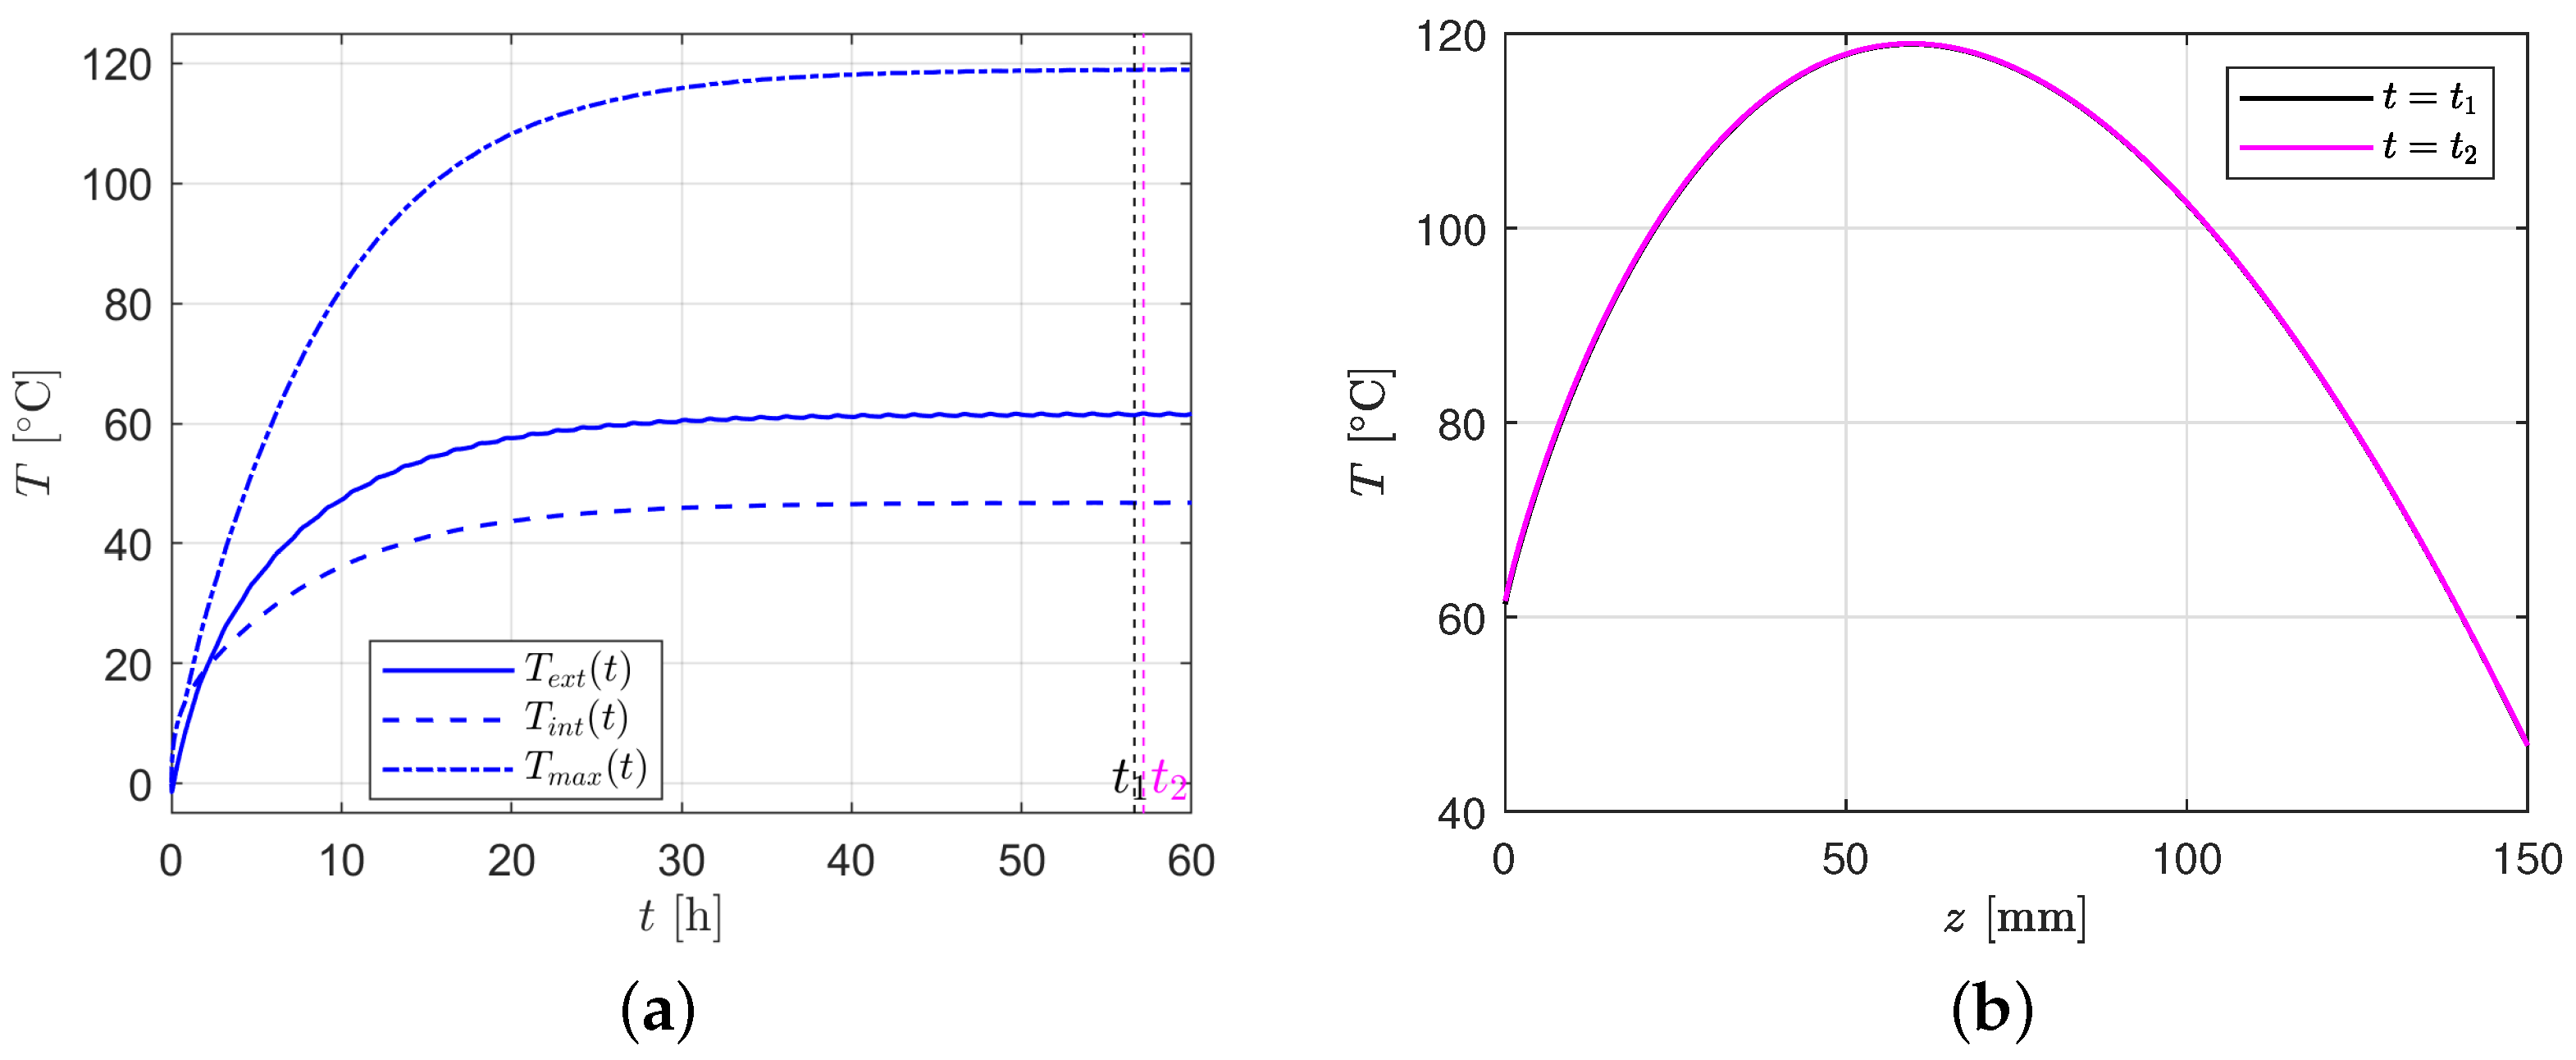
Table 2, results for the 150 mm thick pane are shown, complementing the 36.83 mm case in
Table 1. The increased thickness enhances the absorption of solar and albedo fluxes, resulting in a broader temperature range. In particular, for the
R orientation, the external panel surface for
reaches temperatures of about
, significantly lower than in the case
. The highly irradiated surface
L reaches temperatures of about
, higher than those calculated in [
16] for
. In both cases, the amplitude of the cyclic oscillations is limited, of the order of
.
These comparisons demonstrate that, for acrylic glass windows, the condition
usually considered for thermal design [
16,
17] since it corresponds to the greatest variation in solar radiation, is not the most severe. The condition
needs to be carefully evaluated, especially for thick panes. Specifically, temperatures on the Sun-exposed surface may surpass the acrylic glass transition point [
12,
13], potentially compromising its mechanical stiffness and strength. Meanwhile, the opposite shaded surface cools to extreme lows, where the material becomes prone to brittleness [
10,
11]. Given the strong temperature dependence of AG mechanical properties, these conditions pose a critical threat, since they can potentially lead to catastrophic failure in pressurized panels.
5. Conclusions
Our analysis of Low Earth Orbit conditions revealed that thick acrylic glass panes can exceed their operational temperature limits, identifying a previously underexplored risk. Unlike prior studies focused on orbits with maximal solar radiation variation, we identify a greater threat from highly Sun-inclined orbits. In these scenarios, the Sun-facing surface can heat beyond the glass transition temperature, causing a loss of stiffness and strength, while the opposite face may reach very low temperatures, to the point of severe embrittlement, especially when their thickness is high. These extreme thermal states present a critical hazard for the structural capacity of pressurized panes.
This study has two primary limitations. First, the temperature-dependent mechanical properties are derived from the literature. Although significant data variability highlights a need for targeted characterization of flight-grade materials, all datasets demonstrate severe degradation of stiffness and strength with temperature increase, culminating in structural unsuitability near the glass transition temperature, of the order of 100 °C. Second, the thermal model employs a 1D reduction, assuming uniform heating and ideal edge insulation. This simplification neglects in-plane temperature gradients caused by frame shielding and thermal bridging, which could produce localized thermal stresses. While acrylic’s low modulus and viscoelastic nature are expected to mitigate these stresses, the 1D approach is justified for its primary aim: predicting global temperature extremes. In large glazing systems, localized effects may alter the temperature distribution but not the absolute minima and maxima, a premise that ongoing 3D analyses will validate.
It is important to remark that this study does not conclude that acrylic glass is unsuitable for space station applications. First, the glazing temperature could be controlled through active or passive thermal regulation systems—not examined in this work—to preserve its structural and functional performance. Second, our thermal calculations rely on material properties sourced from the literature, yet acrylic glass encompasses a wide range of formulations. While specialized low-absorption acrylic grades may be custom-produced, obtaining precise thermal data for analysis remains challenging due to gaps in technical literature and manufacturer specifications.
Experimental validation in real, or high-fidelity simulated, conditions remains a critical next step. However, it necessitates access to specialized facilities and partnership with space agencies in a multi-year timeline, placing it beyond this study’s scope. Nevertheless, our research serves a pivotal purpose, since it delivers a first theoretical groundwork for subsequent experimental validation. Despite all its limitations, this study indicates that structural assessments must integrate transient thermal effects, moving beyond the limitations of simplified assumptions based on nominal orbital cases. These insights are vital prerequisites for the safe design of space glazing.
