Article

A New Slice Template Matching Method for Full-Field Temporal–Spatial Deflection Measurement of Slender Structures

1
School of Civil Engineering, Chongqing Jiaotong University, Chongqing 400074, China
2
China Merchant Chongqing Communication Research & Design Institute Co., Ltd., Chongqing 400067, China
3
School of Civil and Transportation Engineering, Shenzhen University, Shenzhen 518060, China
*
Author to whom correspondence should be addressed.
Appl. Sci. 2025, 15(11), 6188; https://doi.org/10.3390/app15116188
Submission received: 25 March 2025 / Revised: 13 May 2025 / Accepted: 15 May 2025 / Published: 30 May 2025
(This article belongs to the Special Issue Advances in Solid Mechanics and Applications to Slender Structures)

Abstract

:
A sufficient number of sensors installed in all structural components is a prerequisite for obtaining the full-field temporal–spatial displacement and is essential for large-scale structure health monitoring. In this paper, a novel lightweight vision-based temporal–spatial deflection measurement method is proposed to measure the full-field temporal–spatial displacement of slender structures. First, the geometric and mechanical properties of slender members are introduced as the priori information to vision-based measurement. Then, a slice template matching model is proposed by deploying a one-dimensional template matching model in every pixel column of each image frame, based on traditional digital image correlation (DIC) method. An indoor experiment was carried out to verify the proposed method, and experiment results show that measurement precision of STMM agrees well with the theory and the laser ranger, with a maximum measurement error of 0.03 pixels and the root-mean-square error (RMSE) of 0.052 mm, for transient beam deflection curve; with the correlation coefficient and coefficient of determination of 0.9994 and 0.9986, for dynamic deflection–time history curves at the middle-span point. Finally, further investigation reveals that brightness inconstancy is the source of STMM measurement error.

1. Introduction

In the past 40 years, many bridges have been built to serve the public, and 1,079,300 road bridges with a total length of 95,288,200 m [1] had been constructed in China alone by the end of 2023. Meanwhile, recent years have witnessed frequent bridge collapses, overturning, and other accidents, which have attracted great attention from highway maintenance and management departments. The Chinese transportation ministry launched an ambitious plan to install structural health monitoring (SHM) systems for all long-span bridges and special bridges across the sea [2] by the end of 2025, and many SHM systems have been installed [3,4]. SHM systems are composed of a large number various types of sensors, for example, the of Sutong Bridge SHM systems are composed of 785 sensors [3], and the Stonecutters Bridge SHM systems are consist of 1500 sensors of 20 types. Large quantity and types of sensors, complex data transmission and power supply circuits pose significant challenges to the system’s stability and service life.
Research [5,6] revealed that the SHM system’s ability to identify and locate structural damage is closely related to its density of the measurement points sets, and the damage can be accurately identified only when the sensors are placed on both sides of the damage location but cannot be identified if the sensors are located on only one side of the damage. Therefore, a large number of sensors becomes a prerequisite to locate the damage in each structural component of bridges, which poses great challenge of tremendous cost to bridge owners, as well as huge workload to engineers. As a result, it is an urgent requirement to develop low-cost full-field displacement monitoring technology.
Machine vision-based motion tracking technology has the advantages of non-contactness, cost-effectiveness, convenience, and high efficiency, and can record continuous temporal and spatial motion of objects at high speed. As the technology is highly compatible with the requirements of structural monitoring and damage identification, it has been widely applied in bridge health monitoring [7,8,9,10,11,12,13,14]. Dong [8] and Ye [9] systematically investigate various motion tracking methods, including the DIC, feature points matching, optical flow, geometrical matching, etc. Vision-based motion tracking methods are applied in different aspects of bridge measurement [7,8], for example, influence line of deflection measurement [13], modal information recognition [8], damage identification, cable force estimation, and structural technical condition evaluation [5,14,15,16,17,18]. Feature extraction and matching-based motion tracking algorithms suffer from a large number of redundant traversal searches and multi-scale feature computations, and feature mismatching occurs frequently [13,14], which reduces the accuracy of structure monitoring.
In this paper, we aim to transfer the geometric properties of large slender ratio member structure and small deformation hypothesis in engineering mechanics to priori knowledge and introduce it into the machine vision-based slender structure deflection monitoring model. A lightweight vison-based model, slice template matching model (STMM), is proposed and verified to measure the full-field temporal–spatial displacement of slender ratio structure by constructing a 1-D template matching model in every pixel column of each structure image frame. This paper is organized as follows: Section 2 introduces the theory of vison-based full-field structural displacement measurement methods and problems encountered; Section 3 proposes the STMM method based on the geometric properties and mechanical priori knowledge of slender structure; Section 4 verifies the STMM method by an indoor multi-box simple support beam experiment; finally, Section 5 provides conclusions and possible perspectives.

2. Vision-Based Structural Displacement Measurement Methods

2.1. Digital Image Correlation Theory

Digital Image Correlation (DIC) is one of the most commonly used dynamic displacements measurement method for small structures or components with speckles preinstalled on specimen surface. In DIC, correlation coefficients are used to characterize the approximation of two same size images, and a variety of correlation coefficients definitions have been proposed [15]. For two same size images f and g in an image sequence, indicating different deformed states of a component, the most commonly used correlation coefficient is the Normalized Sum of Squared Differences (CNSSD) [5,9], formulated as follows [15]:
C N S S D = i = 0 M 1 j = 0 N 1 [ f ( i , j ) g ( i , j ) ] 2 i = 0 M 1 j = 0 N 1 f ( i , j ) 2 i = 0 M 1 j = 0 N 1 g ( i , j ) 2
where M and N are the image height and width, and i and j are the row and column pixel coordinates, respectively, all are in terms of pixels. In general, high precision motion tracking in DIC can be divided into two stages, pixel-level displacement location and subpixel-level displacement calculation, as shown in Figure 1.
For a n-frame image sequence, the sub-image of tracked object is selected as mask and the CNSSD matrices are calculated traversed in all frames of images. In the kth frame (k = 1, 2, 3, …, n), the pixel coordinate (xkp, ykp), in accordance with the smallest value in CNSSD, is the pixel-level location of the mask in motion. Then, the sub-pixel coordinates (xk, yk) of tracked target can be calculated using CNSSD surface fitting, or gray moment conservation [19] in neighborhood of the pixel-level coordinates (xkp, ykp). The motion of tracked object can be recorded with the initial coordinates (x0, y0) and a series of dynamic coordinates (xk, yk) (k = 1, 2, 3, …, n) at different times.

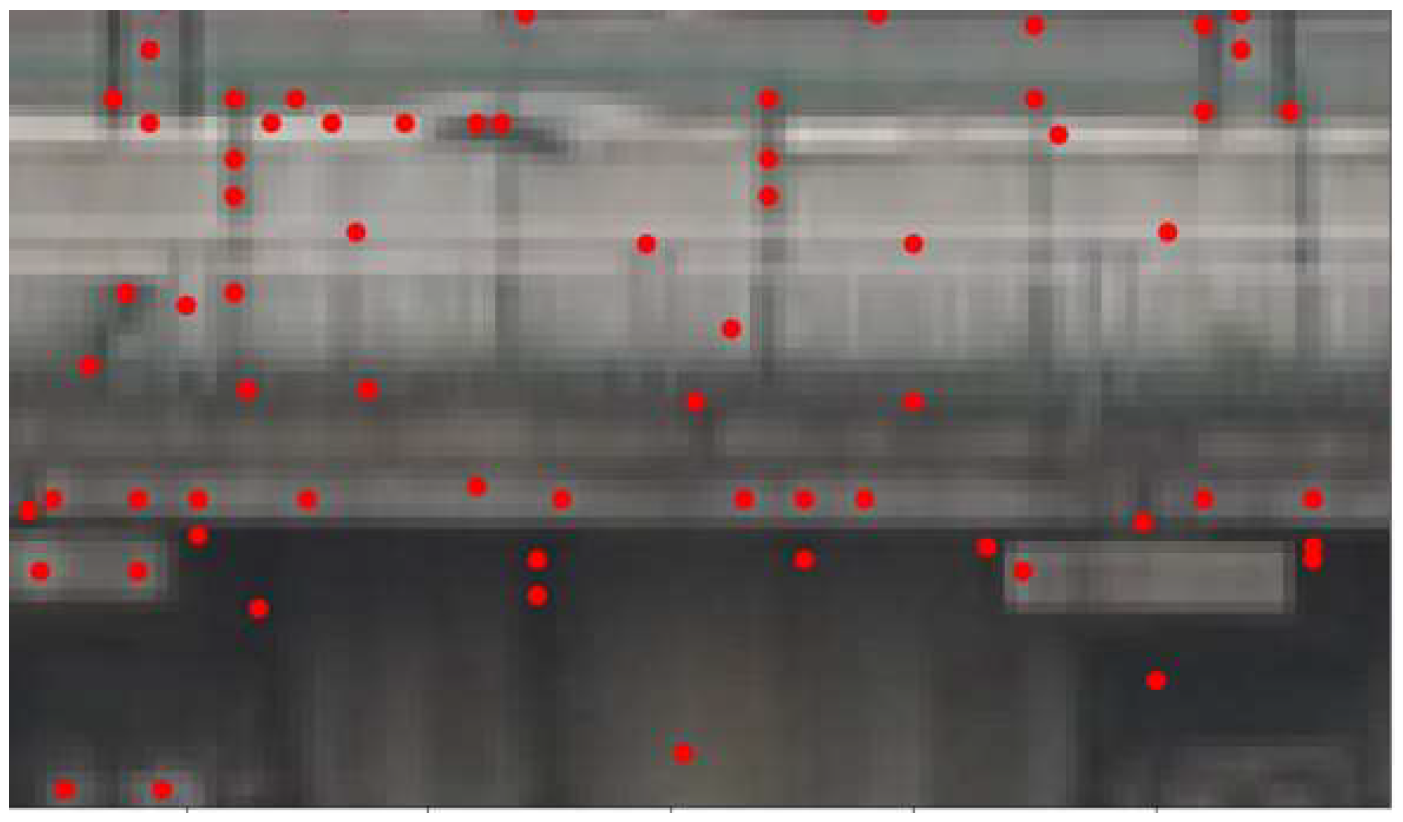
2.2. Feature-Based Motion Tracking

Feature extraction-and-matching is another popular vision-based motion tracking method, and Scale Invariant Feature Transform (SIFT) is the most frequently used multiscale feature [7,8,16,17,18], among Harris–Tomasi, SIFT, and Speeded Up Robust Features (SURF). However, there are a large amount of computation redundancies, as well as feature mismatching, in structural displacement measurement by feature-based motion tracking method, due to the non-uniformly distributed gray gradients that are caused by dust and oil stains texture on structure surfaces, as shown in Figure 2. Chu [13] proposed a method to constrain motion inconsistency to eliminate the mismatching problems, and Zheng [14] proposed a two-staged Random Sample Consensus (RANSAC) and a geometrical prior information method to remove the mismatching. Huang [20] suggested that the accuracy of the displacement measured by feature extraction of natural structure surface texture is low, and that high-reflectance artificial markers or speckles should be prefabricated or installed. Among the problems of feature-based motion tracking methods in full-field displacement measurements, the first is that the non-uniform distribution of feature points, the red points in Figure 2, do not satisfy the requirements of high-precision strain calculation through displacement interpolation, which prefer uniformly distributed feature points as shown in Figure 3.
Moreover, to achieve high precision measurements, the huge workload in prefabrication and installation of a large number of high-reflectance artificial markers or speckles on structure surface is also a great challenge for engineers in full-field temporal–spatial deformation of large-scale structures. Generally, feature mismatching, computational redundancy, and huge time and economic consumption pose great difficulties to real-time full-field displacement monitoring of large-scale structures. Therefore, it is necessary to put forward a light-weight, full-field temporal–spatial deformation measurement or displacement monitoring method for large-scale structures.

3. Full-Field Temporal–Spatial Displacement Measurement of Large Slender Ratio Structure

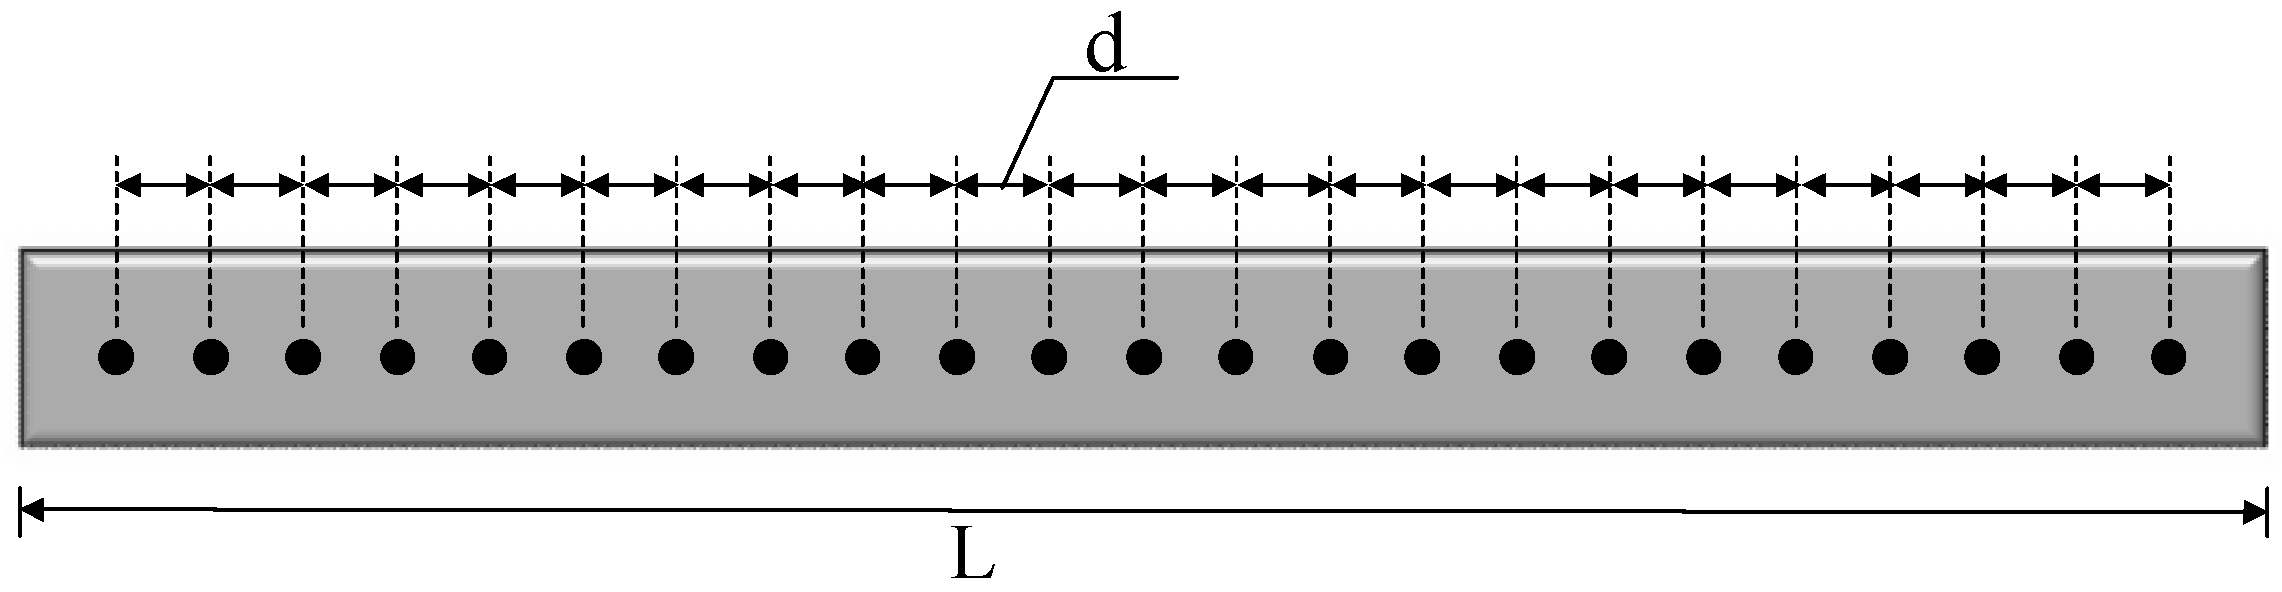
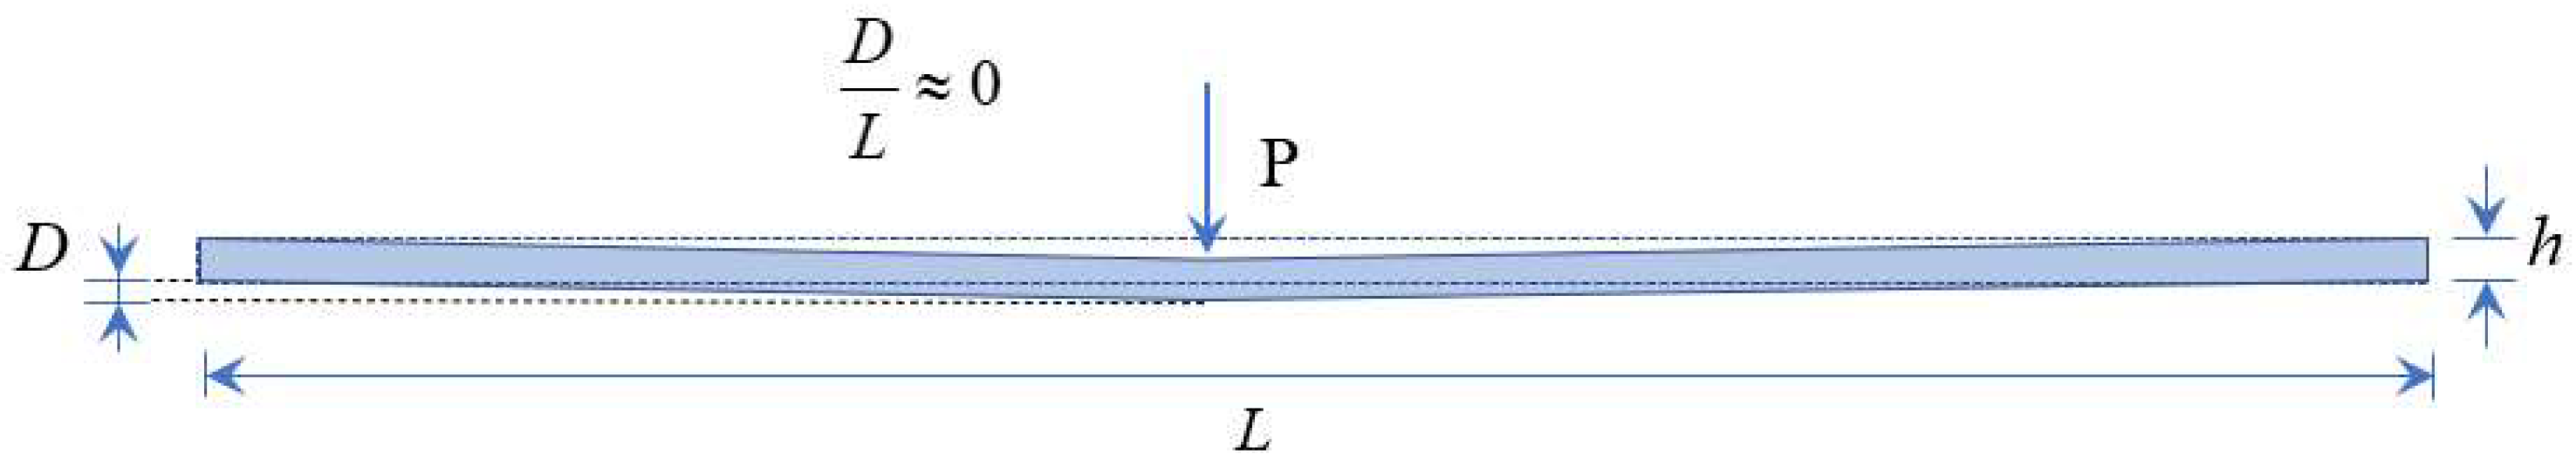
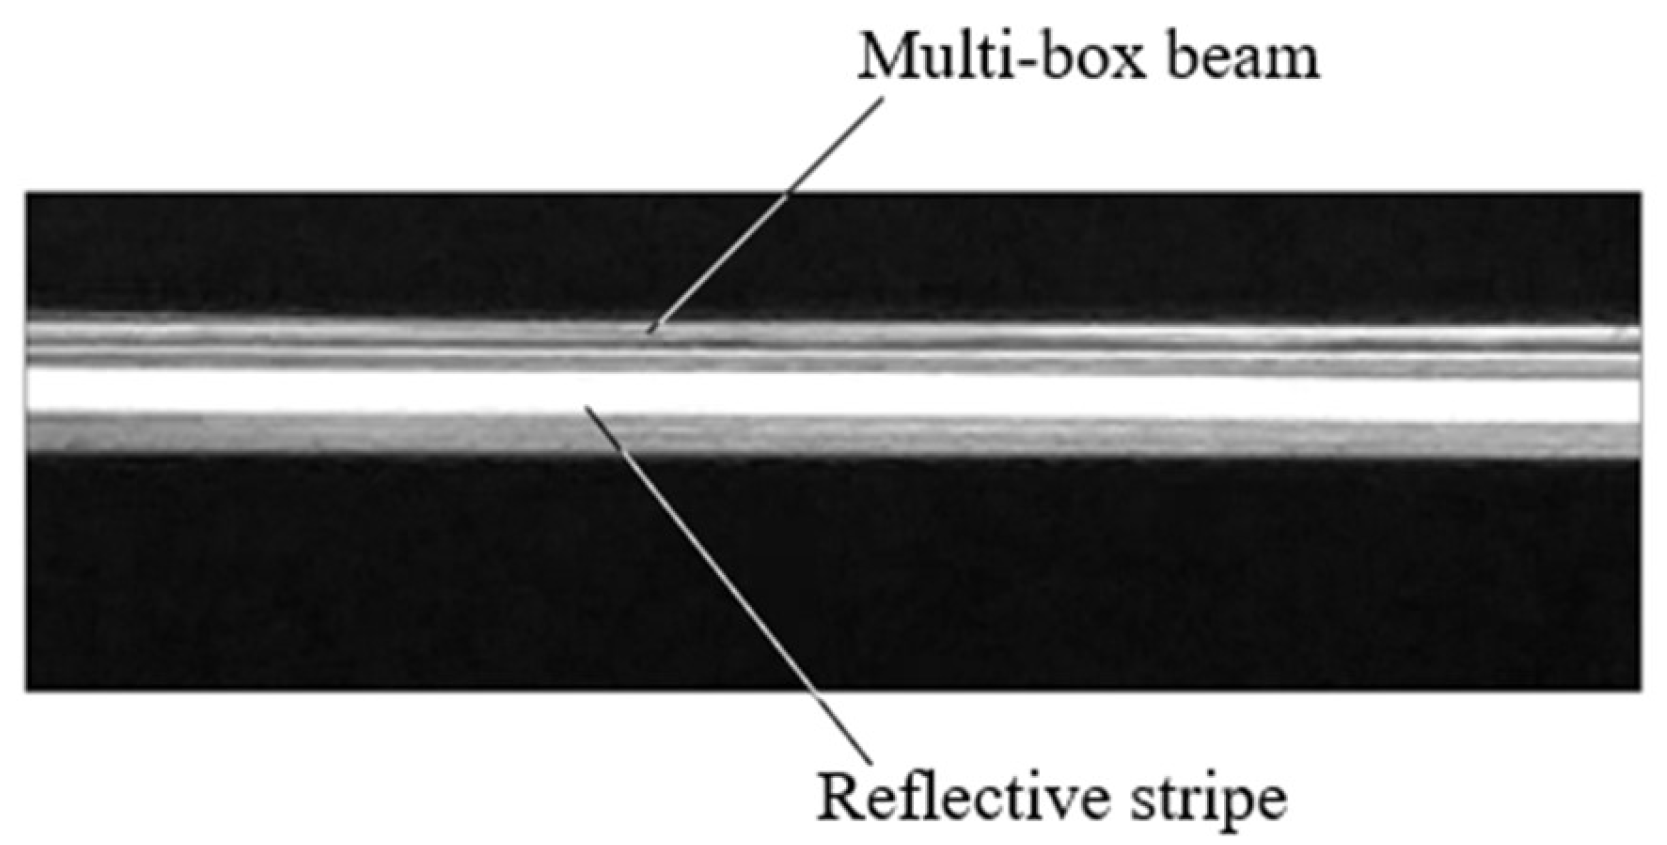
3.1. Priori Knowledge of Slender Structure Geometry and Deformation

Large slender ratio member is widely applied in bridge engineering, including beams, cables, bars, piers, and the scale of one dimension in the structure is much larger than the other two dimensions. In the case of slender beam members subjected to pure bending loads, for example, the length is much larger than its height and width, and the main deformation concerned in engineering mechanics is the deflection, with the axial and shear deformation being neglected. Accordingly, the deformation magnitudes and rotation angles of points within the same transverse section are considered the same, and the full-field displacement measurement of the pure bending beam in Figure 2 can be transferred to the measurement of deflection monitoring of points along the beam length in Figure 4.
For slender beams subjected to eccentric axial and transverse loads, the ideal single row of uniform feature points distribution for deflection measurement, as shown in Figure 4, is also applicable, but the axial–bending interactions should be taken into consideration in structural health diagnosis or status evaluation.
In this way, the geometrical features and deformation characteristics of slender structure could be taken into the vision-based motion tracking model as the priori information to construct a new feature paradigm, which lays a foundation for the extraction full-field temporal–spatial displacement of slender structures. Therefore, for large-span bridges, the number of measurement points deployed on the surface of the structure will be greatly reduced, but it is still difficult to manually preinstall reflective markers for DIC or feature-based motion tracking.

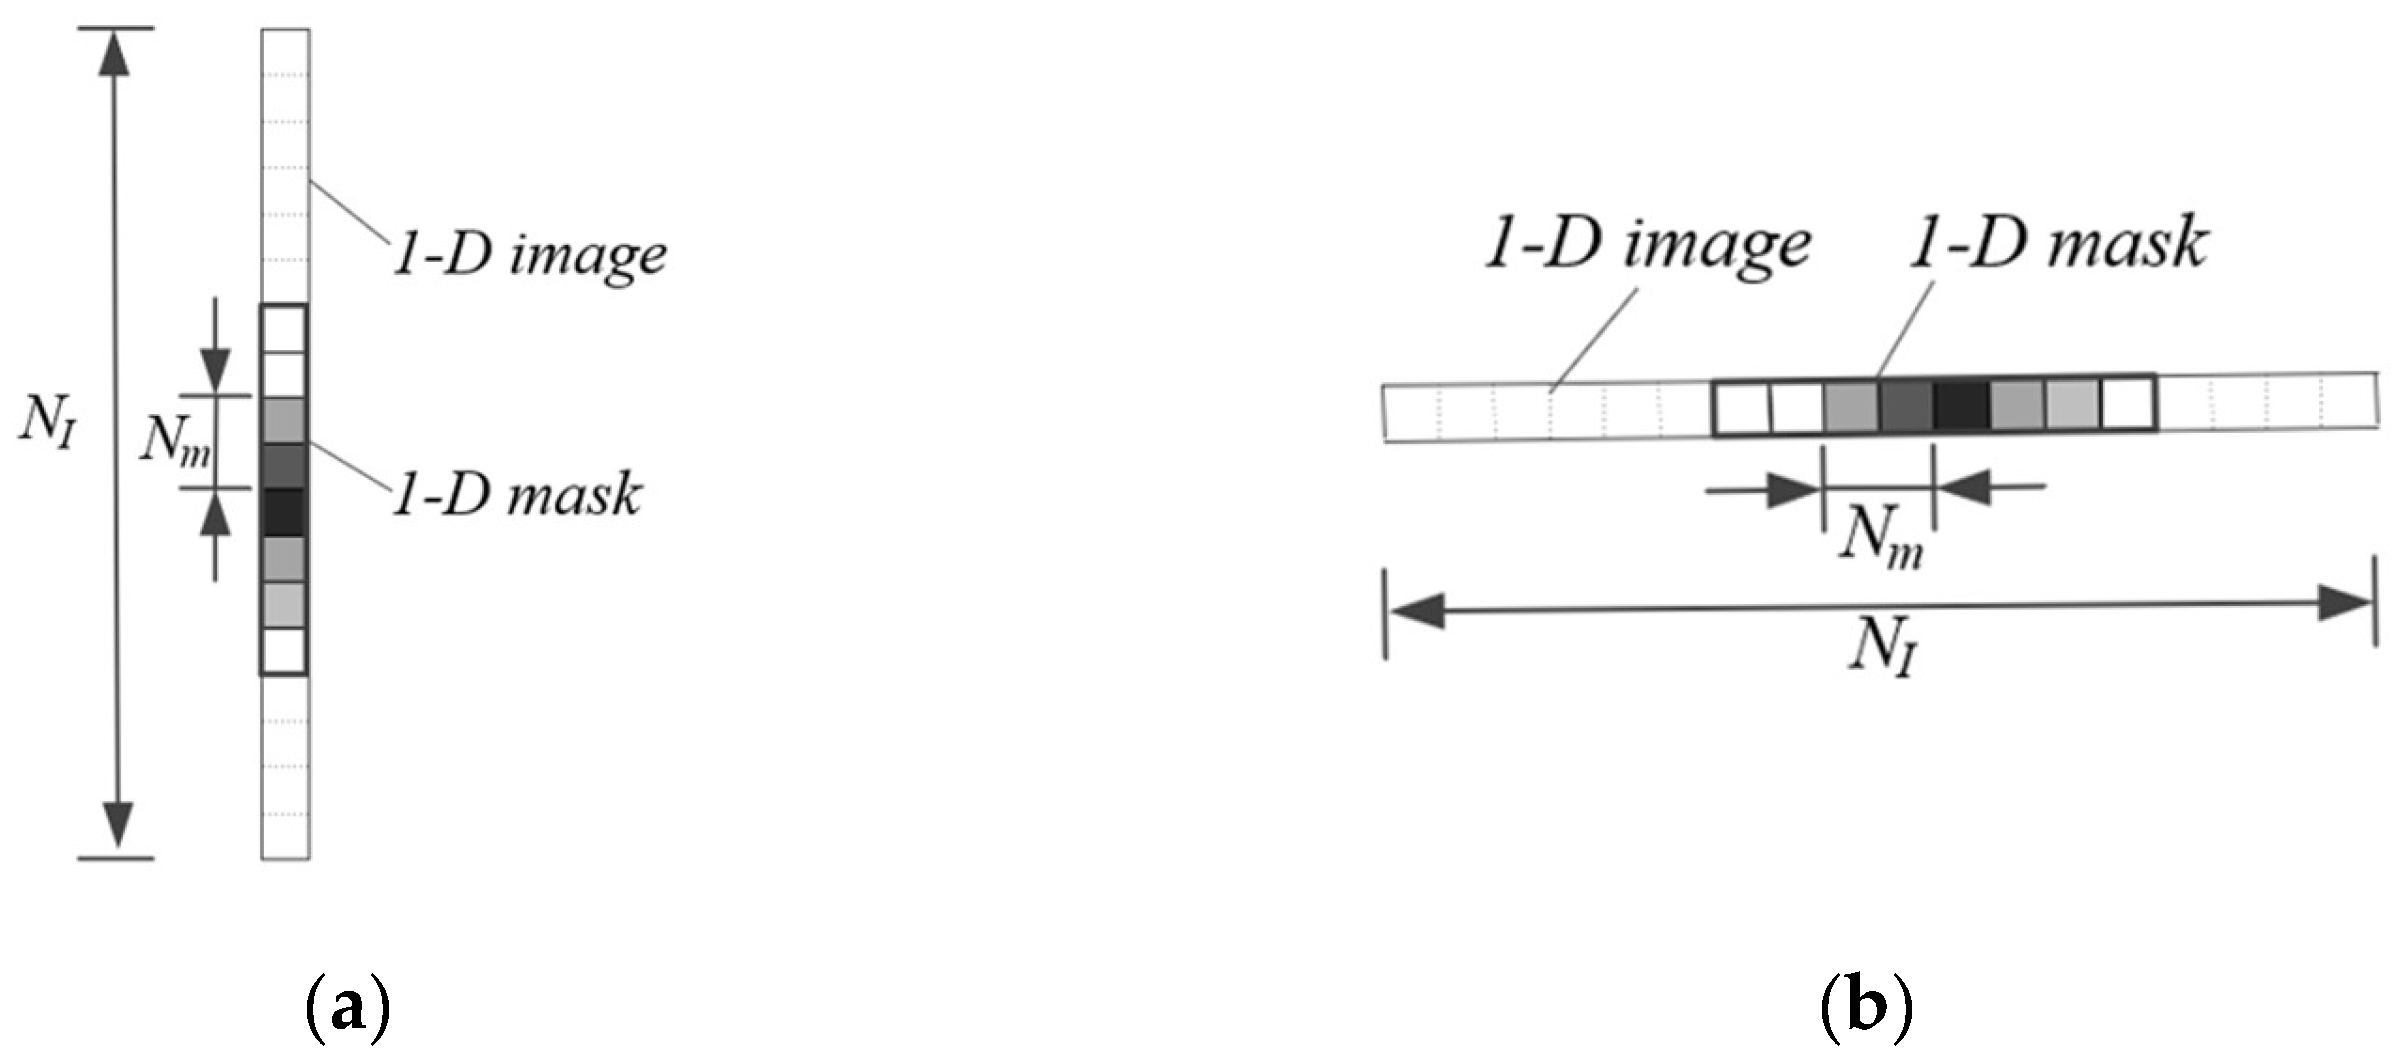
3.2. One-Dimension DIC Model

For each point in the ideal single row of uniform distributed monitoring points on the beam in Figure 4, a reduced one-dimension DIC model could be constructed, degrading from the traditional template matching method or DIC method. For 1-D images of any column or row in 2-D image, shown in Figure 5, the template matching method still works.
For a one-dimension template matching model, CNSSD can be formulated as
C N S S D = i = 0 m 1 [ f ( i , j ) g ( i , j ) ] 2 i = 0 m 1 f ( i , j ) 2 i = 0 m 1 g ( i , j ) 2
where m is the number of correlation transversal in one column or row.

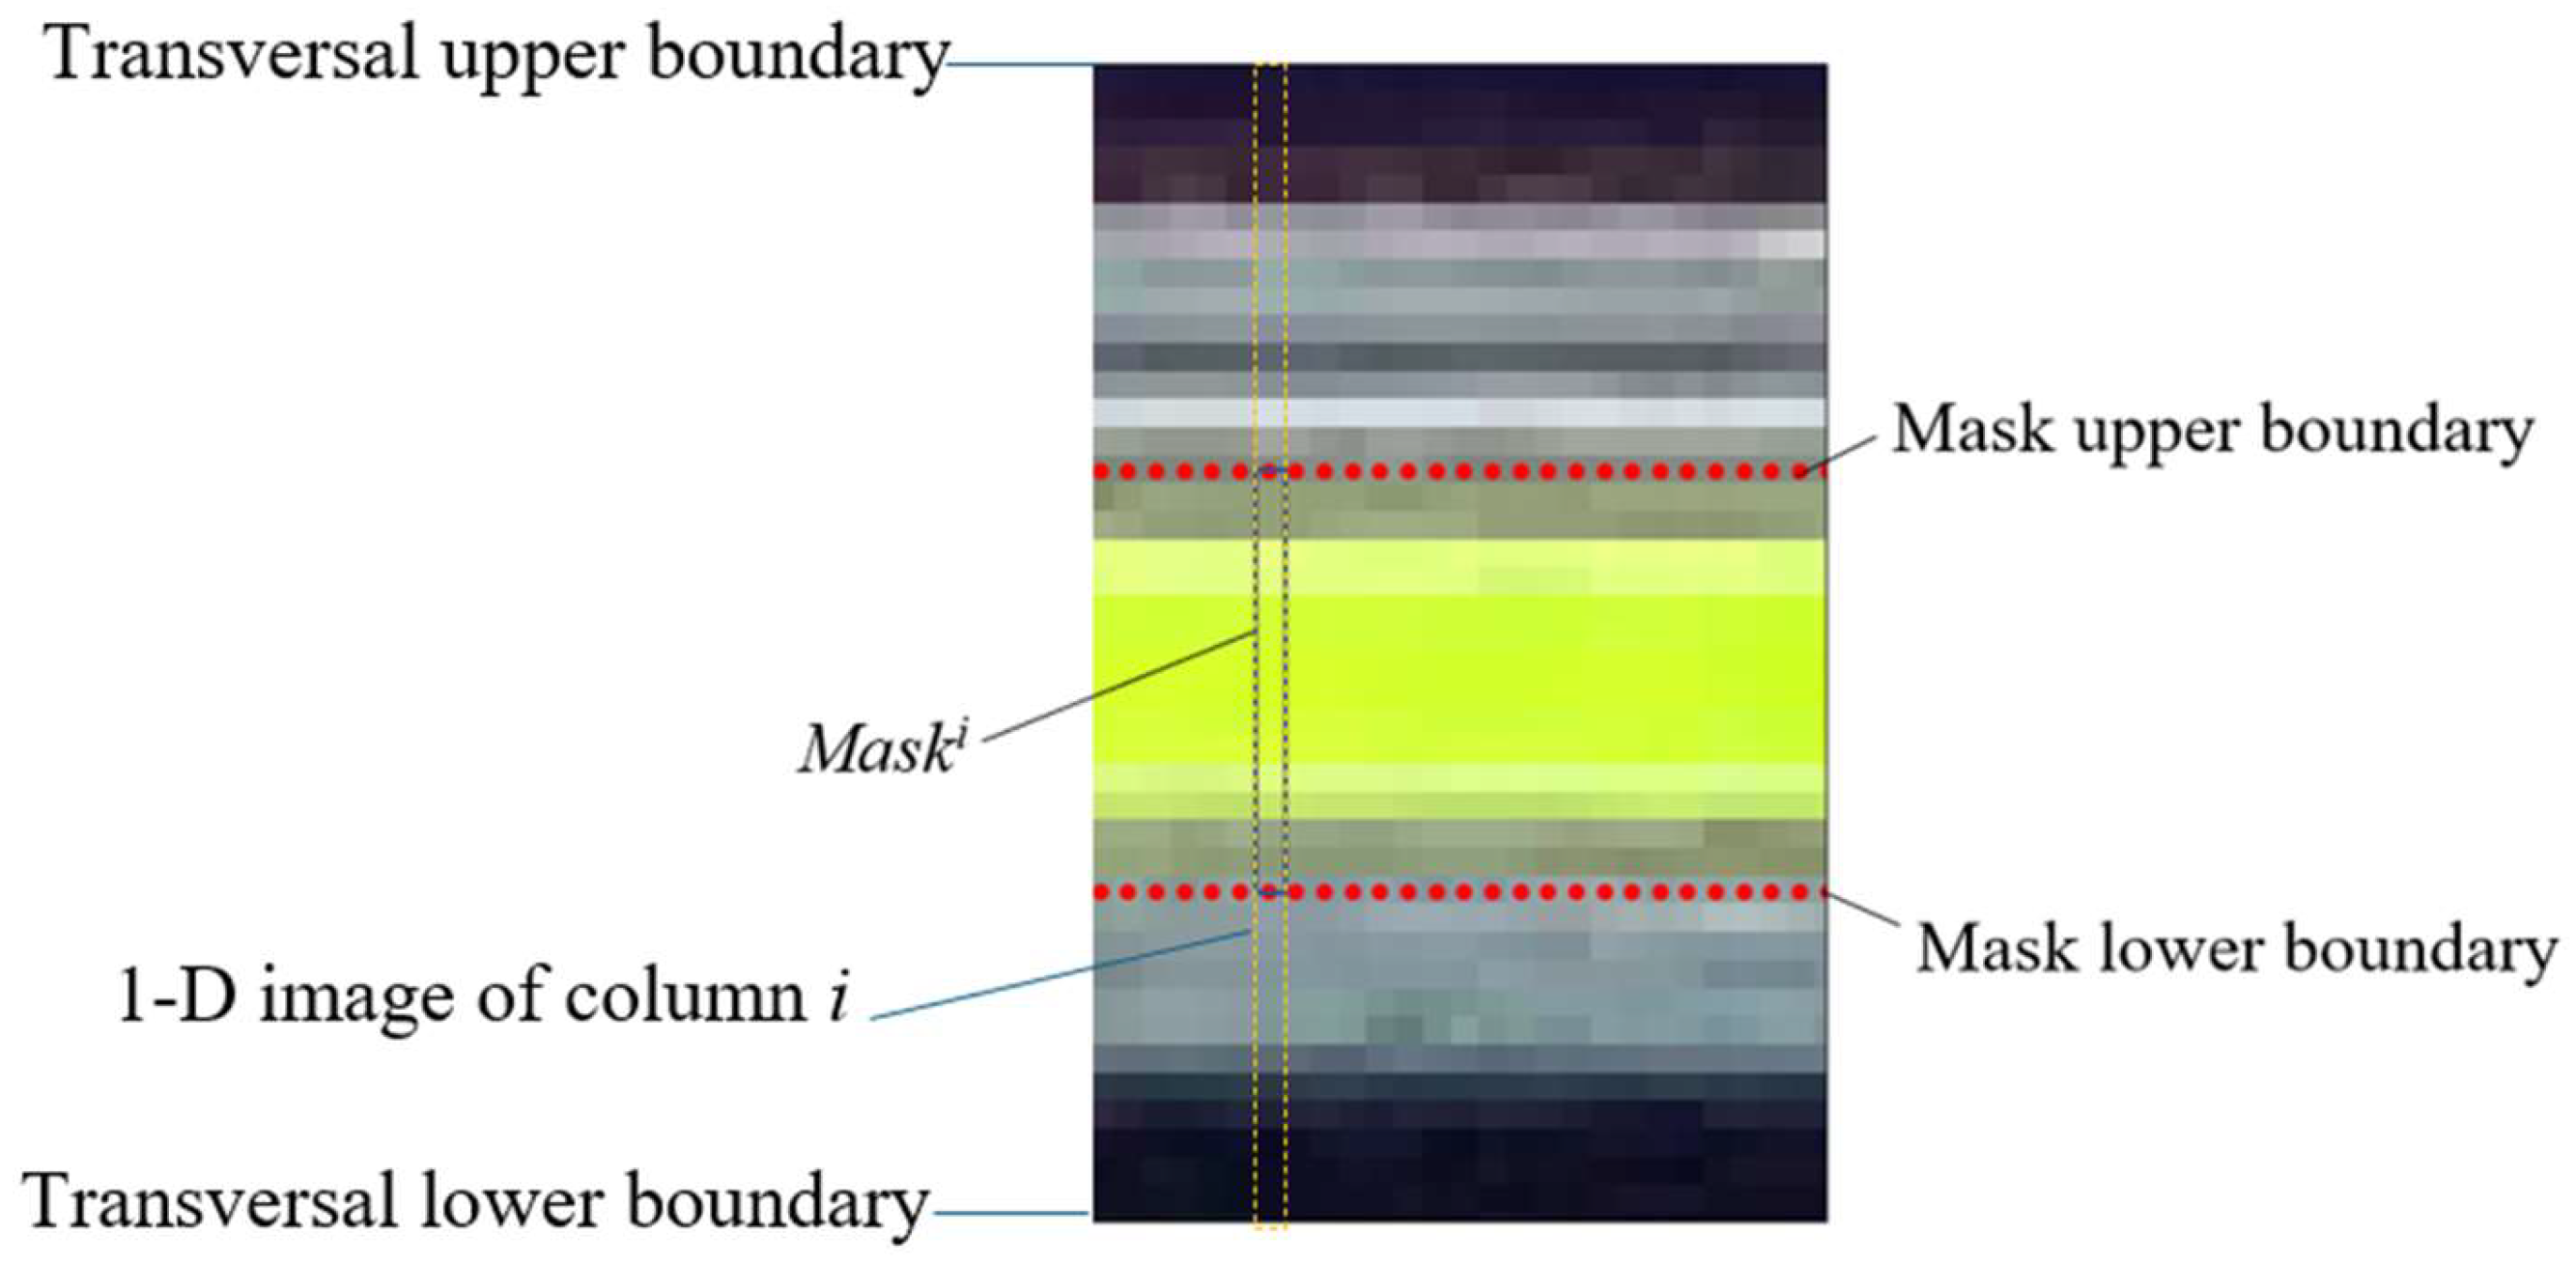
3.3. Slice Template Matching Model

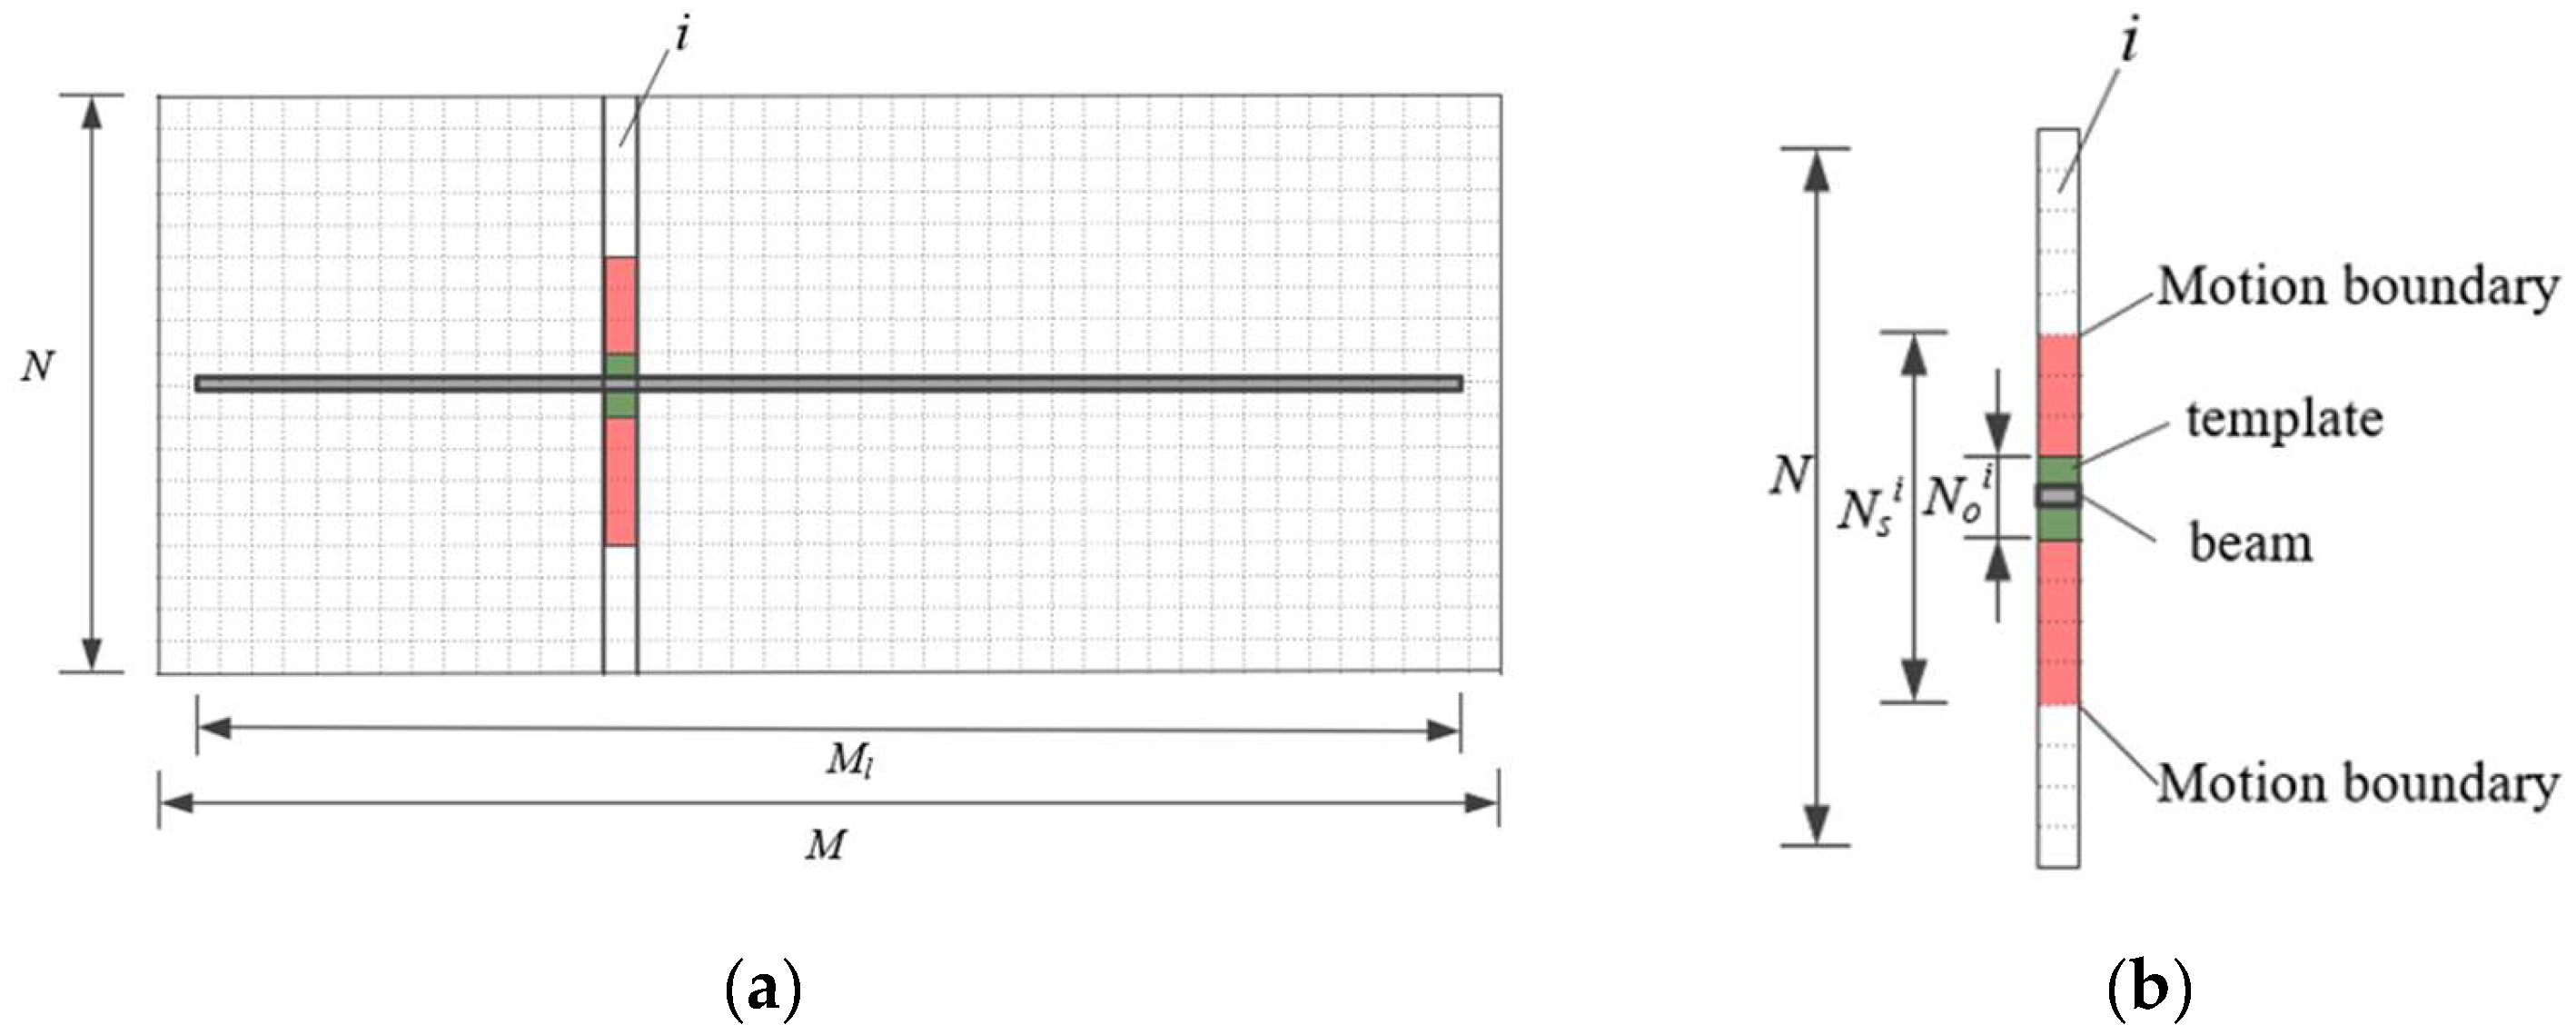
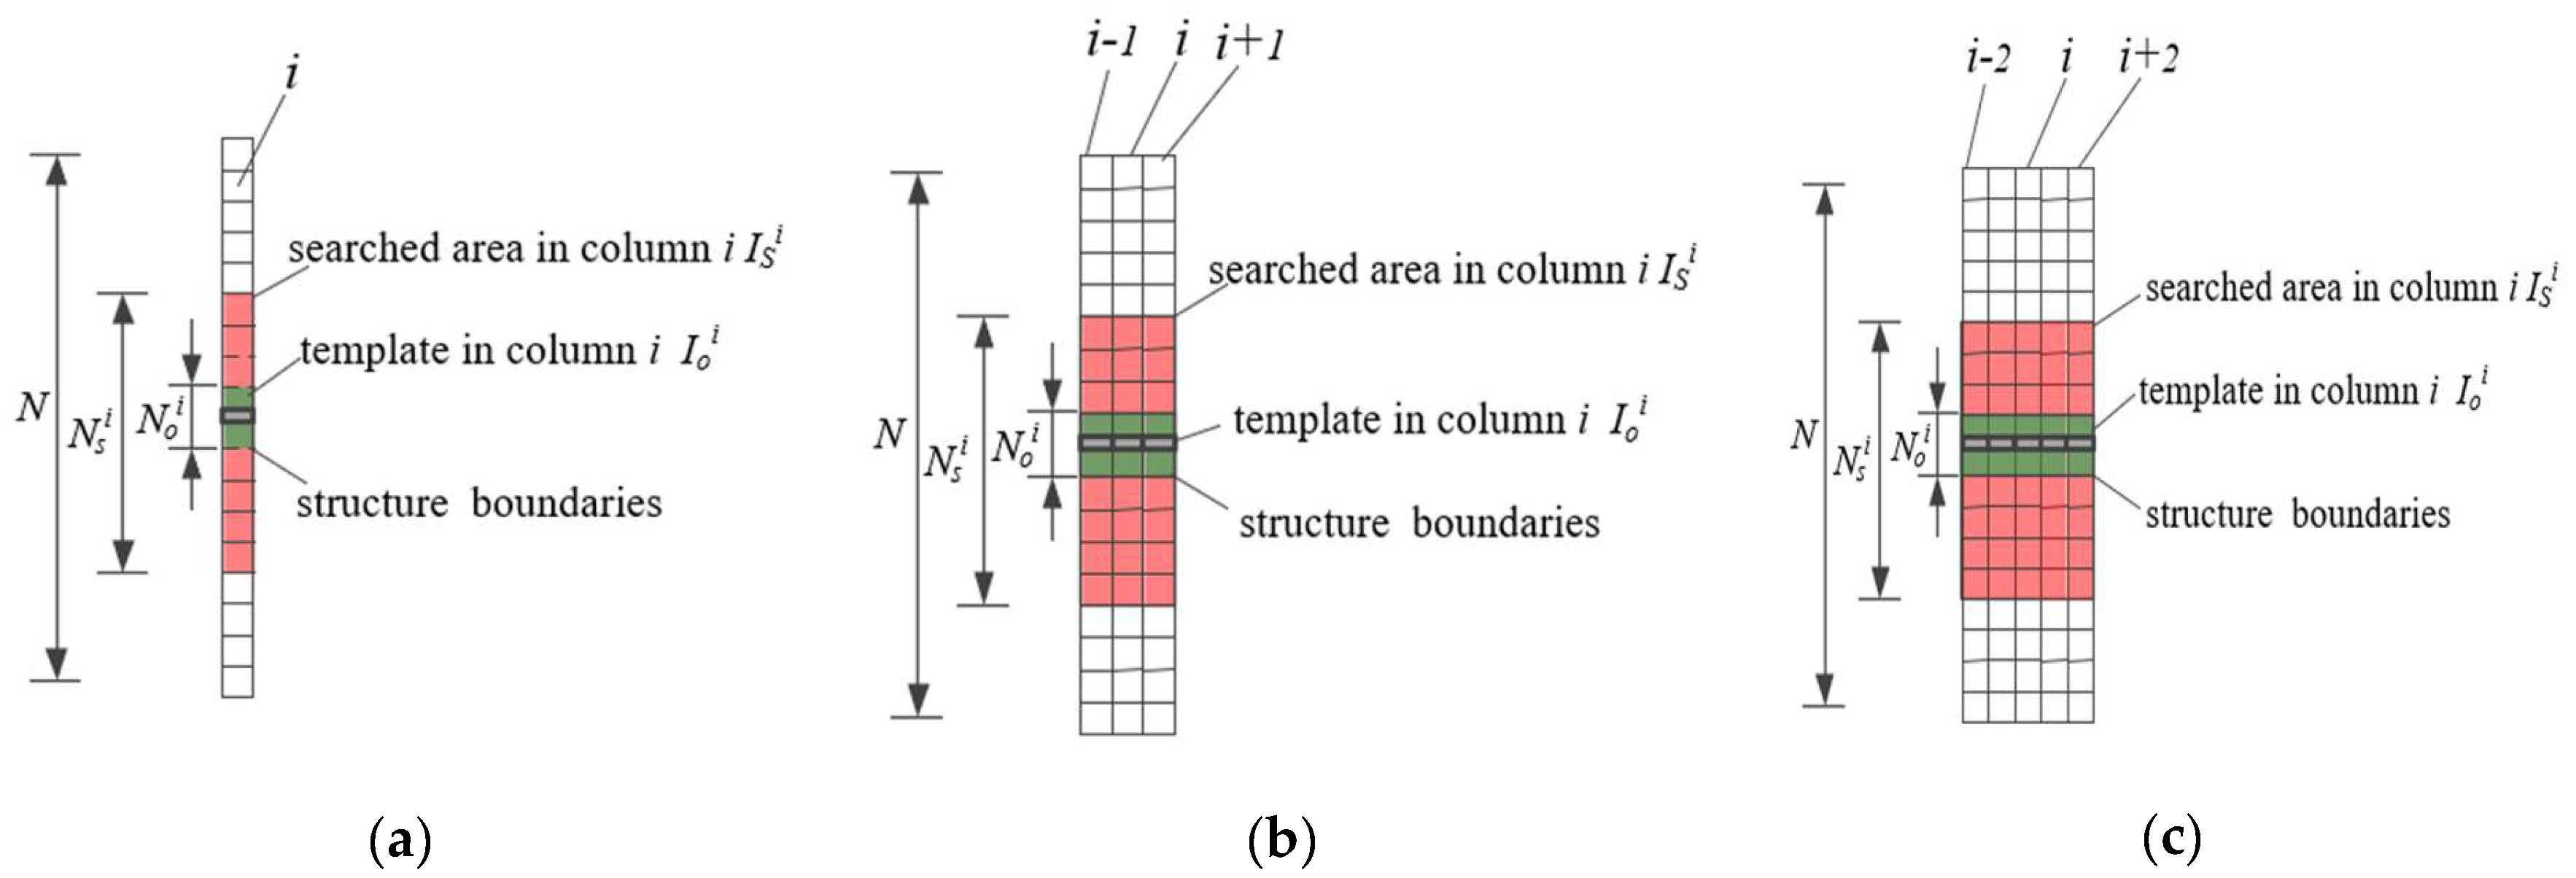
3.3.1. Concept of Single Slice Template Matching Model (STMM)

In vision-based monitoring, the slender structure, for example a beam, is captured and stored in a 2-D gray image as shown in Figure 6a, and there is good distinguishability of the gray-scale values in the vertical direction, but poor distinguishability horizontally. Without preinstalled markers, it is difficult to track the motion of the beam by DIC method or feature-based motion tracking method, but it is possible to track any motion of the single 1-D image in the i-th column of the image, as shown in Figure 6a.
For the 1-D image composed of N pixels, the N0i pixels contains the beam section and is set as the mask as shown in Figure 6b, and the transversal pixels is the mask’s possible motion region in the column indicated as Nsi, where i is the column number in the image. Therefore, a one-dimension template matching model could be set up, and the number of pixels within the transversal sections in each column can be determined by the priori geometrical, mechanical information of the beam as follows.
The number of pixels in mask N0i should be slightly larger than that of beam height, and the height of transversal section Hs is formulated as follows:
H S = h + k D ( 1.2 k 1.5 )
where h is the height of beam, and D is the deflection value calculated theoretically from material property, priori loading and geometry information, as shown in Figure 7. k is a constant empirical coefficient between 1.2 and 1.5.
In this way, the full-field deformation measurement of the beam can be transferred to a series of 1-D template matching models to trace the deflections of uniform measure points in Figure 4, and this one-dimensional template matching model is called Slice Template Matching Model (STMM). In practical application, the number of measurement points arranged on the beam surface can be determined according to engineering requirement, and the maximum number is the number of pixels columns Ml covered by the beam length in image space, i.e., one template matching model is established for each column of pixels. Then, the dynamic full-field displacement measurement of the slender structure is converted into Ml series of STMM per frame in the image sequence.
It is clear that the STMM resolves the two-direction distinguishability challenge in the beam image, by converting the measurement task into multiple one-dimensional template matching processes, which require distinguishability only in the vertical dimension. This approach can be easily achieved for bridge structure located in natural light environment while maintaining high computational efficiency. Moreover, multiple one-dimension models are computed independently each column, and it helps the realization of parallel computation. Meanwhile, this computation independence between columns helps to avoid interference in the neighborhood, as in the two-dimension template matching method model or in the feature matching method, which induces computation redundancy as well as mismatching. The simplicity and interpretability of STMM are better than feature extraction-and-matching based method.

3.3.2. Multiple Slice Template Matching Model and Implementation Process

To reduce local optical noise or similar texture on structure surface, causes by similar oil and dust stains or unexpected nonuniform illustrations, the slice template matching model can also be applied in a one-dimension image composed of n neighbor pixel columns (n = 1, 3, 5), as shown in Figure 8, and it is named the Multiple Slice Template Matching Model (MSTMM). For n-pixel width Slice Template Matching Model, the number of measurement point is Ml − n + 1, Ml is the number of pixels in the beam length in the image space, and the computation amount increase almost linearly with width of STMM.
The STMM proposed in this paper is a vision-based structure displacement measurement method, and, in practical engineering applications, the prior information of geometry, material and structure should be carefully analyzed as the basis for the design and setup of vision-based systems, for example, the selection of cameras, lens. At the same time, the selection of template, transversal region and mask width is a complex trial and error process. The workflow of the proposed slice template matching is outlined in Figure 9.

4. Experiment Verification

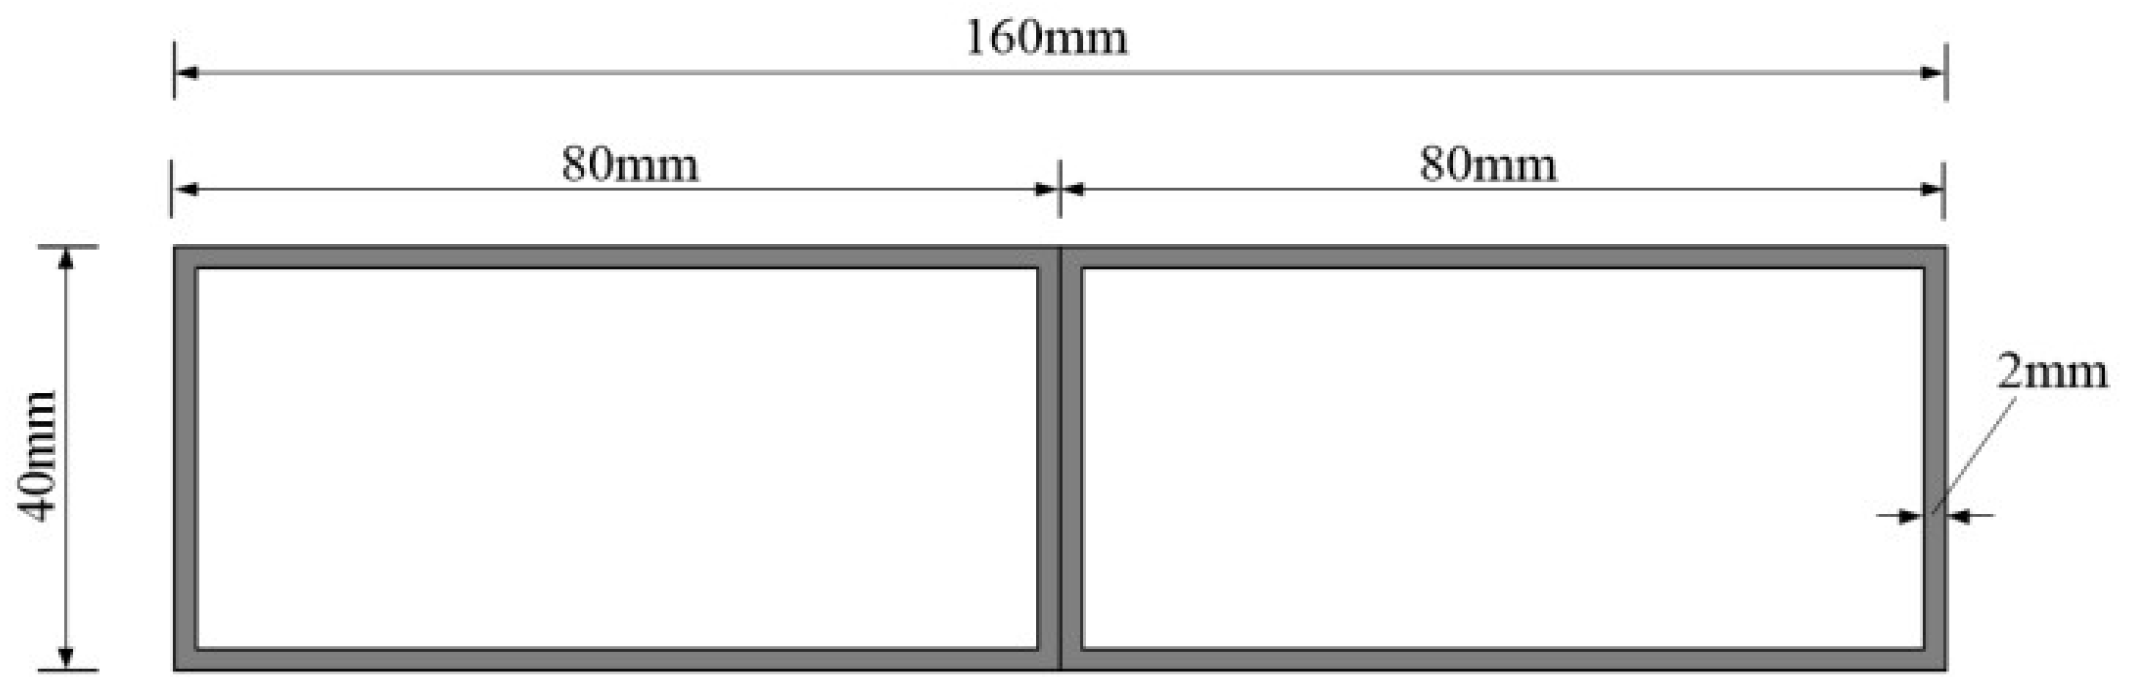
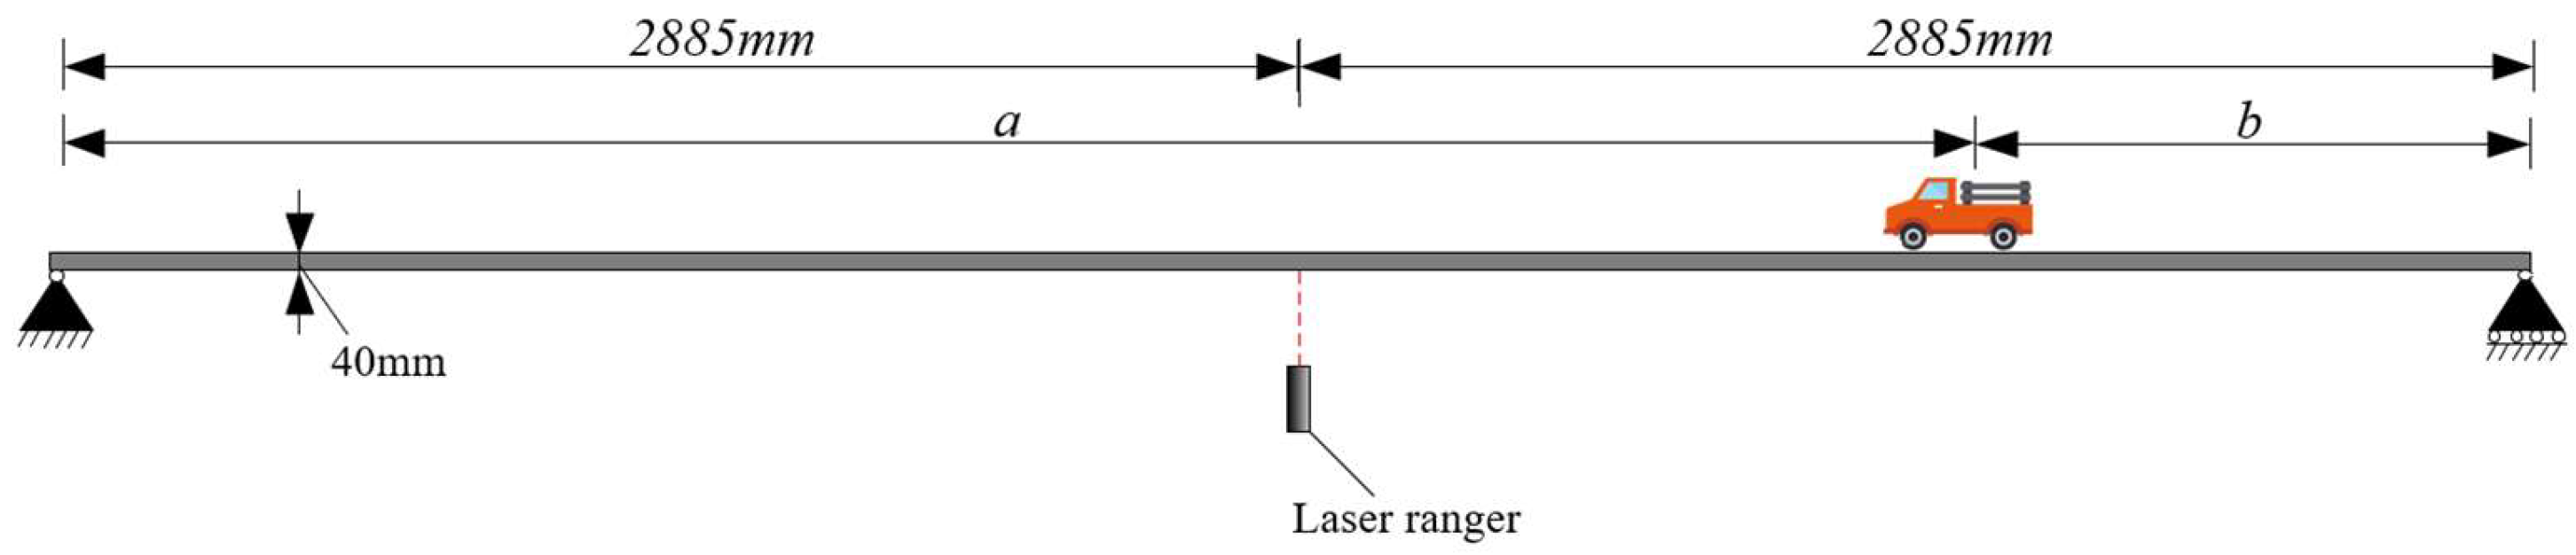
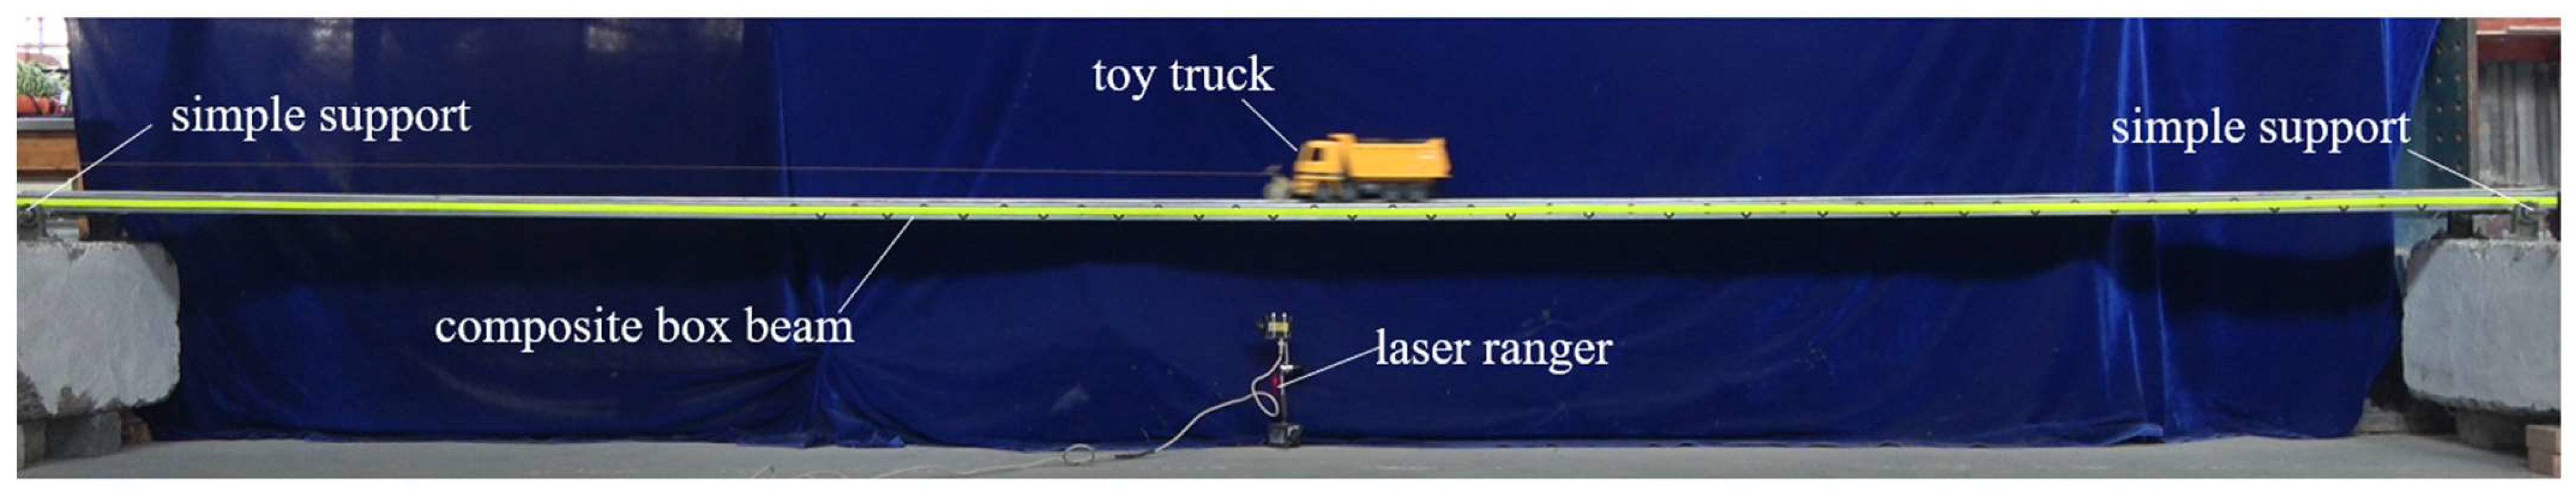
4.1. Experiment Design and Arrangement

An indoor simply supported the composite–box–beam experiment under moving load was designed to validate the accuracy of full-field temporal–spatial structural displacement measurement with STMM. In the experiment, the beam is 5.77 m long, with a cross section of 160 mm in width, 40 mm in height, and 2 mm in thickness, shown in Figure 10.
On the simply supported beam, the dynamic load F was applied with an 8 kg toy truck, traveling from the right support end to the left at a constant speed, as shown in Figure 11. The total image sequence was taken in 8 s, and the toy truck started 1.8 s after the shooting began. Then, the truck traveled to the middle span point at 4.2 s, arriving the left end at 6.6 s and stopped until the shot was over.
Theoretically, the beam deflection curve, under concentrated force F, can be formulated according to the differential equation in mechanics of materials.
w ( x ) = F b x 6 E I z l ( l 2 x 2 b 2 )         0 x a F b 6 E I z l [ l b ( x a ) 2 + ( l 2 b 2 ) x x 3 ]   a x l
where w is the deflection of beam, a and b are the distance between concentrated force and the two supports end, respectively, shown in Figure 11, and EIz is the flexural rigidity of the beam.
In the experiment, the image sequence was captured orthogonally by a SONY video camera, and the dynamic displacement–time history curve in the mid-span of the beam were measured with a laser ranger, and the parameters of the camera and laser ranger are listed in Table 1.
In the image, the number of pixels along test beam length direction is 3770 pixels, and the spatial measurement resolution of the system is 1.53 mm/pixel. Research showed that high reflection coefficient material [20] could help to improve the accuracy of machine vision measurement. A 1.5 cm reflective strip in height was stuck on the beam surface, shown in Figure 12, to improve the distinguishability between structural surface and the environment.
The setup of the simple supported composite box beam experiment under moving toy truck load is shown in Figure 13.
Following the procedure in Figure 9, the mask and transversed region are selected in each column of 1-D image, as shown of the ith column in Figure 14, and slice template matching model was set up column by column. Totally the entire beam region was segmented into 3770 columns, and 3770 1-D slice template matching models were setup to track the full-field temporal–spatial deflection of the simply supported beam.
The dynamic response of the beam is recorded at the speed of 25 frames per second when the toy truck travels from the right end to the left end, and a total of 94,250 displacement data can be calculated per second for all 3770 monitoring points along the beam.

4.2. Measurement Error Analysis

As the data volume is huge in full-field temporal–spatial deflection measurement of large structures, it poses great difficulties to the calibration of the dynamic displacements of such a large number of measure points at the same time. To verify the measurement precision of STMM, two specific scenes were designed. One scene is to verify the transient full-field displacements of the beam at any time, and another scene is to verify the dynamic displacement–time curve at any point on the beam. In the first scene, the full field deflection curve of simply supported beam can be calculated theoretically with Equation (4) if the loading location is known, and the deflection curve can also be measured by STMM at the same time, when the toy truck traveling at the loading location. The errors of all 3770 STMM measurement points can be obtained by comparing the theoretical and experimental deflection curves. In the second scene, the dynamic displacement–time curve of any point along the beam can be measured by both a laser ranger and a corresponding one-dimension STMM, and similarly the error between the two motion tracking methods can be calculated.

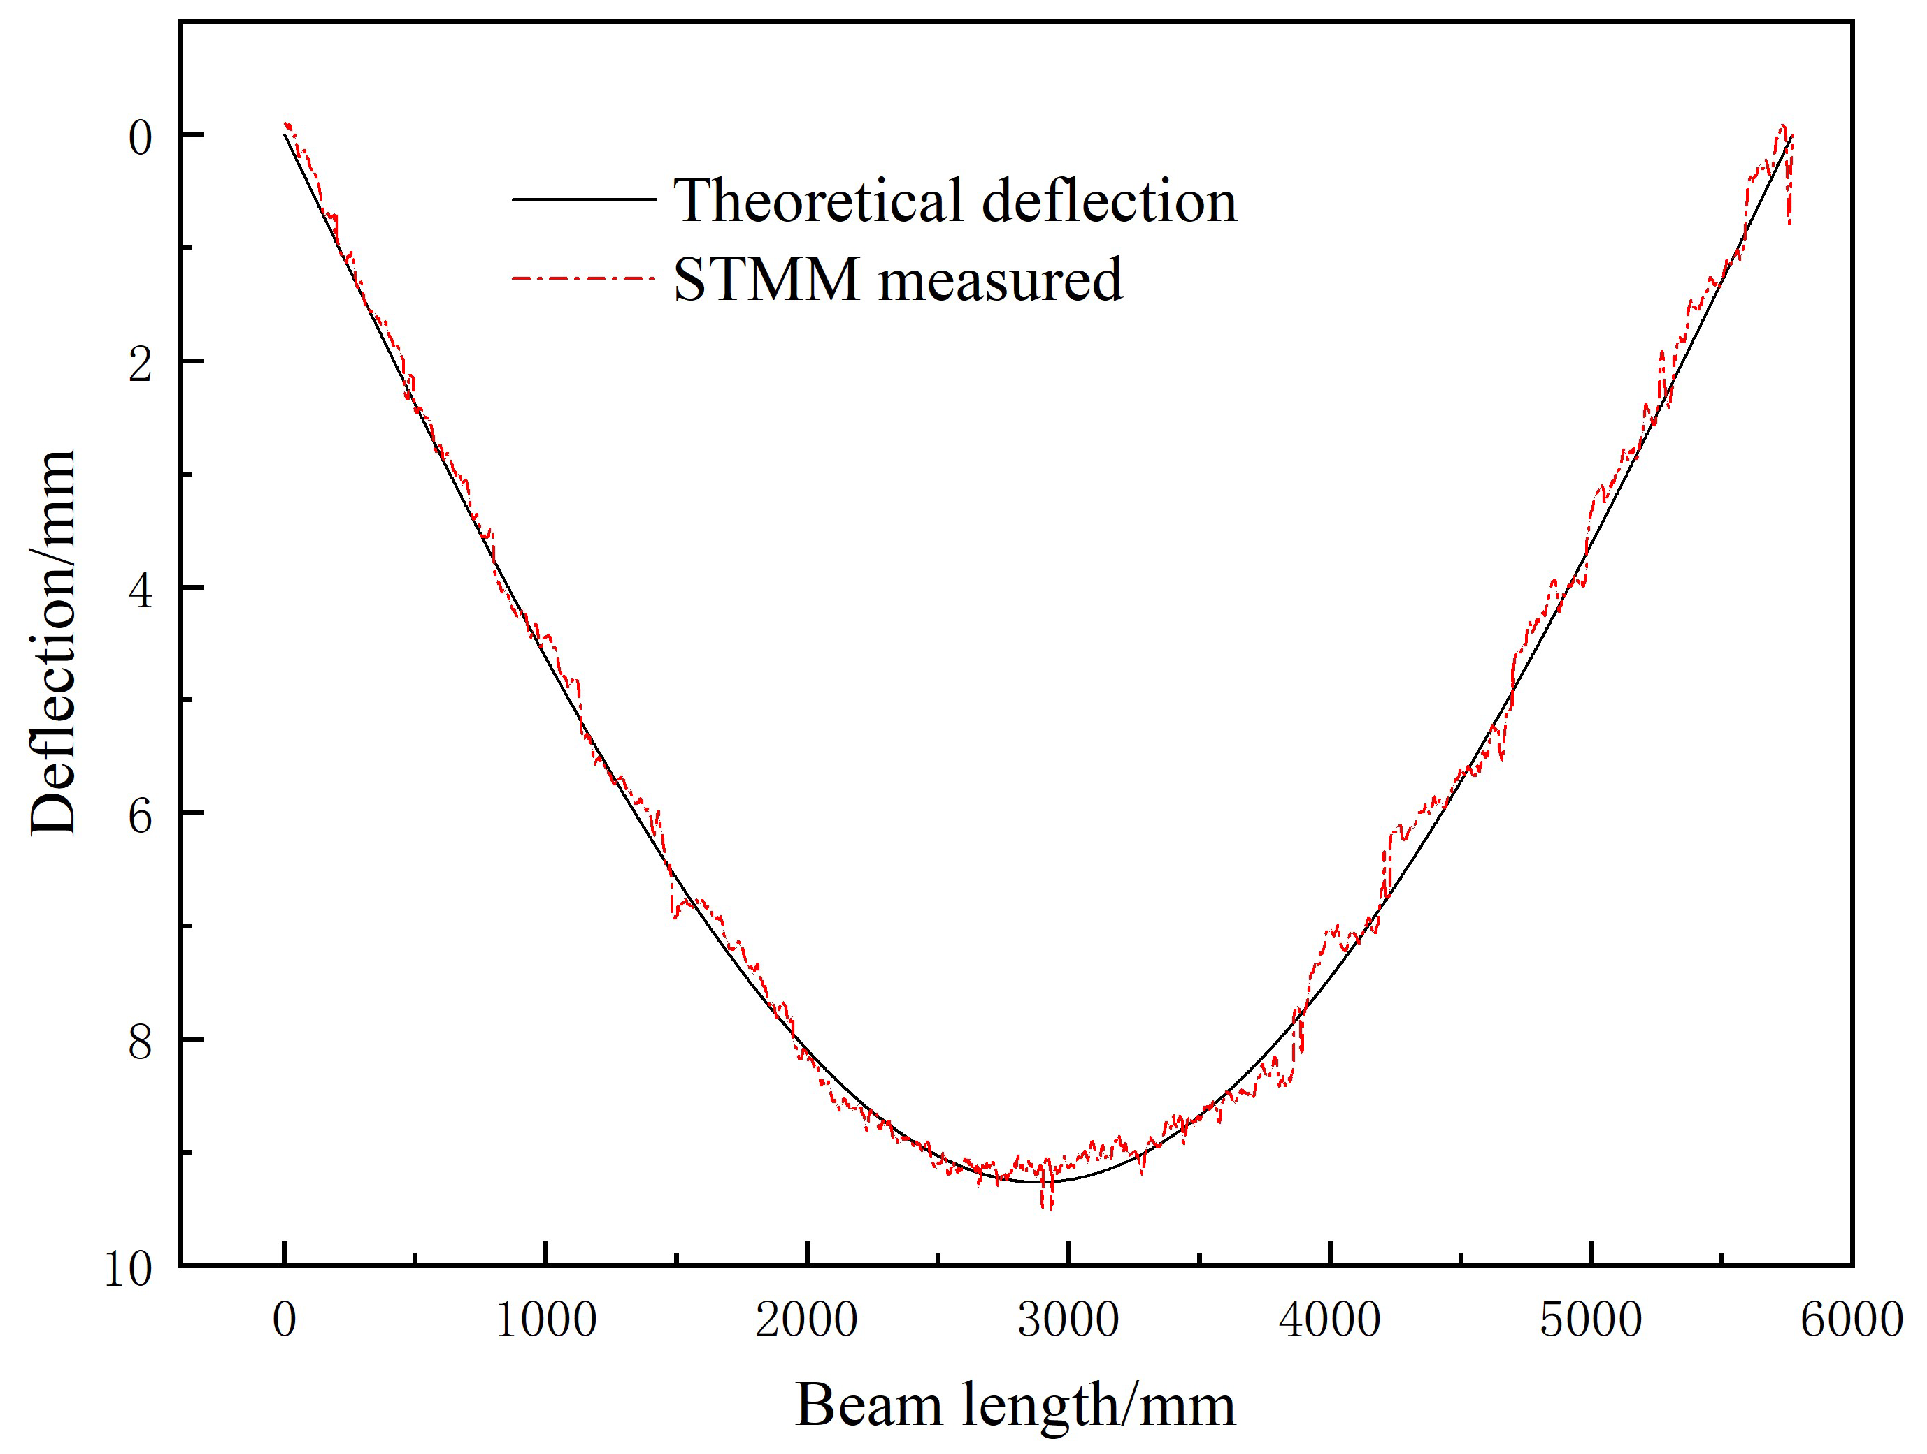
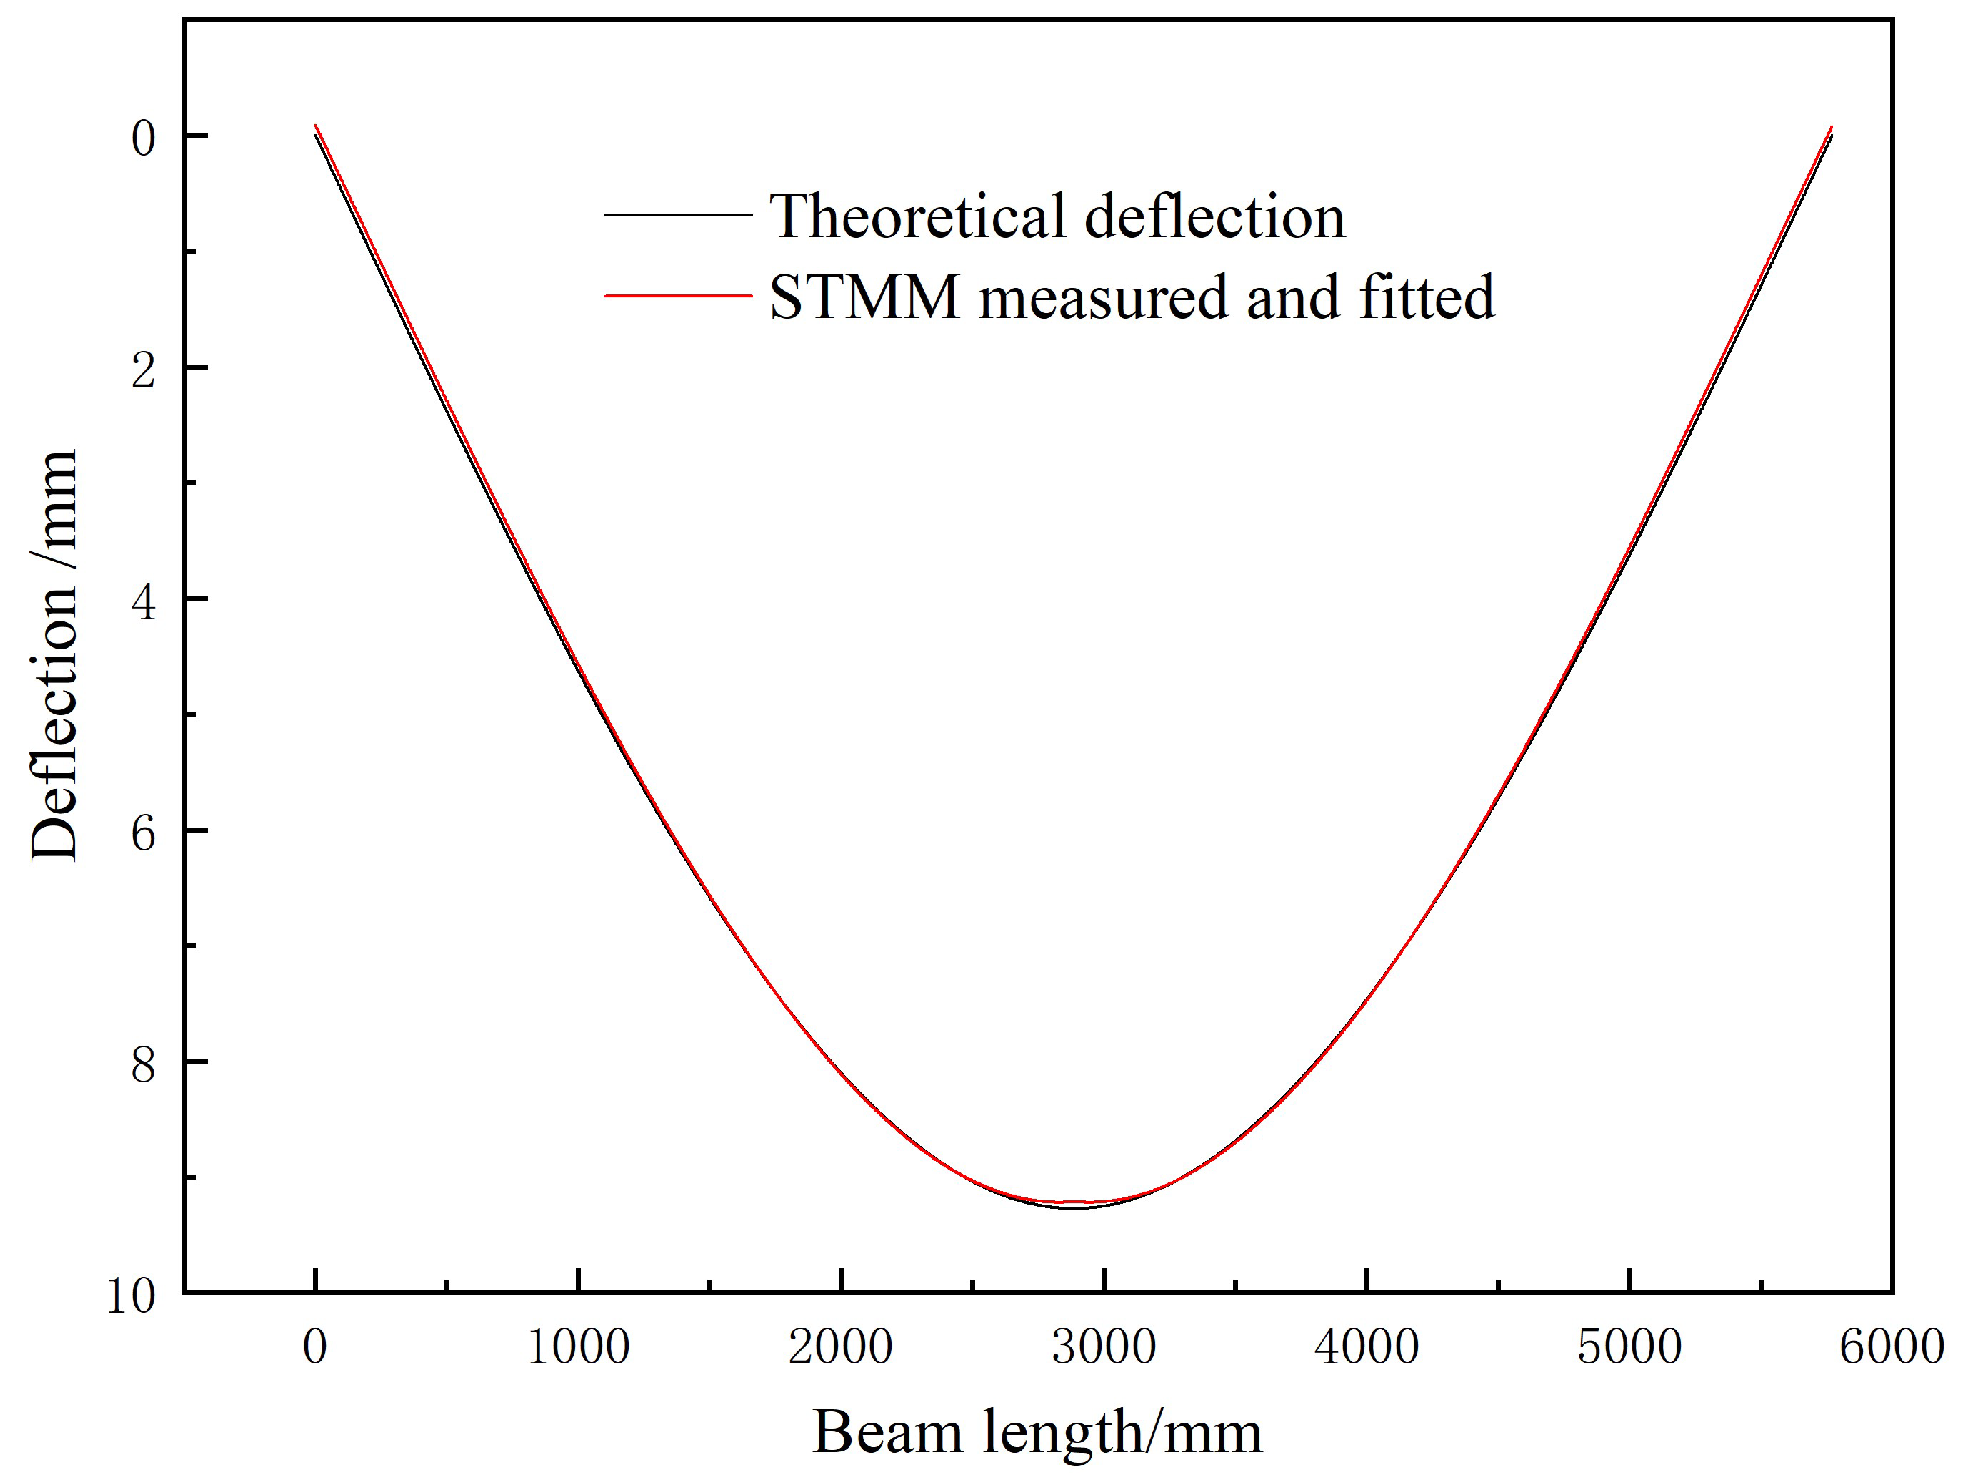
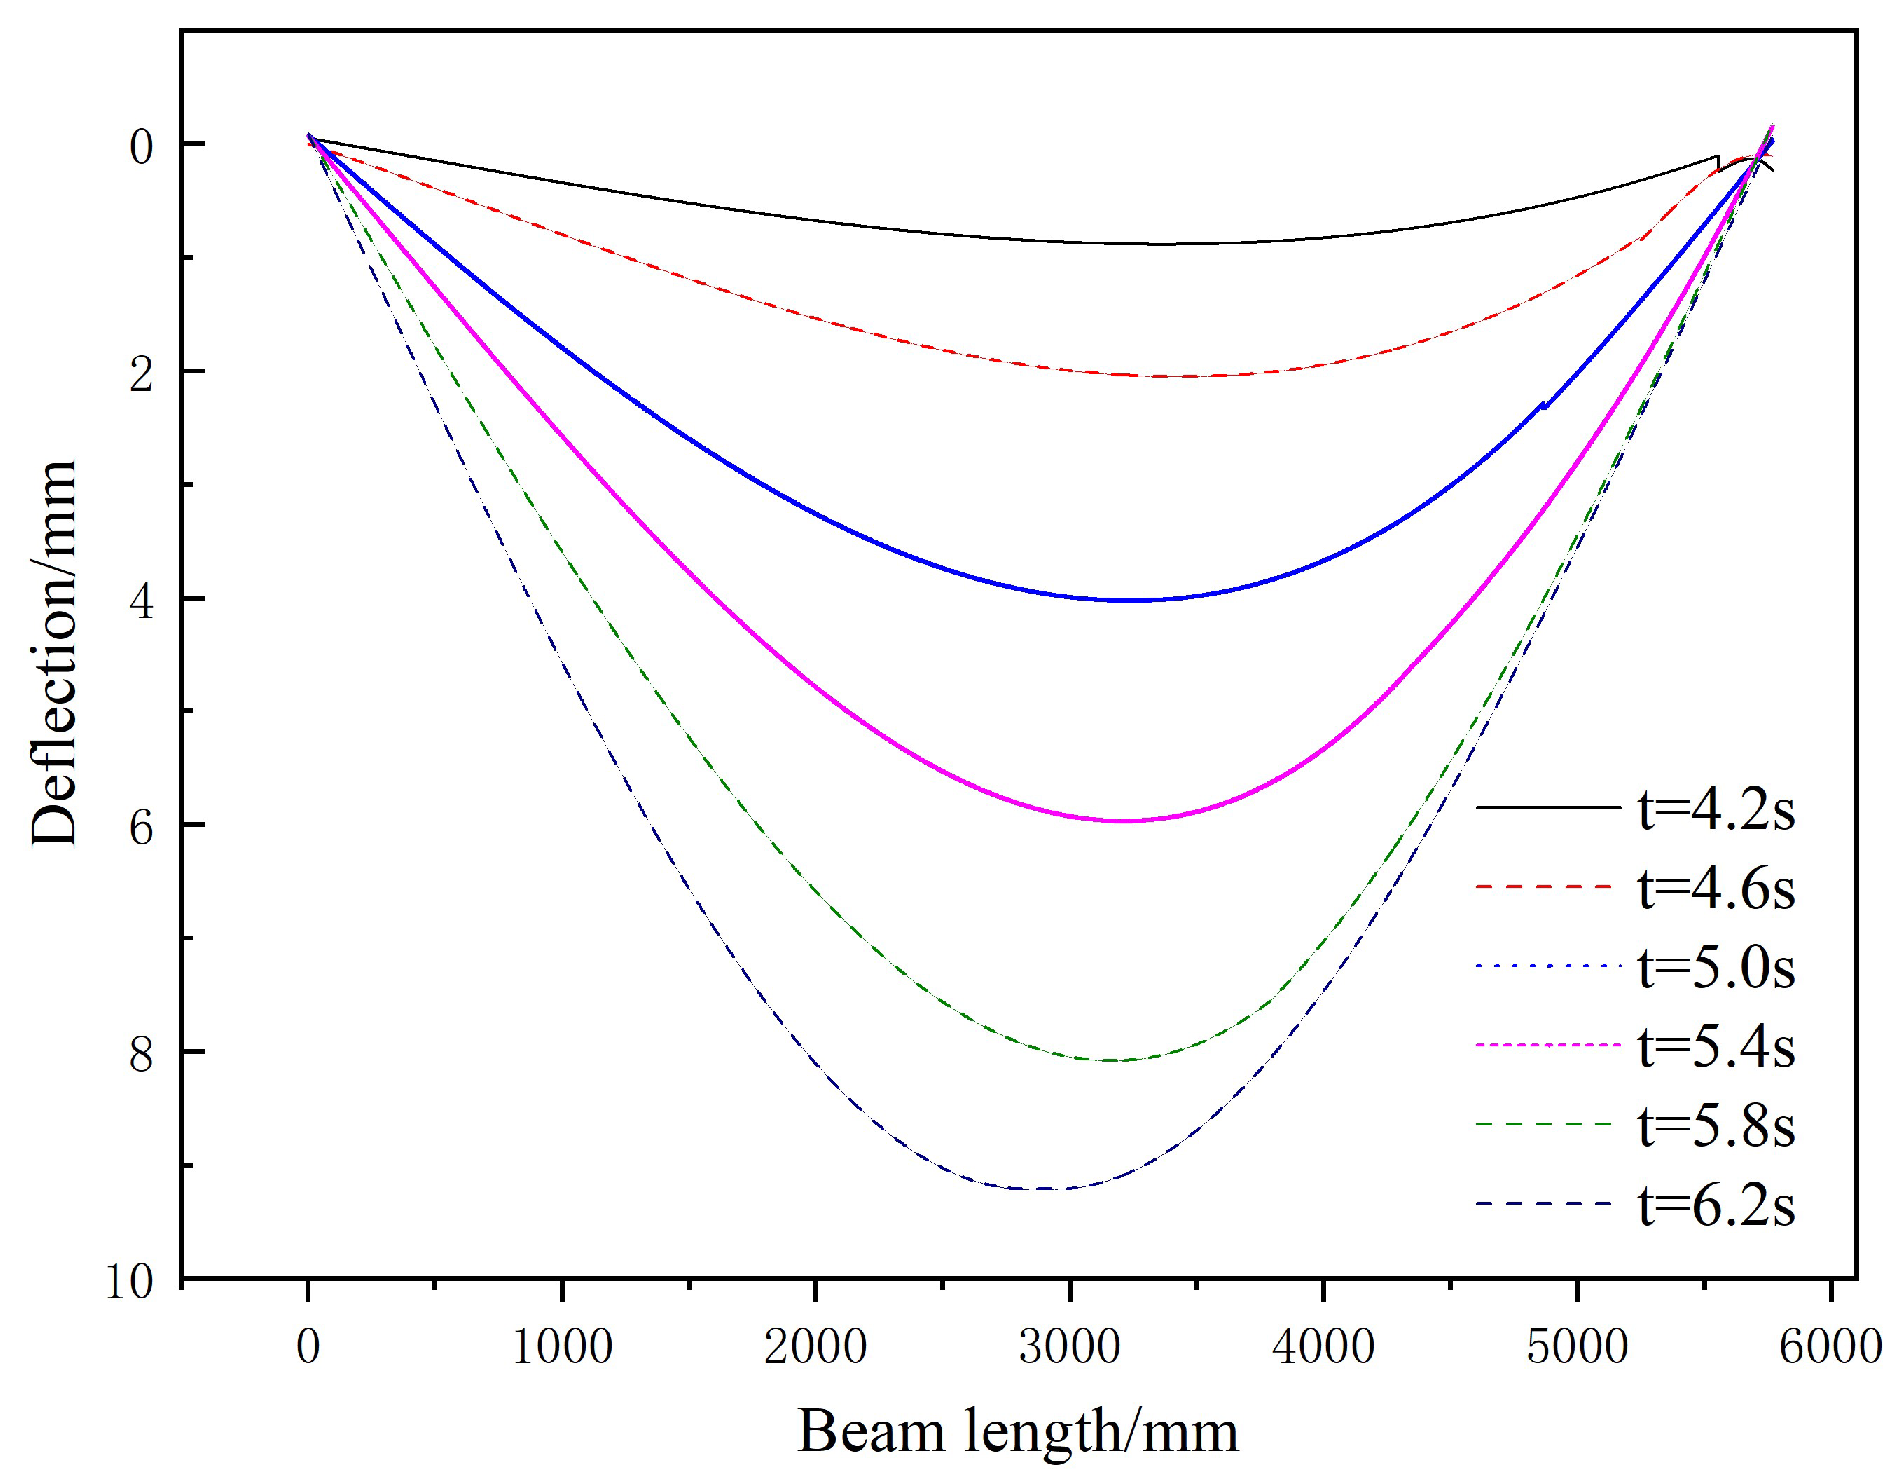
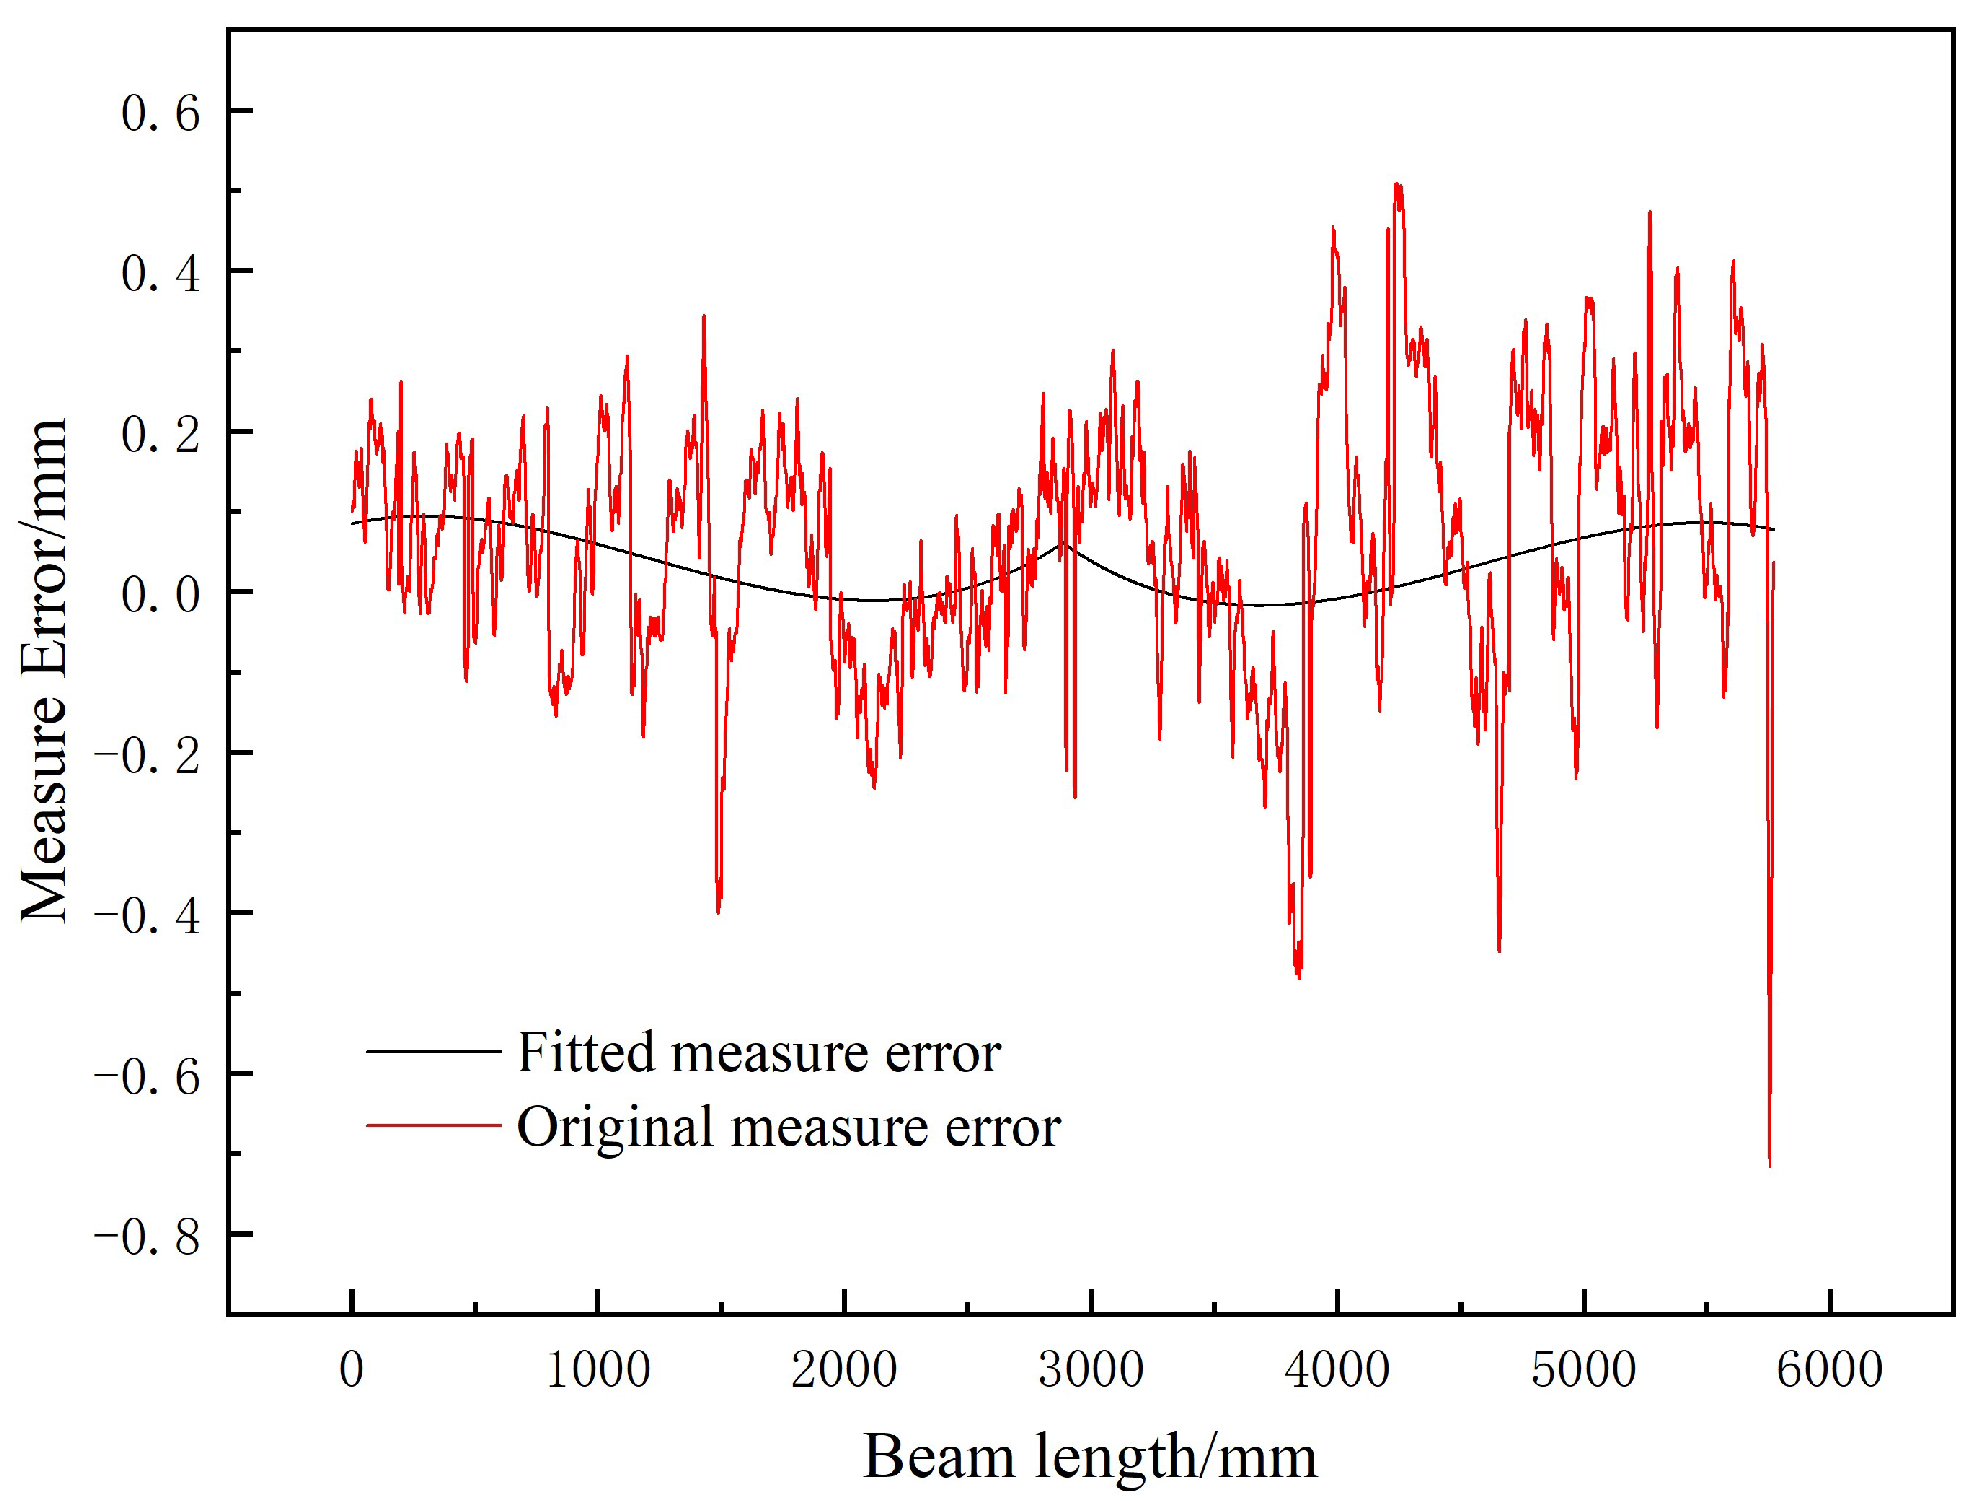
4.2.1. Transient Full-Field Displacement Error Analysis

As mentioned above, the toy truck started at 1.8 s, and finished the trip in 4.8 s at the time of 6.6 s. When the toy truck traveled at the mid-span of the beam at 4.2 s, and the theoretical deflection curve of the simply supported beam and deflection curve calculated using the STMM are shown in Figure 15. The results show that the two curves agree well with each other with a maximum measurement error of 0.72 mm.
From Equation (2), it can be seen that the deflection curve of the simply supported beam under concentrated force is a segmented cubic equation, so the STMM measurement results are fitted with a cubic equation using the least squares method. The fitted deflection curve and theoretical deflection curve are shown in Figure 16. It is clear that the fitted deflection curve exhibits better consistency with theoretical deflection curve, with a maximum measurement error of 0.17 mm.
The fitted deflection curves could be obtained when the toy truck traveled along the beam at 4.2 s, 4.6 s, 5.0 s, 5.4 s, 5.8 s, and 6.2 s, respectively, as shown in Figure 17.
At any time, subtracting theoretical deflections of 3770 measurement points from corresponding STMM measured results, the spatial measurement error distribution of the STMM can be obtained. As an example, the spatial measurement error of original STMM deflection and fitted STMM deflection along the beam can be calculated under middle span load and shown in Figure 18.
When the toy truck traveled to the mid-span, error analysis reveals that the maximum measurement error of STMM occurs near the right end support, specifically with an error of 0.47 pixels and a corresponding measurement error of 0.72 mm, and the maximum measurement error is 0.094 pixels or 0.17 mm for fitted STMM.
Measurement errors of all measure points at a given time can be quantified using the Root Mean Square Error (RMSE), formulated as follows:
R M S E = 1 m 1 m [ h ( x i ) y i ] 2
where h(xi) and yi are the measured and theoretical deflection value of point I, respectively. To show the error variation in column width, the measurement error of 1, 3, 5, and 11 pixels width STMM are listed in Table 2, comparing with that of vision-based static deflection measurement in studies [15,21,22].
The results demonstrate that the maximum measurement error of STMM is comparable to that of static deflection measurements reported in the current literature, and the measurement error decreases as the width of template slice increases. It can also be seen that the fitted measurement error decreases to 0.03 pixels or 0.052 mm when the template slice width is 11 pixels. The STMM proposed in this paper is of high precision in displacement measurement and can meet the requirements of engineering measurement.

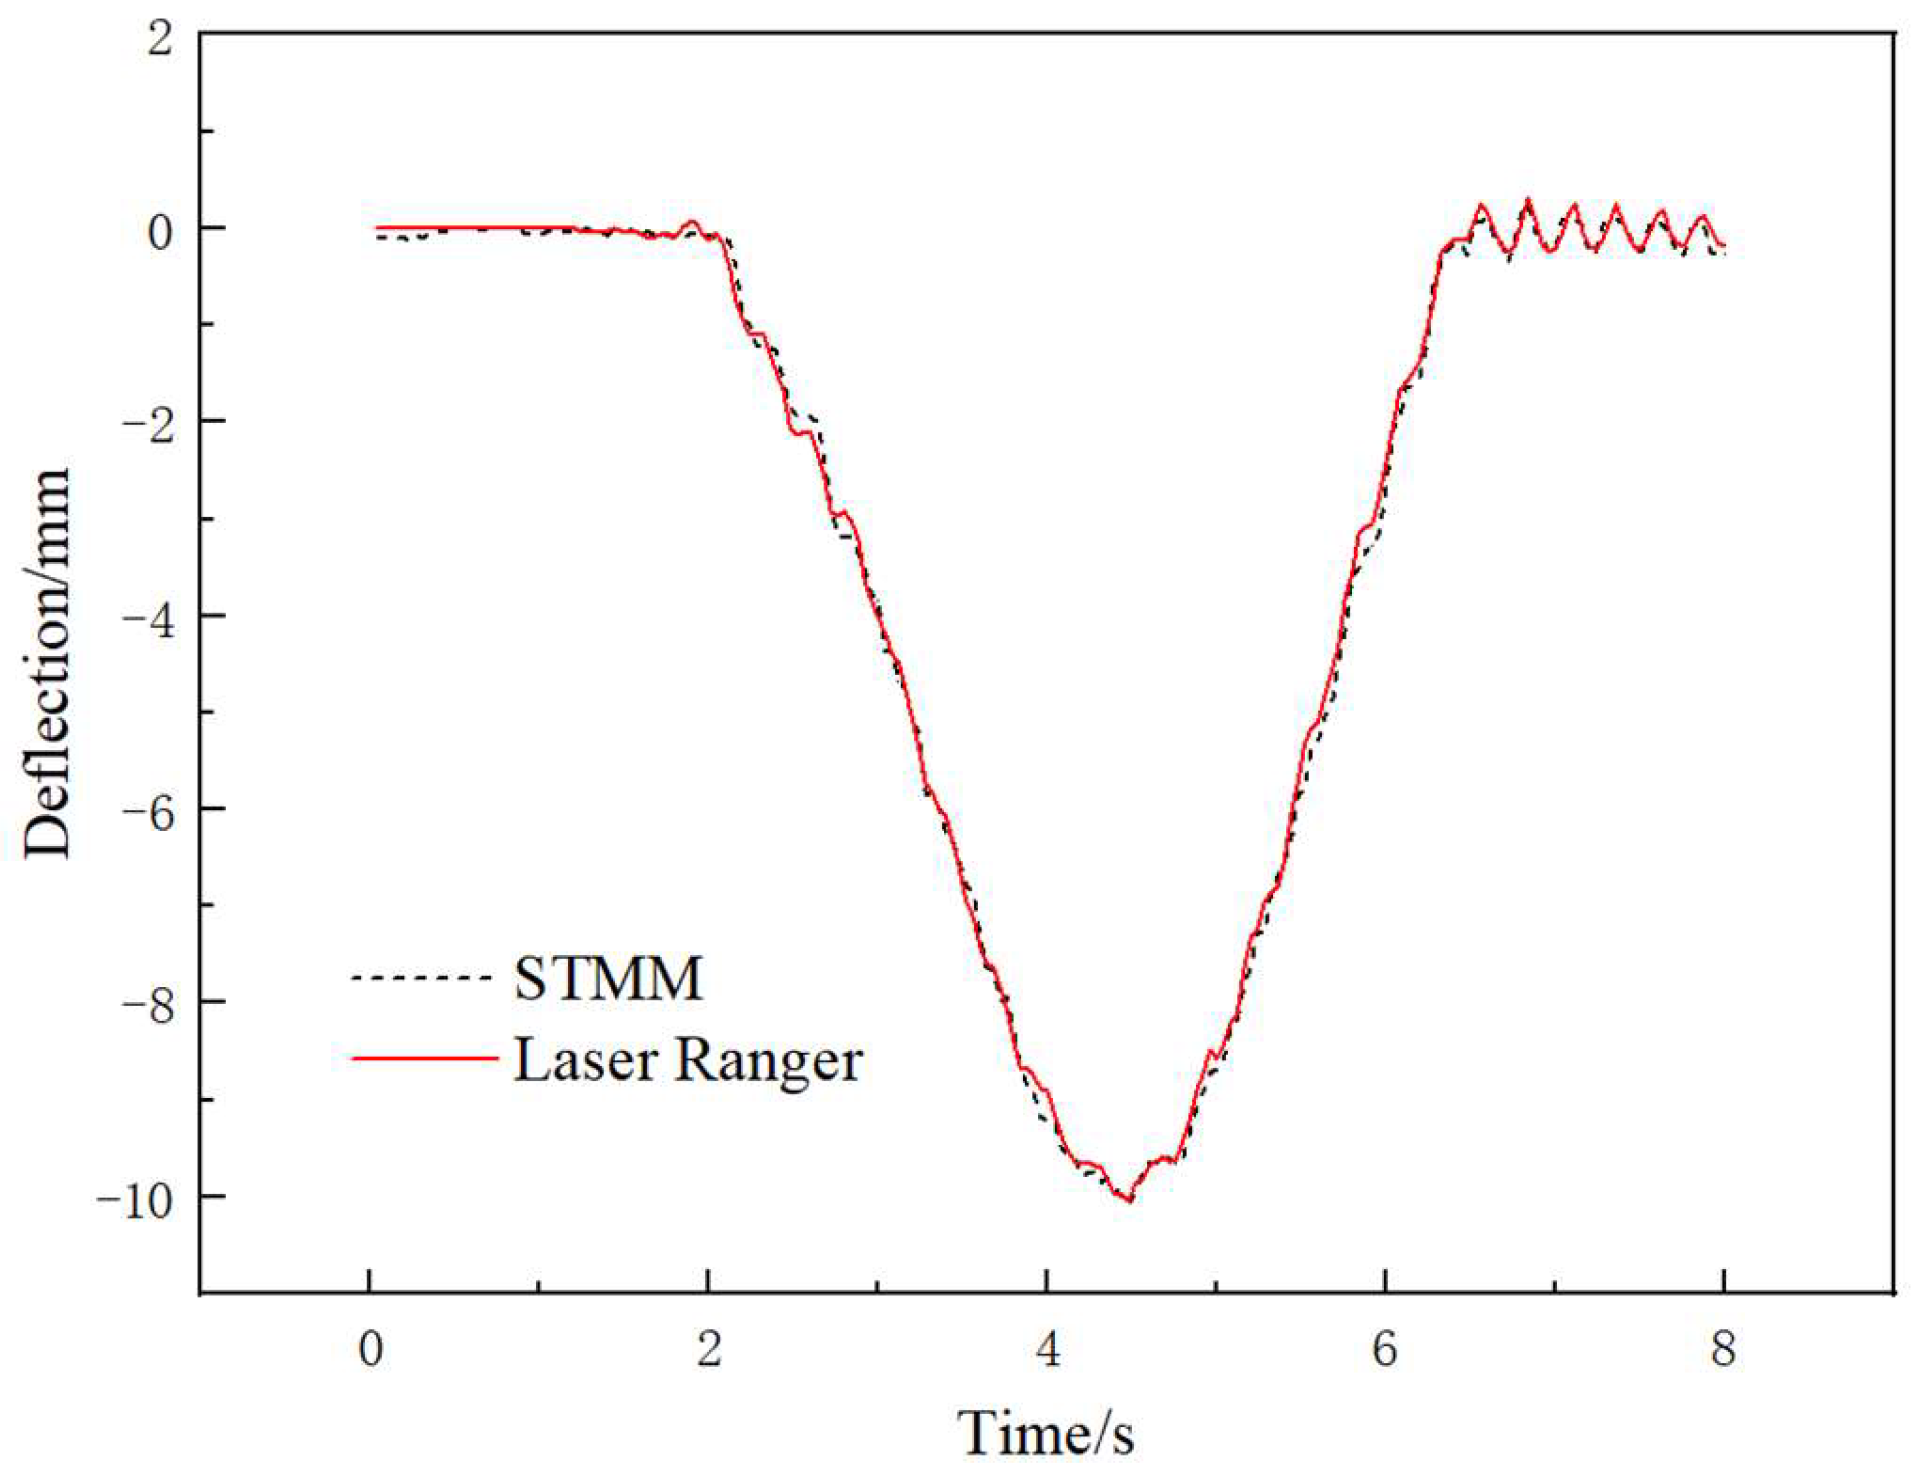
4.2.2. Single Point Dynamic Displacement Measurement Error Analysis

To reveal the dynamic displacement measurement error of a single point on the beam, the displacement–time history curves of the mid-span point by STMM and laser ranger are shown in Figure 19, and the results show that the displacement–time history curves obtained by the two methods are in good consistency.
From the two displacement–time history curves in Figure 19, it can be deduced that the dynamic displacement measurement error is not constant but varied over time. To clarify the measurement error over time, the measurement errors of two curves over time are shown in Figure 20, and results indicate that the maximum error is approximately 0.5 mm or 0.3 pixels.
The errors of two displacement–time history curves are characterized by correlation coefficient ρ and determination coefficient R2 [16], formulated as follows:
ρ = i ( r L ( i ) μ r L ) × i ( r v ( i ) μ r v ) i ( r L ( i ) μ r L ) 2 i ( r v ( i ) μ r v ) 2
R 2 = 1 i ( r v ( i ) r L ( i ) ) 2 i ( r v ( i ) μ r v ) 2
where r L ( i ) and r v ( i ) are displacement measured by the laser ranger and the STMM of measurement point at time i, respectively, and μ r L , μ r v are the mean values of each data sets. The correlation coefficient ρ and determination coefficient R 2 of the two displacement–time history curves are listed in Table 3.
From Table 3, the correlation coefficient and the determination coefficient of the two mid-span displacement–time history curves are 0.9994 and 0.9986, respectively; both are superior to the values reported in the literature [14].

4.3. Measurement Error Source Analysis

The transient full-field deflection error analysis indicates that the displacement measurement error of the 3761th column of 1-D STMM is the largest, and it is selected as the target model to trace the source of error by comparing the gray distribution of the transversal region. Figure 21 illustrates the gray value distribution of the 3761th column at the time of 0 s, 3.2 s, 4.0 s, 4.8 s,5.6 s, and 6.4 s, respectively, denoted as TSi, where TS is the transversal search region, and i is the time. In Figure 21, it can be seen that the gray value distribution along the transversal search region varied slightly with the time, especially at the time of 4.8 s, 5.6 s, and 6.4 s, due to the brightness inconstancy of the light environment that is crucial in DIC and optical flow method.

5. Conclusions

In this research, a novel method of slice template matching model is proposed to measure the full-field temporal–spatial deformation of slender structures, and the indoor experiment shows that STMM is proved to be of high precision and has good application prospects in future bridge health monitoring. The following conclusions can be drawn:
(1) The slice template matching model proposed can effectively measure the full-field temporal–spatial deflection of structure with large slender ratio, and an indoor experiment was designed and carried out to validate the STMM method. Experiment results show that the displacement measurement result of the STMM agreed well with the theoretical results and laser ranger measurement results.
(2) Experiment results demonstrated that the temporal full-field displacement measurement error of the STMM is not constant and changes both spatially and temporally, and the maximum displacement measurement error is 0.47 pixels. Transiently, the RMSE of full-field simply supported beam deflection curve from the STMM measurement and theoretical results is about 0.169 mm. For single points, the correlation coefficient and the determination coefficient of displacement–time history curves of the STMM and laser ranger are 0.9994 and 0.9986, respectively.
(3) Gray distribution analysis of the transversal region reveals that the STMM is also greatly influenced by the brightness inconstancy caused by optical environment variation, and further study should be carried out to investigate the mechanism of the measurement error and control in complex weather conditions and illumination environments, or structures with complex inelastic mechanical properties and large deformations, for example, cables, bars, and piers.

Author Contributions

Conceptualization and methodology, J.Z. and H.L.; validation, Y.S. and J.H.; formal analysis, J.Z.; investigation, H.L. and Z.Z.; resources, J.Z. and Z.Z.; data curation, J.Z. and Y.S.; writing—original draft preparation, J.Z. and H.L.; writing—review and editing, J.Z. and H.L.; Y.S., supervision, J.Z. All authors have read and agreed to the published version of the manuscript.

Funding

This work was supported by the National Natural Science Foundation of China (Grant No. 51778094), the National Natural Science Foundation of China (Grant No. 51708068), the Joint Training Base for Postgraduate Construction Project of Chongqing (Grant No. JDLHPYJD2020019), and the Postgraduate Tutor Team Construction Project of Chongqing (Grant No. JDDSTD2022003). We also acknowledge the State Key Laboratory of Mountain Bridge and Tunnel Engineering for providing experimental equipment.

Institutional Review Board Statement

Not applicable.

Informed Consent Statement

Not applicable.

Data Availability Statement

The data that support the findings of this study are available from the corresponding author upon reasonable request.

Conflicts of Interest

Author Haijing Liu was employed by the company China Merchant Chongqing Communication Research & Design Institute Co., Ltd. The remaining authors declare that the research was conducted in the absence of any commercial or financial relationships that could be construed as a potential conflict of interest.

References

  1. Ministry of Transport of the People’s Republic of China. Statistical Bulletin on Development of Transport Industry of Year 2023; Ministry of Transport of the People’s Republic of China: Beijing, China, 2024. [Google Scholar]
  2. Ministry of Transport of the People’s Republic of China. Recommendations of Ministry of Transport on Further Improving the Safety and Durability Level of Highway Bridges; Ministry of Transport of the People’s Republic of China: Beijing, China, 2020. [Google Scholar]
  3. Tang, Z. Data Anomaly Diagnosis and Reconstruction Based on Deep Learning for Structural Health Monitoring. Ph.D. Thesis, Harbin Institute of Technology, Harbin, China, 2021. [Google Scholar]
  4. Wang, L.; Wang, Q.; Zhu, Z.; Zhao, Y. Current Status and Prospects of Research on Bridge Health Monitoring Technology. China J. Highw. Transp. 2021, 34, 25–45. [Google Scholar]
  5. Liu, G.; Gu, J.; Li, M.; He, C. Damage identification method of painted beams based on digital image correlation. J. Civ. Environ. Eng. 2022, 44, 148–157. [Google Scholar]
  6. Ge, J.; Li, H. Study on bridge damage inspection and identification experiments with mean curvature mode method. J. China Foreign Highw. 2010, 30, 147–150. [Google Scholar]
  7. Dong, C.; Celik, O.; Catbas, F.N. Marker-free monitoring of the grandstand structures and modal identification using computer vision methods. Struct. Health Monit. 2019, 18, 1491–1509. [Google Scholar] [CrossRef]
  8. Dong, C.; Catbas, F.N. A review of computer vision-based structural health monitoring at local and global level, Struct. Health Monit. 2020, 20, 692–743. [Google Scholar] [CrossRef]
  9. Ye, X.; Dong, C. Review of computer vision-based structural displacement monitoring. China J. Highw. Transp. 2019, 32, 20–39. [Google Scholar]
  10. Feng, D.; Feng, M.Q. Computer Vision for Structural Dynamics and Health Monitoring; John Wiley & Sons: Hoboken, NJ, USA, 2021; pp. 31–57. [Google Scholar]
  11. Feng, D.; Feng, M.Q. Computer vision for SHM of civil infrastructure: From dynamic response measurement to damage detection-A review. Eng. Struct. 2018, 156, 105–117. [Google Scholar] [CrossRef]
  12. Zhu, Q.; Chen, J.; Zhang, Q.; Du, Y. A non-contact recognition for deflection influence line of footbridge based on computer vision. Eng. Mech. 2021, 38, 145–153. [Google Scholar] [CrossRef]
  13. Chu, X. Holographic Shape Monitoring and Damage Identification of Bridge Structure Based on Fixed Axis Rotation Photography. Ph.D. Thesis, Chongqing Jiaotong University, Chongqing, China, 2020. [Google Scholar]
  14. Zheng, J.; Tang, Y.; Liu, H.; Zhou, Z.; He, J. Research on Full-Field Dynamic Deflection Measurement of Beams Based on Dense Feature Matching and Mismatch Removal Method. Appl. Sci. 2024, 14, 3347. [Google Scholar] [CrossRef]
  15. Jin, G. Computer Aided Optical Measurement; Qinghua University Press: Beijing, China, 2007; pp. 141–181. [Google Scholar]
  16. Khuc, T.; Catbas, F.N. Completely contactless structural health monitoring of real-life structures using cameras and computer vision. Struct. Control Health Monit. 2016, 24, 1852. [Google Scholar] [CrossRef]
  17. Martini, A.; Eleonora, M.T.; Feng, M.Q.; Leung, R.Y. A computer vision-based method for bridge model updating using displacement influence lines. Eng. Struct. 2022, 259, 114129. [Google Scholar] [CrossRef]
  18. Corbally, R.; Malekjafarian, A. Bridge damage detection using operating deflection shape ratios obtained from a passing vehicle. J. Sound Vib. 2022, 537, 117225. [Google Scholar] [CrossRef]
  19. He, B.; Cui, J.; Xiao, B.; Wang, X. Image Analysis by Two Types of Franklin-Fourier Moments. IEEE/CAA J. Autom. Sin. 2019, 6, 1036–1051. [Google Scholar] [CrossRef]
  20. Huang, G. Digital Close Range Photometry Theory, Method and Application; Science Press: Beijing, China, 2019; pp. 97–133. [Google Scholar]
  21. Detchev, I.; Habib, A.; El-Badry, M. Case study of beam deformation monitoring using conventional close-range photogrammetry. In ASPRS 2011 Annual Conference; ASPRS: Milwaukee, WI, USA, 2011. [Google Scholar]
  22. Sun, P.; Lu, N.; Dong, M. Simultaneous all-parameters calibration and assessment of a stereo camera pair using a scale bar. Sensors 2018, 18, 3964. [Google Scholar] [CrossRef] [PubMed]
Figure 1. Diagram of template matching process with image sequence.
Applsci 15 06188 g001
Figure 2. Non-uniformly distributed SIFT features from natural concrete surface texture.
Applsci 15 06188 g002
Figure 3. Ideal uniform feature points distribution.
Applsci 15 06188 g003
Figure 4. Ideal single row of uniform feature points distribution.
Applsci 15 06188 g004
Figure 5. Degraded one-dimension template matching. (a) 1-D column template matching model. (b) 1-D row template matching model.
Applsci 15 06188 g005
Figure 6. Beam structure in image storage and the STMM. (a) Beam in 2-D image. (b) Slice template matching model.
Applsci 15 06188 g006
Figure 7. Geometric property of slender structure.
Applsci 15 06188 g007
Figure 8. Diagram of STMM. (a) Single column STMM. (b) Triple columns STMM. (c) Five columns STMM.
Applsci 15 06188 g008
Figure 9. Diagram of full-field temporal–spatial structural displacement by STMM.
Applsci 15 06188 g009
Figure 10. Cross section of the composite box beam.
Applsci 15 06188 g010
Figure 11. Diagram of a simply supported composite box beam experiment.
Applsci 15 06188 g011
Figure 12. Reflective stripe on beam surface.
Applsci 15 06188 g012
Figure 13. Front view of simply supported composite box beam.
Applsci 15 06188 g013
Figure 14. Mask selection and transversal region of 1-D image in the ith column.
Applsci 15 06188 g014
Figure 15. Deflection curves of STMM and theoretical equation with mid-span load.
Applsci 15 06188 g015
Figure 16. Deflection curves of fitted STMM and theoretical equation under mid-span load.
Applsci 15 06188 g016
Figure 17. The deflection curve from fitted STMM at different time.
Applsci 15 06188 g017
Figure 18. Measurement error of STMM deflection under mid-span load.
Applsci 15 06188 g018
Figure 19. Mid-span dynamic deflection–time history curves.
Applsci 15 06188 g019
Figure 20. Measurement error of mid-span dynamic displacement–time history curves.
Applsci 15 06188 g020
Figure 21. Gray value distribution of the 3761th column mask and transversal region in different frames.
Applsci 15 06188 g021
Table 1. Parameters of experiment devices.
Experiment DeviceModelTechnical Parameters
Video CameraSONY/FDR-AX40Resolution 3840px × 2160px
/Frame Rate 25fps
Laser RangerRIFTEK/R6039600Baud
Table 2. RMSE of STMM under mid-span load.
Template WidthData TypesRMSE/mm
STMMStudies
1Original data0.204
30.1910.1~0.2 [15]
50.1820.7~2.6 [21]
110.1690.1~0.3 [22]
11Fitted data0.052
Table 3. Correlation of mid-span displacement time curves of STMM and laser ranger.
Source of DataCorrelation CoefficientCoefficient of Determination
Reference [17]0.9689~0.98870.9368~0.9775
This Paper0.99940.9986
Disclaimer/Publisher’s Note: The statements, opinions and data contained in all publications are solely those of the individual author(s) and contributor(s) and not of MDPI and/or the editor(s). MDPI and/or the editor(s) disclaim responsibility for any injury to people or property resulting from any ideas, methods, instructions or products referred to in the content.

