1. Introduction
Reflector antennas are widely used in communication systems because of their capacity to focus and direct electromagnetic waves. This paper presents in detail the diffraction calculation for an antenna reflector with double curvature designed to achieve a directivity characteristic, which is a variant of the optimized characteristic. The main purpose is to reduce the power level transmitted in the vicinity of the radiation direction angle , i.e., the region near the dead cone, in comparison to the characteristic obtained experimentally with , where a significant secondary lobe is observed. This characteristic is highly useful for aircraft-mounted radars (scanning ground or maritime targets— the characteristic is inverted), where the lobe near the dead cone zone can create disruptive signals that may jeopardize the signal processing. It is also valuable for airborne surveillance radars, where reducing this lobe in the dead cone zone offers a better distribution of radiated power in the directivity characteristics.
The purpose of this article is to present in detail the method used to determine the curvature in the reflector plane of symmetry that can achieve an electric field distribution such that the power directivity characteristic is . The main objective of this paper is to elaborate a method that generates the symmetry plane curve for a double curved parabolic reflector, illuminated with a horn-type primary radiation source with a radiation characteristic in the E plane, resulting in an overall directivity characteristic in the elevation plane. The secondary objective is to model the horn antenna and to simulate its radiation characteristic using the finite element methods based on Ansys HFSS, such that the overall characteristic is the desired one. Finally, the third objective is to elaborate a method to calculate the diffraction characteristic of the designed antenna that has a double curved reflector with radiation characteristic, illuminated with a horn antenna with a characteristic in the E plane. For modelling and simulation, a program has been developed that calculates the diffraction and presents the electrical field distribution in the elevation plane, depending on the position vectors of the point on the reflecting surface and on the angles of illumination and reflection as input data. In conclusion, we highlighted the influence of these parameters on the distribution of the electrical field in the elevation angle as well as the possibility of selecting the best pairs of input data to achieve the best orientation for low-, medium-, and high-altitude radars. The results are presented in the final section.
The directivity characteristic antennas are very good for detecting and tracking isolated isotropic targets that evolve at constant height, being used for military or civil air surveillance radars. It is worth mentioning that, for the characteristic, there is an increased power level in the area close to the maximum angle in elevation, before the dead cone area, where the dead cone represents the area where there is no radiation. The characteristic represents the optimal experimental approximation for the characteristic, since it importantly reduces the increased power level in the area close to the maximum angle in elevation, before the dead cone area, and achieves a better distribution of power in elevation. Antennas with the characteristic are useful for applications like military or civil air surveillance radars, for radars installed on military or civil aircraft that have to scan the ground or sea surface, and for land or naval targets since they also have to reduce the clutter level in the area close to the dead cone.
Additionally, the method used is discussed, and the corresponding deduction of the formulas for calculating the radiated electric field for horizontal and vertical polarizations is presented. Simulations were performed using a program developed by the authors to highlight the effects and importance of modifying the maximum reflection angle and minimum reflection angle in shaping the directivity characteristics, as well as the variations in the angle of maximum radiation direction. These simulations provide the necessary data for selecting the optimal variant based on the altitude of interest for target detection and tracking. This type of antenna is also suitable for integration into both military and civilian radar systems operating in the 11–28 GHz frequency range, particularly those intended for drone detection and tracking, where a high angular resolution and directivity are essential. Furthermore, it can be employed in 5G communication systems that require uniform power distribution across the antenna radiation pattern.
Many researchers have studied, simulated, and attempted to implement antennas targeting some important features, such as the shape of the elevation directivity characteristic, the azimuth directivity characteristic opening at −3 dB, the secondary lobe levels, which must be as low as possible, the gain for each frequency, the dead cone angle or maximum elevation opening, the secondary lobe shape in elevation, and the phase characteristic in elevation and azimuth. Thus, [
1] presents a study of a reflector antenna developed to achieve a wide beam using a cosecant-squared pattern for communication applications with specific coverage requirements. This research delves into the theoretical aspects of antenna design, simulation results, and practical considerations for implementation. Thus, it contributes to the broader field of antenna engineering and may have implications for improving the performance of communication systems with specific beamwidth and coverage requirements.
The authors of [
2] explore a methodology for synthesizing cosecant-squared radiation patterns in the context of broadband-shaped reflector antennas. The design of reflector antennas plays a crucial role in various communication systems and in achieving a specific radiation pattern that is essential for optimizing signal coverage. Thus, a novel approach for designing reflector antennas with a cosecant-squared pattern is presented, emphasizing its applicability to broadband scenarios. This research involves theoretical analyses, simulation studies, and practical considerations for implementing the proposed synthesis method. The outcomes of this study may contribute to advancements in antenna engineering, particularly in the development of broadband-shaped reflector antennas with cosecant-squared radiation patterns that cater to the demands of modern communication systems.
In [
3] the authors investigate several main issues related to
radiation patterns synthesis of linear antenna arrays. Antenna arrays are fundamental components of communication systems; thus, their radiation patterns significantly impact signal coverage. Here, the authors propose an innovative approach that uses an adaptive least squares algorithm for the synthesis of
patterns. This involves a combination of theoretical modeling, algorithm development, and practical implementation considerations. This research provides a method for tailoring linear antenna arrays to exhibit
radiation patterns, which can be beneficial in applications requiring specific signal coverage characteristics.
The authors of [
4] explore the design methodology of a reflector antenna with a broadband
radiation pattern. Reflectors are critical components of communication systems; thus, achieving specific radiation patterns is crucial for optimal signal coverage. In this study, the authors employ the Invasive Weed Optimization (IWO) procedure, a nature-inspired optimization technique, to synthesize the reflector of an antenna with
characteristic that spans a broad frequency range. This research involves theoretical modelling, algorithm implementation, and practical considerations for antenna design. The principal contribution of this research is the innovative approach implied in achieving broadband cosecant squared radiation patterns in reflector antennas, with potential applications in communication systems requiring versatile signal coverage.
In [
5], a wideband printed antenna array integrated into a corner reflector, aiming to achieve a
-shaped beam pattern is presented. When dealing with antenna arrays, it is important to achieve specific radiation patterns that are essential for obtaining effective signal coverage. In this research, the authors focus on the integration of printed antenna elements into a corner reflector, using their collective arrangement to synthesize a beam pattern with a cosecant square shape. This work involves theoretical modelling, practical design considerations, and possibly optimization techniques to achieve the desired wideband characteristics. This study provides insights into the design of wideband antennas with unique beam patterns for applications that require versatile and effective signal coverage.
In [
6], the authors focus on the design of a compact parabolic reflector antenna, intending to achieve a
radiation pattern. In this study, the authors concentrate on developing a parabolic reflector antenna with a
radiation pattern, which is often sought after for specific applications requiring controlled signal distribution. Their research provides insights into the design of compact parabolic reflector antennas with
radiation patterns, tailored to the demands of modern communication systems.
The authors of [
7] explore the characteristics of a double-curved antenna reflector, focusing on the curvature generated in the plane of symmetry, specifically designed to exhibit a
pattern beam. The reflector is illuminated by a
pattern beam from the primary radiator. This research involves a combination of theoretical modeling, antenna design considerations, and analysis of the curve generated in the plane of symmetry, offering insights into the complex geometry and radiation pattern of double-curved reflectors, which is important for optimizing signal coverage in various communication applications. In this paper, the authors explore the design and performance of a multimode array antenna. Multimode antennas are versatile systems that can operate in multiple modes or configurations, enabling flexibility in adapting to different communication requirements and standards. In this research, some important theoretical aspects of the antenna’s design, its multimode capabilities, and several potential applications are highlighted, and several results related to the development of antennas capable of supporting various modes for improved functionality and adaptability in diverse communication scenarios are presented.
In [
8], the conception and deployment of an innovative antenna array system suitable for radar applications are presented and discussed. This research aims to address the need for a versatile antenna array capable of adapting to different radar system requirements. The proposed antenna array leverages a reconfigurable design that combines the characteristics of a
pattern with pencil beam focusing. This configuration enhances the performance of radar systems, particularly in terms of target detection and tracking capabilities. Key aspects of this research include the methodology for designing the antenna array, which involves optimizing the geometry and reconfiguration mechanisms to achieve the desired radiation pattern. The authors also present some practical implementations of the antenna array and evaluate their performance through simulations and experimental testing.
In [
9], the authors focus on developing an antenna system that uses a
radiation pattern, which is beneficial for radar and communication applications. Their study integrates this radiation pattern with an all-metal filter antenna design to enhance its performance and efficiency. The primary focus of the research involves the implementation and optimization of the antenna structure to attain the targeted
pattern. Additionally, the authors investigate the practical implementation of the antenna and evaluate its performance based on simulations and experimental testing. Thus, this article offers valuable insights into the development of a
pattern antenna using an all-metal filter antenna, highlighting its potential application in wireless communication networks and radar systems.
The authors of [
10] present a study focusing on the development of a leaky wave slot array antenna that uses gap waveguide technology. Their research aims to address the needs of the 5G base transceiver station (BTS) applications by designing an antenna with a
radiation pattern. The primary objective of the research is to use gap waveguide technology to construct an antenna array and incorporate a
pattern to meet the specific requirements of 5G BTS applications. The authors explore the design methodology, optimization strategies, and practical deployment of the antenna, aiming to enhance its performance and suitability for 5G communication systems, underscoring innovations in antenna technology for upcoming communication networks.
Antennas featuring a
pattern are integral components of air-surveillance radar systems. In [
11], the authors discuss the synthesis of a
pattern leaky-wave antenna (LWA) using a ridge waveguide. Achieving the desired
pattern requires precise control of attenuation and phase constants along the antenna’s length. This control is accomplished by appropriately narrowing the slot offset and ridge profile along the antenna, facilitated by optimization algorithms such as genetic algorithms (GA). The implemented antenna yields a cosecant-squared pattern LWA with an expansive range from 10° to 40°, low ripples (≤2 dB), and reduced sidelobes (≤−18 dB). Fabrication and measurement confirm the effectiveness of the design, with simulation outcomes closely matching experimental results. Notably, the design achieves a significant size reduction (approximately 47%) compared to prior published works.
In [
12], the authors address the escalating risks of oil pollution in the World Ocean, particularly due to offshore oil production activities, which pose significant environmental and economic threats to marine ecosystems and coastal regions. Modern and reliable remote monitoring methods are essential for effectively monitoring water surfaces and detecting oil spills, with radar being a prominent option. This study focuses on enhancing the efficiency of radar methods for water surface monitoring through constructive modifications of the existing radar antenna array and alterations of the shape of the radio signal. In this paper, a theoretical radar analysis and mathematical modelling are presented, justifying the efficacy of using a phased active antenna array and constructing a
pattern diagram for the radio signal. This approach aims to improve radar monitoring efficiency, facilitating quicker and more accurate detection of oil spills, thereby aiding in timely intervention and mitigation efforts.
The authors of [
13] explored the design of reflector antennas across various frequencies by employing frequency-selective surfaces (FSS). Reflector antennas are essential components of wireless communication systems that serve to direct and focus electromagnetic signals. Frequency-selective surfaces are used in this study to tailor the antenna’s performance at specific frequencies, enhancing its efficiency and functionality. Based on the theoretical analysis and practical experimentation presented in this paper, the authors investigate the application of FSS in optimizing reflector antenna designs across different frequency bands. By manipulating the properties of FSS, such as their periodicity and geometry, several performance characteristics of the antenna, such as gain, directivity, and bandwidth, can be tailored to meet specific requirements. This approach improves the performance of communication systems operating in diverse frequency bands, thereby facilitating enhanced connectivity and communication capabilities in wireless networks.
The research presented in [
14] details the development of a multi-purpose aperture antenna suitable for operation at both L- and S-bands, specifically designed for use in airborne synthetic aperture radar (SAR) systems. This was imposed to ensure a consistent beamwidth along the aircraft’s route in both frequency bands. It utilizes a probe-fed square annular patch antenna for L-band and an electromagnetically coupled stacked patch antenna for S-band, set up in arrays of 2 × 6 and 2 × 12 elements, respectively, all on the same aperture measuring 0.35 × 1.2 m. The antenna achieved a 200 MHz bandwidth at the L-band and 400 MHz at the S-band, a peak gain of 6.3 dBi at 1.25 GHz and 19 dBi at 3.2 GHz, and more than 30 dB port isolation and cross-polarization at both frequencies.
In [
15], a pattern synthesis method for a planar array of isotropic antennas using a Genetic Algorithm (GA) is presented. This study focuses on creating two separate beam patterns: a pencil beam pattern and an omnidirectional pattern. The GA is utilized to identify the best combination of element amplitudes and phases to achieve reduced Peak Side Lobe Level (PSLL) and ripple. These optimized excitations, derived through GA, provide discrete solutions that help decrease the Dynamic Range Ratio (DRR). A lower DRR not only assists in simplifying design complexity but also enhances the performance of the feed network.
The authors of [
16] discuss polarimetric radars and polarization antennas. In the context of a frequency-modulated millimeter-wave (FMCW) radar system, the authors presented a new dual-polarization antenna design that they believed would be suitable for both single-input single-output (SISO) and single-input multiple-output (SIMO) at 24 GHz. Angular target tracking and range estimation are achieved using four possible transmitter and receiver polarization combinations: horizontal-horizontal (H-H), horizontal-vertical (H-V), vertical-horizontal (V-H), and vertical-vertical (V-V). The basic radar antenna is well matched from about 23.3 GHz to 25.5 GHz, with isolation exceeding 35 dB.
In [
17], a microstrip antenna design suitable for use in short-range radar studies was presented because it has an E-shaped array and reflector, which is shown to achieve a high gain. The antenna proposed by the authors presents gains of 7.85 and 9.62 dBi at resonance frequencies of 1.4 and 2.4 GHz and, in addition, features a forward-backward (F/B) ratio exceeding 15 dB and a width of the beam where the radiated power fell to 50% suitable for short-range applications.
The authors of [
18] proposed an antenna that operates at 0.5 GHz, intended for use in ground-penetrating radar (GPR) applications with good performance at low frequencies. The design incorporates an improved rectangular reflector with an enhanced antenna gain and directivity. The performance is evaluated based on the radiation pattern, gain, and return loss. Two cases were considered: one with a reflector and one without. The results show better results with the reflector, with a large bandwidth (0.4–1.25 GHz) and increased gain (0.4–1.25 GHz). In [
19], the authors propose a novel method combining a pre-selection strategy with a multi-level dynamic thresholding mechanism to improve both the accuracy and efficiency of massive MIMO systems.
However, none of the studies presented above extends in extenso the theoretical evaluation of the specific
characteristic, its radiation characteristic, and its performances in terms of electrical field distribution depending on the illumination and elevation angles. They have only been marginally mentioned in [
20], where several of their advantages have been mentioned without any demonstration or performance evaluation. By presenting our results, we consider that we are closing the knowledge gap related to these antennas.
The reminder of the paper is organized as follows: in
Section 2, details about double curved antenna reflectors are presented, and the relations used to obtain the ideal
elevation characteristic are highlighted. In
Section 3, calculations are presented using optical geometric methods for the characteristic in the vertical plane, as well as for the characteristic in the vertical plane when using a primary radiator with
directivity. In
Section 4, the results obtained from the simulations are presented, along with the main conclusions.
2. Reflector for Double Curved Antennas
The double-curved reflector is a standard component of various search and tracking radar antenna systems. Initially designed to fulfil the operational demands of search radars, it offers an extended elevation range while maintaining the precise bearing resolution typical of parabolic reflector antennas.
This type of reflector, illuminated by a primary radiation source with an appropriate directive function, emerged when the requirements for the detection and observation of aerial targets required a wide angular range in elevation, where the target could be well observed, and a very good angular resolution in azimuth. For such radar stations where the detection of aerial targets must be done at different elevation angles, a narrow directive characteristic in the horizontal plane is necessary, and in the vertical plane for the elevation angle , a constant amplitude signal must be obtained at the receiver input, i.e., the power distribution on the reflector surface must be a well-known function. For the angles , the energy distribution function on the reflector surface, must be null, i.e., the signal at the receiver input must be zero. The distance is determined by measuring the time between the echo pulse (reflected by the target) and the reference pulse (emitted by the antenna); constant power, independent of the distance value, ensures the necessary signal-to-noise ratio. These conditions are met by the elevation directivity characteristic . These conditions and performances for the directivity characteristic in elevation with a large angular aperture and in the azimuthal plane with a very good angular resolution and a constant power at reception cannot be obtained with an antenna with a parabolic reflector, regardless of the chosen configuration. The option of obtaining a similar characteristic to a phased array antenna is very expensive, both for calibration and operation.
It is known that the received power [
20,
21,
22,
23] varies inversely with the fourth power of the slant distance from the reflector to the target
R
where
and
—is the power of the radar radiation emitted,
—is the wavelength of the transmitter,
—is the effective reflection area of the target; for a target flying in a constant direction, it can be considered in a first approximation as
—is the antenna gain at transmission, for a direction with elevation angle .
—is the antenna gain at reception, for a direction with elevation angle .
But according to relation (2), it can be written .
In
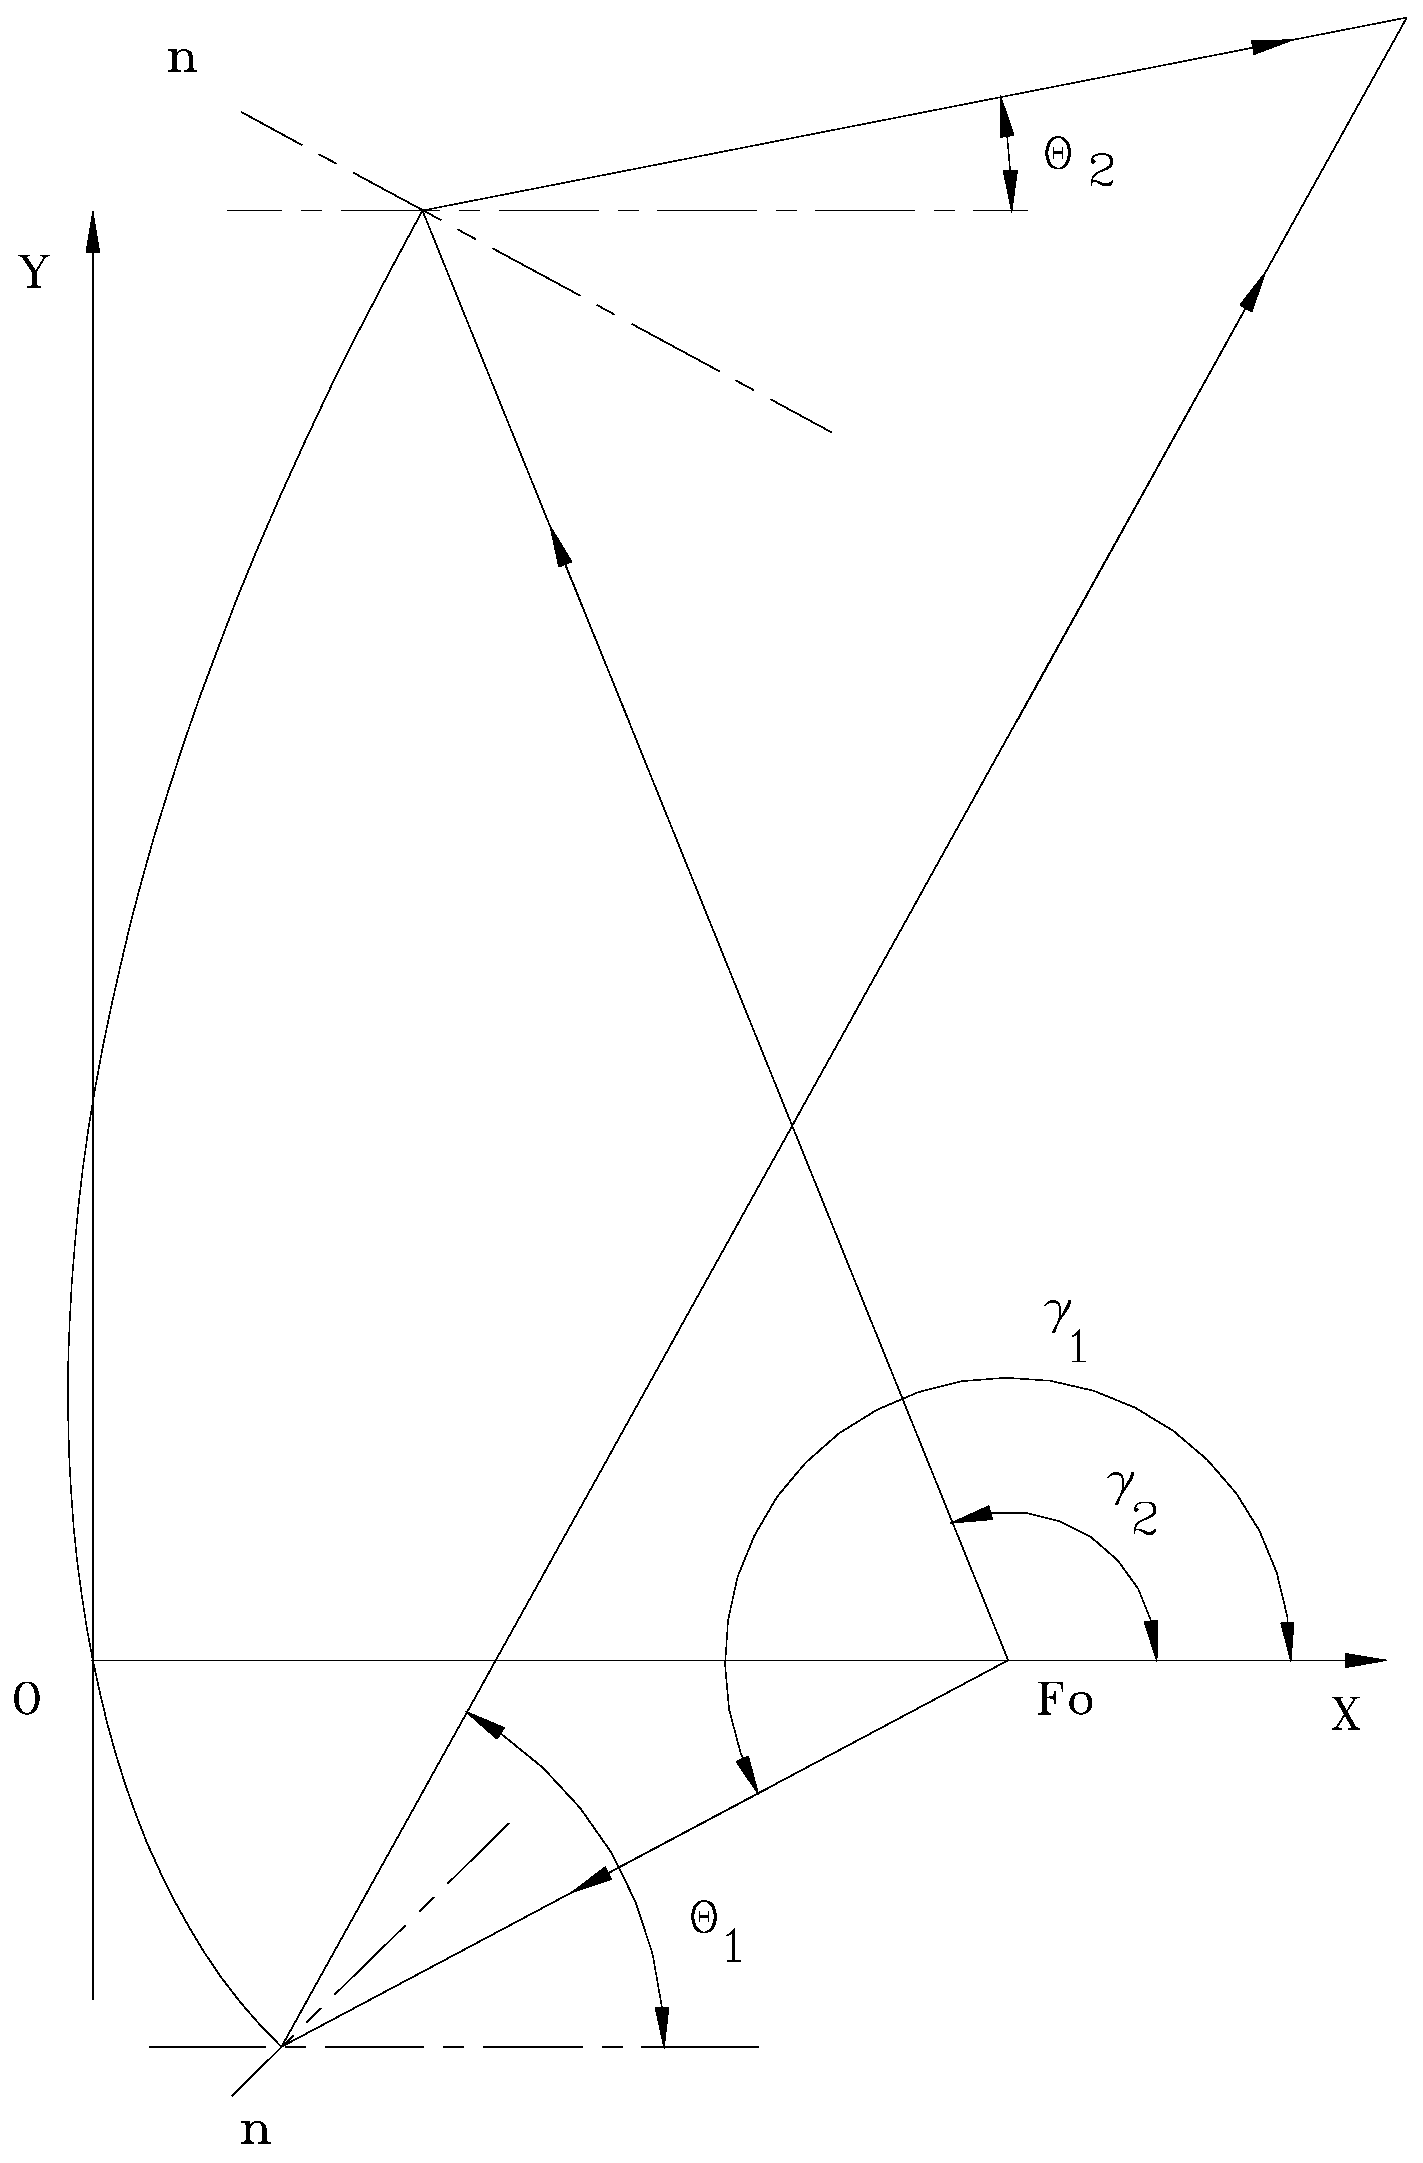
Figure 1, an ideal
elevation directive characteristic is presented, which can provide a complete picture of the relationship between the incline distance
R at an angle
and the target height, thus achieving constant power reception at any elevation angle.
If the height of the target
H is constant, it can be calculated as a function of the distance from the reflector to the target
R, as shown in
Figure 1.
resulting
The received power [
24] is proportional to the gain, that is, to the power directive gain in any direction
But, since
it results
where:
.
These characteristics can be obtained using geometric optics methods by calculating the curvature of the reflecting surface in the vertical plane. In several studies [
1,
15,
20,
21], experimentally determined modified
directive characteristics have been used for airborne radars
or [
20,
24,
25,
26] for radar antennas placed on aircraft
The
characteristic is ideal for constant altitude flight with an isolated isotropic target, being commonly used in airborne target detection radars. The characteristic
represents the optimal [
20,
24] experimental approximation for the
characteristic of antennas designed to operate at wavelengths of 1 to 10 cm.
At this point, it is necessary to mention that such a discontinuous energy distribution, as the one shown above, with a reflector of limited dimensions, is practically impossible to achieve. Diffraction phenomena are inevitable, and what can be hoped for, at best, is to achieve a very good approximation of the optimal model for the function in the range of angles and with an acceptable level of field intensity outside this interval.
First and foremost, it must be noted that, for determining the azimuth of the discovered target in the horizontal plane, a symmetric directive characteristic is used, which can be formed by a reflector with a parabolic profile in the horizontal plane for the reflection directions. In this case, the horizontal profile is parabolic (for the reflection directions), while the vertical profile has a curvature obtained through numerical integration, based on the condition of achieving a power distribution. The primary radiation source can be a horn antenna or a slot antenna.
3. Calculus Using Optical Geometric Methods
- A.
The characteristics in the vertical plane.
To achieve the pattern of radiation in the elevation plane, it’s essential to create a function that represents the profile of the reflector in the vertical plane, ensuring a power distribution. Following the principle of energy conservation, applied specifically in the optical geometric methods used for designing the double-curved radiator, the energy of the incoming ray must equal that of the reflected ray.
If
is the power emitted by the primary reflector in a unitary solid angle, as shown in
Figure 1, the power emitted by the primary reflector situated in the focal point F, in a solid angle
, is:
After reflecting on surface
, it becomes a spatial sector with angular aperture
and width
, such as the power density of the reflected beam
fulfills the energy conservation rule, thus resulting
or
Letting
the incident beam angular limits, their correspondents in the secondary beam are
, such that
For solving this, we define the variable
where
is the largest value of position [
21,
27,
28] vector absolute value, i.e., from focal point to the current point. We can rewrite then (13) as
Since
we may choose a constant
such that
Introducing the constant
,
results
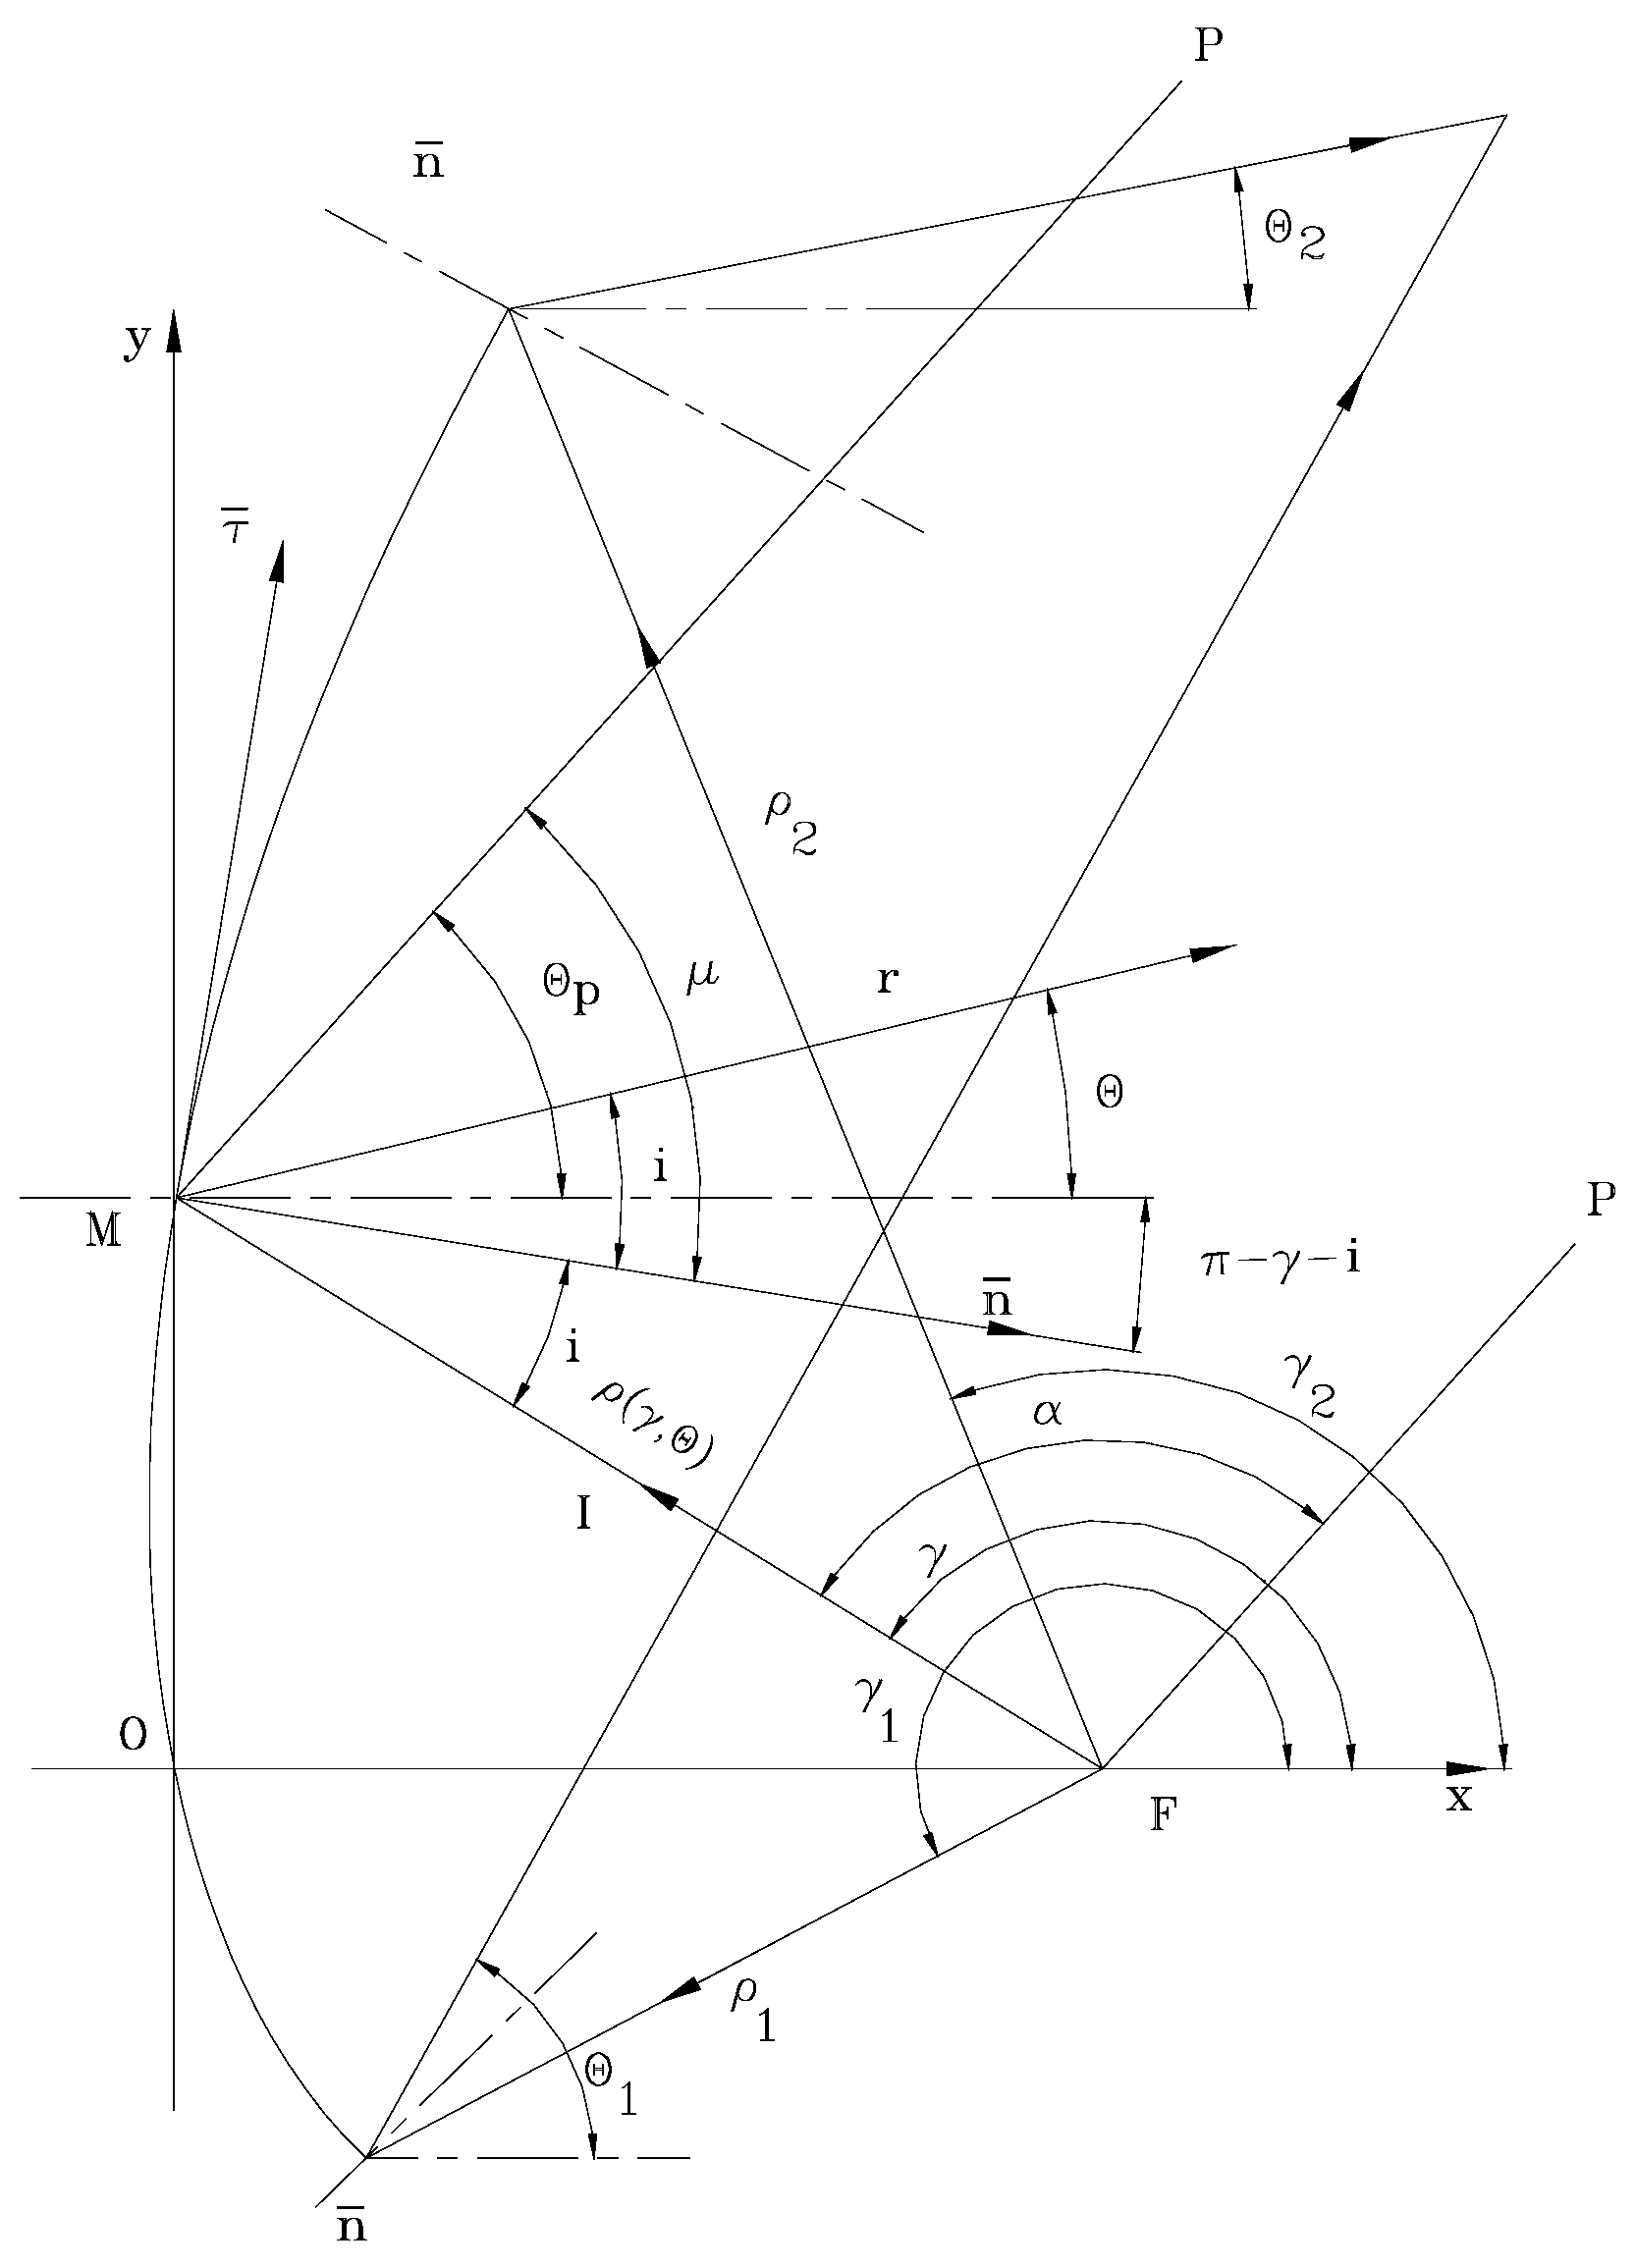
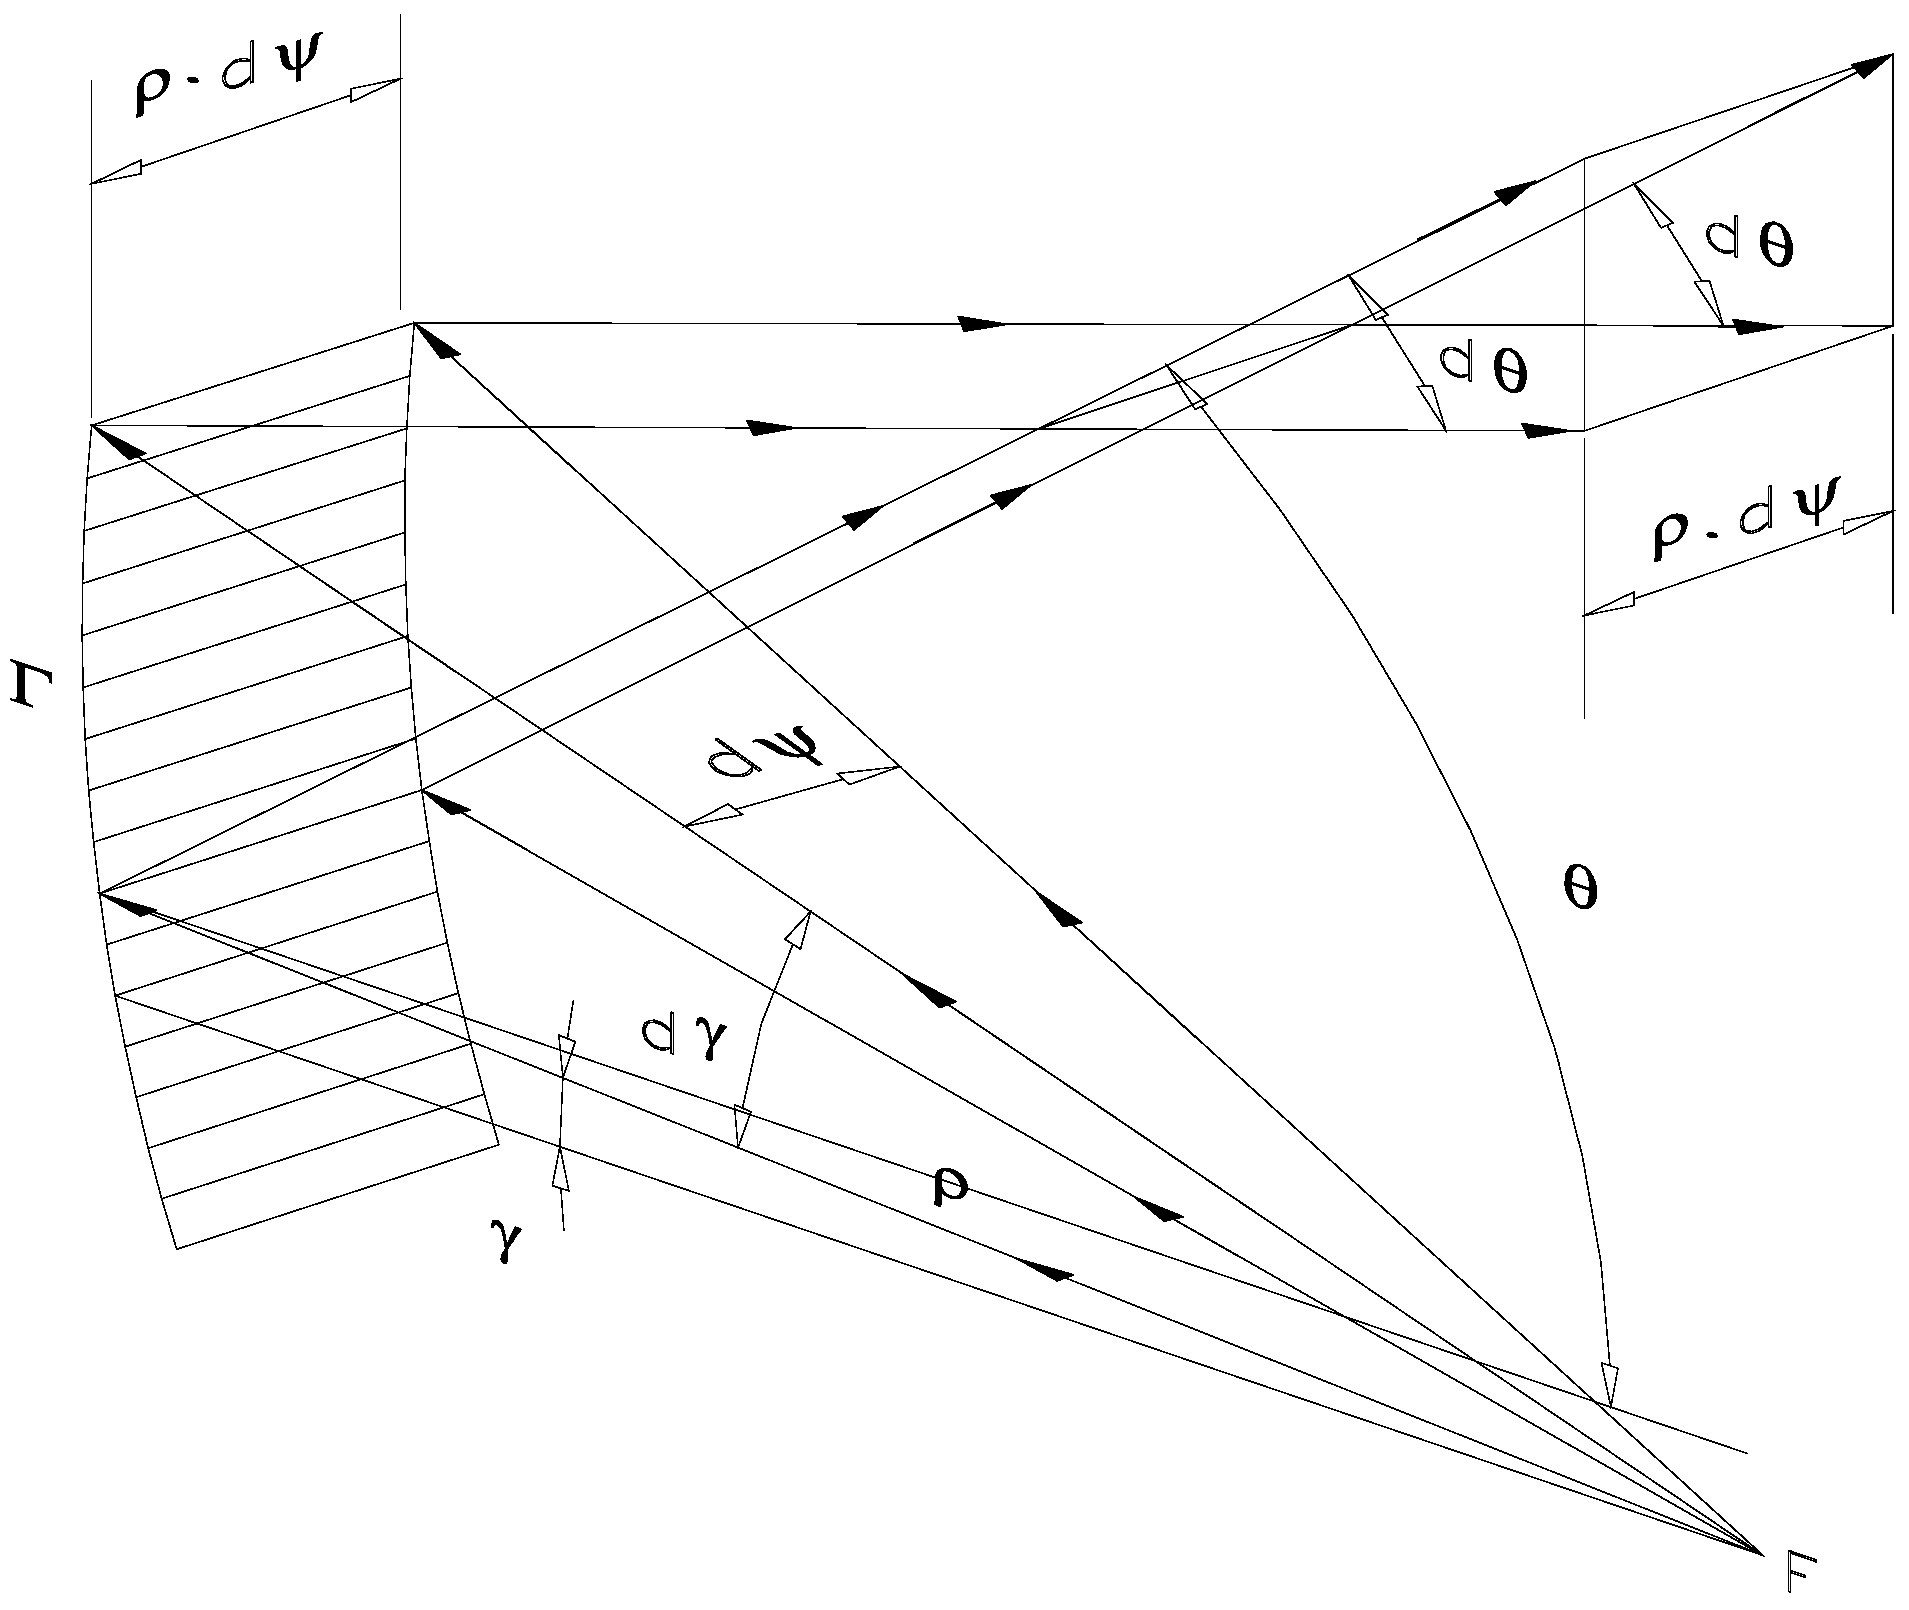
Figure 2 shows the necessary details and notations for the optical calculations. To simplify the computation effort, we can make a convenient choice of the system axis, the angle measurement convention for the position vectors of the incident beam
, with magnitude
. The angles of the radiation directions of the reflected beam
, as they result from the optical calculation, are a function of the angle of the current position vector in the incident beam
, the limits of the incident beam, and the limits of the reflected beam, namely
. The solid angle of the incident beam is suggestively depicted
with the position vector
at an angle of incidence
from the reference point
F (where the primary radiation source is positioned) onto a very narrow surface element around the curvature
in the reflector’s plane of symmetry. Additionally, the corresponding reflected beam for the angle of reflection
is shown with its aperture
and width
.
To determine the mathematical expression of the curvature in the vertical plane, namely the instantaneous vector as a function of and . Since the curve is defined in polar coordinates, we need to evaluate first the equation fulfilled by the tangent to the curve.
Figure 3 shows the necessary details and notations for the optical calculations. To reduce the calculation effort it is necessary to make a convenient choice of the axis system, the angle measurement convention for the position vectors of the incident beam (with magnitude
,
), and the angles of the radiation directions of the reflected beam
(resulting from the optical calculation, which are a function of the angle of the current position vector in the incident beam, the limits of the incident beam, and the limits of the reflected beam).
Considering that the focus is placed on the x-axis at a distance
from the origin, the curve is generated in the right semi-plane,
thus
is in the second quadrant and
is in the first quadrant. Therefore, the angles
are positive, in the first quadrant with values
as shown in
Figure 3. It results
where
is the angle between the incident ray and the normal to the surface.
The tangent to the curve expression [
2,
3,
4] is given by
This relation is valid when the primary radiator directivity characteristic is determined empirically point-by-point, and it can be approximated using the Simpson 1/3 numerical integration method.
In
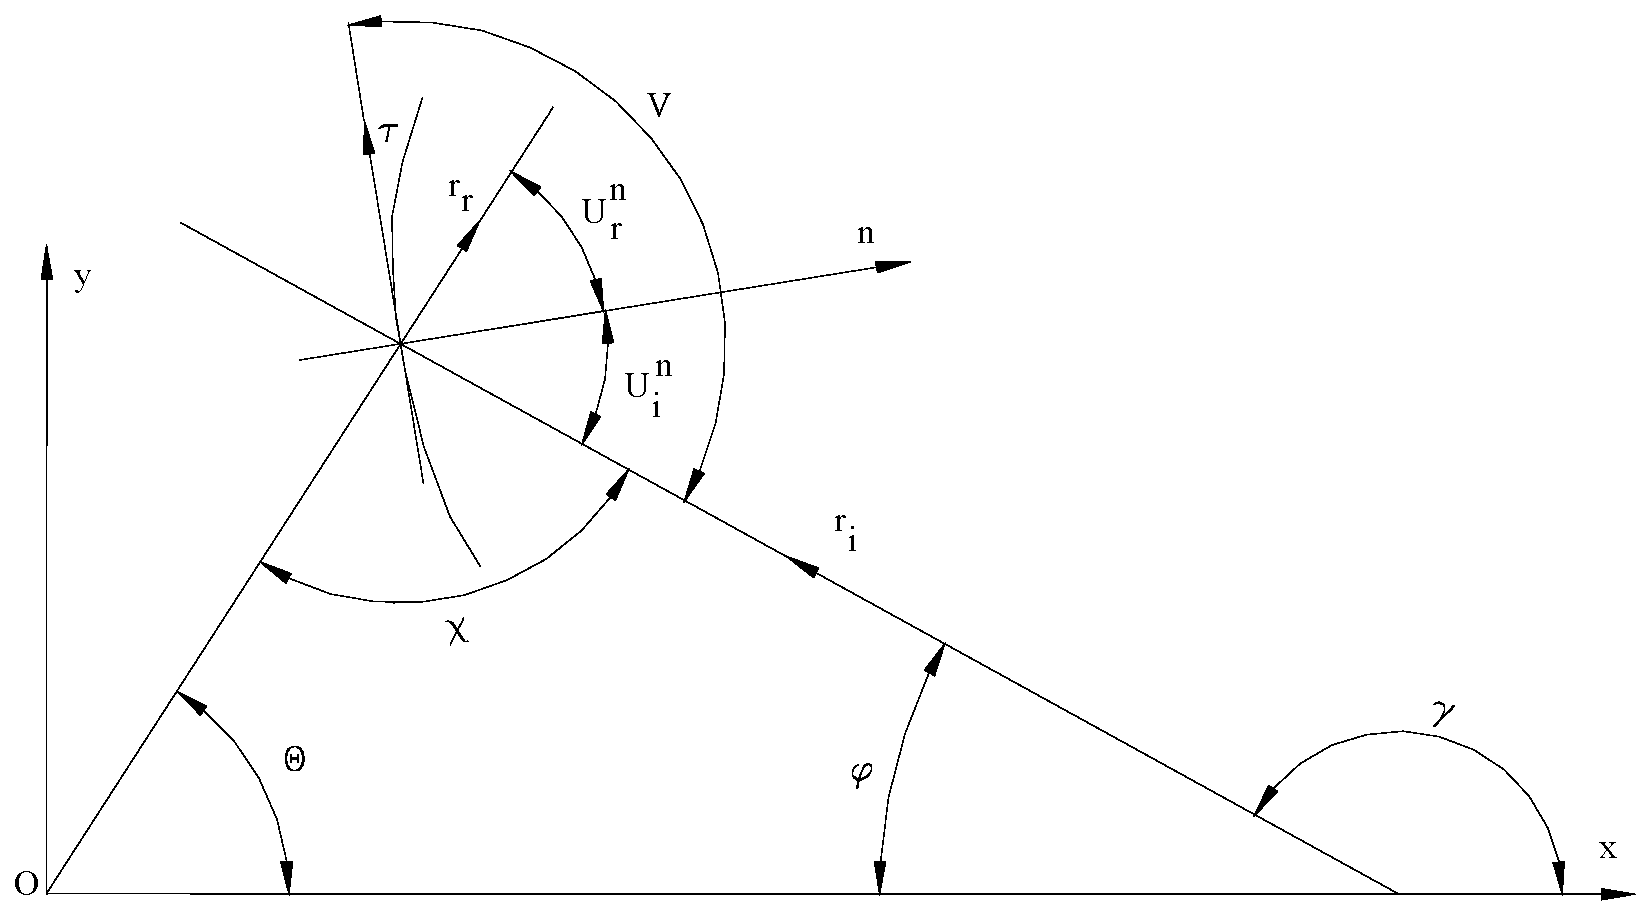
Figure 4, the angle notations and conventions are presented for the position vectors corresponding to the incident ray
, the reflected ray
in relation to the normal
, and the tangent
to the curve in the symmetry plane at the incidence point. These notations are necessary to evaluate the relationship between the tangent angle to the curve in the plane of symmetry in the incidence point of
V, the angle of incidence
, the angle of reflection
, and the incident,
, and reflected,
ray angles to the characteristic in the plane of symmetry.
- B.
The characteristic in the vertical plane when using a primary radiator with the directivity cos4
In this case, knowing the directivity characteristic of the primary reflector, we need to calculate the curve expression in the vertical plane that ensures the desired power density of the reflected beam pattern,
[
14,
15,
24,
26]. First, we can assume that the variation of
has little or no effect on the primary radiation pattern power density, thus Equation (12) can be rewritten as
where
is a constant that has to be determined such that the energy of the incident beam is between
and
is equal to one of the reflected beams in between
and
, where
is given by (17). The notations are pictorially presented in
Figure 2.
We choose the primary radiator, the directivity function
and a reflector with the power density
Then, using (17), (22), and (23), we have
Also, integrating (21), and with (22) and (23), we obtain
On the other hand, using
instead of (19)–(22), we obtain
By contrast with the general method presented in section A, where we have chosen for the position vector its maximum absolute value,
, we may choose a known value for the position vector, for example, the position of the focus
. Thus, the integral may be evaluated on sub-intervals since the position vector is known. For
(20) becomes
and for
it becomes
The mathematical steps used for integrating Equation (20) and obtaining the curve in the symmetry plane in Cartesian coordinates and reflector surfaces are described in detail in references [
21,
24]
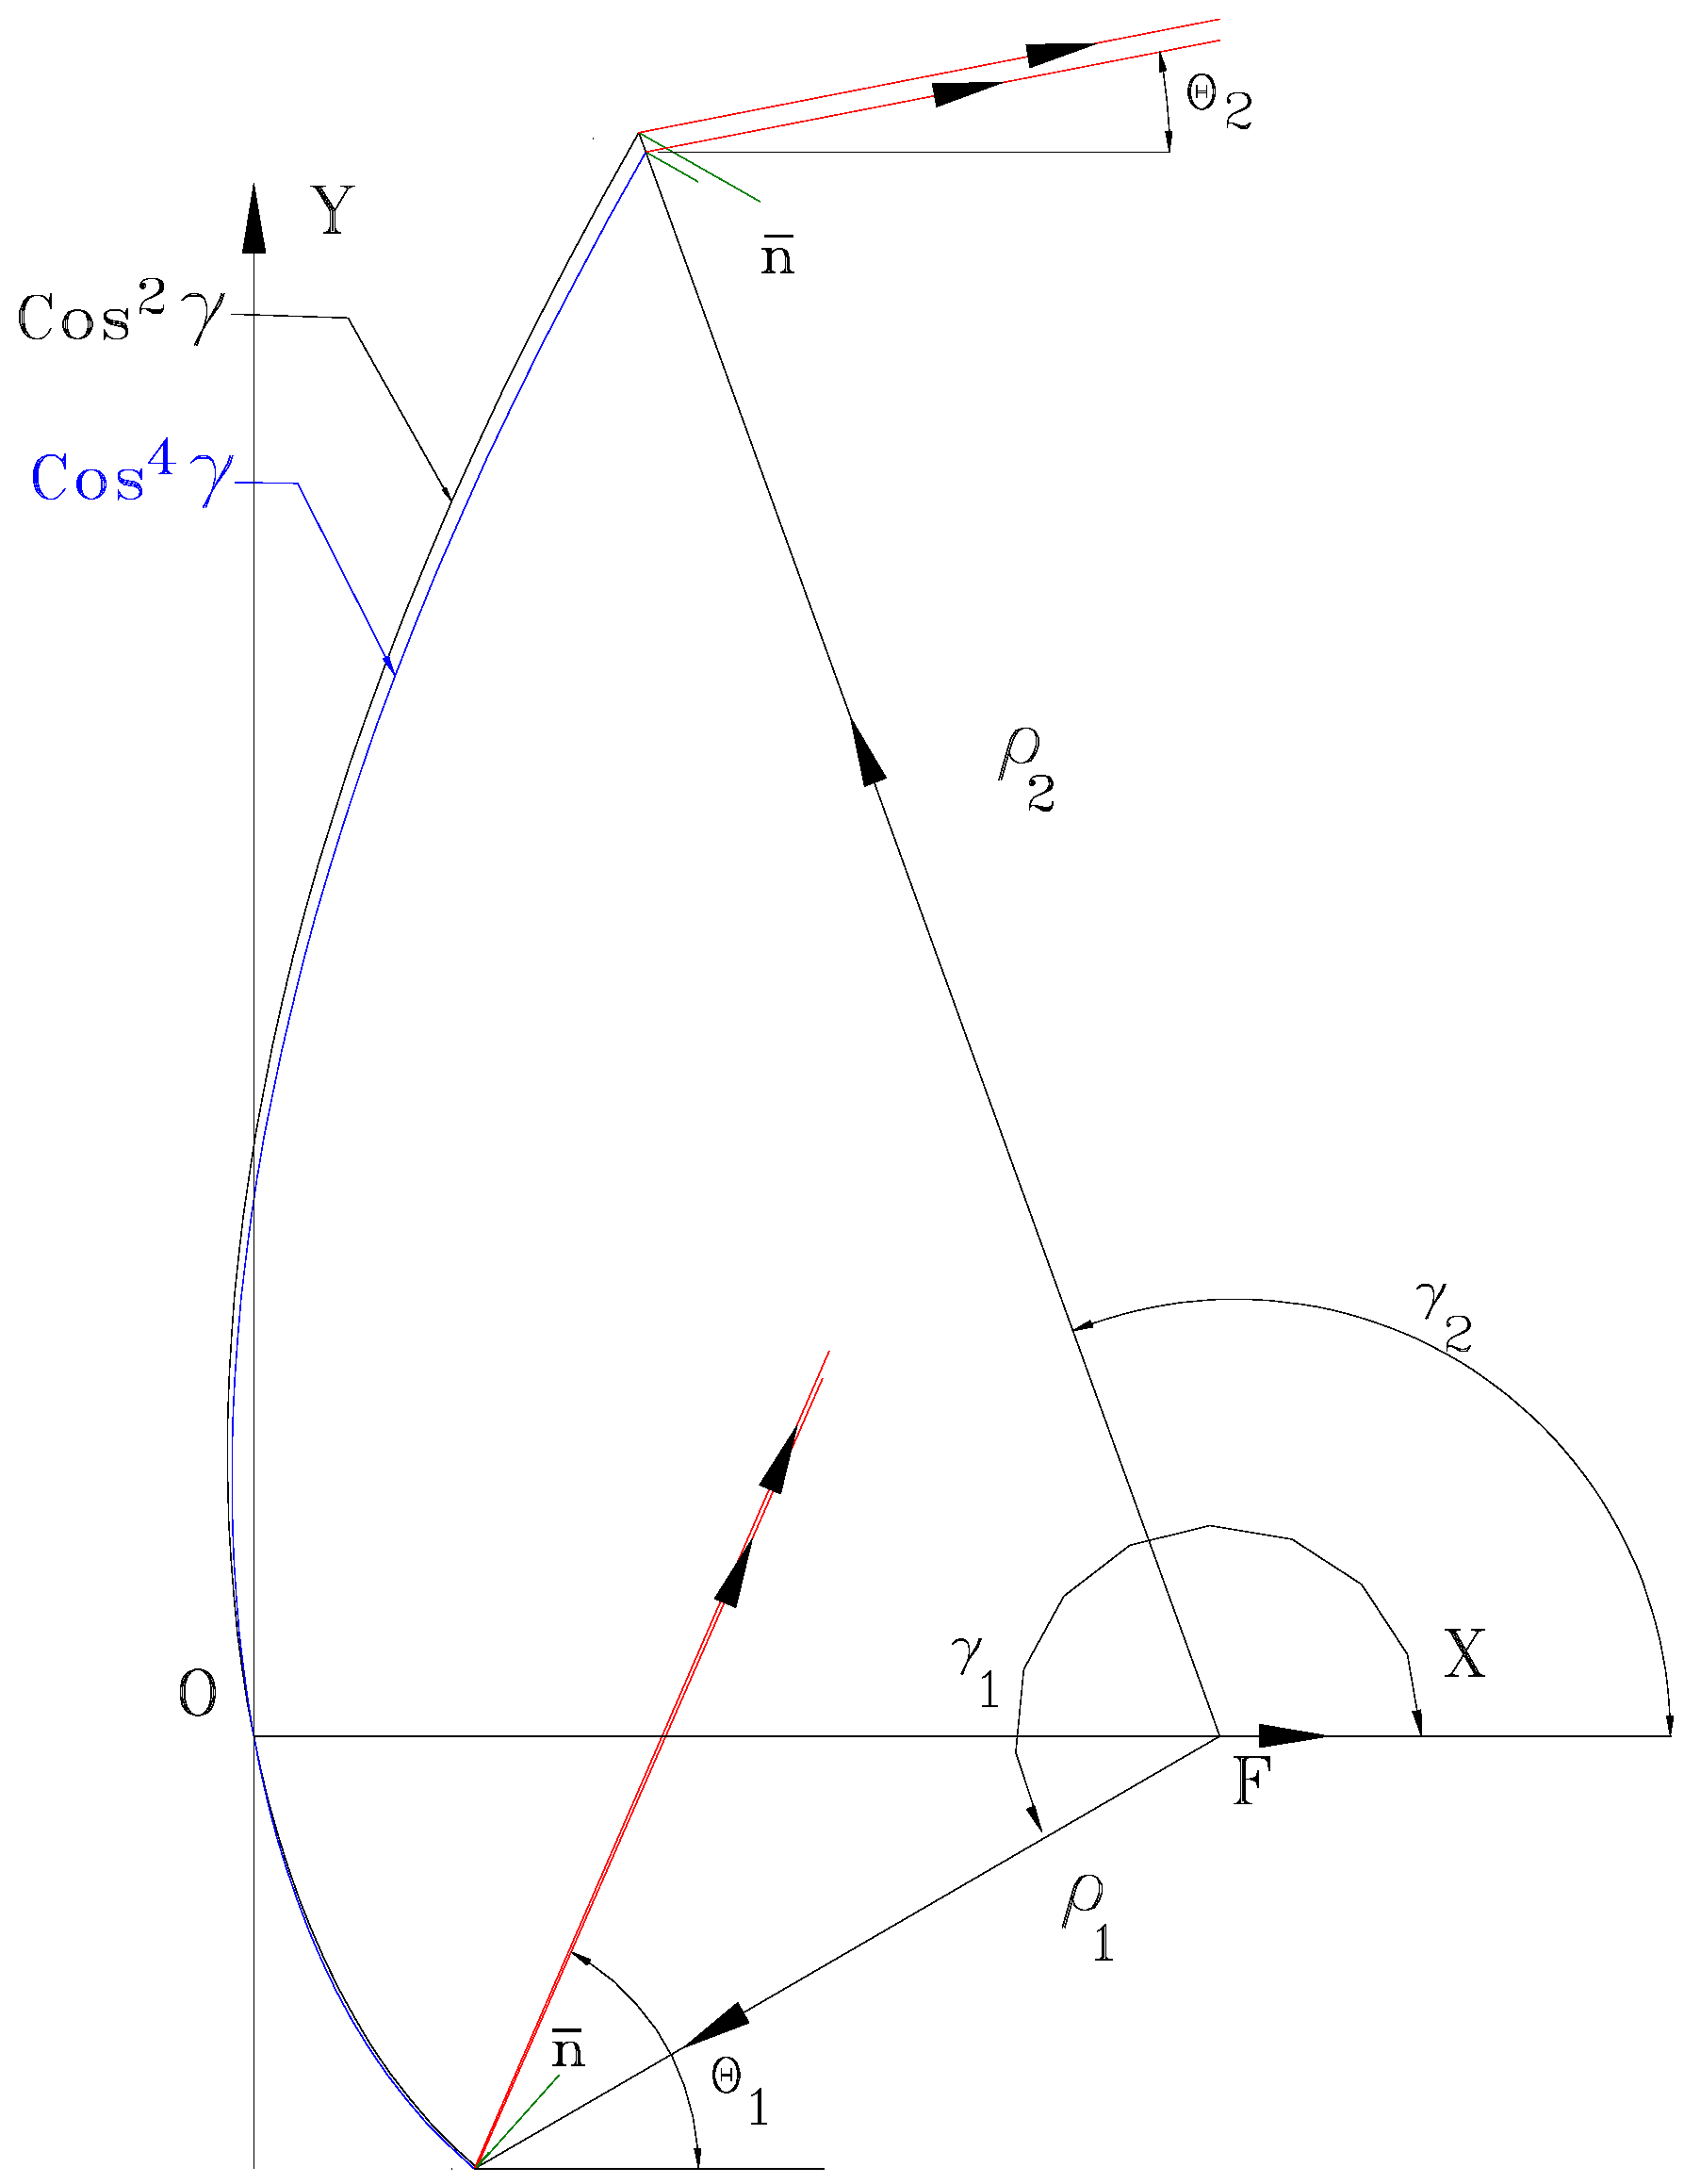
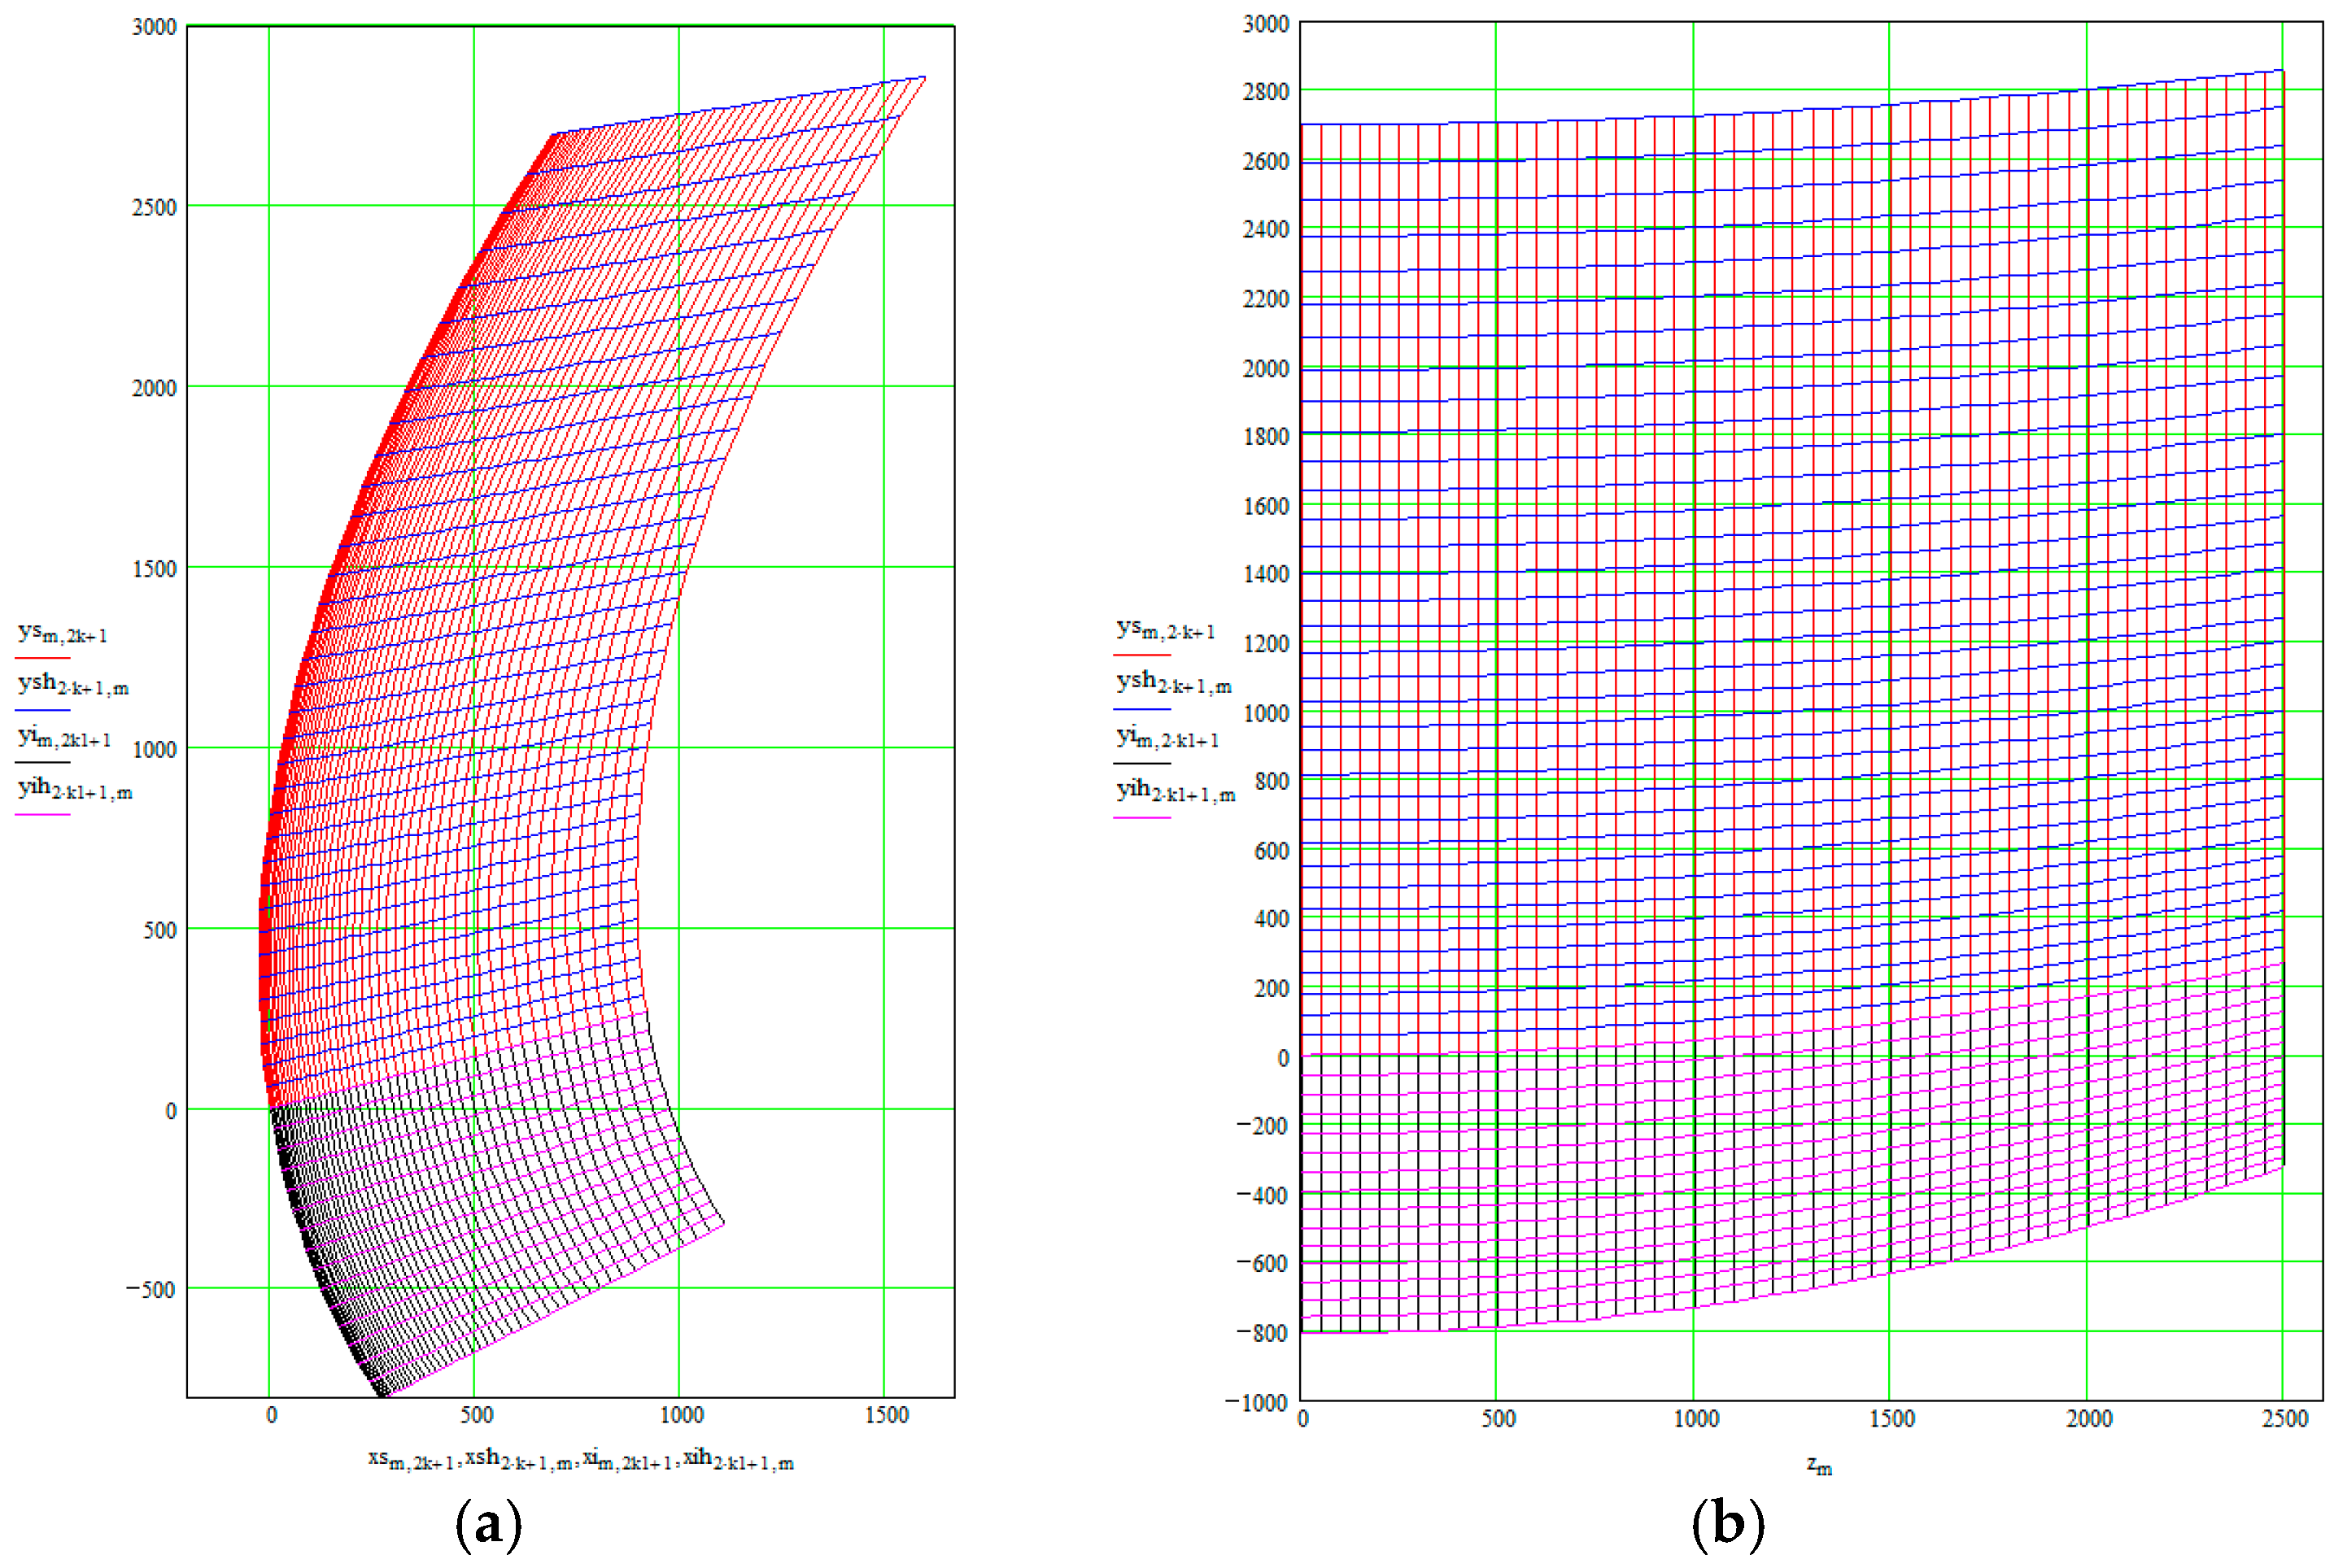
Figure 5 presents the shape of the curve in the symmetry plane when using a
illumination and for
illumination. The rest of the parameters, i.e.,
are the same.
Figure 6 represents the details of
Figure 5, which emphasize the differences between the two characteristics.
In
Figure 6, details are provided to clearly highlight the differences between the two curves shown in
Figure 5. These differences, in the vertical plane, are significant at the top and bottom edges of the reflector. Reducing the surface of the reflector decreases the aerodynamic load, reduces the dimensions of the support structure, and consequently, the weight of the reflector.
In
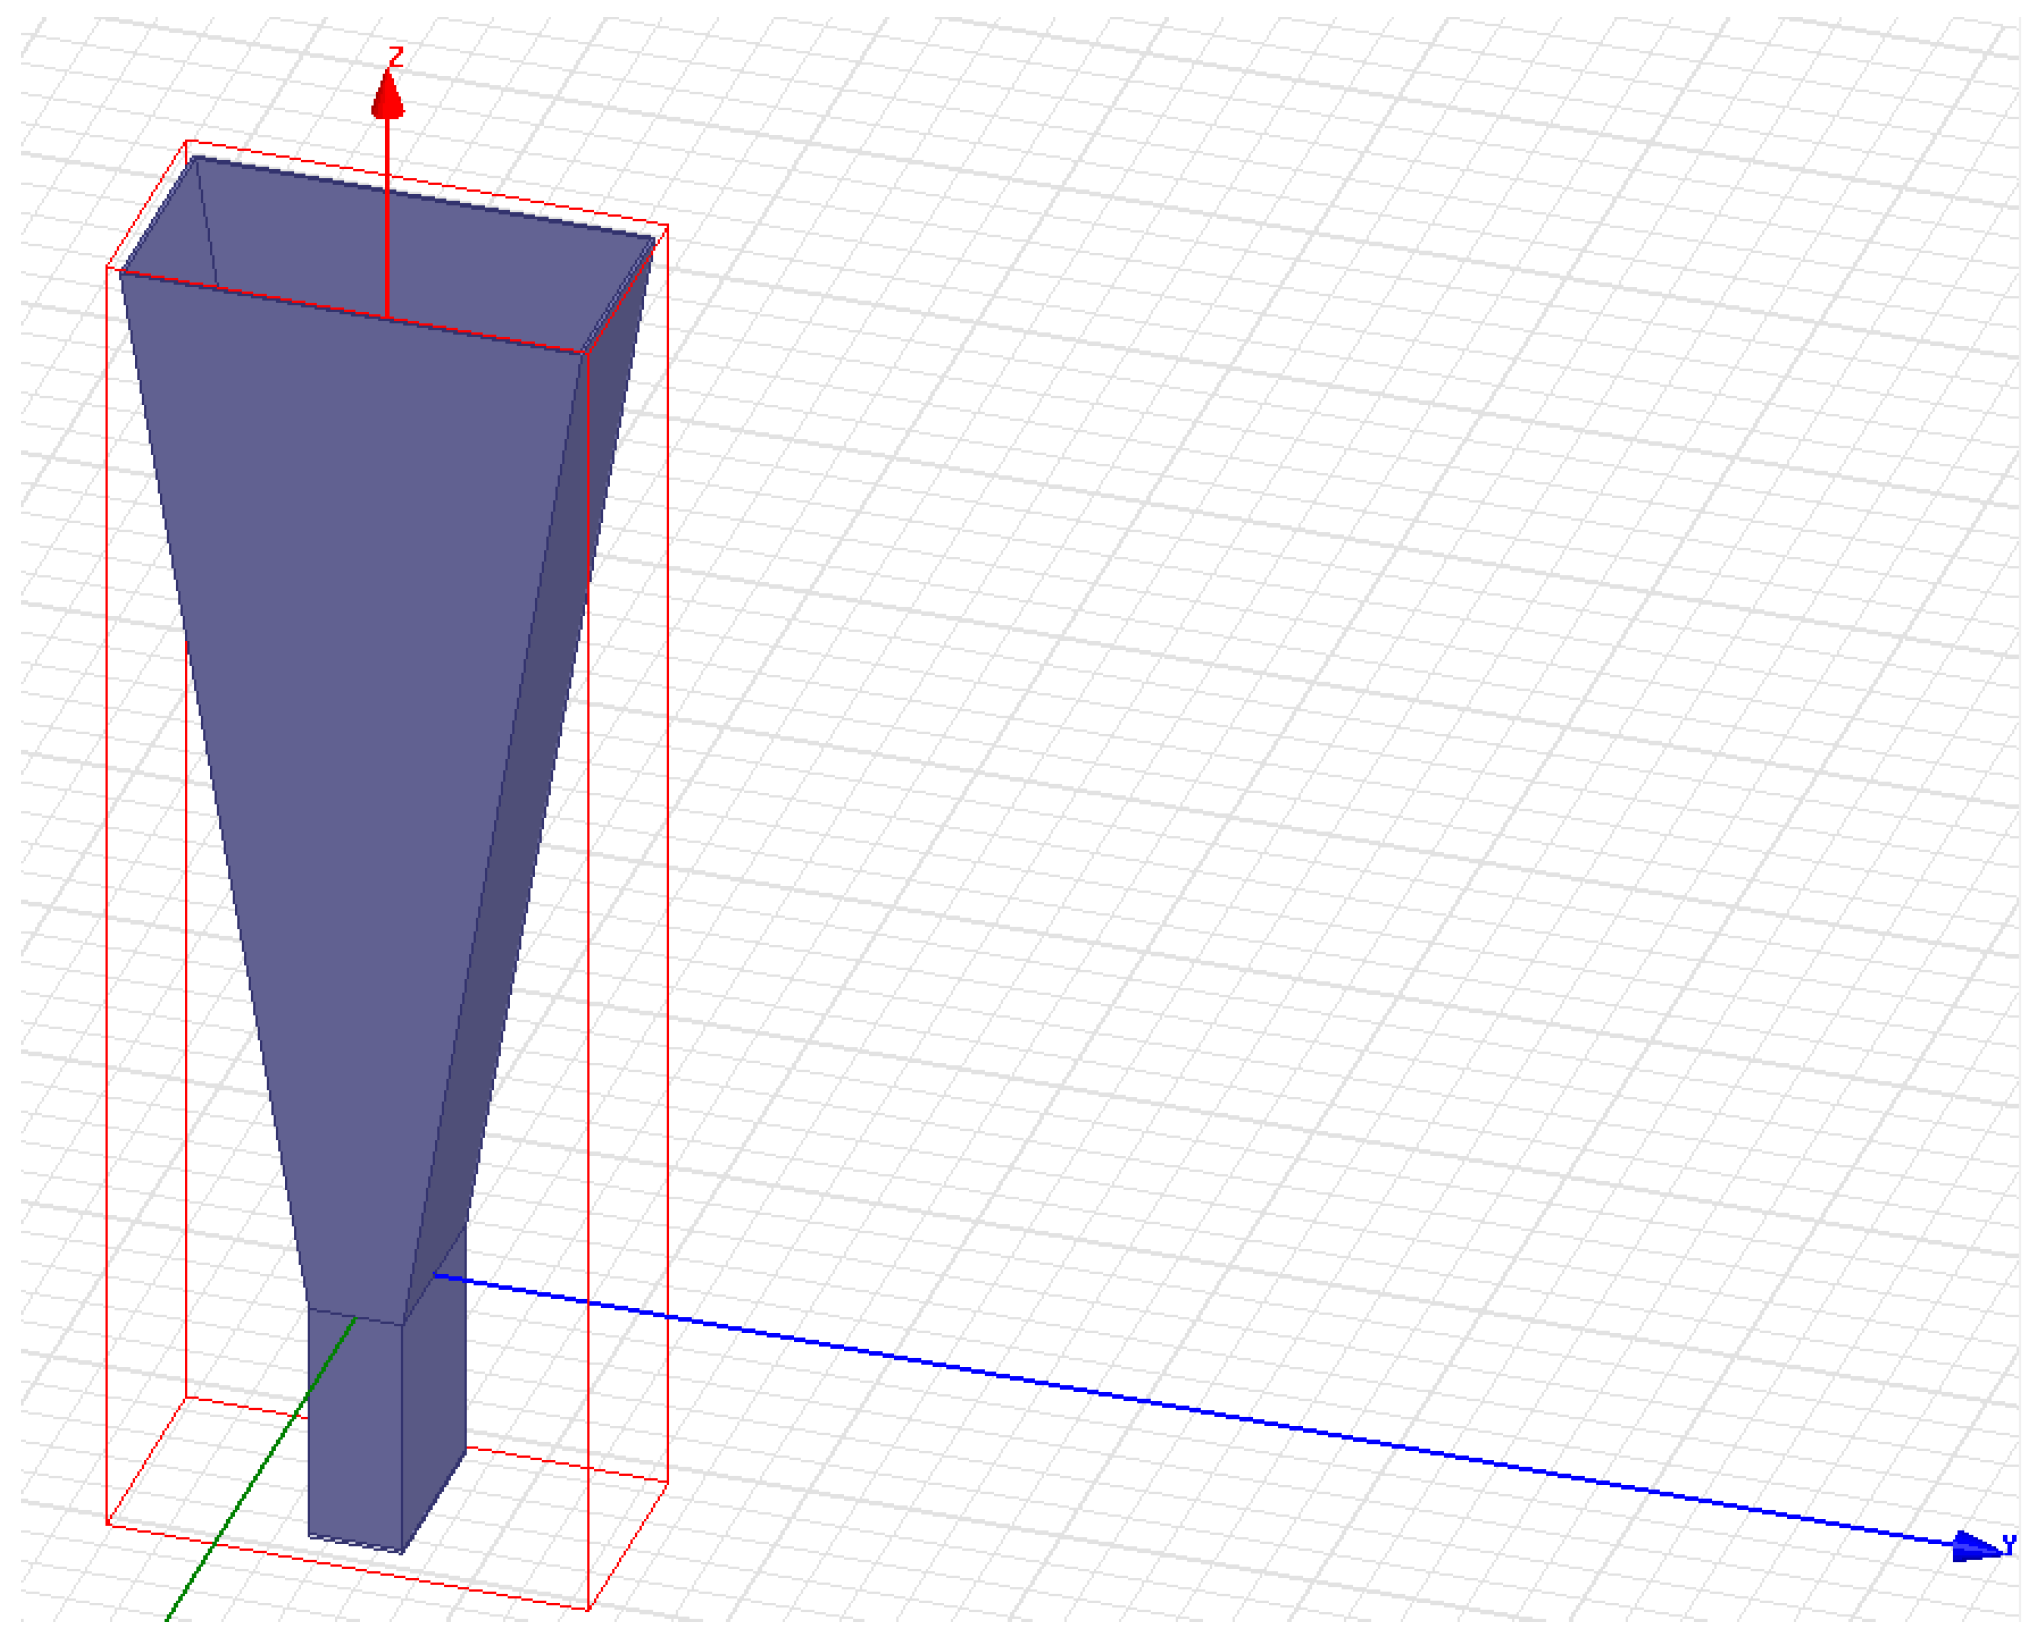
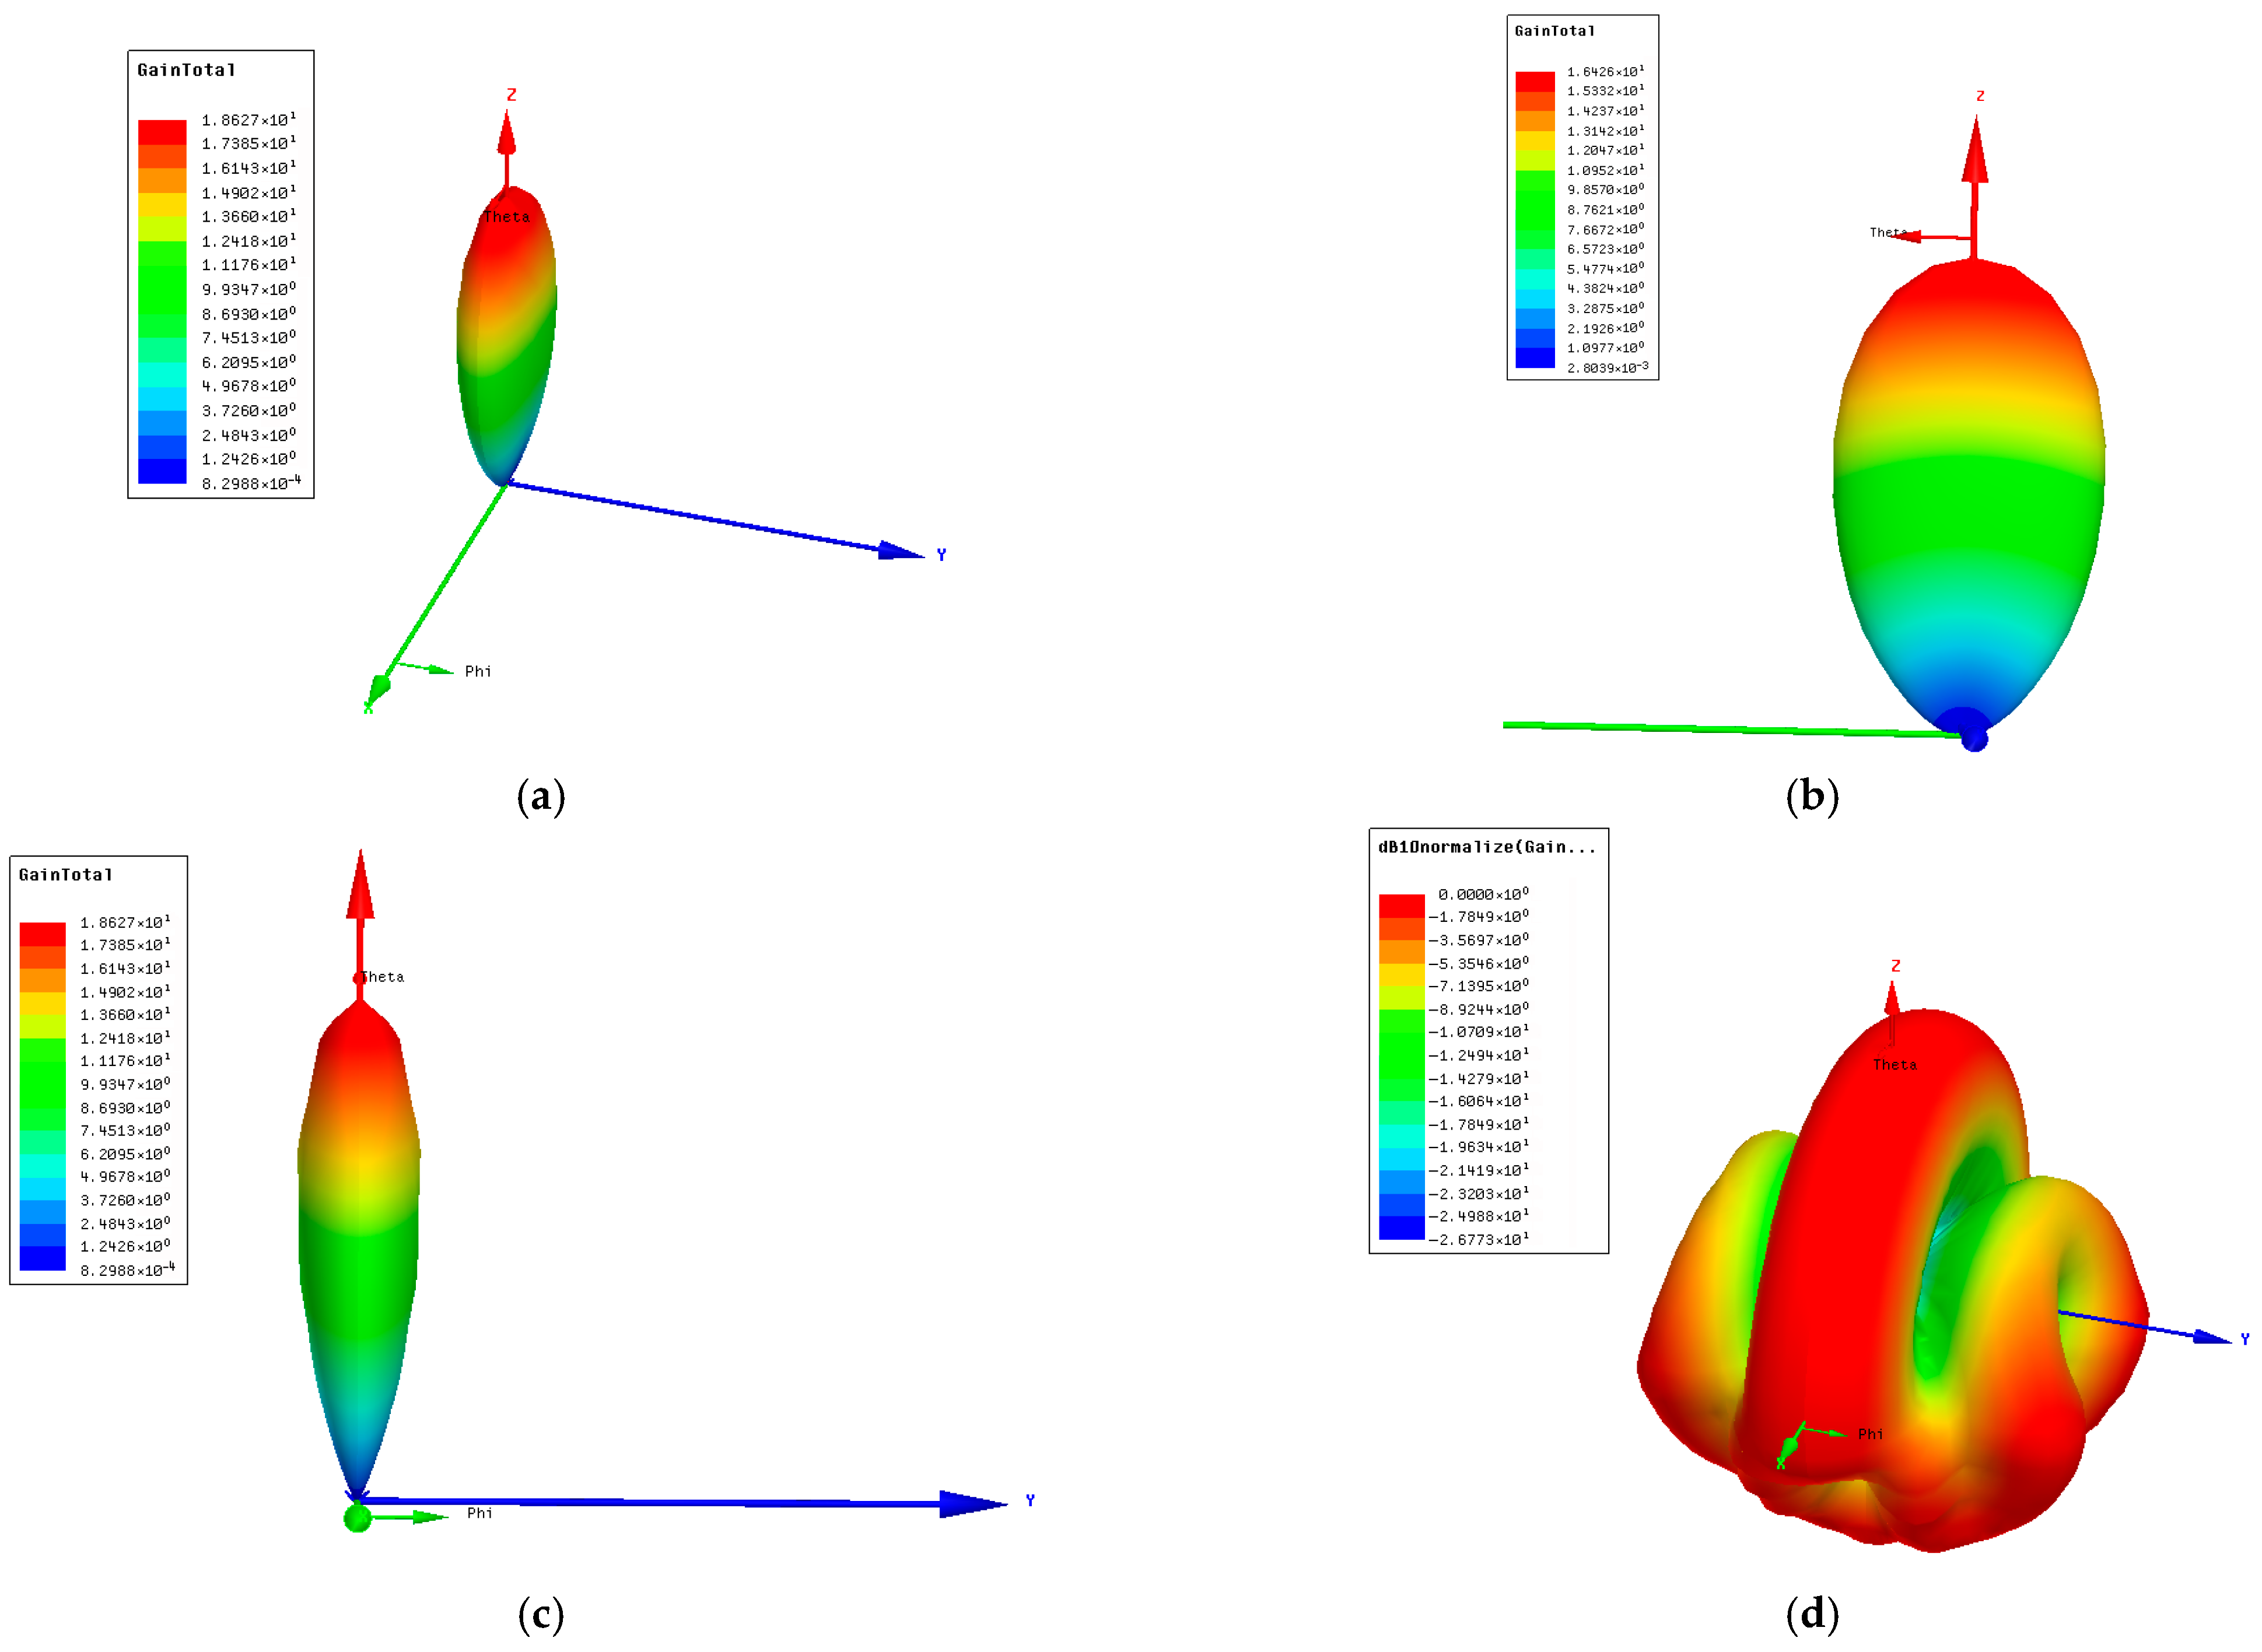
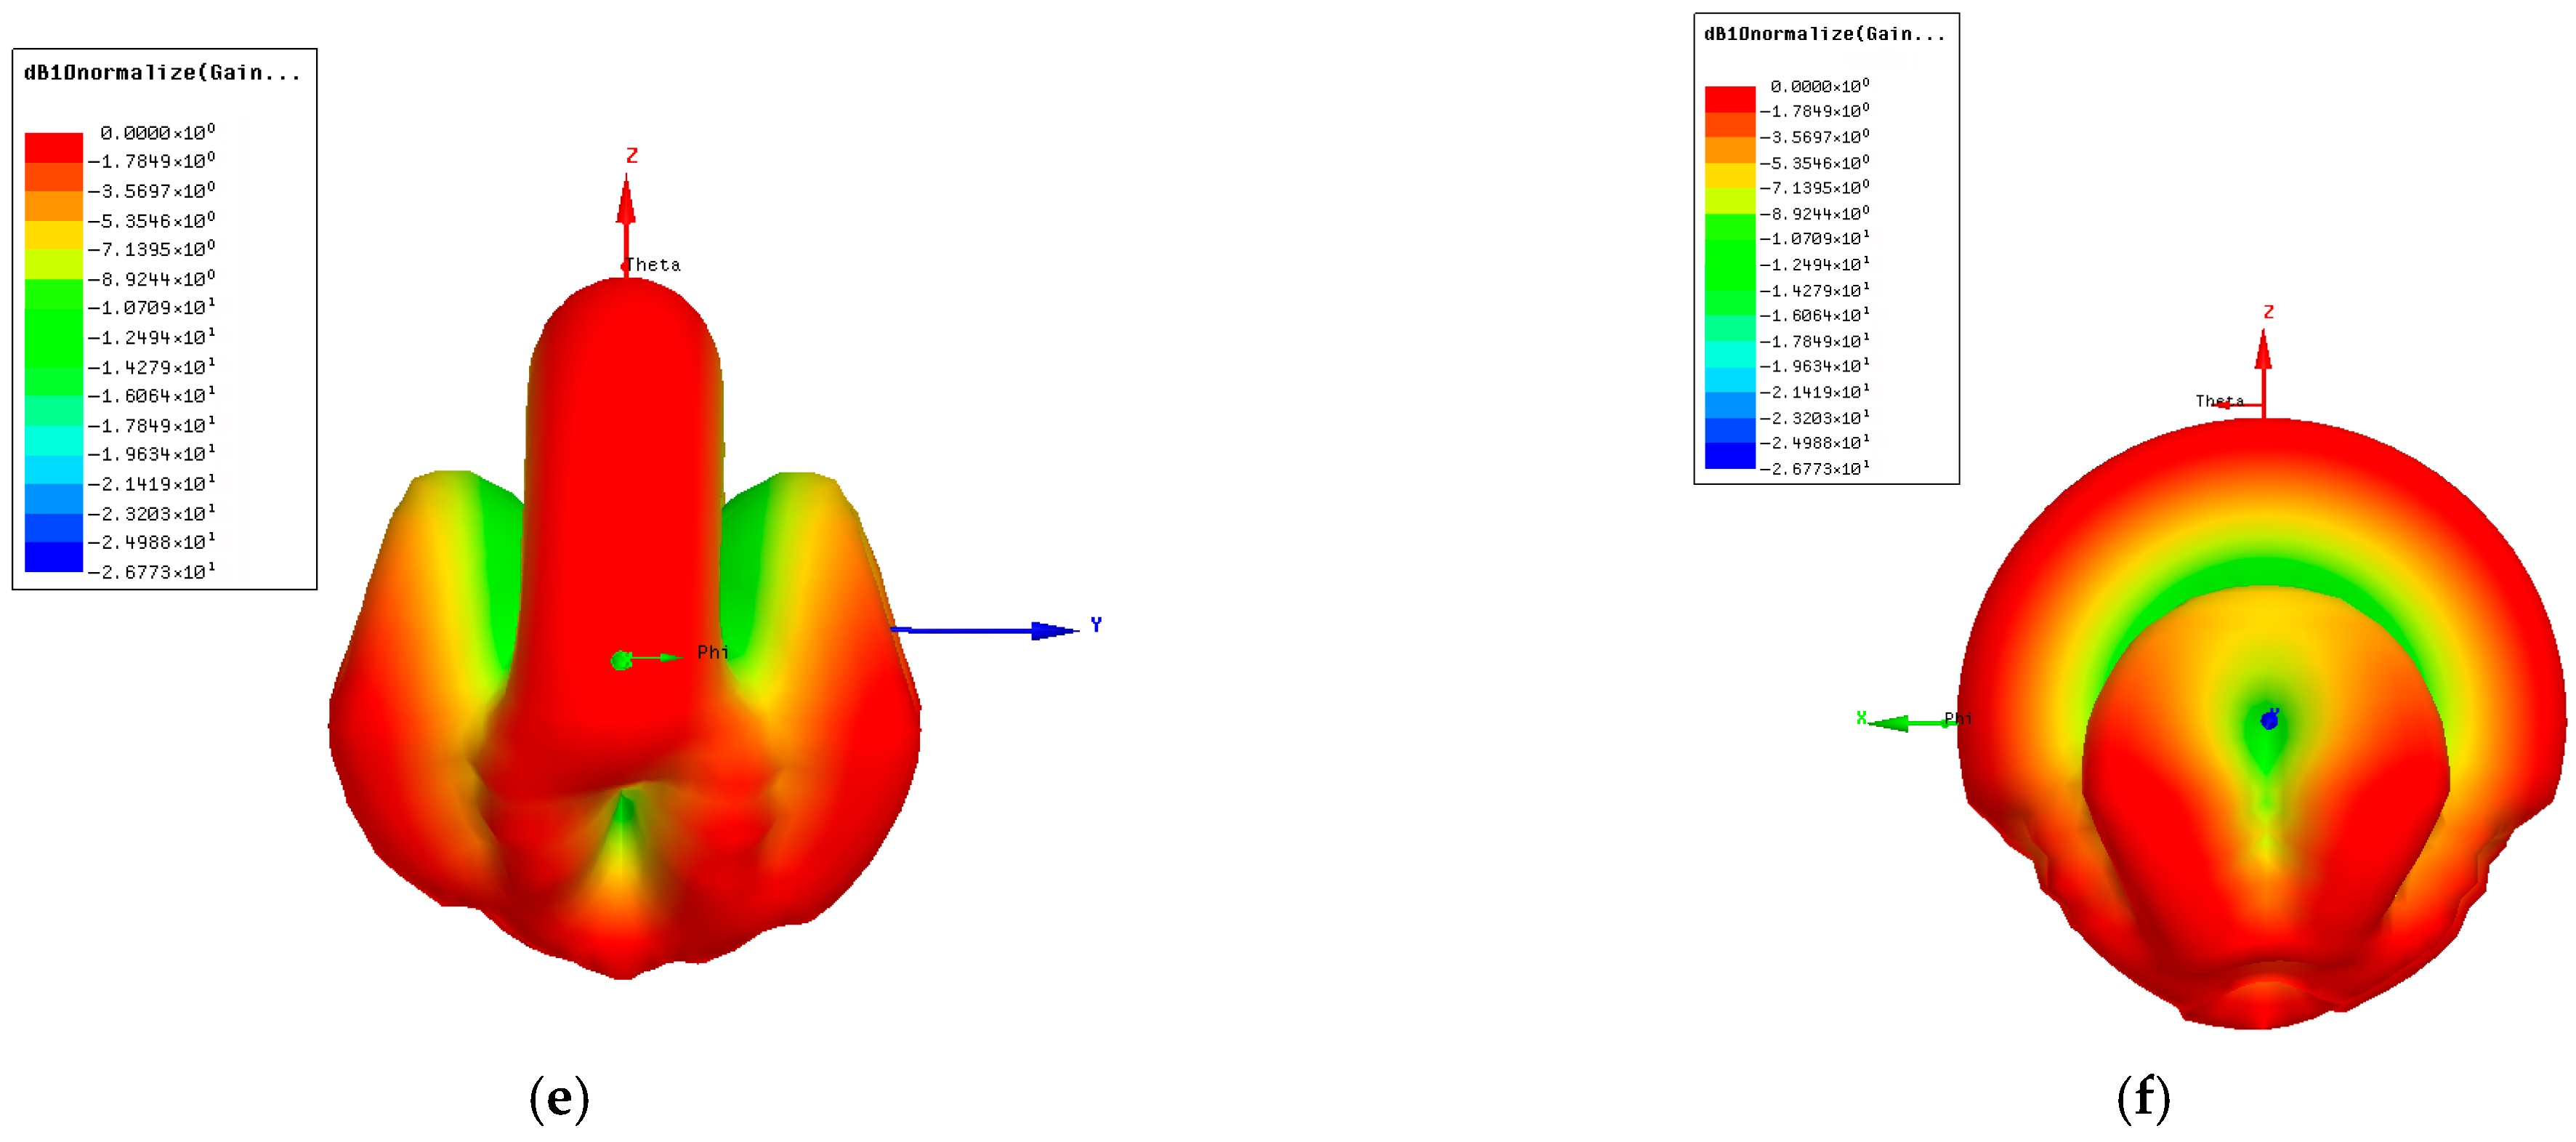
Figure 7, an example of a sectoral horn antenna with linear polarization in the E-plane is presented, which can be used to illuminate a reflector generated with the curve from the symmetry plane defined by Equations (22)–(25), (28), and (29). The sectoral horn antenna shown in the Figure is prepared to simulate the radiation characteristics using the finite element method on the Ansys HFSS platform. For this simulation the following setting shave been used: HFSS Driven Modal, Material: pec, Boundaries: Perfect E1/Radiation/vacuum/Radiating Only, Excitation: Wave port/Properties/General Name: 1/Modes: Number of modes1, Integration line: defined, Characteristic impedance Z0: Zpi/Mode Alignment and Polarity: Set mode polarity using integration lines.
Figure 8,
Figure 9 and
Figure 10 show the results of simulating the radiation characteristics of the horn antenna shown in
Figure 7. Firstly, the results obtained for the 3D radiation pattern are presented (
Figure 8a–f).
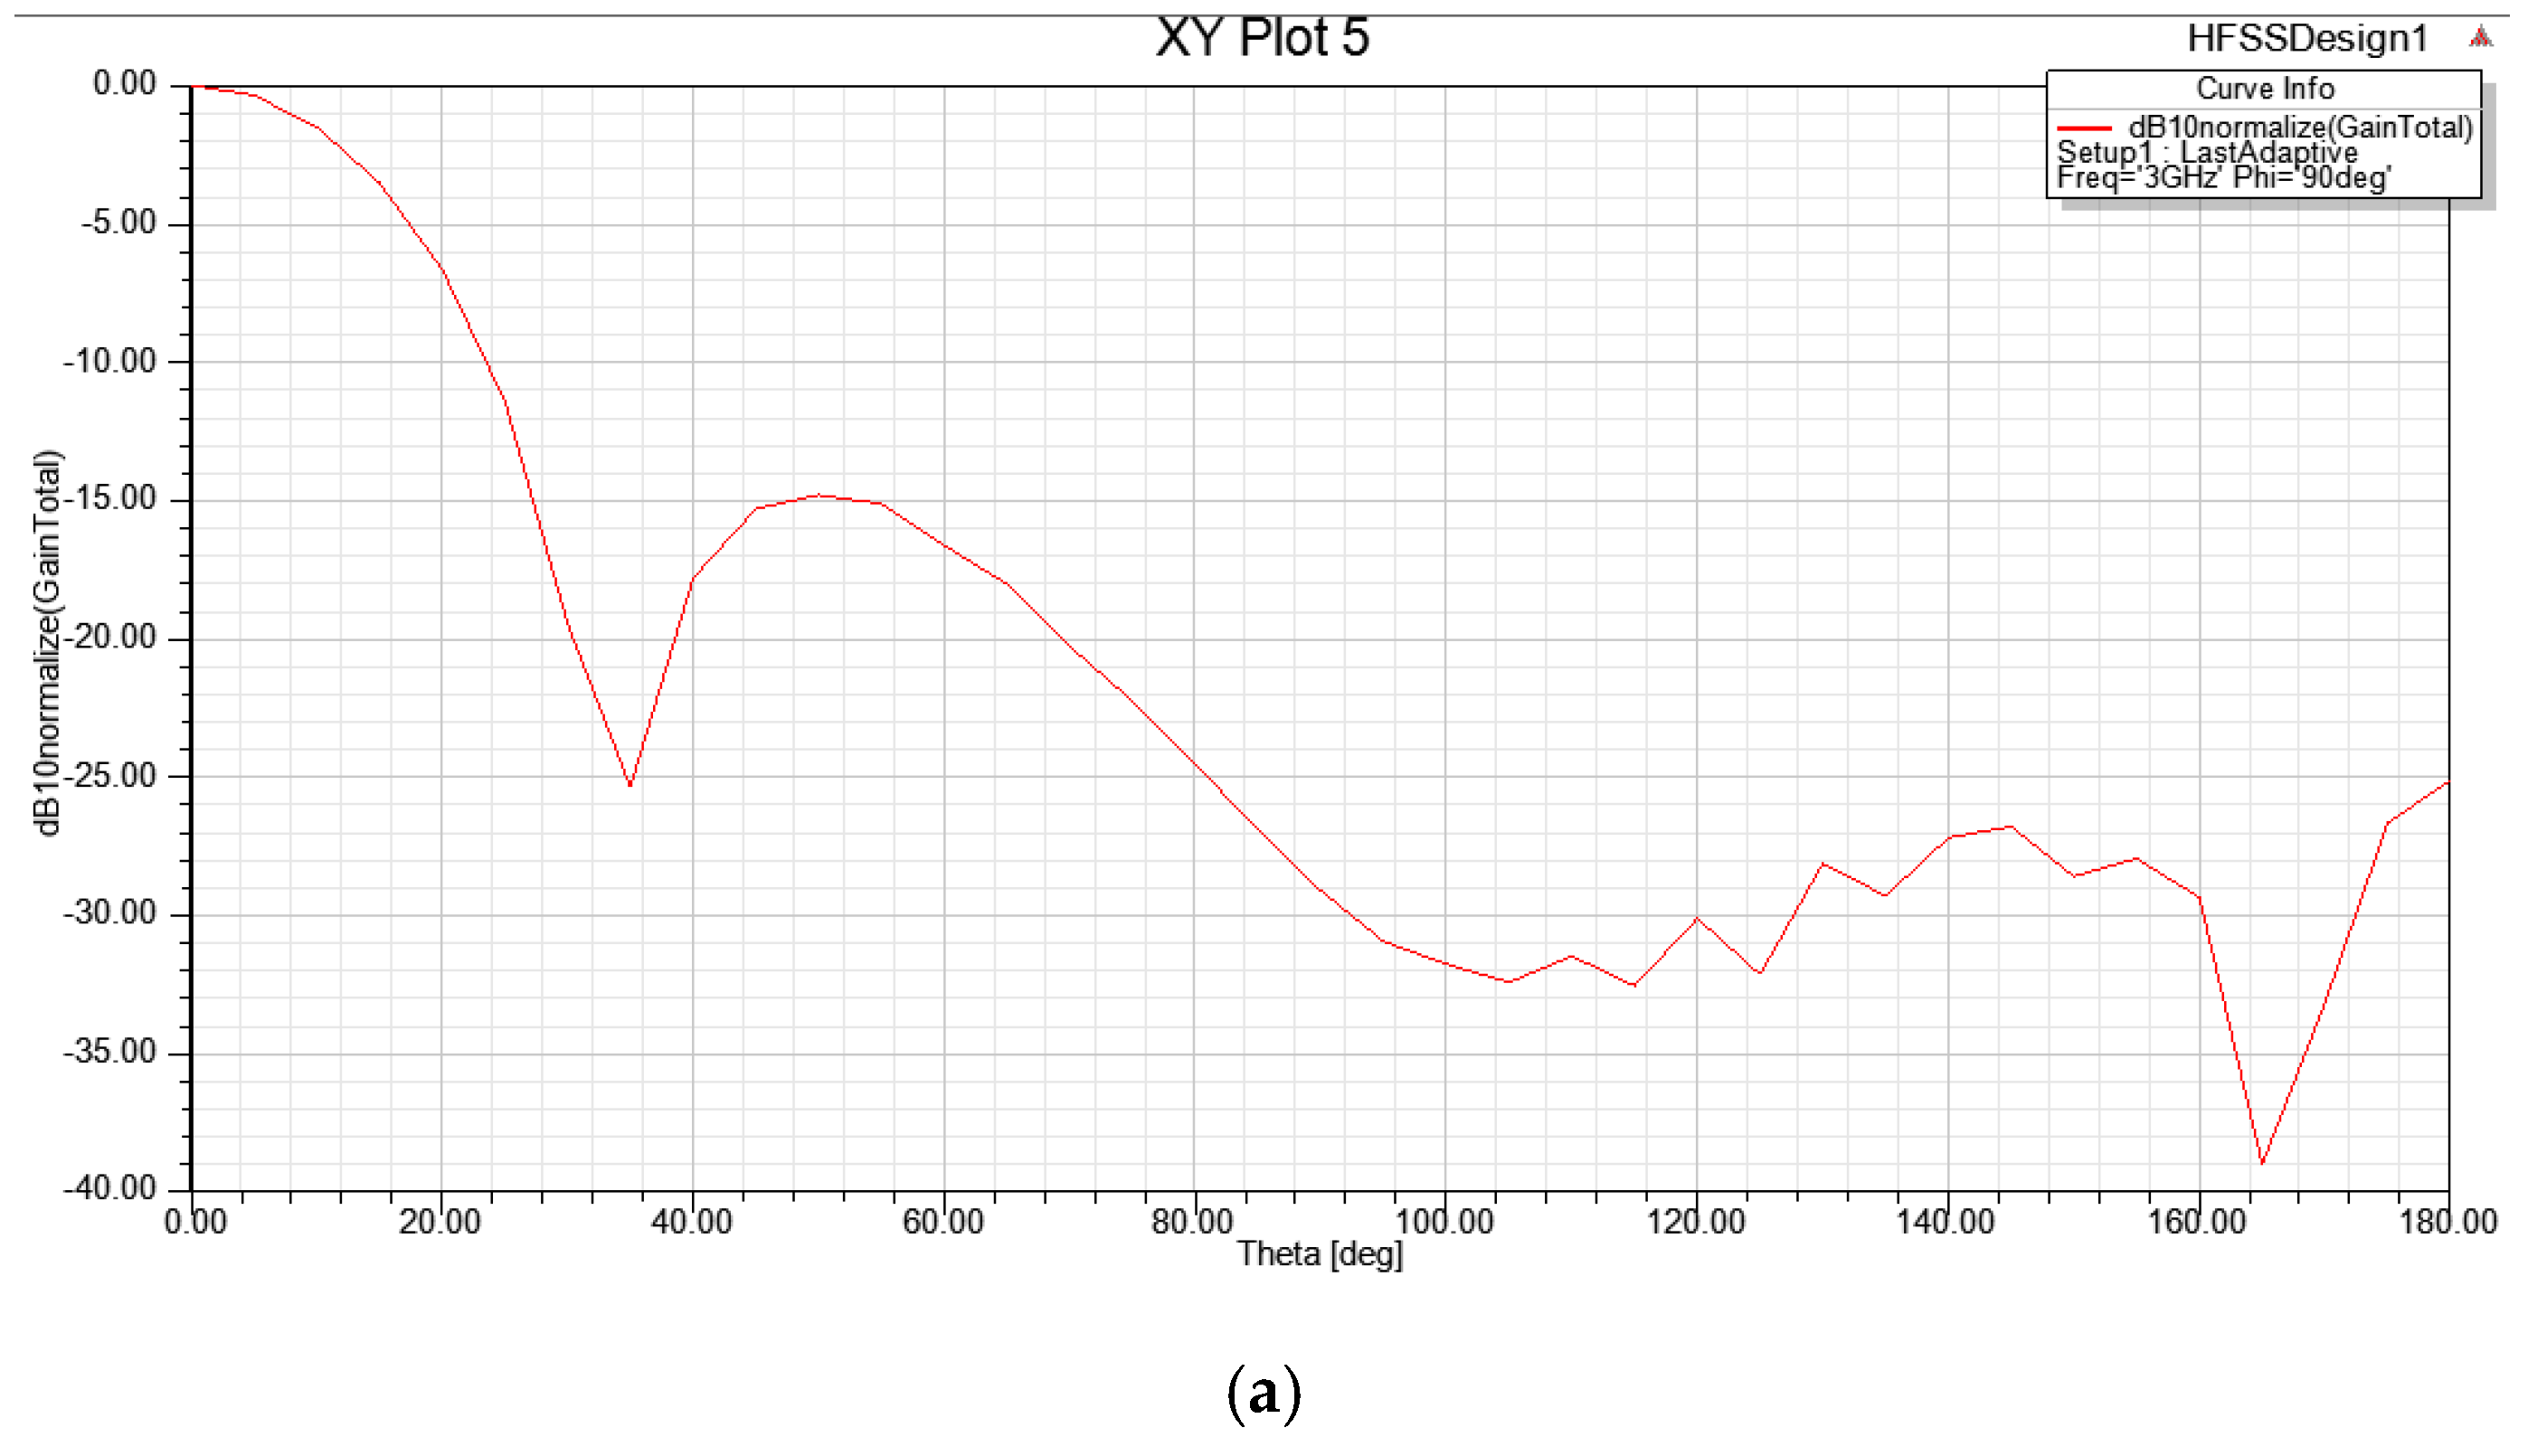
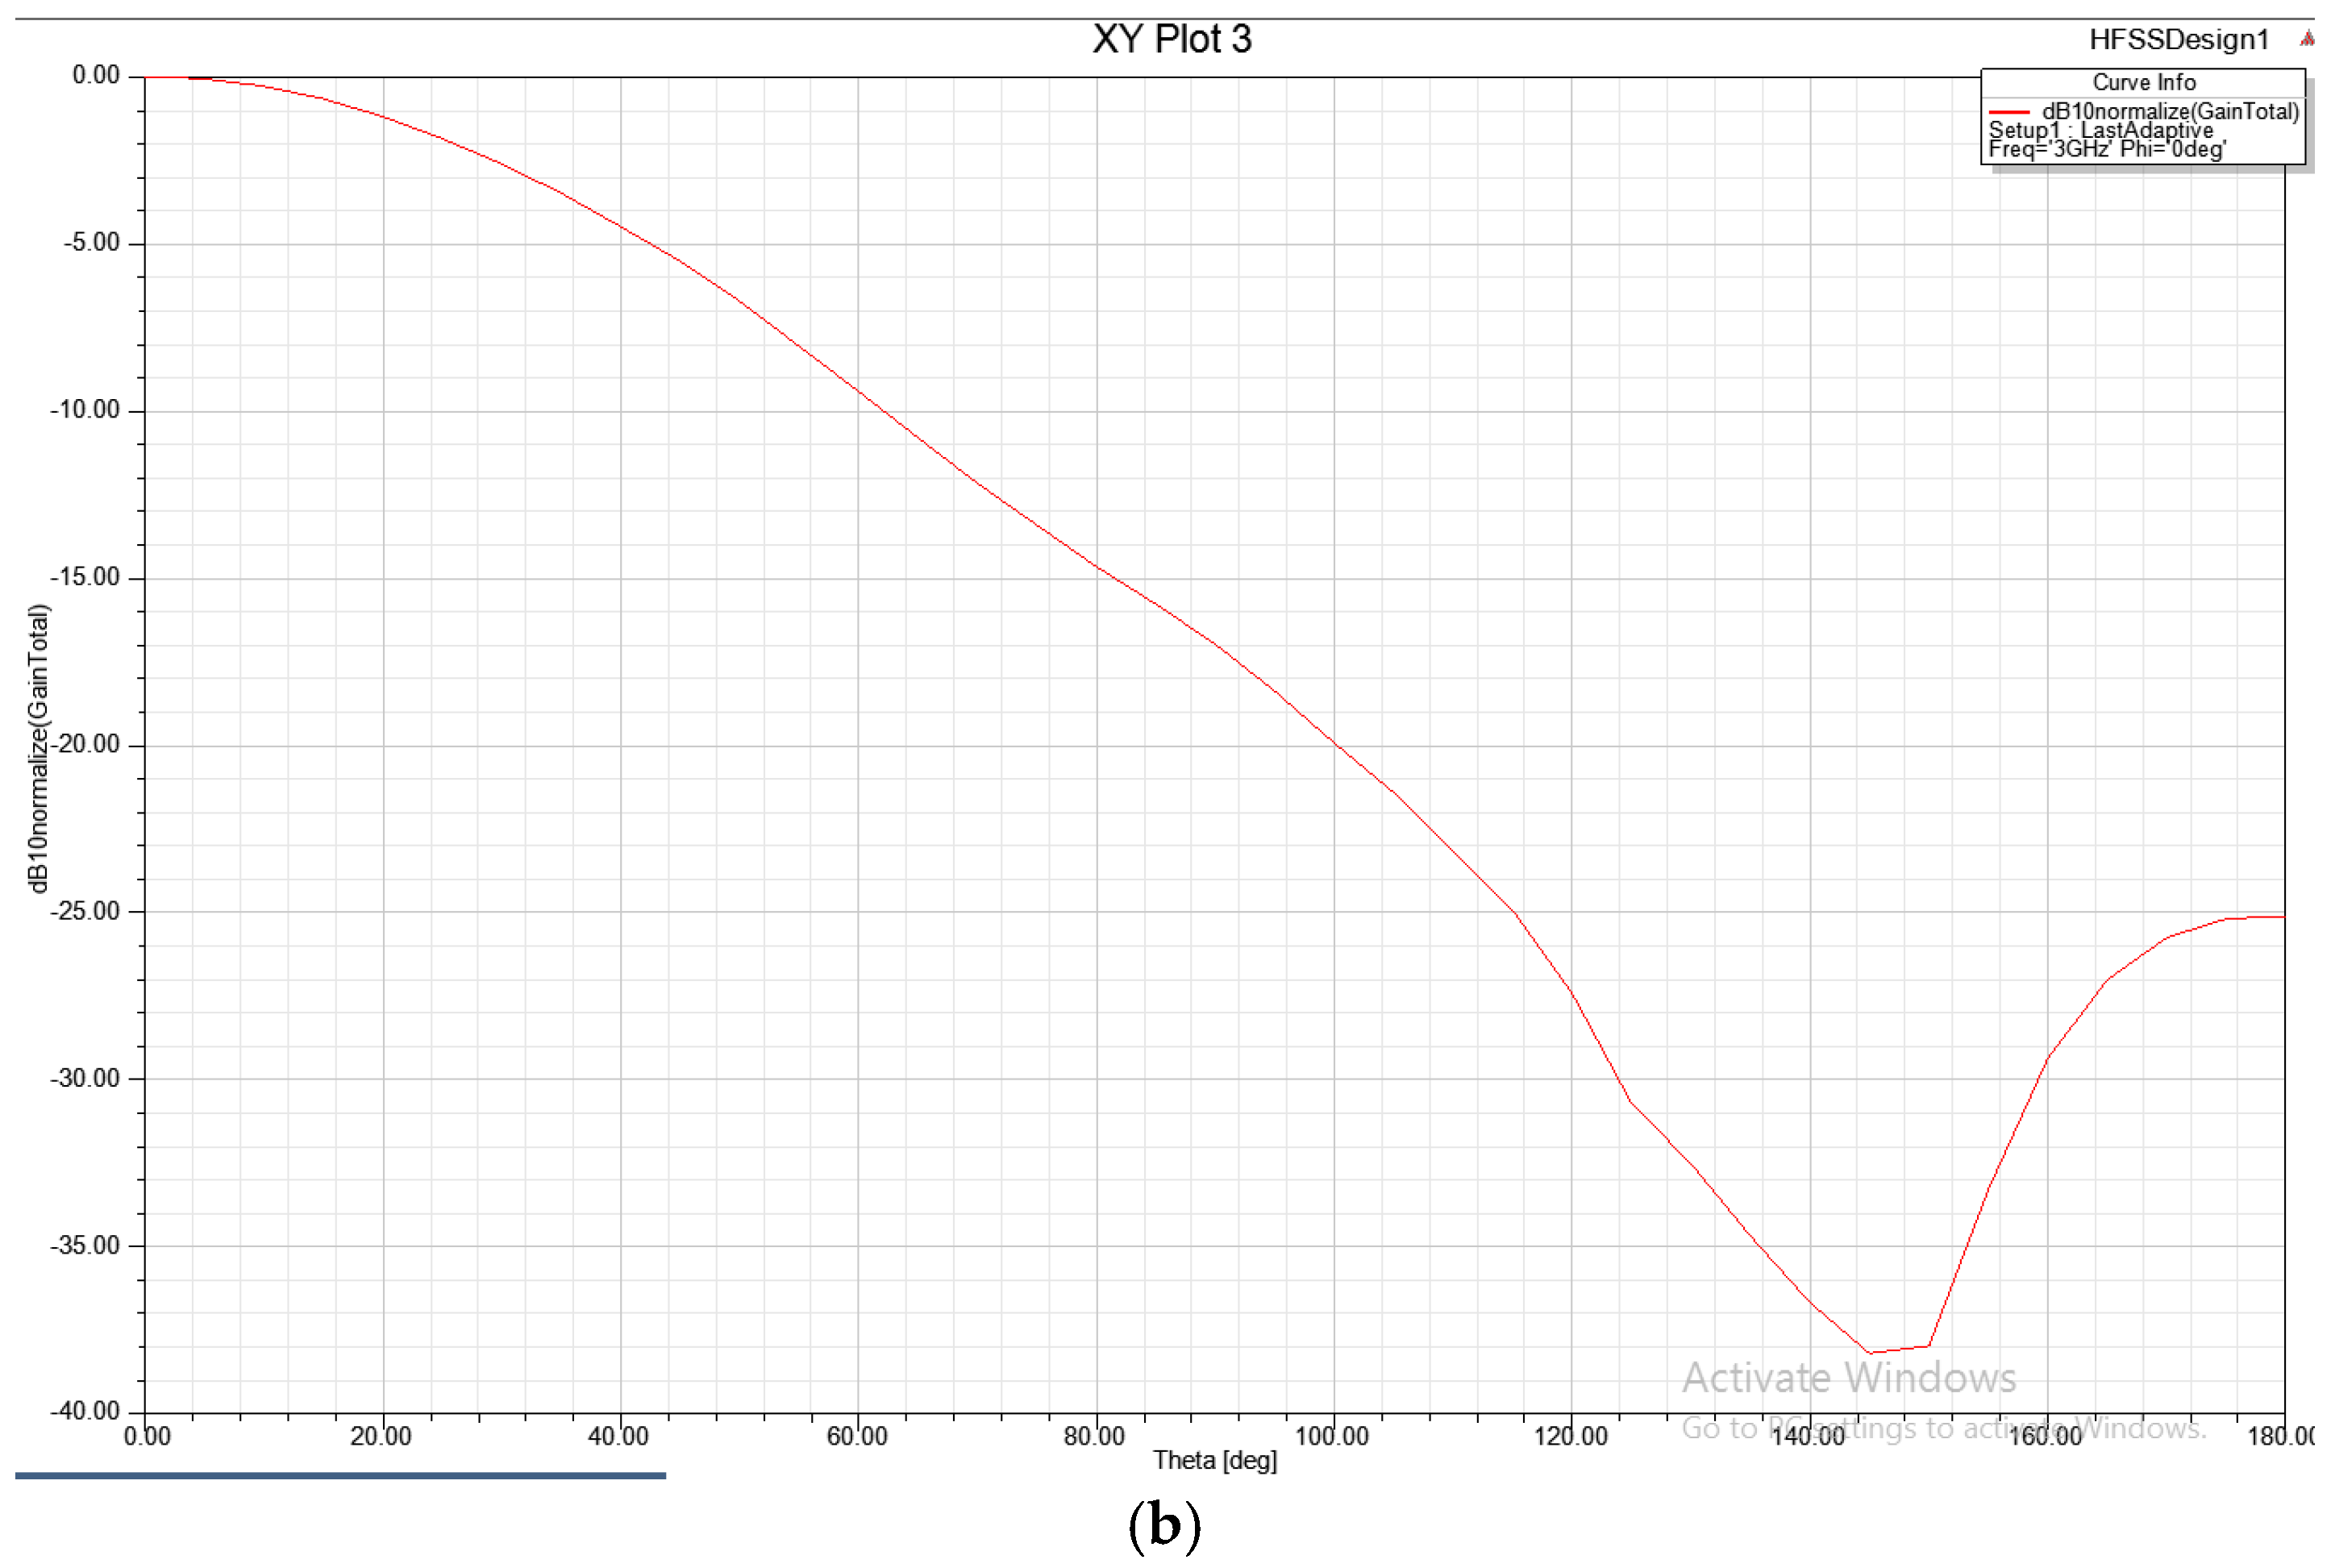
In
Figure 9a,b, the radiation pattern in the E-plane and the radiation pattern in the H-plane, i.e., the total power gain normalized to 0 dB, are presented in Cartesian coordinates as a function of the elevation angle
, with the plane of polarization angle set to
.
In
Figure 10a, the reflector, which has a curvature in the plane of symmetry obtained using Equations (22)–(29), is presented from a lateral view. In
Figure 10b, the reflector, which has a curve in the symmetrical plane obtained using Equations (22)–(29), is presented from a frontal view, showing the plane of symmetry to the boundary of the opening in the horizontal plane. For the numerical computation and graphical modelling of Equations (22)–(29), the program ANCSCCO4 has been developed. PAS in Turbo-Pascal 7.0, which is then transposed into Mathcad 2000 and Matlab.
4. Distribution of the Electromagnetic Field When the Double-Curved Reflector Is Used
Due to computational complexity, a closed form for the electromagnetic field cannot be determined in the general case. We consider a simplified approach [
7,
9,
15,
25,
26], in which we have long-range illumination on the curve in the plane of symmetry of the characteristic. The electromagnetic field is determined using the Kottler formula [
8,
16]
where
—is the distance from the origin to the point at which we evaluate the electromagnetic field (P);
—is the unit vector of FP (from
Figure 11)
—the angle between FP and FM (from
Figure 11)
—wavelength
—wave number
—the total electric field at point M
—the total magnetic field at point M
The index
N shows that the vector product
is projected on the normal line of the plane that includes the
FP segment and vector
. Only a narrow surface, resting on the central curve in the vertical plane of symmetry is considered, as shown in
Figure 11. This surface can be considered as a cylinder of very small height, whose intersection with the plane (xOy) is the central curve in the vertical plane of symmetry.
Let F be the point at which the phase center of the primary radiation source is located. Then, it coincides with the origin O of the axis system, in which the coordinates of the vertical curve in the plane of symmetry are calculated. To simplify the calculations, the cylinder considered above is positioned perpendicular to the (xOy) plane. The diffraction field in the direction of the FP, which forms an angle with the Ox axis at point P, must be calculated. Since it is considered that P is far away, MP and FP can be considered parallel. Let also and be the normal and the tangent in M to the central curve. We assume that the surface is illuminated by a primary source, placed in F, and the angle between and MF is the angle of incidence and the incident ray FM, resulting in a reflected ray , following a direction generally different from MP.
The primary wave from F is spherical, with power density I, in the FM direction, with an angle with the Fz axis. As the surface is reflective, the electric field is normal, thus () = 0, since, when linear polarization is used, is perpendicular to the (xOy) plane. Thus, the reflection introduces an electric field equal and opposite to the incident one (i.e., 180° phase shift); therefore, the total field in M is zero, and only the second term can be considered from the initial formula.
The second case, which will be studied, is the one in which the electric field of the incoming ray lies in the (xOy) plane and () will be normal to the (xOy) plane (i.e., vertical linear polarization).
Figure 11 shows all the details and notations necessary for diffraction calculation. The following angles are depicted: the angle between the incident radiation direction from point
F to point
M (the current calculation point) and the direction vector, defined between point
F and point
P (with angle
) in the radiation space where the field
is calculated, denoted by α; the angle between the direction vector defined between points
M and
P (parallel to
FP) and the normal to the curve in the symmetry plane at point
M, denoted by
; and the angle
between the radiation direction from point
M with inclination (relative to the x-axis)
and the normal to the curve at point
M. From the figure, the angular relationships between these angles and the normal to the curve in the symmetry plane (from the surface element) can be deduced.
- A.
Electrical field evaluation for horizontal linear polarization
The total electrical field at point
M is zero because, based on the properties of the reflection phenomenon, it introduces an electrical field equal to the amplitude of and out of phase with the incident field. However, the aggregate magnetic field at the same point,
M, is tangent and has twice the value of the tangential component of the magnetic field. Assuming a spherical primary wave, the incident electrical field is given by
But in the incident beam, the magnetic field is proportional to
, so the magnetic field is:
In both formulas, the exponential factor explains the phase delay along the direction of the ray where: ;.
The magnetic field,
that will be considered is
because the tangential component of the incident magnetic field is
. Since
is projected on the tangent
which is perpendicular to the normal
, the modulus of the vector product is:
Because the integral (30) is determined in a very narrow area, it may be regarded as a contour integral.
Using (36) in (35), after algebraic manipulations, we obtain
- B.
Electrical field evaluation for vertical linear polarization
The incoming magnetic field is now considered to be perpendicular to the (
xOy) plane, dictated solely by its tangential component. We therefore obtain
or knowing that
and replacing the result is:
Depending on the chosen application, the directivity characteristics can be shaped as follows:
- –
by changing the reflection angle from the base of the reflector, , which affects the dead cone angle and the lobes formed around it, as well as the power distribution in the directivity characteristic.
- –
by changing the reflection angle from the upper edge of the reflector, , which affects the change in the angle of maximum radiation direction, the dead cone angle (the area between the radiation direction with angle and the antenna’s rotation axis), as well as the lobes formed around it, as well as the power distribution in the directivity characteristic, in the angular sector forming the first half of the elevation directivity characteristic from the maximum radiation direction towards the dead cone. Modifying the angle makes the difference between an elevation directivity characteristic for low heights and an elevation directivity characteristic for medium and high heights.
- –
by changing the angles and , that must be performed in correlation with the modification of angles and so that there are no reflections at the edges of the reflector and the reflected power is not significantly reduced due to the large angle between the incident wave and the reflected wave. Modifying angles and involves recalculating the primary radiation source (horn antenna).
- –
it is necessary to mention that, by changing the angles si we obtain, for each value of the angle another curve in the symmetry plane, leading to a different reflective surface, with the same elevation characteristic but different opening angles in elevation, without significant change of the azimuthal parameters.
Using the method presented above, developed in the numerical calculation and graphical modelling program DIAGCCOS.PAS in Turbo-Pascal 7.0, we performed the simulation of the normalized electric field distribution at the maximum value (where: is given by (39), Emax is the maximum value of and the vectors and the angles in accordance with (21–29) are calculated numerically by ANCSCCO4.PAS. The DIAGCCOS.PAS program is created for a double curved reflector (graphite material), with a sector horn type primary radiation source with characteristic , to obtain the characteristic , for a wavelength of 10.6 cm and vertical polarization.
Figure 12,
Figure 13,
Figure 14,
Figure 15 and
Figure 16 present the simulation results using the DIAGCCOS.PAS program to highlight the effect of modifying the angle
on the shape of the elevation directivity characteristic. In the first stage, the angle
is fixed at the maximum value of 70°. For a comprehensive analysis, both CAD representations in rectangular and polar coordinates were utilized.
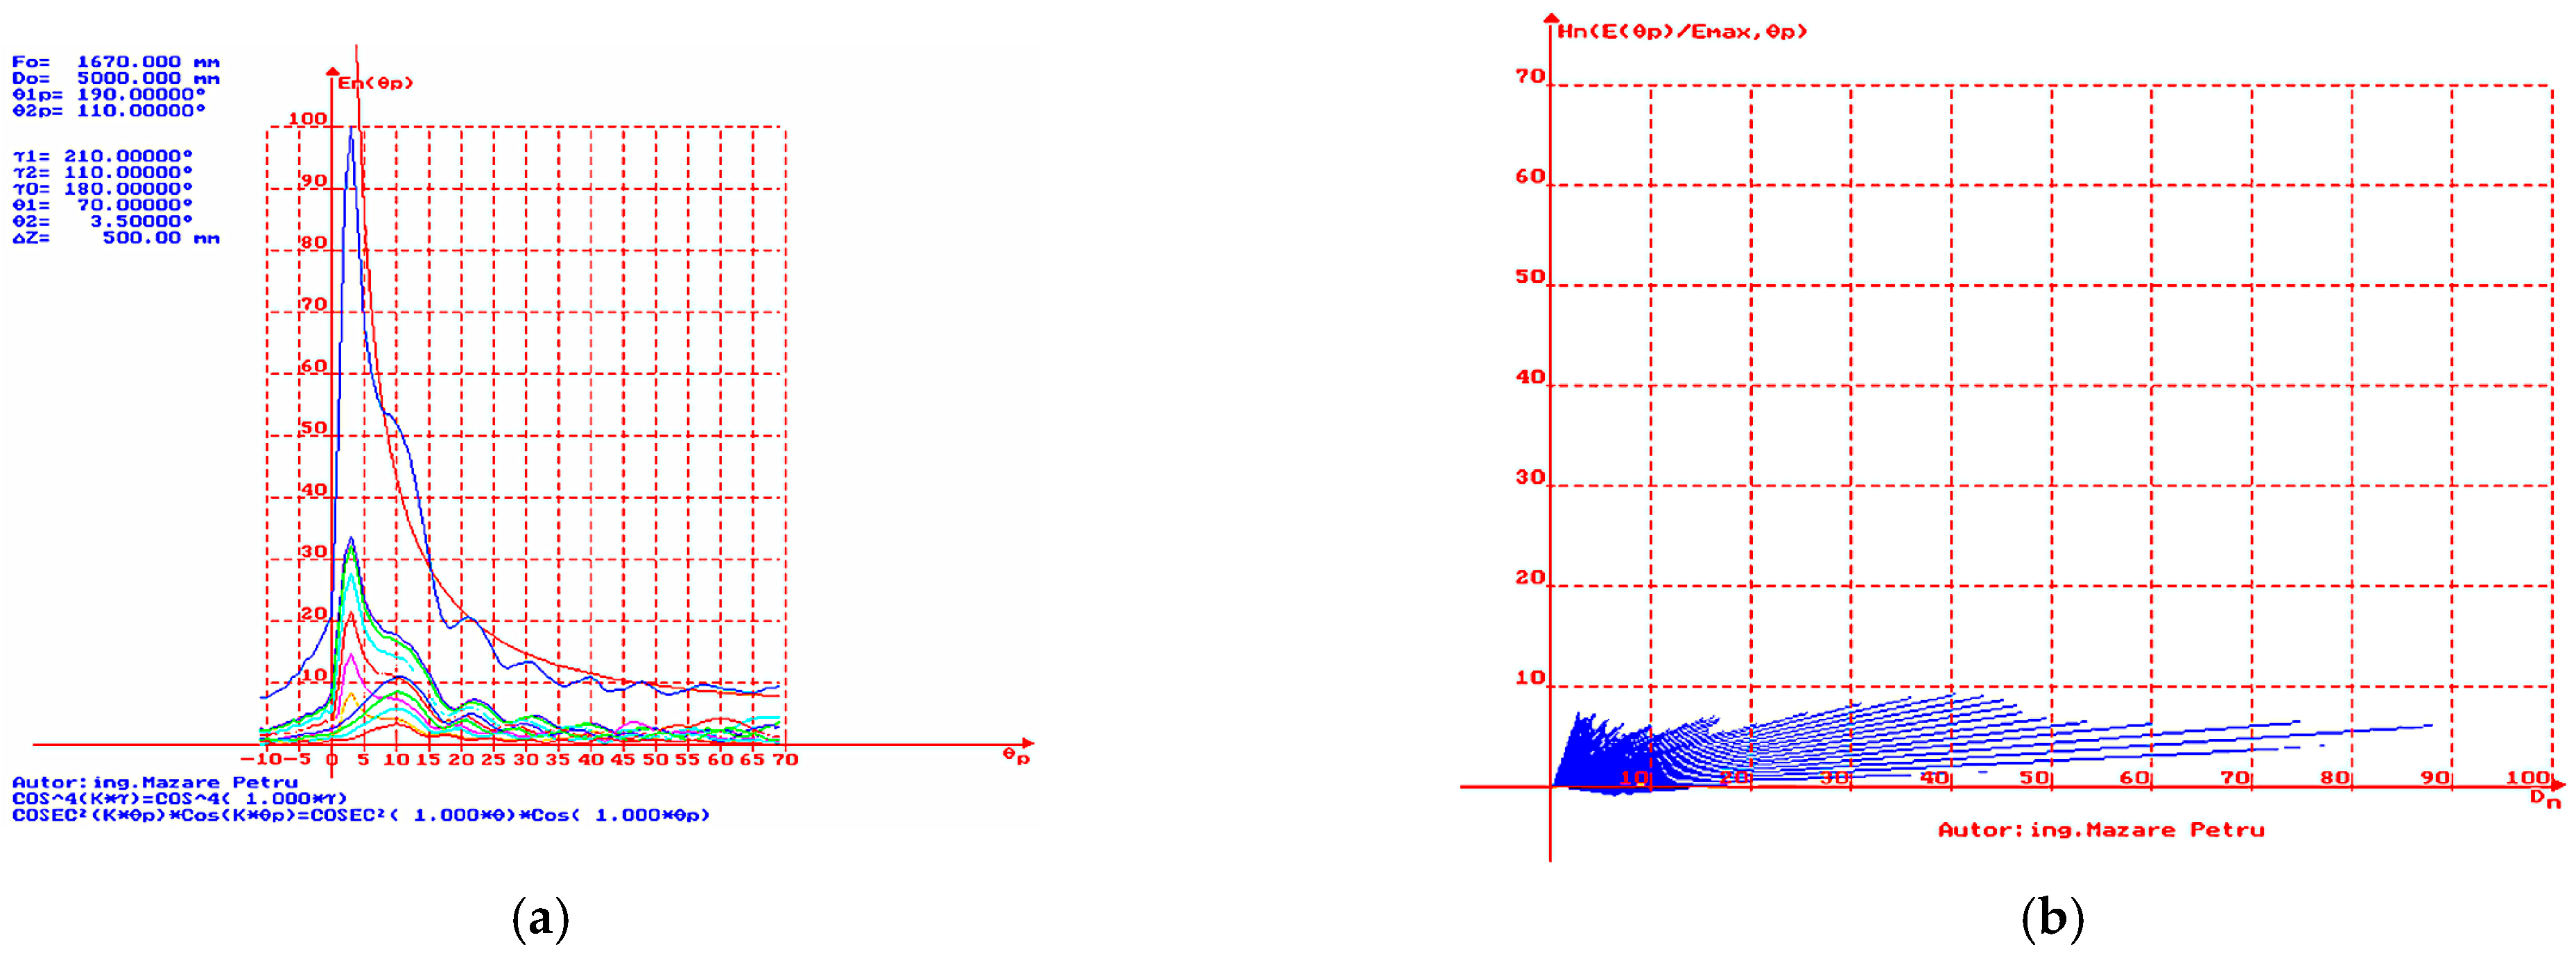
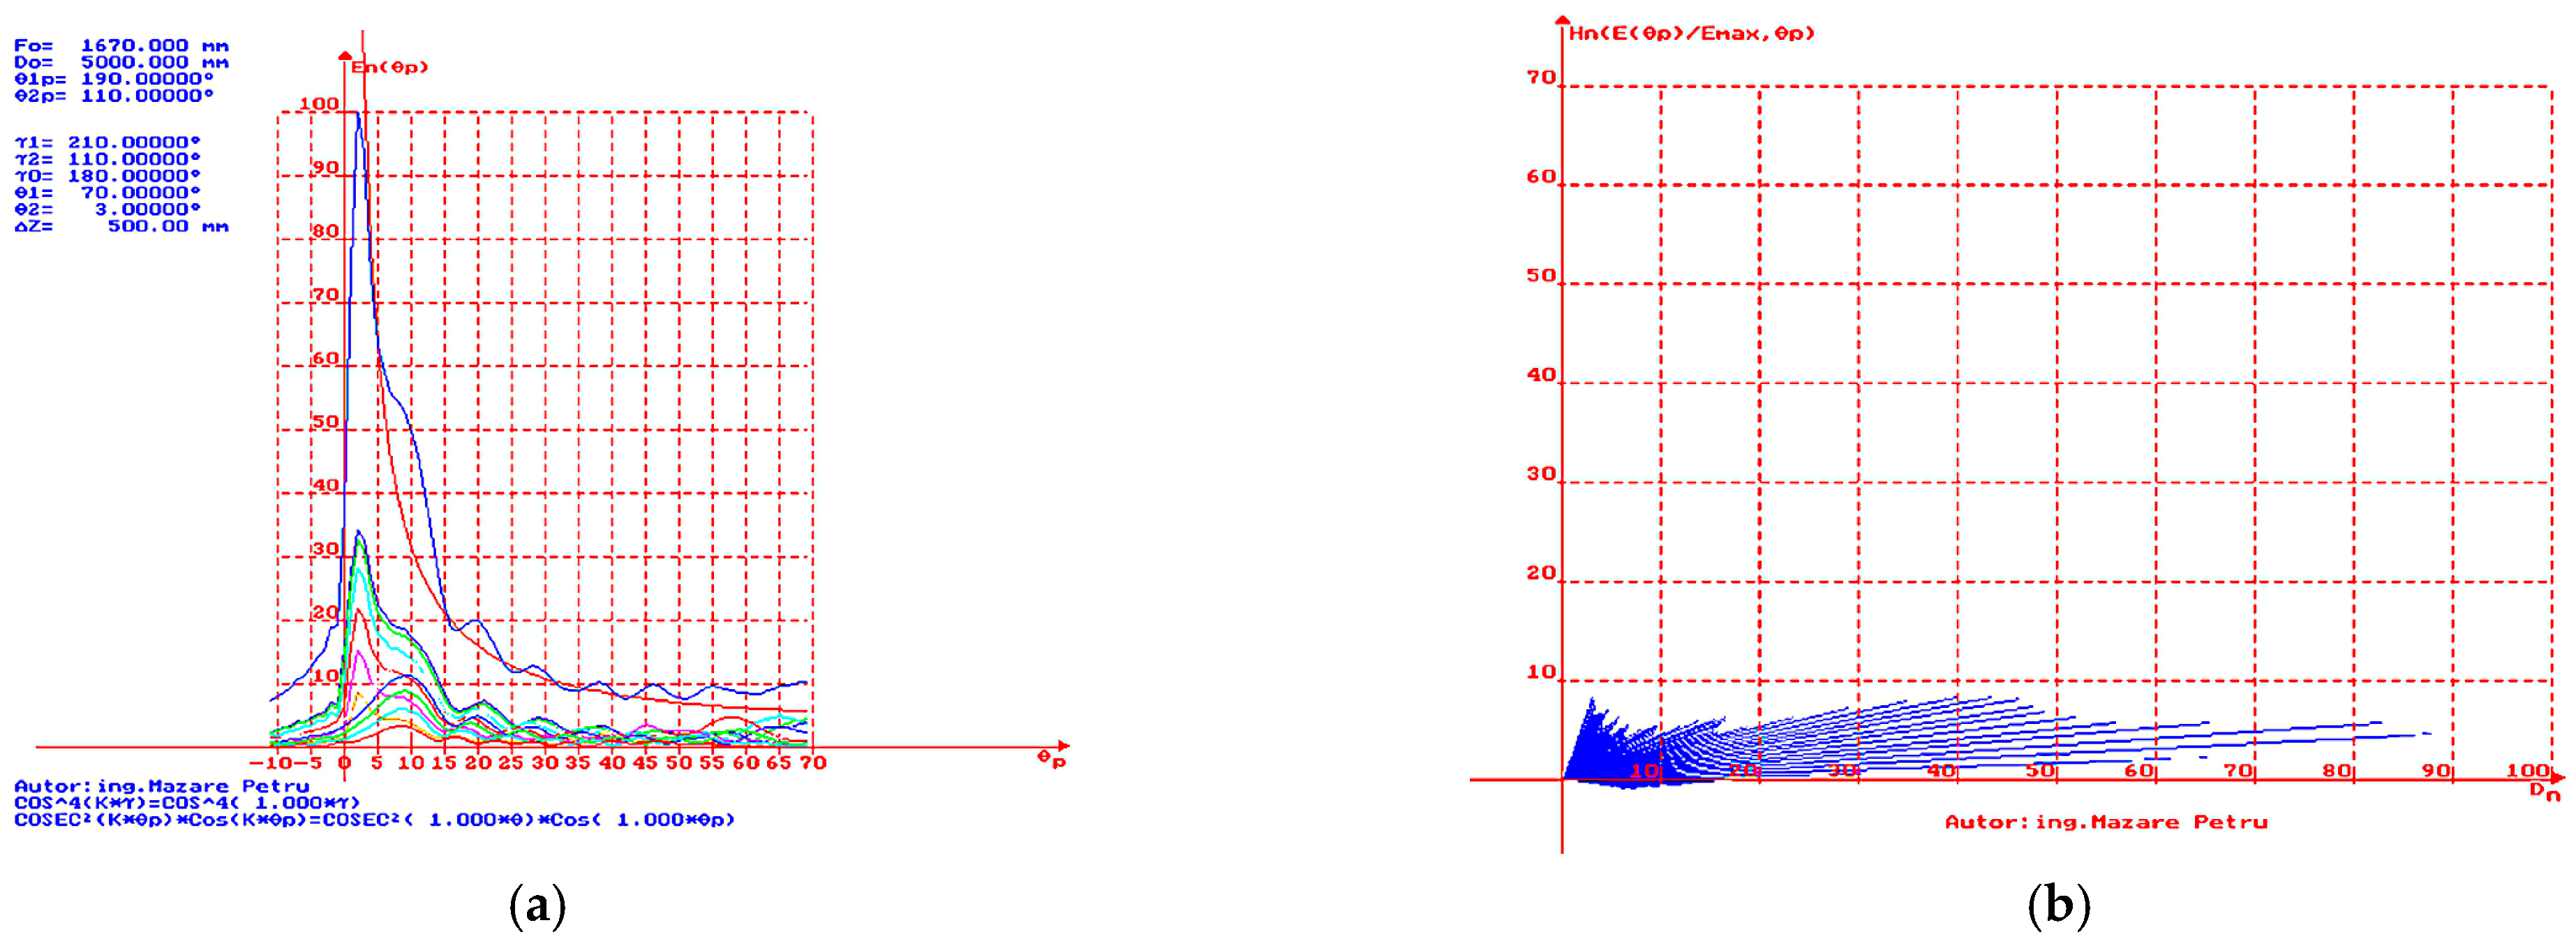
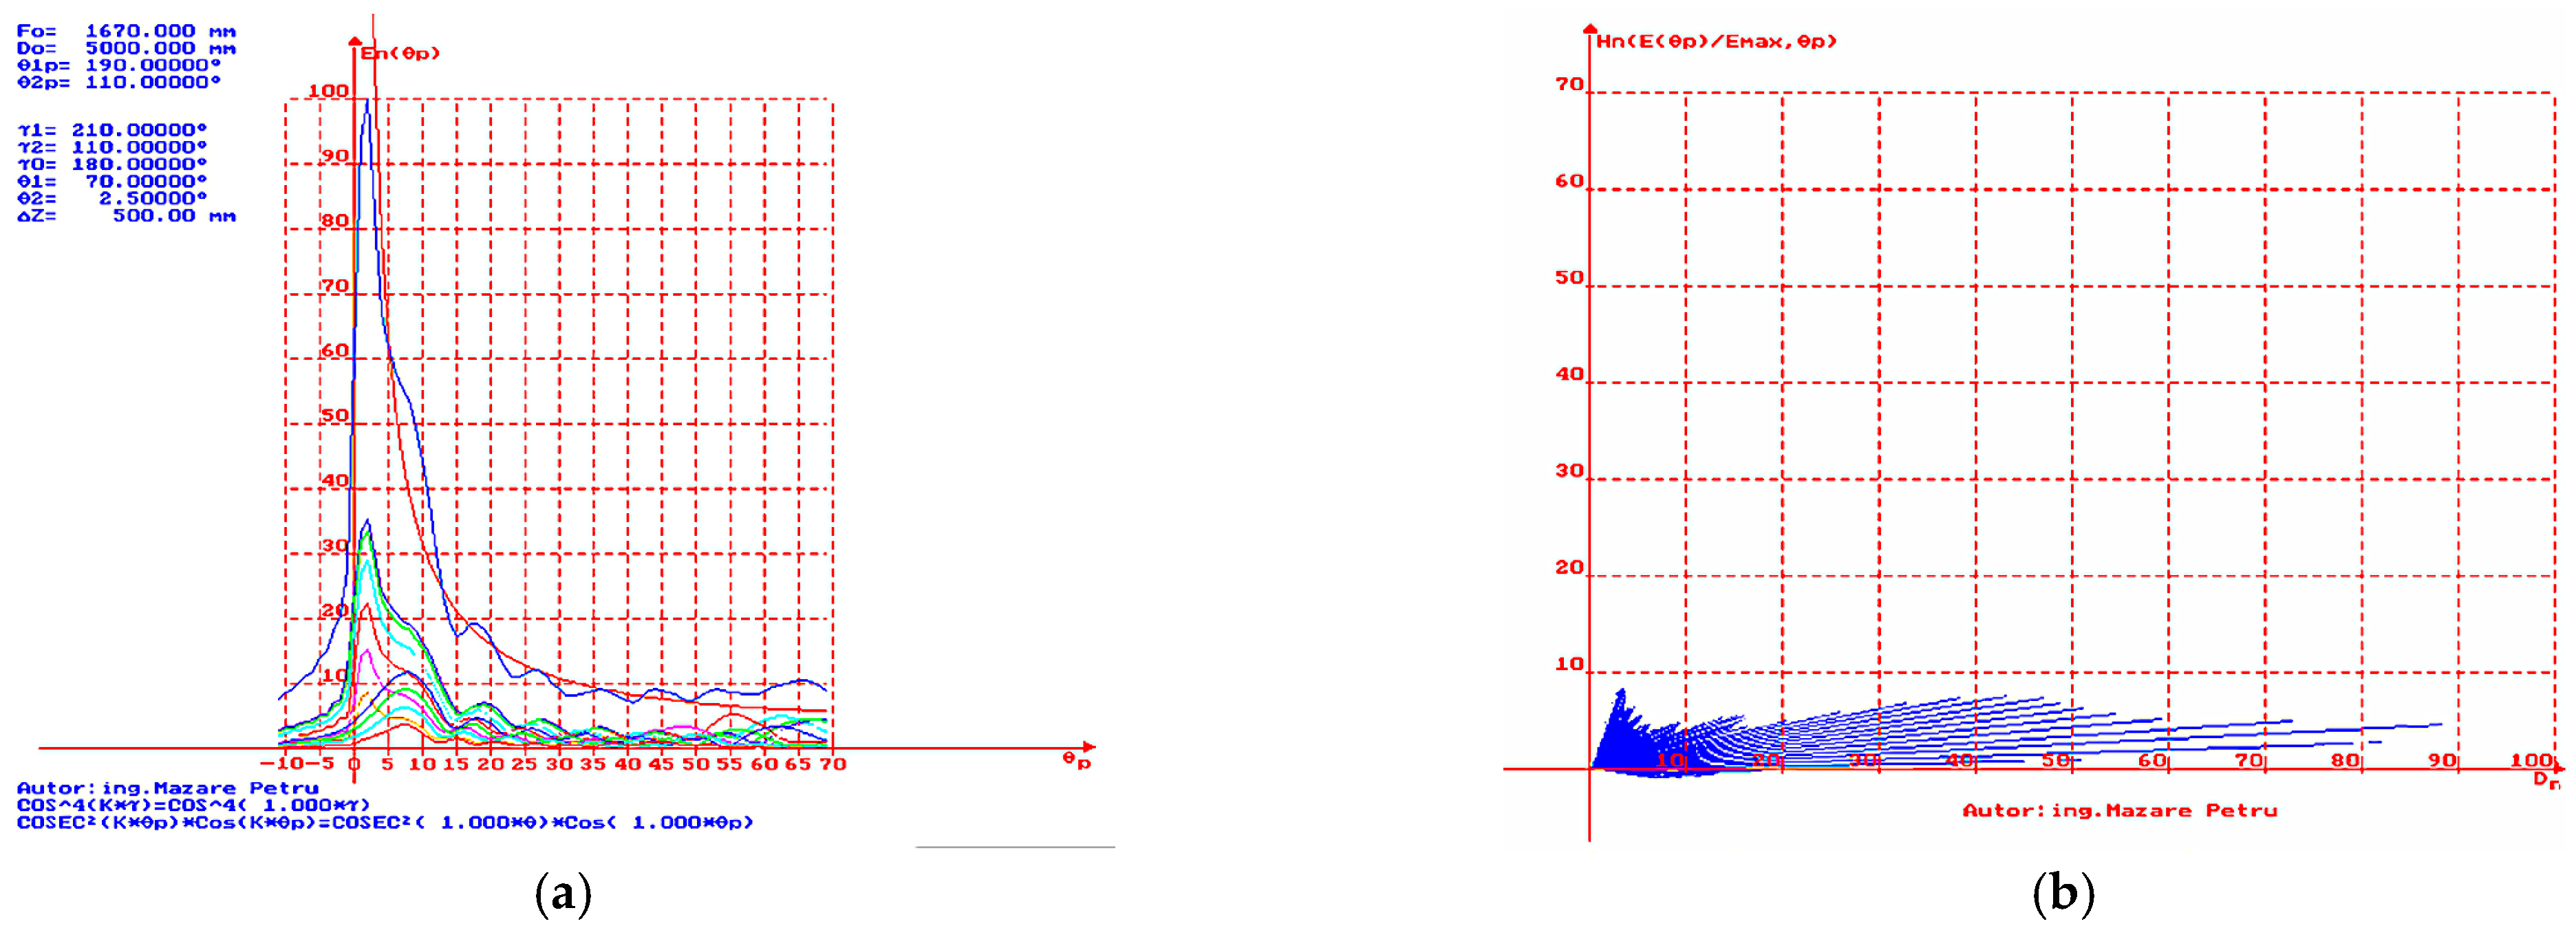
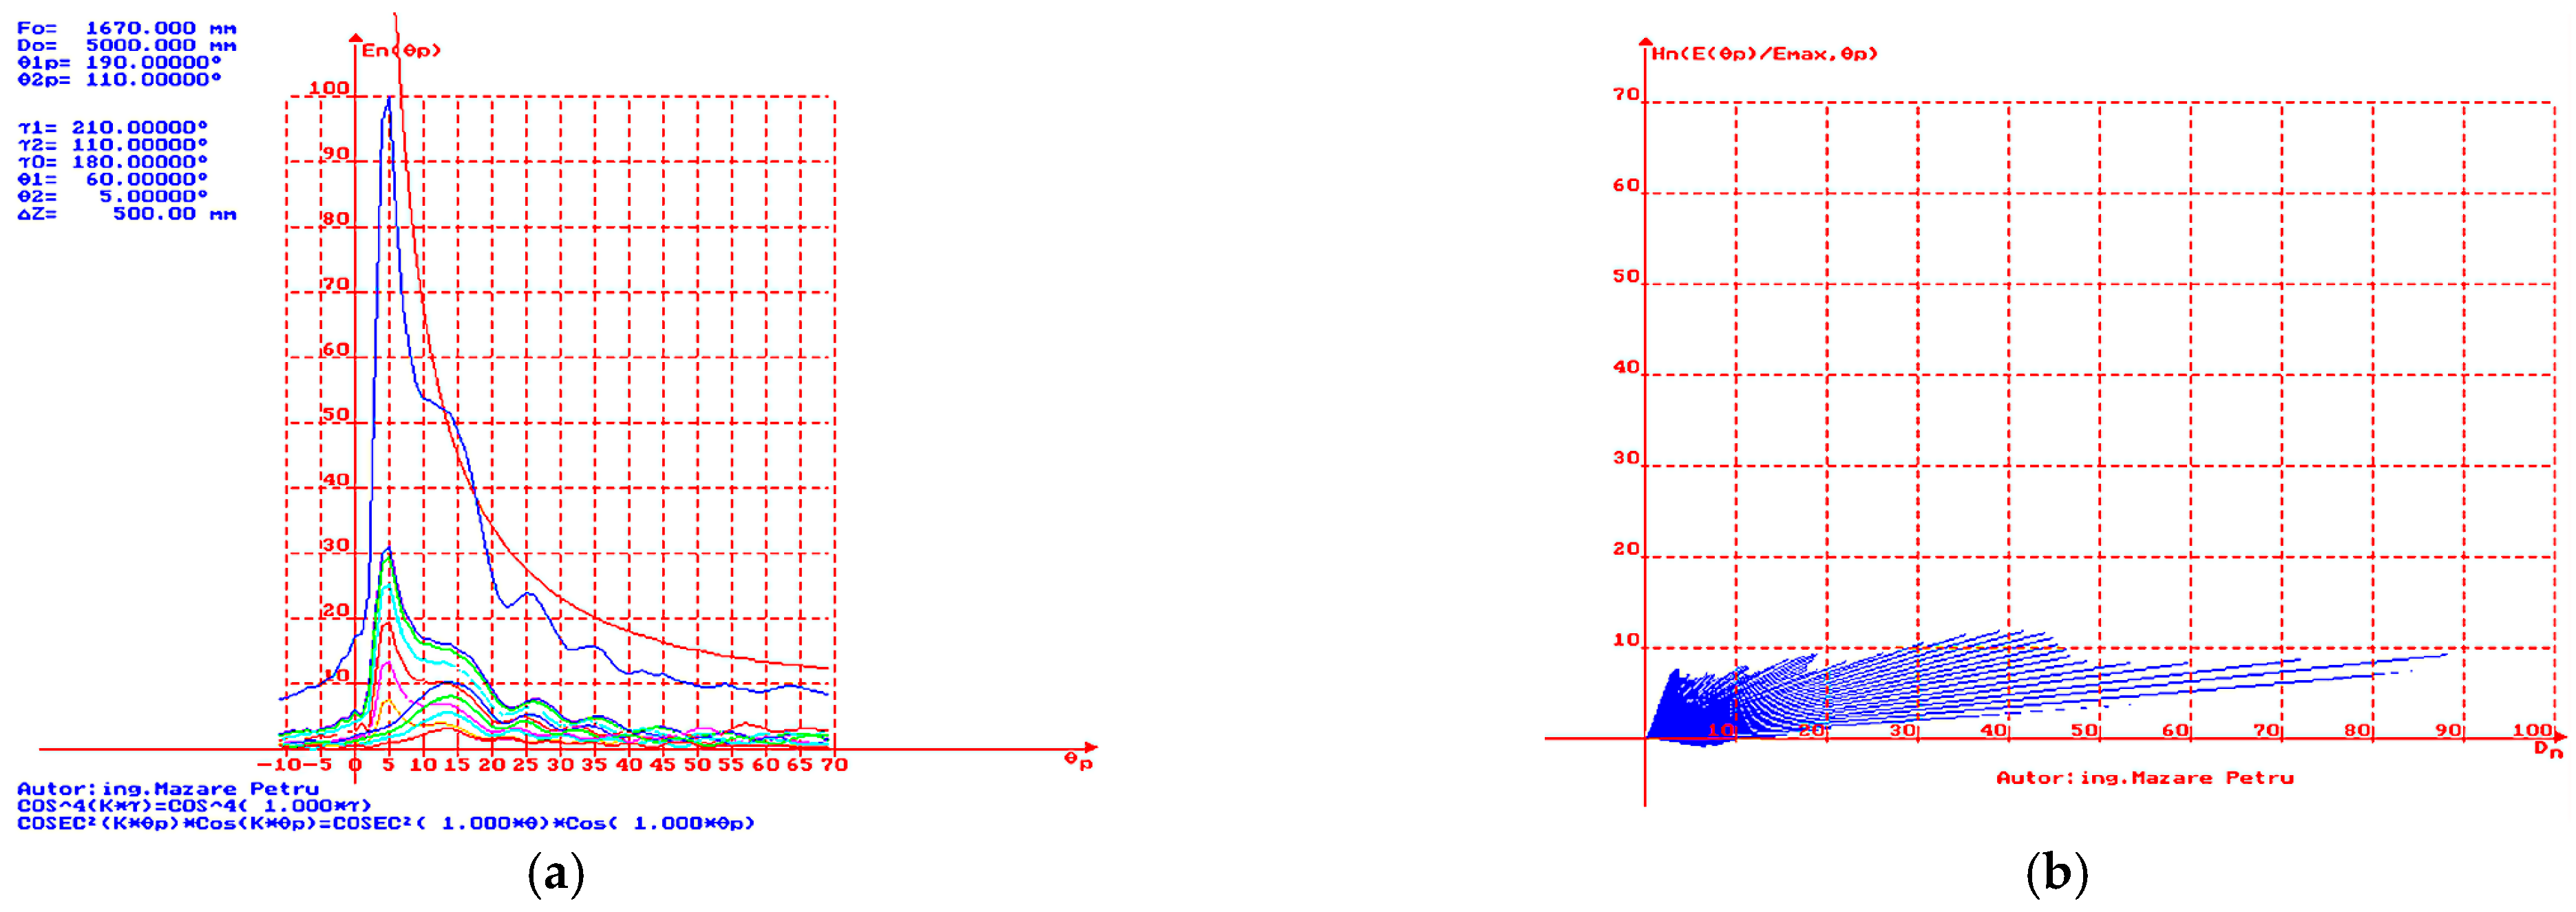
In rectangular coordinates, the variation of the resultant electric field for each angle of the measurement direction (in degree) is represented, normalized to its maximum value in percents, where is given by (39) and the values for and are determined using the program ANCSCCO4.PAS. In this representation, the blue curve depicts the variation of the resultant electric field normalized to the maximum value, and the red curve represents the ideal curve, and the smaller-scale curves at the bottom, each with different colors, represent the synthetic contribution to the resultant field for each section in the vertical plane with step Δz in the horizontal plane, thus providing information on the possibility of modification for the surfaces that could be eliminated for reflector surface optimization.
In
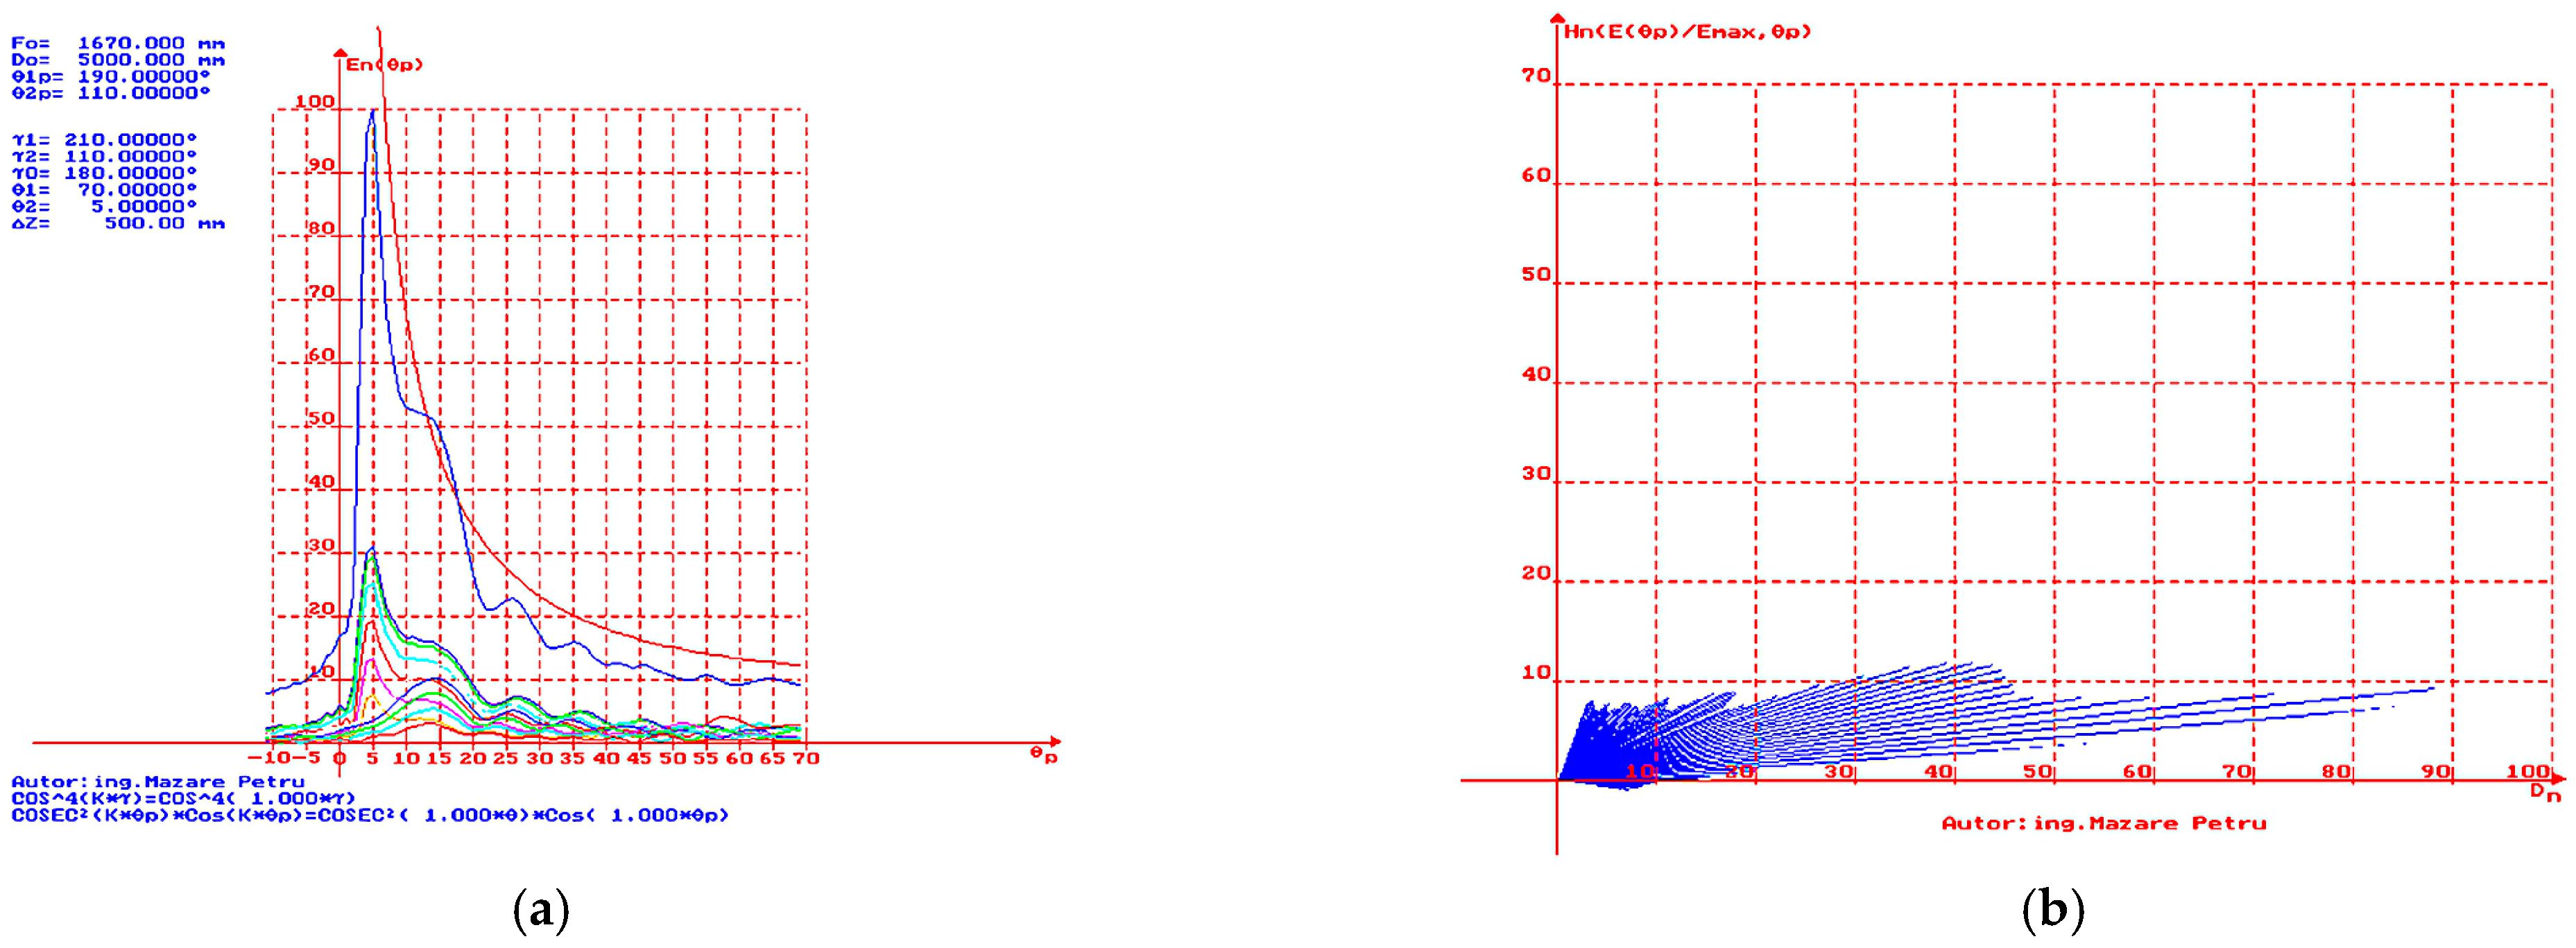
Figure 12a, the simulation result is presented for the case where
= 70° and
= 5°. A constant but small deviation from the ideal
curve (represented in red) is observed. It closely approximates the ideal curve with a phase shift of 2°. This represents a suitable directivity characteristic for radars that detect and track targets with high-altitude flight ceilings. In
Figure 12b, the simulation result is presented when
= 70° and
= 5°, with representation in polar coordinates to obtain a dependence of height
vs. distance
. It is easy to observe the reduced level of the lobe near the limit value of the angle
(dead cone).
In polar coordinates, the representation of vectors (in percents) as a function of has been made. By projecting onto the horizontal axis, the normalized distance (Dn) in percent is obtained, while on the vertical axis, the normalized height (Hn) in percent is obtained, both at the same scale (in the presented cases, the scale is unit). The result is a simulation of the electric field distribution in terms of distance and height (without considering the curvature of the Earth). The resultant vectors (in percents) for each direction are depicted in blue, while the white line represents the approximation of the directivity characteristic contour.
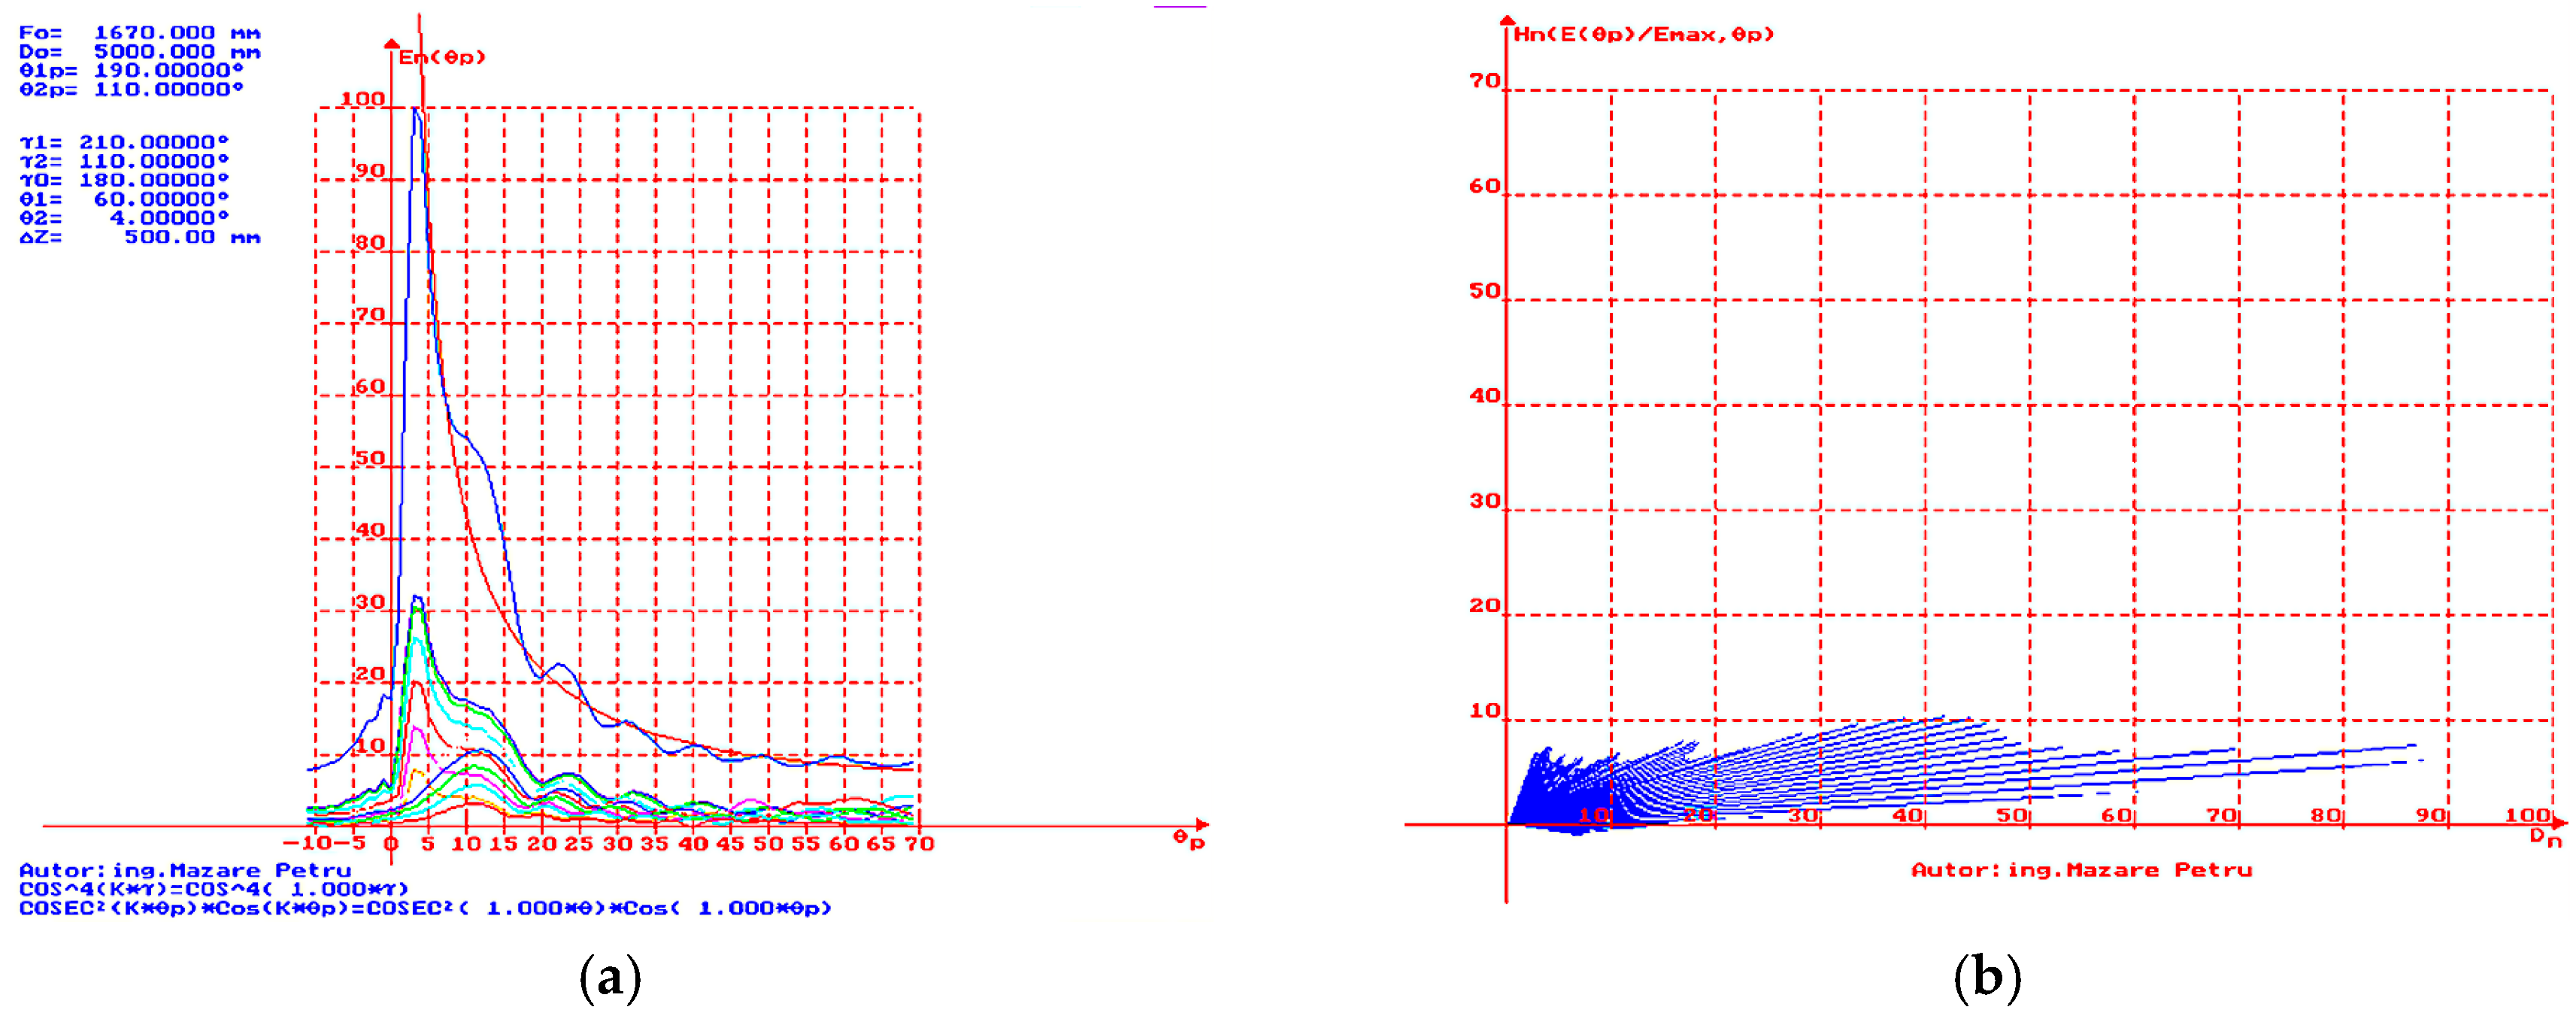
In the second stage of the analysis, using the DIAGCCOS.PAS program, the angle
is modified to the value of 60° to highlight the effect on the elevation directivity characteristic in correlation with the same values of the angle
from the first stage. The simulation results of the second stage are presented in
Figure 13,
Figure 14,
Figure 15,
Figure 16,
Figure 17,
Figure 18,
Figure 19,
Figure 20 and
Figure 21.
In
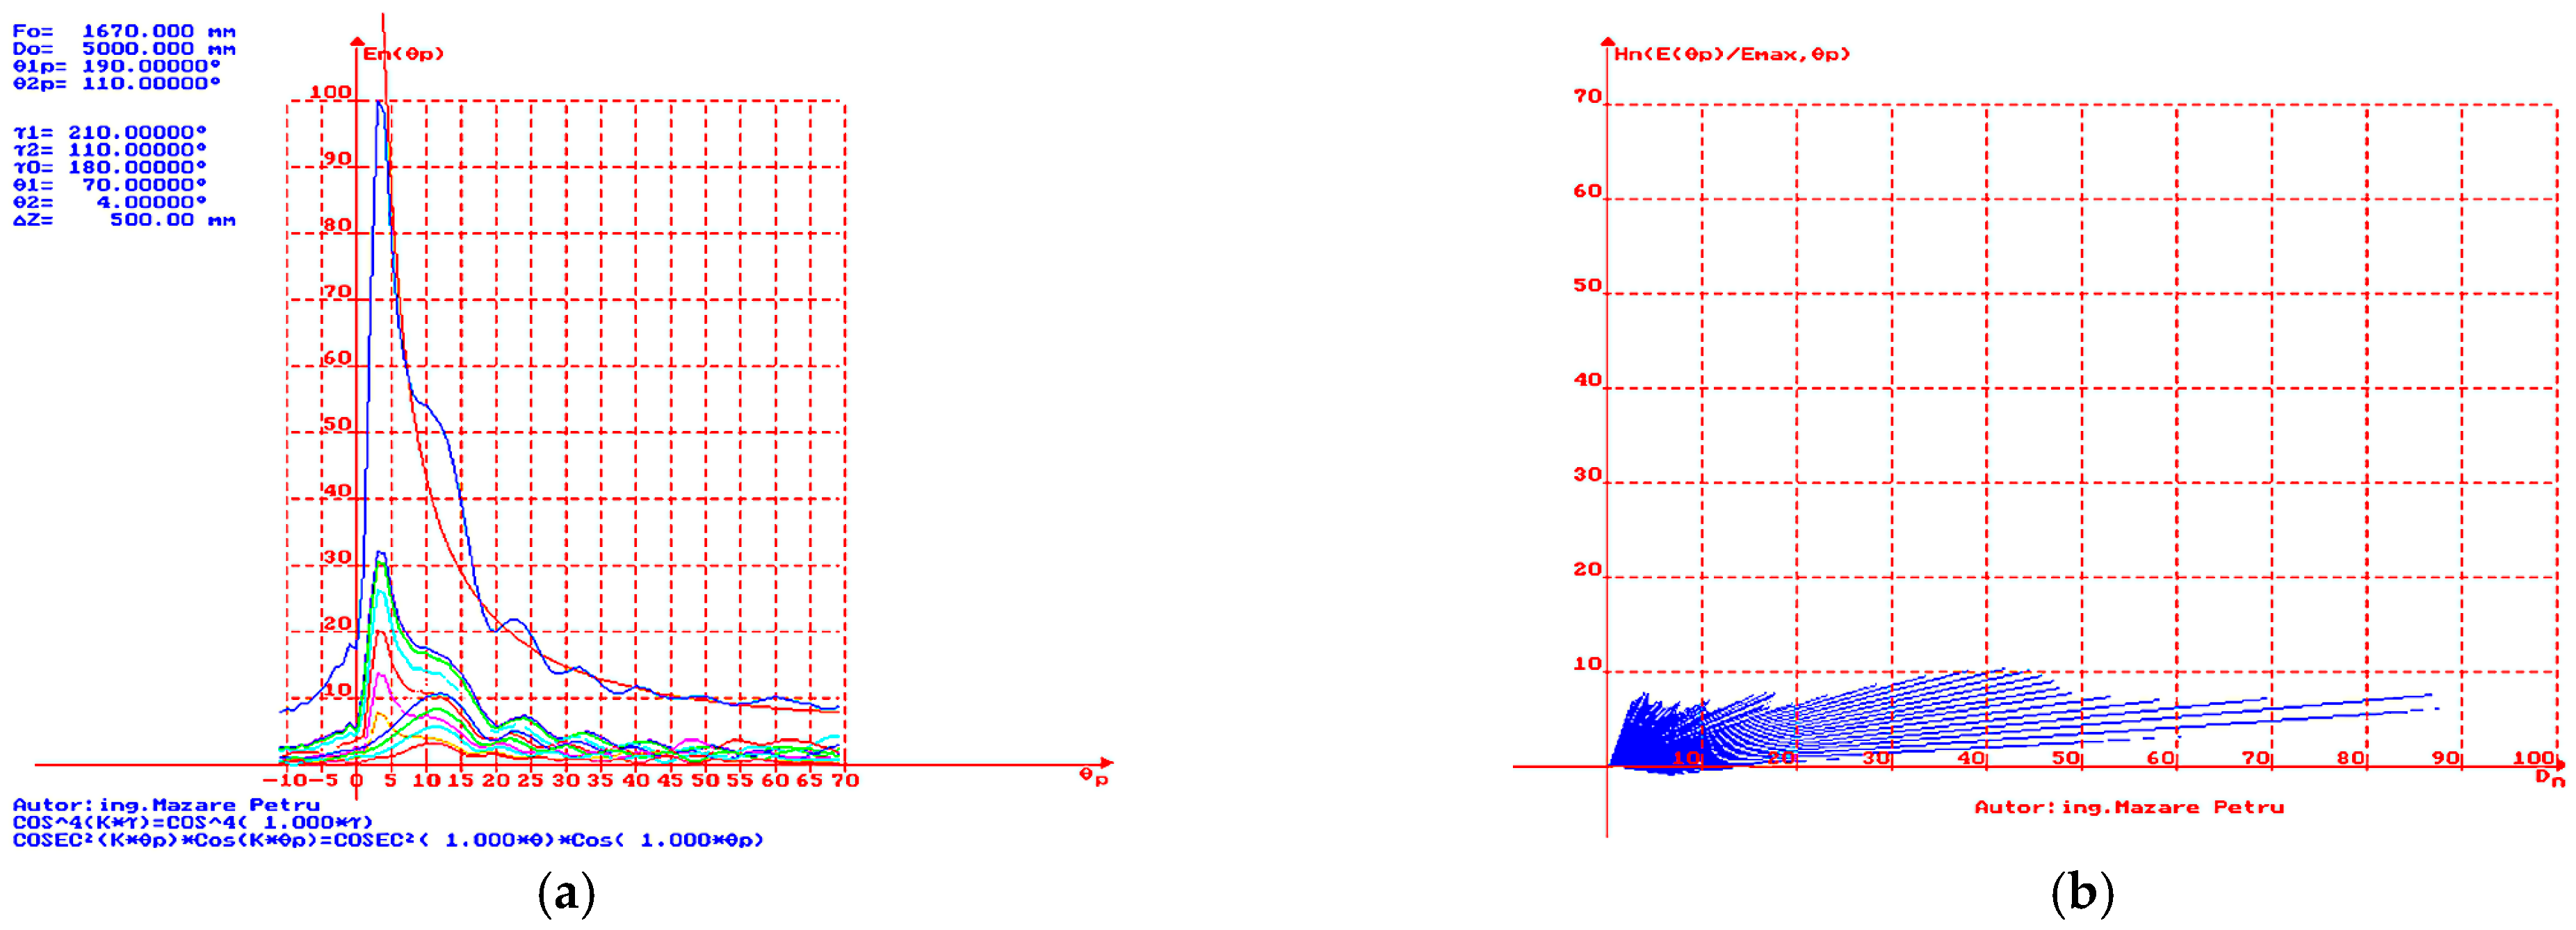
Figure 13a, the simulation result is presented when
= 70° and
= 4°. A good approximation to the ideal
curve (represented in red) is observed for angles
between 4° and 7.5°, as well as for large
. A reduction in the angle of maximum radiation direction is observed. This represents a suitable directivity characteristic for radars that detect and track targets with medium-altitude flight ceilings. In
Figure 13b, the simulation result is presented for the case where
= 70° and
= 4°, with representation in polar coordinates of the vectors to obtain a dependence of height
vs. distance
. It is easy to observe the reduced level of the lobe near the limit value of the angle
(dead cone).
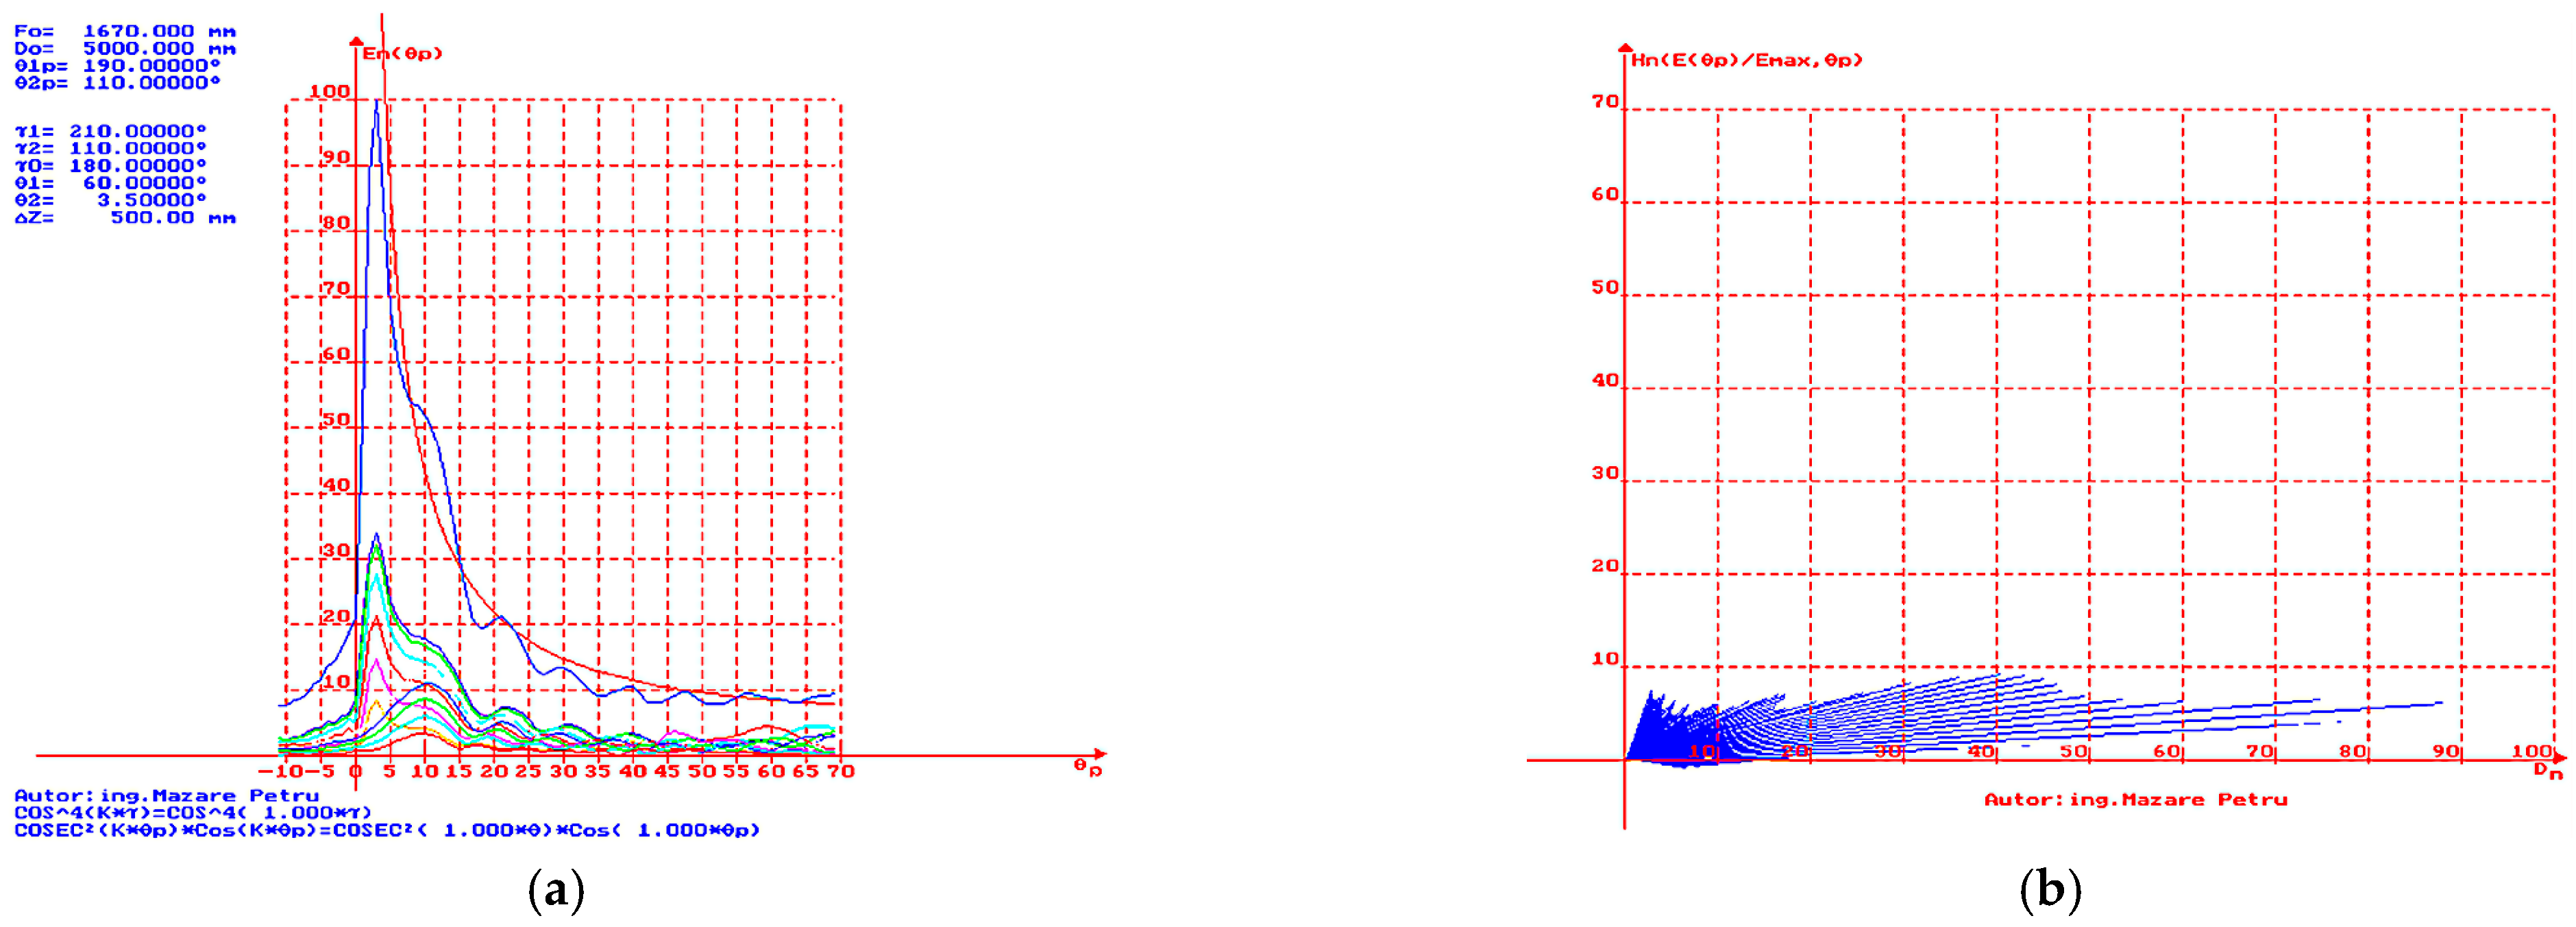
In
Figure 14a, the simulation result is presented when
= 70° and
= 3.5°. A deviation, smaller than that in the case of
= 5°, but constant from the ideal
curve (represented in red) is observed for angles
between 4° and 7.5°, as well as for large
. It closely approximates the ideal curve with a phase shift of 1°. A reduction in the maximum radiation direction angle and a slight narrowing of the characteristic in the vertical plane are observed. This represents a suitable directivity characteristic for radars that detect and track targets with medium- and low-altitude flight ceilings. In
Figure 14b, the simulation result is presented when
= 70° and 3.5°, with representation in polar coordinates of the vectors to obtain a dependence of height (
Hn) vs. distance (Dn). It is easy to observe the reduced level of the lobe near the limit value of the angle
(dead cone).
In
Figure 15a, the simulation result is presented for the case where
= 70° and
= 3°. A good approximation to the ideal
curve (represented in red) is observed for angles
between 4° and 7.5°, as well as for large
(compared to the case of
= 3.5°). A reduction in the angle of maximum radiation direction and a narrowing of the characteristic in the vertical plane are observed. This represents a suitable directivity characteristic for radars that detect and track targets with low-altitude flight ceilings. In
Figure 15b, the simulation result is presented for the case where
= 70° and
= 3°, with representation in polar coordinates of the vectors to obtain a dependence of height (
Hn) vs. distance (
Dn). It is easy to observe a slight increase in the level of the lobes near the limit value of the angle
(dead cone).
In
Figure 16a, the simulation result is presented for the case where
= 70° and
= 2.5°. A good approximation to the ideal
curve (represented in red) is observed for angles
between 4° and 7.5°, as well as for large
(compared to the case of
= 3°). A reduction in the angle of maximum radiation direction and a narrowing of the characteristic in the vertical plane are observed. Compared to the case of
= 3°, there is a slight decrease in the intensity of the electric field for large
[15;50]°. This represents a suitable directivity characteristic for radars that detect and track targets with low-altitude flight ceilings. In
Figure 16b, the simulation result is presented for the case where
= 70° and
= 2.5°, with representation in polar coordinates of the vectors to obtain a dependence of height (
Hn) vs. distance (
Dn). It is easy to observe a slight decrease in the level of the lobes near the limit value of the angle
(dead cone).
In
Figure 17a, the simulation result is presented for the case where
= 60° and
= 5°. A constant but small deviation from the ideal
curve (represented in red) is observed. It closely approximates the ideal curve with a phase shift of 2°. Compared to the case of
= 70° and
= 5°, there is an increase in the dead cone angle, a slight decrease in the intensity of the normalized electric field from lobes near the limit value of the angle
(dead cone), and a narrowing of the characteristics in the vertical plane. This represents a suitable directivity characteristic for radars that detect and track targets with medium-altitude flight ceilings. In
Figure 17b, the simulation result is presented for the case where
= 60° and
= 5°, with representation in polar coordinates of the vectors to obtain a dependence of height (Hn) vs. distance (Dn). Compared to the case of
= 70° and
= 5°, there is an increase in the dead cone angle, a slight decrease in the intensity of the normalized electric field from lobes near the limit value of the angle
(dead cone).
In
Figure 18a, the simulation result is presented for the case where
= 60° and
= 4°. A very good approximation to the ideal
curve (represented in red) is observed for angles
between 4° and 7.5°, as well as for large
(compared to the case of
= 5°). A reduction in the angle of maximum radiation direction and a narrowing of the characteristic in the vertical plane are observed. Compared to the case of
= 70° and
= 4°, there is an increase in the dead cone angle, a slight decrease in the intensity of the normalized electric field from lobes near the dead cone. This represents a suitable directivity characteristic for radars that detect and track targets with medium-altitude flight ceilings. In
Figure 18b, the simulation result is presented for the case where
= 60° and
= 4°, with representation in polar coordinates of the vectors to obtain a dependence of height (
Hn) vs. distance (
Dn). It is easy to observe a slight increase in the level of the lobes near the limit value of the angle
(dead cone) and a small decrease in the width of the characteristic. Compared to the case of
= 70° and
= 4°, there is an increase in the dead cone angle, a slight increase in the intensity of the normalized electric field in the radiation zone between lobes near the limit value of the angle
(dead cone).
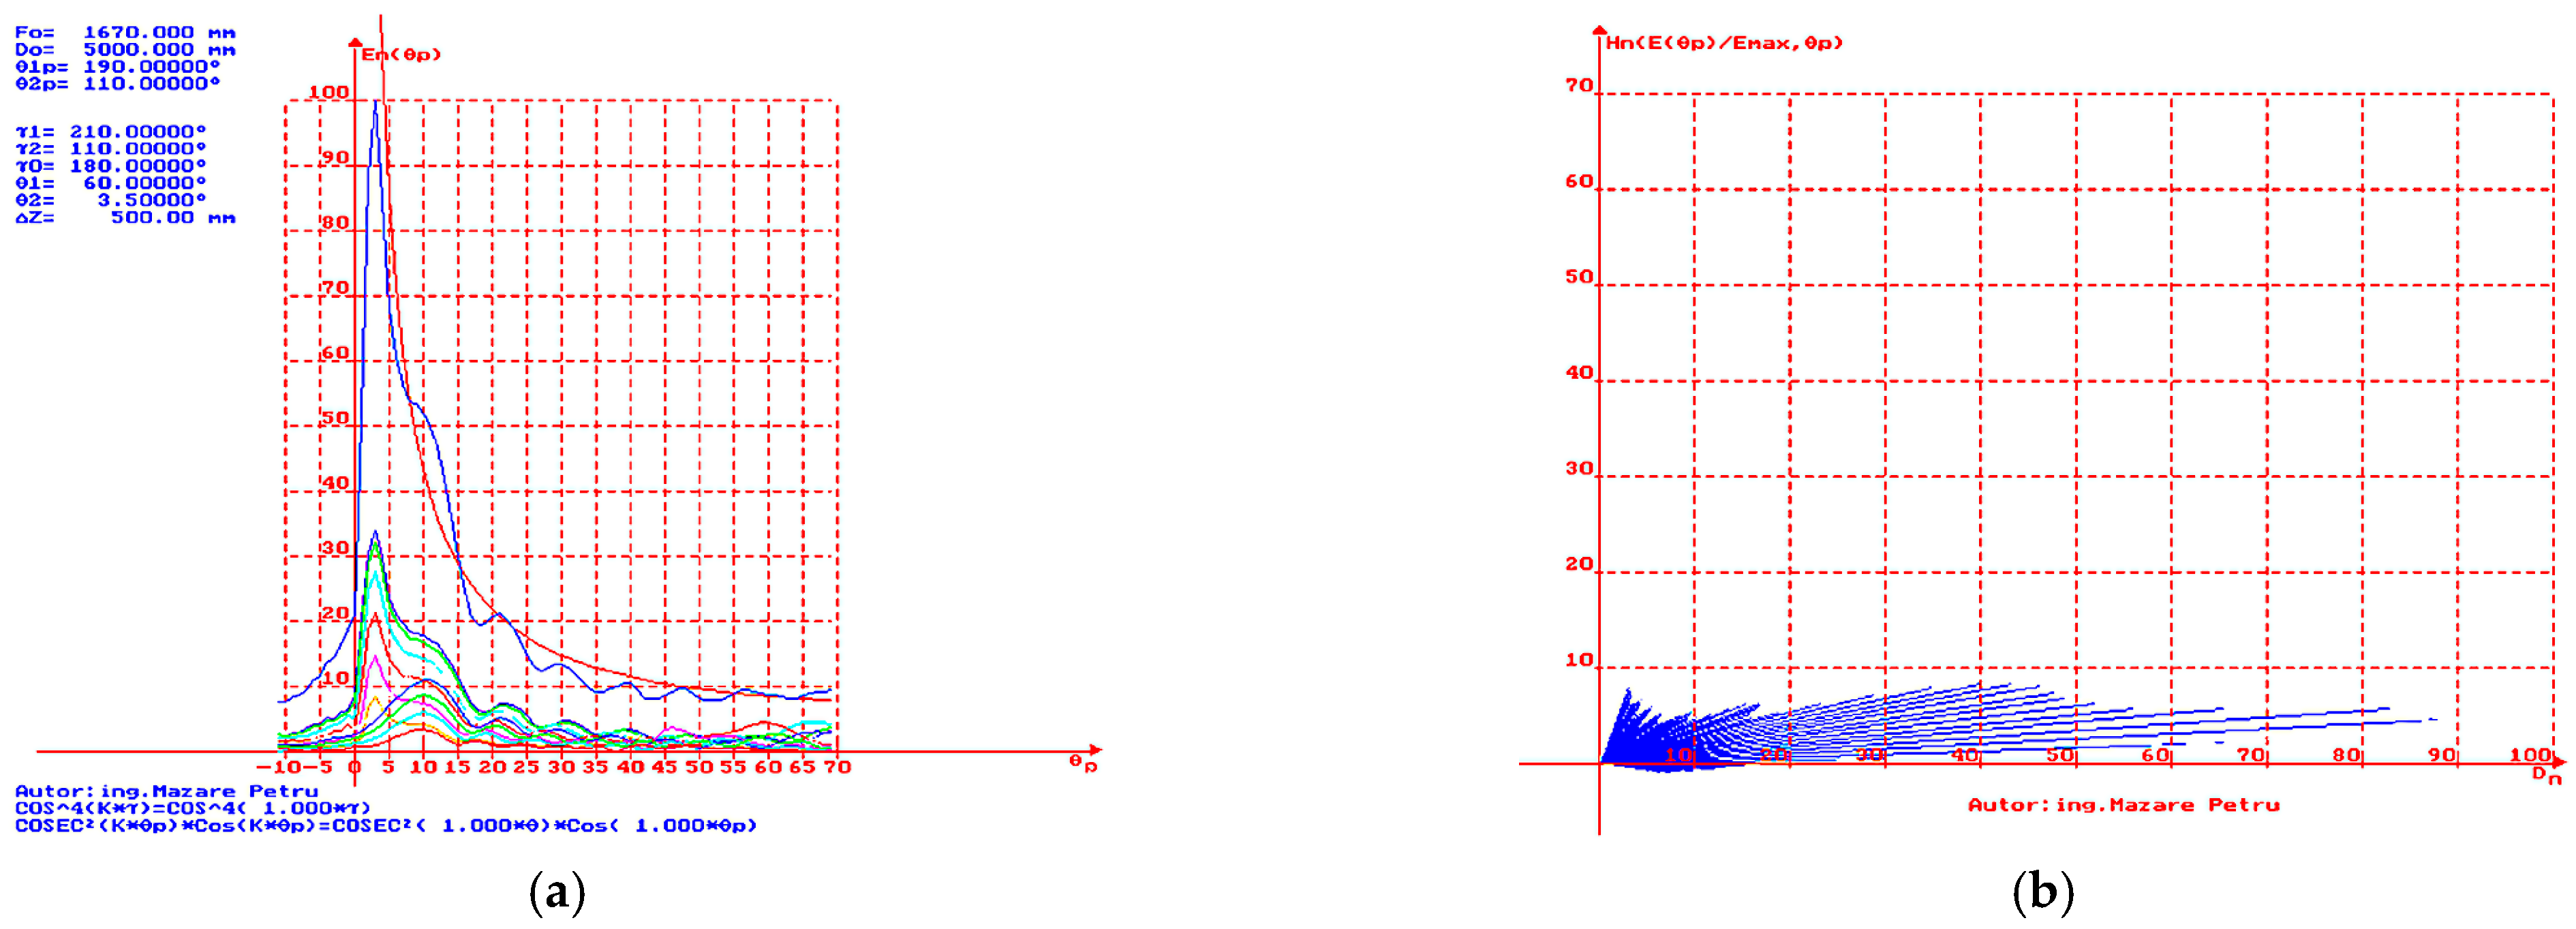
In
Figure 19a, the simulation result is presented for the case where
= 60° and
= 3.5°. A slight but constant deviation from the ideal curve (represented in red) is observed for angles
between 4° and 7.5°, as well as for large
(compared to the case of
= 4°). A reduction in the angle of maximum radiation direction and a narrowing of the characteristic in the vertical plane are observed. This represents a suitable directivity characteristic for radars that detect and track targets with medium- and low-altitude flight ceilings. In
Figure 19b, simulation results are presented when
= 60° and
= 3.5°, with representation in polar coordinates of the vectors to obtain a dependence of height (
Hn) vs. distance (
Dn). It is easy to observe a slight decrease in the level, but with the maintenance of the shape for the lobes near the limit value of the angle (dead cone), compared to the case of
= 4°.
In
Figure 20a, the simulation result is presented for the case where
= 60° and
= 3°. A good approximation to the ideal
curve (represented in red) is observed for angles
between 4° and 7.5°, as well as for large
(compared to the case of
= 3.5°). A reduction in the angle of maximum radiation direction and a narrowing of the characteristic in the vertical plane are observed. This represents a suitable directivity characteristic for radars that detect and track targets with low-altitude flight ceilings. In
Figure 20b, the simulation result is presented for the case where
= 60° and
= 3°, with representation in polar coordinates of the vectors to obtain a dependence of height (
Hn) vs. distance (
Dn). Compared to the case of
= 70° and
= 3°, there is an increase in the dead cone angle, a slight decrease in the intensity of the normalized electric field in the radiation zone between lobes near the limit value of the angle
(dead cone).
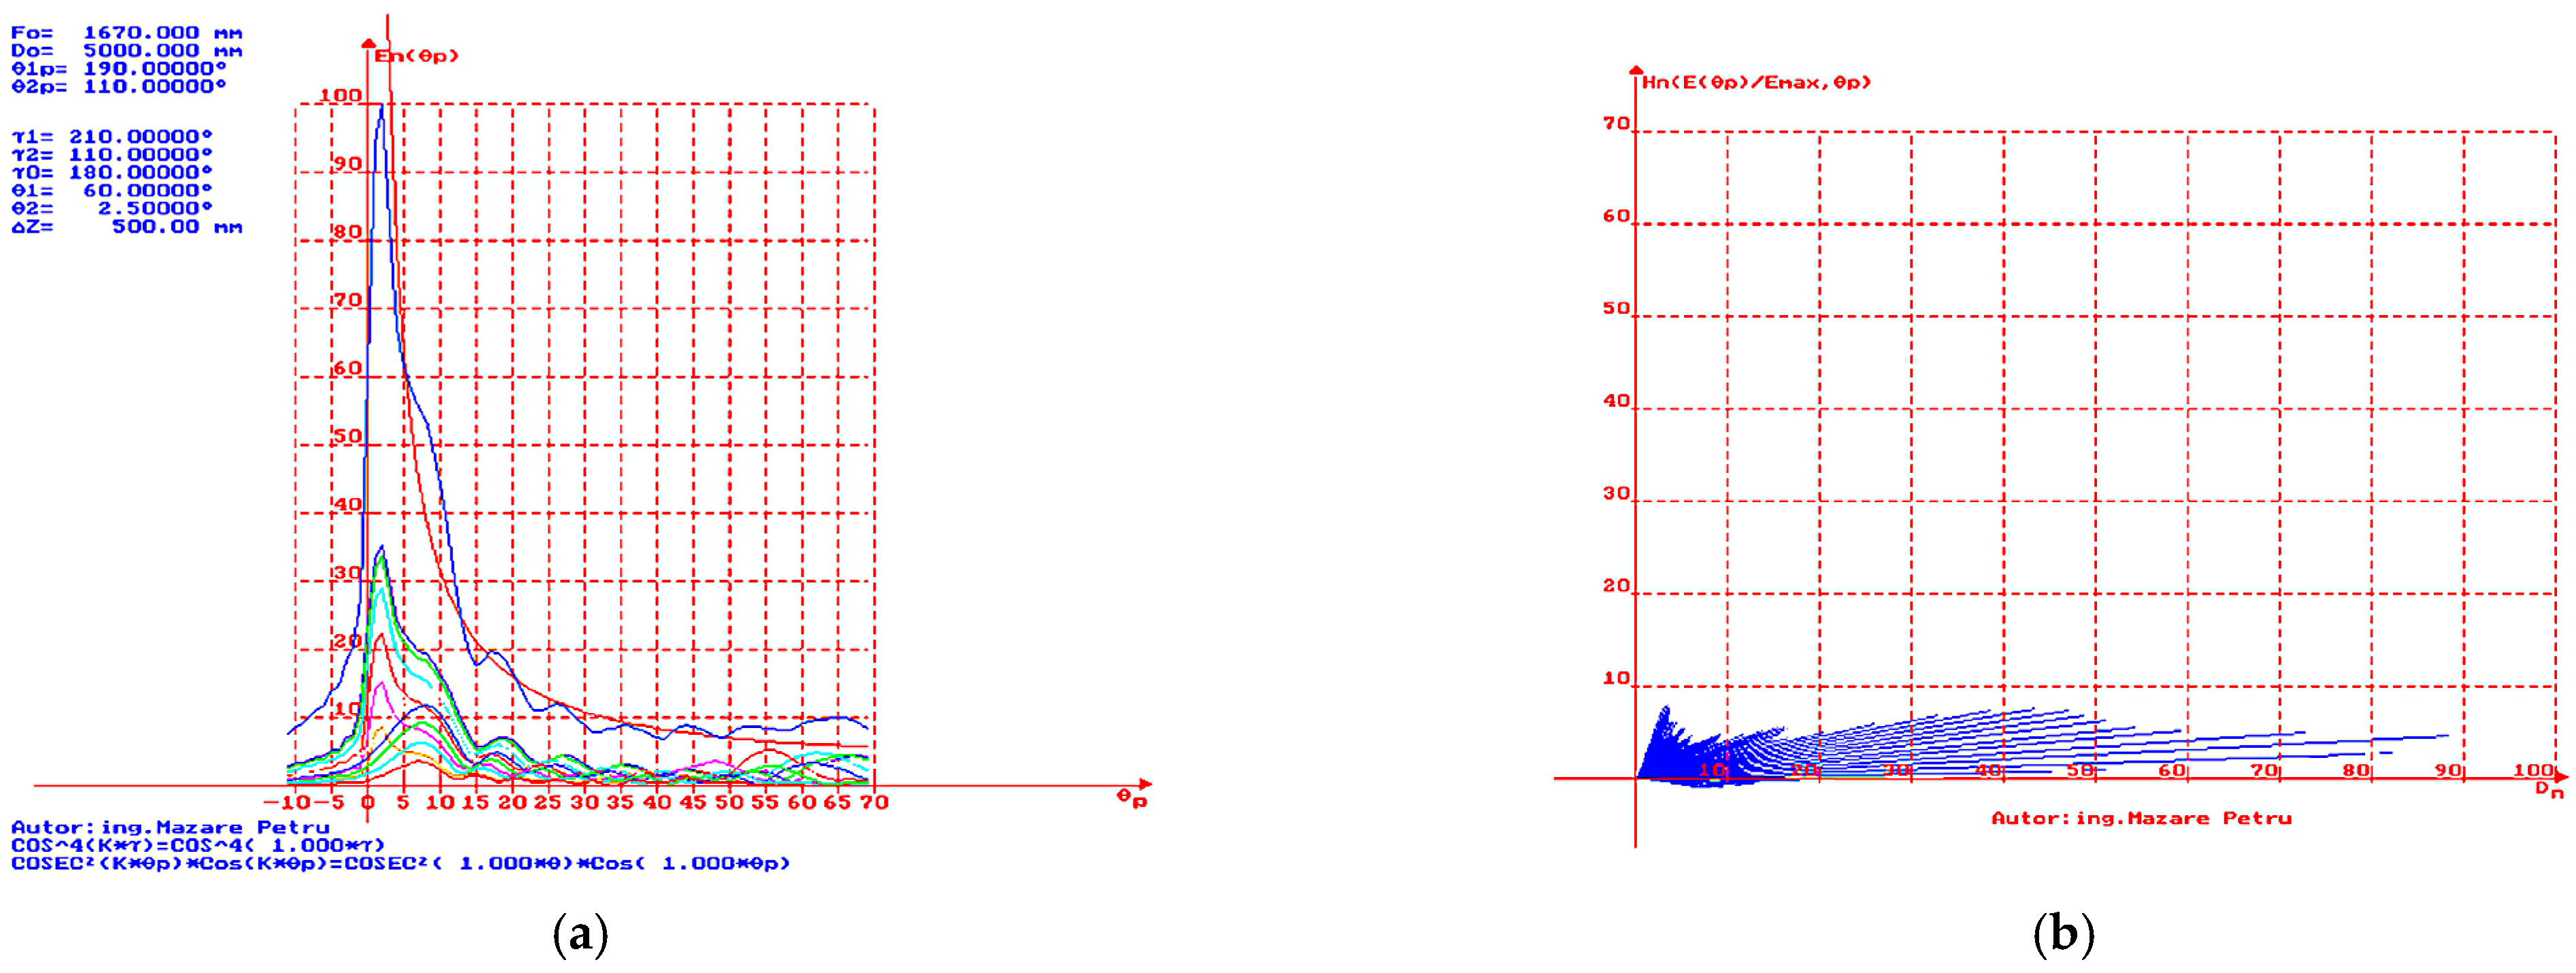
In
Figure 21a, the simulation result is presented for the case where
= 60° and
= 2.5°. A good approximation to the ideal
curve (represented in red) is observed for angles
between 4° and 7.5°, as well as for large
(compared to the case of
= 3°). Compared to the case of
, there is a slight decrease in the intensity of the normalized electric field for large
(
in the range [15;50]°). A reduction in the angle of maximum radiation direction is observed. This represents a suitable directivity characteristic for radars that detect and track targets with low-altitude flight ceilings. In
Figure 21b, the simulation result is presented for the case where
= 60° and
= 2.5°, with representation in polar coordinates of the vectors to obtain a dependence of height (
Hn) vs. distance (
Dn). It is easy to observe a slight decrease in the level of the lobes near the limit value of the angle
(dead cone). Compared to the case of
= 70° and
= 2.5°, there is an increase in the dead cone angle, a slight decrease in the intensity of the normalized electric field in the radiation zone between lobes near the limit value of the angle
(dead cone).
Analysing the simulation results, it can be observed that if remains set at its maximum value of 70°, and the value of the angle is modified (from 5° to 2.5°), the following effects are obtained:
- –
The angle of maximum radiation direction decreases proportionally with the decrease in the angle . This change in the angle of maximum radiation direction results in obtaining directivity characteristics suitable for detecting and tracking targets flying at high altitude (for large ) and at medium altitude (for between 4° and 3.5°. The characteristic for = 3.5° can also be used for medium altitude) and at low altitude (for between 3° and 2.5°).
- –
The shape of the directivity characteristic in elevation approaches more closely to the ideal shape, simultaneously with the decrease in the values of the angle . A slight narrowing of the characteristic in the vertical plane is also observed.
- –
Variation in the amplitude and phase of the lobes near the limit value of the angle (dead cone—the area between the antenna rotation axis and the angle , where there is no radiation). Decreasing the angle results in the proximity of the level of these lobes to the ideal level curve.
- –
In the situation where the angle is reduced to the value of 60°, and the value of the angle is modified (from 5° to 2.5°—for the same values used in the simulation where = 70°), the following effects are obtained:
- –
A slight decrease in the intensity of the normalized electric field in the radiation zone between lobes near the limit value of the angle (dead cone) for angles less than 3° and an increase in the intensity of the normalized electric field in the radiation zone between lobes near the limit value of the angle (dead cone) for angles of [4; 5]°.
Based on the simulations performed, the following optimal characteristics can be considered depending on the flight altitude of the targets to be detected and tracked:
- –
Optimal characteristics for low altitude is obtained with = 60° and = 2.5°.
- –
Optimal characteristics for medium altitude is obtained with: = 60° and = 3.5°.
- –
Optimal characteristics for high altitude is obtained with: = 70° and = 5°.

