Article

Heritage at Altitude: Navigating Moisture Challenges in Alpine Architectural Conservation

1
Department of Architecture, Built Environment and Construction Engineering, Polytechnic University of Milan, 20133 Milan, Italy
2
University of the Built Environment, Horizons, 60 Queen’s Road, Reading RG1 4BS, UK
3
Department of Earth Sciences, Fluid Dynamics and Mathematic, University of Trieste, 34127 Trieste, Italy
*
Author to whom correspondence should be addressed.
Appl. Sci. 2025, 15(17), 9480; https://doi.org/10.3390/app15179480
Submission received: 22 May 2025 / Revised: 17 August 2025 / Accepted: 26 August 2025 / Published: 29 August 2025
(This article belongs to the Section Civil Engineering)

Abstract

This study presents the diagnostics and microclimate analysis of four case studies located in the Alps region in Valtellina and Valposchiavo. The primary focus is on evaluating and comparing microclimatic conditions, encompassing temperature (T°C), relative humidity (RH%), mixing ratio (MR), and dew point depression (DPD). The choice of the variables and statistic metrics depends substantially on the aim to identify the risk factor for the preservation of the historical materials of historical buildings, and the procedures for identifying the anomalies in the trends useful to study how to prevent these anomalies in the future. The paper has the target to support the activities of restorers and building managers for improving the restoration process. While various moisture detection methodologies have been studied, no single approach is preferred for analyzing moisture via microclimate monitoring in built heritage. Therefore, this research delves into the influence of various factors, including altitude, location, building type, structure, materials, orientation, and use, on the microclimatic parameters. Altitude and building use significantly influence indoor microclimates: unoccupied structures exhibit greater stability, whereas seasonal use increases condensation risks. Key risks included high RH% and critical T-RH zones (T > 25 °C + RH > 65%), exacerbating material stress. Probability density function (PDF) analysis reveals temperature and RH% distributions, highlighting bimodal T°C patterns and prolonged RH% in high-elevation exposed sites. The findings underscore the need for tailored conservation strategies and targeted interventions to mitigate microclimate-induced deterioration in Alpine heritage.

1. Introduction

The Alpine region of Valtellina and Valposchiavo presents unique preservation challenges, including extreme climate variability, the vulnerability of porous materials, and the impacts of climate change [1,2]. While climate monitoring for cultural heritage preservation has been extensively studied [3,4], Alpine sites specifically lack systematic and widespread microclimate monitoring essential for preserving both monumental and vernacular built heritage.
Some Alpine regions worldwide have undergone critical literature reviews due to scientific expeditions conducted systematically since the early 1950s in major high mountain ranges (especially the Himalayas) [5]. More recently, ongoing climatic changes have generated significant scientific interest due to the profound influence of the Asian Alps on a global scale, particularly concerning their impact on highly populated nations directly or indirectly connected to the area [6]. The availability of scientific literature for these vast regions prompted initial research in the European Alpine region [7,8,9,10,11,12], especially given the limited availability of local climatic data. The scarcity of weather stations in remote locations, particularly along the Swiss Italian border, poses a critical challenge for data collection [13,14,15,16,17,18,19].
Historically, most local research in the Alps has focused on the effects of climate variation on the landscape, rather than the climate and microclimate of historical buildings. In contrast, the European Union has long supported the protection of built historical heritage in the Lombardy and Grigioni Canton region. Numerous Interreg projects have been financed to improve both restoration practices and the dissemination of best practices in the field of historical building restoration and conservation [20].
To address a notable deficiency in current research concerning the microclimate patterns of built heritage in the Alpine region, this study was undertaken. The authors sought to bring the most effective non-destructive diagnostic and monitoring techniques, refined over recent decades, directly to this context. By focusing on buildings that are highly representative of the area’s rich historical and artistic heritage, the research aimed to provide much-needed data and insights into their specific microclimates, a crucial step for their long-term preservation. This necessitated installing microclimatic data loggers near and inside the studied buildings and comparing the collected data with available data from the nearest weather stations. This comparative method, utilizing both research-generated and public weather monitoring data, proved particularly effective in this study [21,22,23].
This paper examines the microclimatic conditions of four historically significant buildings in this region: the Church of San Romerio and the Visconti-Venosta, Semadeni, and Besta Palaces. These case studies were chosen for their architectural and cultural importance and illustrate the challenges of conserving heritage assets in mountainous areas, where altitude, building usage, material vulnerability, and fluctuating climate converge. Despite its importance for mitigating risks to historical objects, microclimate monitoring in Alpine regions remains underrepresented in studies [24,25]. For climate-sensitive regions, Bonazza et al. [26], Padeletti et al. [22], Kalamees et al. [23], Sciurpi [24], Aste et al. [25], Sesana et al. [27], Andretta et al. [28], Leissner et al. [29], and Haugen et al. [30] have established standardized protocols using long-term data loggers and infrared thermography (IRT) to assess temperature (T°C) and relative humidity (RH%) fluctuations. Haugen et al. [30] applied probabilistic modeling to examine frost damage risks in Nordic churches, highlighting the need for specific microclimate thresholds at various altitudes. In Alpine contexts, Rosina et al. [31,32] used psychrometric mapping, IRT, and seasonal RH% analysis to identify moisture-prone zones in historical churches, while Ludwig et al. [33] demonstrated IRT’s efficacy in detecting subsurface moisture without invasive sampling. Comparative analysis across sites integrated empirical data with environmental factors (usage, orientation, materials) to identify effective preservation strategies. The emphasis was placed on non-destructive techniques to safeguard historical materials [10,29,34,35,36,37,38,39,40,41,42,43,44], while also documenting altitude-specific risks such as moisture infiltration and thermal fluctuations.
These methods align with this study’s comparative approach, which combines long-term microclimate monitoring (using data loggers), infrared thermography (IRT), and statistical analysis (Probability Density Functions (PDFs) and air humidity mixing ratios) to evaluate microclimate stability across different building typologies.

2. Materials and Methods

2.1. Thermo-Hygrometric Monitoring of the Case Studies

The challenging climatic characteristics of the Alpine region, including extreme climate variability, high humidity, and freeze–thaw cycles, necessitate long-term microclimate monitoring of cultural heritage. This method entails studying seasonal fluctuations in temperature (T°C) and relative humidity (RH%), critical for identifying risks like condensation, mold, and salt crystallization, while providing empirical data to establish safe thresholds for conservation. The combination of various non-destructive (ND), semi destructive techniques (SD) and microclimate monitoring offers a preliminary test to ensure the least destructive application of the quantitative, gravimetric tests [10,36,45]. This methodology of monitoring microclimate results in a more significant collection of data and less disfiguring/destroying of the historical material [46,47,48,49,50,51,52,53,54,55,56].
The microclimate monitoring campaigns were conducted across four historic case studies, San Romerio (2013–2025), Visconti-Venosta Palace (2021–2023), Semadeni Palace (2021–2023), and Besta Palace (2017–2023), using a standardized yet site-adapted protocol to assess environmental conditions affecting heritage materials. Data loggers were strategically deployed based on architectural features, material vulnerabilities, and conservation priorities. Additionally, psychrometric analysis was conducted to assess the hygroscopic homogeneity of indoor microclimate to optimize the location of the data loggers. Table 1 summarizes the building characteristics of four historical sites. It compares their construction materials, dates, current uses, and elevation levels, highlighting that all sites feature continuous stone masonry but vary in age, purpose, and altitude.

2.1.1. San Romerio Church, Brusio

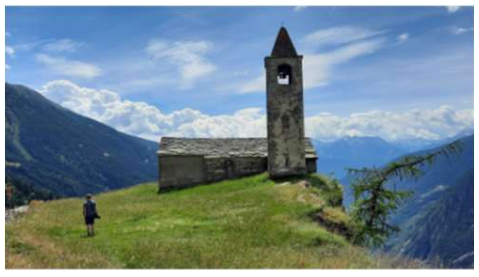
San Romerio Church occupies a mountainous ridge at 1800 m elevation near Lake Poschiavo, under Italian jurisdiction. The 12th-century structure demonstrates vernacular Alpine architecture with a single nave, underground crypt, and northern bell tower. Its small windows and compact volume reflect historical defensive requirements. The church features a gabled roof which underwent major restorations in the 17th century and 1951–1953. Local stone and lime plaster construction retains fragmentary northern wall frescoes. South-facing orientation provides solar gain, but its exposed ridge location causes significant thermos-hygrometric fluctuations, challenging material conservation. Current use is seasonal during milder months.
Figure 1 illustrates the location of data loggers along with psychrometric analysis and Infrared thermography (IRT) test conducted from 2013 to 2025 in various intervals. Infrared thermography (from 27 August 2020, to 30 November 2021) revealed non-uniform surface temperature distribution due to stone-mortar structure and intermittent water infiltration. External thermographic surveys did not reveal thermal imbalances indicative of abnormal material water absorption. However, some areas with higher surface temperatures were noted, potentially indicating detachment of the finish. Pre-2024 microclimate monitoring showed interior temperature fluctuations closely tracking exterior variations, particularly during transitional seasons, with minimal structural buffering. This correlation stemmed from uninsulated roofing. The monitoring confirmed the presence of humidity and temperature imbalances that pose a risk to the conservation of the materials. The recorded relative humidity (RH%) values, ranging from 46% to 97%, are higher than optimal for the preservation of historical surfaces and materials. This situation, combined with the observed temperature distribution (lower at the base of walls due to ground contact), can lead to condensation phenomena, especially during colder hours. The data acquired from this monitoring will be fundamental in defining the optimal conservation conditions for the site.
Roof insulation was installed in 2024, with ongoing monitoring. The objective of monitoring is to detect thermo-hygrometric imbalances that could risk the conservation of existing materials. The collected data will be used to define the ideal conditions for better preservation of the building.

2.1.2. Visconti-Venosta Palace, Tirano

The Visconti-Venosta Palace is situated in Tirano’s historic center at 440 m elevation, embedded in a dense urban context of low-to-medium rise buildings. Architectural analysis suggests a 15th century origin, with major 18th century modifications. The three-story stone masonry structure features vaulted ground floor rooms, cellars, and an attic. Continuous vacancy since 1985 and absence of recent conservation measures have increased its material vulnerability. Microclimate monitoring from 2021 to 2023 focuses on thermos-hygrometric fluctuations potentially damaging interior porous materials. Eight data loggers were deployed following complete psychrometric mapping of temperature (T°C) and relative humidity (RH%) across all levels. The attic, Sala d’Onore, and rooms with frescoes exhibited the most unstable conditions, with RH peaks reaching 90–100% in some periods. High indoors relative humidity levels (often exceeding outdoor values), critical for porous and organic materials, has been recorded in spring.
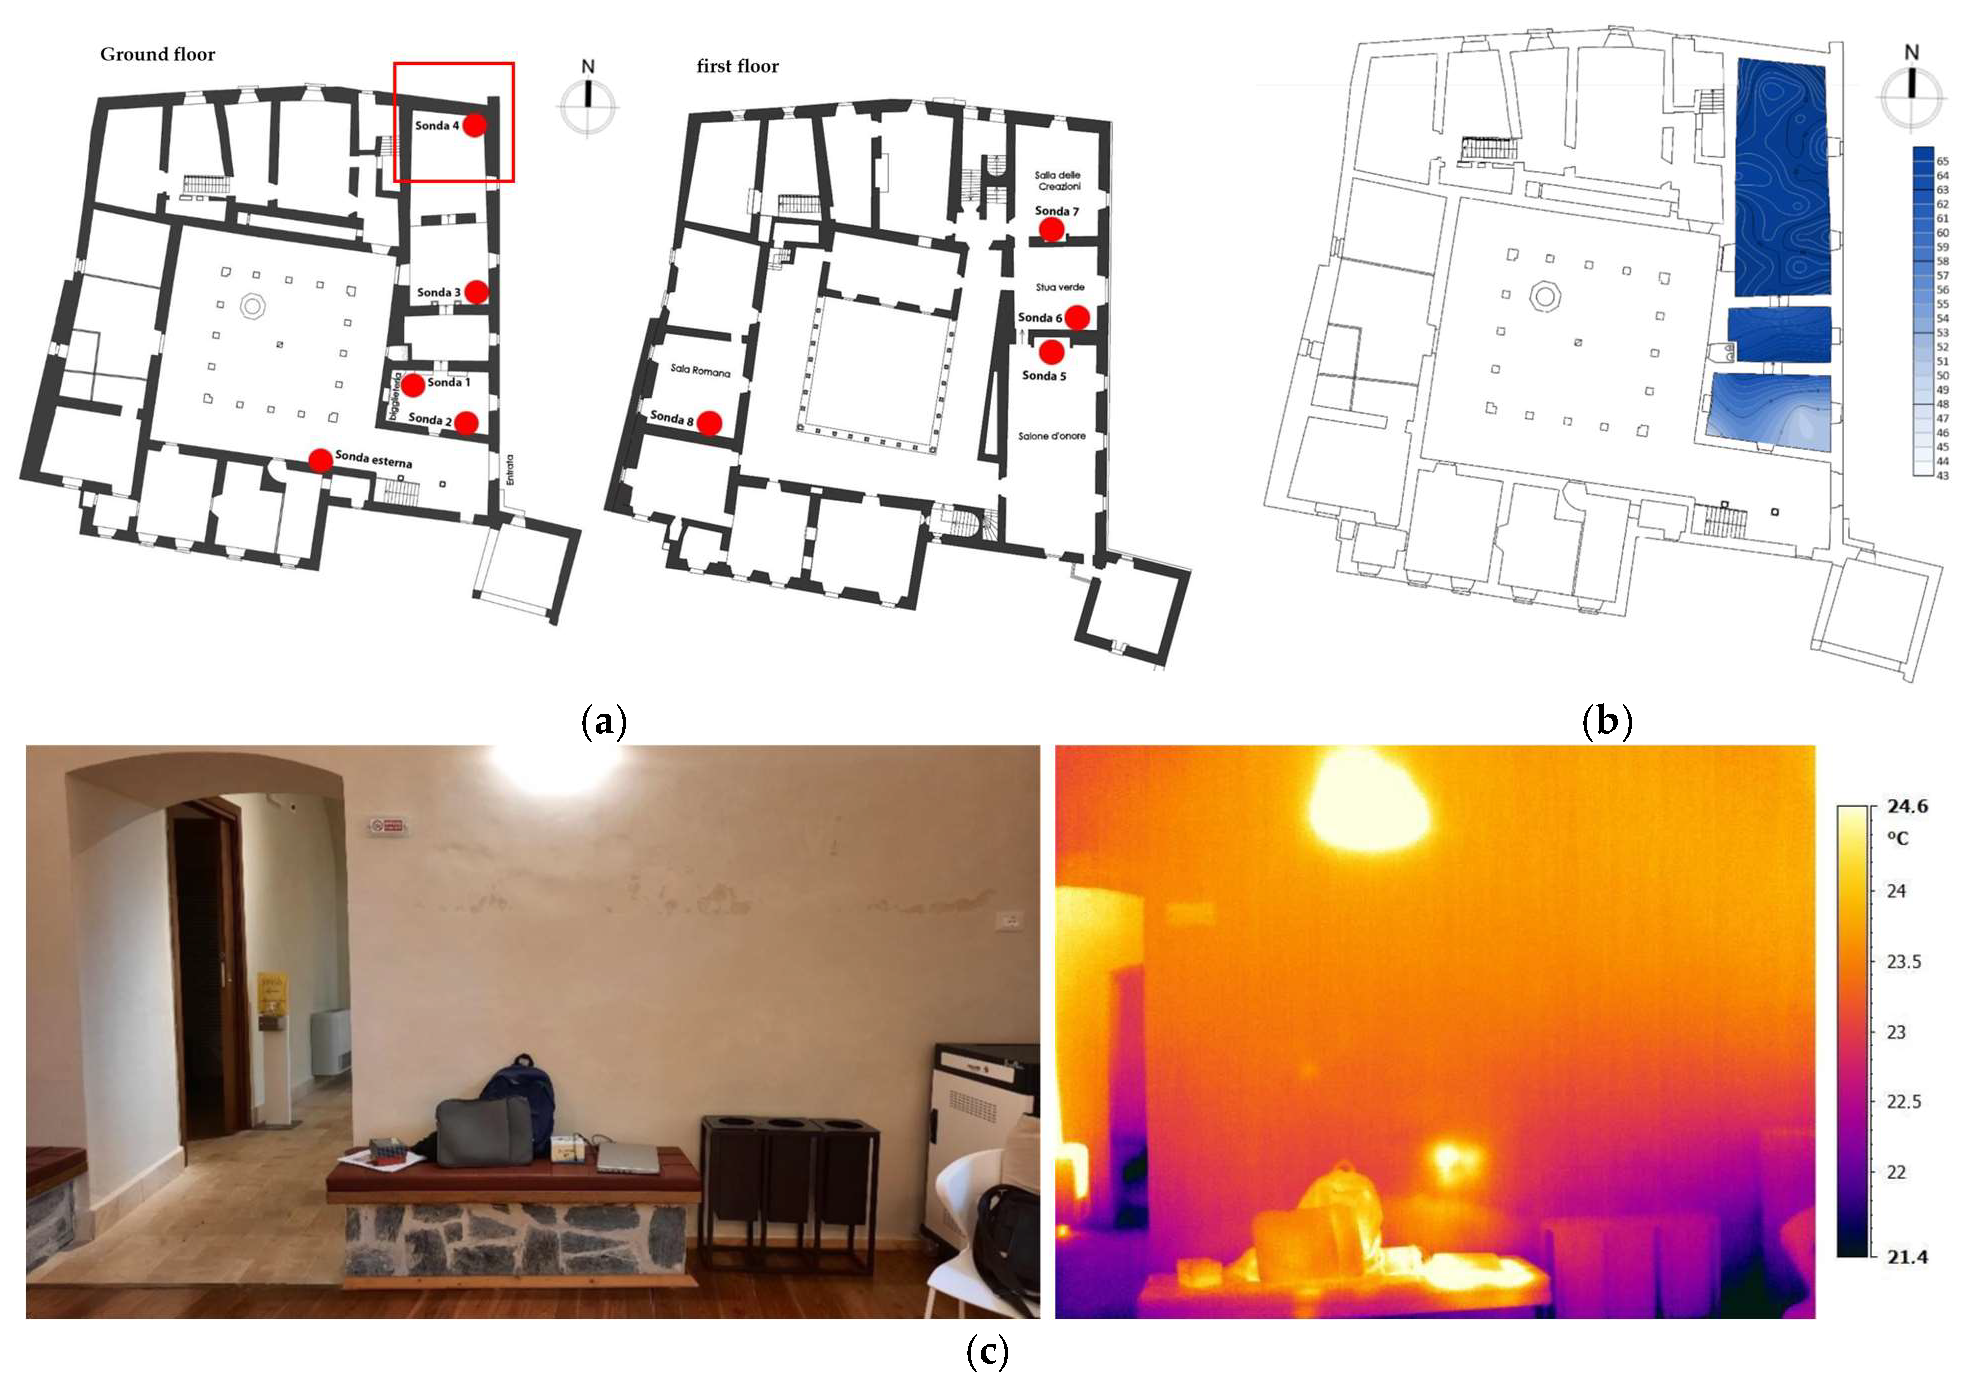
Complementary infrared thermography (IRT) scans identified surface thermal anomalies that could induce localized RH% condensation and subsequent material stress. Discontinuous surface temperatures were observed on internal and external walls, revealing areas with moisture infiltration, tamponed openings, and degraded finishes. The representative microclimate data was recorded by a datalogger in the first-floor room (Sala d’Onore) at the south-east side of the building which shows a moderate condition in comparison to the rest of installed dataloggers.
Figure 2 shows the locations of the dataloggers, the selected one for this research, and the IRT analysis in the southern part of the building where the designated probe was installed.

2.1.3. Semadeni Palace, Poschiavo

Semadeni Palace forms part of a historic complex in Poschiavo, located at 1014 m above sea level. Dating from the late 19th century, the building holds protected status in both the Swiss Inventory of Heritage Sites of National Importance (ISOS) and ICOMOS’s Inventory of Historic Gardens of Switzerland. The palace features continuous stone masonry construction with a semi-basement, three main floors, and an attic. Its spatial organization demonstrates an urban planning approach designed to optimize natural daylight and passive solar heating, with strategic orientation maximizing solar exposure along the principal façade. While architecturally significant, the building has remained vacant since the late 1970s without major restoration or adaptive reuse, resulting in prolonged dormancy and preservation concerns.
Infrared Thermography was conducted in April, May, July, and September 2021 to detect surface temperature anomalies, indicating moisture infiltration, structural discontinuities, or hidden openings. Preliminary infrared thermography (IRT) of all interior surfaces revealed greater thermal imbalances in the barn area, particularly lower temperatures at wall bases.
Monitoring data indicated synchronous daily temperature (T°C) and relative humidity (RH%) patterns in upper levels, while barn fluctuations mirrored ground-level conditions. Recorded RH% levels (30–70%) fell outside optimal conservation ranges for historic porous materials such as plaster and frescoes. The selected datalogger is located on the first floor. Figure 3 illustrates the location of data loggers along with the IRT analysis.

2.1.4. Besta Palace, Teglio

Besta Palace is in Teglio (Sondrio) at 900 m elevation, constituting a site of significant historical and architectural importance. Initially constructed in the 15th century, it later became Valtellina’s most notable Renaissance residence.
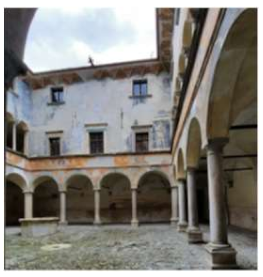
The continuous stone masonry structure comprises three floors organized around a central cloistered courtyard. Extensive fresco decorations on courtyard façades and upper interior levels highlight its cultural and artistic significance. Functioning as a public museum since 1927, the palace has received multiple restoration interventions to maintain its architectural and historical integrity.
Comprehensive microclimate monitoring was conducted from 2017 to 2023, including infrared thermography (IRT) surface mapping and gravimetric testing. Data analyzed spans from August 2020 to November 2021, with thermographic surveys in mid-2021 and December 2021. The result of thermographic analysis revealed non-uniform temperature distribution underlying masonry texture and past restoration interventions (e.g., plaster repairs). Moisture infiltration was observed near windows on the west side due to prevailing wind-driven rain. Higher temperatures (5–6 °C above upper floors) due to heating systems and ground contact was detected in the interior walls.
Ground-level temperature monitoring showed remarkable stability during winter/spring (9–13 °C through March), with modest increases in April. External temperature variations influenced interior conditions with reduced amplitude and delayed response (several hours). Relative humidity (RH%) exhibited limited variation (32–67% range) with fluctuations constrained to 10% amplitude.
Figure 4 demonstrates the location of the data loggers, psychrometric analysis in the east and south parts, and the infrared thermography results.

2.2. Data Collection and Data Processing

Long-term, non-invasive microclimate monitoring provides a critical means of assessing hygrothermal dynamics in heritage structures, enabling repeated measurements without damaging historic fabric. The microclimate monitoring in this study adheres to established conservation standards, including UNI 10586:1997 [57] (environmental measurement for heritage assets), UNI 10829:1999 [46] (detailed environmental analysis), and UNI 10969:2002 [58] (microclimatic parameter control), with methodologies adapted to site-specific conditions. The thermographic surveys comply with UNI 9252/88 [59] (thermal irregularity detection in building envelopes), UNI EN 16714-1:2016 [49] (fundamental thermographic testing principles), and UNI EN 13187:2000 [48] (qualitative infrared assessment of thermal anomalies). Together, these standards ensure rigorous, non-destructive evaluation of hygrothermal behavior and structural performance, guaranteeing reliable and comparable results.
Microclimate monitoring was conducted across four historic case studies (San Romerio, Visconti-Venosta Palace, Semadeni Palace, and Besta Palace) to capture seasonal extremes, including winter condensation and summer evaporation cycles. For consistency, a representative 13-month dataset in the year 2022 from each site was selected, prioritizing continuous, uninterrupted records to ensure reliable climatic analysis. Monitoring was performed using calibrated HOBO MX1104 with accuracy ±0.20 °C (0 °C to 50 °C), HOBO U12-013 with accuracy ±0.35 °C (0 °C to 50 °C), and Lascar EL-USB-2+ with accuracy ±0.45 °C typical (5 °C to 60 °C) (see Appendix A for specifications). Datalogger placement was carefully selected to minimize interference from solar radiation, air currents, and building envelope effects. Psychrometric analysis was occasionally used to map humidity gradients (RH% and specific humidity), ensuring optimal sensor positioning. Hourly recordings captured masonry’s slow moisture dynamics while maintaining data resolution for analysis.
Before analysis, microclimate data underwent rigorous quality control to ensure reliability. Outliers from sensor errors or interference were removed using statistical methods and a 4 h moving average filter to reduce noise. Data validation included cross-checking with external weather stations to differentiate measurement artifacts from true environmental fluctuations (e.g., visitor impacts).
Preliminary time series analysis is employed to evaluate long-term environmental trends and detect patterns in temperature and relative humidity (RH) fluctuations. This method facilitates the identification of seasonal variations. Understanding risk factors of microclimate unbalances [53,60,61,62,63,64,65,66,67] this study emphasized on the calculation of mixing ratio, ratio of the mass of water vapor to the mass of dry air in a given air parcel, between the interior and exterior air and especially across the main opening of the building [68]. While temperature and relative humidity are standard parameters, the mixing ratio provides additional insight into moisture dynamics, helping to pinpoint events that may not be obvious from temperature or humidity data alone [69]. This parameter was calculated through the following steps:
S a t u r a t i o n   V a p o r   P r e s s u r e   e s T   =   A     10 B T C + T
where A, B, and C are constants. A common set of constants for es in hPa and T is in °C, A = 6.112, B = 17.67, C = 243.5.
A c t u a l   V a p o r   P r e s s u r e   e   =   R H 100     e s
M i x i n g   R a t i o   ω   =   e P e
where ϵ ≈ 0.622 (ratio of molar mass of water to dry air).
The microclimate assessment is based on four primary parameters: air temperature (T, °C), relative humidity (RH, %), dew point temperature (Tp, °C), and mixing ratio (MR, g/kg). Four derived indicators quantify fluctuations, peaks, and correlations: mixing ratio gradients and damping effect, dew point depression (DPD, °C), critical T-RH zones, and daily RH variation (DRH, %). The theoretical significance of each indicator has been established independently of material degradation states in empirical case studies. Dew point depression (DPD = T − Tp) directly quantifies condensation risk. The dew point is calculated using the Magnus formula, an empirical equation widely applied in building science and conservation due to its reliability (±1 °C deviation) within 0–60 °C. Critical T-RH zones are defined by two conditions: (1) T > 25 °C and RH > 60%, promoting salt dissolution-recrystallization, and (2) T ≈ 0 °C and RH > 60%, inducing freeze–thaw damage. RH fluctuation analysis is critical for identifying prolonged high-variability periods.
The damping effect evaluates hygrothermal buffering performance by comparing internal and external daily RH and MR variations. The damping coefficient is categorized as: <0 (uncontrolled), 0–0.25 (very low damping), 0.25–0.5 (low damping), 0.5–0.75 (moderate damping), 0.75–1 (high damping), and = 1 (full damping). This metric quantifies material efficacy in attenuating indoor RH fluctuations relative to external conditions.
As a statistical framework, this study applies probability density function (PDF) which provides essential insights in microclimate stability through distribution width, seasonal patterns through distribution modality, risk thresholds, and comparative performance between cases studies. This method complements the understanding gained from time-series examination and mixing ratio calculations. Furthermore, multi-regression analysis was applied to examine the relationship between dew point depression and multiple independent variables (temperature, relative humidity, dew point temperature).

3. Results

3.1. Monitoring of the Microclimatic Conditions

In the subsequent analysis, the collected data is compared against the daily averages of temperature (T°C) and relative humidity (RH%). Statistical tools are employed to discern trends and patterns within the amassed data.
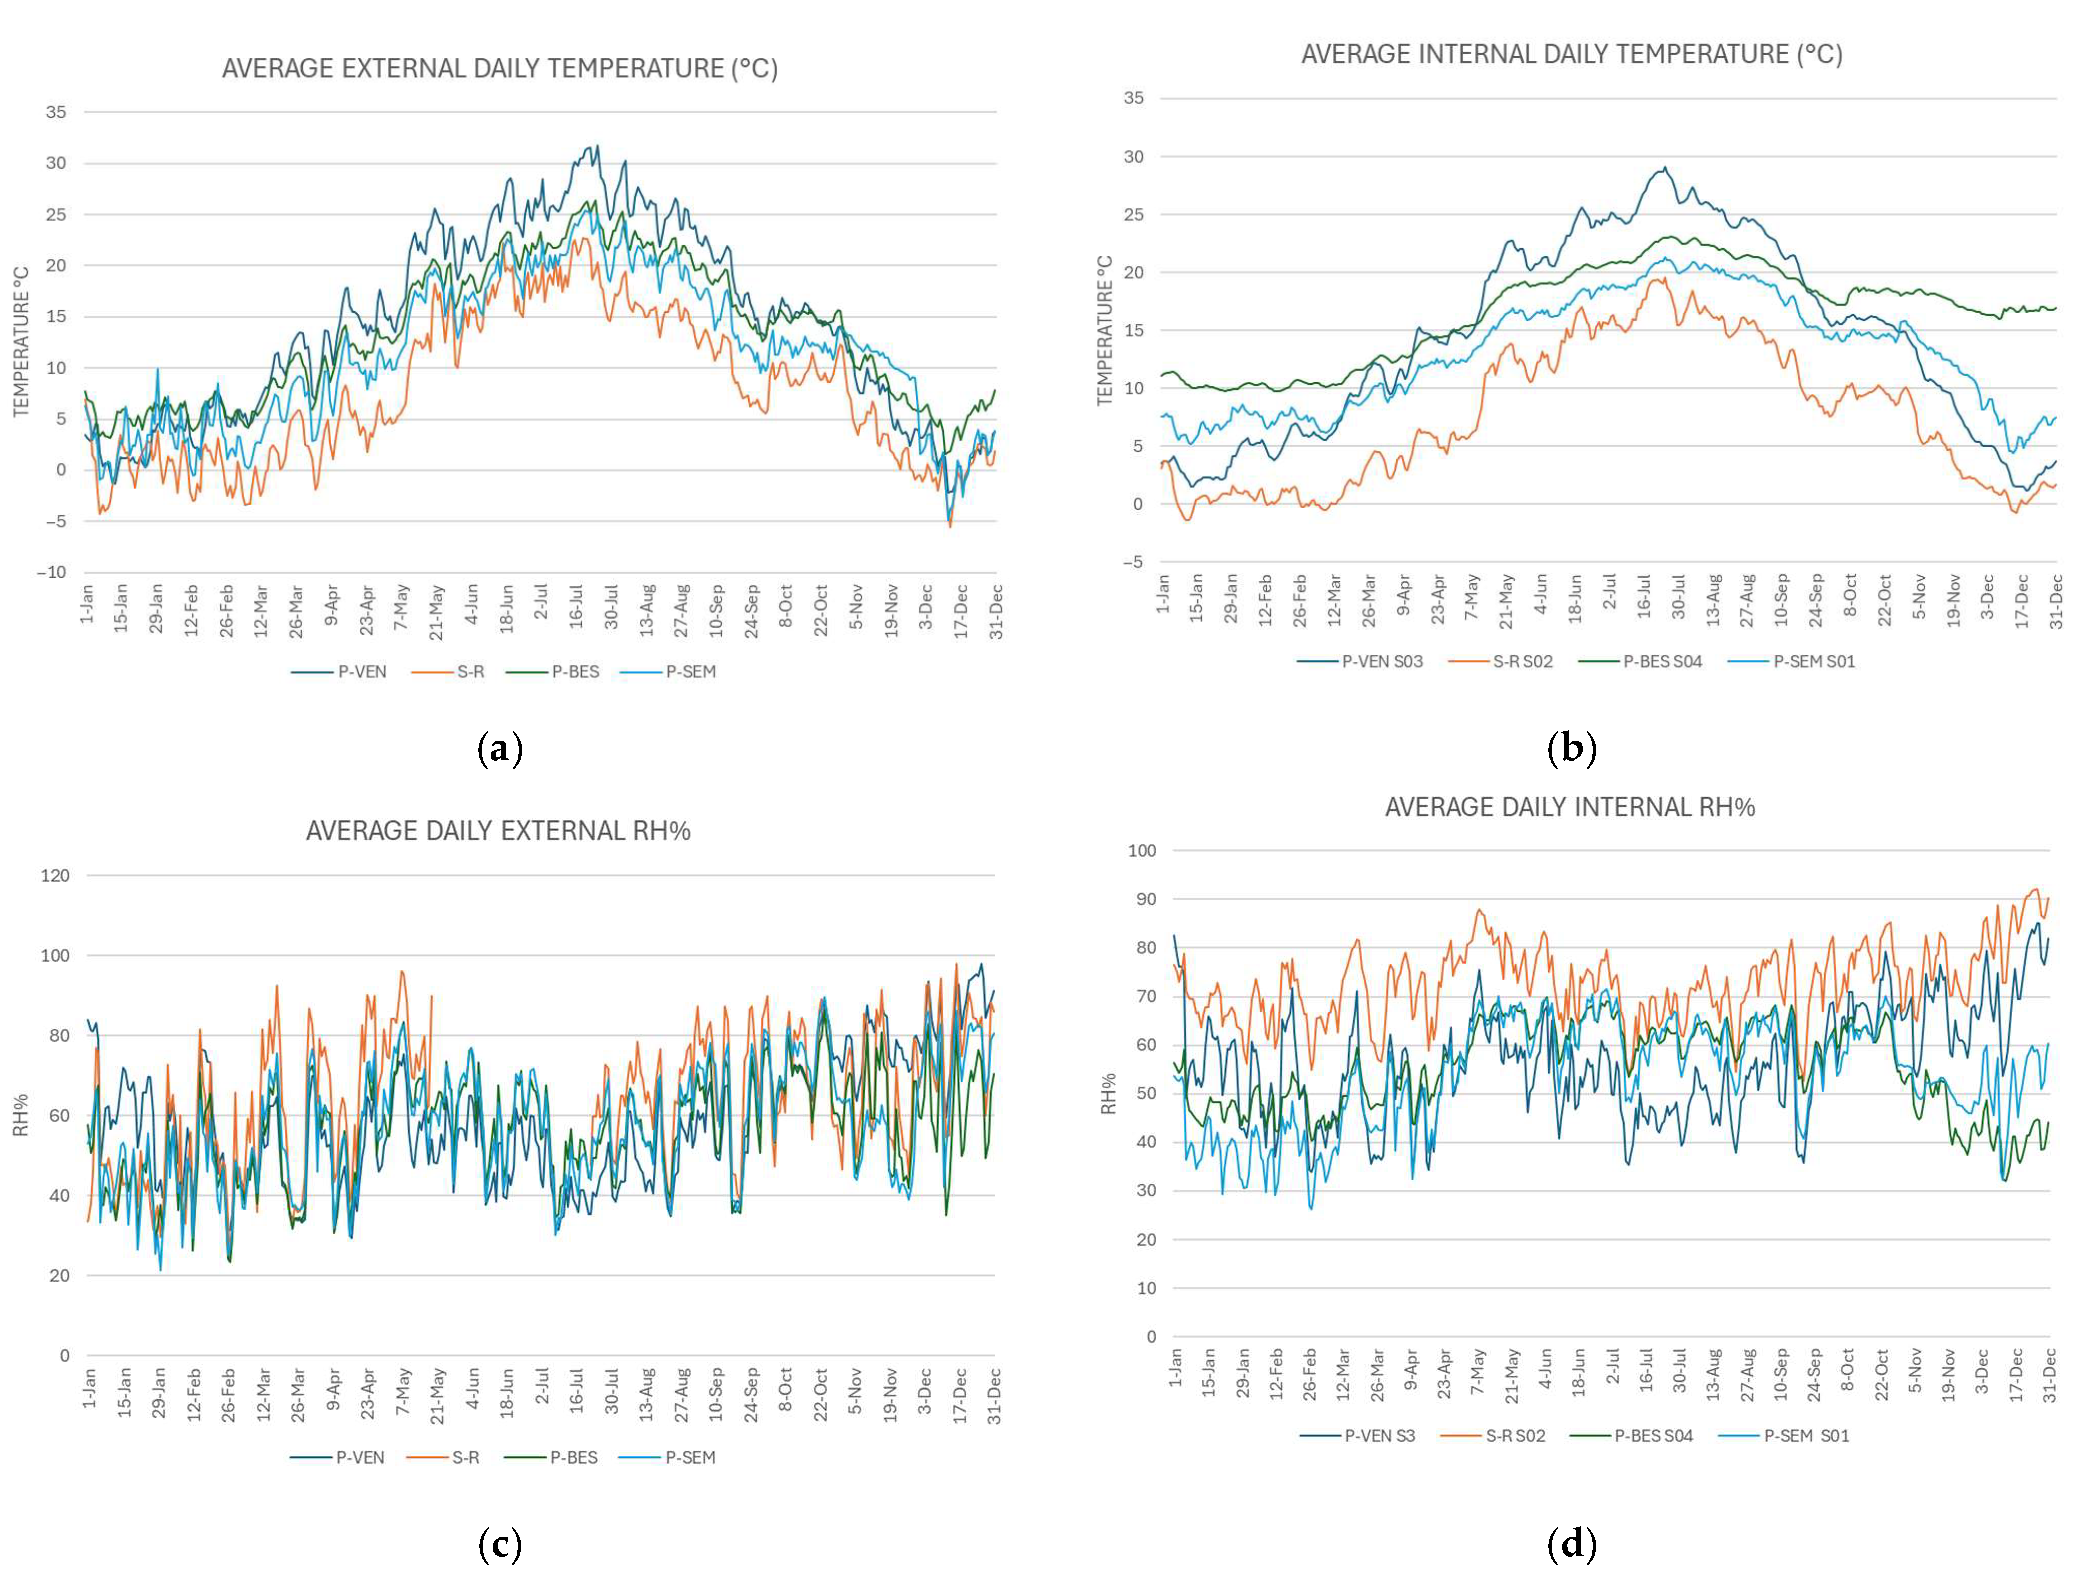
Visconti-Venosta and Besta palaces exhibit similar temperature patterns throughout the year, with the highest values occurring during the summer season, ranging from 20 °C to 29 °C. This can be attributed to factors such as limited window openings in Visconti-Venosta Palace or the influx of visitors in Besta palace. Additionally, the presence of urban forms in these case studies may contribute to the observed temperature trends. In contrast, Semadeni palace demonstrates greater temperature stability during the cold seasons. This stability can be attributed to the construction of the building and its non-utilization, which effectively regulates the internal temperature by reducing heat exchange with the external environment.
The results show consistently lower temperatures inside the Church of San Romerio, throughout the year, ranging from −1 °C to 21 °C. The result confirms the lapse rate observed in the region at a high level of altitude, wherein temperature decreases with increasing altitude. In fact, the temperatures resulted from 4 to 8 °C lower compared to the ones installed inside the other buildings: the impact of altitude on temperature differentials within the alpine setting is strongly affected by altitude.
The first conclusion that it is possible to obtain is regarding the shape and volume. The typology of Palace, more than the volume, seems to affect the temperature distribution of the temperature inside, when no plant is on. The results clearly show the same trend, with the peak and minimum reached almost every day, despite the slight differences in altitude, and the huge differences in the number of floors, presence of openings, etc.
The annual indoor RH% graphs resulted in clear and distinct patterns. In the cases of Visconti-Venosta Palace, and Besta Palace, and San Romerio, RH fluctuations closely align with the outdoor humidity trends. Elevated RH% values, ranging from 40% to 90%, resulted in San Romerio and Visconti-Venosta Palace, especially during the spring, autumn, and winter seasons, therefore in more than 70% of the year. A difference of approximately 10% exists between the indoor and outdoor environments throughout the year. The result shows a high exchange rate between these two domains. In addition, the highest RH% values during the summer season, ranging from 50% to 87% resulted in San Romerio Church.
Semadeni Palace stands out from the other locations due to its relatively stable RH% levels throughout the year. This stability is likely attributed to the non-utilization of the building, which effectively decreases the exchange of heat and humidity with the external environment, due to the lack of openings and the caution to take the shatters closed for improving the insulating effect. Higher RH% levels during the cold seasons resulted in Besta Palace, primarily resulting from moisture infiltration at the ground level, while lower RH% levels are observed during the warm seasons due to enhanced ventilation and the influx of visitors. These observed patterns shed light on the influence of outdoor climate, building materials, and ventilation on the dynamics of indoor RH% in the absence of central heating. Figure 5a–d represents the internal and external daily average of T°C and RH% in 2022. The absence of active heating systems (expect the case of Besta Palace) or other climate control systems in three of the cases reveals a significant dependency on the outdoor environment for indoor temperature regulation.
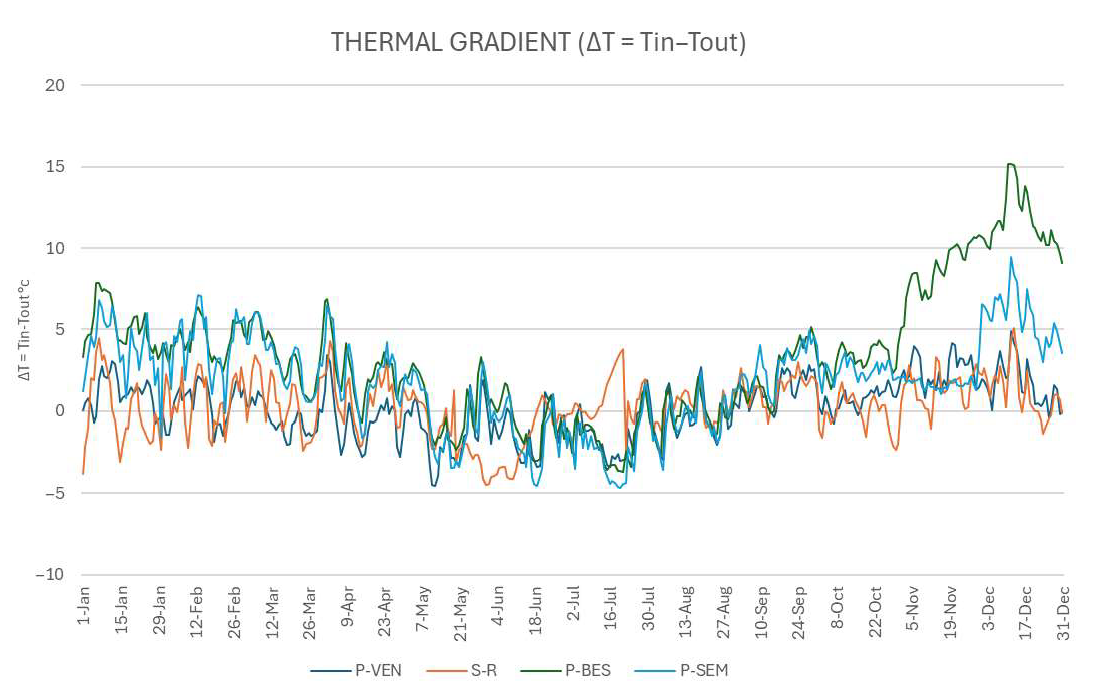
Among the four case studies, only Besta palace was equipped with a heating system causing the widest range among all cases (−3.62 to 15.17 °C), indicating extreme fluctuations that could stress materials through repeated expansion and contraction. The heating period in Besta is from mid-November to the end of January with the highest difference of 15 °C in December. This observation provides valuable insights into how active climate control influences the microclimate of historical structures compared to those relying solely on passive thermal regulation. In contrast, Semadeni Palace shows moderate variability (mean: 2.74, range: −4.63 to 9.43) while Venosta palace and San Romerio display lower means (0.44 and 0.22) and narrower ranges (with some seasonal spikes suggesting periodic thermal shocks). Notably, Besta’s prolonged high phase (November–December) and abrupt drops (May–June) highlight cyclical stress, while San Romerio’s stability (except for winter lows near −4.48) implies fewer but severe cold-phase risks. Figure 6 illustrates the thermal gradient comparison among the case studies. This comparison underscores that risks are not isolated but often synchronized (e.g., concurrent December spikes), necessitating integrated strategies to mitigate compound damage from thermal cycling.

3.1.1. Mixing Ratio (MR)

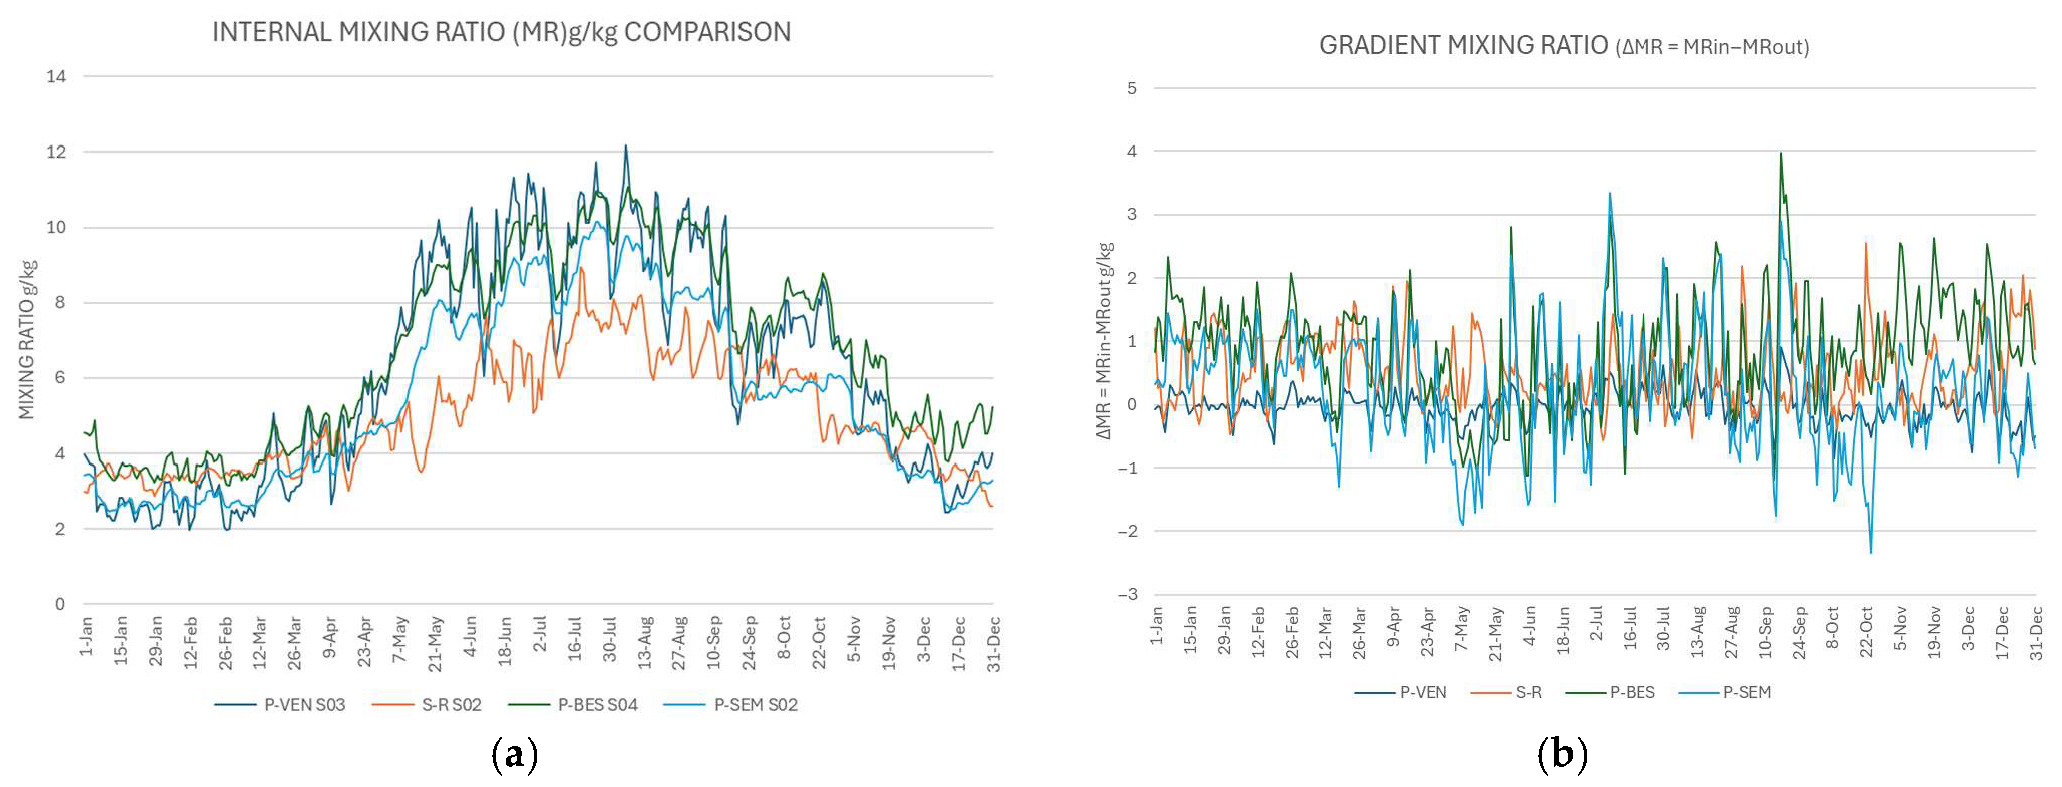
The comparison of mixing ratios across the cases reveals seasonal and event-driven variations, reflecting their distinct architectural and environmental interactions. The internal mixing ratio (MR) data demonstrate pronounced seasonal trends, with elevated values during summer months (June–August) and reduced levels in winter (December–February), consistent with external climatic conditions. Internal MR (Figure 7a) values for Venosta and Besta palace exhibit pronounced peaks during summer (e.g., 11.3 g/kg for Venosta and 10.3 g/kg for Besta in June). Besta palace shows the highest mean MR (~5.85) and peak summer values, suggesting significant moisture retention, likely due to poor ventilation or groundwater infiltration. In contrast, San Romerio demonstrated lower variability but persistent elevated MR (~4.52 mean), possibly due to hygroscopic building materials. Gradient MR comparisons (Figure 7b) further highlighted these differences, with Besta exhibiting the highest mean gradient, reinforcing its susceptibility to moisture accumulation, while Venosta’s near-zero gradient implied balanced ventilation, albeit with occasional anomalies. Gradient MR variability revealed critical anomalies, including negative gradients in Semadeni Palace during winter (e.g., −2.34 in December). These findings highlight the role of microclimate and building design in moisture dynamics, with extreme events (heatwaves, cold snaps) exacerbating MR fluctuations.
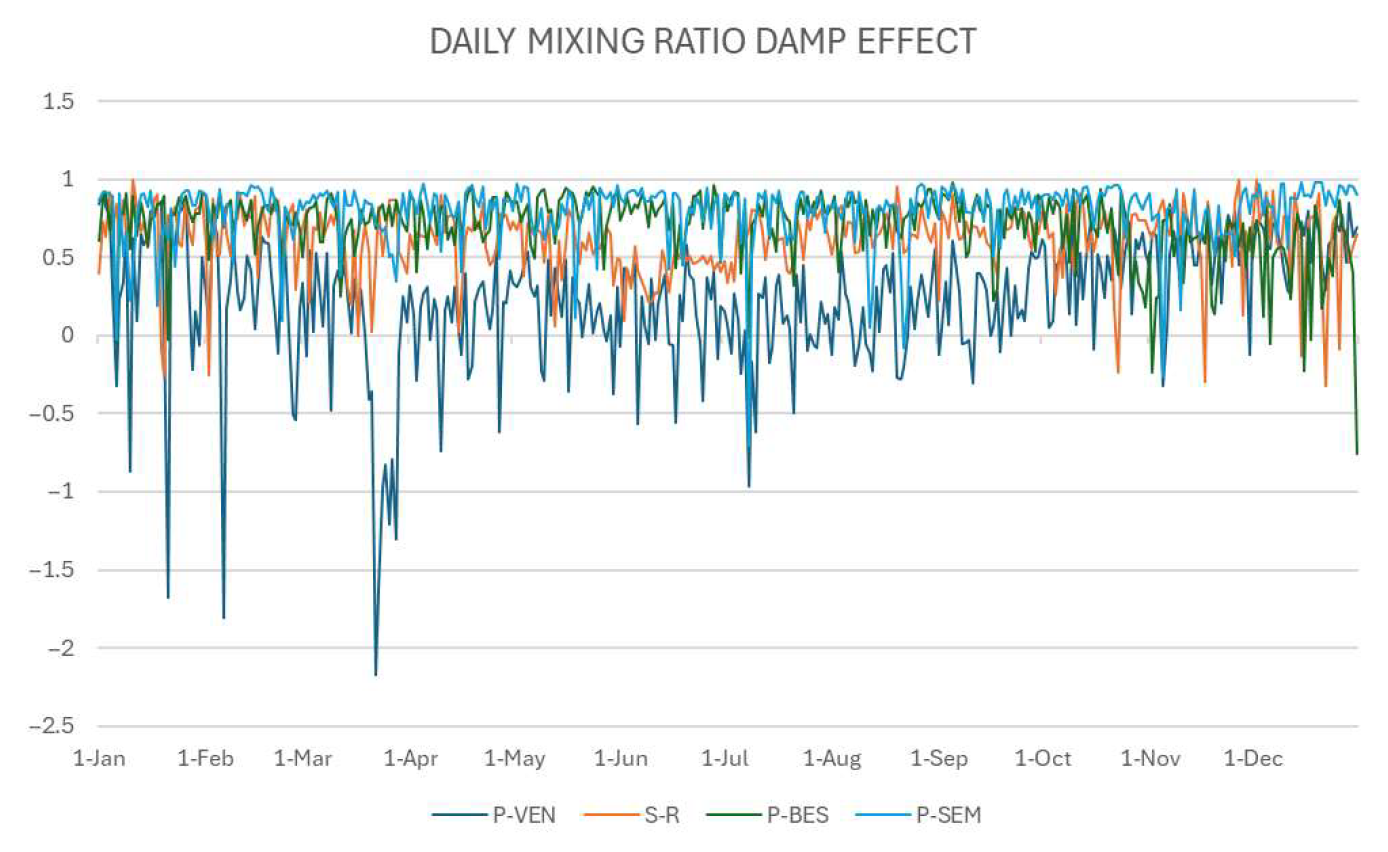
The standard deviation of mixing ratio (MR) is used to quantify the variability in moisture content over time. By comparing the standard deviation of MR inside and outside, 1 − (stdev MR inside/stdev MR outside), the damping effect measures how effectively a material or system reduces indoor moisture fluctuations relative to outdoor conditions (Figure 8). A higher damping effect indicates better hygrothermal buffering, as the indoor MR variability is significantly reduced compared to the outdoors. Venosta palace shows the weakest buffering, with most counts in very low to low damping (89 and 103 days/year, respectively) and minimal high damping (17 days), indicating poor moisture fluctuation control. San Romerio performs better, with moderate (189 days) and high damping (95) dominating, though its distribution is uneven. Besta palace demonstrates strong buffering, with high (194 days) and moderate damp (124 days) as the primary categories, suggesting effective moisture regulation. Semadeni palace excels as the most buffered case, with 278 days counts in high damping and 62 days in moderate damping, highlighting superior hygrothermal stability.

3.1.2. Dew Point Depression (DPD)

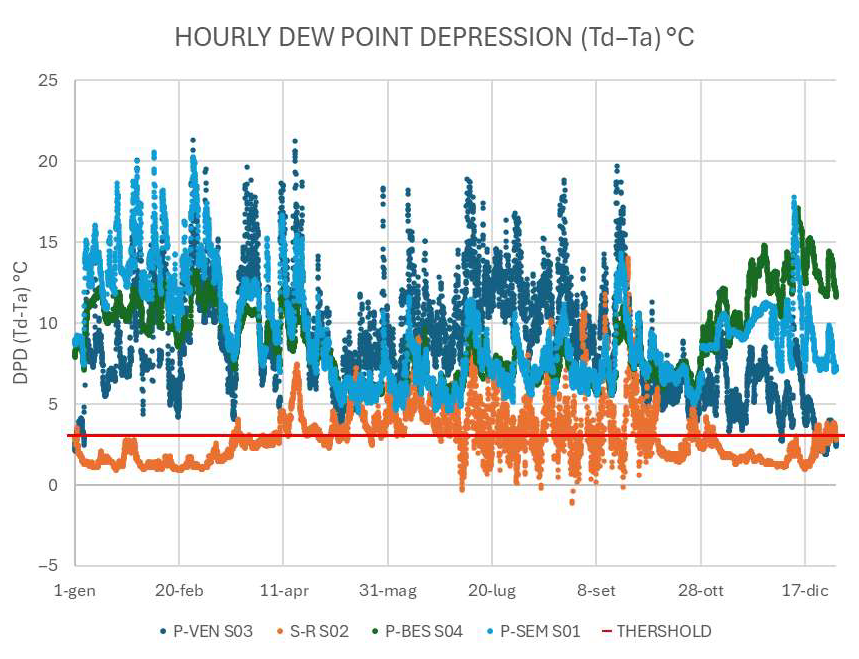
Dew point depression (DPD), the difference between air temperature (T) and dew point temperature (Td-Ta), is critical for microclimate analysis by assessing moisture-related risks that can lead to deterioration. In this study, a dew point depression (DPD) below 3 °C, calculated from annual hourly data, was established as a risk threshold. This criterion accounts for the precision limitations of the datalogger-derived dew point measurements and the heightened moisture sensitivity of pre-damaged surfaces. Figure 9 highlights a striking feature in the case of San Romerio, where nearly half the year, particularly from April to October, is at risk of condensation. This prolonged phase of low DPD suggests a high likelihood of persistent moisture accumulation, which could lead to condensation-related issues such as mold growth or material degradation. In contrast, Venosta Palace (P-VEN S03) shows only sporadic instances of condensation risk, with a brief but notable dip in DPD during December. This isolated event implies that while the building is generally well outside the critical threshold, it may still face short-term moisture challenges during colder months.

3.1.3. Critical T-RH Zones

Studying when moisture risk occurs and how close the microclimate conditions are to condensation, this study applied multiple regression, examining DPD and critical T-RH zones in relation with dry air temperature Ta, RH%, and dew point temperature Td. The critical T-RH condition is described as:
  • High T (above 25 °C) + High RH (above 65%);
  • Fluctuating T around 0 °C + High RH (>65%).
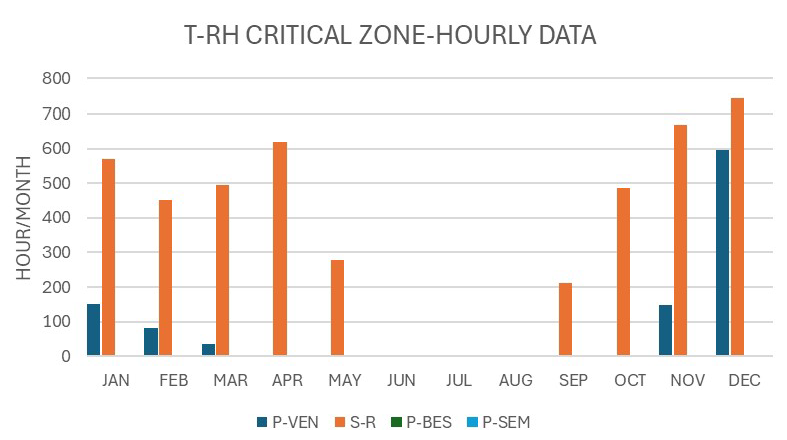
RH levels above 65% significantly increase the likelihood of mold growth, which can threaten the integrity of building materials and cultural artifacts [70,71,72,73]. Elevated temperature and humidity increase mechanical stress, leading to expansion, contraction, and cracking in materials like wood, stone, and masonry, which can compromise structural integrity and widen existing cracks over time [74,75,76]. These conditions also promote chemical degradation, such as corrosion of metals and irreversible chemical changes in stone, as well as increased porosity and water absorption, further weakening materials [77,78,79]. As illustrated in Figure 10, Venosta Palace exhibits criticality in winter (December 80% h–January 20% h) and sporadically in other months, while San Romerio remains critical for most of the year except summer. In contrast, Besta Palace (P-BES) and Semadeni Palace (P-SEM) show no criticality for most of the year. However, during summer months (June–August), both palaces exhibit limited criticality when high RH coincides with temperatures ≥ 20 °C. While 20 °C alone is not inherently risky, the coupling with high RH can still threaten sensitive materials (e.g., wood, frescoes) and previously damaged surfaces.
The multi-regression analysis of DPD in relation to T, RH%, and Td confirms that temperature has the strongest influence on DPD (coefficient: +0.37, p = 0 in case of San Romerio) while RH% alone is not the dominant factor, its impact depends on T and Td.

3.2. Probability Density Function (PDF) Analysis

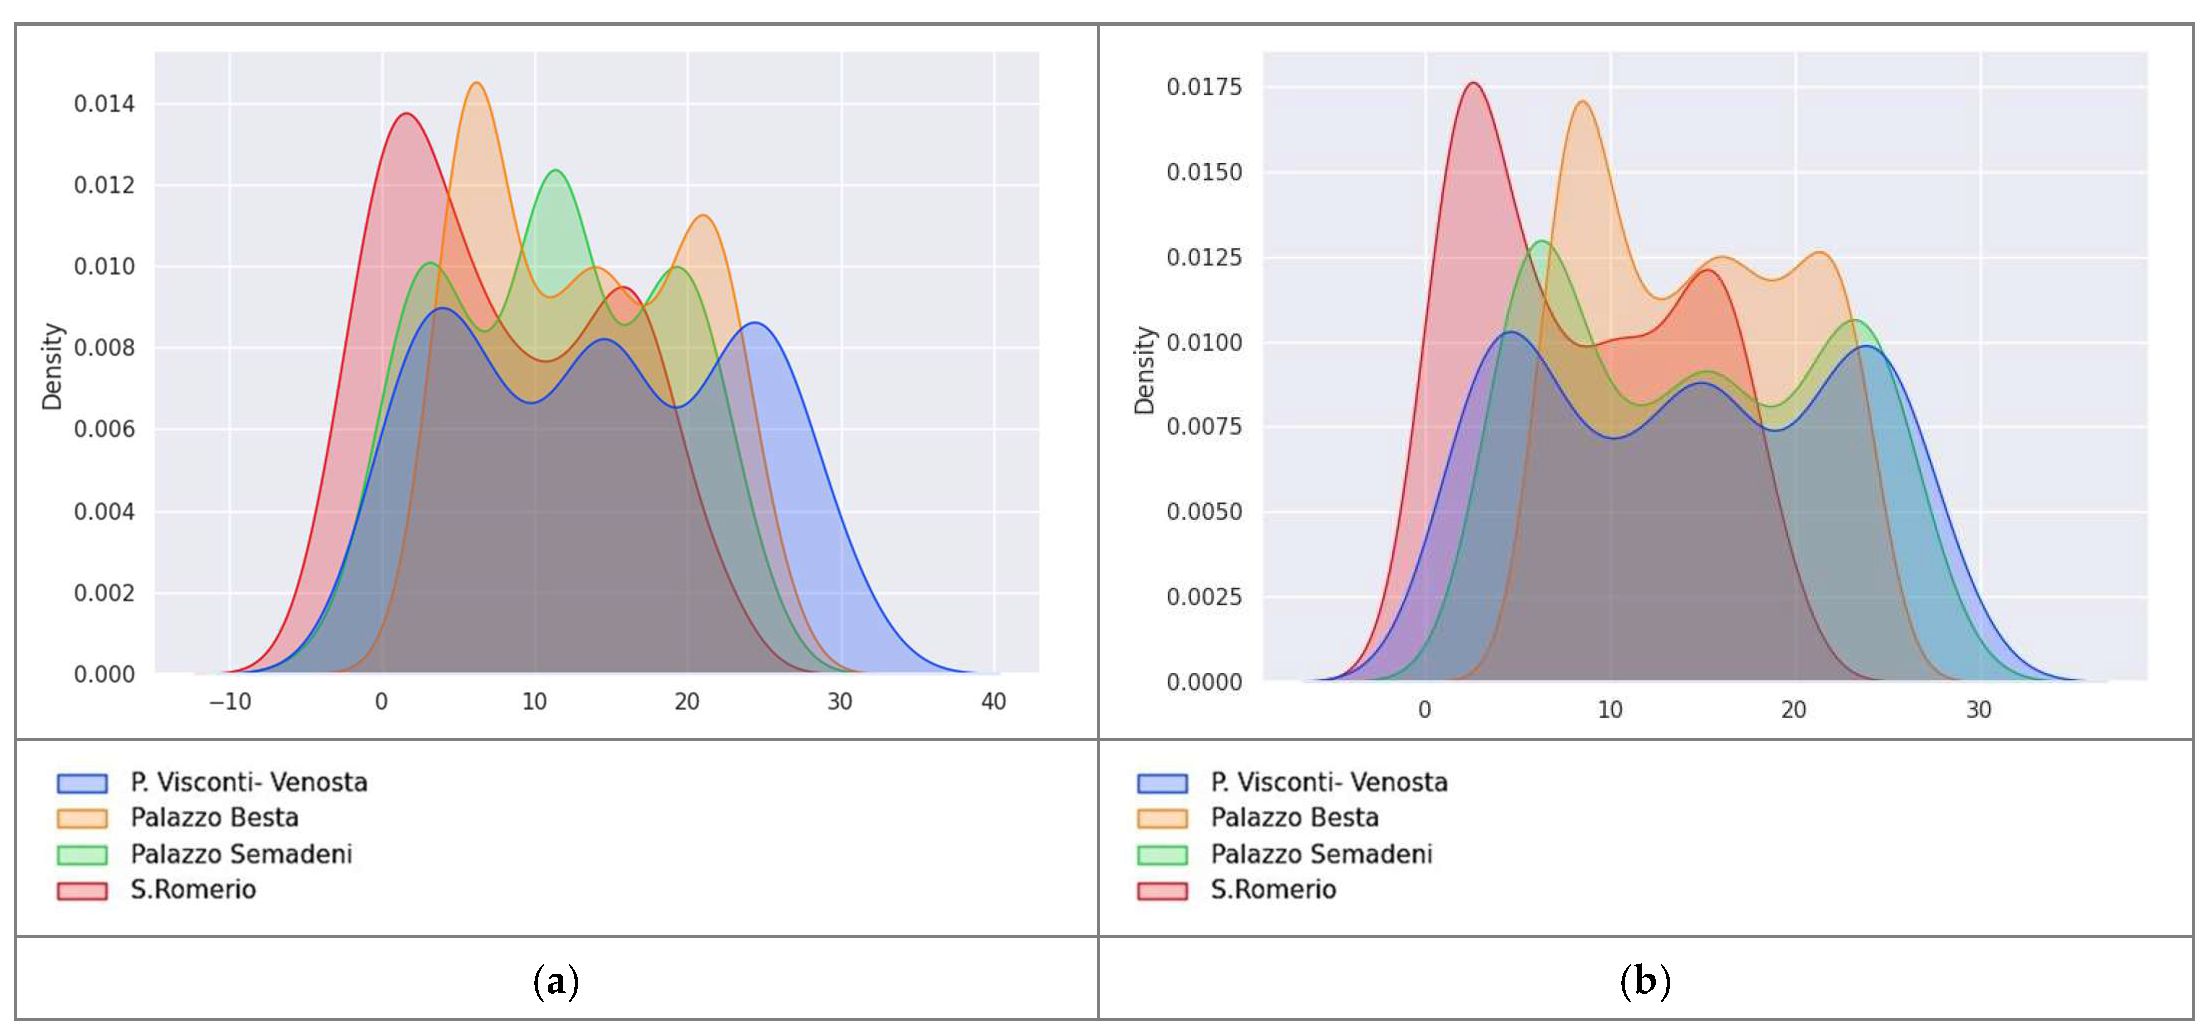
The PDF (Probability Density Function) analysis reveals that all case studies exhibit three peaks in their temperature distributions, indicating a broader temperature range and higher variability in both the indoor and outdoor environments.
Notably, the indoor PDFs mirror the peak trends observed in the outdoor graphs, suggesting a strong influence of external climate conditions on indoor temperature patterns. Among the case studies, San Romerio demonstrates a distinctive bimodal PDF, with two prominent peaks around 0 °C and 16 °C in both the indoor and outdoor data (Figure 11a,b). This bimodal distribution suggests the presence of two distinct climatic conditions or seasons at this location.
When comparing the indoor and outdoor charts, Semadeni Palace stands out as a case where the indoor environment appears less influenced by external factors. Its PDF shows smoother peaks and a more consistent distribution than the outdoor chart, implying a more controlled indoor environment that mitigates the impact of external temperature fluctuations. In contrast, Visconti-Venosta Palace exhibits closer alignment with outdoor temperature peaks, reflecting a stronger influence of external climate on indoor conditions. This suggests that the building’s indoor temperatures closely follow outdoor trends, possibly due to factors such as ventilation design or insufficient insulation.

PDF of the Outdoor and Indoor RH%

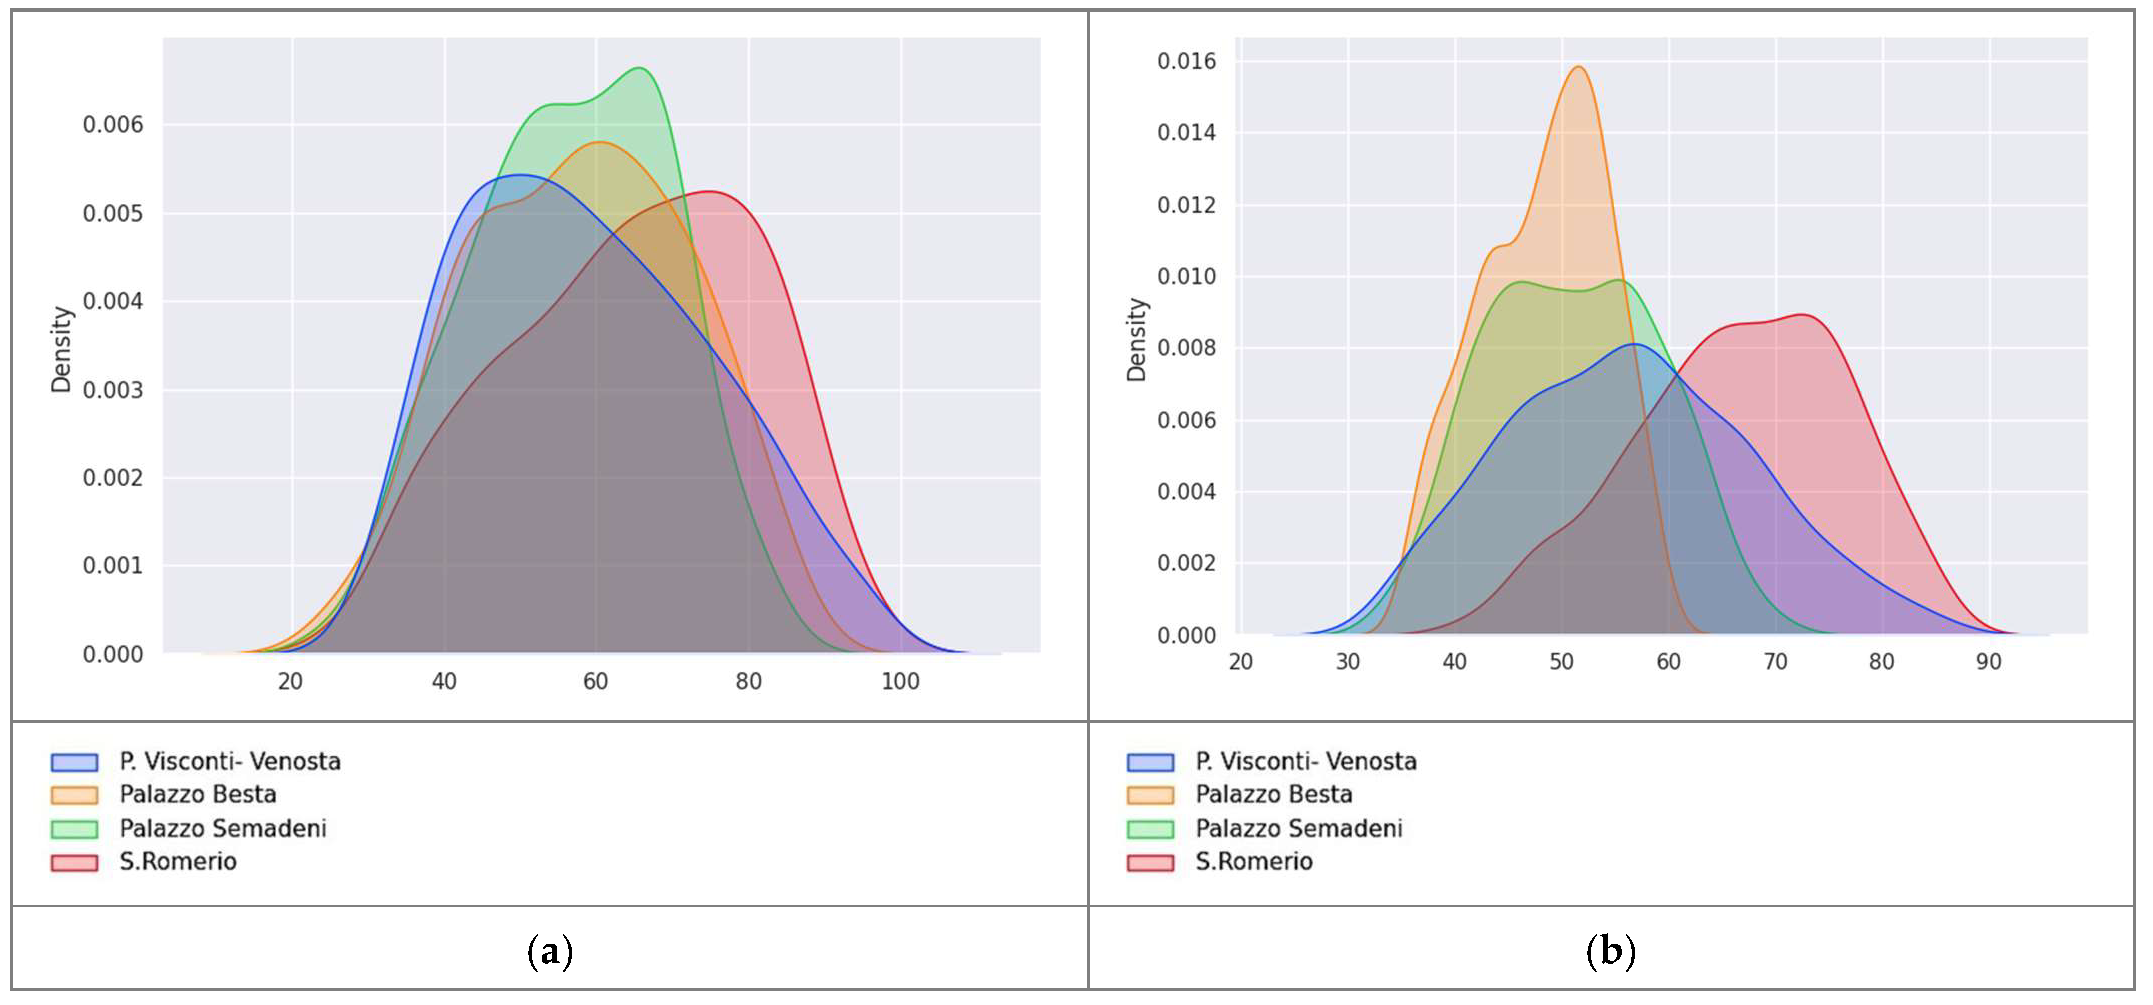
Besta palace shows a bell-shaped PDF curve for both indoor and outdoor RH%, with a prominent peak around 60% of RH% for the outdoors and 52% of RH% for the indoors (Figure 12a,b). This distribution implies a higher probability of encountering moderate humidity levels consistently throughout the year, indicating a relatively balanced distribution of high and low humidity days in this location. In contrast, San Romerio church exhibits a left-skewed PDF graph. Most data points are clustered towards higher Relative Humidity values for both outdoor and indoors, ranging between 60% and 80%. This skewness indicates a prevalence of humid conditions within this area, with a smaller occurrence of lower humidity days.
Visconti-Venosta palace exhibits a right-skewed PDF graph for the outdoor RH%, and a relatively flat-shaped curve, reflecting a uniform distribution of RH% values for the indoor environment. The PDF for the indoor RH% curve peaks around 55% RH, with frequent values observed between 45% and 65% RH.
Lastly, Semadeni palace displays a PDF graph for the outdoor conditions with frequent values between 40 and 80% of RH%, while the indoor graph for RH% showcases a rectangular shape. The distribution of Relative Humidity values appears relatively uniform across the year for the indoor environment, with frequent occurrences between 35% and 65% RH. These values fall within the accepted range for conservation purposes, indicating a relatively stable and acceptable humidity profile throughout the year.
Overall, the comparison between indoor and outdoor PDFs for RH in the four case study buildings showcases the dynamic interplay between external climatic influences and internal factors that shape the indoor microclimate. Understanding these patterns is crucial for implementing effective climate control and preservation strategies.

4. Discussion

This study presents a comprehensive analysis of microclimatic conditions in four Alpine heritage buildings, integrating long-term monitoring, statistical analysis, and non-destructive techniques to assess moisture-related risks. The findings highlight the critical influence of altitude, building use, and material properties on indoor microclimate stability, offering new insights into conservation strategies for high-altitude heritage sites.
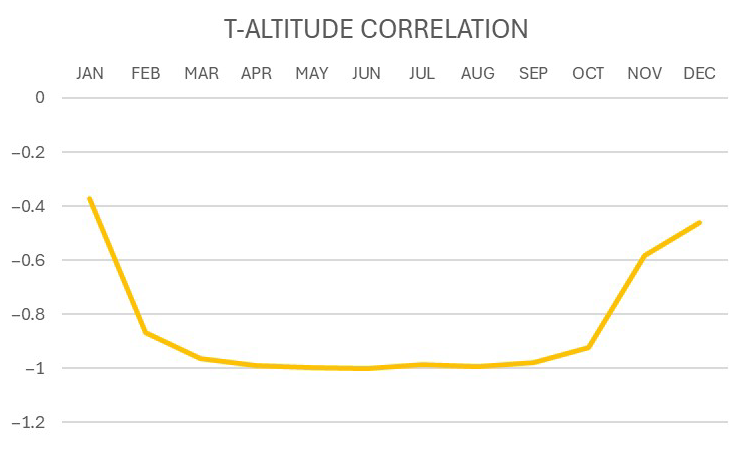
The graph of outdoor temperature (°C) and its annual correlation matrix (Figure 13) clearly reveals a strong relationship between temperature and altitude in the Alpine region. This correlation primarily stems from the well-documented lapse rate effect, where air temperature decreases with increasing elevation, a defining characteristic of mountainous climates. Additionally, the studied Alpine sites exhibited consistent weather systems and atmospheric conditions across different altitudes during the monitoring period. Regional factors such as solar exposure, valley orientation, and wind patterns further reinforced this thermal coherence, though occasional microclimate variations, like temperature inversions, introduced localized deviations. Moderate to weak correlation of T and altitude occurred in winter (November to January) when other factors (temperature inversions, cloud cover, or snow albedo) can disrupt the typical lapse rate. Ultimately, altitude emerged as the dominant driver of temperature distribution, despite secondary influences from terrain and weather dynamics.
The study revealed significant differences in microclimate stability based on building function patterns. Unoccupied buildings such as Visconti-Venosta and Semadeni Palaces exhibited more stable indoor conditions, with Semadeni Palace maintaining a consistent relative humidity range of 35–65%. This stability can be attributed to minimal air exchange resulting from reduced human activity, which effectively limits both moisture ingress and thermal fluctuations. In contrast, seasonally occupied buildings like San Romerio Church and Besta Palace demonstrated higher microclimate variability. Besta Palace, which experiences intermittent heating and visitor traffic, showed sharp seasonal RH% fluctuations, dropping to 32% in summer and peaking at 67% in winter. Despite its infrequent use, San Romerio Church maintained prolonged high humidity levels (60–80% RH) due to inadequate ventilation. Buildings with active climate control systems, such as Besta Palace’s heating, exhibited the most pronounced thermal fluctuations, with temperature differentials reaching 15 °C, confirming that improperly managed mechanical interventions can significantly exacerbate microclimate stress on heritage materials.
Material properties played an equally critical role in moderating indoor microclimates. While all case studies featured stone masonry construction, variations in wall thickness, insulation, and surface treatments resulted in distinct moisture buffering capacities. San Romerio Church’s exposed stone walls facilitated rapid thermal exchange with the exterior environment, leading to frequent condensation events (dew point depression < 3 °C for 50% of the year). In comparison, Besta Palace’s plastered interiors demonstrated better humidity regulation, maintaining RH% between 32 and 67%. Visconti-Venosta Palace’s unmaintained frescoed rooms experienced extreme RH% spikes (90–100%), illustrating how material degradation can amplify microclimate risks. These findings underscore the importance of considering both occupancy patterns and material characteristics when developing conservation strategies for heritage buildings.
While this study provides comprehensive microclimate data for Alpine heritage sites, several limitations should be noted. Material heterogeneity, particularly in salt-laden or previously repaired masonry, complicates threshold calibration, requiring case-specific adjustments. Short-term moisture events, such as rain-driven infiltration, were not fully captured in annual averages, suggesting event-based analysis could improve detection sensitivity. Additionally, while microclimate conditions were thoroughly documented, direct correlations with material degradation rates were not established; a limitation that could be addressed through further statistical validation and complementary tests (e.g., gravimetric analysis, surface temperature mapping). However, such methods were beyond the scope of this research, which primarily aimed to characterize the unique microclimate patterns of Alpine heritage buildings as a foundational step for future conservation studies.

5. Conclusions

This study’s primary innovation lies in addressing the significant knowledge gap regarding microclimate conditions in Alpine heritage buildings. This analysis contributes to our understanding of the complex interplay between altitude and temperature in Alpine environments and has implications for best practices in conserving historical building materials. The techniques for improving insulation and reducing indoor fluctuations often derive from traditional knowledge inherited from past inhabitants of the studied buildings. These practices can be summarized as follows:
  • Prevent moisture intrusion into the structure from both the upper and lower levels of the building.
  • Protect openings with shutters or other systems to minimize fluctuations caused by external weather changes.
  • Avoid damage through continuous care and maintenance, prioritizing responsible, compatible, and sustained use of the building.
  • Research historical techniques, materials, and habits that could enhance the physical conservation of structures and materials. Any new interventions should be rigorously tested and documented at the local scale before implementation. In many cases, unwritten sources, such as oral traditions or empirical knowledge, are equally important for documenting problem-solving techniques that remain the most sustainable and effective for conservation purposes.
Environmental/interior monitoring is confirmed to be one of the main tools for the evaluation and diagnosis of historical buildings and cultural heritage sites where the weather conditions can be as severe as they are in Alpine mountains. The obtained results are fundamental for planning and directing the conservation and restoration both of historical buildings and the contained objects.
Several questions remain unanswered, shaping the potential focus of future research. One inquiry involves exploring whether the lack of use, and consequently the absence of updates to any heating plant, exacerbates the state of conservation in a damaged structure. Additionally, when heating is employed, it is crucial to ascertain whether it adversely affects conservation only in the presence of thermos-hygrometric imbalance or if pre-existing damage occurs.
In the latter scenario, it becomes imperative to understand how and where it is most convenient to mitigate this imbalance to prevent further damage, especially when restoration is not a feasible option.
Ongoing research is currently addressing and investigating these questions from various perspectives, including sustainability, retrofitting, and addressing overheating issues during climate change. Now, more than ever, it is required to expand and disseminate the existing comprehensive debate for facing the challenges posed by the transformation of the built environment in the Alps and to multiply the purposes of further research in this area.

Author Contributions

Conceptualization, E.R., M.Z. and A.A.; methodology, E.R.; software, M.Z., A.A. and H.E.T.; validation, E.R., M.Z., A.A. and H.E.T.; formal analysis, M.Z. and A.A.; investigation, E.R., M.Z. and A.A.; resources, E.R.; data curation, M.Z. and A.A.; writing—original draft preparation, M.Z. and A.A.; writing—review and editing, E.R. and H.E.T.; visualization, M.Z., A.A. and H.E.T.; supervision, E.R.; project administration, E.R.; funding acquisition, E.R. All authors have read and agreed to the published version of the manuscript.

Funding

This research was funded within the activities of the ConValoRe project (Interreg) funded under the Interreg programme grant contract ConValore—ID639237—Interreg V-A Ita-Ch 1 July 2020.

Data Availability Statement

The authors gathered the data within the EU project ConValore. As Politecnico di Milano has been a partner of the project, the data are preserved in the Politecnico archives, according to the privacy agreement among the partners.

Conflicts of Interest

The corresponding authors declare that there is no conflict of interest.

Appendix A

HOBO MX1104, HOBO U12-013, and Lascar EL-USB-2+ are precision dataloggers designed for microclimate monitoring in heritage conservation. The MX1104 offers high-resolution temperature (±0.2 °C) and humidity (±2.5%) measurements with minimal drift, while the U12-013 provides robust performance with ±0.35 °C temperature accuracy. The Lascar EL-USB-2+ features an extended temperature range (35 °C to 80 °C) and compact design, suitable for long-term environmental monitoring.
Table A1. Technical Specifications of Microclimate Monitoring Devices.
ParameterHOBO MX1104HOBO U12-013Lascar EL-USB-2+
Temperature
Range−20 °C to 70 °C (−4 °F to 158 °F)−20 °C to 70 °C (−4 °F to 158 °F)−35 °C to 80 °C (−31 °F to 176 °F)
Accuracy±0.20° C (0 °C to 50 °C)/±0.36 °F (32 °F to 122 °F)±0.35 °C (0 °C to 50 °C)/±0.63 °F (32 °F to 122 °F)±0.45 °C typical (5 °C to 60 °C)/±1.04 °F
Resolution0.002 °C at 25 °C (0.004 °F at 77 °F)0.03 °C at 25 °C (0.05 °F at 77 °F)0.5 °C (1 °F) internal resolution
Long-term Drift<0.1 °C/year (0.18 °F/year)±1 min/month (time accuracy at 25 °C/77 °F)<0.02 °C/year (0.04 °F/year)
Relative Humidity (RH)
Range0% to 100% (−20 °C to 70 °C)5% to 95% RH0% to 100% RH
Accuracy±2.5% (10–90% RH, typical), max ±3.5%
(incl. hysteresis at 25 °C/77 °F); ±5% (<10% or >90% RH)
±2.5% (10–90% RH, typical), max ±3.5%
(incl. hysteresis); ±5% (<10% or >90% RH)
±3% (20–80% RH)
Resolution0.01%0.05%0.5% RH internal resolution
Long-term Drift<1%/year (typical)<0.25% RH/year
Additional NotesExposure >95% RH may temporarily increase max error by +1%. Operating range: −20 °C to 70 °C. Radio power: 1 mW (0 dBm).Dew point accuracy (total error): 1.7 °C typical (−35 °C to 80 °C, 40–100% RH).
Response Time
Temperature11 min (90% in moving air at 1 m/s)6 min (90% in moving air at 1 m/s)
RH30 s (90% in moving air at 1 m/s)1 min (90% in moving air at 1 m/s)
Data Capacity16,382 readings (T/RH)

References

  1. Mazzadi, F.; Lab, C. Towards the regeneration of mountain tourism territories. Insights from the Alta Valtellina region. Riv. Geogr. Ital. 2024, 22, 114–131. [Google Scholar]
  2. Berro, D.C. Le Alpi nel 2050: Clima e territorio. Arch. Alp. 2023, 9, 1–15. [Google Scholar]
  3. Spiridonov, V.; Ćurić, M.; Novkovski, N. The New Era of Environmental Monitoring: Insights into Weather, Water, and Climate. Atmos. Perspect. 2025, 1, 401–443. [Google Scholar]
  4. Xu, H.; Duan, Y.; Xu, X. Exploring the integration of a global AI model with traditional data assimilation in weather forecasting. Environ. Res. Lett. 2024, 19, 124079. [Google Scholar] [CrossRef]
  5. World Meteorological Organization (WMO). Manual on Codes. Available online: https://library.wmo.int/idurl/4/35713 (accessed on 23 June 2025).
  6. Fatorić, S.; Seekamp, E. Are cultural heritage and resources threatened by climate change? A systematic literature review. Clim. Chang. 2017, 142, 227–254. [Google Scholar] [CrossRef]
  7. Palazzi, E.; von Hardenberg, J.; Terzago, S.; Provenzale, A. Precipitation in the Karakoram-Himalaya: A CMIP5 view. Clim. Dyn. 2015, 45, 21–45. [Google Scholar] [CrossRef]
  8. Rangwala, I.; Palazzi, E.; Miller, J.R. Projected Climate Change in the Himalayas during the Twenty-First Century. In Himalayan Weather and Climate and Their Impact on the Environment; Springer: Cham, Switzerland, 2020; pp. 51–71. [Google Scholar]
  9. Rosina, E.; Zala, M. The microclimates unbalance of subterrain historic spaces in Italy. In Proceedings of the Conference on Cultural Heritage, Milan, Italy, 20-22 September 2023; pp. 247–252. [Google Scholar]
  10. Rosina, E.; Zala, M.; Ammendola, A. The moisture issue affecting the historical buildings in the Po valley. In Proceedings of the Heritage Conservation Symposium, Trieste, Italy, 15 June 2023; pp. 285–290. [Google Scholar]
  11. Rose Marco, D.; Caccamo, M.T.; Casale, F.; Bocchiola, D. Climate Change Effects upon Pasture in the Alps: The Case of Valtellina Valley, Italy. Climate 2022, 10, 173. [Google Scholar] [CrossRef]
  12. Bonari, G.; Bricca, A.; Tomasi, G.; Dorigatti, L.; Bertolli, A.; Andreatta, D.; Sabatini, F.M.; Di Musciano, M.; Prosser, F. Grassland Changes in the Eastern Alps Over Four Decades: Unveiling Patterns Along an Elevation Gradient. Appl. Veg. Sci. 2025, 28, e70012. [Google Scholar] [CrossRef]
  13. Cacciotti, R.; Sardella, A.; Drdácký, M.; Bonazza, A. A Methodology for Vulnerability Assessment of Cultural Heritage in Extreme Climate Changes. Int. J. Disaster Risk Sci. 2024, 15, 404–420. [Google Scholar] [CrossRef]
  14. Choidis, P.; Coelho, G.B.A.; Kraniotis, D. Assessment of frost damage risk in a historic masonry wall due to climate change. Adv. Geosci. 2023, 58, 157–175. [Google Scholar] [CrossRef]
  15. Cavargna-Sani, M.; Epard, J.L.; Steck, A. Structure, geometry and kinematics of the northern Adula nappe (Central Alps). Swiss J. Geosci. 2014, 107, 135–156. [Google Scholar] [CrossRef]
  16. Klostermann, J.; van de Sandt, K.; Harley, M.; Hildén, M.; Leiter, T.; van Minnen, J.; Pieterse, N.; van Bree, L. Towards a framework to assess, compare and develop monitoring and evaluation of climate change adaptation in Europe. Mitig. Adapt. Strateg. Glob. Chang. 2018, 23, 187–209. [Google Scholar] [CrossRef] [PubMed]
  17. Mahdjoubi, L.; Hawas, S.; Fitton, R.; Dewidar, K.; Nagy, G.; Marshall, A.; Alzaatreh, A.; Abdelhady, E. A Guide for Monitoring the Effects of Climate Change on Heritage Building Materials and Elements. Available online: https://uwe-repository.worktribe.com/output/882571 (accessed on 23 June 2025).
  18. Elmi, M. The Alps in 25 Maps; Permanent Secretariat of the Alpine Convention: Innsbruck, Austria, 2018. [Google Scholar]
  19. Interreg Alpine Space Programme—Alpine Space Programme. Available online: https://www.alpine-space.eu/ (accessed on 23 June 2025).
  20. Progetti Finanziati. Available online: https://www.interreg-italiasvizzera.eu/wps/portal/site/interreg-italia-svizzera/progetti/progetti-finanziati (accessed on 19 July 2025).
  21. Sardella, A.; Palazzi, E.; von Hardenberg, J.; Del Grande, C.; De Nuntiis, P.; Sabbioni, C.; Bonazza, A. Risk Mapping for the Sustainable Protection of Cultural Heritage in Extreme Changing Environments. Atmosphere 2020, 11, 700. [Google Scholar] [CrossRef]
  22. Padeletti, G. Heritage Resilience Against Climate Events on Site—HERACLES Project: Mission and Vision. In Communications in Computer and Information Science; Springer: Cham, Switzerland, 2019; Volume 961, pp. 360–375. [Google Scholar]
  23. Kalamees, T.; Väli, A.; Kurik, L.; Napp, M.; Arümagi, E.; Kallavus, U. The influence of indoor climate control on risk for damages in naturally ventilated historic churches in cold climate. Int. J. Archit. Herit. 2016, 10, 486–498. [Google Scholar] [CrossRef]
  24. Sciurpi, F.; Carletti, C.; Cellai, G.; Pierangioli, L. Environmental monitoring and microclimatic control strategies in ‘La Specola’ museum of Florence. Energy Build. 2015, 95, 190–201. [Google Scholar] [CrossRef]
  25. Aste, N.; Adhikari, R.; Buzzetti, M.; Della Torre, S.; Del Pero, C.; Huerto, H.E.; Leonforte, F. Microclimatic monitoring of the Duomo (Milan Cathedral): Risks-based analysis for the conservation of its cultural heritage. Build. Environ. 2019, 148, 240–257. [Google Scholar] [CrossRef]
  26. Bonazza, A.; Sardella, A. Climate Change and Cultural Heritage: Methods and Approaches for Damage and Risk Assessment Addressed to a Practical Application. Heritage 2023, 6, 3578–3589. [Google Scholar] [CrossRef]
  27. Sesana, E.; Gagnon, A.S.; Bonazza, A.; Hughes, J.J. An integrated approach for assessing the vulnerability of World Heritage Sites to climate change impacts. J. Cult. Herit. 2020, 41, 211–224. [Google Scholar] [CrossRef]
  28. Andretta, M.; Coppola, F.; Seccia, L. Investigation on the interaction between the outdoor environment and the indoor microclimate of a historical library. J. Cult. Herit. 2016, 17, 75–86. [Google Scholar] [CrossRef]
  29. Leissner, J.; Kilian, R.; Kotova, L.; Jacob, D.; Mikolajewicz, U.; Brostrom, T.; Ashley-Smith, J.; Schellen, H.L.; Martens, M.; Van Schijndel, J.; et al. Climate for culture: Assessing the impact of climate change on the future indoor climate in historic buildings using simulations. Herit. Sci. 2015, 3, 38. [Google Scholar] [CrossRef]
  30. Haugen, A.; Bertolin, C.; Leijonhufvud, G.; Olstad, T.; Broström, T. A Methodology for Long-Term Monitoring of Climate Change Impacts on Historic Buildings. Geosciences 2018, 8, 370. [Google Scholar] [CrossRef]
  31. Rosina, E.; Zala, M.; Ammendola, A. The moisture issue affecting the historical buildings in the Alps region. In Proceedings of the NDT Conference, Brescia, Italy, 28–30 November 2023; Available online: https://www.ndt.net/?id=28944 (accessed on 23 June 2025).
  32. Rosina, E.; Zala, M.; Pecoraro, I.; Romoli, E.; Pili, A. Il ruolo del monitoraggio microclimatico per la conservazione del patrimonio storico diffuso, dalle Alpi al Mediterraneo. In Restauro Dell’architettura. Per un Progetto di Qualità; SIRA: Napoli, Italy, 2023. [Google Scholar]
  33. Ludwig, N.; Rosina, E.; Sansonetti, A. Evaluation and monitoring of water diffusion into stone porous materials by means of innovative IR thermography techniques. Measurement 2018, 118, 348–353. [Google Scholar] [CrossRef]
  34. Thickett, D. Comparison of Environmental Control Strategies for Historic Buildings. Stud. Conserv. 2020, 65, 314–320. [Google Scholar] [CrossRef]
  35. UNEP; Adger, N.; Aggarwal, P.; Agrawala, S.; Alcamo, J.; Allali, A.; Anisimov, O.; Arnell, N.; Boko, M.; Canziani, O.; et al. Climate Change 2007: Impacts, Adaptation and Vulnerability. Available online: https://msuweb.montclair.edu/~lebelp/PSC643IntPolEcon/IPCCClimateChange2007.pdf (accessed on 26 February 2025).
  36. Huerto-Cardenas, H.E.; Aste, N.; Del Pero, C.; Della Torre, S.; Leonforte, F. Effects of Climate Change on the Future of Heritage Buildings: Case Study and Applied Methodology. Climate 2021, 9, 132. [Google Scholar] [CrossRef]
  37. Melada, J. Microclimate and Heritage Conservation: Probabilistic Damage Functions as Risk Assessment Tools. Available online: https://air.unimi.it/handle/2434/1070048 (accessed on 23 June 2025).
  38. Urbina Leonor, L.M.; Echeverría, R.S.; Perez, N.A.; Vega, E.; Kahl, J.D.W.; Murillo, M.S.; Ayala, R.S. Importance of Atmospheric Sciences in Stone Heritage Conservation Study in Italy and Mexico. Sustainability 2023, 15, 5321. [Google Scholar] [CrossRef]
  39. Isaksson, T.; Thelandersson, S.; Ekstrand-Tobin, A.; Johansson, P. Critical conditions for onset of mould growth under varying climate conditions. Build. Environ. 2010, 45, 1712–1721. [Google Scholar] [CrossRef]
  40. Loli, A.; Bertolin, C. Indoor Multi-Risk Scenarios of Climate Change Effects on Building Materials in Scandinavian Countries. Geosciences 2018, 8, 347. [Google Scholar] [CrossRef]
  41. Lisø, K.R.; Hygen, H.O.; Kvande, T.; Thue, J.V. Decay potential in wood structures using climate data. Build. Res. Inf. 2006, 34, 546–551. [Google Scholar] [CrossRef]
  42. Grøntoft, T. Observed Recent Change in Climate and Potential for Decay of Norwegian Wood Structures. Climate 2019, 7, 33. [Google Scholar] [CrossRef]
  43. Rosina, E. When and how reducing moisture content for the conservation of historic building. A problem solving view or monitoring approach? J. Cult. Herit. 2018, 31, S82–S88. [Google Scholar] [CrossRef]
  44. Kaslegard, A.S. Climate Change and Cultural Heritage in the Nordic Countries; Nordic Council of Ministers: Copenhagen, Denmark, 2011. [Google Scholar]
  45. Barreira, E.; Almeida, R.M.S.F. IRT Versus Moisture: In Situ Tests in Indoor Environment. In SpringerBriefs in Applied Sciences and Technology; Springer: Cham, Switzerland, 2019; pp. 43–51. [Google Scholar]
  46. UNI. UNI 10829:1999—Beni di Interesse Storico e Artistico—Condizioni Ambientali di Conservazione—Misurazione ed Analisi. Available online: https://store.uni.com/uni-10829-1999 (accessed on 23 June 2025).
  47. UNI. UNI 11085:2003—Cultural Heritage—Natural and Artificial Stones—Moisture Content Determination: Gravimetric Method. Available online: https://store.uni.com/en/uni-11085-2003 (accessed on 23 June 2025).
  48. UNI. UNI EN 13187:2000—Prestazione Termica Degli Edifici—Rivelazione Qualitativa Delle Irregolarità Termiche Negli Involucri Edilizi—Metodo All’infrarosso. Available online: https://store.uni.com/uni-en-13187-2000 (accessed on 23 June 2025).
  49. UNI. UNI EN 16714-1:2016—Prove non Distruttive—Prove Termografiche—Parte 1: Principi Generali. Available online: https://store.uni.com/uni-en-16714-1-2016 (accessed on 23 June 2025).
  50. ASHRAE. ASHRAE Guideline 34-2019, Energy Guideline for Historic Buildings. Available online: https://www.ashrae.org/about/news/2019/ashrae-publishes-new-guideline-on-energy-efficiency-for-historic-buildings (accessed on 23 June 2025).
  51. UNI. UNI EN 15757:2010—Conservazione dei Beni Culturali—Specifiche Concernenti la Temperatura e L’umidità Relativa per Limitare I Danni Meccanici Causati dal Clima ai Materiali Organici Igroscopici. Available online: https://store.uni.com/uni-en-15757-2010 (accessed on 23 June 2025).
  52. Pretelli, M.; Fabbri, K. Historic Indoor Microclimate of the Heritage Buildings; Springer: Cham, Switzerland, 2018. [Google Scholar]
  53. Franzoni, E. Rising damp removal from historical masonries: A still open challenge. Constr. Build. Mater. 2014, 54, 123–136. [Google Scholar] [CrossRef]
  54. Bison, P.; Cadelano, G.; Capineri, L.; Capitani, D.; Casellato, U.; Faroldi, P.; Grinzato, E.; Ludwig, N.; Olmi, R.; Priori, S.; et al. Limits and advantages of different techniques for testing moisture content in masonry. Mater. Eval. 2011, 69, 111–116. [Google Scholar]
  55. Rosina, E.; Ludwig, N.; Della Torre, S.; D’Ascola, S.; Sotgia, C.; Cornale, P. Thermal and Hygroscopic Characteristics of Restored Plasters with Different Surface Textures. Mater. Eval. 2016, 66, 1271–1278. [Google Scholar]
  56. Sansonetti, A.; Casati, M.; Rosina, E.; Gerenzani, F.; Gondola, M.; Ludwig, N. Contribution of IR Thermography to the Performance Evaluation of Water Repellent Treatments. Restor. Build. Monum. 2012, 18, 13–22. [Google Scholar] [CrossRef]
  57. UNI 10586:1997; Beni Culturali—Condizioni Climatiche per Ambienti di Conservazione di Documenti Grafici e Caratteristiche Degli Involucri. Ente Nazionale Italiano di Unificazione (UNI): Milano, Italy, 1997.
  58. UNI 10969:2002; Beni Culturali—Materiali Lapidei Naturali ed Artificiali—Descrizione della Forma di Alterazione—Termini e Definizioni. Ente Nazionale Italiano di Unificazione (UNI): Milano, Italy, 2002.
  59. UNI 9252:1988; Isolamento Termico. Rilievo e Analisi Qualitativa delle Irregolarità Termiche negli Involucri Degli Edifici. Metodo della Termografia All’infrarosso. Ente Nazionale Italiano di Unificazione (UNI): Milano, Italy, 1988.
  60. Ricci, M.; Laureti, S.; Malekmohammadi, H.; Sfarra, S.; Melis, M.; Agresti, G.; Lanteri, L.; Colantonio, C.; Calabro, G.; Pelosi, C. Multi-spectral and Thermography Imaging Techniques for the Investigation of a 15th Century Wall Painting. Res. Sq. 2020. [Google Scholar] [CrossRef]
  61. Nguyen, J.L.; Schwartz, J.; Dockery, D.W. The relationship between indoor and outdoor temperature, apparent temperature, relative humidity, and absolute humidity. Indoor Air 2014, 24, 103–112. [Google Scholar] [CrossRef]
  62. Coley, D.; Kershaw, T. Changes in internal temperatures within the built environment as a response to a changing climate. Build. Environ. 2010, 45, 89–93. [Google Scholar] [CrossRef]
  63. Rosina, E.; Sansonetti, A. San Rocco Church: A Typical Ancient Structure in Northern Italy. Mater. Eval. 2011, 69, 32–40. [Google Scholar]
  64. Phillips, H. The capacity to adapt to climate change at heritage sites—The development of a conceptual framework. Environ. Sci. Policy 2015, 47, 118–125. [Google Scholar] [CrossRef]
  65. Carroll, P.; Aarrevaara, E. Review of Potential Risk Factors of Cultural Heritage Sites and Initial Modelling for Adaptation to Climate Change. Geosciences 2018, 8, 322. [Google Scholar] [CrossRef]
  66. Forino, G.; MacKee, J.; von Meding, J. A proposed assessment index for climate change-related risk for cultural heritage protection in Newcastle (Australia). Int. J. Disaster Risk Reduct. 2016, 19, 235–248. [Google Scholar] [CrossRef]
  67. Franzoni, E.; Berk, B.; Bassi, M.; Marrone, C. An integrated approach to the monitoring of rising damp in historic brick masonry. Constr. Build. Mater. 2023, 370, 130631. [Google Scholar] [CrossRef]
  68. Monteith, J.L.; Unsworth, M.H. Properties of Gases and Liquids. In Principles of Environmental Physics; Academic Press: Cambridge, MA, USA, 2013; pp. 5–23. [Google Scholar]
  69. Camuffo, D. Humidity and Conservation. In Microclimate for Cultural Heritage; Elsevier: Amsterdam, The Netherlands, 2014; pp. 77–118. [Google Scholar]
  70. Menneer, T.; Mueller, M.; Sharpe, R.; Townley, S. Modelling mould growth in domestic environments using relative humidity and temperature. Build. Environ. 2022, 207, 108440. [Google Scholar] [CrossRef]
  71. Viitanen, H.; Vinha, J.; Salminen, K.; Ojanen, T.; Peuhkuri, R.; Paajanen, L.; Lähdesmäki, K. Moisture and bio-deterioration risk of building materials and structures. J. Build. Phys. 2010, 33, 201–224. [Google Scholar] [CrossRef]
  72. Yu, D.; Klein, S.; Reindl, D. An Evaluation of Silica Gel for Humidity Control in Display Cases. Available online: https://cool.culturalheritage.org/waac/wn/wn23/wn23-2/wn23-206.html (accessed on 25 June 2025).
  73. Camuffo, D.; Bertolin, C. Towards standardisation of moisture content measurement in cultural heritage materials. e-Preserv. Sci. 2012, 9, 1–6. [Google Scholar]
  74. Califano, A.; Baiesi, M.; Bertolin, C. Analysing the Main Standards for Climate-Induced Mechanical Risk in Heritage Wooden Structures: The Case of the Ringebu and Heddal Stave Churches (Norway). Atmosphere 2022, 13, 791. [Google Scholar] [CrossRef]
  75. Dolińska, N.; Wojciechowska, G.; Bednarz, Ł. Monitoring Environmental and Structural Parameters in Historical Masonry Buildings Using IoT LoRaWAN-Based Wireless Sensors. Buildings 2025, 15, 282. [Google Scholar] [CrossRef]
  76. Pinheiro, V.R.F.; Fontenele, R.; Magalhães, A.; Frota, N.; Mesquita, E. Evaluation of the influence of climatic changes on the degradation of the historic buildings. Energy Build. 2024, 323, 114813. [Google Scholar] [CrossRef]
  77. Esteban-Cantillo, O.J.; Menendez, B.; Quesada, B. Climate change and air pollution impacts on cultural heritage building materials in Europe and Mexico. Sci. Total Environ. 2024, 921, 170945. [Google Scholar] [CrossRef]
  78. Cano, H.; Ríos-Rojas, J.F.; Hernández-Fernández, J.; Herrera, W.B.; Betancur, M.B.; Vélez, L.D.L.H.; González, L.A. Impact of Environmental Pollution in the Sustainability of Architectural Heritage: Case Study from Cartagena of India, Colombia. Sustainability 2022, 14, 189. [Google Scholar] [CrossRef]
  79. Lobarinhas, R.; Dionísio, A.; Paneiro, G. High Temperature Effects on Global Heritage Stone Resources: A Systematic Review. Heritage 2024, 7, 6310–6342. [Google Scholar] [CrossRef]
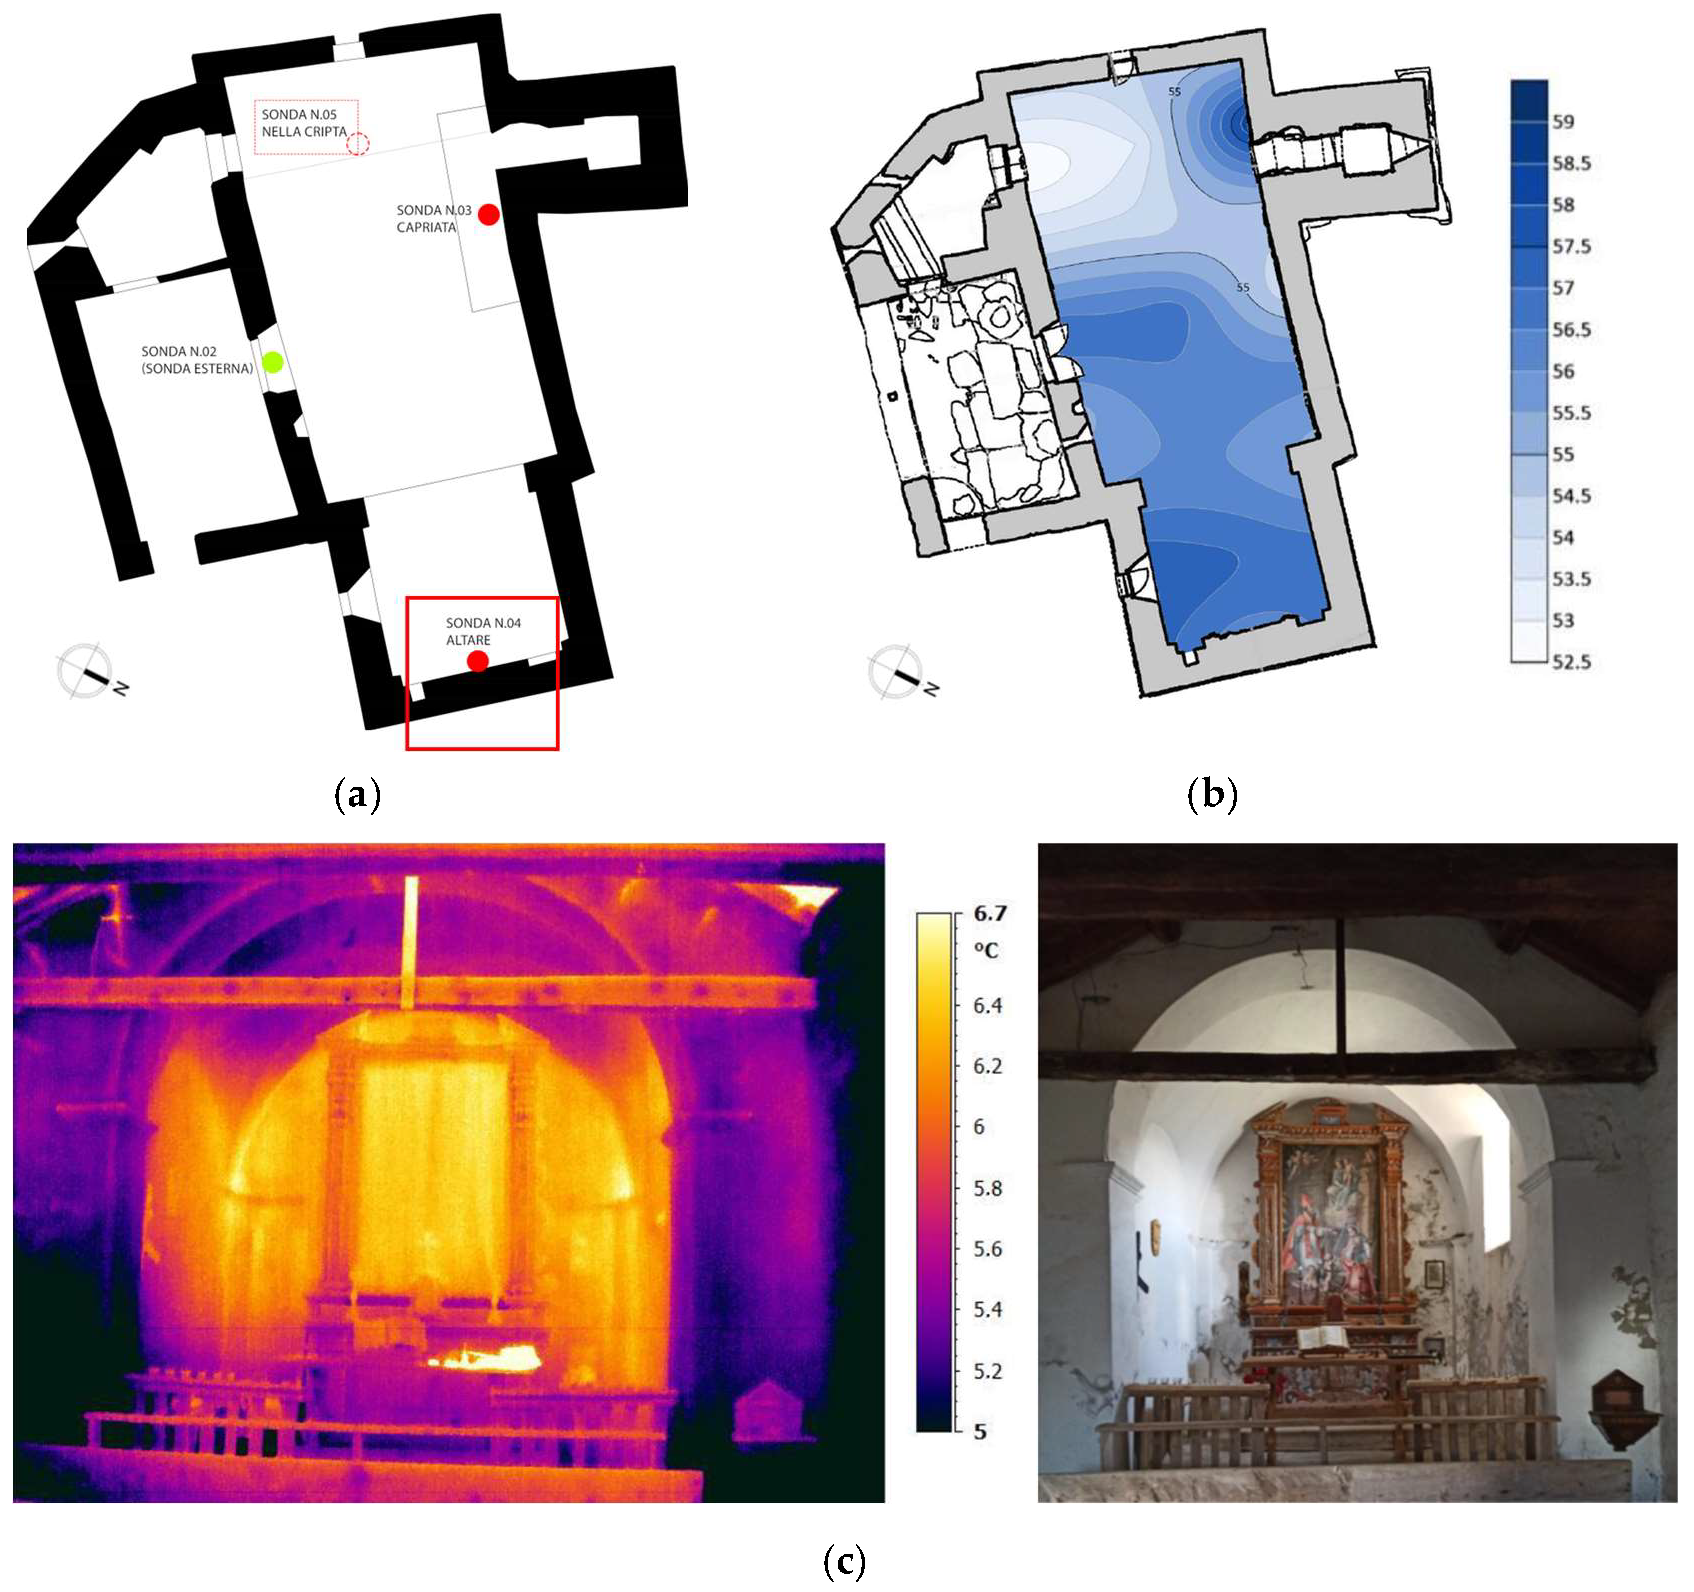
Figure 1. The monitoring campaign in San Romerio: (a) the location of data loggers. The red box at the bottom indicates the location of the selected probe for this research; (b) psychrometric analysis of relative humidity RH% from August 2021 at 11.00 am at 1m level. (c) IRT test of north side (apse) from May 2021. Thermographic surveys of the apse area, particularly the east side to the left of the altar, indicate that the area is directly heated by solar radiation in both May and July. This heating causes a greater discontinuity in temperatures and likely a partial drying of the finish.
Applsci 15 09480 g001
Figure 2. The monitoring campaign in Visconti-Venosta Palace: (a) the location of data loggers. The red box at the bottom indicates the location of the selected probe for this research (Sala d’Onore); (b) IRT test of south side (Scala d’Onore) in July 2021.
Applsci 15 09480 g002
Figure 3. The monitoring campaign in Semadeni Palace: (a) the location of data loggers. The red box indicates the location of the selected probe for this research; (b) south-facing wall in the basement hayloft with evident moisture infiltration. (c) IRT test taken in April 2021 of the same basement wall in the hayloft.
Applsci 15 09480 g003
Figure 4. The monitoring campaign in Besta Palace: (a) the location of data loggers. The red box indicates the location of the selected probe for this research; (b) RH% homogeneity in the east part of the palace on the ground floor; psychrometric analysis conducted on 2 December 2021 at 11:00am (c) IRT test from the north wall of the ticket office in July 2021.
Applsci 15 09480 g004
Figure 5. (a) the comparison between average outdoor daily temperatures in the cases, (b) average indoor daily temperatures, (c) average outdoor daily RH%, (d) average indoor daily RH%.
Applsci 15 09480 g005
Figure 6. Daily average thermal gradient (ΔT = Tin − Tout) in case studies.
Applsci 15 09480 g006
Figure 7. (a) The internal average daily mixing ratio MR g/kg, (b) gradient MR analysis in a year.
Applsci 15 09480 g007
Figure 8. The damping effect categorizes hygrothermal buffering performance, with higher values indicating greater attenuation of indoor moisture fluctuations.
Applsci 15 09480 g008
Figure 9. Internal DPD analysis on an hourly basis in 2022.
Applsci 15 09480 g009
Figure 10. Monthly evaluation of critical T-RH zone per hour considering High T (above 25 °C) + High RH (above 65%) and Fluctuating T around 0 °C + High RH (>65%). Besta and Semadeni palace showed no criticality during 2022.
Applsci 15 09480 g010
Figure 11. Probability Density Function (a) PDF for the outdoor T°C; (b) PDF for the indoor T°C.
Applsci 15 09480 g011
Figure 12. Probability Density Function. (a) PDF for the outdoor RH%; (b) PDF for the indoor RH%.
Applsci 15 09480 g012
Figure 13. Outdoor temperature and altitude correlation.
Applsci 15 09480 g013
Table 1. Summary of the characteristics of the case studies.
CharacteristicsVisconti-Venosta Palace (P-VEN)Semadeni Palace (P-SEM)Besta Palace (P_BES)San Romerio Church (S-R)
imageApplsci 15 09480 i001Applsci 15 09480 i002Applsci 15 09480 i003Applsci 15 09480 i004
Geographic locationVia Visconti Venosta,
2A, 23037 Tirano SO
Via da Mezz 53,
7742 Poschiavo, Switzerland
V. Fabio Besta, 8,
23036 Teglio SO
Alpe San Romerio,
7743 Brusio, Switzerland
Building Materialsstone masonrystone masonrystone masonrystone masonry
Construction date15–18th century19th century15th century17th century
Building usenot in usenot in usesome visitors in summerseldom used, only in summer-autumn
Elevation level440 m1014 m900 m1800 m
Context Semi-dens, urbanSemi-dens, urbanSemi-dens, urbanopen field, mountain
Disclaimer/Publisher’s Note: The statements, opinions and data contained in all publications are solely those of the individual author(s) and contributor(s) and not of MDPI and/or the editor(s). MDPI and/or the editor(s) disclaim responsibility for any injury to people or property resulting from any ideas, methods, instructions or products referred to in the content.