Article

Impact of Hydrogen-Methane Blending on Industrial Flare Stacks: Modeling of Thermal Radiation Levels and Carbon Dioxide Intensity

Gas Engineering Department, Drilling, Oil and Gas Faculty, AGH University of Krakow, Mickiewicza 30 Av., 30-059 Kraków, Poland
*
Authors to whom correspondence should be addressed.
Appl. Sci. 2025, 15(17), 9479; https://doi.org/10.3390/app15179479
Submission received: 13 August 2025 / Revised: 21 August 2025 / Accepted: 22 August 2025 / Published: 29 August 2025
(This article belongs to the Special Issue Technical Advances in Combustion Engines: Efficiency, Power and Fuels)

Abstract

Regulatory changes related to the policy of reducing CO2 emissions from natural gas are leading to an increase in the share of hydrogen in gas transmission and utilization systems. In this context, the impact of the change in composition on thermal radiation zones should be assessed for flaring during startups, scheduled shutdowns, maintenance, and emergency operations. Most existing models are calibrated for hydrocarbon flare gases. This study assesses how the CH4–H2 blends affect thermal radiation zones using a developed solver based on the Brzustowski–Sommer methodology with composition-dependent fraction of heat radiated (F) and range-dependent atmospheric transmissivity. Five blends, 0–50% (v/v) H2, were analyzed for a 90 m stack at wind speeds of 3 and 5 m·s−1. Comparisons were performed at constant molar (standard volumetric) throughput to isolate composition effects. Adding H2 contracted the radiation zones and reduced peak ground loads. Superposition analysis for a multi-flare layout indicated that replacing one 100% (v/v) CH4 flare with a 10% (v/v) H2 blend reduced peak ground radiation. Emission-factor analysis (energy basis) showed reductions of 3.24/3.45% at 10% (v/v) H2 and 7.01/7.44% at 20% (v/v) H2 (LHV/HHV); at 50% (v/v) H2, the decrease reached 22.18/24.32%. Hydrogen blending provides coupled safety and emissions co-benefits, and the developed framework supports screening of flare designs and operating strategies as blends become more prevalent.

1. Introduction

A climate–neutral economy requires both the reduction of absolute CO2 emissions and the maintenance of process safety in situations where gas flaring remains essential–such as during startups, scheduled shutdowns, maintenance, or emergency operations.
In May 2024, the Hydrogen and Decarbonized Gas Market Package was adopted, and the legal acts—Directive (EU) 2024/1788 and Regulation (EU) 2024/1789—set a target limit of ≤2% (v/v) hydrogen in cross-border gas interconnections [1,2]. At the distribution level, pilot programs are currently testing 10–20% (v/v) hydrogen–natural gas blends. As an example, the UK HyDeploy program demonstrated that domestic gas appliances can operate safely with a 20% (v/v) H2–natural gas blend, with no adverse impact on performance or safety [3,4]. Other European initiatives are exploring blends of 5–20% (v/v) H2, and up to~30% (v/v) in industrial clusters [5,6,7,8].
Flare systems (widely used in oil and gas production, LNG plants, refineries, and chemical processing facilities) are typically designed for flare gases dominated by methane (CH4). Additionally, flare flames must be maintained continuously, as the flare stack must remain in a ready-to-ignite state to handle emergency gas releases from the process installation at any time [9,10]. Hydrogen blending affects the thermal radiation characteristics of flare flames, a critical factor for process safety and hazard-zone determination [11,12,13,14,15]. The addition of hydrogen modifies flame structure, combustion kinetics, and radiative output. The adiabatic flame temperature of pure hydrogen (approximately 2403 K) is slightly higher than that of methane (approximately 2200 K), while the fraction of heat radiated (F) decreases markedly [14]. API Standard 521 (7th Edition, 2023) defines F as the proportion of the total chemical heat-release rate emitted as thermal radiation—a key input for calculating safe thermal-radiation distances on the ground [15]. For methane-rich flare gases, typical F values range from 0.15 to 0.32, whereas for hydrogen-rich blends near 80% (v/v) H2, F can drop to 0.10–0.11 [12,13,16]. This reduction is primarily due to (i) the absence of soot formation and associated continuum radiation, (ii) the relatively weak molecular emission of water vapor (H2O) in the infrared, and (iii) strong self-absorption of H2O radiation in the flame. Lower F values translate into smaller thermal-hazard zones for the same total heat-release rate; however, the higher flame temperature of hydrogen can increase local thermal radiation near the flare tip, which must be considered in tip design and material selection [13,16]. These policy and physics trends together motivate composition-aware assessment of flare-radiation levels and related carbon-intensity outcomes for CH4/H2 blends.
The literature on CH4/H2 flare radiation establishes key trends in emissivity, transmissivity, flame geometry, and resulting hazard distances, while also underscoring the limits of hydrocarbon-calibrated models when applied to CH4/H2 blends. Using a weighted multi-point source model, Zhang et al. quantified the influence of orifice diameter and pressure on H2 jet-fire radiation and demonstrated that the flame extends and widens as pressure and leak diameter rise [17]. Zhou et al. [18] developed a model for CH4/H2 mixtures and examined how H2 admixture alters thermal radiation, reporting an increase in effective emissivity with distance from the source. Miller et al. [19] emphasize that most thermal radiation models were calibrated for hydrocarbon flares and are routinely applied to hydrogen beyond their strict validity. Rossiello et al. [20] performed CFD analyses of flare gases and pure hydrogen on heavy-duty burners, and He et al. [21] proposed hydrogen-specific flare-radiation models for hazard-distance assessment; both lines of work indicate material differences in flame geometry and radiation fields between hydrocarbon and hydrogen releases. Benard et al. [22] compared point-source and solid-flame formulations for H2 flares and showed that, near the base of the stack, solid-flame approaches are more reliable for sizing and layout. Li et al. [23] modified solid-flame models tailored to CH4/H2 jet fires and found that, for identical operating conditions, safe distances for CH4/H2 can be lower than for pure CH4. Further confirmation that hydrogen-specific radiation models yield hazard distances distinct from hydrocarbon analogues is provided by He et al. [12].
Lévai and Bereczky [24] reported, from flame-optic tests, that adding hydrogen shortens flame height in a nonlinear fashion with composition. With higher H2 content, both adiabatic flame temperature and laminar burning velocity increase, as shown by Sorgulu et al. [25], consistent with classic scaling in which flame length grows with total mass flow and nozzle diameter [26] and with turbulence–chemistry interactions that differentiate pure H2 from CH4/H2 flames [27]. In diffusion flames, the flare tip mixes air and fuel at velocities, turbulence levels, and concentrations required for reliable ignition and stable combustion; small H2 additions broaden the stability envelope because liftoff velocity rises faster than flashback propensity in the near-tip region, in line with diffusion–flame practice.
Baird et al. [28] provided a comprehensive safety assessment of hydrogen blending with natural gas and concluded that jet-fire heat-flux patterns for CH4/H2 can resemble those for 100% CH4 under certain regimes. Most tools used to assess thermal radiation around flare stacks were calibrated on hydrocarbon data and, in the absence of hydrogen-specific models, are frequently extrapolated to H2, as noted by Miller et al. [19] and Willoughby et al. [29]. More recent CFD and field-validated modeling for natural gas with hydrogen admixture demonstrate improved predictive fidelity for H2-enriched flames and provide case-study validation at scale [20,30]. In horizontal jet-fire scenarios, H2 flares exhibit lower fatality levels than natural-gas analogues in QRA settings [31]. Correlations for the fraction of heat radiated, F, have been generalized across H2, CH4, and C3H8, offering composition-aware inputs to radiation models [32]. Consistently, dispersion/safety zoning around pipelines transporting CH4/H2 tends to be smaller than for pipelines carrying pure CH4 at the same operating conditions [33].
Despite this progress, three practical gaps remain for engineering design and operations. First, many zoning workflows still pair F values calibrated for hydrocarbons with transmissivity assumed constant with range, even though the literature reports composition-dependent F and attenuation that varies with humidity and distance [12,19,21,22,23]. Integrated, lightweight implementations suitable for CH4/H2 blends remain rare. Second, CH4/H2 comparisons are often inconsistent because results are reported at different throughputs, which confounds composition effects with simple scaling. Third, interaction among flares is underrepresented, even though the superposition of ground-level radiation from nearby flares is directly relevant to layout decisions.
In this study, we implement a Brzustowski–Sommer–based solver with composition-dependent F and range-dependent atmospheric transmissivity, perform constant-molar-throughput comparisons across 0–50% (v/v) H2 for single- and multi-flare configurations with superposition, and quantify associated CO2-emission reductions via composition-adjusted emission factors, with external model cross-checks to support design-grade application.

2. Methodology

The methodology adopted in this work includes the calculation framework, underlying assumptions, and analytical tools used to estimate the thermal radiation envelopes for single- and multi-flare stacks operating with hydrogen blends ranging from 0–50% (v/v), as well as the corresponding reductions in CO2 emissions. To support early-stage layout screening, an engineering correlation framework based on the Brzustowski–Sommer methodology was adopted. The approach is well established in flare radiation design and is computationally efficient, while allowing inclusion of a composition-dependent fraction of heat radiated F and a range-dependent atmospheric transmissivity.

2.1. Combustion of Hydrogen–Natural Gas Blends

In CH4/H2 systems, combustion bifurcates into two parallel reactions: CH4 undergoes oxidation to CO2 and H2O, whereas hydrogen oxidizes exclusively to H2O [34]. A hydrogen flame typically appears nearly invisible, especially when burned in pure oxygen, producing only water vapor [34,35]. In atmospheric combustion, additional species from air are present in the flare gas. The morphology of the flame, including length and shape, is also modified: hydrogen enhances the laminar combustion speed and molecular diffusion, promoting faster mixing with air. Empirical jet–flame studies demonstrate that flame height decreases with increasing hydrogen content, up to approximately 60% (v/v) H2 by volume [36,37,38]. A comparison of key design–relevant parameters for hydrogen and natural gas is presented in Table 1.
Experimental studies on large-scale flares utilizing H2/CH4 blends indicate that for hydrogen concentrations up to approximately 20% (v/v), the radiation zone greater than 4 (kW·m–2) remains comparable to that observed for pure CH4 [36]. However, when the hydrogen content exceeds 50% (v/v), this zone is significantly reduced. The maximum flame temperature increases with the hydrogen content at constant burner power. Hydrogen promotes the formation of a greater number of reactive radicals and enhances air–fuel mixing intensity, which tends to shorten the flame length. However, this effect is counterbalanced by the higher flame temperature and increased jet velocity, both of which contribute to flame elongation.
In the study by Zhao et al., it was demonstrated that increasing the hydrogen content in a non-premixed CH4/H2 jet introduces two opposing influences on flame height [38]. The enhanced diffusivity of the fuel blend, the elevated concentration of reactive intermediates, and the intensified air entrainment contribute to a shorter flame. Conversely, higher adiabatic flame temperatures and increased jet exit velocity, especially under low Reynolds number conditions, tend to elongate the flame.

2.2. Thermal Radiation Assessment for Existing Industrial Flare Systems

Flare stacks, as defined in API Standard 521, are designed to safely dispose of excess gases during emergency depressurizations and plant startups or shutdowns [15]. The discharged gases are most often hydrocarbons, which undergo combustion to form CO2, H2O, and trace species determined by the composition of the flare gas. Steam injection is frequently used to promote atomization, enabling smokeless combustion and maintaining required flame temperatures. The introduction of steam enhances turbulent mixing with ambient air and creates an induced draft, increasing air entrainment into the flare tip and improving combustion stability. Nitrogen is commonly supplied to displace flammable mixtures upward, preventing flashback and combustion within the flare riser or tip. Continuous readiness is ensured by maintaining a pilot flame supplied with high-pressure fuel gas, typically at 8–15 (m3·h–1) [10].
Various approaches exist to estimate thermal radiation zones. The available methods differ in terms of their level of detail and fidelity in representing real conditions. A comparative summary of selected methodologies is presented in Table 2.
Single-source models assume that the entire flame can be represented by a single point or spherical energy source [15]. Although computationally simple, they neglect the effects of wind and flame geometry. In semi-empirical models, the flame center of gravity and flame length are determined using dimensionless correlations, while the thermal radiation is still estimated using a point source equation. Line and surface source models represent the flame as a linear segment or an elongated cylinder and apply wind-dependent shape factors to improve the accuracy of the lateral distribution [15,42].
The most accurate representation is achieved through full CFD–RTE simulations (Computational Fluid Dynamics with Radiative Transfer Equation), which are performed using specialized software such as ANSYS Fluent or OpenFOAM. These models incorporate combustion chemistry, turbulence, and spectral gas absorption. However, such simulations are time-intensive and highly complex to execute [47].
A classical approach to flare system design is the Brzustowski–Sommer method, which belongs to the family of point-source-based empirical correlations. It was developed based on full-scale flame radiation measurements conducted in crosswind conditions and remains one of the calculation methods referenced in API Standard 521 [15].
Given the gas flow rate, the geometry of the flare stack and the wind velocity, the method aims to sequentially determine (i) the location of the flame center and its total length; (ii) the thermal radiation at any ground level observation point, and (iii) the critical distances corresponding to standard thermal radiation thresholds, as listed in Table 3.
Based on the flare gas flow parameters specified, including the mass flow rate m ˙ (kg·h−1), molecular weight MW (kg·kmol−1), gas temperature T (K), flare tip diameter D (m), and lower heating value LHV (kJ·kg−1), the following quantities are determined sequentially [15,44]. First, the normal volumetric flow rate W ˙ (Nm3·s–1) is calculated from the mass flow rate under standard conditions according to Equation (1):
W ˙ = m ˙ 3600 · 22.4 M W · T 273
The thermal power Q (kW) released by the flare, as given by Equation (2), is determined from the lower heating value LHV (kJ·kg−1) of the gas:
Q = m ˙ 3600 · L H V 1000
Using the volumetric flow rate, the gas exit velocity Uj (m·s–1) at the flare tip is then calculated, as defined in Equation (3):
U j = W π · D 2 4
The reference speed of sound a i s o (m·s–1), is obtained using the empirical correlation given in Equation (4):
a i s o = 91.2 · T M W
The Mach number M (–) is calculated as the ratio of jet velocity to isentropic speed of sound, as shown in Equation (5):
M = U j a i s o
Brzustowski and Sommer developed a correlation that relates two dimensionless numbers to the normalized coordinates (xc, yc) of the flame center: CLav (–), which describes ability of the fuel jet to dilute below the lower explosive limit, LEL (%), and dj·R (–), which reflects the ratio of jet momentum to wind (a higher value indicates a longer flame) –as expressed in Equations (6) and (7) [44].
C L a v = L E L 100 · M · a i s o U · M W M W a i r
d j · R = D · U j U · T a i r · M W T · M W a i r
The total flame length (m) is determined using the following Equation (8):
L = 2 · x c 2 + y c 2
Once the center of gravity of the flame and the total length have been established, it is essential to evaluate the thermal radiation zones by estimating the radiation impact distances corresponding to the standard exposure thresholds. This process requires careful consideration of the fraction of heat radiated (F), which expresses the proportion of the total chemical heat release of the flare that is converted into thermal radiation [15].
The value of F is highly dependent on the fuel composition. When hydrogen is blended into natural gas, this fraction decreases as a result of reduced soot formation and lower infrared emissivity of hydrogen flames [12,13,15,16]. To account for this behavior, the correlation shown in Equation (9) is applied for H2/NG blends:
F H 2 = 0.19 0.19 · ( 1 0.80 · y 0.20 0.30 0.10 f o r y 0.20 f o r   0.20 y < 0.50 f o r 0.50
where F denotes the fraction of heat radiated (dimensionless), and y is the molar fraction of hydrogen in the gas blend on a v/v basis.
The function applies a piecewise linear decrease from F = 0.19 (–) down to F = 0.10 (–) as the H2 content increases from 20% (v/v) to 50% (v/v). For hydrogen concentrations above 50% (v/v), the radiative fraction is fixed at F = 0.10 (–), which reflects pure H2 combustion behavior.
In the presented methodology, atmospheric transmissivity is not assumed to be constant but is treated as a variable dependent on the distance from the flame center [15,44]. This approach allows for a more accurate representation of infrared attenuation under real atmospheric conditions, particularly for long-distance radiation calculations. The transmissivity coefficient τ should be calculated based on the API Standard 521, and incorporates the effect of ambient humidity RH (%) as well as the line-of-sight distance r between the flame and the ground-level observation point [15]. This ensures that the reduction of radiative intensity due to water vapor absorption is properly accounted for across the entire radiation field. By dynamically adjusting transmissivity at each location, as expressed in Equation (10), the method improves the accuracy of predicted thermal radiation intensities and resulting safety distances.
τ R H , r = 0.79 · 3000 R H · r 1 16
where RH (%) denotes the ambient relative humidity, and r (m) is the distance from the flame center to the observation point.
The location of the flame center can be expressed as the coordinate pair (xc, H + yc), where H (m) denotes the height of the flare stack, xc (m) represents the horizontal displacement of the flame center from the axis of the stack in the wind direction, and yc (m) is the vertical displacement from the center of the flame above the flare stack tip. For a point at ground level located along the wind axis at horizontal coordinate r, the distance from the center of the flame is calculated as r(x) (kW·m–2) using Equation (11) [15]:
r x = F · Q 4 · π · r · x 2 · τ R H , r
This formulation accounts for both geometric attenuation due to the inverse square law and the spectral absorption of infrared radiation by atmospheric constituents.
To determine the critical distance from the flame at which the thermal radiation level considered falls below a predefined threshold Rk (kW·m–2), a two-step approach is used. An initial estimate of the distance, obtained without neglecting atmospheric absorption, is calculated using Equation (12):
d r a d R k = F · Q · 1000 4 · π · R k
The critical radiation distance drad(Rk) (m) corresponds to the minimum separation between the flame center and a ground–level location at which the incident thermal radiation flux does not exceed a predefined threshold Rk (m).

2.3. Indicators for Assessing CO2 Emissions from Combustion

Despite ongoing mitigation efforts, routine and emergency flaring continues to generate substantial direct CO2 emissions worldwide. Figure 1 presents direct CO2 emissions resulting from flaring natural gas and the flaring intensity, defined as the annual ratio of natural gas flared to total oil production for the years 2010–2030, according to the International Energy Agency (IEA) [48].
When combusting hydrogen-enriched natural gas blends, an important environmental aspect is the resulting CO2 emissions. Since hydrogen does not contain carbon, the blend of H2 with natural gas (NG) reduces the carbon intensity of the fuel and consequently reduces CO2 emissions during combustion [49].
Carbon accounting and sustainability reporting frameworks typically rely on predefined emission factors (carbon intensity expressed in kgCO2 per unit of energy, (kgCO2·GJ−1) or (kgCO2·MJ−1)) along with oxidation factors. Any reduction in the carbon content of the fuel mix directly decreases reportable CO2 emissions [49]. This is particularly relevant in regulatory and financial contexts, where such reductions can translate into compliance benefits or cost savings.
For example, a 10% (v/v) hydrogen admixture to methane results in approximately a 3 (%) reduction in CO2 emissions, while a 20% (v/v) H2 blend leads to a 7–10 (%) decrease in the CO2 mass emitted per unit of chemical energy [4,7].
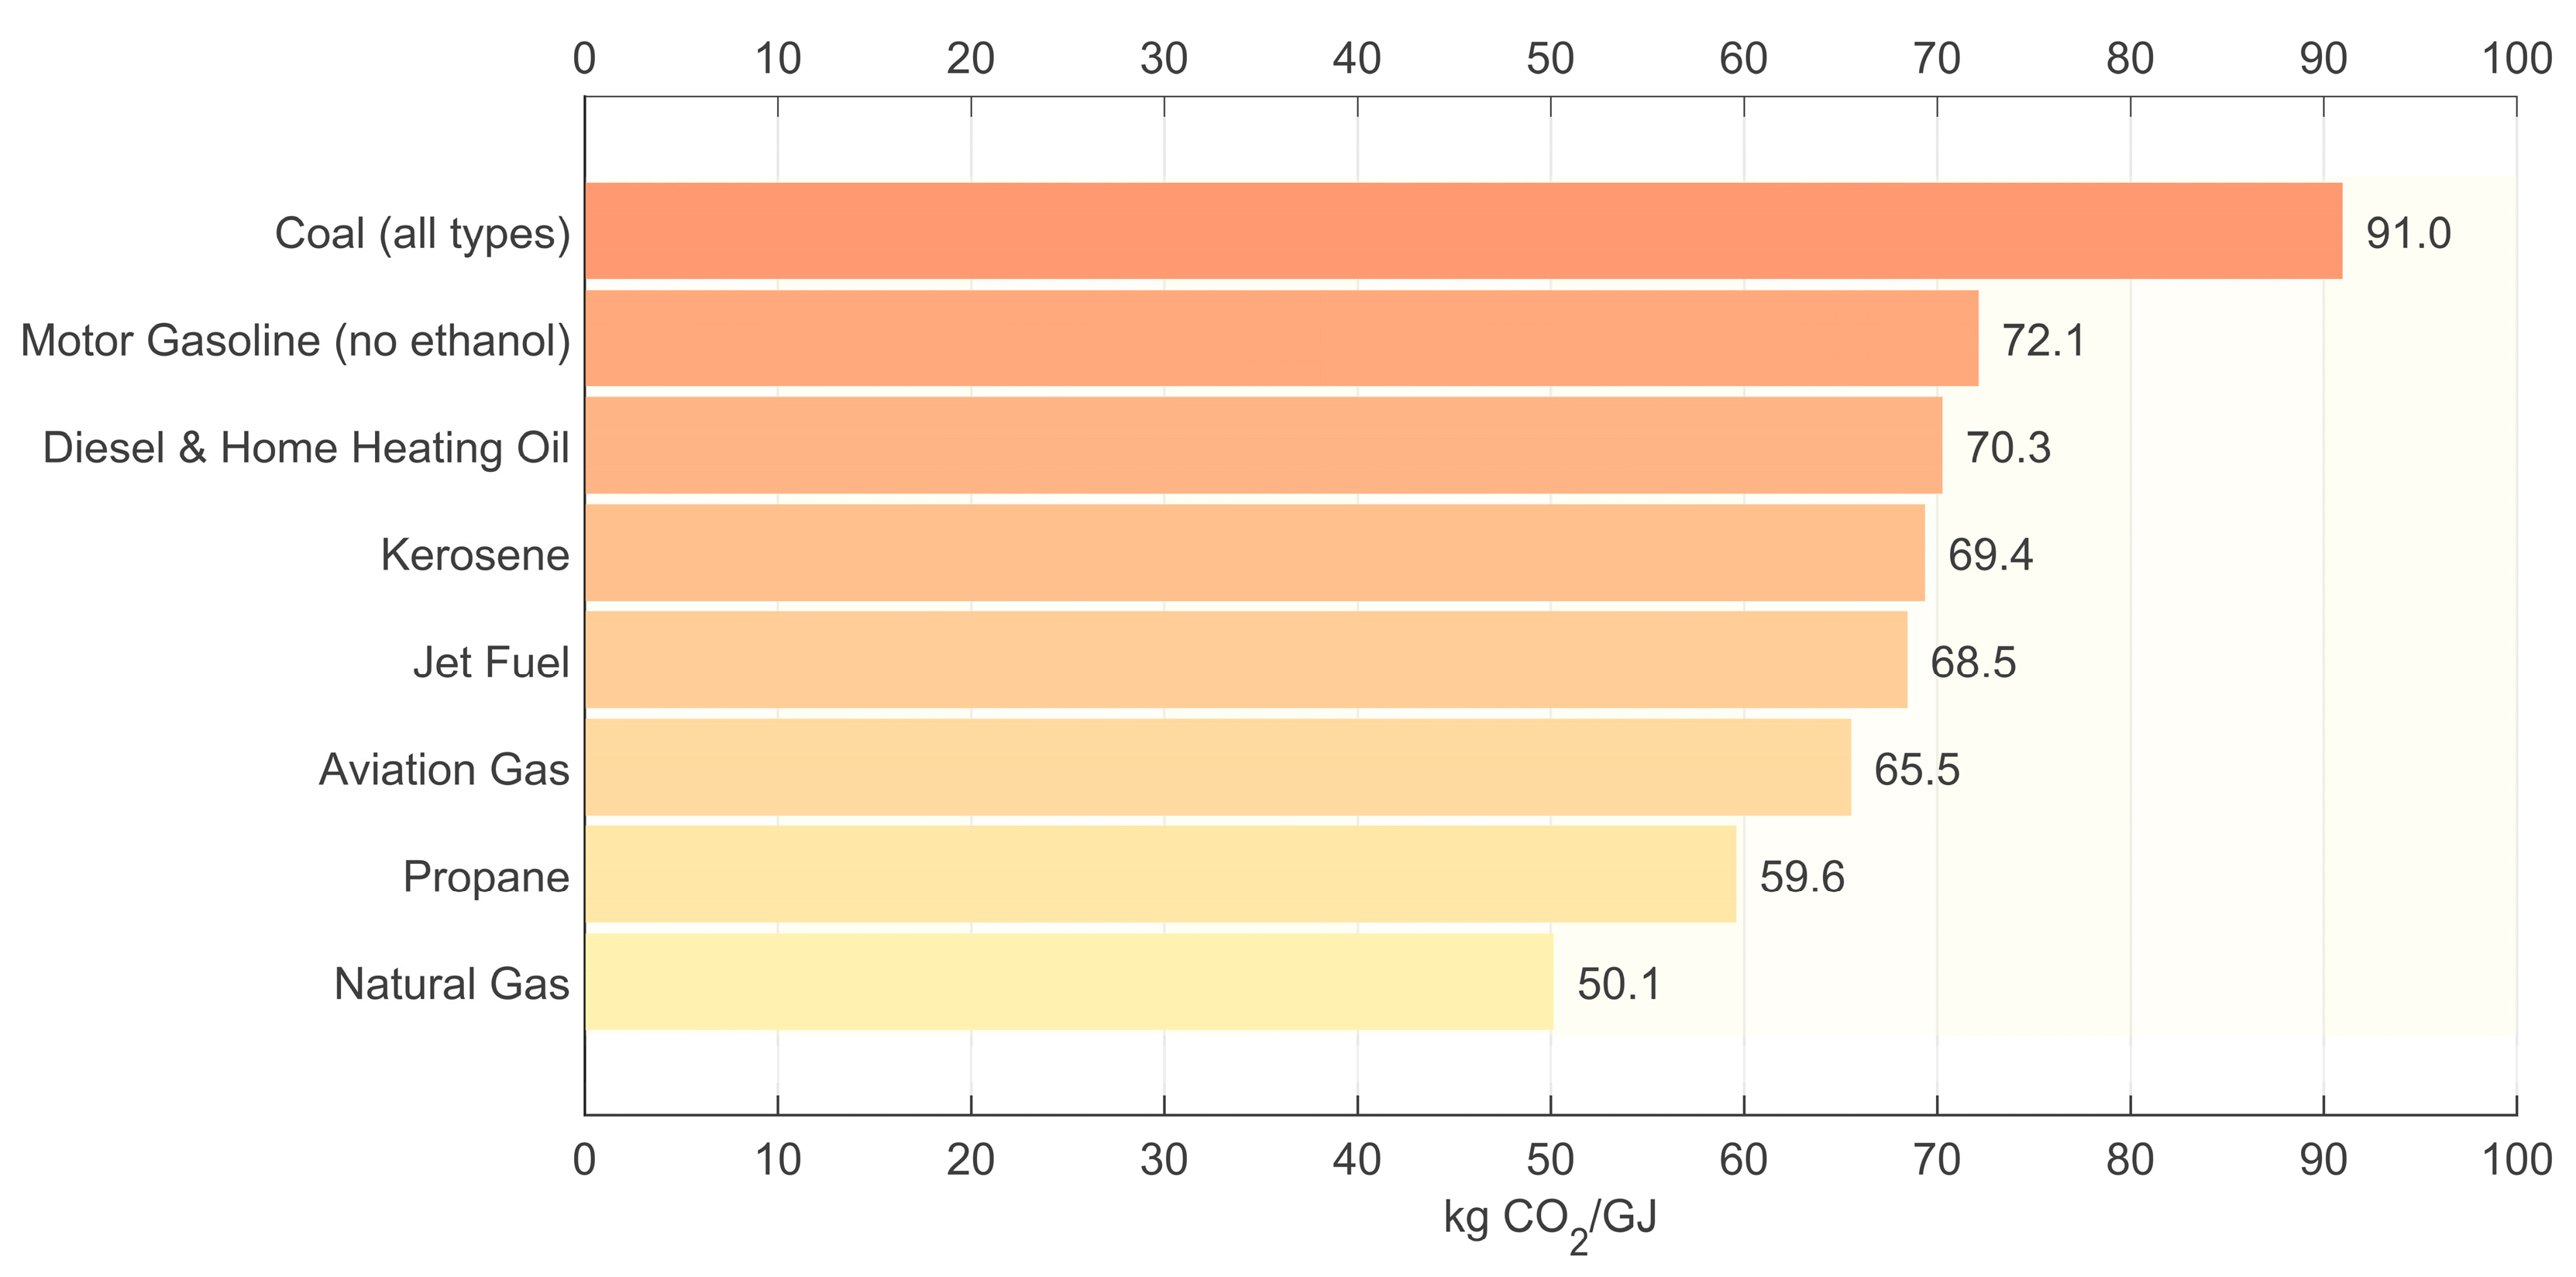
One of the primary metrics for assessing the climate impact of different fuels is carbon intensity. For pure CH4, a typical reference value is approximately 50.1 (kgCO2·GJ−1) (based on LHV) (Figure 2) [50].
With the growing prevalence of hydrogen blending in gas distribution and industrial applications, the reduction in CO2 intensity becomes a measurable and predictable parameter, provided that the blend composition is known and stable. In addition to lowering CO2 emissions, national inventories and compliance schemes (such as the IPCC Guidelines for National Greenhouse Gas Inventories, the EU Emissions Trading System (EU ETS), and the US EPA Greenhouse Gas Reporting Program) require operators to account for CO2 released during fuel combustion [51]. Two broad methodological approaches are permitted: Tier 1, in which a single conservatively high emission factor (EF) is taken from regulatory tables, and Tier 2/Tier 3 (based on analysis), in which EF is derived from laboratory gas composition analysis or continuous gas quality measurements [49].
In almost all scenarios, the mass of CO2 is calculated rather than measured directly by multiplying activity data (fuel quantity) by a chain of emission-related coefficients. The generic Tier 1 formula adopted by the IPCC (2006) is shown in Equation (13) [49]:
C O 2 E M = A D · N C V · E F · O F
where AD denotes the amount of fuel combusted (Nm3) of gas; NCV is the net calorific value (lower heating value) of the fuel; EF represents the emission factor (kgCO2·MJ−1); and OF is the oxidation factor (−), defined as the fraction of carbon oxidized to CO2, which for high efficiency burners is typically assumed to be 1.0 (−).
The values of default emission factors for natural gas are typically expressed on a lower heating value (LHV) basis and are intended for use in national greenhouse gas inventories, compliance reporting, and carbon accounting. Although the EU Monitoring & Reporting Regulation (MRR) and the IPCC Guidelines adopt an identical factor of 56.1 (kgCO2·GJ−1) for commercial natural gas regardless of hydrogen content, the US EIA provides separate coefficients based on higher heating value (HHV) with conversion to LHV, applicable specifically to dry pipeline gas without accounting for hydrogen blending (Table 4) [50,51].
When composition data are available, a Tier 2/3 factor can be calculated by mass balance. Assuming ideal gas behavior and complete oxidation of CH4 to one mole of CO2, the net emission factor on a LHV or HHV basis, EFmix,LHV; EFmix,HHV (kgCO2·GJ−1) for a CH4–H2 blend can be expressed by the following equations (Equations (14) and (15)) [51,52]:
F m i x , L H V = 1 y H 2 · m C O 2 1 y H 2 · L H V C H 4 + y H 2 · L H V H 2
E F m i x , H H V = 1 y H 2 · m C O 2 1 y H 2 · H H V C H 4 + y H 2 · H H V H 2
The y H 2 parameter represents the volumetric fraction of hydrogen in the blend. The L H V C H 4 denotes the lower heating value of CH4, 802 (kJ·mol−1), while H H V C H 4 is the higher heating value of CH4, 890 (kJ·mol−1 [52]). L H V H 2 corresponds to the lower heating value LHV of hydrogen, 242 (kJ·mol−1) and H H V H 2 is its higher heating value, 286 (kJ·mol−1) [52]. The m C O 2 denotes the molar mass of carbon dioxide, 44 (g·mol−1).

3. Case Study

A dedicated computational framework was developed for the calculation of thermal radiation and the modeling of flame behavior, and subsequently applied to CH4/H2 blends to investigate the influence of hydrogen enrichment on key operational parameters of elevated flare stacks.
A constant set of environmental conditions was assumed. Pasquill stability class D; wind speed: 3 (m·s−1) and 5 (m·s−1); ambient relative humidity RH = 60 (%); ambient temperature T = 289 (K). Flare stack geometry was fixed as stack height H = 90 (m), flare–tip internal diameter Dtip = 0.70 (m), and static pressure at the tip p2 = 104 (kPa). Design ground-level thermal radiation thresholds followed API Std 521: 1.58, 4.73, 6.31, and 9.46 (kW·m−2) [15]. Blend properties used by the solver were obtained from the following correlations (Table 5).
Calculations were performed for a single elevated flare stack that handled CH4/H2 blends, with the base scenario defined as a pure CH4 mass flow rate of 150,000 (kg·h−1). The molar masses adopted for CH4 and H2 were 16.043 (kg·kmol−1) and 2.016 (kg·kmol−1), respectively. This corresponds to a reference molar flow rate of 9,349.872 (kmol·h−1) for pure CH4. In subsequent scenarios, the total molar flow rate was kept constant to isolate composition effects, with a specified fraction of the CH4 molar flow replaced mole–for–mole by hydrogen.
The temperature at the flare tip was taken to be 289 (K). Lower Explosive Limit (LEL) values were determined using Le Chatelier’s rule, as expressed in Equation (16) [45,46,53]:
1 L E L m i x = y H 2 L E L H 2 + 1 y H 2 L E L C H 4
Calculations were performed for single elevated flare stacks and for the five compositions of CH4/H2 blends listed below. The resulting compositions, the molar and mass flow rates of CH4 and H2, the total H2 total mass flow rates, and the total mass flow rates of H2 with LELmix values are summarized in Table 6.
The five scenarios in Table 6 are composition cases for CH4/H2 blends at 0, 10, 20, 35, and 50% (v/v) H2. They were selected to include the baseline (100% (v/v) CH4), cover blends already trialed or discussed in European pilots and distribution studies (10–20% H2), bracket higher-blend use cases considered in industrial clusters (≈30–35% H2), and provide an upper-bound sensitivity at 50% H2 to probe the transition to low-luminosity flames and its implications for radiation zoning. In all scenarios, flare geometry and operating conditions are held fixed; thus, Scenarios 1–5 are designed to isolate the effect of hydrogen on thermal-radiation behavior.
In this study, the fraction of heat radiated, F, for each C H 4 / H 2 scenario was determined using a hybrid approach that combines the Chamberlain correlation based on the velocity with a composition-dependent adjustment for flames rich in hydrogen and low luminosity [15,45,46]. For the CH4–rich scenarios (0, 5, and 10% (v/v) H2), the flames remain in the luminous, soot-forming regime; therefore, F was taken directly from the Chamberlain formula, as given in Equation (17) [45,46,53]:
F = 0.21 e 0.00323 U j + 0.11
The exit velocity for each CH4/H2 blend was calculated as shown in Equation (18) [15,49]:
U j = 4 · m ˙ π · D 2 · P · M W m i x R · T
where m ˙ is the total mass flow rate (kg·s−1), D is the flare tip internal diameter (m), and ρ is the density at flare tip conditions (kg·m−3). The density was calculated from the molar composition, the molecular weight MWmix (kg·kmol−1), and the gas constant R.
At 20% (v/v) H2, the system enters a transition region. Here, F was assigned as the lower of the Chamberlain value and the composition-dependent correlation F y H 2 [12], both giving about 0.190 (−), reflecting the onset of reduced luminosity. For the hydrogen-rich scenario (50% (v/v) H2), the flames exhibit low-luminosity behavior with negligible soot formation; in these conditions, F was assumed as 0.100 (−). This ensures that for luminous hydrocarbon flames, the radiative fraction is driven by exit velocity, whereas for low-luminosity hydrogen flames, it is governed by composition, in agreement with full–scale experimental observations.
This study treats the elevated flare as a turbulent, mixing-controlled diffusion flame. Molecular species-diffusion fields are not explicitly resolved; instead, the influence of H2 is represented by composition-dependent thermophysical/stoichiometric properties and a composition-dependent radiative heat fraction F (lower for H2-rich, non-luminous flames). This approach captures the observed tendency of H2 enrichment to shorten diffusion flames and enhance stability, which reduces predicted radiation footprints, while remaining within an API-type engineering framework.

4. Results and Discussion

4.1. Thermal Radiation Calculations

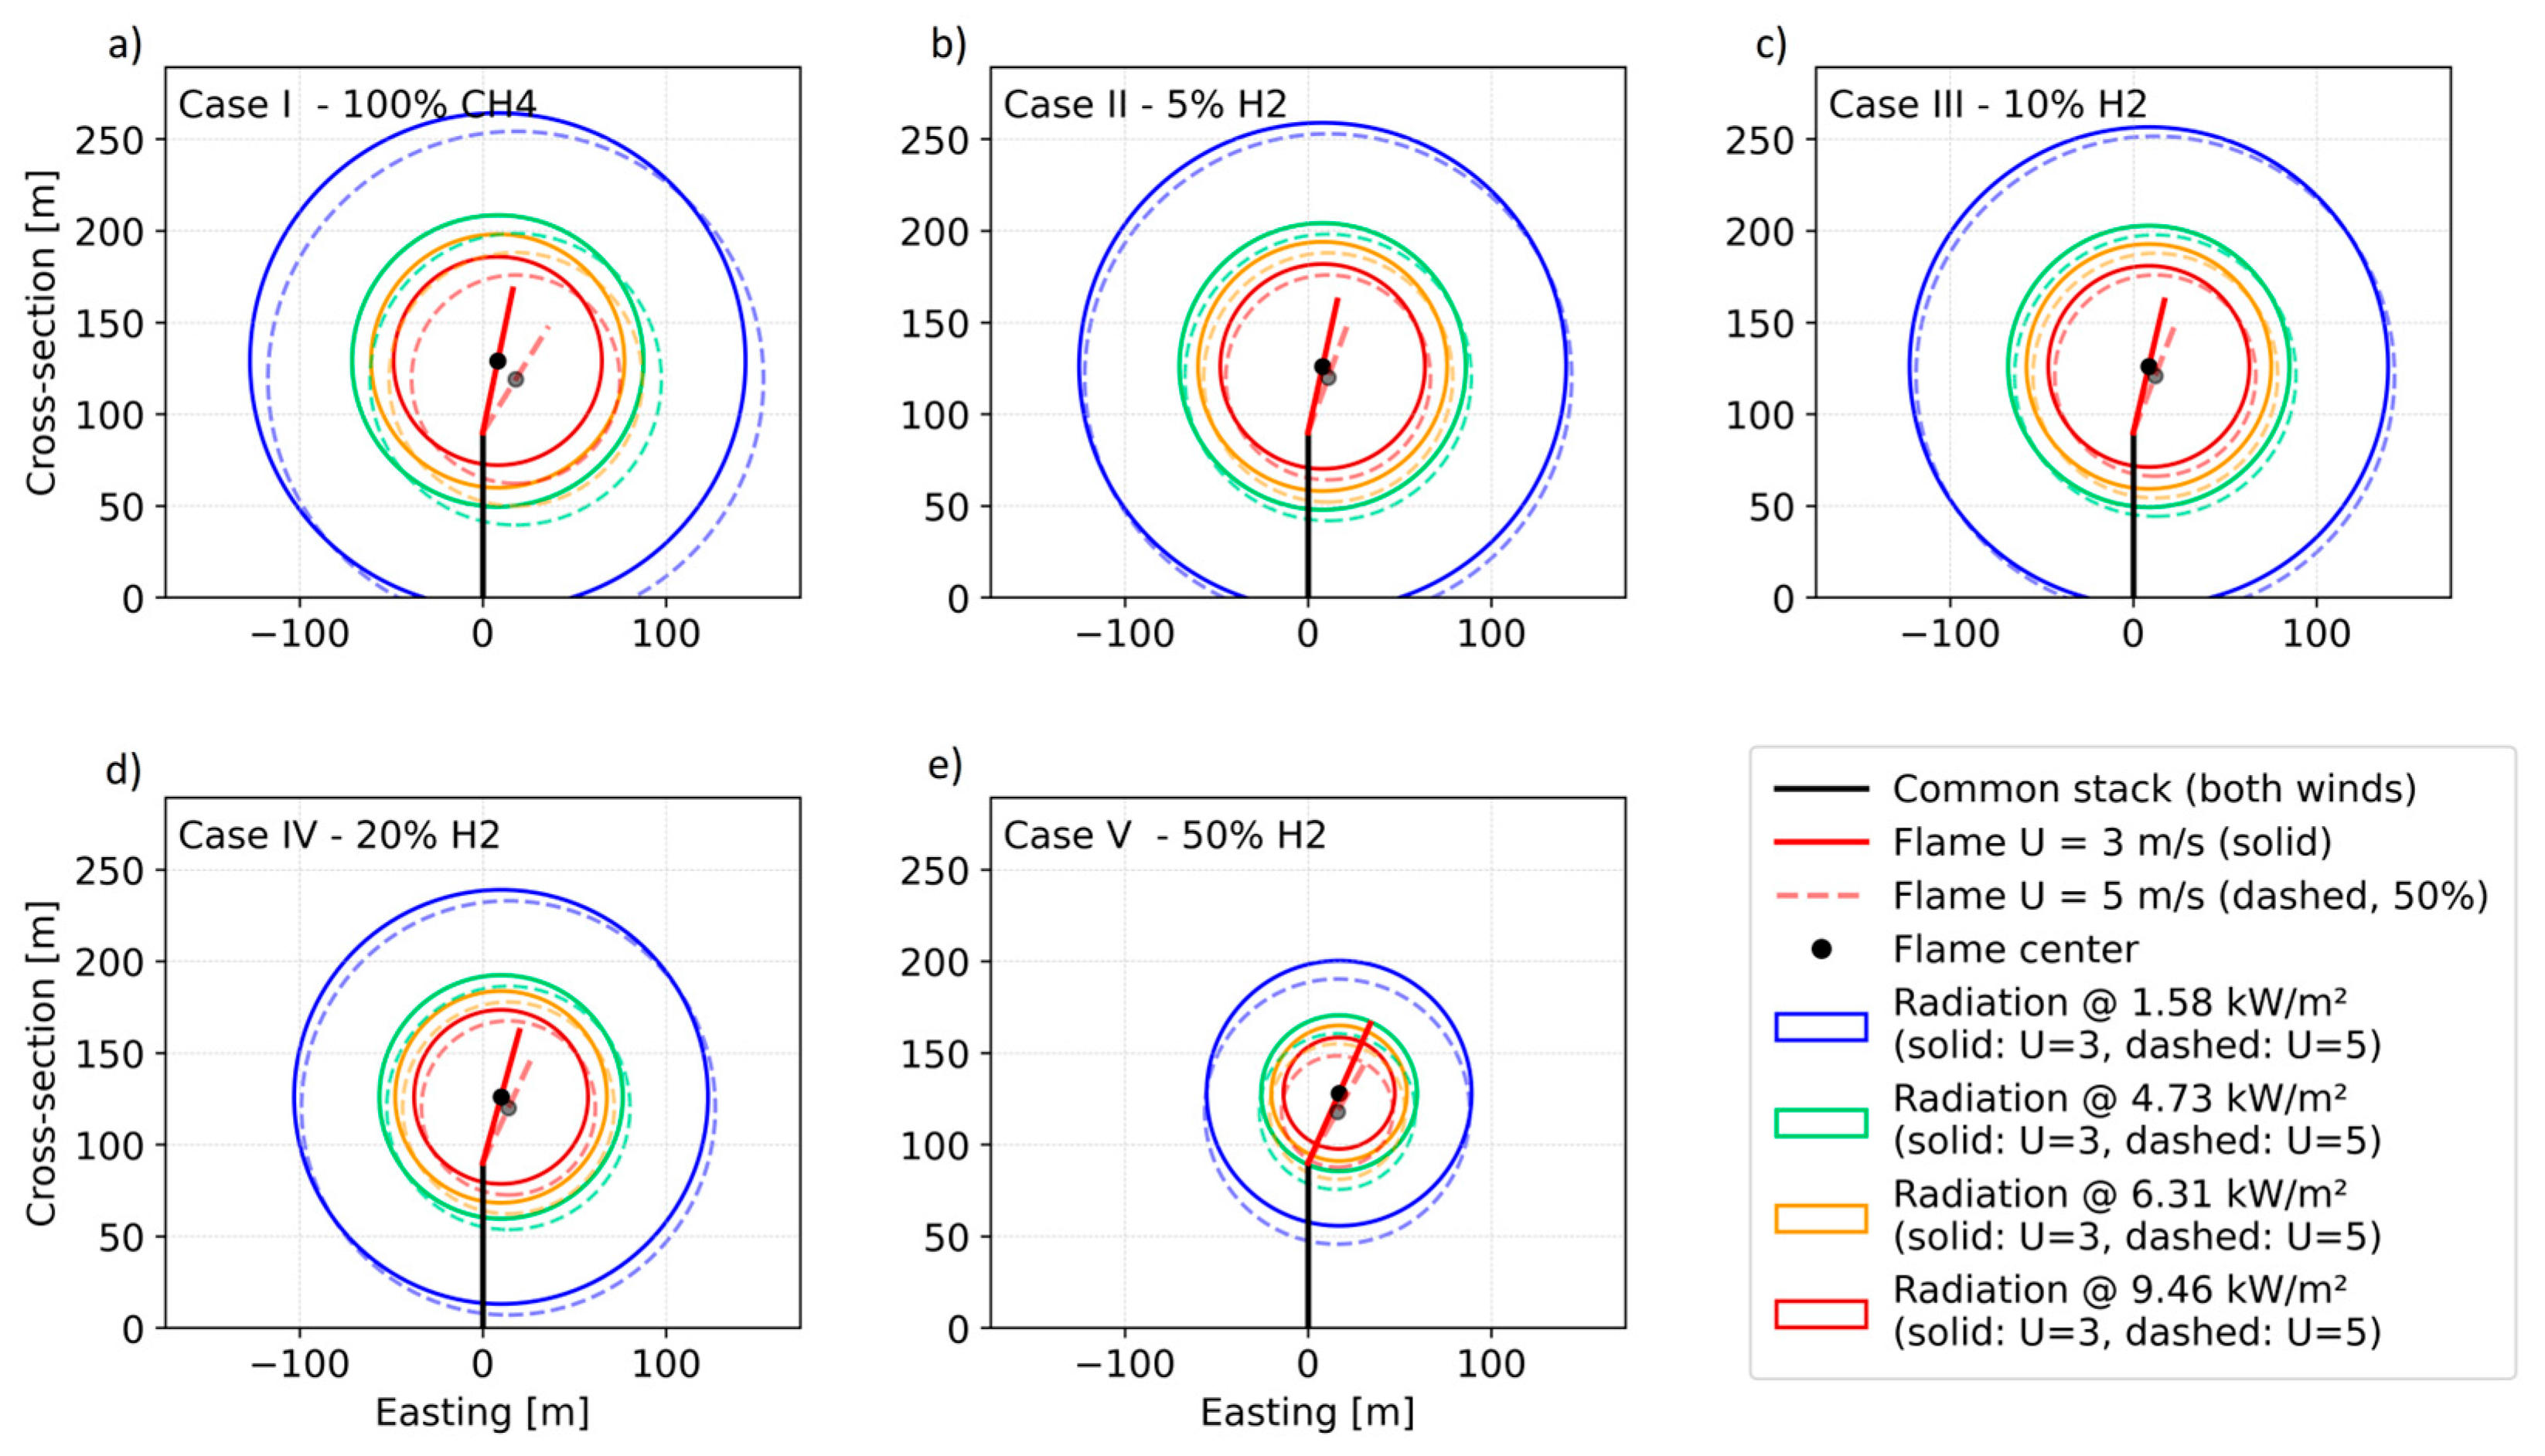
Five blends were analyzed for a common stack: 100% (v/v) CH4 and CH4 with 5, 10, 20, and 50% (v/v) H2. Figure 3 shows, in a vertical side–view (Cross–section vs. Easting), the flame center and axis together with the ground–referenced isopleths for 9.46, 6.31, 4.73, and 1.58 (kW·m−2). Solid contours correspond to U = 3 (m·s−1), while dashed contours correspond to U = 5 (m·s−1).
For U = 3 (m·s−1), increasing the hydrogen fraction causes a clear contraction of all radiation zones. The effect is already visible at 5–10% (v/v) H2 and becomes pronounced for 20–50% (v/v) H2, with the outer 1.58 (kW·m−2) contour receding the most. The flame axis shortens slightly and its center shifts modestly downwind with composition, but the dominant change is the reduction of the footprint radii for every threshold. This behavior is consistent with both the lower molar heat release of CH4/H2 blends and the lower luminous (radiative) fraction of hydrogen-rich flames. For U = (5 m·s−1), the wind tilts “lays down” the flame, bringing the hot core closer to the ground on the lee side. The observed contraction with increasing H2 is consistent with hydrogen-aware flare models and jet-flame experiments [19,21,23,32,36,38].
Figure 4 shows the corrected distance Dc for each thermal radiation threshold as a function of hydrogen content. The corrected distance denotes the distances evaluated after applying atmospheric transmissivity τ(R,RH) along the optical path (line of sight) from the flame to the ground receptor.
Within the algorithm used, a single Dc is obtained for each blend/threshold, common to both wind speeds, U = 3 (m·s−1) and U = 5 (m·s−1). The curves exhibit a nearly linear decrease in corrected distance Dc from pure CH4 to 50% (v/v) H2. All calculations were performed at a constant molar flow throughput at the flare tip for every blend. Holding the molar flow constant makes the comparison energy-based and composition-driven: as CH4 is replaced by H2, the total heat-release rate per mole and the radiative fraction both decrease, so the predicted distances contract systematically without confounding the trends with trivial scaling from different feed rates.
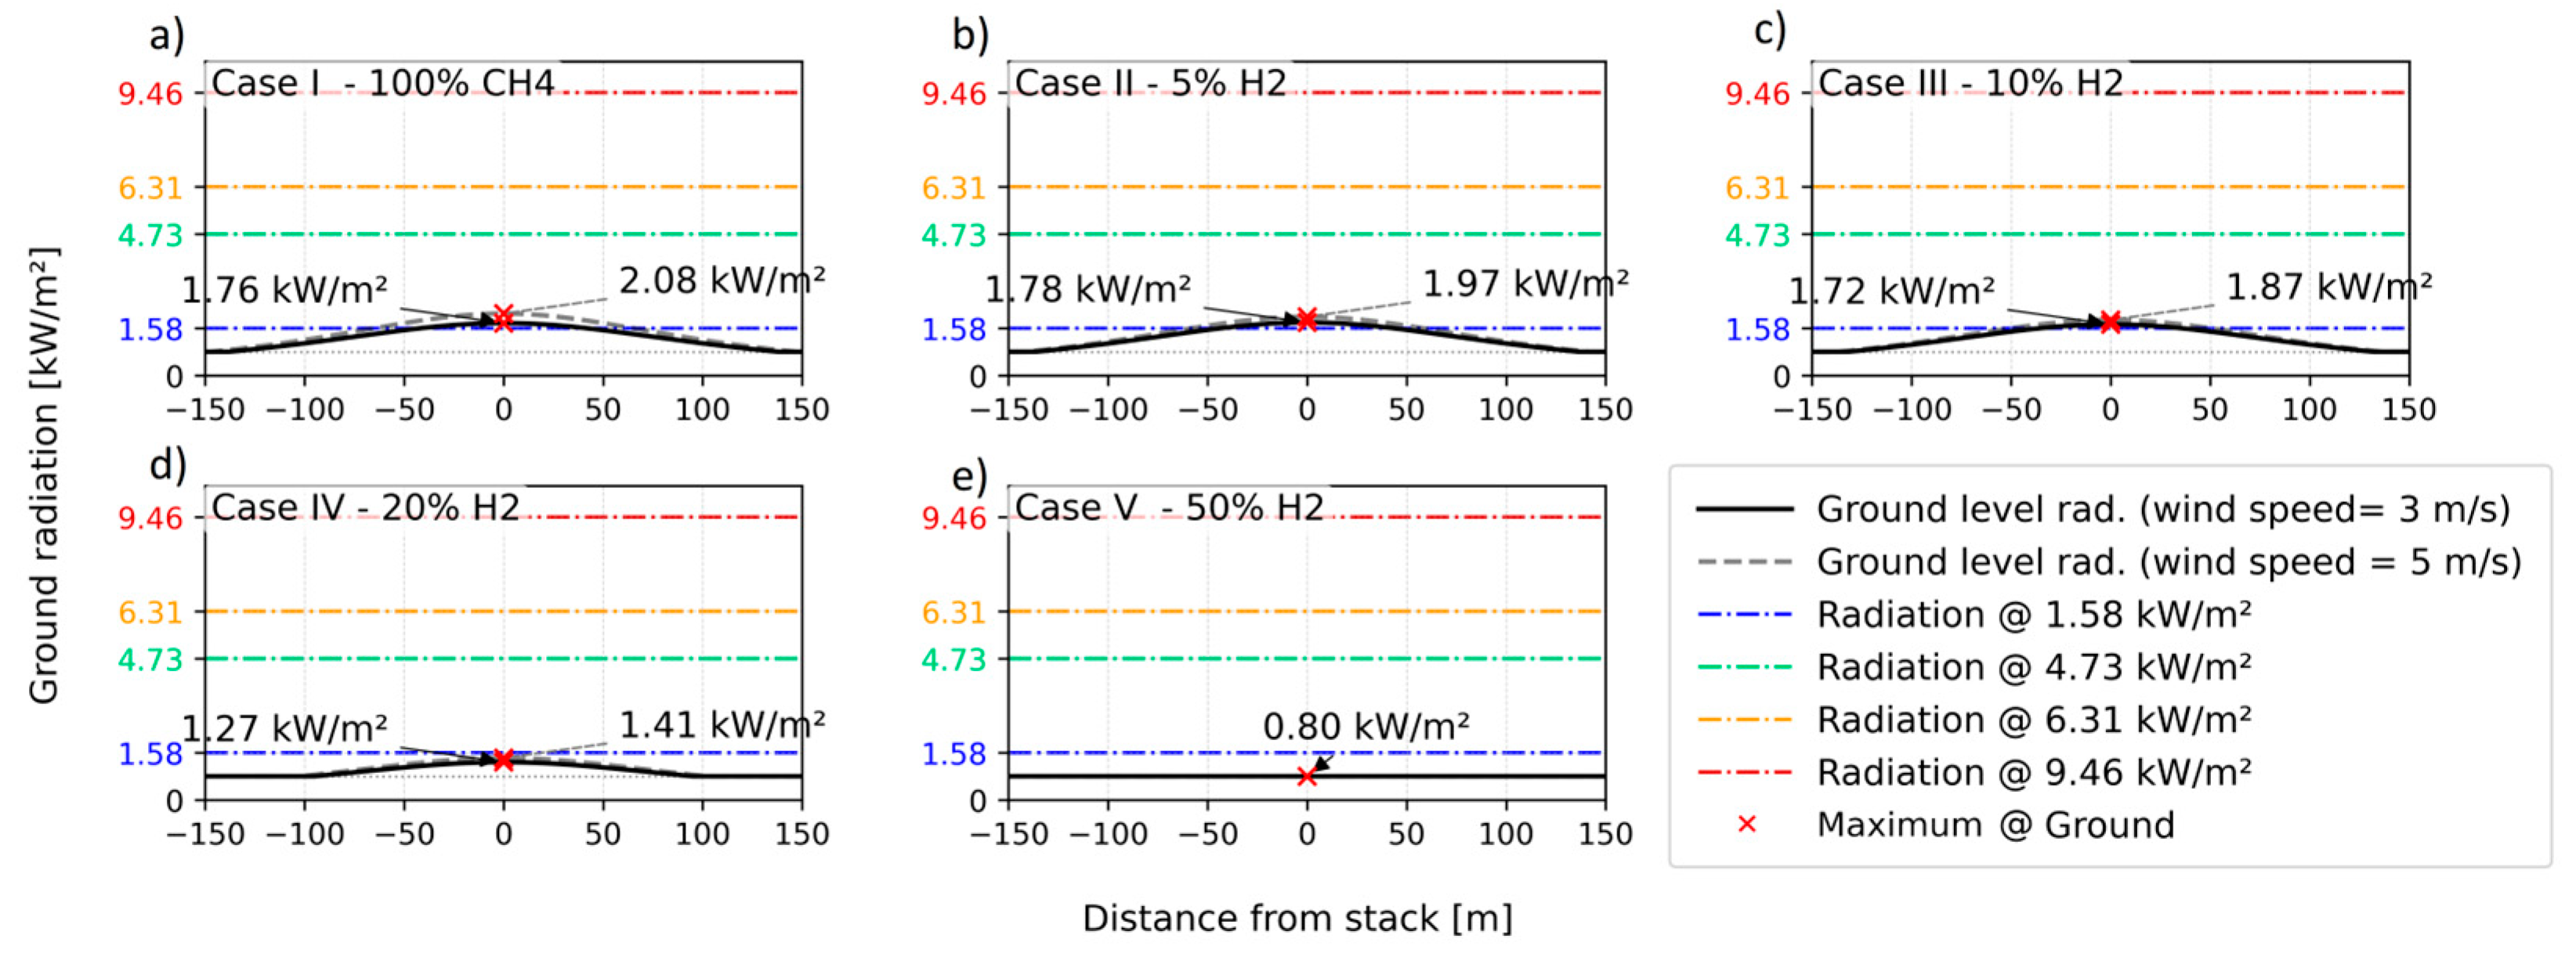
Figure 5 shows the ground-level thermal radiation profiles as a function of the horizontal distance from the stack. Each panel corresponds to one blend scenario (I: 100% (v/v) CH4; II–V: CH4 with 5, 10, 20, and 50% (v/v) H2). Horizontal dash–dot lines mark the reference thresholds, 1.58; 4.73; 6.31; and 9.46 (kW·m−2); the red cross indicates the downwind location of the local maximum.
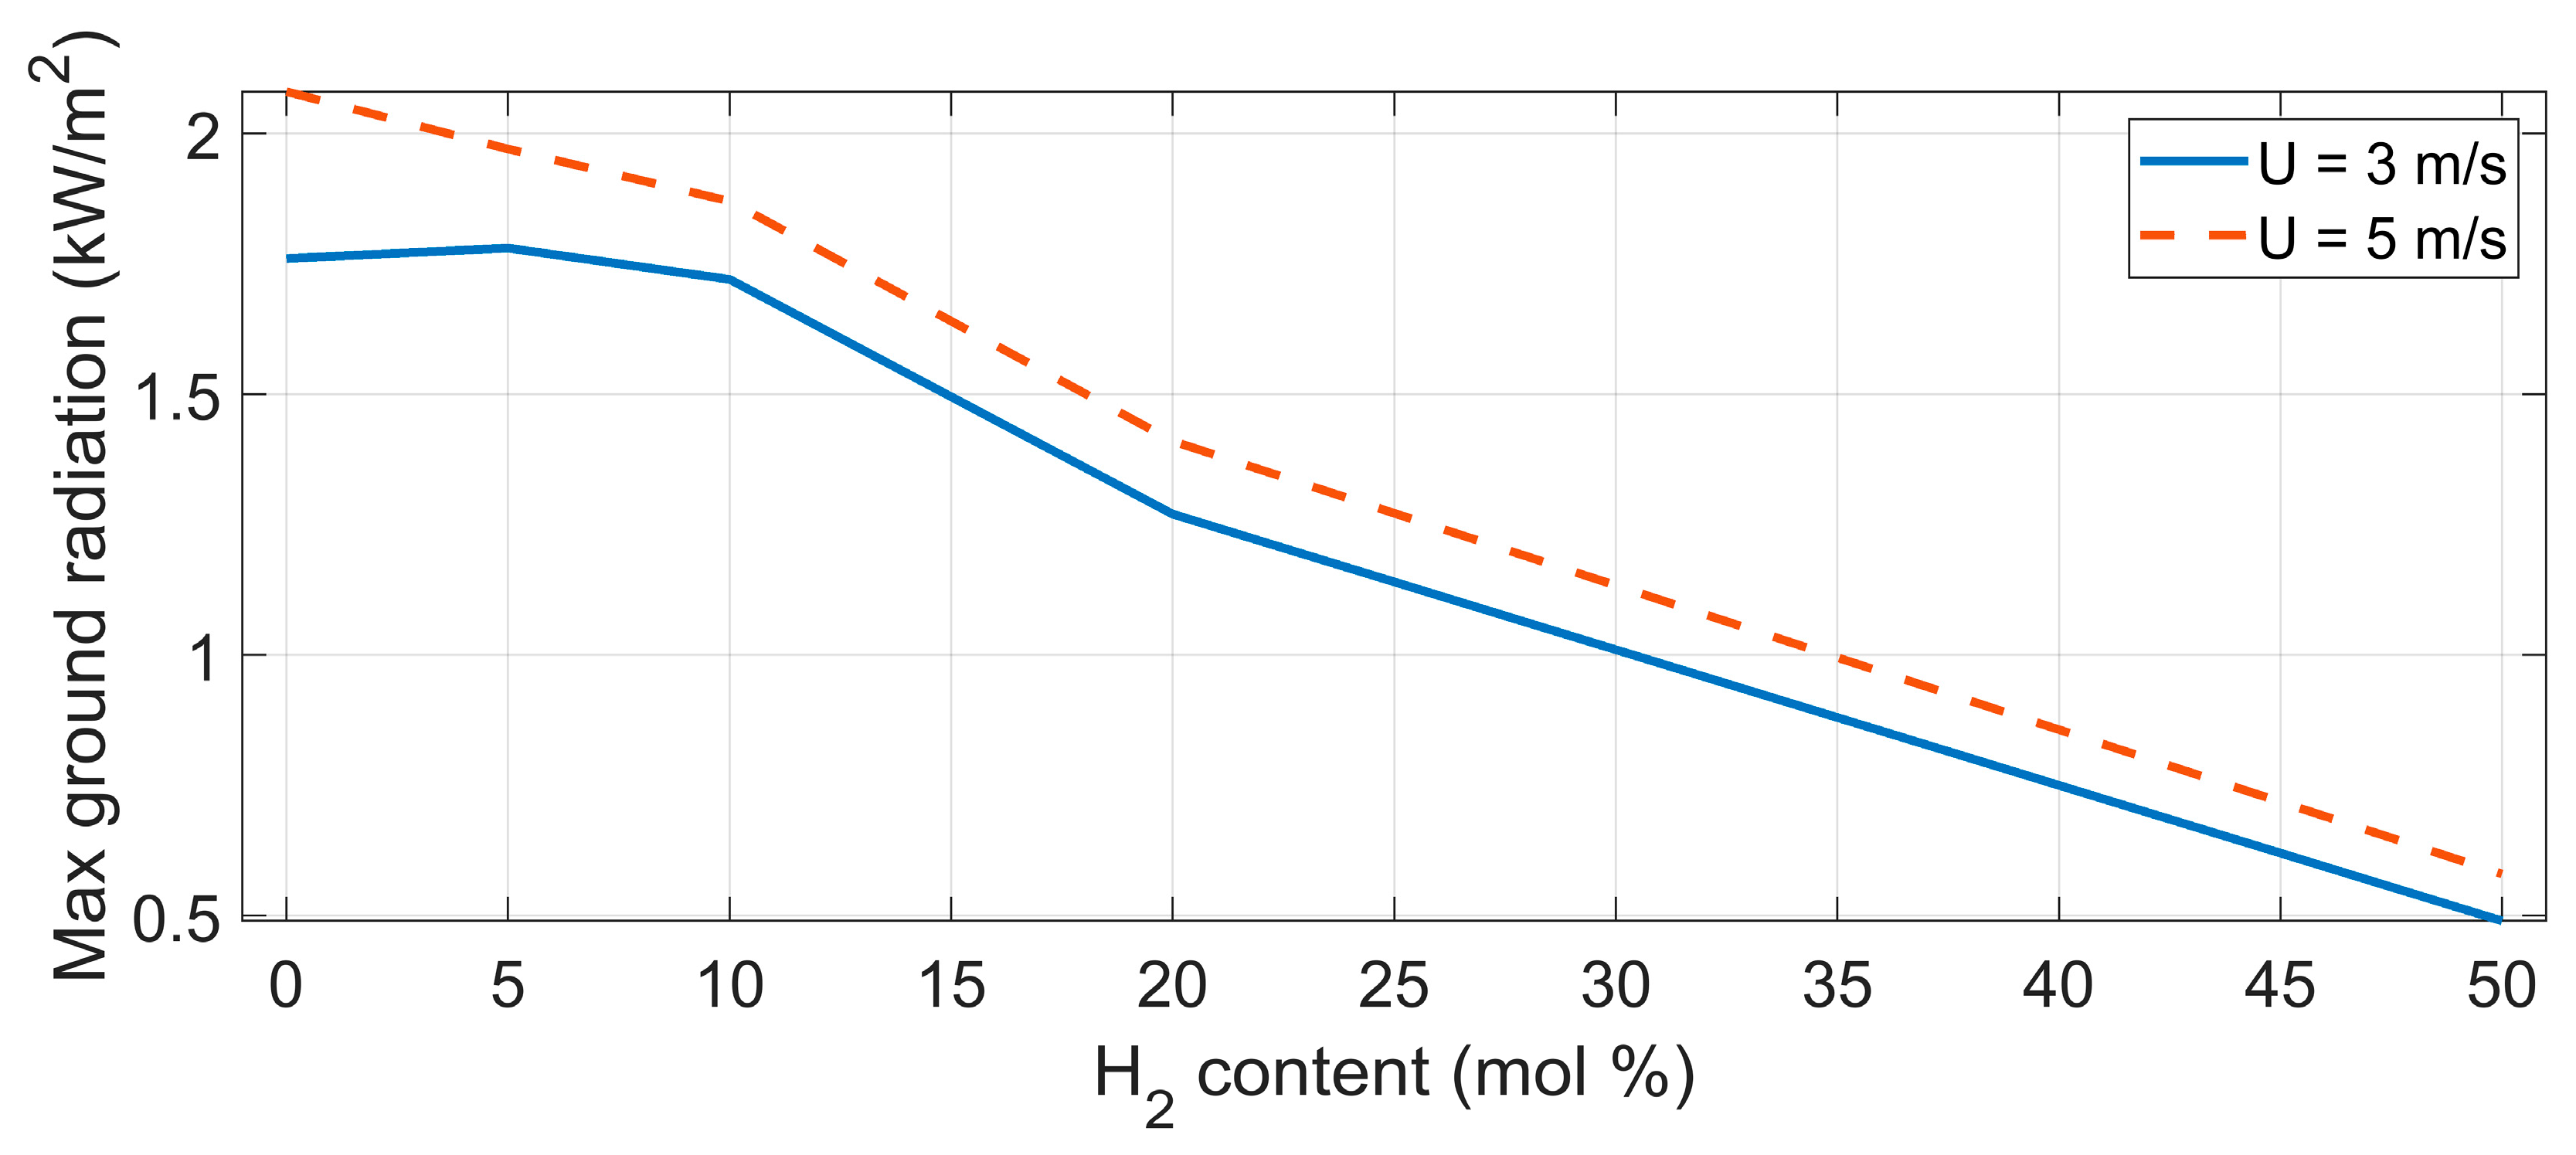
For U = 3 (m·s−1), the curves peak slightly downwind and remain below 2 (kW·m−2) for CH4, with a reduction of the peak as hydrogen is added. Increasing the wind to 5 (m·s−1) tilts the flame and moves the peak further downwind with a modest increase in the local maximum relative to U = 3 (m·s−1) for the same composition. By scenario IV (20% (v/v) H2), the entire profile already falls below 1.58 (kW·m−2), and in scenario V (50% (v/v) H2), the predicted ground-level load is at or below the adopted solar background, 0.8 (kW·m−2), only ambient solar irradiance is effectively perceived at the ground. This trend is consistent with existing studies that report lower radiative fractions and shorter diffusion flames for CH4/H2 blends (e.g., Miller et al. [19]; He et al. [12,21]; Li et al. [23]; Zhou et al. [32]; Zhao et al. [38]; and Kong et al. [36]). Figure 6 condenses Figure 5 into the maximum ground-level radiation attained for each fuel blend and wind speed.
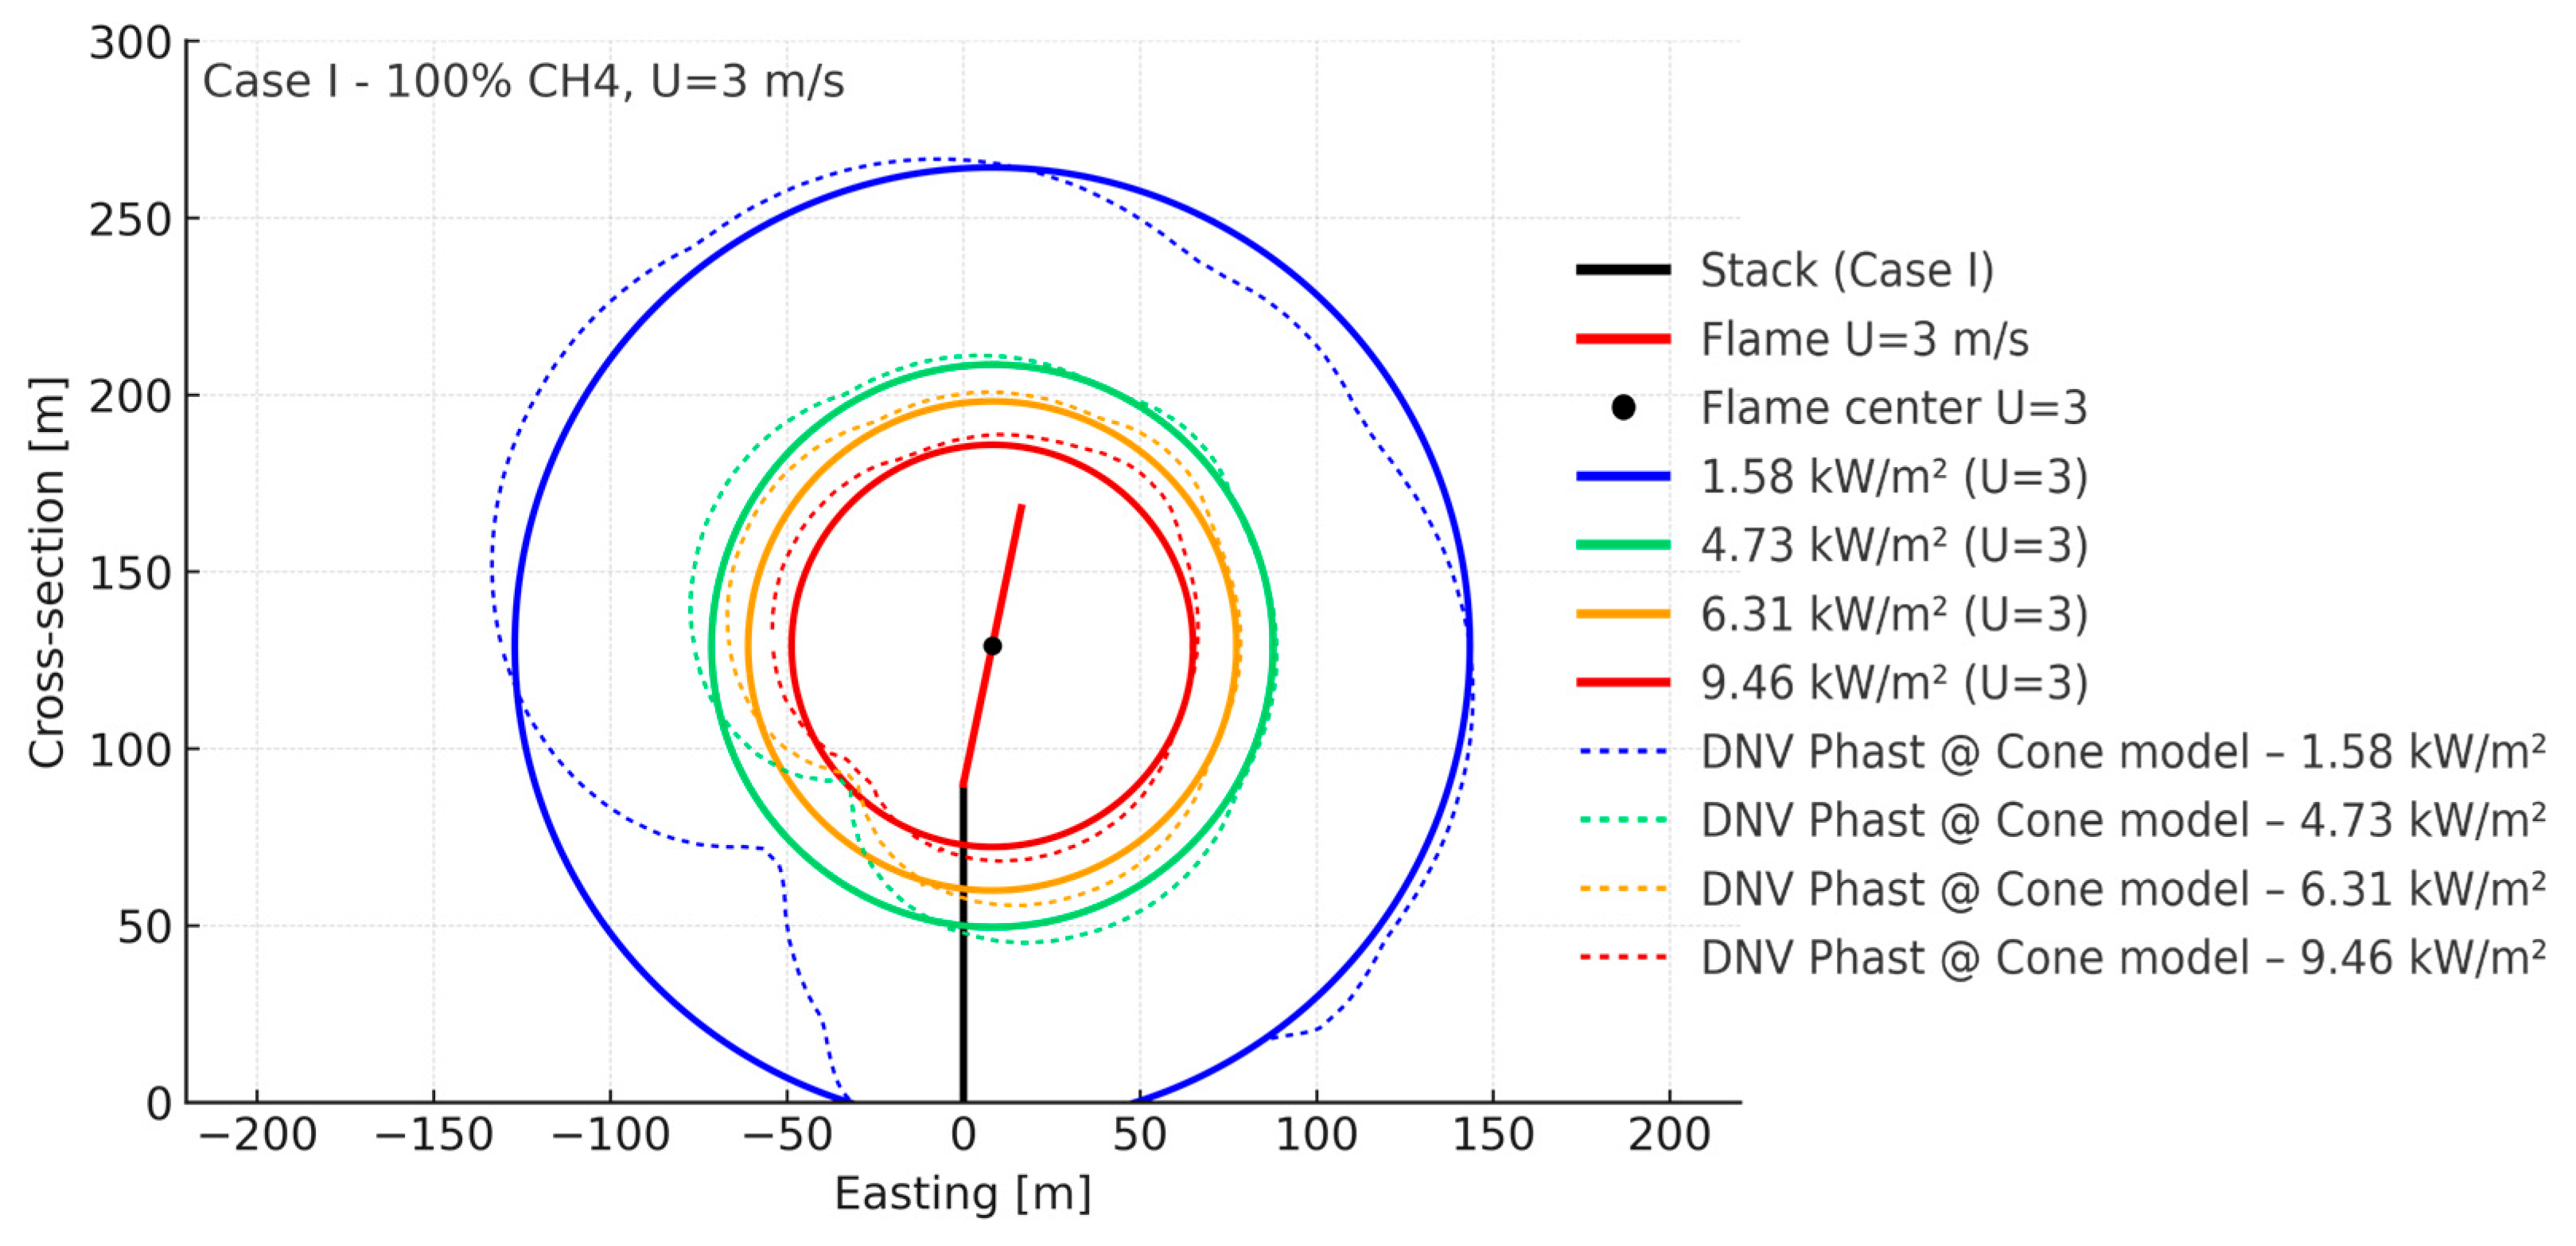
To validate the computational algorithm, we reproduced the scenarios in DNV Phast using identical input data. Figure 7 overlays the side-view isopleths predicted by the Brzustowski–Sommer implementation (solid lines) with contours exported from DNV Phast using the Cone model (dashed lines)—an illustrative result for scenario I–100% (v/v) CH4 at U = 3 (m·s−1).
The agreement is strong across all thresholds. For the inner zones, 9.46, 6.31, and 4.73 (kW·m−2), the DNV Phast Cone model contours and calculated contours are nearly coincident, with only minor azimuthal offsets around the lee side where the flame tilt is most influential. The outer 1.58 (kW·m−2) boundary shows a slightly larger downwind radius in the Cone model, consistent with its treatment of flame lay-down and far-field attenuation. Using the Cone output as reference, a mean radial error (MRE) falls within 3–7 (%) for the three inner thresholds and 8–12 (%) for 1.58 (kW·m−2), with a small bias (mean signed difference) of the order of a few percent. Across all scenarios I–V and both wind speeds, the pooled average MRE is~7.8 (%), median~7.4 (%), with a small downwind-biased signed error of about~2 (%). The pooled mean radial error (MRE) values obtained for each scenario, relative to the DNV Phast Cone model, are presented in Table 7.
The observed trends align with existing literature, which documents a contraction of ground-level radiation footprints as H2 content increases. This phenomenon reflects the transition to low-luminosity flames in methane/hydrogen (CH4/H2) mixtures [11,12,13], indicating significant safety and environmental benefits associated with H2/CH4 blending.
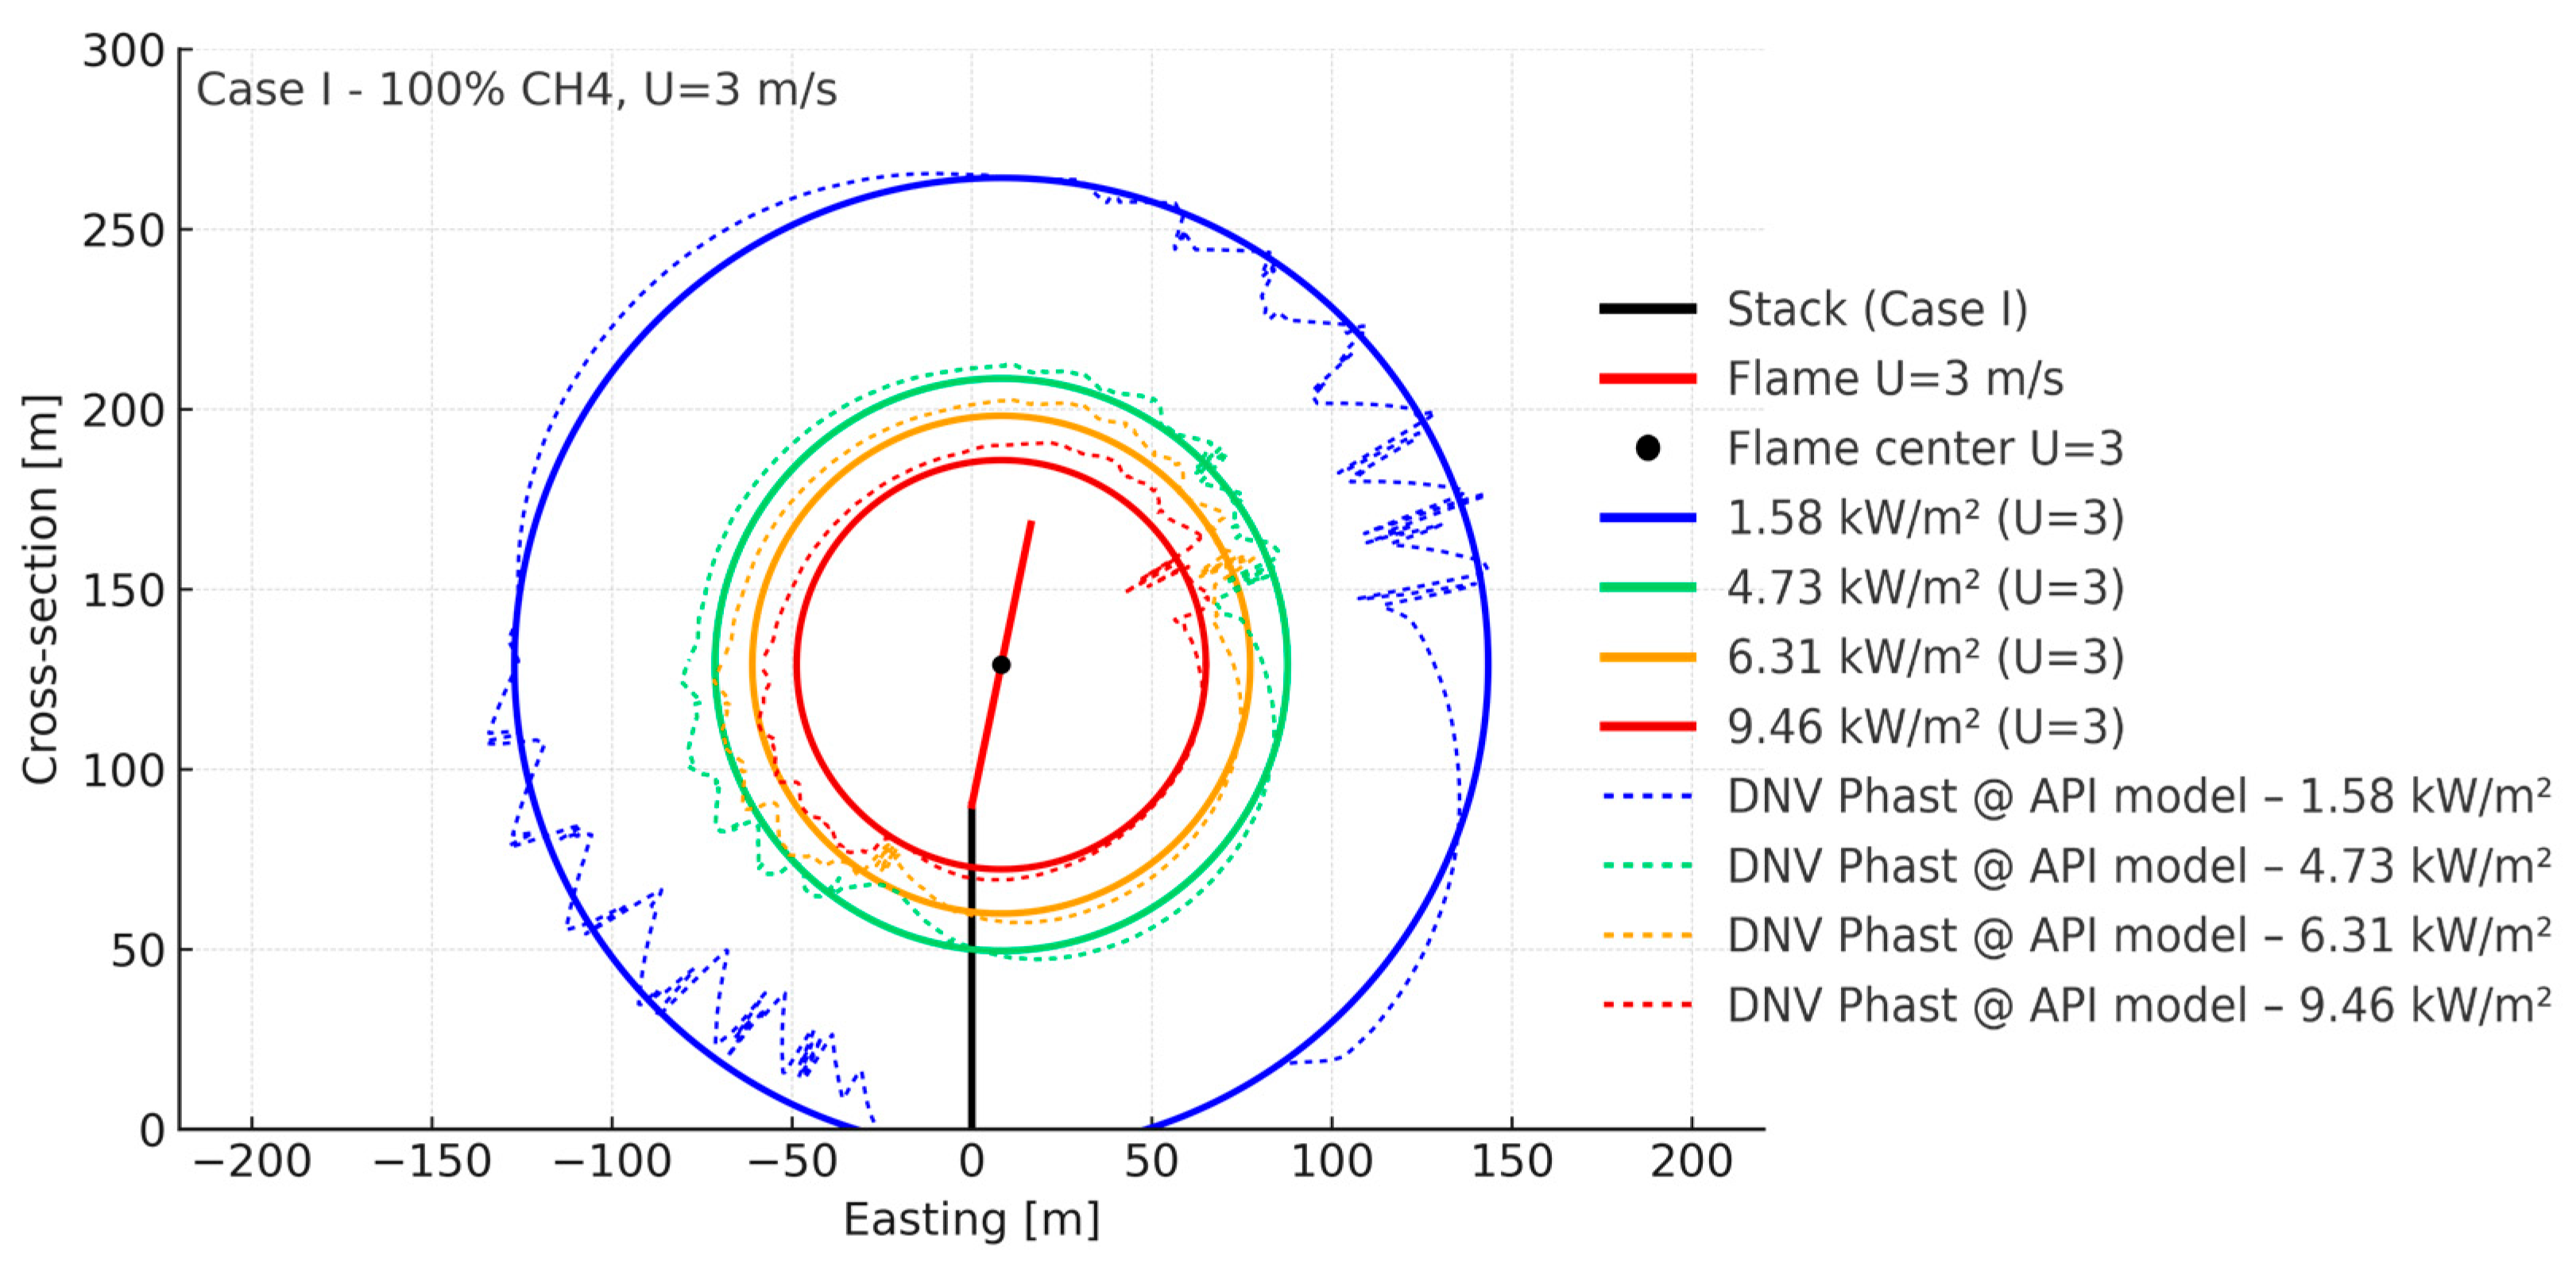
Figure 8 repeats the comparison of the calculated contours with the DNV Phast API radiation model. The contours of the API model exhibit a systematic outward shift for the low–intensity boundary, 1.58 (kW·m−2), while remaining close to the present solution for higher thresholds. This behavior reflects the API model’s more pronounced flame lay-down and effective radiative fraction in the far field; the jagged appearance of the plotted API curves stems from DNV Phast’s contour discretization, not from physical variability.
Compared to the DNV Phast API contours, the pooled MRE by scenario remains in the~7–10% band, with a mild upward drift at higher H2 fractions (Table 8). This is consistent with the API model’s systematic outward shift of the 1.58 kW·m−2 boundary and its far-field treatment; signed bias remains modest (<±3%).
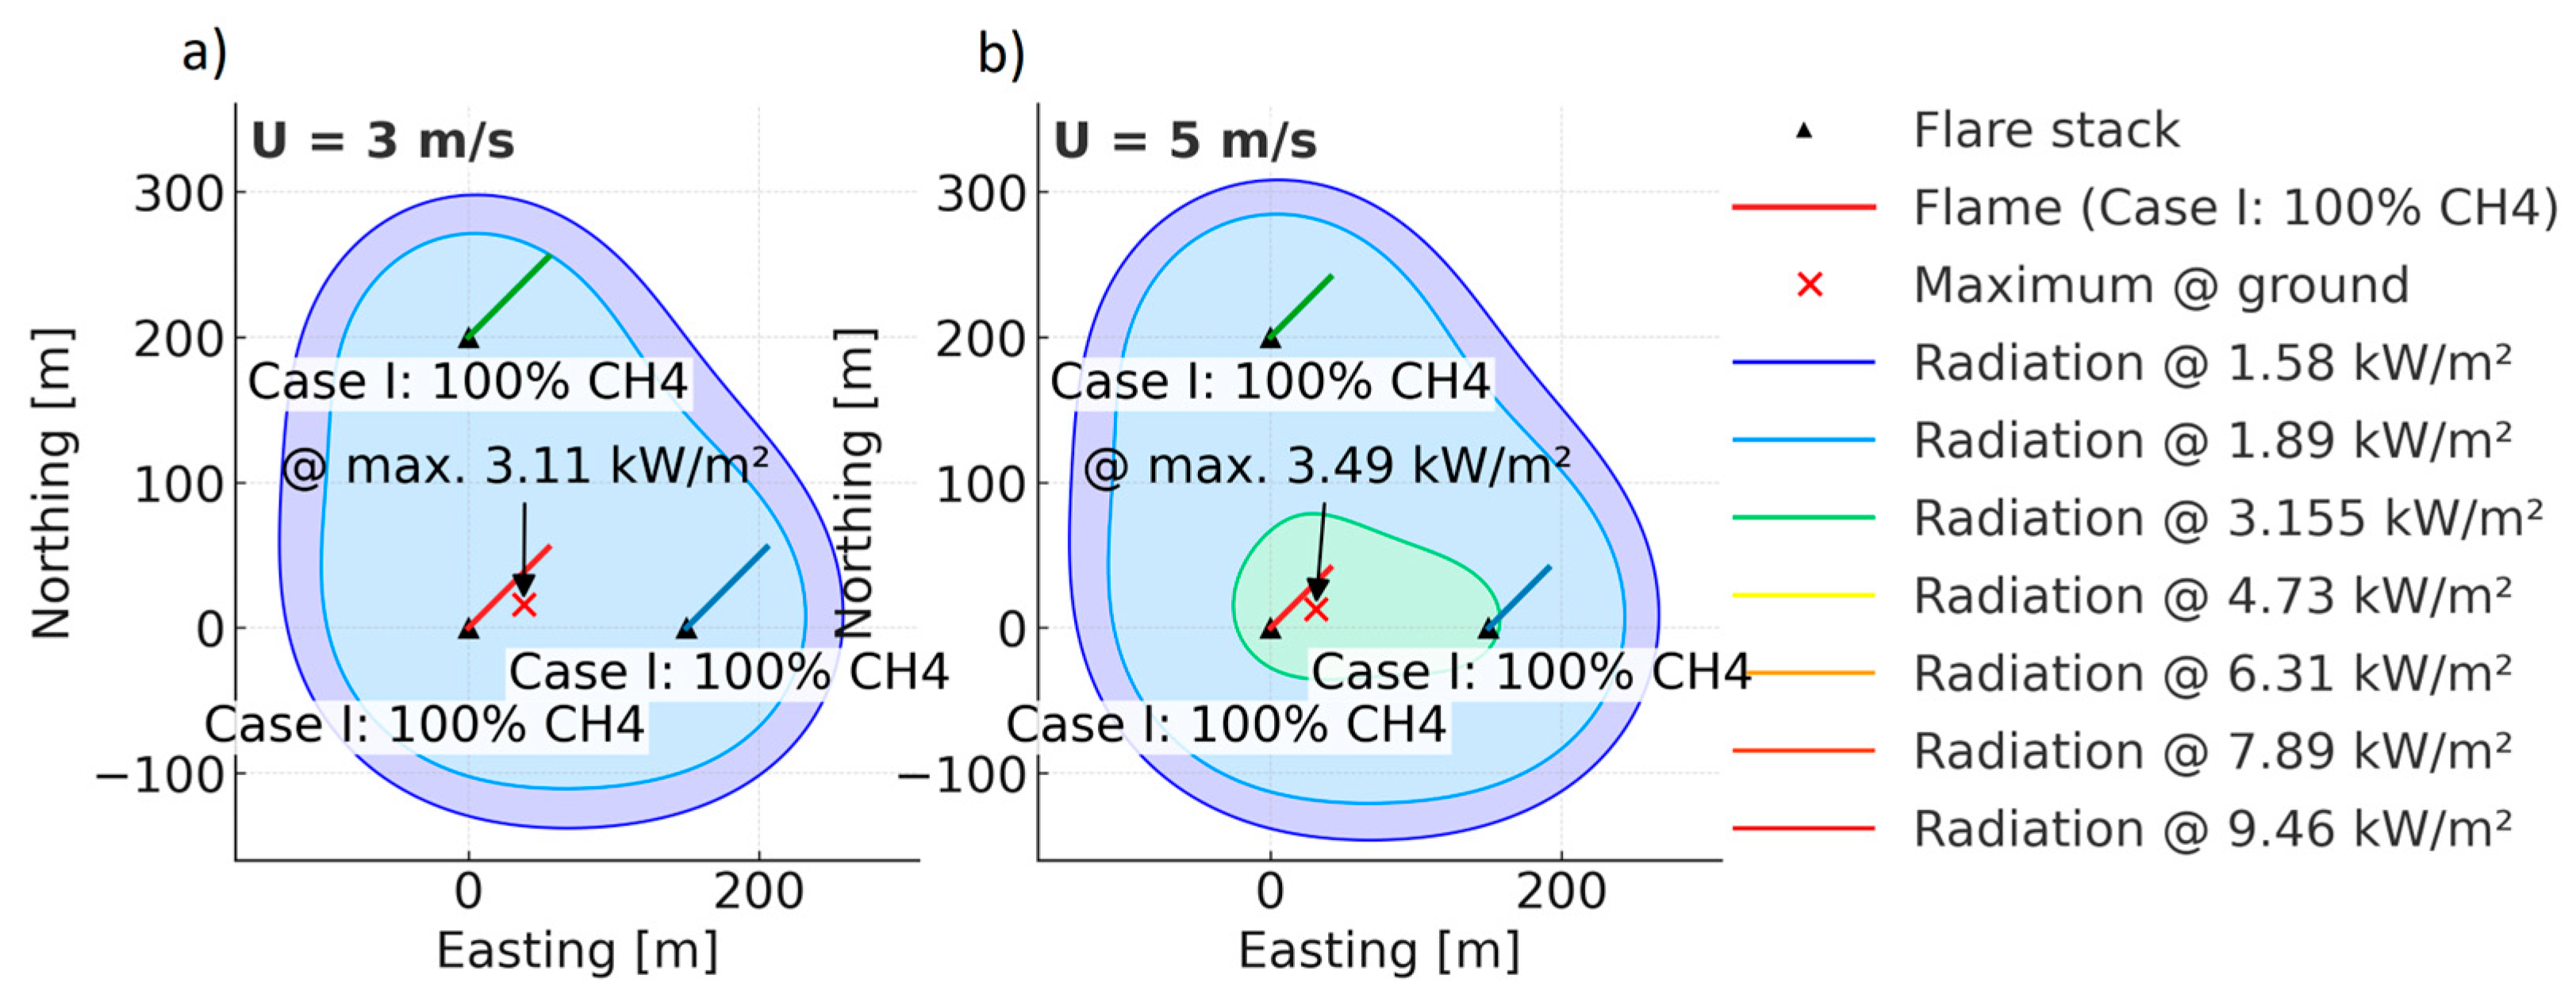
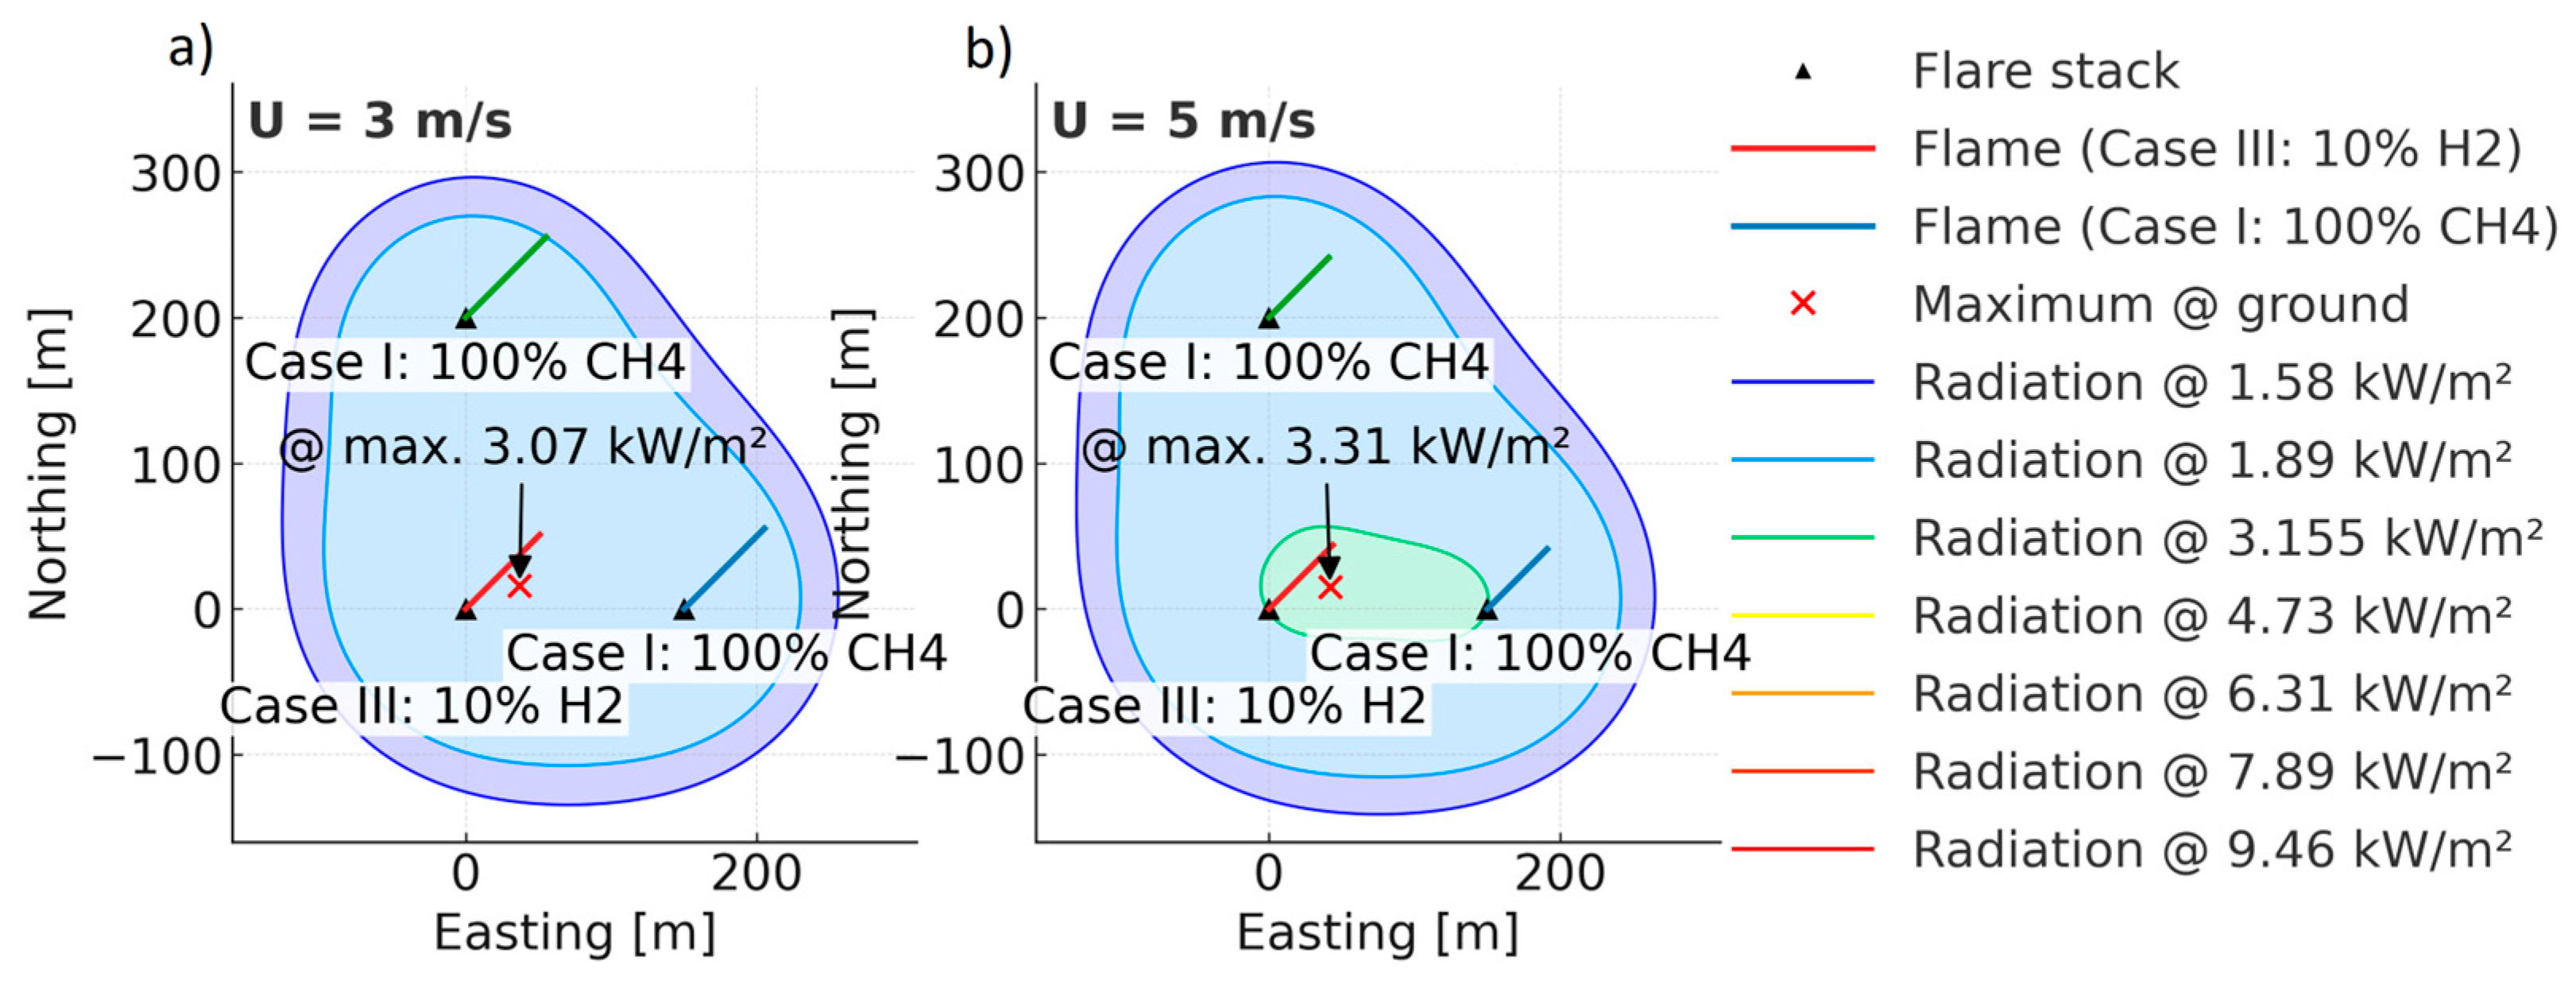
To assess mutual interaction between nearby flares, ground-level radiation fields from each flame were calculated and then superposed. The maps below (Figure 9 and Figure 10) compare the reference scenario with two identical 100% (v/v) CH4 flares to a mixed scenario in which one flare burns a CH4/H2 blend (10% (v/v) H2).
Replacing one of three 100% (v/v) CH4 flare stacks with a 10% (v/v) H2 blend reduced the area of radiation zones and decreased peak ground thermal radiation. With two CH4 flare stacks, the 1.58 (kW·m−2) zones strongly overlap, producing a broad joint footprint. The global ground maximum occurs downwind and increases from 3.11 (kW·m−2) with U = 3 (m·s−1) to 3.49 (kW·m−2) with U = 5 (m·s−1) as stronger wind tilts the flames and lowers the clearance of the flame to the ground on the lee side.
Replacement of a CH4 flare stack with the 10% (v/v) H2 blend reduces the superposed field: the overlapping region above 1.58 (kW·m−2) contracts and the peak ground load drops to 3.07 (kW·m−2) for U = 3 (m·s−1) and 3.31 (kW·m−2) for U = 5 (m·s−1). This demonstrates the potential for improved safety management through hydrogen integration.

4.2. Emission Metrics

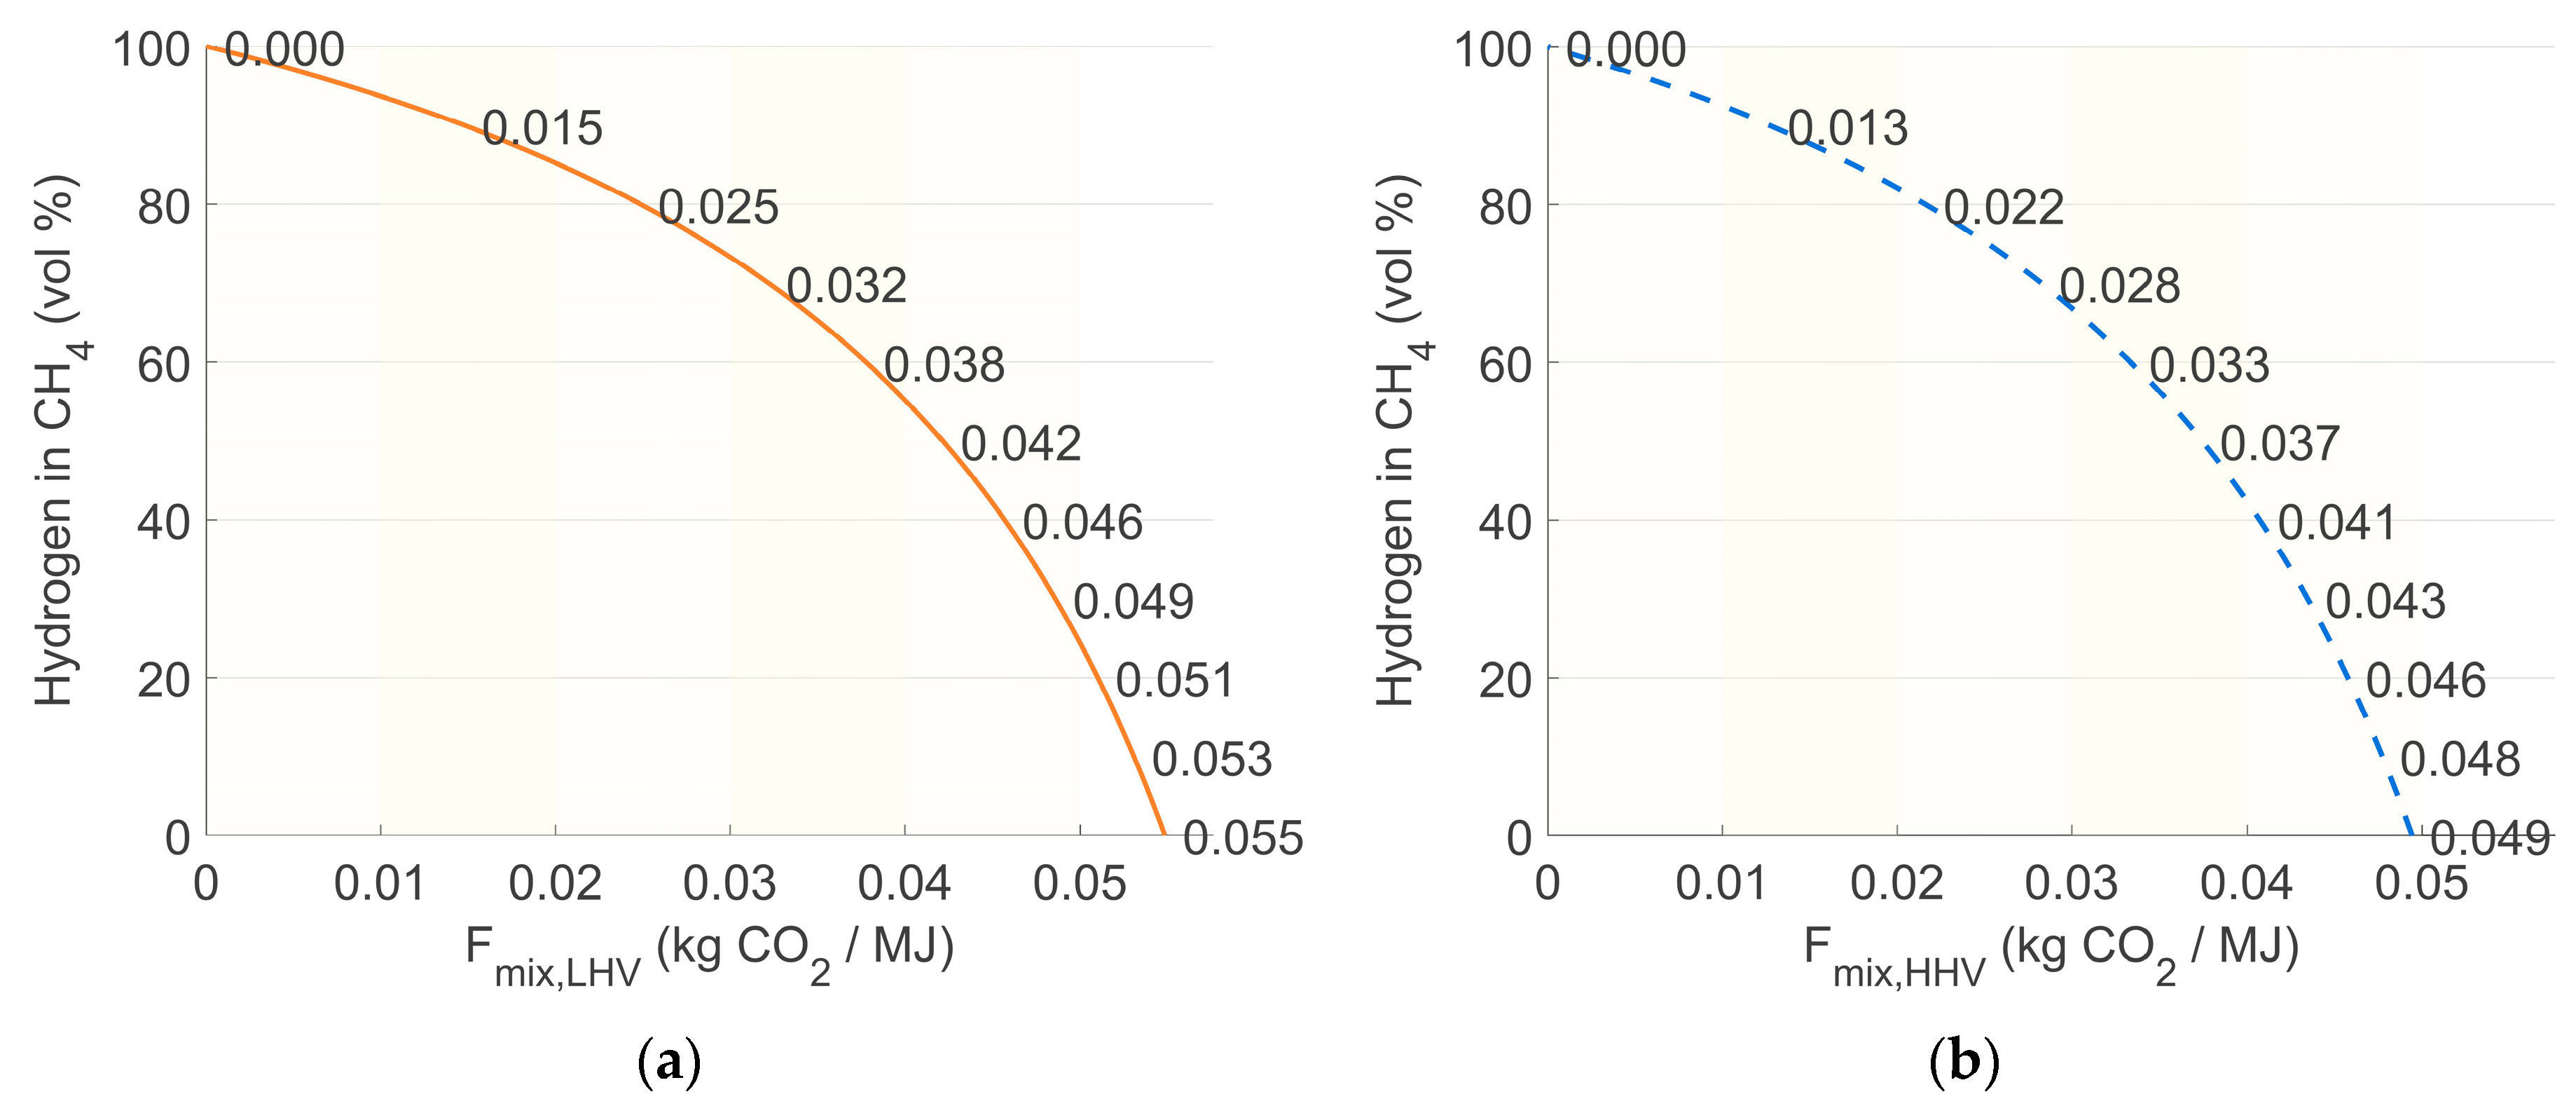
The blended fuel emission factor Fmix was evaluated for the five fuels (scenarios I–V) used in the thermal radiation study, on both LHV and HHV bases (Figure 11, Table 9). A constant molar throughput at the flare tip was assumed. The lower and higher heating values were assumed to be CH4: 802/890 (kJ·mol−1), which is equal to 50,030/55,540 (kJ·kg−1), and H2: 242/286 (kJ·mol−1), which is equal to 120,770/142,550 (kJ·kg−1).
Trends are summarized in Table 9 for the blend levels commonly considered in policy and pilot projects.
At constant molar throughput, replacing 50% (v/v) of CH4 with H2 lowers the CO2 emission factor by 22.18 (%) (LHV) and 24.32 (%) (HHV), which should translate into proportionally lower emissions charges for the same duty. For blend levels relevant to gas distribution, 10–20% (v/v) H2, the reduction is modest but material: 3.24 (%) (LHV)/3.45 (%) (HHV) at 10% (v/v) H2, rising to 7.01 (%) (LHV)/7.44 (%) (HHV) at 20% (v/v) H2. These findings are further supported by the assumptions mentioned in [51,52] and by the emission-factor formulations in the Guidelines for National Greenhouse Gas Inventories [49]. Taken together, these corroborate both the direction and the order of magnitude of the calculated CO2-intensity reductions across 0–50% (v/v) H2.

5. Conclusions

This study shows that, at constant molar throughput, increasing the hydrogen fraction from 0 to 50% (v/v) systematically contracts the 9.46, 6.31, 4.73, and 1.58 kW·m2 thermal radiation envelopes and lowers peak ground radiation. The direction of this composition effect is robust across the examined operating cases.
Introducing a composition-dependent radiative fraction F together with a range-dependent atmospheric transmissivity materially changes the predicted envelope extents relative to the common pairing of hydrocarbon-calibrated F with range-invariant transmissivity. Accounting for humidity and distance effects at the screening stage improves the fidelity of layout estimates without sacrificing simplicity.
For a representative flare stack at wind speeds of 3 and 5 m·s−1, wind primarily modulates flame geometry and envelope shape but does not reverse the composition trend. Hydrogen addition continues to reduce peak ground radiation as wind varies within this range.
In multiflare layouts, superposition of ground-level radiation can exceed any single flare case, underscoring the role of spacing and relative orientation. Partial substitution of CH4 by H2 at equal throughput reduces radiation peaks, offering a practical lever for layout refinement under hydrogen blending.
At the same time, the equivalent CO2 emission rate decreases with hydrogen fraction, pairing smaller radiation footprints with lower emissions. This co-benefit is relevant for screening trade-offs between safety envelopes and environmental performance.
However, it is important to recognize that hydrogen addition can influence NOx emissions because higher flame temperatures and increased combustion intensity may promote their formation. Where hydrogen blending is pursued, additional NOx mitigation measures may be required to ensure compliance with environmental standards and safe operation.
The implemented solver, based on the Brzustowski–Sommer methodology, augmented with composition-aware F and range-dependent transmissivity, therefore provides a practical, low-cost tool for hydrogen-aware layout screening and option ranking in both single and multiflare contexts.
The approach is correlation-based and steady-state. Molecular diffusion and soot chemistry are not explicitly resolved, meteorology is represented by discrete wind cases, and geometry is fixed for screening. These choices are appropriate for early-stage design, but critical applications should be complemented by site-specific sensitivity studies, refined F and transmissivity calibration, broader validation across flare hardware, and, where warranted, higher fidelity modeling. Future work will couple the solver to site meteorological statistics and enable automated spacing optimization for multiflare arrays under hydrogen blending.

Author Contributions

Conceptualization, P.B.; methodology, P.B.; validation, S.K. and S.N.; formal analysis, P.B.; investigation, P.B.; resources, P.B.; software, P.B.; data curation, P.B.; writing—original draft preparation, P.B.; writing—review and editing, P.B.; visualization, P.B.; supervision, S.K. and S.N.; funding acquisition, S.N. All authors have read and agreed to the published version of the manuscript.

Funding

The authors acknowledge the support and funding received from the Ministry of Education and Science subsidy and IDUB D4 no. 10688.

Data Availability Statement

Publicly available datasets were analyzed in this study.

Conflicts of Interest

The authors declare no conflicts of interest.

Abbreviations

The following abbreviations are used in this manuscript:
APIAmerican Petroleum Institute
API Std 521API Standard 521: Pressure-Relieving and Depressuring Systems
CFDComputational Fluid Dynamics
CH4Methane
CO2Carbon dioxide
DNV PhastProcess hazard analysis software by DNV
EU ETSEuropean Union Emissions Trading System
EIA (US EIA)United States Energy Information Administration
EPA (US EPA)United States Environmental Protection Agency
HHVHigher Heating Value (gross calorific value)
H2Hydrogen
H2OWater (steam)
IEAInternational Energy Agency
IPCCIntergovernmental Panel on Climate Change
ISOInternational Organization for Standardization
ISO 23251International standard equivalent to API 521
LELLower Explosive Limit
LELmixLower Explosive Limit of the fuel blend (Le Chatelier’s rule)
LHVLower Heating Value (Net Calorific Value)
LNGLiquefied Natural Gas
MIEMinimum Ignition Energy
MREMean Radial Error (contour-matching metric)
MRR (EU)Monitoring & Reporting Regulation (EU) 2018/2066
NCVNet Calorific Value (equal to LHV)
NGNatural Gas
NOxNitrogen oxides
RTERadiative Transfer Equation
Symbols
aisoIsentropic (reference) speed of sound of the gas
drad(Rk)First-pass (no-atmosphere) estimate of the critical distance at threshold Rk
DcCorrected distance after applying atmospheric transmissivity along the line of sight
dj·RDimensionless momentum–wind parameter used in Brzustowski–Sommer correlations
EFEmission factor (mass of CO2 per unit energy)
EFmixEmission factor of the fuel blend (generic)
EFmix,LHVEmission factor of the blend on an LHV basis
EFmix,HHVEmission factor of the blend on an HHV basis
FFraction of heat radiated (radiative fraction of total chemical heat release)
HFlare stack height
HHVCH4Higher Heating Value of methane (molar or mass basis per context)
HHVH2Higher Heating Value of hydrogen (molar or mass basis per context)
LTotal flame length
LHVCH4Lower Heating Value of methane (molar or mass basis per context)
LHVH2Lower Heating Value of hydrogen (molar or mass basis per context)
m ˙ Total mass flow rate of the gas
mCH4Mass flow rate of methane in the blend
mH2Mass flow rate of hydrogen in the blend
m ˙ totalTotal mass flow rate
mCO2Molar mass (or produced moles) of carbon dioxide used in EF derivations (per equation context)
MMach number (ratio of jet exit velocity to aiso)
MWMolecular weight of a pure component (per species)
MWairMolecular weight of air
MWmixMolecular weight of the blend
n ˙ CH4Molar flow rate of methane
n ˙ H2Molar flow rate of hydrogen
OFOxidation factor in IPCC accounting (fraction of carbon oxidized to CO2)
pStatic pressure used in density/velocity relations at the tip
QTotal chemical heat release rate (thermal power of combustion)
RUniversal gas constant (as used in state/velocity relations)
RkDesign thermal radiation threshold level used for zoning criteria
RLine-of-sight distance between flame center and ground receptor
r(x)Ground-level radiative heat flux along the wind axis as a function of horizontal coordinate x
RHAmbient relative humidity (appears in τ correlation)
TGas temperature (local/at tip as defined in context)
TairAmbient air temperature used in correlations
TmixGas temperature at the flare tip
TAmbient (free-stream) temperature
τ(RH, r)Atmospheric transmissivity along the line of sight; function of RH and distance r
UWind speed at stack height (crosswind)
UjJet (exit) velocity at the flare tip
W ˙ Normal (standard-state) volumetric flow rate of the gas
xDownwind horizontal coordinate on the ground
xcDownwind coordinate of flame center (from stack axis)
ycVertical rise of flame center above the tip
yMolar (volume) fraction of hydrogen in the blend (generic)
yH2Explicit notation for hydrogen molar fraction in the blend
ΡGas density at tip conditions (used in velocity/flow relations)

References

  1. Directive (EU) 2024/1788 of the European Parliament and of the Council of 13 June 2024 on Common Rules for the Internal Markets for Renewable Gas, Natural Gas and Hydrogen. OJ L 2024/1788, 15 July 2024. Available online: https://eur-lex.europa.eu/eli/dir/2024/1788/oj (accessed on 10 August 2025).
  2. Regulation (EU) 2024/1789 of the European Parliament and of the Council of 13 June 2024 on the Internal Markets for Renewable Gas, Natural Gas and Hydrogen. OJ L 2024/1789, 15 July 2024. Available online: https://eur-lex.europa.eu/eli/reg/2024/1789/oj (accessed on 10 August 2025).
  3. Jones, D.R.; Al-Masry, W.A.; Dunnill, C.W. Hydrogen-Enriched Natural Gas as a Domestic Fuel: An Analysis Based on Flash-Back and Blow-Off Limits for Domestic Natural Gas Appliances within the UK. Sustain. Energy Fuels 2018, 2, 710–723. [Google Scholar] [CrossRef]
  4. Isaac, T. HyDeploy: The UK’s First Hydrogen Blending Deployment Project. Clean Energy 2019, 3, 114–125. [Google Scholar] [CrossRef]
  5. Leicher, J.; Schaffert, J.; Cigarida, H.; Tali, E.; Burmeister, F.; Giese, A.; Albus, R.; Görner, K.; Carpentier, S.; Milin, P.; et al. The Impact of Hydrogen Admixture into Natural Gas on Residential and Commercial Gas Appliances. Energies 2022, 15, 777. [Google Scholar] [CrossRef]
  6. Bertasini, D.; Battista, F.; Rizzioli, F.; Frison, N.; Bolzonella, D. Decarbonization of the European natural gas grid using hydrogen and methane biologically produced from organic waste: A critical overview. Renew. Energy 2023, 206, 386–396. [Google Scholar] [CrossRef]
  7. Franco, A. Industrial Decarbonization through Blended Combustion of Natural Gas and Hydrogen. Thermo 2024, 5, 29. [Google Scholar] [CrossRef]
  8. Mahfoozi, S.; van Zoelen, R.; Jepma, C. D4.1. Introducing Hydrogen in decentral end-user areals to deal with e-grid congestion in the Netherlands (Report). Zenodo 2022. [Google Scholar] [CrossRef]
  9. United States Environmental Protection Agency (EPA). 40 CFR §60.18—General Control Device and Work Practice Standards for Flares. Available online: https://www.ecfr.gov/current/title-40/part-60/section-60.18 (accessed on 10 August 2025).
  10. U.S. Environmental Protection Agency (EPA). EPA Air Pollution Control Cost Manual. Section 3–VOC Controls Section 3.2–VOC Destruction Controls. Chapter 1: Flares; U.S. Environmental Protection Agency: Research Triangle Park, NC, USA, 2019. [Google Scholar]
  11. Miller, D. New Model for Predicting Thermal Radiation from Flares and High-Pressure Jet Fires for Hydrogen and Syngas. Process Saf. Prog. 2017, 36, 237–251. [Google Scholar] [CrossRef]
  12. He, Y.; Pu, L.; Sun, R.; Yan, T.; Tan, H.; Zhang, Z. Development and Application of Hydrogen Flare Radiation Model for Assessing Hazard Distance. Int. J. Hydrogen Energy 2024, 49, 1161–1173. [Google Scholar] [CrossRef]
  13. Government of Alberta. Heat Radiation from Flares; Alberta Environment: Edmonton, AB, Canada, 2005; Available online: https://open.alberta.ca/publications/0778511898 (accessed on 10 August 2025).
  14. Marzouk, O.A. Adiabatic Flame Temperatures for Air-Methane and Air-Hydrogen Stoichiometric Combustion Using NASA CEARUN and Cantera. arXiv 2025, arXiv:2503.11826. [Google Scholar] [CrossRef]
  15. American Petroleum Institute (API). API Standard 521: Pressure-Relieving and Depressuring Systems, 7th ed.; American Petroleum Institute: Washington, DC, USA, 2023. [Google Scholar]
  16. Bernardy, C.; Habib, A.K.; Kluge, M.; Orchini, A. Heat Radiation Emanating from Hydrogen and Methane Jet Fires. Chem. Eng. Trans. 2025, 116, 385–390. [Google Scholar] [CrossRef]
  17. Zhang, H.; Cao, X.; Yuan, X.; Wu, F.; Wang, J.; Zhang, Y.; Li, Q.; Liu, H.; Huang, Z. Study on Thermal Radiation Characteristics and the Multi-Point Source Model of Hydrogen Jet Fire. Appl. Sci. 2024, 14, 7098. [Google Scholar] [CrossRef]
  18. Zhou, K.; Wang, X. Thermal Radiation Modelling of Pool Fire with Consideration on the Nonuniform Temperature in Flame Volume. Int. J. Therm. Sci. 2019, 138, 12–23. [Google Scholar] [CrossRef]
  19. Miller, D.; Jung, S.; Lutostansky, E. Applicability of Currently Available Flare Radiation Models for Hydrogen and Syngas. Process Saf. Prog. 2015, 34, 141–146. [Google Scholar] [CrossRef]
  20. Rossiello, G.; Uzair, M.A.; Ahmadpanah, S.B.; Morandi, L.; Ferrara, M.; Rago, G.D.; Molfetta, G.; Saponaro, A.; Torresi, M. Design and Testing of a Multi-Fuel Industrial Burner Suitable for Syngases, Flare Gas and Pure Hydrogen. Therm. Sci. Eng. Prog. 2023, 42, 101845. [Google Scholar] [CrossRef]
  21. Sun, R.; Pu, L.; He, Y.; Yan, T.; Tan, H.; Lei, G.; Li, Y. Investigation of the Leakage and Diffusion Characteristics of Hydrogen-Addition Natural Gas from Indoor Pipelines. Int. J. Hydrogen Energy 2023, 48, 38922–38934. [Google Scholar] [CrossRef]
  22. Benard, P.; Mustafa, V.; Hay, D.R. Safety Assessment of Hydrogen Disposal on Vents and Flare Stacks at High Flow Rates. Int. J. Hydrogen Energy 1999, 24, 489–495. [Google Scholar] [CrossRef]
  23. Li, Y.; Kuang, Z.; Fan, Z.; Shuai, J. Evaluation of the Safe Separation Distances of Hydrogen-Blended Natural Gas Pipelines in a Jet Fire Scenario. Int. J. Hydrogen Energy 2023, 48, 18804–18815. [Google Scholar] [CrossRef]
  24. Lévai, E.; Bereczky, Á. Effect of Hydrogen Mixing on the Flame Geometry of Natural Gas-Powered Equipment. Pollack Period. 2025, 20, 119–123. [Google Scholar] [CrossRef]
  25. Sorgulu, F.; Ozturk, M.; Javani, N.; Dincer, I. Experimental Investigation for Combustion Performance of Hydrogen and Natural Gas Fuel Blends. Int. J. Hydrogen Energy 2023, 48, 34476–34485. [Google Scholar] [CrossRef]
  26. Schefer, R.W.; Houf, W.G.; Bourne, B.; Colton, J. Spatial and Radiative Properties of an Open-Flame Hydrogen Plume. Int. J. Hydrogen Energy 2006, 31, 1332–1340. [Google Scholar] [CrossRef]
  27. Ilbas, M. The Effect of Thermal Radiation and Radiation Models on Hydrogen–Hydrocarbon Combustion Modelling. Int. J. Hydrogen Energy 2005, 30, 1113–1126. [Google Scholar] [CrossRef]
  28. Baird, A.R.; Glover, A.M.; Ehrhart, B.D. Review of Release Behavior of Hydrogen & Natural Gas Blends from Pipelines (SAND2021-9802); Sandia National Laboratories: Albuquerque, NM, USA, 2021. [Google Scholar] [CrossRef]
  29. Willoughby, D.; Royle, M.; Nilsen, S.; Gautier, T. Hydrogen Venting under Variable Flow Conditions. In Proceedings of the 4th International Conference on Hydrogen Safety (ICHS 2011), San Francisco, CA, USA, 12–14 September 2011; Available online: https://conference.ing.unipi.it/ichs2011/papers/162.pdf (accessed on 21 August 2025).
  30. Shan, S.; Jin, G.; Han, X.; Qin, Q.; Miao, L.; Zhou, Z. Numerical Study on the Radiation Characteristics of Hydrogen-Blended Natural Gas Combustion. Combust. Sci. Technol. 2025, 1–27. [Google Scholar] [CrossRef]
  31. Froeling, H.A.J.; Dröge, M.T.; Nane, G.F.; Van Wijk, A.J.M. Quantitative Risk Analysis of a Hazardous Jet Fire Event for Hydrogen Transport in Natural Gas Transmission Pipelines. Int. J. Hydrogen Energy 2021, 46, 10411–10422. [Google Scholar] [CrossRef]
  32. Zhou, L.; Zeng, D.; Li, D.; Chaos, M. Total Radiative Heat Loss and Radiation Distribution of Liquid Pool Fire Flames. Fire Saf. J. 2017, 89, 16–21. [Google Scholar] [CrossRef]
  33. Witkowski, A.; Rusin, A.; Majkut, M.; Stolecka, K. Analysis of Compression and Transport of the Methane/Hydrogen Mixture in Existing Natural Gas Pipelines. Int. J. Press. Vessels Pip. 2018, 166, 24–34. [Google Scholar] [CrossRef]
  34. H2Tools (PNNL). Hydrogen Flames. Available online: https://h2tools.org/bestpractices/laboratory-safety/laboratory-operations/hydrogen-hazards/hydrogen-flames (accessed on 10 August 2025).
  35. Schefer, R.W.; Patterson, B.D.; Kulatilaka, W.D.; Settersten, T.B. Visible Emission of Hydrogen Flames. Combust. Flame 2009, 156, 1234–1241. [Google Scholar] [CrossRef]
  36. Kong, Y.; Li, Y.; Wang, S.; Duan, P.; Zhu, J.; Han, H.; Han, J. Large-Scale Experimental Study on Jet Flame Length of Hydrogen-Blended Natural Gas and Inverse Methods for Optimizing the Weighted Multi-Point Source Model. Fuel 2024, 367, 131434. [Google Scholar] [CrossRef]
  37. Lowesmith, B.J.; Hankinson. Large Scale High Pressure Jet Fires Involving Natural Gas and Natural Gas/Hydrogen Mixtures. Process Saf. Environ. Prot. 2012, 90, 212–224. [Google Scholar] [CrossRef]
  38. Zhao, C.; Sun, L.; Ma, H.; Xiao, H. An Experimental Study of the Characteristics of Blended Hydrogen–Methane Non-Premixed Jet Flames. Process Saf. Environ. Prot. 2023, 171, 265–278. [Google Scholar] [CrossRef]
  39. Singh, S.; Jain, S.; PS, V.; Tiwari, A.K.; Nouni, M.R.; Pandey, J.K.; Goel, S. Hydrogen: A Sustainable Fuel for Future Energy. Renew. Sustain. Energy Rev. 2015, 51, 623–633. [Google Scholar] [CrossRef]
  40. National Renewable Energy Laboratory (NREL). Life Cycle Assessment of Hydrogen Production via Natural Gas Steam Reforming. NREL/TP-570-27637. 2001. Available online: https://www.nrel.gov/docs/fy01osti/27637.pdf (accessed on 10 August 2025).
  41. Ghosh, A.; Munoz-Munoz, N.M.; Chatelain, K.P.; Lacoste, D.A. Laminar Burning Velocity of Hydrogen-, Methane-, Ethane-, Ethylene-Air Mixtures. Applications in Energy and Combustion Science 2022, 12, 100094. [Google Scholar] [CrossRef]
  42. Rijksinstituut voor Volksgezondheid en Milieu (RIVM). A Comparison of Jet Fire Models for Horizontal Two-Phase Jet Fires. RIVM Report 620550005. 2012. Available online: https://www.rivm.nl/bibliotheek/rapporten/620550005.pdf (accessed on 10 August 2025).
  43. Molina, A.; Schefer, R.W.; Houf, W.G. Radiative Fraction and Optical Thickness in Large-Scale Hydrogen-Jet Fires. Proc. Combust. Inst. 2007, 31, 2565–2572. [Google Scholar] [CrossRef]
  44. Brzustowski, T.A.; Sommer, E.C., Jr. Predicting Radiant Heating from Flares. API Proc. 1973, 53, 865–893. [Google Scholar]
  45. Mashuga, C.V.; Crowl, D.A. Derivation of Le Chatelier’s Mixing Rule for Flammable Limits. Process Saf. Prog. 2000, 19, 112–117. [Google Scholar] [CrossRef]
  46. ISO 13443:1996; Natural Gas—Standard Reference Conditions. International Organization for Standardization: Geneva, Switzerland, 1996.
  47. Buczyński, R.; Uryga-Bugajska, I.; Tokarski, M. Recent advances in low-gradient combustion modelling of hydrogen fuel blends. Fuel 2022, 328, 125265. [Google Scholar] [CrossRef]
  48. International Energy Agency (IEA). Direct CO2 Combustion Emissions from Flaring and Flaring Intensity in the Net Zero Scenario, 2010–2030. Available online: https://www.iea.org/data-and-statistics/ (accessed on 10 August 2025).
  49. IPCC. 2006 IPCC Guidelines for National Greenhouse Gas Inventories, Volume 2: Energy; Institute for Global Environmental Strategies (IGES): Hayama, Japan, 2006; Available online: https://www.ipcc-nggip.iges.or.jp/public/2006gl/ (accessed on 10 August 2025).
  50. U.S. Energy Information Administration (EIA). Carbon Dioxide Emissions Coefficients. Release 18 September 2024. Available online: https://www.eia.gov/environment/emissions/co2_vol_mass.php (accessed on 10 August 2025).
  51. Commission Implementing Regulation (EU) 2018/2066 of 19 December 2018 on the Monitoring and Reporting of Greenhouse Gas Emissions Pursuant to Directive 2003/87/EC of the European Parliament and of the Council and Amending Commission Regulation (EU) No 601/2012. OJ L 334, 1–93. Available online: https://eur-lex.europa.eu/legal-content/EN/TXT/?uri=CELEX:32018R2066 (accessed on 10 August 2025).
  52. U.S. Environmental Protection Agency (EPA). 40 CFR Part 98, Subpart C—General Stationary Fuel Combustion Sources. Available online: https://www.ecfr.gov/current/title-40/part-98/subpart-C (accessed on 10 August 2025).
  53. National Fire Protection Association (NFPA). NFPA 69: Standard on Explosion Prevention Systems, 2024th ed.; National Fire Protection Association: Washington, DC, USA, 2024. [Google Scholar]
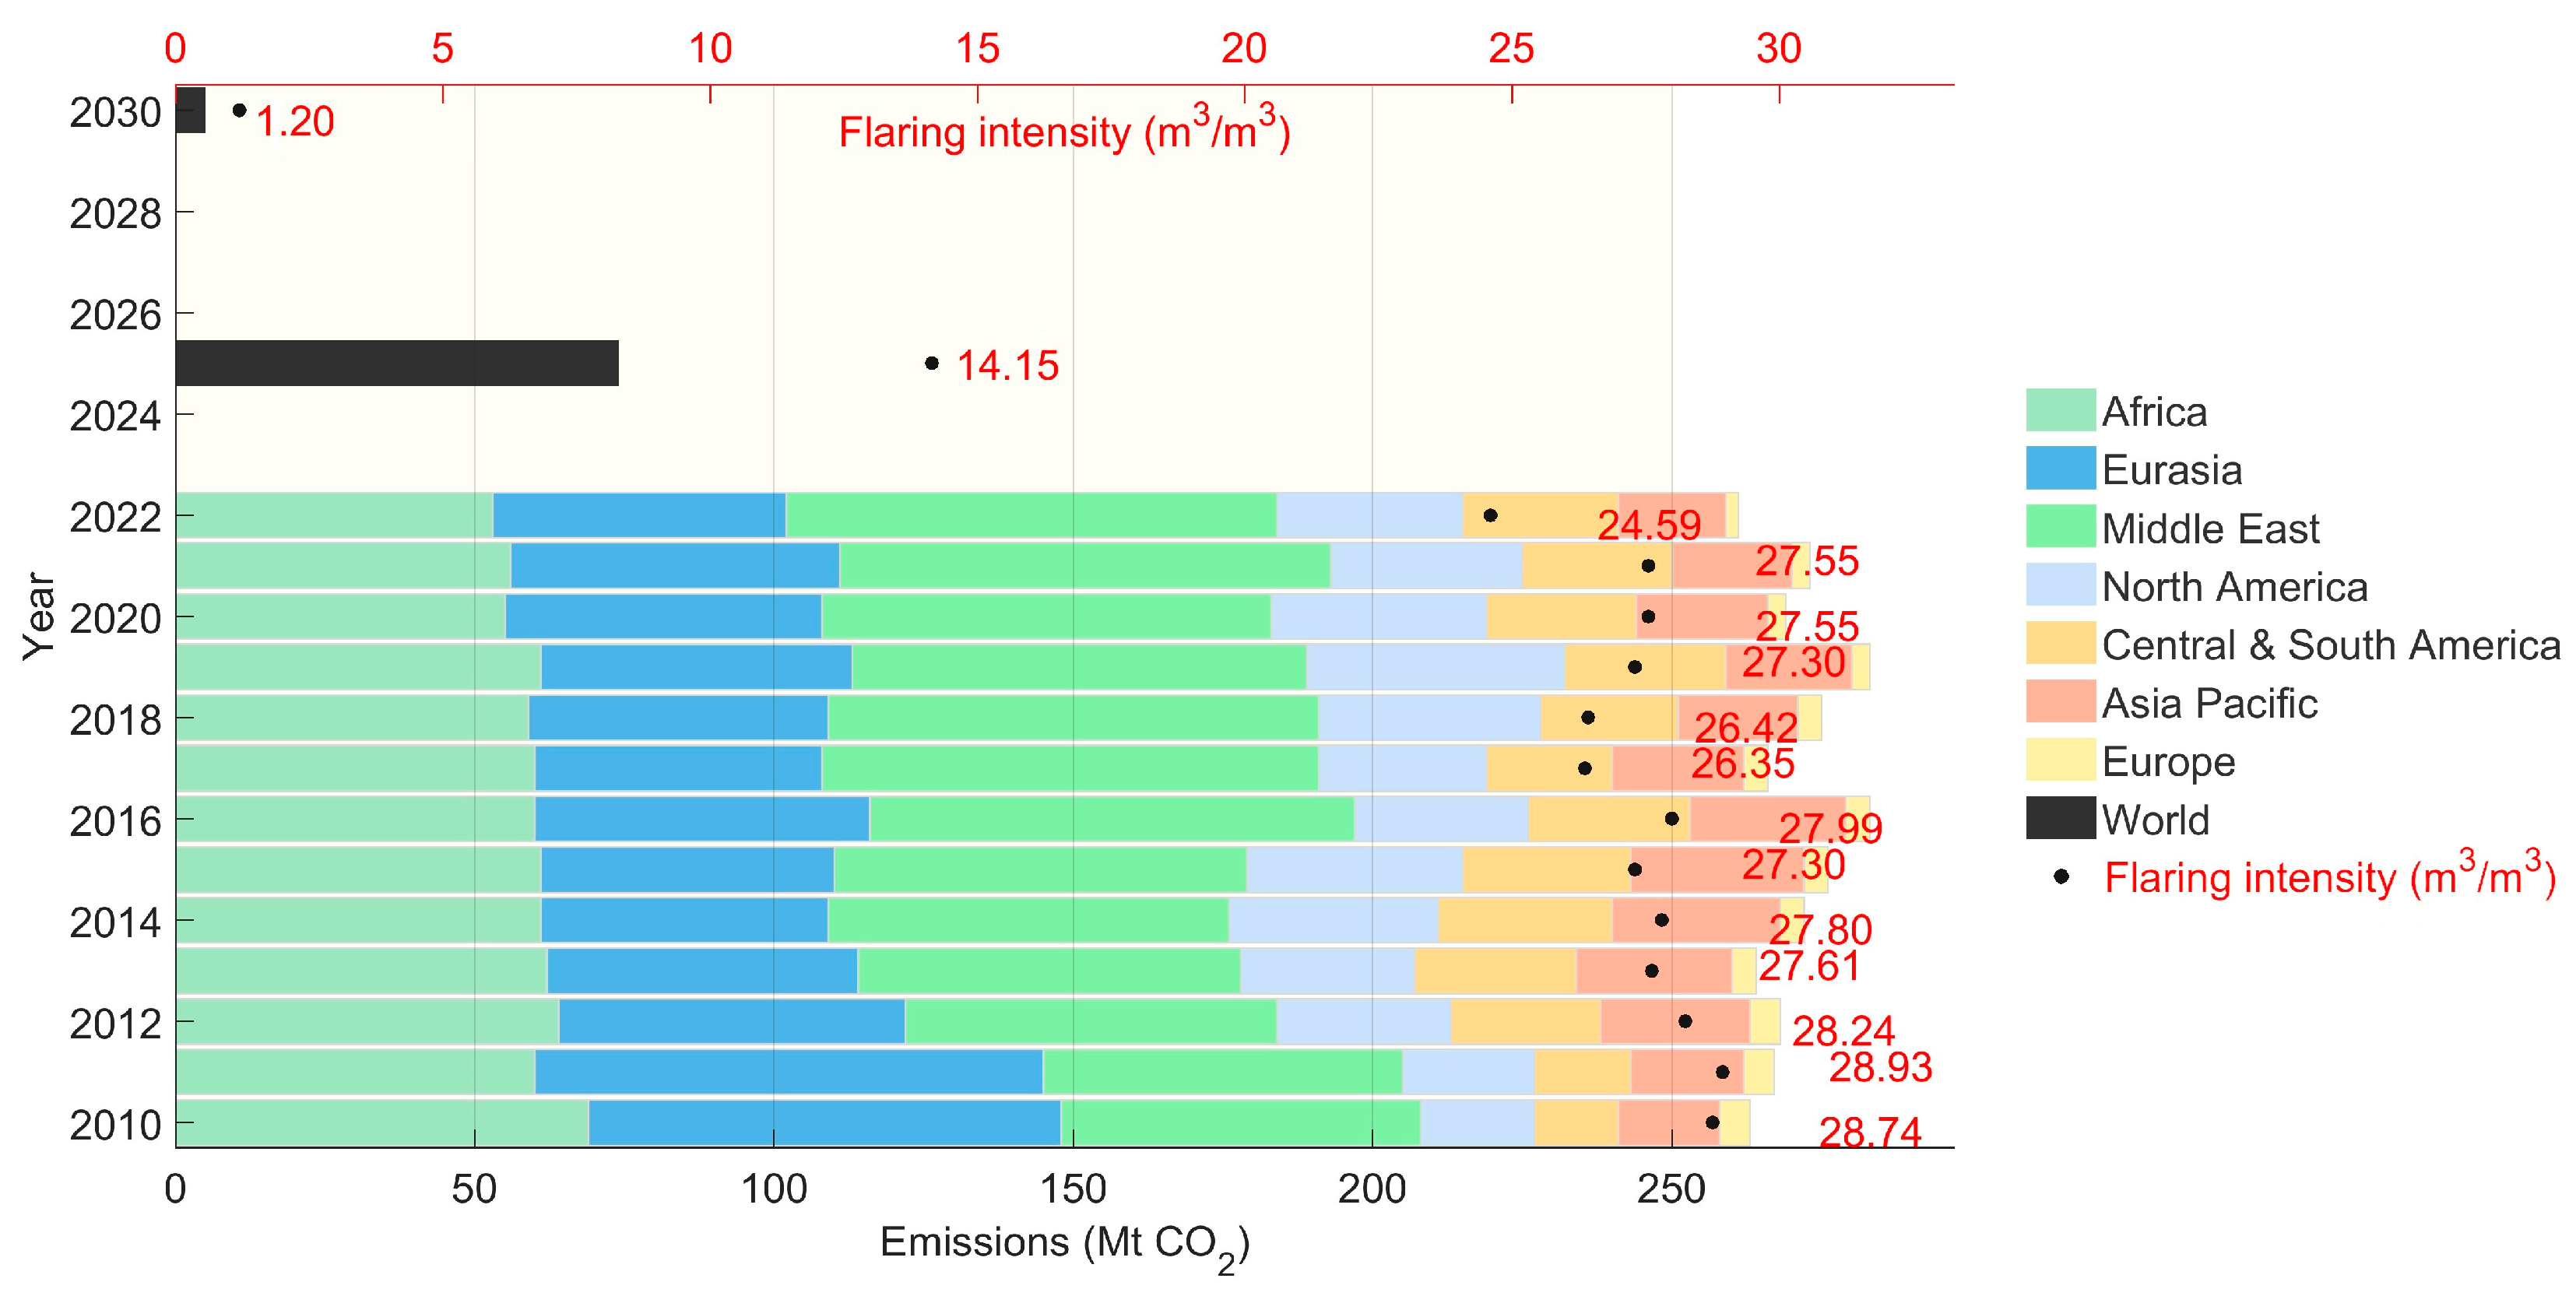
Figure 1. Data Derived from IEA Calculations Based on Flaring Statistics Provided by the World Bank Group [48]. Direct CO2 emissions from flaring by region (stacked bars, Mt CO2) and global flaring intensity (black markers, gas flared per m3 oil produced).
Applsci 15 09479 g001
Figure 2. Typical Carbon Dioxide Emissions Factors for Selected Fuels [50].
Applsci 15 09479 g002
Figure 3. Side-View Cross-Sections of Thermal Radiation Zones for C H 4 and H 2 Blends for Scenarios I–V (ae). Wind Speed U = 3 (m·s−1)—Solid Lines; Wind Speed U = 5 (m·s−1)—Dashed Lines.
Applsci 15 09479 g003
Figure 4. Corrected Distance Dc of Thermal Radiation Zones for CH4 and H2 Blends. Wind Speed U = 3 (m·s−1)—Solid Lines; Wind Speed U = 5 (m·s−1)—Dashed Lines.
Applsci 15 09479 g004
Figure 5. Ground-Level Thermal Radiation Profiles (Cross-Sections) For Scenarios I–V (ae). Wind Speed U = 3 (m·s−1)—Solid Lines, Wind Speed U = 5 (m·s−1)—Dashed Lines.
Applsci 15 09479 g005
Figure 6. Maximum Ground-Level Thermal Radiation vs. Hydrogen Content. Wind Speed U = 3 (m·s−1) (Solid Lines) and Wind Speed U = 5 (m·s−1) (Dashed Lines).
Applsci 15 09479 g006
Figure 7. Validation Against DNV Phast Cone Model: Scenario I—100% (v/v) CH4, U = 3 (m·s−1).
Applsci 15 09479 g007
Figure 8. Validation Against DNV Phast API Model: Scenario I—100% (v/v) CH4, U = 3 (m·s−1).
Applsci 15 09479 g008
Figure 9. Superposition of Ground-Level Thermal Radiation for Identical Flare Stacks from Scenario I (100% (v/v) CH4). (a) Wind Speed U = 3 (m·s−1), (b) Wind Speed U = 5 (m·s−1).
Applsci 15 09479 g009
Figure 10. Superposition of Ground-Level Thermal Radiation for Two Flare Stacks from Scenario I (100% (v/v) CH4) and One Flare Stack from Scenario III (10% (v/v) H2). (a) Wind Speed U = 3 (m·s−1); (b): Wind Speed U = 5 (m·s−1).
Applsci 15 09479 g010
Figure 11. CH4–H2 Blend Emission Factors vs. Hydrogen Content: (a) Lower Heating Value (LHV); (b) Higher Heating Value (HHV).
Applsci 15 09479 g011
Table 1. Selected Physical and Flammability Parameters of CH4 and H2 Relevant to Flare System Design.
Parameter
(298 K, 1 bar)
UnitCH4H2
Lower Heating Value (LHV) 1(MJ·kg–1)35.8120
Higher Heating Value (HHV) 1(MJ·kg–1)55.5142
Density 2(kg·m–3)0.7170.0899
Laminar Combustion Speed 3(m·s–1)0.42.9
Stoichiometric flame temperature 4(K)2497 (burning with air);
3083 (burning with pure
oxygen)
2673
Lower and Upper Explosive Limit (LEL, UEL) 5(%)5–154–75
Minimum Ignition Energy (MIE) 6(mJ)0.28–0.300.017–0.02
Fraction of Heat Radiated 7(–)0.15–0.250.05–0.15
1 [39], 2 [39,40], 3 [41], 4 [14], 5 [7,39], 6 [12,16], 7 [12,15,16].
Table 2. Overview of Thermal Radiation Estimation Methods for Flare Systems.
MethodAuthors/NameTypical Applications 1Advantages 1Limitations 1
Simple point source approachSimple Approach (API Std 521, Annex C) 2Preliminary stack height selectionInstant calculations, minimal data requiredConservative; does not account for flame shape or wind
Semi-Empirical Model B&RBrzustowski & Sommer 3Refineries, gas processing facilitiesIncludes wind, jet direction, flammability class; still in useRequires charts/tables; calibration needed
Line-Surface Model ChamberlainChamberlain 4High flares onshore/offshoreImproved accuracy for luminous flares; widely used in British standardsUnderestimates radiation for low luminosity gases
Extended “Low Luminosity” ModelMiller et al., He et al. 5H2-rich flaring, multi–tip ground flaresValidated via full-scale tests, 0–100 (%) H2; supports low-luminosity flamesGreater number of parameters
1 [14,42,43], 2 [15], 3 [44], 4 [15,45,46], 5 [11,12].
Table 3. Recommended Design Thermal Radiation Exposure Levels [15].
Recommended Thermal Radiation Level (kW·m–2)Conditions
9.46Maximum limit for urgent emergency actions. Personnel with proper protective clothing (e.g., fire suits) can tolerate this level only for a few seconds.
6.31Suitable for short-duration emergency tasks, ≤30 (s) without shielding, provided appropriate clothing is worn.
4.73Acceptable for emergency actions lasting 2–3 min with appropriate clothing but no shielding.
1.58Continuous exposure level for personnel wearing proper work clothing.
Table 4. Reference CO2 Emission Factors for Natural Gas Used in Inventories and Compliance Reporting.
RegulatoryBasis Default   E F C H 4
EU Monitoring & Reporting Regulation (MRR) 2018/2066, Annex VI; IPCC Guidelines 2006, Vol 2 [49]LHV56.1 (kgCO2·GJ−1)
US EIA “Carbon Dioxide Emission Coefficients“ [50]HHV → LHV52.9 (kgCO2·GJ−1)
Table 5. Composition-Weighted Formulas for CH4/H2 Blends Used for Calculations.
CorrelationEquation
Molecular weight (−) i z i · M W i
Molar lower/higher heating value (kJ·kg−1) i z i · L H V i
i z i · H H V i
Mass–based lower heating value (kJ·mol−1) L H V m i x , m o l M W m i x
Hourly mass rate (kg·h−1) 1 m ˙ = Q k W · 3600 L H V m i x , m a s s k J · k g 1
1 [15,44].
Table 6. Parameters Adopted for Subsequent Calculations for CH4 and H2 Blends.
ParameterUnitScenario 1Scenario 2Scenario 3Scenario 4Scenario 5
H 2 in CH4/H2 blend % (v/v)05102050
T m i x (K)289289289289289
n ˙ C H 4 k m o l · h 1 93498882841474794674
n ˙ H 2 k m o l · h 1 046793418694674
m ˙ C H 4 k g · h 1 150,000142,500135,000120,00075,000
m ˙ H 2 k g · h 1 0942188437699424
m ˙ t o t a l k g · h 1 150,000143,442136,884123,76984,424
M W m i x k g · k m o l 1 16.04315.34214.64013.2389.030
L E L m i x ( % ) 5.004.944.884.764.44
L H V m i x k J · k g 1 50,00050,45050,95652,12257,813
H H V m i x k J · k g 1 55,47556,04256,66658,10565,123
Table 7. Pooled mean radial error (MRE) by scenario (relative to DNV Phast Cone model).
UnitScenario 1
0% (v/v) H2;
100% (v/v) CH4
Scenario 2
10% (v/v) H2;
90% (v/v) CH4
Scenario 3
20% (v/v) H2;
80% (v/v) CH4
Scenario 4
30% (v/v) H2;
70% (v/v) CH4
Scenario 5
50% (v/v) H2;
50% (v/v) CH4
Pooled MRE–DNV Phast Cone model vs. developed solver %6.87.17.48.39.2
Table 8. Pooled mean radial error (MRE) by scenario (relative to DNV Phast API model).
UnitScenario 1
0% (v/v) H2;
100% (v/v) CH4
Scenario 2
10% (v/v) H2;
90% (v/v) CH4
Scenario 3
20% (v/v) H2;
80% (v/v) CH4
Scenario 4
30% (v/v) H2;
70% (v/v) CH4
Scenario 5
50% (v/v) H2;
50% (v/v) CH4
Pooled MRE–DNV Phast API model vs. developed solver %7.27.88.69.610.3
Table 9. Emission Factors From CH4–H2 Blend and Relative CO2 Reduction (Constant Molar Flow).
ScenarioH2 % (v/v) F m i x , L H V (−) F m i x , H H V (−) C O 2 v s C H 4
L H V
C O 2 v s C H 4
H H V
I00.05490.0494
II50.05400.0486–1.56%–1.66%
III100.05310.0477–3.24%–3.45%
IV200.05100.0458–7.01%–7.44%
V500.04220.0374–22.18%–24.32%
Disclaimer/Publisher’s Note: The statements, opinions and data contained in all publications are solely those of the individual author(s) and contributor(s) and not of MDPI and/or the editor(s). MDPI and/or the editor(s) disclaim responsibility for any injury to people or property resulting from any ideas, methods, instructions or products referred to in the content.