Article

An Investigation of Three-Dimensional Void Changes and Top-Down Microcrack Formation of AC-16 in Rutted and Non-Rutted Zones Under Extremely High Temperature and Heavy Load

1
The Key Laboratory of Road and Traffic Engineering, Ministry of Education, Tongji University, Shanghai 201804, China
2
China Merchants Chongqing Communications Technology Research & Design Institute Co., Ltd., Chongqing 400067, China
3
School of Civil Engineering, Chongqing University, Chongqing 400045, China
4
State Key Laboratory of Safety and Resilience of Civil Engineering in Mountain Area, Chongqing University, Chongqing 400045, China
*
Author to whom correspondence should be addressed.
Appl. Sci. 2025, 15(17), 9464; https://doi.org/10.3390/app15179464
Submission received: 24 June 2025 / Revised: 26 August 2025 / Accepted: 27 August 2025 / Published: 28 August 2025
(This article belongs to the Special Issue Sustainable Asphalt Pavement Technologies)

Abstract

To address the issue of cracking damage under extreme high-temperature rutting, which is not sufficiently considered in the selection of preventive maintenance programs, the objective of this study was to investigate the preventive maintenance-oriented minor internal damage changes in asphalt concrete with a normal maximum aggregate size of 16 mm (AC-16) under extreme high temperature (70 °C) and load (1.4 MPa) conditions. The changes in void structure within the 0–10 mm rutting depth were tracked through the rutting test and Computer Tomography (CT) image analysis. It was observed that there were notable discrepancies in the three-dimensional (3D) space distribution of void, void volume development, and void morphology between the rut impact zones and the rutted part. The impact zone exhibited a greater prevalence of voids and an earlier onset of cracking. At a rutting depth of only 5 mm, multiple top-down developed cracks (TDCs) of over 6 mm length were observed in the impact zone. At a rutting depth of 10 mm, the TDCs in the impact zone were more numerous, larger, and wider, indicating the necessity for a tailored repair program that includes milling. TDC damage caused by high-temperature rutting is predominantly observed in the upper and middle positions of the height direction, with the bottom position data exhibiting greater inconsistency due to the influence of molding. Furthermore, the combination of void morphology indicators with void volume can effectively track the occurrence and development of microcracks. However, the fine-scale assessment of compaction degree and deformation process using the equivalent void diameter indicator is not sufficiently differentiated.

1. Introduction

Established standards, guidelines, and engineering applications impose an average rutting depth (RD) limit of approximately 12 mm for micro-surfacing treatments [1,2,3,4]. Only when the average rut depth reaches a certain value (15 mm in JTG/T 5142-01-2021 [3] or 38.1 mm in ISSA A143-10 [1]), milling is needed before paving new layers. Despite the potential for addressing the unevenness of the pavement, the effectiveness of this rutting filler treatment process in addressing the endogenous distress that occurs in the rut-affected areas is limited. The existence of this type of endogenous cracking has been noted in studies of top-down cracking, but this type of cracking is understudied, experimental methods are inadequate, and there is a particular lack of research about top-down cracking (TDC) due to high-temperature rutting [5]. It can be concluded that the typical depth thresholds employed for pavement assessment and maintenance strategies are neither representative nor capable of adequately accounting for the impacts of fine-scale structural alterations within the internal 3D space beneath rutting. Conventional wheel tracking tests (60 °C, 0.7 MPa loading pressure) fail to reproduce the rutting depth of this magnitude [6]. High RD level is typically attributed to inadequate aggregate gradation or other fundamental design deficiencies [7]. Current evaluation systems pay insufficient attention to the unique material behaviors under extremely high-temperature and heavy conditions. Large voids and initial cracks in rut-affected areas under concurrent extreme thermal and heavy loading were neglected in lab simulation.
The extant literature has reached a consensus that rutting deformation can be encapsulated in four principal patterns: wear, densification, structural deficiency, and lateral plastic flow [8,9,10]. Lateral plastic flow is associated with shear-related deformation, which is the dominant factor in the long-term accumulation of rutting [10,11]. It is widely acknowledged among the research community that rutting behavior is influenced by a complex interplay of mechanisms, particularly in high temperatures, heavy loads, and submerged environments [12,13,14,15,16]. Alamnie pointed out that fatigue and permanent deformation damages are both caused by the same load, so the two kinds of damage can evolve at the same time [17]. Several studies have shown that the formation of ruts leads to an increase in the heterogeneity of the stress response of the pavement, which in turn exacerbates localized stress concentrations and promotes the formation of TDCs [18,19], which may have a negative impact on the preventive maintenance effect. Furthermore, it is found that the edge of the tire tends to produce a concentration of shear stress, which will lead to TDCs [20], while the wheel rolling part tends not to appear TDC, and there is a certain distance between the surface and the place maximum shear stress occurs [20,21,22]. In addition, the probability of TDC tends to increase with the increase in traffic load, but the results of temperature effects on TDC are sometimes conflicting and usually inconclusive [5,22]. The presence of ruts has been observed to result in a more heterogeneous stress response in pavement, which in turn increases the probability of TDC occurrence in the rutted-affected area of the pavement. Given the potential for TDC occurrence, it is imperative to elucidate the performance and structural dissimilarities between the wheel crush area and the rut-influenced area when contemplating the utilization of microsurfacing for rut filling. However, few studies have been undertaken to examine a comparison between the two.
The analysis of damage mechanisms in asphalt mixture by characterizing the changes in voids during specimen deformation has been applied to the study of compaction, freeze–thaw damage, and fatigue fracture [23,24,25,26,27,28]. A three-stage failure mode of Superpave-12.5 (Sup-12.5) was analytically confirmed using visual images of computed tomography (CT) scan samples and void ratio in the Hamburg wheel tracking device (HWTD) test [12]. Similarly, Wang et al. [29] employed a comparable methodology to examine the three-stage failure mechanism of porous asphalt PA-13 during the repeated loading permanent deformation (ARLPD) test, identifying that the failure in the tertiary stage was characterized by densification, which distinguishes it from the behavior of Sup-12.5. Li et al. [30] examined the distribution characteristics of voids to investigate the damage mechanisms of diverse pavement structure layers. It was found that the reduction in the void fraction in the upper layer of the pavement was due to densification, while the cracks that emerged in the middle layer were caused by shear flow.
To conduct microscale analyses, digital imaging techniques have been employed to observe alterations in void structures during the internal degradation of specimens. The void structure exhibits a variety of forms, including void equivalent diameter [27,31], void distribution [24,32], and fractal dimension [26]. Zhao et al. [33] divided the rutted plate into three segments along the wheel loading direction to obtain cross-sectional images of different loading cycles. Their findings indicated that void distribution, void shape characteristics, and void fractal dimension were effective in characterizing the permanent deformation pattern of rutted slabs. Ma et al. [13] divided the rutted slab into four segments along a plane perpendicular to the wheel loading direction to investigate the alterations in the void structure of porous asphalt concrete under coupled conditions of loading, moisture, and temperature. The changes in void characteristics of the affected zones on both sides of the rut were examined. However, these studies were unduly concentrated on the rutted region, with insufficient attention devoted to the changes in the un-rutted region. The majority of observed changes in metrics in specimens and actual pavements have been made using mean density and mean void area [31,33,34,35], while studies of the non-rutted region mostly focused on numerical modeling predictions [31,34,36].
It is noteworthy that the mechanical behavior of asphalt materials at high temperatures undergoes fundamental changes. The flow and redistribution of softened binder can induce a notable “self-healing” effect within the mixture, while the concurrent reduction in mastic stiffness inhibits the initiation of micro-cracks under repeated loading [9,37,38,39]. These mechanisms suggest that rutting formation at elevated temperatures may involve a complex process of internal structural adaptation and damage evolution that has not yet been fully elucidated. A critical question remains: does this healing-dominated mechanism persist under extreme conditions of combined high temperature and heavy loading? To address this, our study examines 3D void alterations in rutted versus non-rutted regions of AC16 mixtures, with rut depths ranging from 0 to 10 mm, simulating development under severe thermo-mechanical loading. The evolution of void structures and the emergence of distress across different sections of the mixture were investigated to establish a foundational understanding for assessing the progressive risk of rutting damage.

2. Materials and Methods

2.1. Materials

2.1.1. Raw Materials

Styrene–butadiene–styrene (SBS) modified asphalt was selected as the asphalt binder, and the main physical properties are given in Table 1. Hot-mix asphalt (HMA) mixtures were designed with a typical gradation of AC-16, as shown in Table 2. The coarse aggregate was basalt, the fine aggregate was machine-made sand, the filler was limestone, and the asphalt content is 4.6%.
The average measured air void content of the Marshall specimens was 4.7% (JTG E20-2011 T0708) [6]. The high-temperature wheel tracking test (JTG E20-2011 T0719) conducted at 60 °C yielded an average dynamic stability of 6980 cycles/mm, with a maximum rut depth of 2.5 mm. The freeze–thaw resistance has been validated through Tensile Strength Ratio (TSR) testing (JTG E20-2011 T0729), with the TSRs all exceeding 90%.

2.1.2. Specimen Fabrication and Rutting Test

The mixing temperature of the asphalt binder and aggregate was set at 163 °C, and the specimens were rolled 24 times on an asphalt slab roller at a temperature of 135 °C (JTG E20-2011 T0703). Four plate specimens with dimensions of 300 mm (length) × 300 mm (width) × 85 mm (height) were finally molded. The specimen molding steps are shown in Figure 1.
Rutting tests were conducted using the automatic asphalt mixture rutting instrument following the specification (JTG E20-2011 T0719). The apparatus primarily comprised a rubber wheel and a fixed platform. The rubber wheel was designed with a diameter of 200 mm and a contact width of 50 mm. A stress of 1.4 ± 0.05 MPa was applied to the rubber wheel, and the rutting loading simulation process was conducted at 70 °C and a speed of 42 mm/min. The specimens after loading exhibited rutting depths that could be classified into three ranges: 1–3 mm, 4–6 mm, and 7–10 mm. The procedure for conducting the rutting test is illustrated in Figure 2.

2.2. Experiment and Computation Methods

2.2.1. Image Data Acquisition

CT scanning was accomplished using a SOMATOM Ccope medical CT scanner manufactured by SIEMENS (Munich, Germany), as shown in Figure 3a. The scanning voltage was 130 KV, the current was 220 mA, and the scanning mode was spiral scanning with an interval of 0.6 mm. The CT slice sample is shown in Figure 3b.
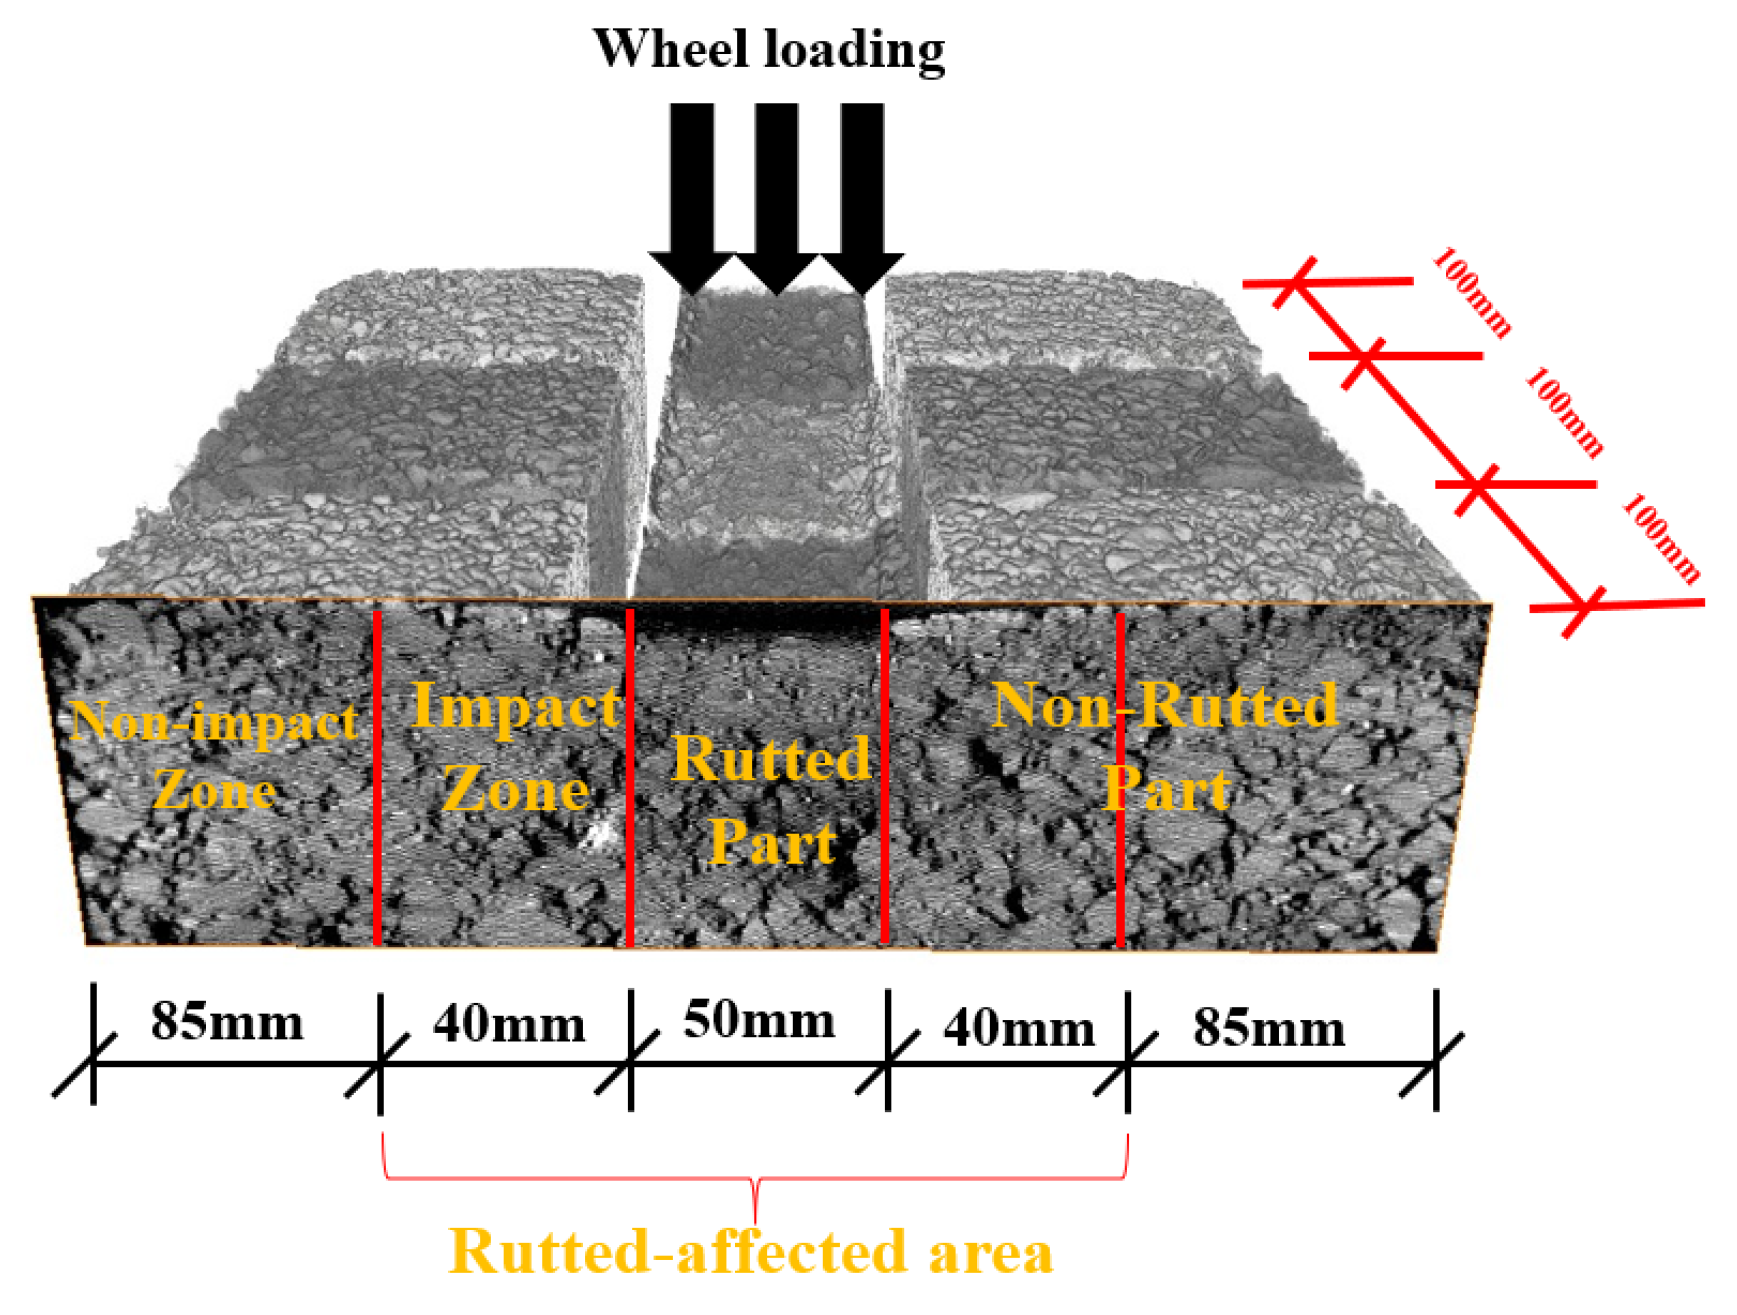
A total of 1517 images were obtained from the CT scan. The extant literature indicates that the impact of permanent deformation resulting from wheel loading is predominantly concentrated within a 25 mm radius of the rut [13]. Considering the more rigorous loading and temperature conditions in this study, as well as the trend of the void ratio in the lengthwise direction, the calculation area has been extended to a distance of 40 mm beyond the rut. The acquired specimen data were divided into one rutted area and two non-rutted areas, and the non-rutted areas were divided into one impact zone and one non-impact zone. Subsequently, the specimens were divided into three parts along the wheel rolling direction and five zones perpendicular to the wheel rolling direction, a total of 15 parts, as illustrated in Figure 4. The final number of images was 22,755, including 4551 rutted parts, 9102 rut impact zones, and 9102 non-impact zones.

2.2.2. Digital Image Processing

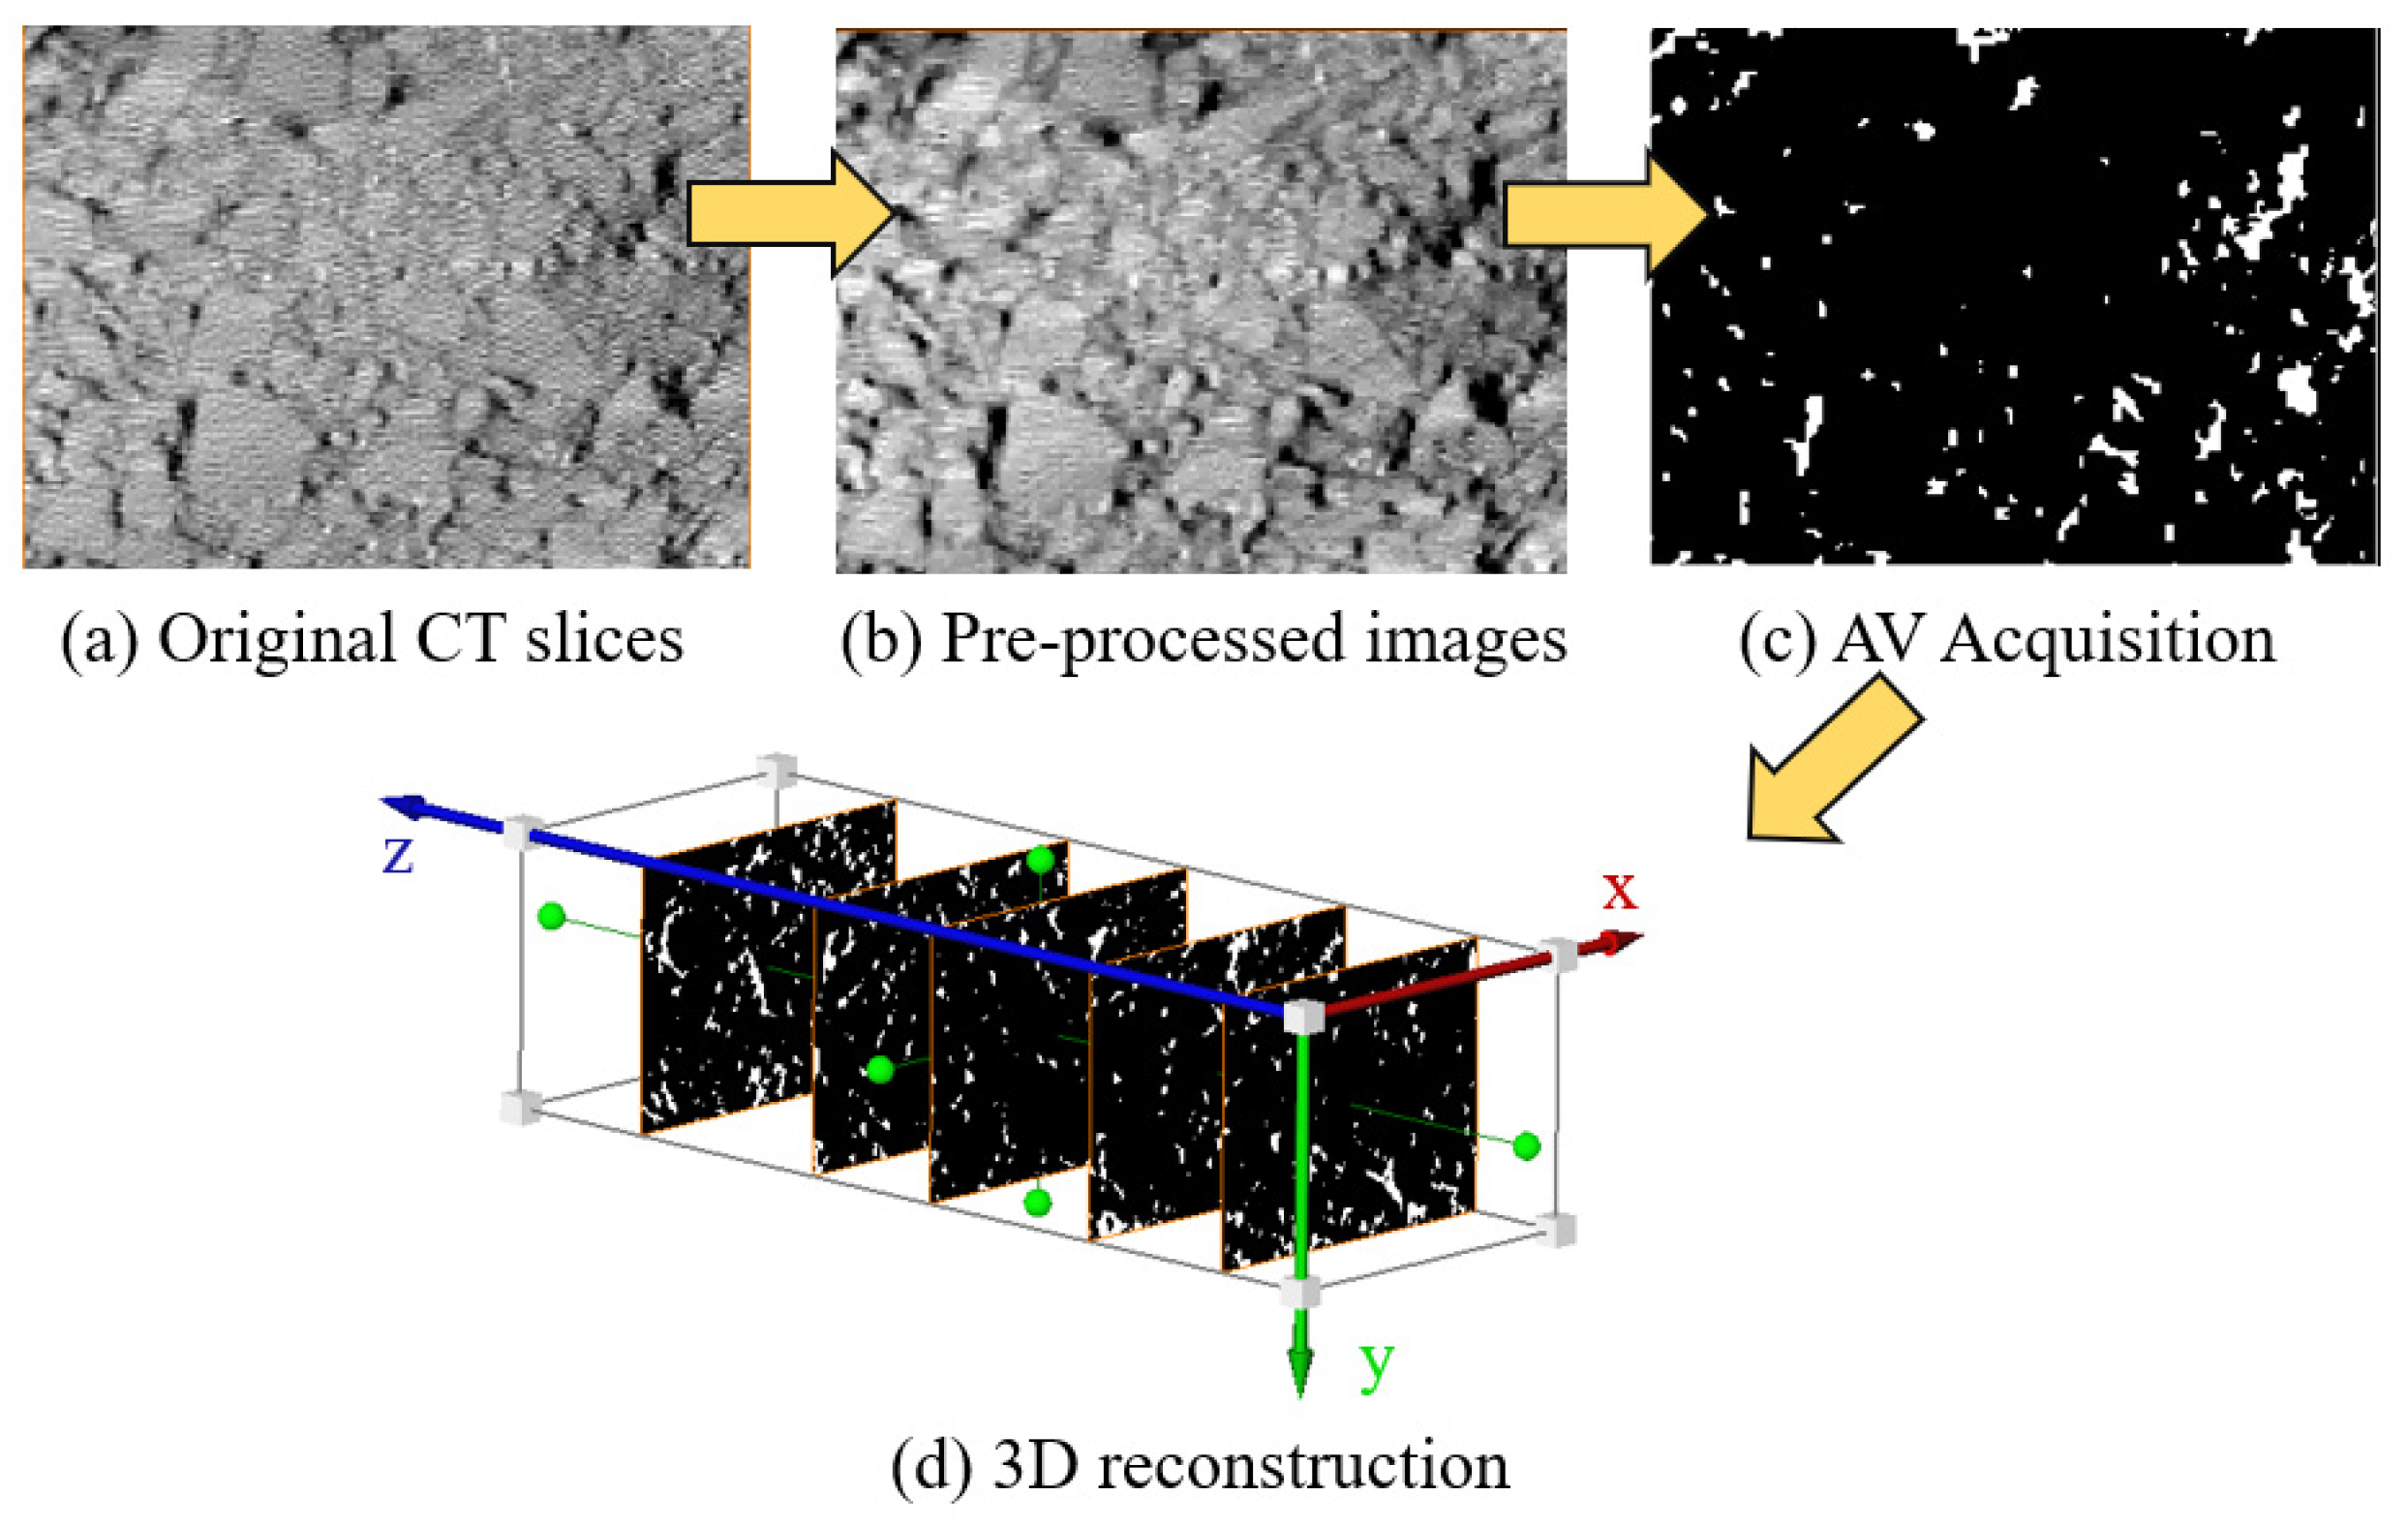
Avizo software was used to process CT images and create 3D reconstruction models of the specimens. These CT slices were pre-processed using median filtering and histogram equalization to remove image defects due to beam hardening and ringing artifacts, and to enhance the contrast between voids and aggregates [28,31]. The void was extracted from the image using interactive threshold segmentation, and the principle is shown in Equation (1). The threshold T-value was derived by manual debugging. During the interaction segmentation process, the T-value that makes the target area completely contain the void and the edges do not extend into the aggregate area is chosen as a reasonable threshold, and the whole process is shown in Figure 5.
g x y = 0 , f ( x , y ) > T 255 , f ( x , y ) T
where f(x, y) is the original image, g(x, y) is the segmented binary image, and T is the selected threshold. Manually adjust and obtain the segmentation thresholds for the nearest and farthest slices along the scanning depth direction. Set the segmentation threshold for each slice based on the average linear variation in the overall grayscale values along the CT scanning depth.
The 3D reconstruction process shown in Figure 5 is to confirm the spatial location of the voids to have a more complete picture of the variations in the voids in the height, length, and width directions. The reconstruction step was carried out using Avizo 2019.1 software developed by Thermo Fisher Scientific (Waltham, MA, USA).

2.2.3. Three-Dimensional Distribution and Morphological Features of Voids

The series of metrics proven to be effective in assessing void characteristics and void development [15,24,40,41,42,43] were selected for use as evaluation metrics for image-based calculation of void characteristics, including void ratio (V0), mean void area (MA0), equivalent void diameter (Deq) [44], fulness [45], aspect ratio (Ar) [46], and sphericity [47]. Except for V0 calculated by Equation (2), the calculated void ratio metrics are all 3D-based, as shown in (3)–(7). A specific example of sphericity and spheroidicity is shown in Figure 6.
V 0 = A 0 A a × 100 %
M A 0 = 1 N i = 1 N A i 0
D e q = 6 V π 3
A r = a b
S r = 4 π ( 3 V 4 π ) 2 3 A s × 100 %
S f = V 4 3 π a b c 8
where V0 is the void ratio, A0 is the total area of the voids in the test area, A a is the total area of the scan area; N is the number of the scan slices for a certain 3D section, MA0 is the mean value of the total areas of the N slices for the 3D section; A r is the aspect ratio of a void; Deq is the equivalent diameter of a void, V is the volume of a void; AS is the surface area of a certain 3D void, a, b, and c are the length, width, and height of the smallest enclosing box of the 3D void, Sr and Sf are the sphericity and fullness, respectively.
Specifically, a high “sphericity” or “fullness” value (close to 1) indicates a near-spherical void with fewer local concavities and convexities, which tends to resist stress concentration better than irregular voids, thereby delaying crack initiation.
To further evaluate the distribution characteristics of the voids, the composition of voids with varying Deq values can be represented graphically using a gradation curve. Gradient curves were constructed using equivalent void diameters and corresponding void volumes expressed as a percentage of the total void volume for a certain specimen. As has been demonstrated, the two-parameter function accurately fits as a Weibull distribution, which is an appropriate means of characterizing the void gradation [24,48]. Therefore, the Weibull distribution function was employed to characterize the void gradation curves during the compaction process. The two-parameter Weibull function is expressed by Equation (8).
F ( x ) = 1 e ( x a ) b , x > 0
where a is a scale parameter, and b is a shape parameter of the curve.

3. Results and Discussion

3.1. Void Ratio and Void Area

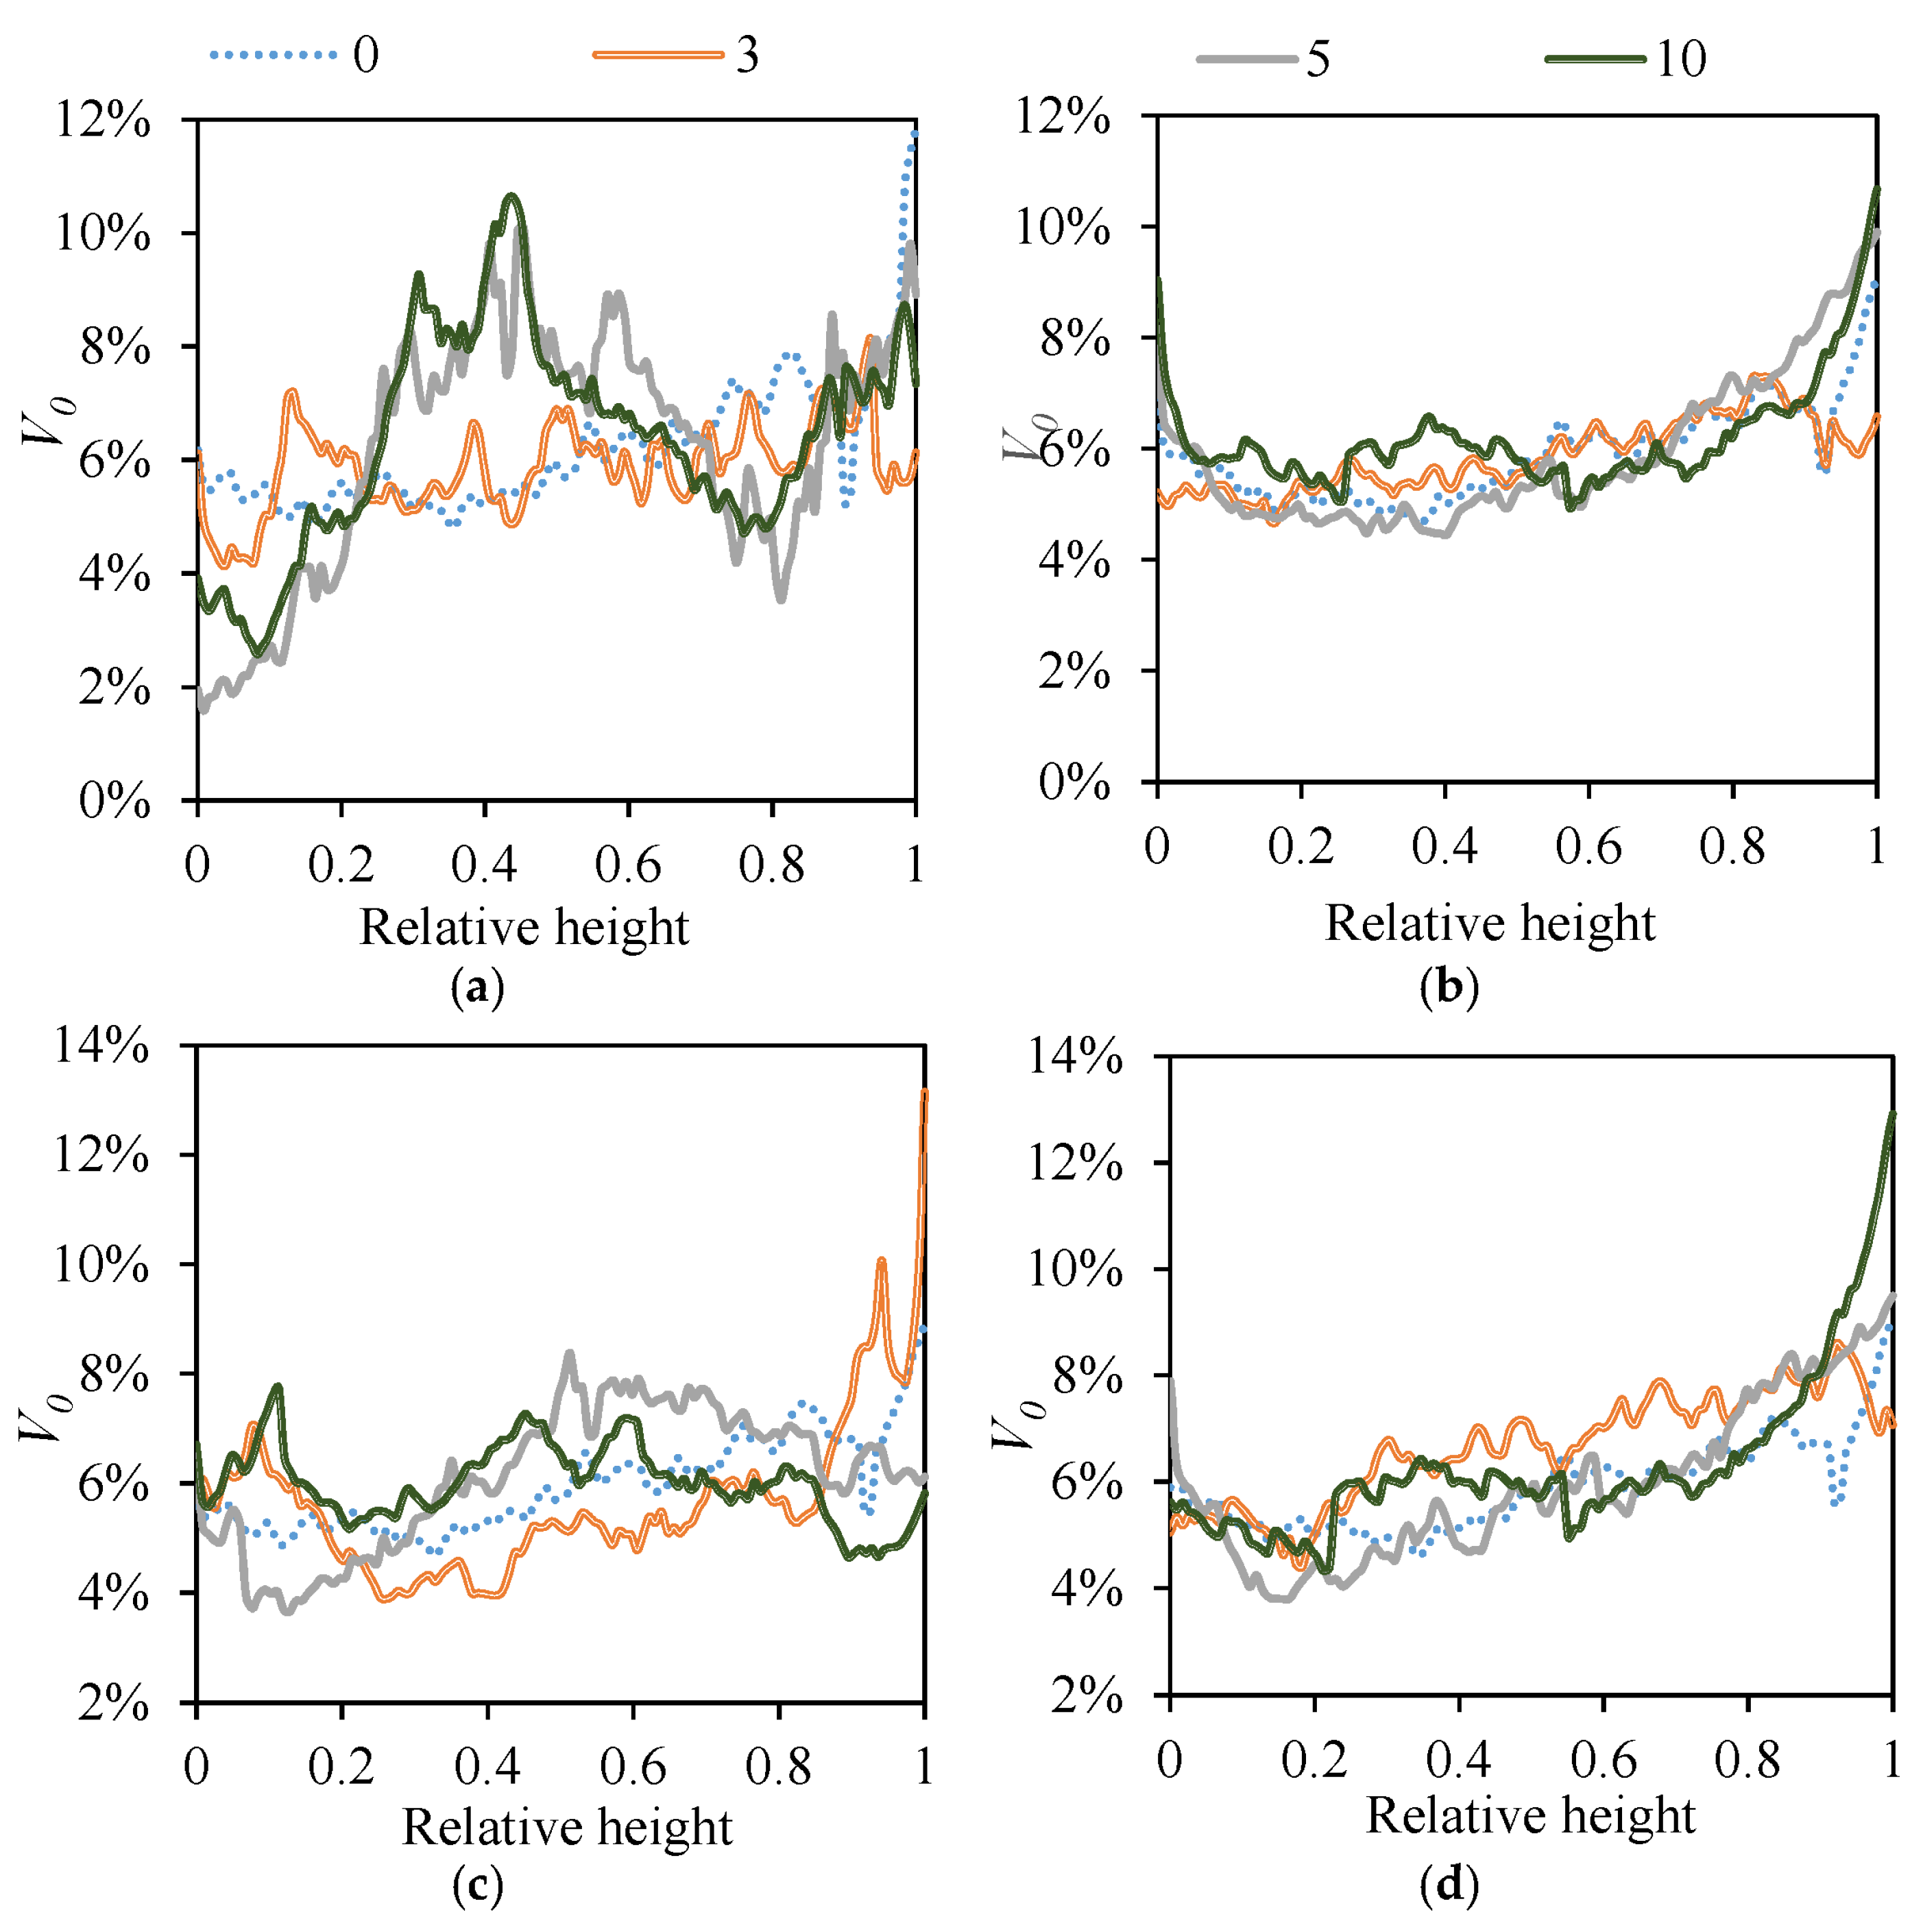
The changes in void ratio along the height of the whole specimen are shown in Figure 7.
As can be seen in Figure 7, the void distribution characteristics along the height sections are not consistent with different rut depths. It is worth noting that the rut-impact (Figure 7c) and non-affected (Figure 7d) zones do not show the same trend in void change, so a unified analysis of the non-rutted part (Figure 7b) would lead to ignoring this different trend and the compositional relationship of the internal material.
As illustrated in Figure 7a, the voids appear to become densified in the upper portion of the specimen, as evidenced by the gradual decline in the upper void ratio with increasing rutting depth. As the relative height increases to 0.2, the influence of its densification behavior gradually dissipates. It is noteworthy that the void ratio at the upper area appears to increase as the rutting depth increases from 5 to 10 mm. This phenomenon may be attributed to the stripping phenomenon that occurs when specimens are subjected to sustained wheeling under high-temperature conditions, potentially leading to cracking. At rut depths of 5 mm and 10 mm, the void fraction increased significantly, especially when the relative height was between 0.2 and 0.8, but there was little difference between these two groups. There was also no significant absolute numerical difference between 3 mm and 0 mm. Although the differences in magnitude were not significant, voids at 3 mm and 5 mm exhibited a higher frequency of fluctuations in the height region relative to 0 mm and 10 mm, implying that there was a depth range of relative movement of aggregate particles evident during the rolling process. The relatively steady state of the void ratio index fluctuating in the height region at 10 mm rut depth may be due to cracking. The association of tiny voids and the occurrence of cracks leads to the redistribution of internal stresses, which in turn leads to large changes in the distribution of voids [49]. The findings distinguished from the three-stage evolution of PA mixtures under rutting, where the void of PA continuously decreases with a reduction rate decreases gradually with rutting depth [13,29,30]. The initial void ratios of PA are larger and the contribution of densification to rutting is greater than that of shear flow, there is a continuous decrease in the manifestation of the change in the void ratio. So the change in the void ratio of the rutted part of AC-16 appears to decrease and then increase may be due to the different dominant roles of the two damage modes at different stages.
As shown in Figure 7b, compared with the rutted part, the amount of voids in the non-rutted part is more concentrated, the changes with the rutting depth are not significant, and the main change occurs in the bottom 10% thickness and the top 5% thickness sections.
As illustrated in Figure 7c, the volume of voids within the rut-affected zone in the relative height range of 0.2–0.7 tends to decrease, then increase, and finally fluctuate along the height as the rut depth reaches 10 mm. The rut-affected zone undergoes a comparable transformation to the rutted portion at rut depths between 5 and 10 mm, which may also be attributed to cracking. It is noteworthy that the compaction density at the bottom occurred at the stage of change from 5 to 10 mm rut depth. Except for the 5 mm rut, the surface layer predominantly exhibits an increase in void space. The plunge observed at 0–0.2 for depths of 5 and 10 mm is attributed to the incorporation of the rutted part.
As illustrated in Figure 7d, except for a minor portion of the surface layer, the void ratio in the non-rutting-affected region demonstrates a gradual elevation from the surface to the bottom. Additionally, the overall relative change exhibits fluctuations, with the maximum alteration in the void ratio occurring at the base, exhibiting a gap of approximately 5%.
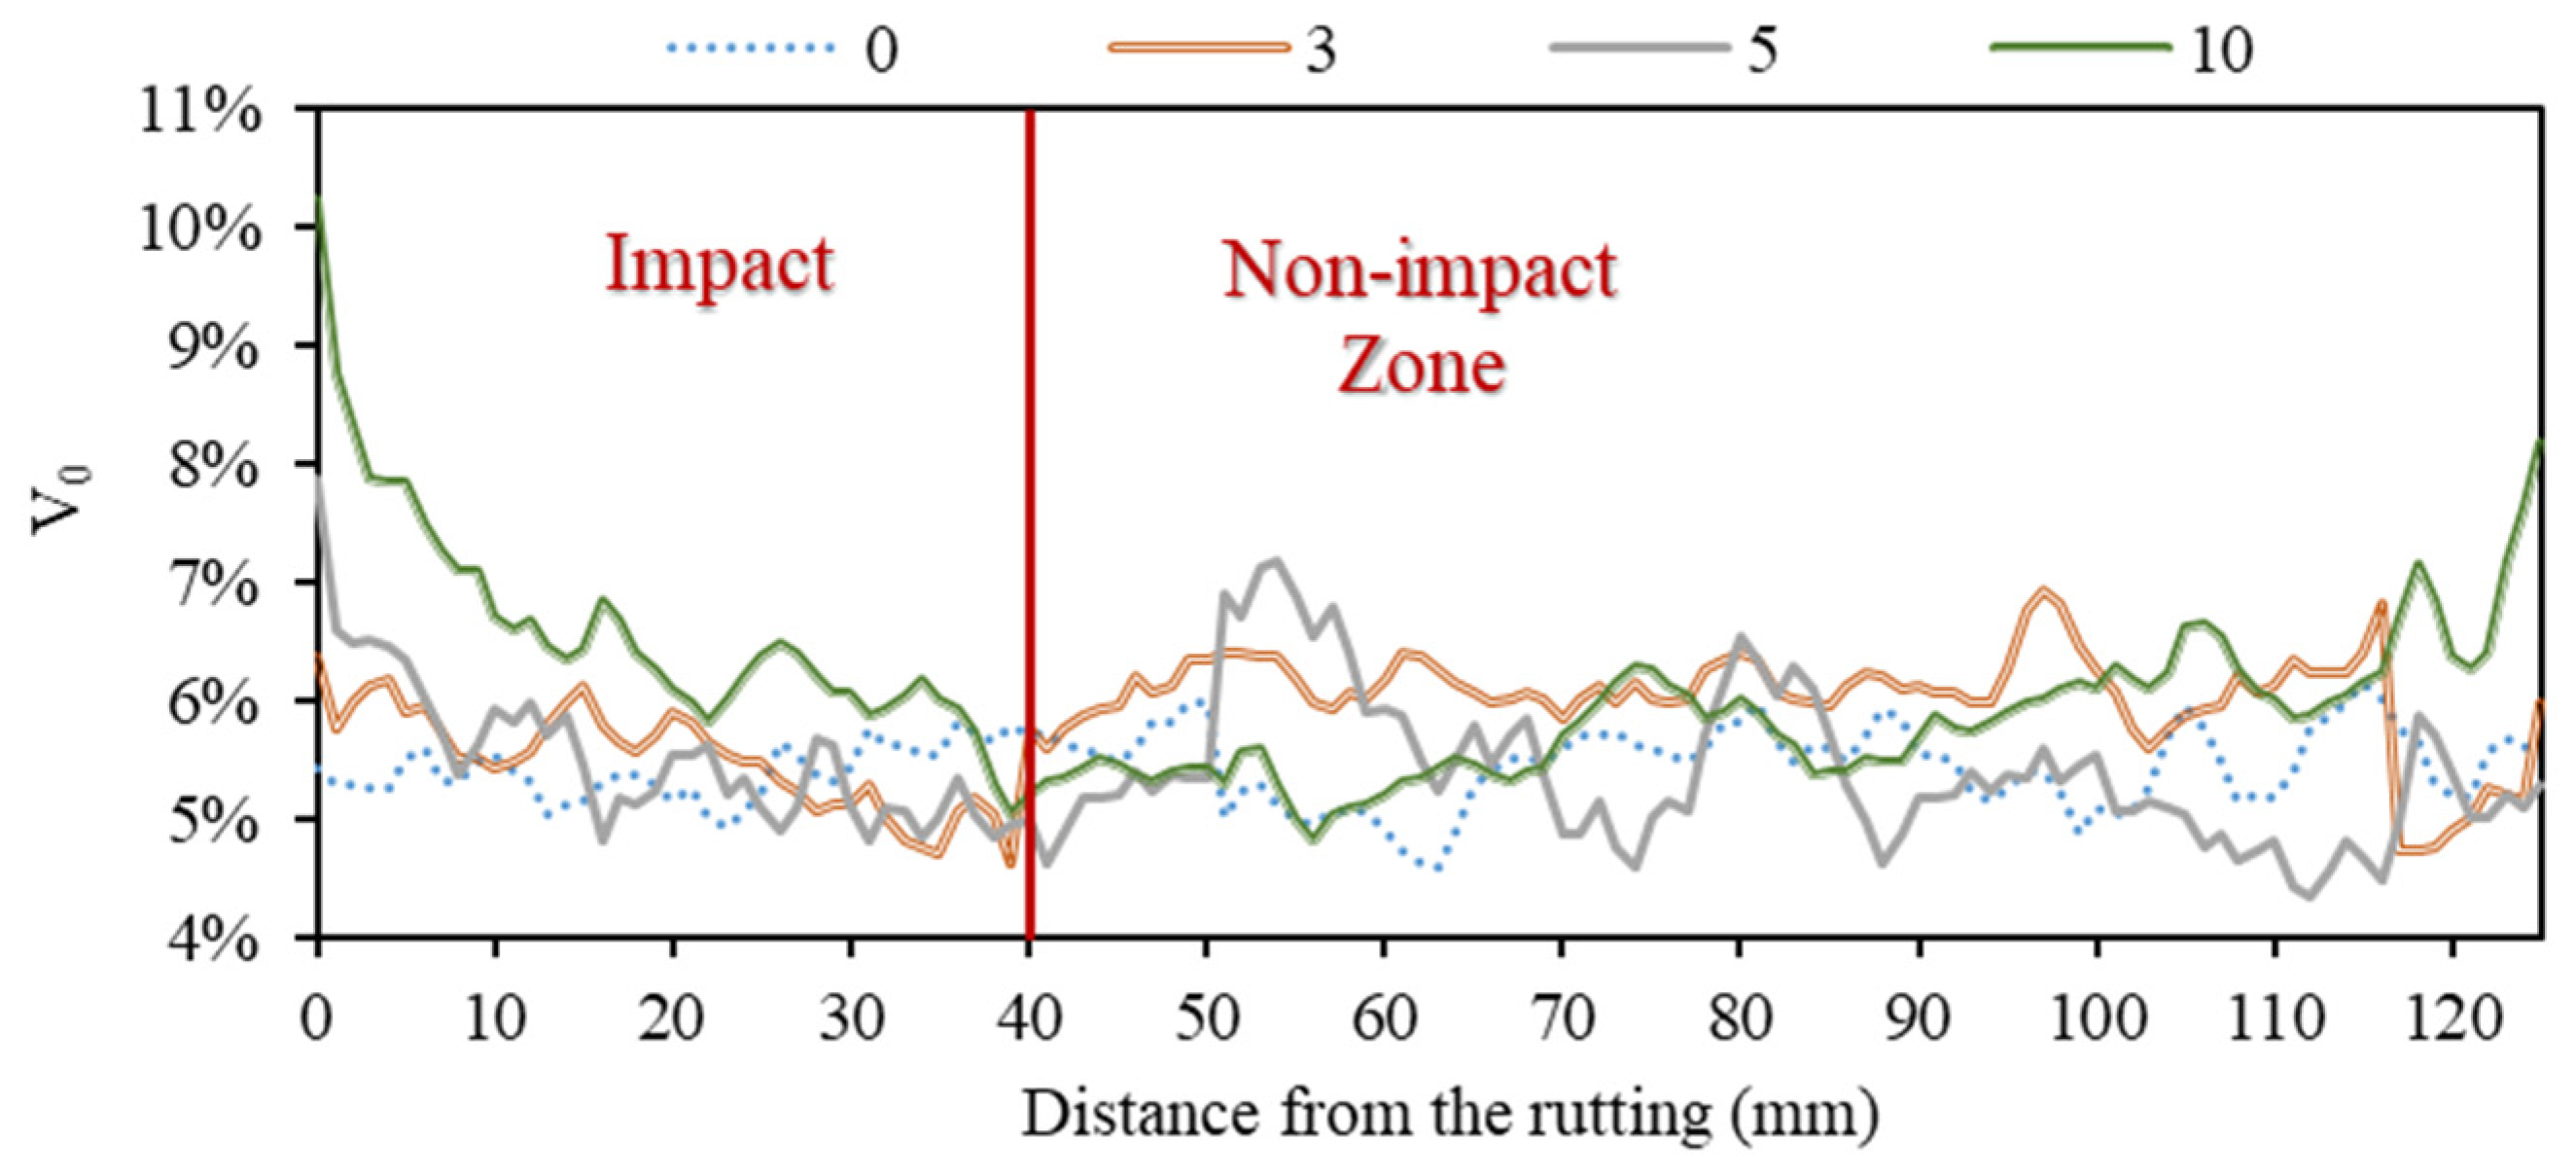
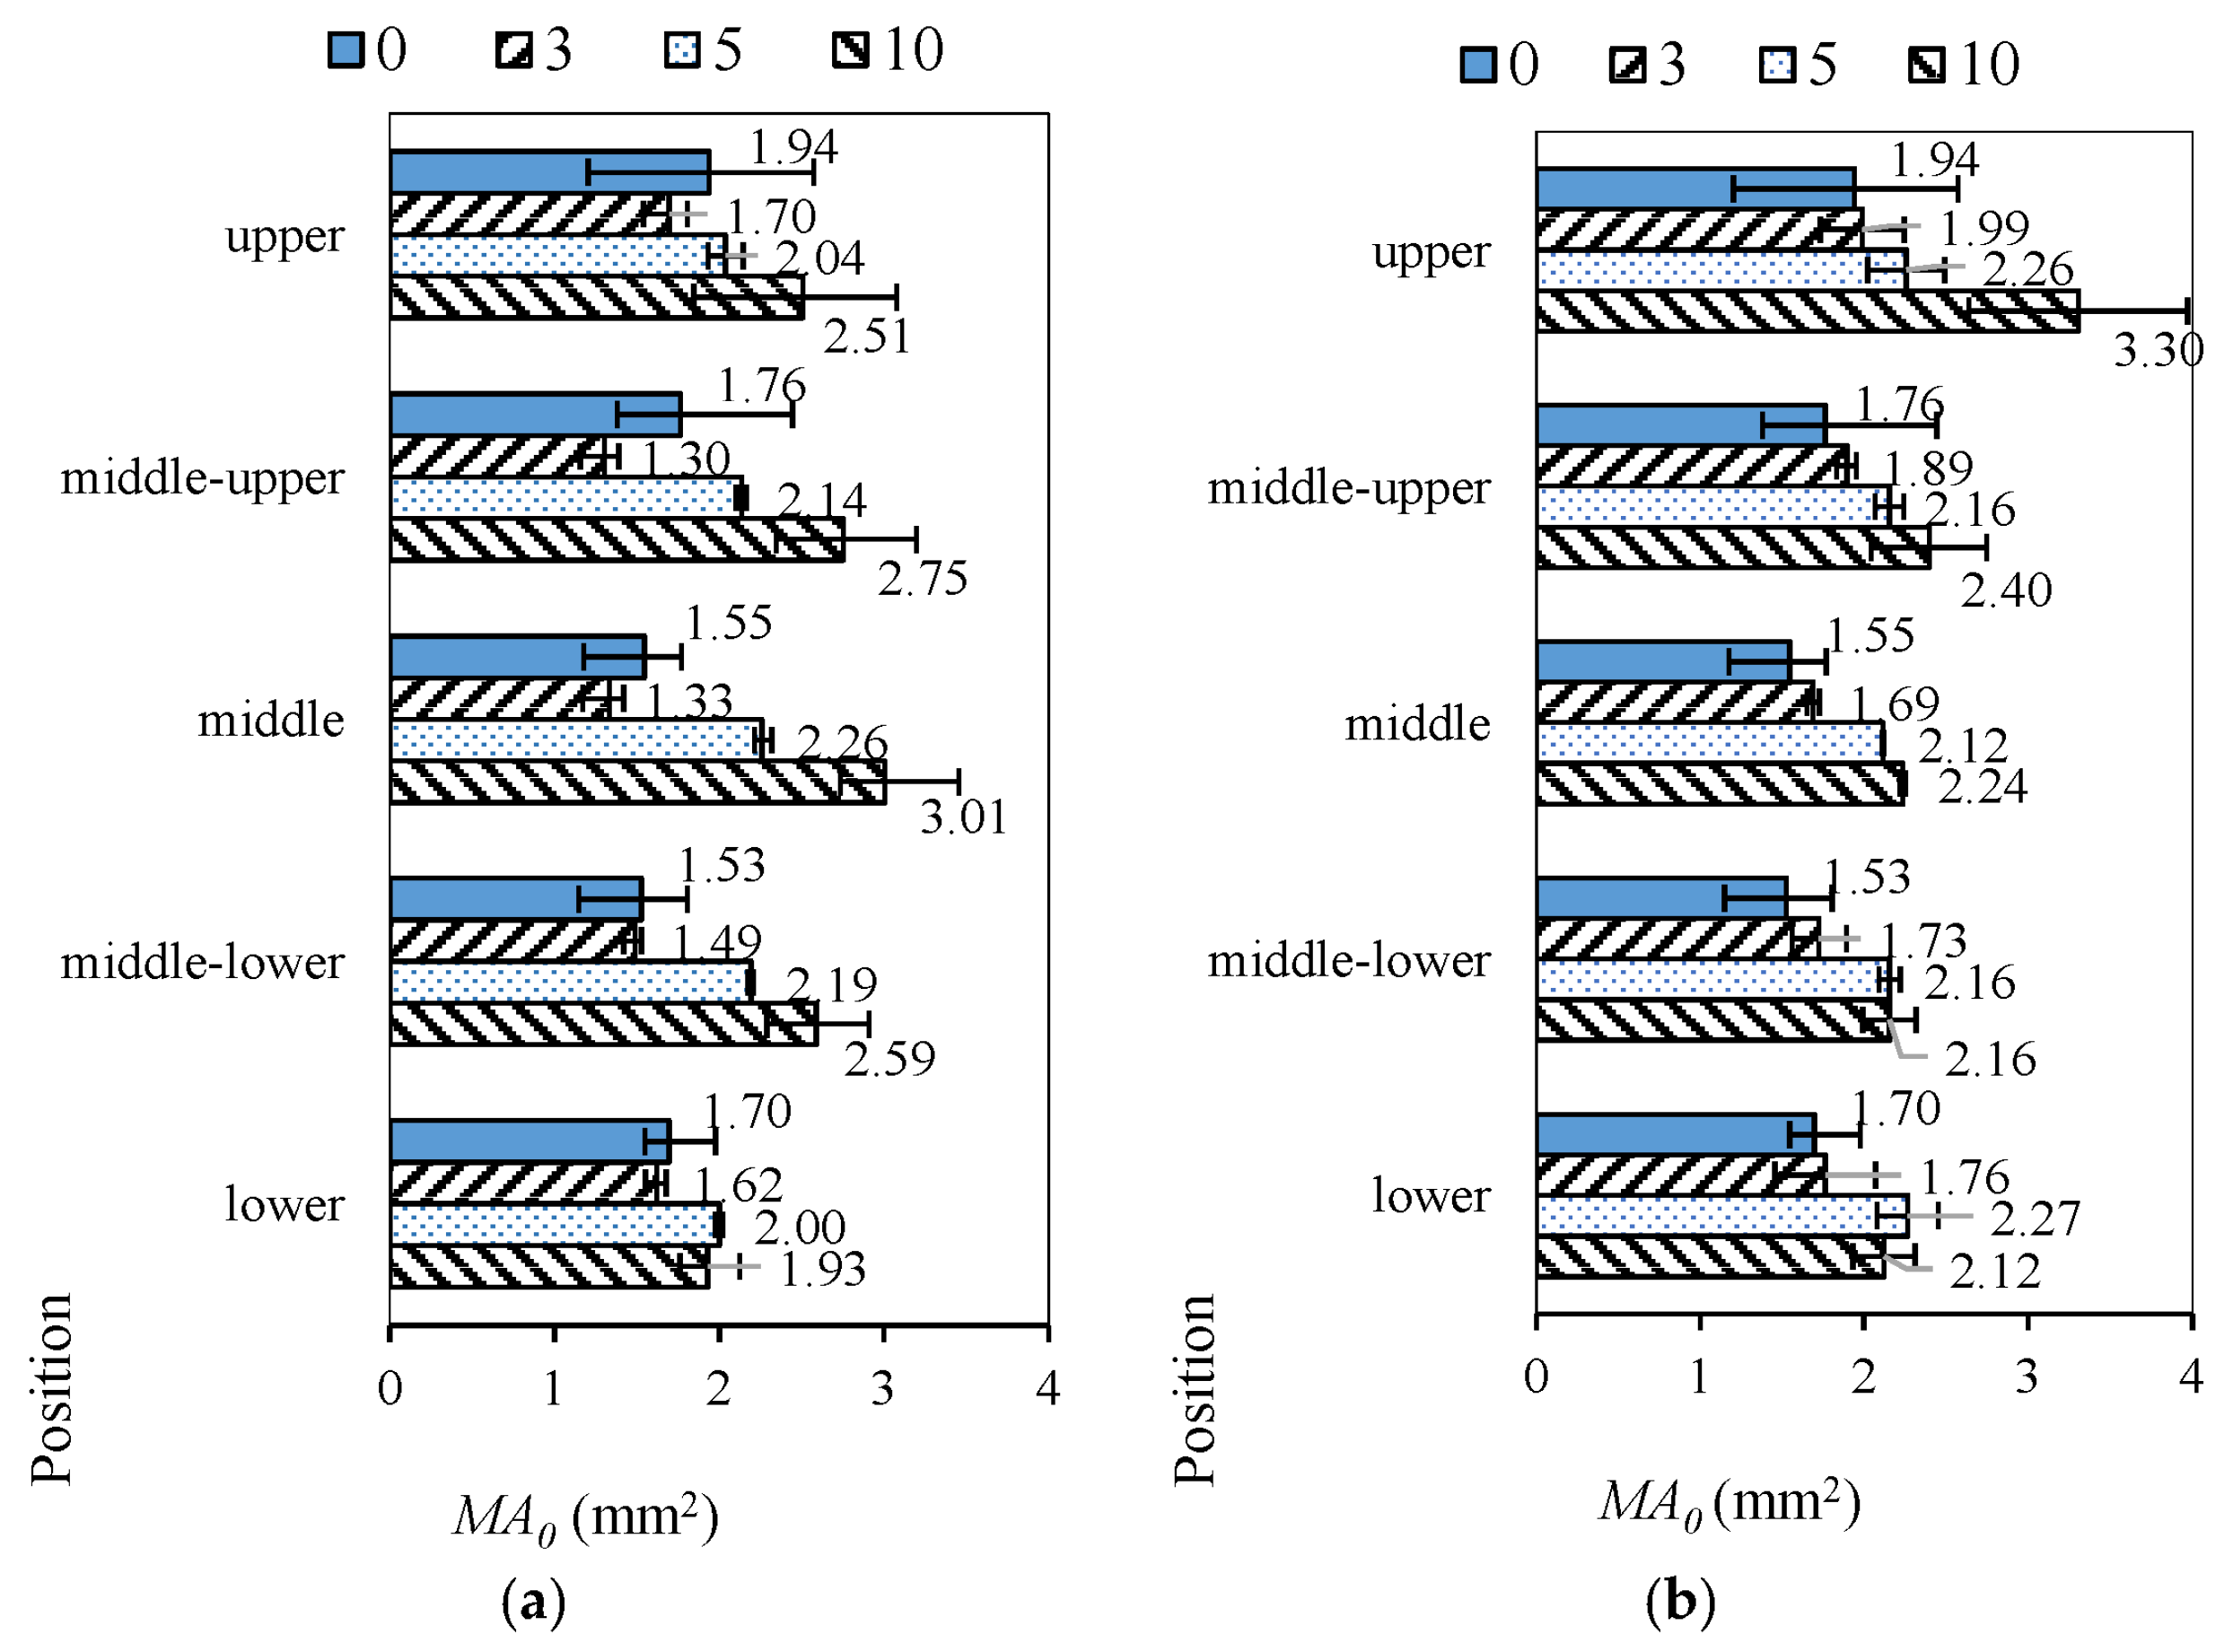
To further analyze the relative changes in the extent of rutting influence, the variation in the void ratio along the distance from the rutted part is plotted as shown in Figure 8. Calculations and comparisons of void areas based on height segments at 20% of the relative height were conducted, and the results are shown in Figure 9.
Figure 8 specifically shows the gradual trend of void ratio from the region near the rutting to the region away from it. It can be observed that with the increase in rutting depth, the void ratio of the non-rutted area near the rutting will show a significant increase, and with the increase in the distance from the rutting area, the trend of decreasing ratio is extremely fast. However, beyond a distance of 40 mm, the effects of rutting deformation appear to be nearly negligible, which implies the necessity of the division into impact zone and non-impact zone for the non-rutted part.
As shown in Figure 9a, the rutted part shows a decrease in the void area caused by compaction density at the initial stage (0–3 mm), followed by an increase in voids (3–10 mm). Among them, the process of increasing voids may correspond to the void aggregation phenomenon of crack damage. The distribution characteristics along the heights show that the maximum porosity under 5–10 mm rutting depth occurs in the middle section, which presents a symmetrical convex envelope characteristic of the middle is large and the two sides gradually become smaller, which is consistent with the known maximum shear stress location [21] of the pavement structure.
As shown in Figure 9b, the rut impact zone differs from the rutted part in the mean void area at different depths. Except at the bottom, the mean void area of the rut impact zone shows a gradual increase due to direct crushing by the load. The variation in the mean void area in height shows the characteristic of an eccentric concave curve envelope. The mean void area in the upper 20% of the rut impact zone is the largest among all the tested sections, and the development of void aggregation and enlargement is the most rapid, followed by the middle, and middle-upper sections of the rutted part.
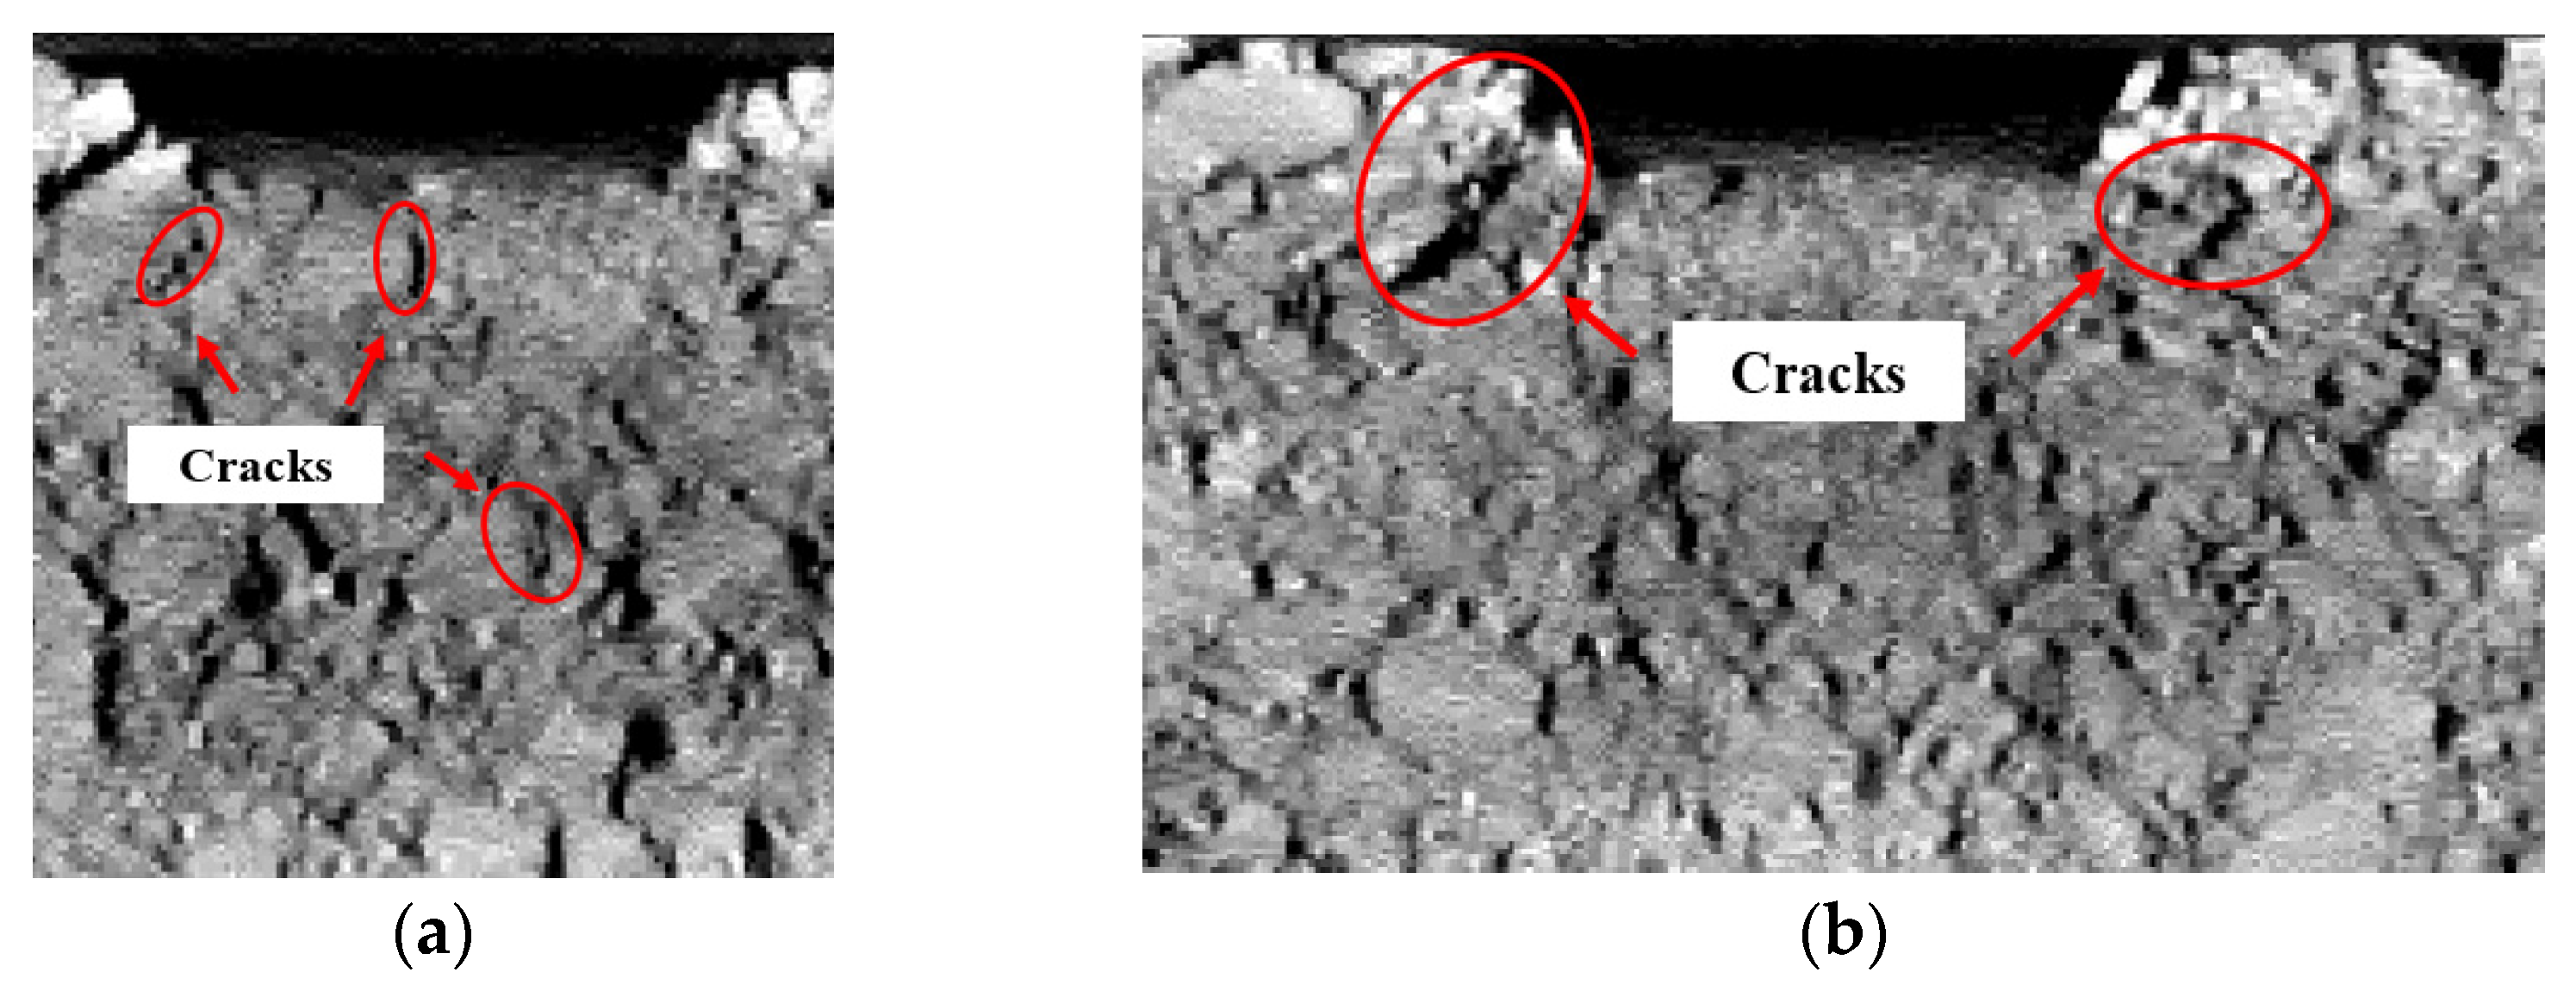
The wheel load position of the actual road is not stable, and the transverse distribution characteristics are more complex. Considering that the porosity at the 30–50% depth position (about 25–42 mm) changes rapidly and exceeds 8–10% (Figure 7a), such a large variation in voids may have a significant impact on maintenance and repair treatments such as overlays and sealants. This inherent defect will greatly reduce the life extension and performance enhancement provided by high-performance preventive maintenance materials, resulting in unreasonable over-maintenance. For ruts produced in hot climates, milling, and filling is recommended at a rut depth of 5–10 mm, and the milling range needs to be widened in the transverse direction. To verify the reason for changes in voids after rutting progression to 10 mm as illustrated above, cracks prevalent in the rutted part and rut-impact zone are presented in Figure 10.
As can be seen in Figure 10, the cracks in the rut-impact zone are more pronounced than in the rutted part, developing diagonally downwards along the non-rutted part, whereas the cracks in the rutted part develop predominantly from top to bottom. These cracks were basically of the TDC category.

3.2. Equivalent Void Diameter

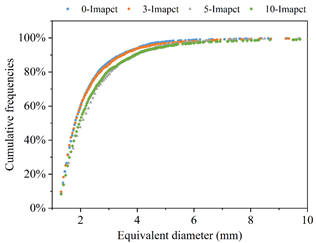
The fit void graduations of Deq and related parameters calculated are shown in Table 3.
As shown in Table 3, it can be found that the goodness-of-fit (Gofit) R2 values are all above 0.92, indicating acceptable fits. In general, the larger the scale parameter a, the larger the distribution range of the void gradation. The larger the shape parameter b is, the more concentrated the void gradation.
The results showed that the dimensional parameters of the specimens in the rutted part all fluctuated around 2 with increasing rut depth, indicating that there was not much difference in the range of void gradations. For shape parameter b, a larger difference was shown in the rutted part. Specifically, as the rut depth progresses to 3 mm, the shape parameter b increases from 2.04 to 2.75, indicating that the void size is gradually concentrated, which may be caused by densification. When the rutting depth progressed from 3 mm to 5 mm, b decreased to 1.75, indicating that at this stage, the rutted area underwent shear deformation and some of the voids began to transform into cracks, resulting in a decrease in void size concentration. As the rut depth progresses from 5 mm to 10 mm, b increases to 2.08, probably because more voids transform into cracks, resulting in a concentration of void size.
The changes in scale parameters in the rut impact zone are more significant. As the rut depth progresses to 5 mm, the void size range gradually increases, reaching the maximum at about 5 mm. When the rutting depth progressed from 5 mm to 10 mm, the void size range became slightly smaller, the value of 10 mm rut depth was equal to that of 3 mm rut depth. This may be because the cracking in the rut-impact zone occurred during the period that the rut depth increased to 5 mm. When the rut depth progressed to 10 mm, the void aggregation and reorganization occurred due to the further loading. The change in shape parameters occurred mainly at 0–3 mm rut depth, which corresponded to the increase in the concentration level of void gradation, and the discrete degree of void gradation increased significantly at 3–5 mm rut depth variation, with little difference in the shape of gradation at 5–10 mm rut depth interval. The evolution of the gradation of void size in the non-rutted parts, and the relative concentration of void gradation in the rutted parts, can also be observed in the images shown in Figure 10.

3.3. Aspect Ratio

During data processing, it was found that aspect ratio alone could not determine the stage of development of the voids with different lengths. Therefore, in Figure 11, we added indicator a in Equation (5) as the x-axis (Length) to fully display the void features.
As shown in Figure 11a,b, compared with the impact zone, the distribution of Ar and the Length of voids in the rutted part becomes slightly concentrated, but the difference is not obvious, indicating that the structure of the voids does not change significantly. The 3 mm depth rutting somewhat compresses the void in the two areas, mainly in the rutted part.
As illustrated in Figure 11c,d, the degree of Ar distribution of voids tends to be discrete, there is a significant increase in the Ar with a rut depth of 5 mm and a significant increase in the length of voids with a rut depth of 10 mm. This is indicative of the formation and progression of cracks.
A 5 mm rutting depth is associated with an increase in the number of voids with Ar greater than 4, which may be indicative of the onset of microcrack formation. However, the alteration in length is not readily discernible. In comparison to samples with a rut depth of 5 mm, the number of voids with Ar greater than 4 is reduced when the rut depth is 10 mm. This may be attributed to the formation of longer cracks as a result of microcracks connecting, which is also evidenced by an increase in length. Furthermore, the observed reduction in Ar may be caused by an increase in crack width due to the presence of transverse stresses.

3.4. Sphericity and Fullness

Based on the sphericity value, the voids are categorized into three types: when 0.6 < Sr < l.0, the void is regular; when 0.45 < Sr < 0.6, the void is irregular; when 0 < Sr < 0.45, the void is elongated. Sphericity results are shown in Figure 12.
As sphericity results of the rutted part shown in Figure 12a, in the process of rutting depth development from 0 to 3 mm, the proportion of elongated voids decreased, and then the proportion gradually increased, which is consistent with the conclusions of the analysis of microcrack formation and development trend in Section 3.1 and Section 3.2. In the process of rutting depth development up to 5 mm, the irregular voids also show a decreasing and then increasing trend, and the decreasing part mainly becomes regular voids, which should be caused by the dense action. In the process of rutting depth development from 5 mm to 10 mm, the irregular voids showed a slight decrease, but they did not become regular voids but turned into cracks.
From Figure 12b, it can be seen that the rut-influenced zone and the rutted portion of the different types of void occupancy have the same trend of change with increasing rut depth. The differences include: (1) the total percentage of elongated voids (cracks) is higher in the rut-impact zone; (2) the variation in regular and irregular voids is larger, and a certain percentage of irregular voids still exist at the development stage of rut depth from 5 to 10 mm to be transformed into regular voids, which means that the compaction process still exists or even continues.
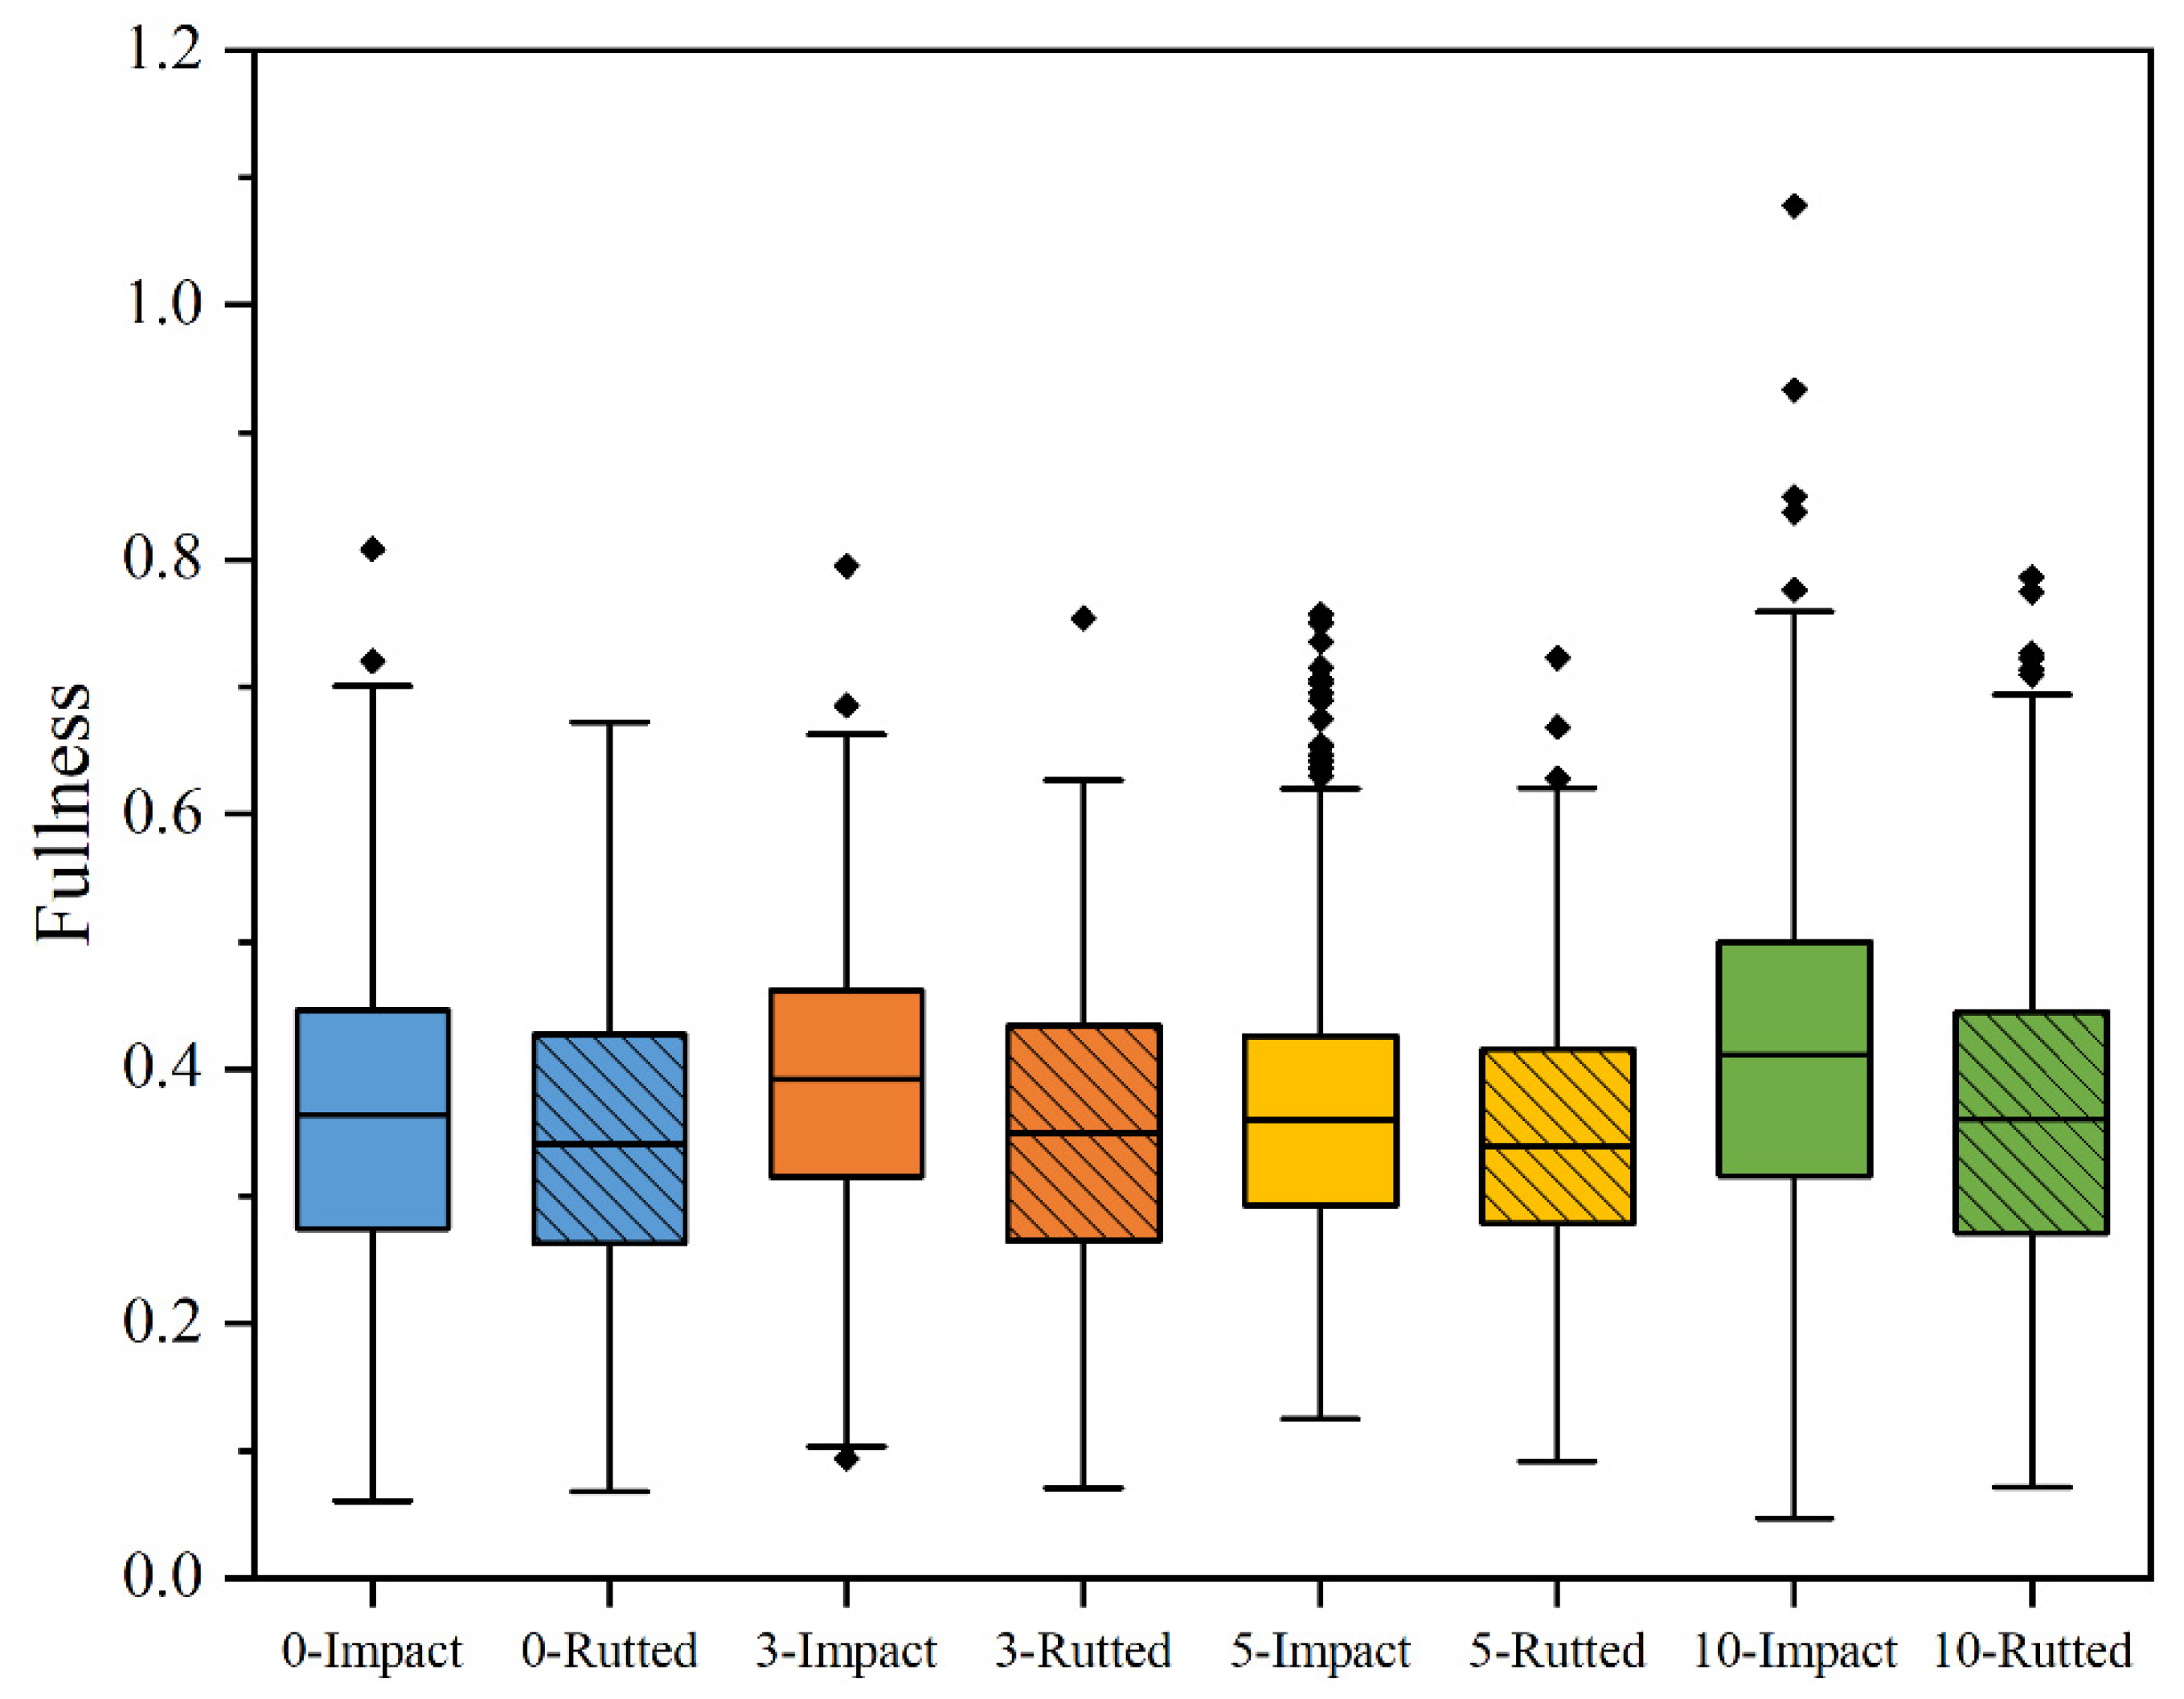
As illustrated in Figure 13, the fullness within the rut impact zone displays a more pronounced discrete pattern than that observed in the rutted part, accompanied by a notable rise in the number of outliers. The mean fullness in the rutted portion demonstrates a relatively stable distribution of values, exhibiting a slight increase at rut depths of 10 mm. In contrast, the mean fullness of the rutted impact zone increased significantly for specimens with rut depths of 3 mm and 10 mm, with more high-fullness voids. This increase in high-fullness voids indicates a complex change in the impact zone. To further analyze the characteristics of the region at 3 mm and 10 mm rutting depths, void distribution maps were plotted in Figure 14.
Figure 14 illustrates the transmission relationship and the shaping of voids resulting from the wheeling force acting on the specimens. As illustrated in Figure 14a for the slight rutting case, the rutted part is primarily manifested as a pressure transfer. Before cracking occurred, the void volume and average area gradually decreased with increasing compaction degrees, forming a skeleton interlocking structure. The void interface consists of dense and embedded aggregates, resulting in void characteristics of a low degree of fullness. The rut impact zone is characterized by a combination of pushing and squeezing actions, which generate shear tensile stresses. These stresses result in the formation of void interfaces consisting of aggregates that are not sufficiently dense and do not form stable interlocking relationships. Consequently, the degree of fullness is higher. The relative difference between the rut impact zone and the rutted part remained unaffected in the case of Figure 14b, although several significant cracks and micro-cracks occurred.

3.5. Influence of Material and Testing Factors

The results presented herein were obtained from a specific set of materials and testing conditions. It is recognized that factors such as binder type (including polymer modification like SBS), aggregate mineralogy and gradation, as well as testing temperature and loading speed, are critical determinants of asphalt mixture performance. For instance, SBS modification would be expected to enhance the elastic recovery of the binder, potentially mitigating permanent deformation [7,8,9,10]. Similarly, a stiffer aggregate skeleton or a different gradation could alter the resistance to shear flow [7].
However, the primary objective of this exploratory study was to isolate and investigate the meso-scale mechanistic response under a uniquely severe combination of high temperature and heavy load. The observed phenomena, such as the flow, redistribution, and the critical role of void morphology evolution, establish a fundamental framework for understanding damage in extreme environments. While the quantitative values of RD are specific to our experimental setup, the identified mechanisms (e.g., void coalescence leading to shear failure) are of fundamental importance. The explicit quantification of the influence of the factors mentioned above, while beyond the scope of this initial mechanistic investigation, constitutes a vital and logical next step for future research to build upon the foundational understanding provided here.

4. Conclusions and Recommendations for Future Work

To investigate 3D void changes in AC-16 asphalt slabs during rutting deformation under extreme high-temperature and heavy-load conditions, this study combined rutting tests with CT image analysis to characterize the evolution of the internal void structure. The rut depth was evaluated at intervals of approximately 0 mm, 3 mm, 5 mm, and 10 mm. Parameters such as void ratio, mean void area, and equivalent void diameter were calculated and compared between the rut-impacted zone and the rutted section at various depths and cross-sectional locations to assess void development under rutting. Additionally, a comparative analysis of morphological features of voids was conducted, including aspect ratio, sphericity, and fullness. The main findings are as follows:
  • The rut-impacted zone exhibits significant differences from both the rutted section and the non-impacted zone in terms of void depth distribution, volumetric development, and morphological characteristics. Under extreme high-temperature and heavy-load conditions, these differences are reflected in earlier crack initiation, larger voids, and increased instability in the fine-scale structure of the void–asphalt mortar–aggregate system.
  • At a rut depth of 5 mm, several TDCs longer than 6 mm were observed in the rut-impacted zone, whereas only one microcrack was detected in the rutted section of the same specimen. At a rut depth of 10 mm, the number of cracks became similar between the two zones; however, those in the impacted zone remained larger and wider.
  • TDC damage caused by high-temperature rutting primarily occurs in the mid-to-upper region of the slab. Therefore, fine-scale data from the bottom region should be interpreted with caution.
  • Combining morphological indicators with volumetric parameters can effectively track the initiation and propagation of microcracks. However, it should be noted that equivalent void diameter is not a sensitive indicator for distinguishing the degree of compaction or deformation in the same type of mixture. Furthermore, the fullness parameter should be applied in conjunction with aggregate characteristics.
From a practical perspective, this study highlights that the rutting failure mechanism under extreme conditions is not merely a simple accumulation of plastic deformation but involves a complex process of internal structural adaptation and damage. The findings imply that standard performance tests conducted at lower temperatures or stress levels may fail to capture these critical high-temperature mechanisms, potentially leading to an underestimation of rutting risk in projects located in hot climates or subjected to heavy traffic.
Based on the findings and limitations of this study, the following specific directions are recommended for future research: (1) The meso-scale analysis framework established here should be applied to a wider array of materials, including SBS-modified binders, different aggregate types (e.g., limestone vs. granite), and various gradations. This will quantify the influence of these factors on the observed mechanisms and determine the universality of the proposed failure progression. (2) The quantitative data on void evolution (e.g., rate of coalescence, change in sphericity) can be used to develop and calibrate multi-scale computational models that couple binder rheology with aggregate skeleton stability for predicting rutting. (3) Accelerated pavement testing under controlled temperature conditions is essential to validate the laboratory findings and the meso-scale analysis methodology against full-scale performance data. (4) Future efforts should focus on developing a standardized and efficient protocol for acquiring and analyzing CT images of asphalt mixtures to make this powerful technique more accessible for routine performance assessment.

Author Contributions

Conceptualization, H.W.; Methodology, Z.X.; Software, Z.X. and W.F.; Validation, W.F.; Formal analysis, Z.X., W.F. and H.W.; Investigation, Z.X.; Data curation, Z.X. and W.F.; Writing – original draft, Z.X., W.F. and H.W.; Writing—review and editing, H.W.; Visualization, W.F.; Supervision, H.W.; Project administration, H.W. All authors have read and agreed to the published version of the manuscript.

Funding

This research received no external funding.

Institutional Review Board Statement

Not applicable.

Informed Consent Statement

Not applicable.

Data Availability Statement

Some or all data, models, or code that support the findings of this study are available from the corresponding author upon reasonable request.

Conflicts of Interest

Author Zhoucong Xu was employed by the company China Merchants Chongqing Communications Technology Research & Design Institute Co., Ltd. The remaining authors declare that the research was conducted in the absence of any commercial or financial relationships that could be construed as a potential conflict of interest.

References

  1. International Slurry Surfacing Association. Recommended Performance Guideline for Microsurfacing; ISSA A143; ISSA: Annapolis, MD, USA, 2010. [Google Scholar]
  2. Jiang, Y.J. Pavement Performance Measures and Forecasting and the Effects of Maintenance and Rehabilitation Strategy on Treatment Effectiveness; FHWA-HRT-17-095; Office of Infrastructure Research and Development: Washington, DC, USA, 2016.
  3. JTG/T 5148-01-2021; Technical Specifications for Preventive Maintenance of Highway Asphalt Pavement. Key Laboratory of Highway Engineering of Ministry of Education: Xi’an, China, 2021. (In Chinese)
  4. Shackil, G.; Ali, A.; Mehta, Y.; Papuc, D. Evaluating the laboratory cracking performance of pavement preservation materials using the Texas overlay tester. Constr. Build. Mater. 2020, 262, 120802. [Google Scholar] [CrossRef]
  5. Canestrari, F.; Ingrassia, L.P. A review of top-down cracking in asphalt pavements: Causes, models, experimental tools and future challenges. J. Traffic Transp. Eng. (Engl. Ed.) 2020, 7, 541–572. [Google Scholar] [CrossRef]
  6. JTG E20-2011; Standard Test Methods of Bitumen and Bituminous Mixtures for Highway Engineering. Key Laboratory of Highway Engineering of Ministry of Education: Xi’an China, 2011. (In Chinese)
  7. Rieksts, K.; Pettinari, M.; Haritonovs, V. The influence of filler type and gradation on the rheological performance of mastics. Road Mater. Pavement Des. 2018, 20, 964–978. [Google Scholar] [CrossRef]
  8. Du, Y.; Chen, J.; Han, Z.; Liu, W. A review on solutions for improving rutting resistance of asphalt pavement and test methods. Constr. Build. Mater. 2018, 168, 893–905. [Google Scholar] [CrossRef]
  9. Simms, R.; Hernando, D.; Roque, R. A new paradigm to explain the development of instability rutting in asphalt pavements. Road Mater. Pavement Des. 2020, 21, 1815–1828. [Google Scholar] [CrossRef]
  10. Radhakrishnan, V.; Ramya Sri, M.; Reddy, K.S. Sensitivity of rutting and moisture resistance of asphalt mixes to gradation and design air void content. Int. J. Pavement Eng. 2020, 21, 1035–1043. [Google Scholar] [CrossRef]
  11. Norouzi, A.; Kim, D.; Richard Kim, Y. Numerical evaluation of pavement design parameters for the fatigue cracking and rutting performance of asphalt pavements. Mater. Struct. 2016, 49, 3619–3634. [Google Scholar] [CrossRef]
  12. Lv, Q.; Huang, W.; Bahia, H.U.; Tang, N.; Zhu, T. Three-Stage Damage Evolution of Asphalt Mixture in the Wet Hamburg Wheel Tracking Device Test Using X-Ray Computed Tomography. J. Mater. Civ. Eng. 2018, 30, 04018138. [Google Scholar] [CrossRef]
  13. Ma, X.; Zhou, P.; Wang, L.; Jiang, J.; Wang, J. Internal structure change of porous asphalt concrete under coupled conditions of load, moisture and temperature. Constr. Build. Mater. 2022, 314, 125603. [Google Scholar] [CrossRef]
  14. Ren, J.; Xue, B.; Zhang, L.; Liu, W.; Li, D.; Xu, Y. Characterization and prediction of rutting resistance of rock asphalt mixture under the coupling effect of water and high-temperature. Constr. Build. Mater. 2020, 254, 119316. [Google Scholar] [CrossRef]
  15. Sun, J.; Zhang, H.; Yu, T.; Shi, Y.; Liu, Y. Microscopic void characteristics of OGFC in Sponge City and its effect on noise reduction performance using X-ray CT. Constr. Build. Mater. 2023, 408, 133729. [Google Scholar] [CrossRef]
  16. Deng, Y.; Lu, T.; Ma, J.; Sun, D. Analysis on Factor Dependence of Rutting Depth in Composite Pavement Considering Tunnel Conditions. Int. J. Pavement Res. Technol. 2023, 16, 1501–1521. [Google Scholar] [CrossRef]
  17. Alamnie, M.M.; Taddesse, E.; Hoff, I. Advances in Permanent Deformation Modeling of Asphalt Concrete—A Review. Materials 2022, 15, 3480. [Google Scholar] [CrossRef]
  18. Alae, M.; Zarei, S.; Ouyang, J.; Xiao, F. Prediction of top-down crack resistance in semi-flexible pavements under coupling effect of rutted surface and temperature gradient. Int. J. Pavement Eng. 2023, 24, 2152024. [Google Scholar] [CrossRef]
  19. Wang, G.; Roque, R.; Morian, D. Effects of Surface Rutting on Near-Surface Pavement Responses Based on a Two-Dimensional Axle-Tire-Pavement Interaction Finite-Element Model. J. Mater. Civ. Eng. 2012, 24, 1388–1395. [Google Scholar] [CrossRef]
  20. Gu, F.; Luo, X.; West, R.C.; Taylor, A.J.; Moore, N.D. Energy-based crack initiation model for load-related top-down cracking in asphalt pavement. Constr. Build. Mater. 2018, 159, 587–597. [Google Scholar] [CrossRef]
  21. Sun, L.; Wang, G.; Zhang, H.; Liu, L. Initiation and Propagation of Top-Down Cracking in Asphalt Pavement. Appl. Sci. 2018, 8, 774. [Google Scholar] [CrossRef]
  22. Ling, M.; Luo, X.; Chen, Y.; Hu, S.; Lytton, R.L. A calibrated mechanics-based model for top-down cracking of asphalt pavements. Constr. Build. Mater. 2019, 208, 102–112. [Google Scholar] [CrossRef]
  23. Gao, L.; Kong, H.; Deng, X.; Wang, Z. Multi-scale finite element simulation of asphalt mixture anti-cracking performance. Theor. Appl. Fract. Mech. 2022, 121, 103490. [Google Scholar] [CrossRef]
  24. Dai, W.; Qian, G.; Zhu, X.; Yu, H.; Shi, C.; Zhang, C.; Ge, J.; Xie, T. Research on void characteristics during compaction of asphalt mixtures. Constr. Build. Mater. 2024, 416, 135069. [Google Scholar] [CrossRef]
  25. Jiang, S.; Weng, Z.; Wu, D.; Du, Y.; Liu, C.; Lin, Y. Pavement compactness estimation based on 3D pavement texture features. Case Stud. Constr. Mater. 2024, 21, e03768. [Google Scholar] [CrossRef]
  26. Teng, X.; Zhang, D.; Zhang, F. Study on Damage of the OGFC Mixture Based on Characteristics of Void Distribution. Adv. Mater. Sci. Eng. 2022, 2022, 1844556. [Google Scholar] [CrossRef]
  27. Yu, D.; Jing, H.; Liu, J. Effects of Freeze–Thaw Cycles on the Internal Voids Structure of Asphalt Mixtures. Materials 2022, 15, 3560. [Google Scholar] [CrossRef]
  28. Li, Y.; Hao, P.; Zhao, C.; Ling, J.; Wu, T.; Li, D.; Liu, J.; Sun, B. Anti-rutting performance evaluation of modified asphalt binders: A review. J. Traffic Transp. Eng. (Engl. Ed.) 2021, 8, 339–355. [Google Scholar] [CrossRef]
  29. Wang, X.; Gu, X.; Hu, X.; Zhang, Q.; Dong, Q. Three-Stage Evolution of Air Voids and Deformation of Porous-Asphalt Mixtures in High-Temperature Permanent Deformation. J. Mater. Civ. Eng. 2020, 32, 04020233. [Google Scholar] [CrossRef]
  30. Li, Q.; Yang, H.; Ma, X.; Ni, F. Evaluation of microstructure and damage evolution for asphalt pavements in an advanced repeated load permanent deformation test using X-ray computed tomography. Road Mater. Pavement Des. 2017, 18, 1135–1158. [Google Scholar] [CrossRef]
  31. Li, J.; Han, X.; Li, X.; Diao, H.; He, Z. Investigation of aggregate gradation on air voids distribution in porous asphalt concrete using X-ray CT scanning images. Case Stud. Constr. Mater. 2024, 21, e03710. [Google Scholar] [CrossRef]
  32. Sun, J.; Zhang, H.; Xie, K.; Jiang, L.; Ren, T.; Sun, Y. Meso-structural evolution characteristics of porous asphalt mixtures with stress-induced and their effects on environmental functions. Constr. Build. Mater. 2024, 432, 136687. [Google Scholar] [CrossRef]
  33. Zhao, K.; Yang, H.; Wang, W.; Wang, L. Characterization of Rutting Damage by the Change of Air-Void Characteristics in the Asphalt Mixture Based on Two-Dimensional Image Analysis. Materials 2022, 15, 7190. [Google Scholar] [CrossRef] [PubMed]
  34. Wu, J.; Wu, Y. Performance Evaluation of Asphalt Pavement with Semi-Rigid Base and Fine-Sand Subgrade by Indoor Large-Scale Accelerated Pavement Testing; Accelerated Pavement Testing to Transport Infrastructure Innovation; Springer: Cham, Switzerland, 2020; pp. 80–89. [Google Scholar] [CrossRef]
  35. Kuang, X.; Yang, F.; Fu, J.; Liu, F. Analysis of early rutting disease at urban road intersection. Highlights Sci. Eng. Technol. 2022, 18, 38–41. [Google Scholar] [CrossRef]
  36. Li, J.; Guo, W.; Meng, A.; Han, M.; Tan, Y. Investigation on the Micro Deformation Mechanism of Asphalt Mixtures under High Temperatures Based on a Self-Developed Laboratory Test. Materials 2020, 13, 1791. [Google Scholar] [CrossRef] [PubMed]
  37. Saeed, F.; Rahman, M.; Chamberlain, D.; Collins, P. Asphalt surface damage due to combined action of water and dynamic loading. Constr. Build. Mater. 2019, 196, 530–538. [Google Scholar] [CrossRef]
  38. Shi, L.; Wang, Y.; Li, H.; Liang, H.; Lin, B.; Wang, D. Recycled asphalt mixture’s discrete element model-based composite structure and mesoscale-mechanical properties. Case Stud. Constr. Mater. 2023, 18, e01987. [Google Scholar] [CrossRef]
  39. Zhang, J.; Yang, J. Experimental and Numerical Investigation of Dilation Behavior of Asphalt Mixture. Int. J. Geomech. 2017, 17, 04016062. [Google Scholar] [CrossRef]
  40. Liu, J.; Chen, S.; Liu, Q.; Wang, Y.; Yu, B. Influence of steel slag incorporation on internal skeletal contact characteristics within asphalt mixture. Constr. Build. Mater. 2022, 352, 129073. [Google Scholar] [CrossRef]
  41. Xu, H.; Shi, H.; Tan, Y. Investigation and Characterization of 3DVoid Meso-structures in Asphalt Mixtures. China J. Highw. Transp. 2020, 33, 210–220. (In Chinese) [Google Scholar] [CrossRef]
  42. Zhang, Y.; Ma, T.; Ding, X.; Chen, T.; Huang, X.; Xu, G. Impacts of air-void structures on the rutting tests of asphalt concrete based on discretized emulation. Constr. Build. Mater. 2018, 166, 334–344. [Google Scholar] [CrossRef]
  43. Mahmud, M.Z.H.; Hassan, N.A.; Hainin, M.R.; Ismail, C.R. Microstructural investigation on air void properties of porous asphalt using virtual cut section. Constr. Build. Mater. 2017, 155, 485–494. [Google Scholar] [CrossRef]
  44. Jennings, B.R.; Parslow, K. Particle Size Measurement: The Equivalent Spherical Diameter. Proc. R. Soc. Lond. Ser. A Math. Phys. Sci. 1988, 419, 137–149. [Google Scholar] [CrossRef]
  45. Kuo, C.; Frost, J.D.; Lai, J.S.; Wang, L.B. Three-Dimensional Image Analysis of Aggregate Particles from Orthogonal Projections. Transp. Res. Rec. 1996, 1526, 98–103. [Google Scholar] [CrossRef]
  46. Valsangkar, A.J. Principles, Methods and Applications of Particle Size Analysis; Cambridge University Press: Cambridge, UK, 1992; Volume 29, p. 1006. [Google Scholar] [CrossRef]
  47. Wadell, H. Sphericity and Roundness of Rock Particles. J. Geol. 1933, 41, 310–331. [Google Scholar] [CrossRef]
  48. Gao, L.; Ni, F.; Luo, H.; Charmot, S. Characterization of air voids in cold in-place recycling mixtures using X-ray computed tomography. Constr. Build. Mater. 2015, 84, 429–436. [Google Scholar] [CrossRef]
  49. Xia, X.; Han, D.; Zhao, Y.; Xie, Y.; Zhou, Z.; Wang, J. Investigation of asphalt pavement crack propagation based on micromechanical finite element: A case study. Case Stud. Constr. Mater. 2023, 19, e02247. [Google Scholar] [CrossRef]
Figure 1. Molding steps of the specimen.
Applsci 15 09464 g001
Figure 2. Rutting test process.
Applsci 15 09464 g002
Figure 3. Image acquisition method. (a) CT scanning equipment; (b) Sectional CT scanned image of AC-16.
Applsci 15 09464 g003
Figure 4. Schematic diagram of specimen partitioning. Note: all transverse subdivisions discussed below are based on this subdivision name expression.
Applsci 15 09464 g004
Figure 5. Image analysis process.
Applsci 15 09464 g005
Figure 6. Sphericity and spheroidicity.
Applsci 15 09464 g006
Figure 7. Void ratio distribution along the depth direction. (a) Rutted part; (b) Non-rutted part; (c) Rutted-impact zone; (d) Non-affected zone. Relative height 0 represents the contact surface with the wheel, and 1 represents the bottom surface. Note: The calculated porosity based on CT image segmentation exhibits a positive deviation from the actual condition.
Applsci 15 09464 g007
Figure 8. Void ratio of un-rutted parts.
Applsci 15 09464 g008
Figure 9. Changes in the mean void area for different transverse zones with different rut depths. (a) Rutted-part; (b) Rut impact zone.
Applsci 15 09464 g009
Figure 10. CT slice part with rutting depth of 10 mm. (a) Cracks in the rutted part; (b) Cracks in the rut-impact zone.
Applsci 15 09464 g010
Figure 11. Distribution of aspect ratio of impact and rutted parts at different levels of ruts depth. (a) 0 mm; (b) 3 mm; (c) 5 mm; (d) 10 mm.
Applsci 15 09464 g011
Figure 12. Results of sphericity. (a) Rutted part; (b) Impact zone.
Applsci 15 09464 g012
Figure 13. Results of fullness.
Applsci 15 09464 g013
Figure 14. Void distribution maps. (a) 3 mm rut depth; (b) 10 mm rut depth.
Applsci 15 09464 g014
Table 1. Properties of the asphalt binder.
Test MetricsValueTest Methods
Penetration (25 °C, 5 s, 100 g) (0.1 mm)69T0604-2011
Penetration index−0.53T0604-2011
Ductility (5 °C) (cm)42T0605-2011
Soft point (°C)51.6T0606-2011
Rotating thin film oven test (RTFOT)Mass loss (%)0.5T0610-2011
Penetration ratio (%)60.2T0610-2011
Ductility (10 °C) (cm)27.1T0605-2011
Table 2. Aggregate gradation of AC-16.
Sieve Size (mm)191613.29.54.752.361.180.60.30.150.075
Passing rate (%)10096.683.570.34430.322.115.810.67.75.2
Table 3. Results of fitting parameters.
PartsRD (mm)abR2Fit Curves
Rutted01.972.040.9500Applsci 15 09464 i001
32.012.750.9738
52.181.750.9620
101.992.080.9275
Impact Zone01.952.030.9389Applsci 15 09464 i002
32.122.190.9720
52.251.850.9646
102.131.850.9460
Disclaimer/Publisher’s Note: The statements, opinions and data contained in all publications are solely those of the individual author(s) and contributor(s) and not of MDPI and/or the editor(s). MDPI and/or the editor(s) disclaim responsibility for any injury to people or property resulting from any ideas, methods, instructions or products referred to in the content.