1. Introduction and Background
Unsignalized intersections operating under priority control are common in road networks. According to the priority rule, vehicles entering the intersection from the controlled legs (often termed “minor”) must yield the right-of-way to traffic approaching on the uncontrolled legs (often termed “major”). Drivers on the minor approaches have to comply with either a stop or a yield sign.
The evaluation of traffic operations at this type of intersection is usually based on performance measures such as approach capacities, delays and queue lengths. In addition, safety issues are often a concern due to the discretionary nature of minor road drivers’ behavior.
The operation of priority intersections is strongly dependent on gap acceptance, that is, the process by which drivers on a minor approach select a gap in the major road traffic stream to safely execute the desired crossing or merging maneuver [
1].
The main parameters used to characterize gap acceptance behavior are the critical gap and the follow-up time [
2]. The first is defined as the minimum time gap in the major road traffic stream that a driver considers acceptable to enter the intersection from the minor road approach. Due to its behavioral nature, the critical gap may exhibit significant variations both between and within individuals. As a simplification, these kinds of variations are often neglected in the analyses supporting intersection design and management, implying that drivers at a given location are assumed to be homogeneous and consistent. Notably, this assumption rules out the possibility that drivers would accept a gap smaller than one they had previously rejected.
Follow-up time is defined as the minimum interval between the entry of two consecutive vehicles in the same gap of the major road stream. It is analogous to the saturation headway at signalized intersections, and can only be observed under conditions of queuing on the minor approach.
Both parameters are key determinants of the performance of priority intersections [
3], and play an essential role in the operation of roundabouts as well [
4,
5]. Gap acceptance behavior not only affects the operational efficiency of unsignalized intersections, but also has important safety implications [
6,
7]. Since in the present study the interplay between gap acceptance behavior and network route choice is investigated, considering follow-up time as a fixed parameter, the following introductory remarks focus only on the critical gap.
In addition to characteristics of the driver and vehicle performing the maneuver from the minor approach, several other factors are known to significantly affect the magnitude of the critical gap. Among them, the most influential are the type of maneuver being executed, the type of traffic control on the minor road (stop or yield sign), the average speed of traffic on the major road, intersection geometry and environmental conditions [
8,
9]. Moreover, situation-related conditions such as the delay incurred by minor road vehicles before entering the intersection have been shown to influence gap acceptance behavior [
10].
Critical gap may also be significantly affected by other characteristics of the major road traffic stream, such as vehicular composition [
11] and type of headway distribution [
12].
While traditionally gap acceptance behavior has been investigated using observational data collected through video or manual recordings, studies based on naturalistic driving [
13] or driving simulator experiments [
14] have become viable alternatives in recent years.
Of particular interest to the present study is the impact on critical gap of the intensity of traffic on the major road. Intuition suggests that an increase in the latter should cause a reduction in minor road drivers’ critical gap. High traffic volumes on the major road cause long delays to minor road vehicles. As a result, minor road drivers tend to become impatient and are willing to bear the increased risk of accepting short gaps to perform their desired maneuvers. Thus, this phenomenon can be viewed essentially as a tradeoff between the cost of waiting and the cost of accident risk.
Since minor road drivers’ delay ultimately depends on the volume of the priority traffic stream, the above-described effect can be expressed analytically by means of a function relating critical gap to major road flow. On the other hand, the relationship between the critical gap and the waiting time of minor road drivers may be of primary interest in some cases. Several researchers have investigated this issue in the context of studies about gap acceptance and capacity of unsignalized intersections.
The tendency of the critical gap to decrease with increasing waiting time was demonstrated, among others, by Mahmassani and Sheffi [
15], Adebisi and Sama [
16] and Kittelson and Vandehey [
17]. Polus et al. [
18] analyzed the gap acceptance behavior of drivers on the minor approach as a learning process, and showed that the learning rate was affected both by the waiting time and by the traffic volume on the major road.
Hamed et al. [
8] developed a disaggregate gap acceptance model using data collected at 15 urban unsignalized T-intersections, and found, in particular, that the mean critical gap was a decreasing function of traffic flow on the major road. The tradeoff between the risk and the benefit of accepting short gaps, which underlies the effect of waiting time on critical gap, was investigated by Pollatschek et al. [
10] within a microscopic decision model of gap acceptance behavior. They showed that different compositions of the driving population in terms of attitude toward risk may result in different minor road capacities, suggesting that these differences should be taken into account in order to obtain realistic capacity estimates.
Using data collected at seven urban and suburban sites, Polus et al. [
19,
20] analyzed the relationship between gap acceptance and waiting time of drivers on roundabout approaches. They estimated a logistic model and a binary logit model, and found in both cases that delay had a significant effect in reducing the critical gap of drivers entering the roundabout.
Viti et al. [
21] proposed to use a variable critical gap in the microscopic simulation of traffic operations at unsignalized intersections. A decreasing functional relationship between critical gap and major road traffic volume was introduced in the microsimulation software VISSIM 5.0. Calibration and validation results reported by the authors indicate that a significant improvement of the model can be achieved by replacing the constant critical gap parameter with a flow-dependent gap acceptance formulation.
Day-to-day dynamic route choice models describe the evolution of network flows over successive time periods, and seek to predict the long-term outcome of this process as a result of various demand, supply and user behavior characteristics. Following the pioneering work of Horowitz [
22], an active area of research dealing with day-to-day traffic dynamics and the related issue of equilibrium stability has developed over the last forty years.
Specific types of day-to-day dynamic models can be formulated based on different assumptions about the route choice paradigm (deterministic or probabilistic) and the nature of the underlying dynamic process (deterministic or stochastic) [
23]. For the purpose of the present study, we focus in particular on discrete-time, deterministic process models with probabilistic route choice.
After general theoretical results were established by Cantarella and Cascetta [
24], a number of studies regarding various applications of day-to-day dynamic models have been carried out. For example, Bie and Lo [
25] analyzed the attraction domains of network equilibria, and suggested that their identification could be used to direct the traffic evolution toward a target equilibrium by means of traffic management measures. Other studies [
26,
27] addressed the interaction between day-to-day dynamic route choice and adaptive traffic signal control. The process of commuters’ route choice adjustments following network disruptions was investigated in a day-to-day dynamic vulnerability analysis by Xu et al. [
28]. Sun [
29] studied the day-to-day route choice dynamics arising from the coexistence of autonomous vehicles and human-driven vehicles in mixed traffic flows. Meneguzzer [
30] adopted a day-to-day dynamic approach to model the effect of travelers’ contrarian route choice behavior on the evolution of network states.
Alongside research investigating the theoretical aspects of day-to-day traffic dynamics, several experiments focusing on the observation of repeated route choice behavior have been conducted, both in laboratory-like environments [
31,
32,
33] and in real-world settings [
34]. Studies aimed at establishing a link between analytical and empirical approaches are also documented in the literature [
35,
36].
The joint modeling of the day-to-day dynamics of route choice and gap acceptance appears to be a virtually unexplored topic. A possible exception is the study by Liu et al. [
37], who included in the dynamic microsimulation model DRACULA a function allowing the critical gap to decrease with increasing waiting time at priority intersections.
This research gap provides the motivation for the present study, whose aim is to propose and test a combined model of the day-to-day evolution of route choice and gap acceptance. To this end, we formulate a discrete-time, deterministic dynamical system, and investigate analytically and numerically its key properties. To the author’s knowledge, this represents a novel contribution to the field of traffic dynamics in road networks.
The remainder of the paper is organized as follows. The conceptual structure of the proposed model is described in
Section 2, with emphasis on the twofold dependence of minor road capacities on major road flows.
Section 3 presents the general formulation of the model, followed by the derivation of explicit fixed-point stability conditions for an elementary network with analytically tractable forms of the involved functions. A few numerical examples demonstrating the application of the model in the simplified setting are also provided in
Section 3. The results of extensive numerical tests of the proposed model on a grid network with realistic functions are illustrated in
Section 4. Concluding remarks and suggestions for possible developments of the proposed approach are offered in
Section 5.
2. Conceptual Description of the Proposed Model
As stated in the introductory remarks, the purpose of this study is to investigate the interaction between drivers’ route choice and gap acceptance behavior ensuing from the presence of priority intersections in a road network. This goal is accomplished by combining into a single framework the models that are usually employed to describe separately the two types of behavior.
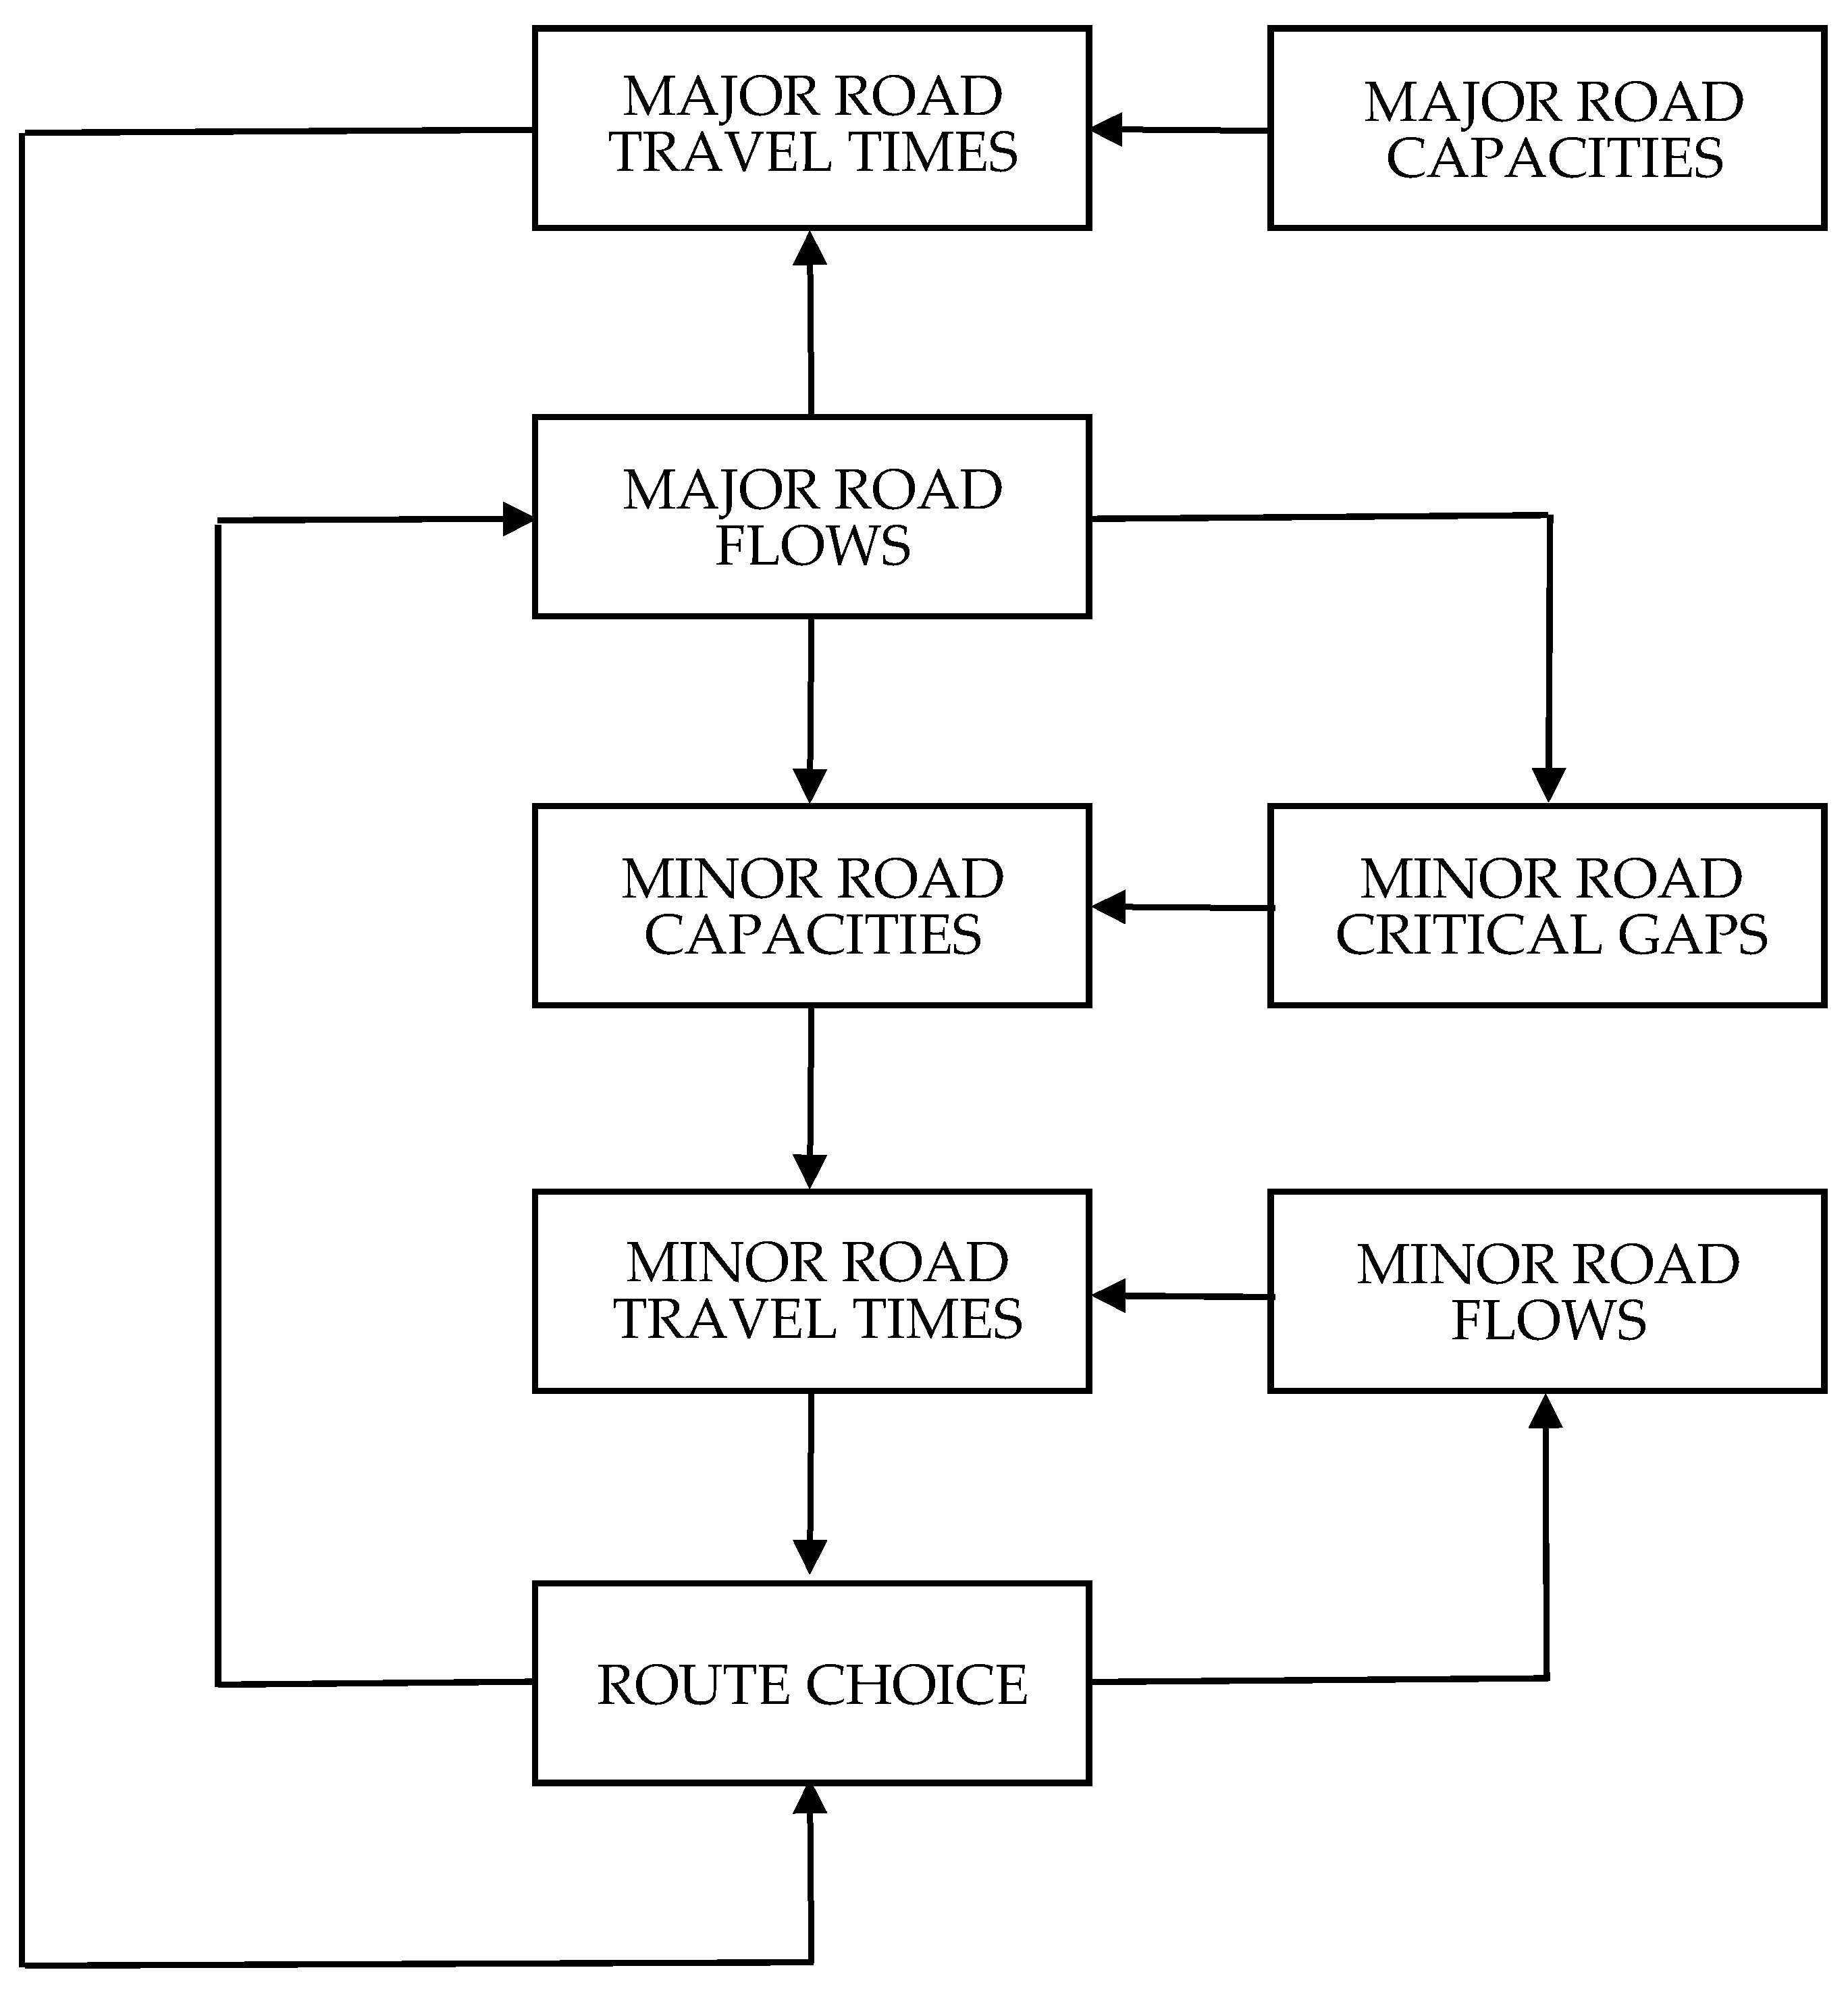
The conceptual structure of the proposed model is illustrated in
Figure 1. At the heart of the formulation are minor road capacities, which are treated as endogenous and thus provide the essential connection between route choice and gap acceptance behavior. In particular, in the proposed approach, minor road drivers’ critical gaps are explicitly modeled as a function of major road flows. This results in the twofold dependence of minor road capacities on major road flows shown in the diagram, which can be explained as follows.
First, major road flow has a direct impact on minor road capacity because, as the former increases, the average size of gaps in the priority stream decreases. This, in turn, reduces the number of acceptable gaps for drivers in the non-priority stream, ultimately reducing minor road capacity (of course, the reverse happens if major road flow decreases).
Second, as major road flow increases, so does the delay incurred by minor road drivers. As suggested by several previous studies (see the review in
Section 1), longer waiting times increase minor road drivers’ propensity to accept shorter gaps as a result of impatience, thus increasing minor road capacity (as before, the reverse happens if major road flow decreases). In addition, the decline of average speed of the priority traffic stream caused by an increase in its flow may determine a reduction in the severity of potential collisions, acting as an additional incentive for minor road drivers to accept shorter gaps.
Interestingly, the above-described effects work in opposite directions, a circumstance emerging also in the analytical investigation presented in
Section 3.2.
Note that the assumption of a deterministic functional relationship between critical gap and major road flow implies drivers’ homogeneity in terms of gap acceptance behavior. Hence, the proposed model refers to the average critical gap and does not capture the statistical distribution of this parameter across drivers observed in empirical studies.
It should also be noted that follow-up time (as defined in
Section 1) is considered a fixed parameter in this study. Its value is specified throughout the numerical examples presented in
Section 3 and
Section 4. This is a simplifying assumption that could be removed by making follow-up time endogenous, just like the critical gap.
The above-described framework is implemented by embedding the interaction between route choice and gap acceptance behavior in a day-to-day dynamic model of network traffic. The original contribution of this study consists of an in-depth analytical and numerical investigation of the properties of this model by means of a discrete-time nonlinear dynamical system approach.
3. Method
3.1. General Formulation of the Combined Dynamics of Route Choice and Gap Acceptance
We consider a road network with unsignalized intersections operating under priority control, and aim at analyzing the day-to-day evolution of network states as a result of the interplay between route choice and gap acceptance behavior. To this end, we formulate the following discrete-time, deterministic process model:
where:
n represents the generic period (“day”) of the dynamic process;
is the vector of mean perceived link costs at the start of day n;
is the vector of link flows on day n;
is the vector of link capacities on day n;
is the vector representing average link costs actually experienced by users as a function of link flows and capacities;
is the vector function representing the relationship between link flows and mean perceived link costs, based on an assumed probabilistic route choice model;
is the vector function representing the relationship between link capacities and link flows;
() is a parameter quantifying the contribution of the cost actually incurred on day n−1 to the formation of the cost perceived by travelers at the start of day n;
() is a parameter quantifying the fraction of travelers who are willing to reconsider their previous day’s route choice.
The approaches to unsignalized intersections (and the corresponding links in the network representation) are classified into two types:
priority or
major road segments (those having right of way) and
non-priority or
minor road segments (those required to yield right of way). As a consequence, the entries of vector
Q corresponding to priority links are assumed to be fixed, while those corresponding to non-priority links are assumed to be variable as a function of the interacting major road flow, both directly and through the flow-dependent critical gap (see the conceptual framework outlined in
Section 2). Formally, this means that in Expression (3) the components of
V associated with priority links or with non-intersection links reduce, in fact, to constant values.
Parameter represents the weight assigned by drivers to the travel costs incurred on the preceding day. Hence, it captures the role played by memory and learning in repeated route choice situations. When travelers are “memoryless”, meaning that their next choice is determined only by the most recently experienced cost. On the other hand, parameter represents the fraction of users who reconsider their route choice from one day to the next. It follows that is the fraction of drivers who repeat their previous day’s choice without being affected by the most recently updated travel cost. When all drivers are free from inertia and are willing to review their route choices on a daily basis without any habit effect.
Substituting Equation (1) for
in Equation (2) and expressing the link capacities through Expression (3), model (1)–(3) can be reformulated as the following nonlinear dynamical system:
Fixed points of (4) and (5) are pairs of vectors
, such that
Conditions (6) and (7) imply the following:
and fixed-point link capacities are given by the following:
It should be noted that, in general, more than one fixed point of system (4) and (5) may exist, implying that multiple equilibria of the combined route choice and gap acceptance model are possible.
A well-known result of nonlinear dynamical systems theory states that local stability of a fixed point is ensured if the modulus of all eigenvalues of the Jacobian matrix of system (4) and (5), computed at , is less than 1. In the following subsections, this condition is applied to the case of an elementary network and an explicit expression is obtained based on specific forms of the functions involved.
3.2. Day-to-Day Dynamics of Route Choice and Gap Acceptance in a Two-Link Network
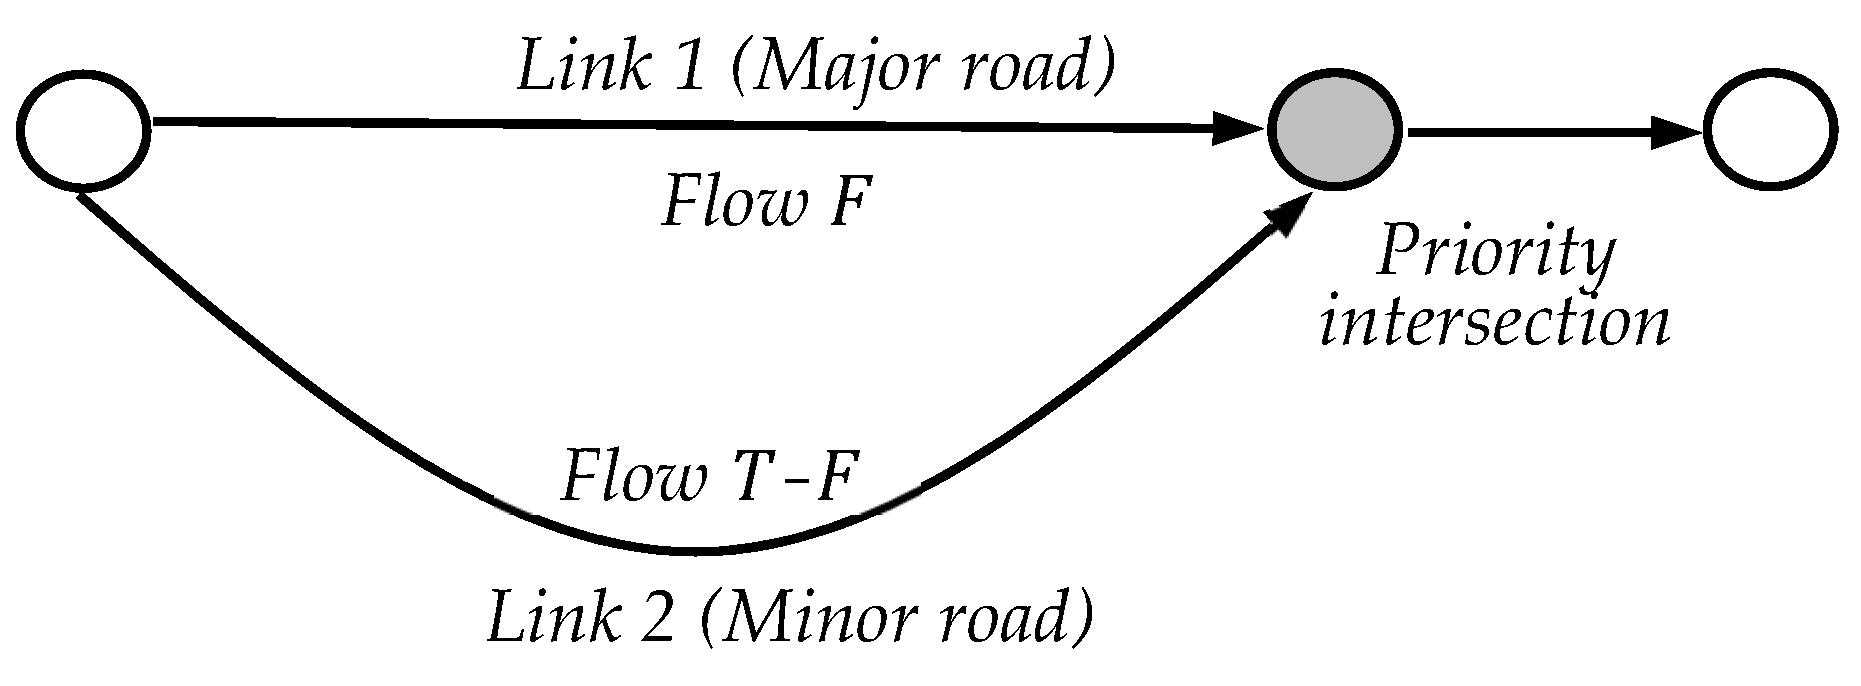
We consider the elementary road network shown in
Figure 2, which consists of two links connecting a single Origin–Destination (O-D) pair and carrying a total travel demand of
T units. The two links merge at an unsignalized intersection operating under priority control, where traffic on the major road (link 1) has the right of way over vehicles approaching the junction from the minor leg (link 2). Due to flow conservation, the traffic pattern in this simple network is uniquely determined by the value of one of the two flows. In what follows, we choose the flow on link 1, denoted by
F, as representative of the network state, so that (
T-
F) is the flow on link 2.
Applying Expressions (1)–(3) to this network and assuming that, for the fraction
of travelers, route choices on day
n depend on the difference between the mean perceived costs of the two links at the start of day
n, we obtain the following scalar formulation:
where
S is the share of total travel demand assigned to link 1. Note that, as stated in
Section 3.1, the capacity of link 1 is assumed to be fixed, and hence does not appear as a variable in function
. Consistent with the discussion in
Section 2, the twofold dependence of link 2’s capacity on link 1’s flow is explicitly indicated in Expression (12), where
represents the average critical gap of minor road drivers as a function of major road flow.
If we define
and
, and subtract (12) from (11), Expressions (11)–(13) can be rewritten as follows:
Finally, substitution of (14) for
into (15) yields the following two-dimensional nonlinear dynamical system:
whose fixed points are pairs
, such that
It then follows from (18) and (19) that fixed points of system (16) and (17) can be found by solving the following:
As already noted in
Section 3.1, we stress that, in general, more than one solution to (20) and (21) may exist, corresponding to the possibility of multiple equilibria of the combined route choice and gap acceptance model.
Next, conditions for fixed point local stability can be worked out writing the Jacobian matrix of system (16) and (17):
and computing each of its entries as follows:
having defined the following:
While is clearly negative, given the assumed dependence of the habit-free fraction of route choices on , it is not possible to determine the sign of in general. This claim is supported by the following analysis, which provides a separate evaluation of the effects of the various factors that contribute to shaping the cost-flow relationship for traffic on the minor road.
Recalling that
, we can write the following:
where
While the first term on the right-hand side of (28) represents the effect of the major road flow on its cost, and thus has a positive sign, the meaning and expected sign of each of the derivatives related to link 2 are as follows:
- (1)
represents the effect of the minor road flow on its cost, and has an expected positive sign;
- (2)
represents the effect of the minor road capacity on its cost, and has an expected negative sign;
- (3)
represents the direct effect of the major road flow on the capacity of the minor road, and has an expected negative sign;
- (4)
represents the effect of the critical gap of minor road drivers on the capacity of the minor road, and has an expected negative sign;
- (5)
represents the effect of the major road flow on the critical gap of minor road drivers, and, in light of the discussion in
Section 2, has an expected negative sign.
Hence, the product of the derivatives in (4) and (5) represents the indirect effect of the major road flow on the capacity of the minor road, and has an expected positive sign. This accounts for the fact that the major road flow affects the minor road capacity not only directly, but also through variations of the drivers’ critical gap. Based on the above analysis, we can conclude that, in general, the sign of cannot be established a priori.
As stated in
Section 3.1, a fixed point is locally stable if the modulus of all eigenvalues of matrix
J, computed at the fixed point, is less than 1. For two-dimensional systems this requirement is equivalent to the so-called Jury conditions:
where
δ is the determinant and
τ is the trace of
J evaluated at the fixed point. Using the previously derived Expressions (23)–(26) for the entries of
J we obtain the following:
so that conditions (31)–(33) become the following:
where the derivatives appearing in (37) and (38) are meant to be computed at the fixed point under examination.
Since (36) always holds because
and
, we can conclude that a fixed point of system (16) and (17) is locally stable if
Using (28) and (30), Expression (39) can be further rewritten as follows:
Note that an explicit expression for
can be obtained upon specification of the analytical form of the route choice model, as shown in the example presented in
Section 3.3.
Three special cases of (40) can be obtained by setting
and/or
equal to one. In particular, for a population of habit-free and memoryless drivers
(40) reduces to the following:
corresponding to a stability region which is symmetrical around zero.
Expressions (39) and (40) suggest that fixed point stability depends on the sensitivity of route choices to travel costs and on the sensitivity of travel costs to flows. For links representing minor intersection approaches, the latter also takes into account the twofold dependence of capacities on major road flows discussed in
Section 2.
Moreover, according to (39) and (40), the width of the stability region increases as a result of a decrease in and/or . From a behavioral standpoint, this means that the range of conditions ensuring equilibrium stability tends to expand when drivers are less inclined to reconsider their route choices on a daily basis and/or when they rely more heavily on travel costs experienced in the distant past.
The analysis reported in the next section shows how a specific form of the fixed point stability condition can be derived if all the relevant functions are explicitly defined.
3.3. Fixed Point Stability in a Simple Model of Route Choice and Gap Acceptance Dynamics
In order to establish a setting for preliminary numerical tests of the proposed dynamical system’s behavior, we introduce at this point specific forms of the functions
,
,
S,
Q and
G, and derive the resulting explicit form of the fixed point local stability condition (39). Simple expressions allowing analytical tractability are adopted here; a further implementation of the model using realistic functions is presented in
Section 4.
The following forms are assumed for the travel cost functions of the two links:
where
are positive parameters, and the remaining symbols have the previously defined meaning.
A Logit model with parameter
is adopted to determine link 1’s share of travel demand as a function of the difference between mean perceived costs:
The capacity of the link representing the minor road is expressed as a function of the major road flow as follows:
where
h is the average follow-up time,
p is a positive parameter and
is the mean critical gap of minor road drivers.
The latter is assumed to be a linearly decreasing function of the major road flow:
where
and
represent the maximum and minimum values of
G. As intuitively expected, the largest and the smallest value of mean critical gap are obtained for
and
, respectively, and the corresponding minor road capacities are as follows:
Note that Expressions (42), (43), (45) and (46) are defined for
.
Substituting Expression (46) into (45) and then (45) into (43), we obtain the following:
so that the nonlinear dynamical system (16) and (17) becomes as follows:
Fixed points of system (50) and (51) in terms of link flows can be found by solving the following:
Next, we consider the expressions of the two derivatives appearing in (39), evaluated at a fixed point. Computation of the first one yields the following:
where the last equality follows from (27) and (20). Recalling the definition of
and using (42), (43), (45) and (46), Expression (53) can be rewritten as follows:
The other derivative shown in (39) has the following expression:
Finally, the product of (54) and (55) can be used to analyze the local stability of any specific fixed point of system (50) and (51) based on the following condition:
In order to illustrate some typical behaviors of system (50) and (51), a few numerical examples of long-term evolution of the route choice and gap acceptance dynamics are presented in the remainder of this section. Total travel demand
T and flow
F are expressed in vehicles/s. Since the purpose of these examples is to provide a preliminary assessment of the qualitative behavior of the dynamic process, only the temporal trajectory of the system state under different parameter combinations is considered. The analysis of network performance and gap acceptance descriptors is then the focus of the model implementation presented in
Section 4.
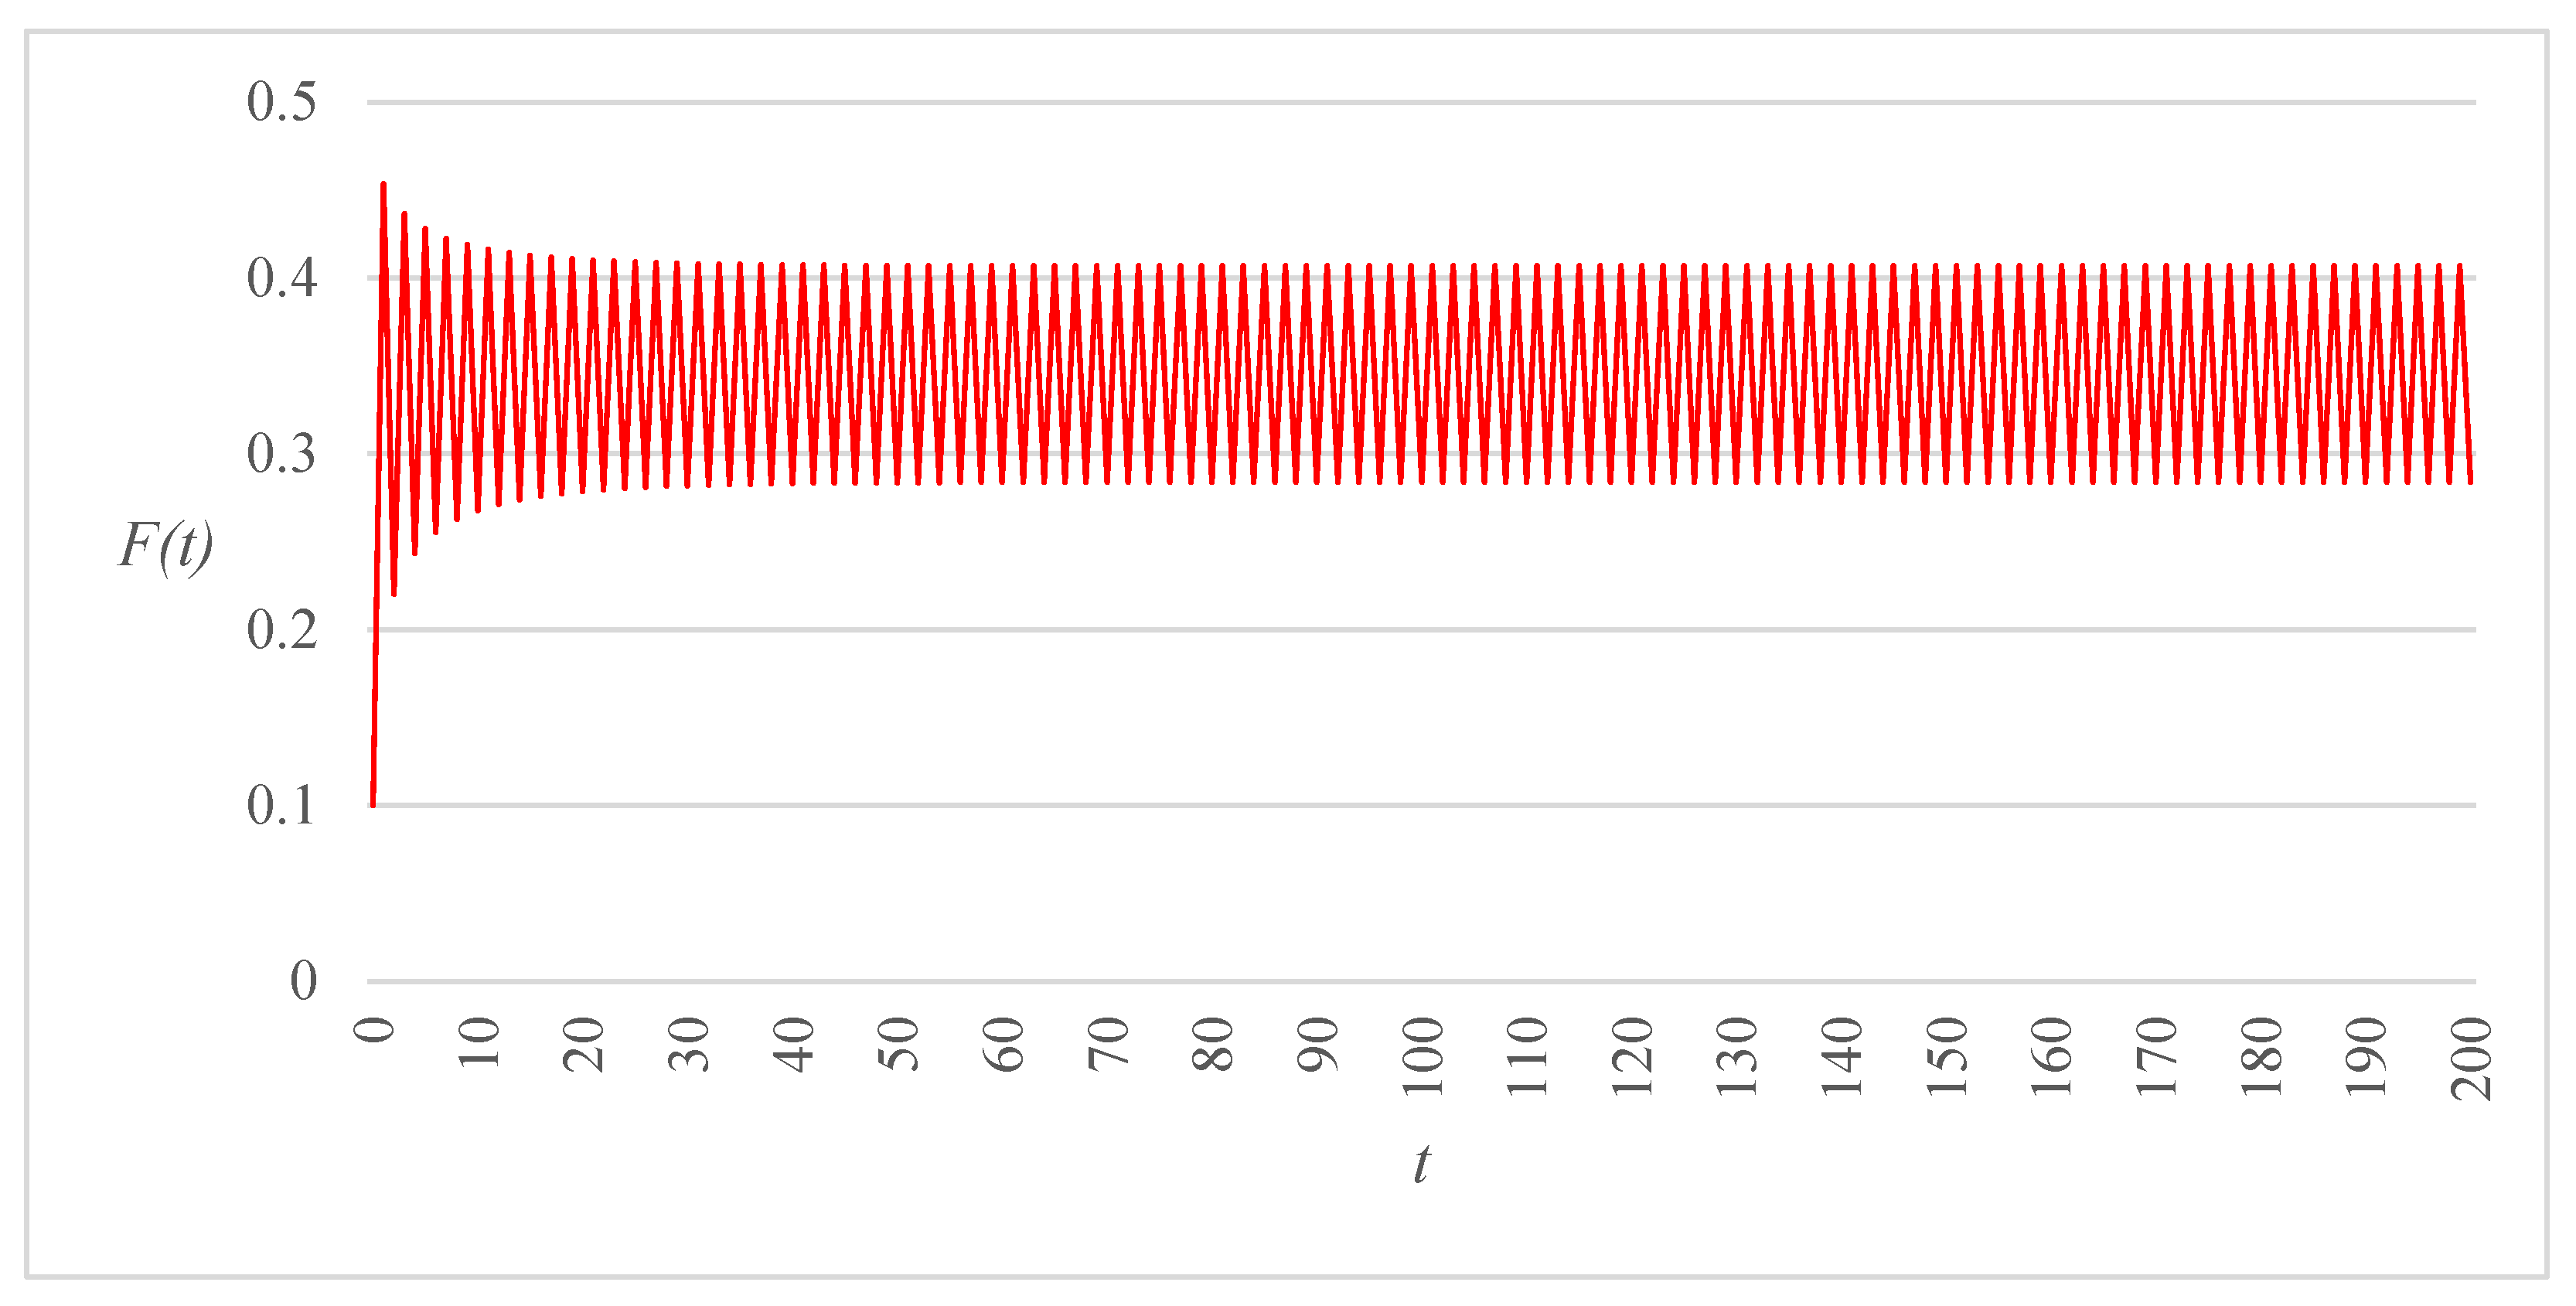
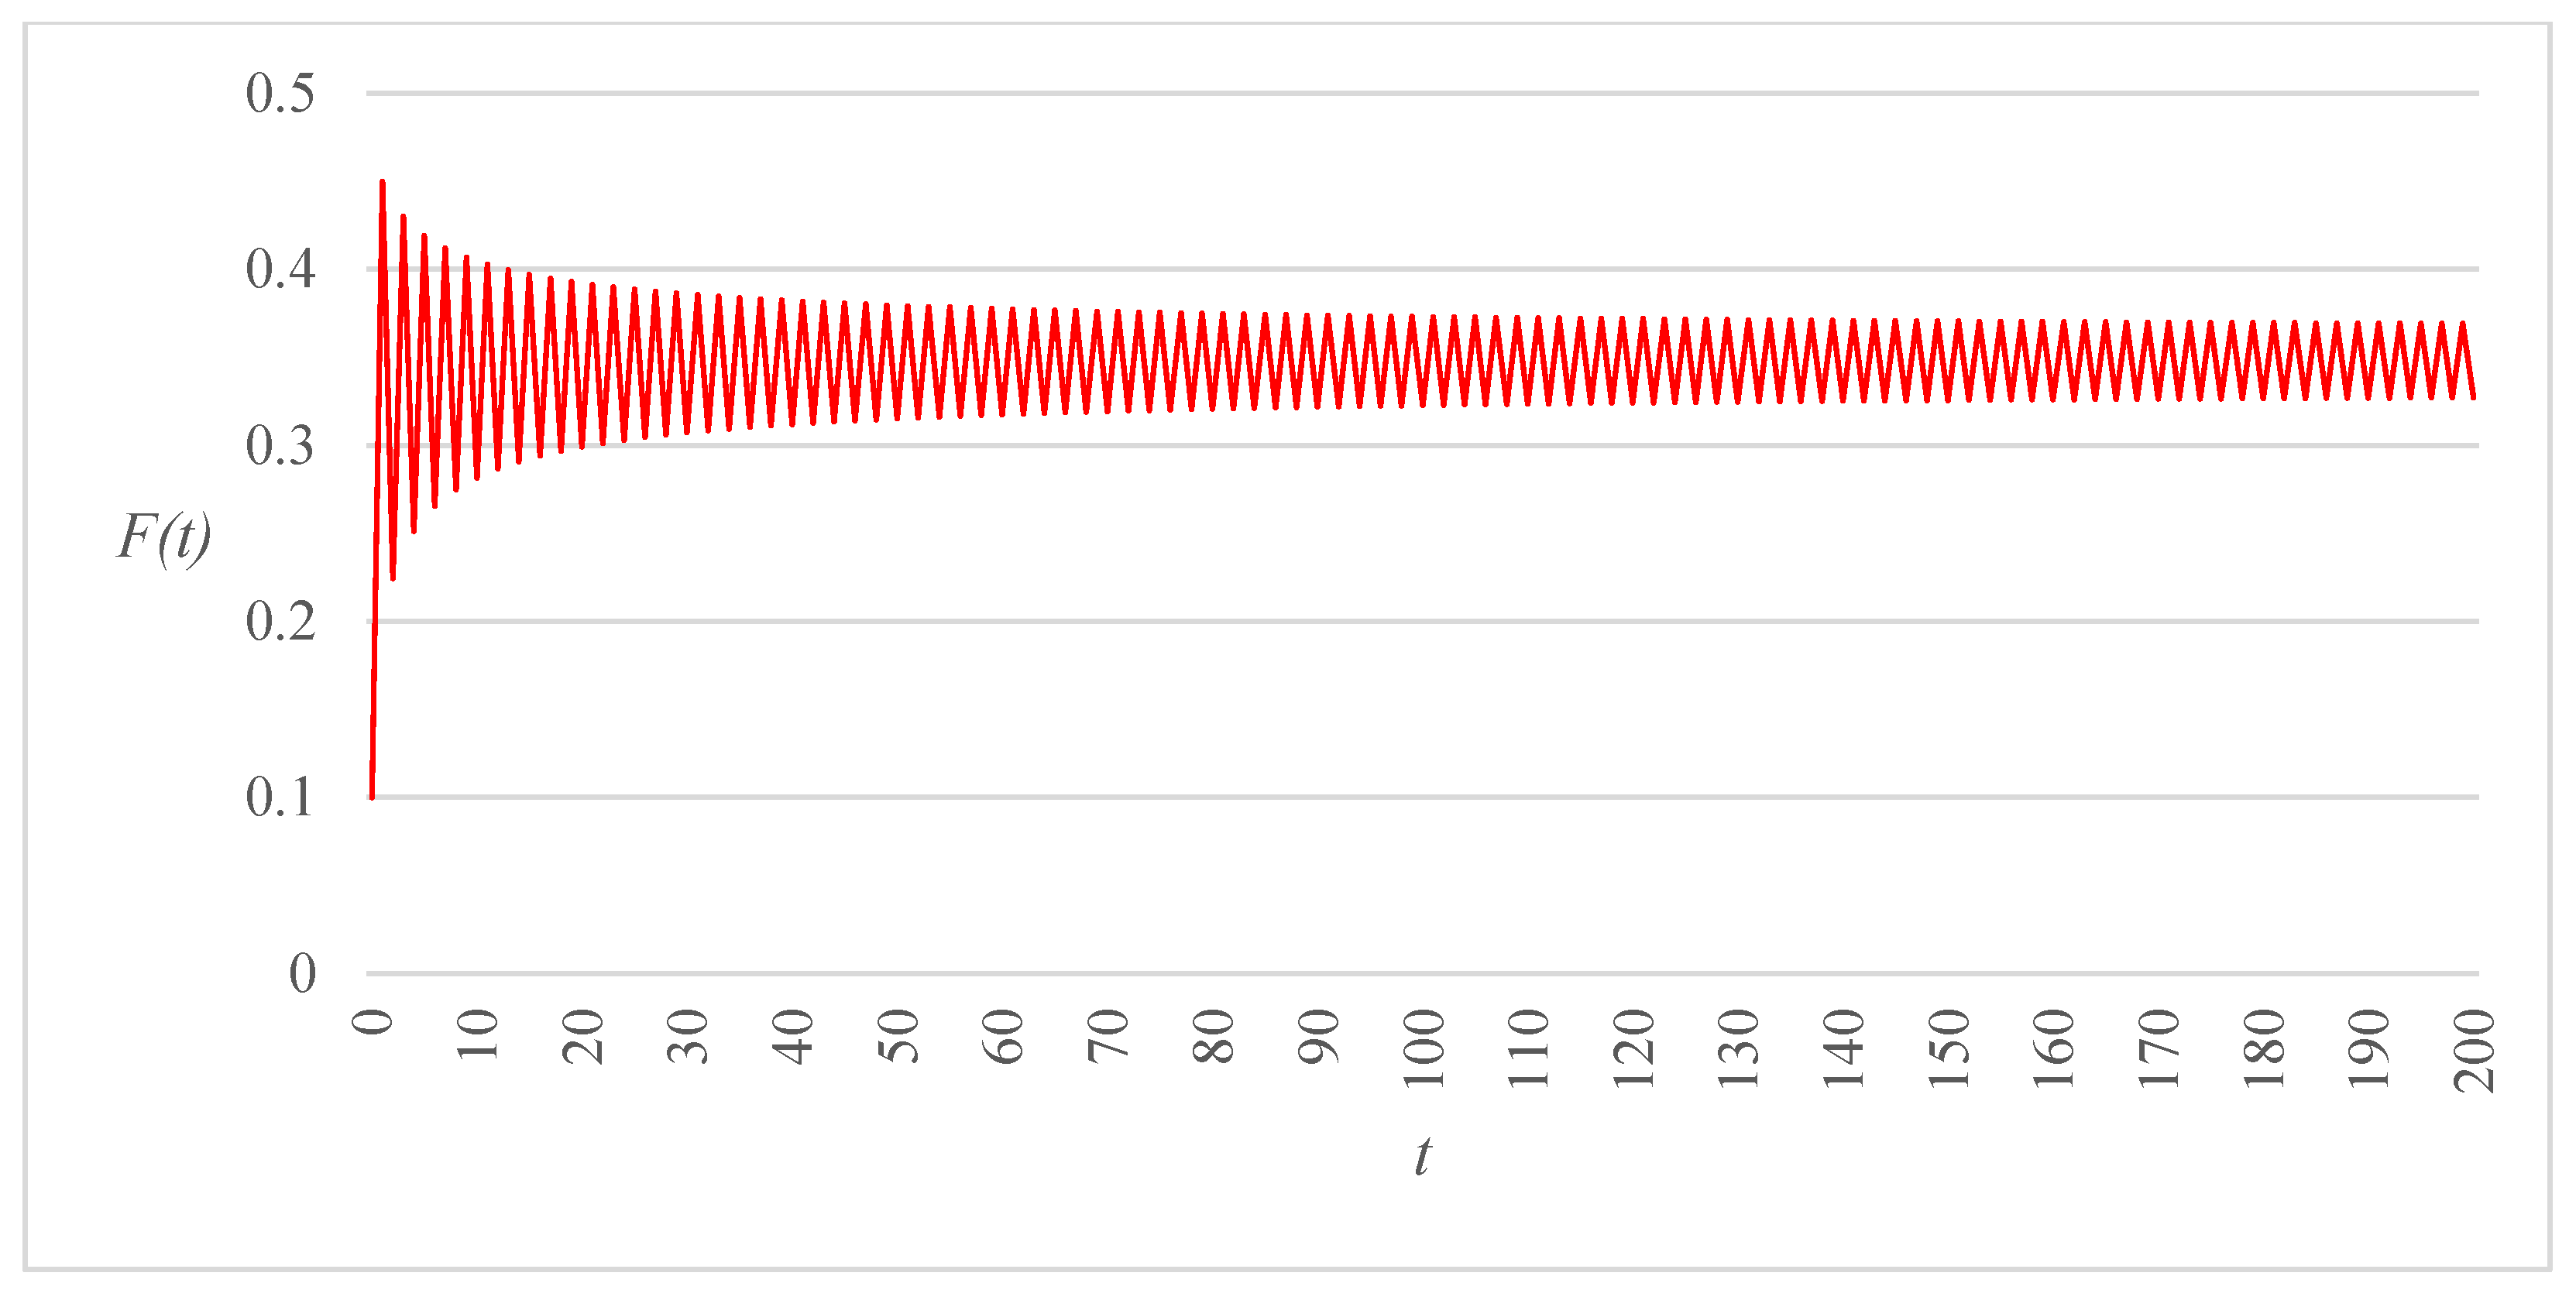
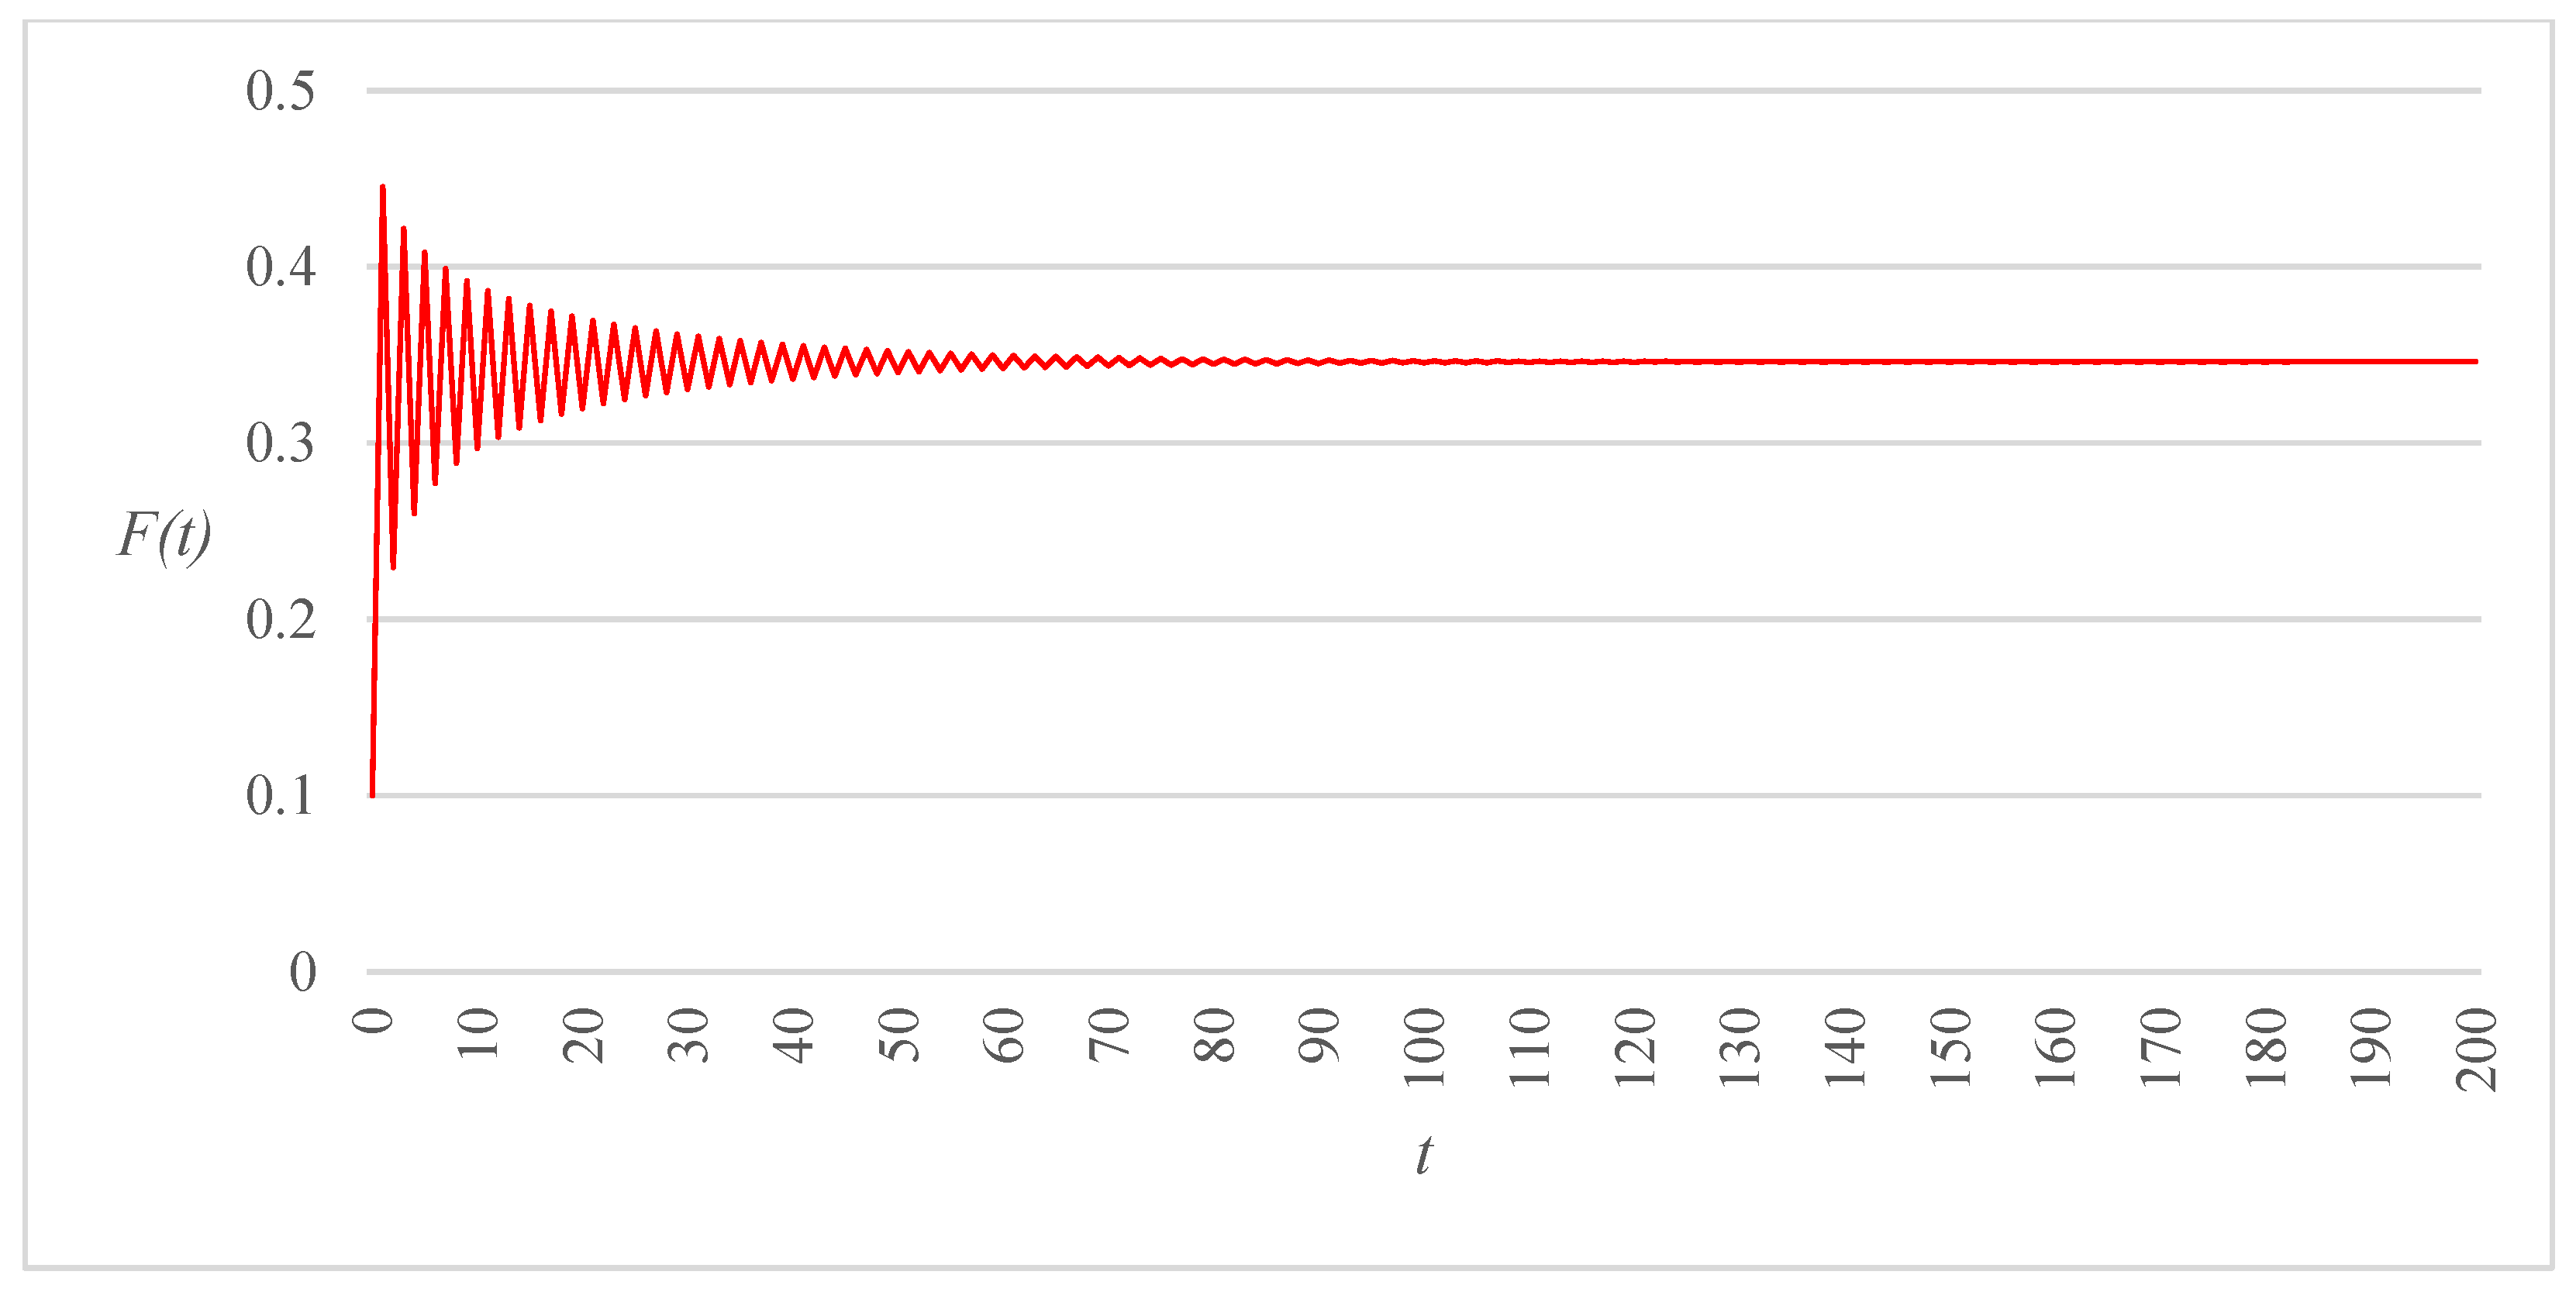
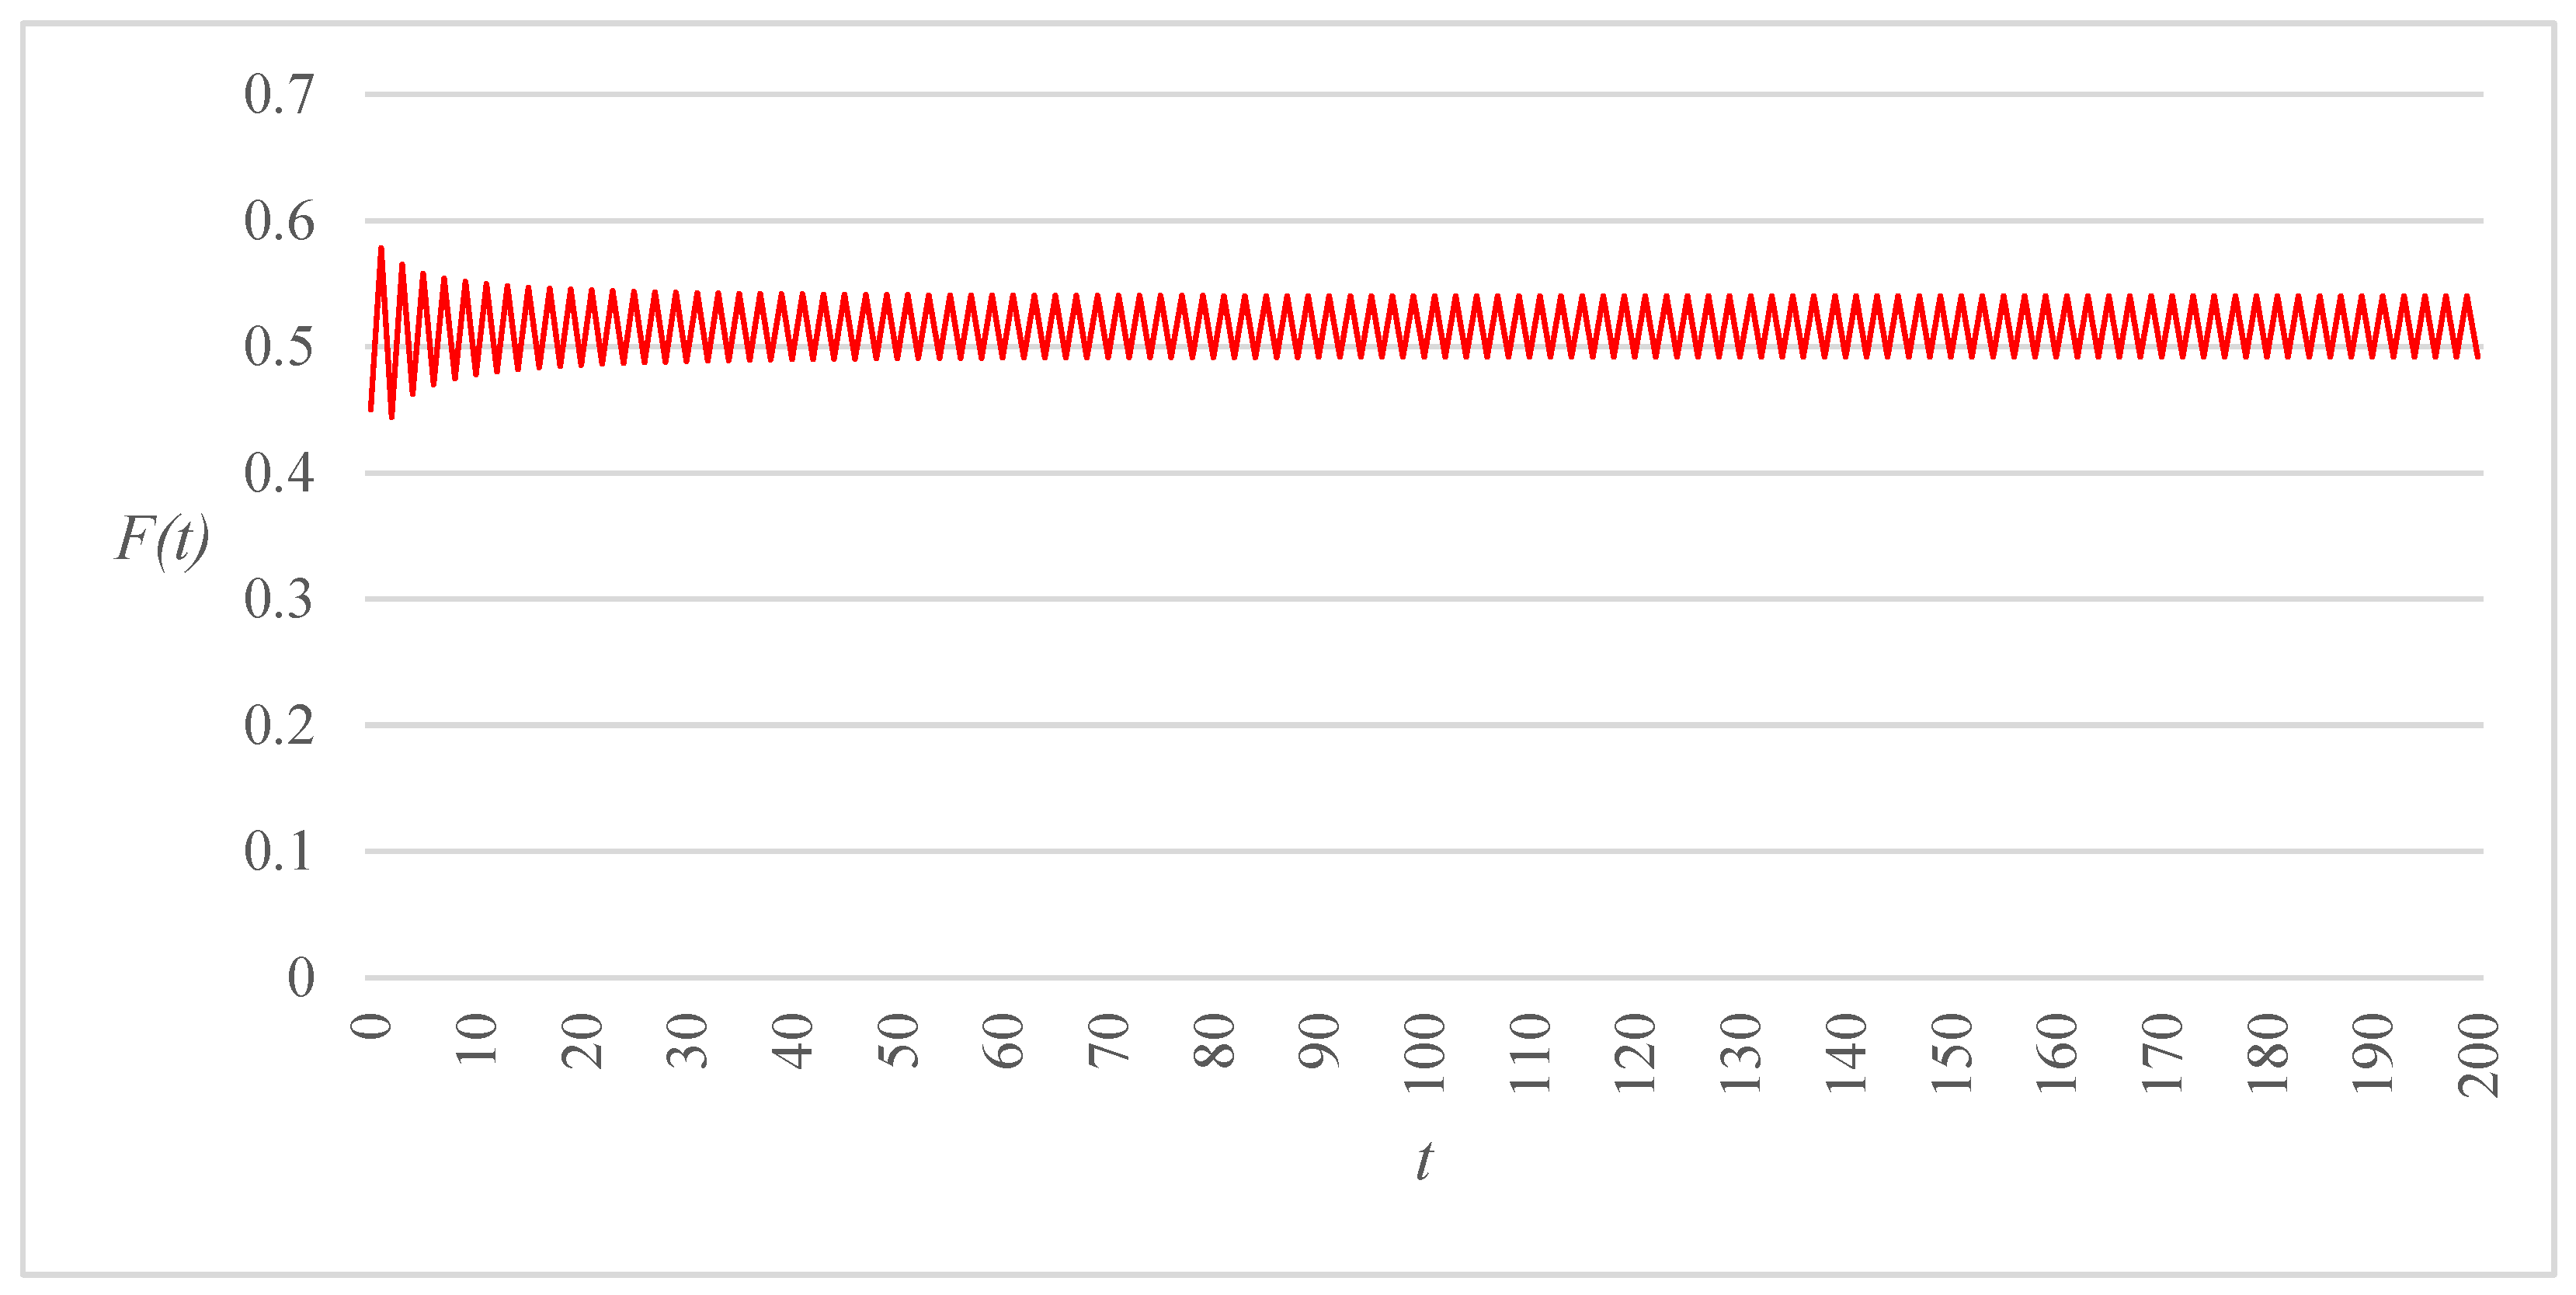
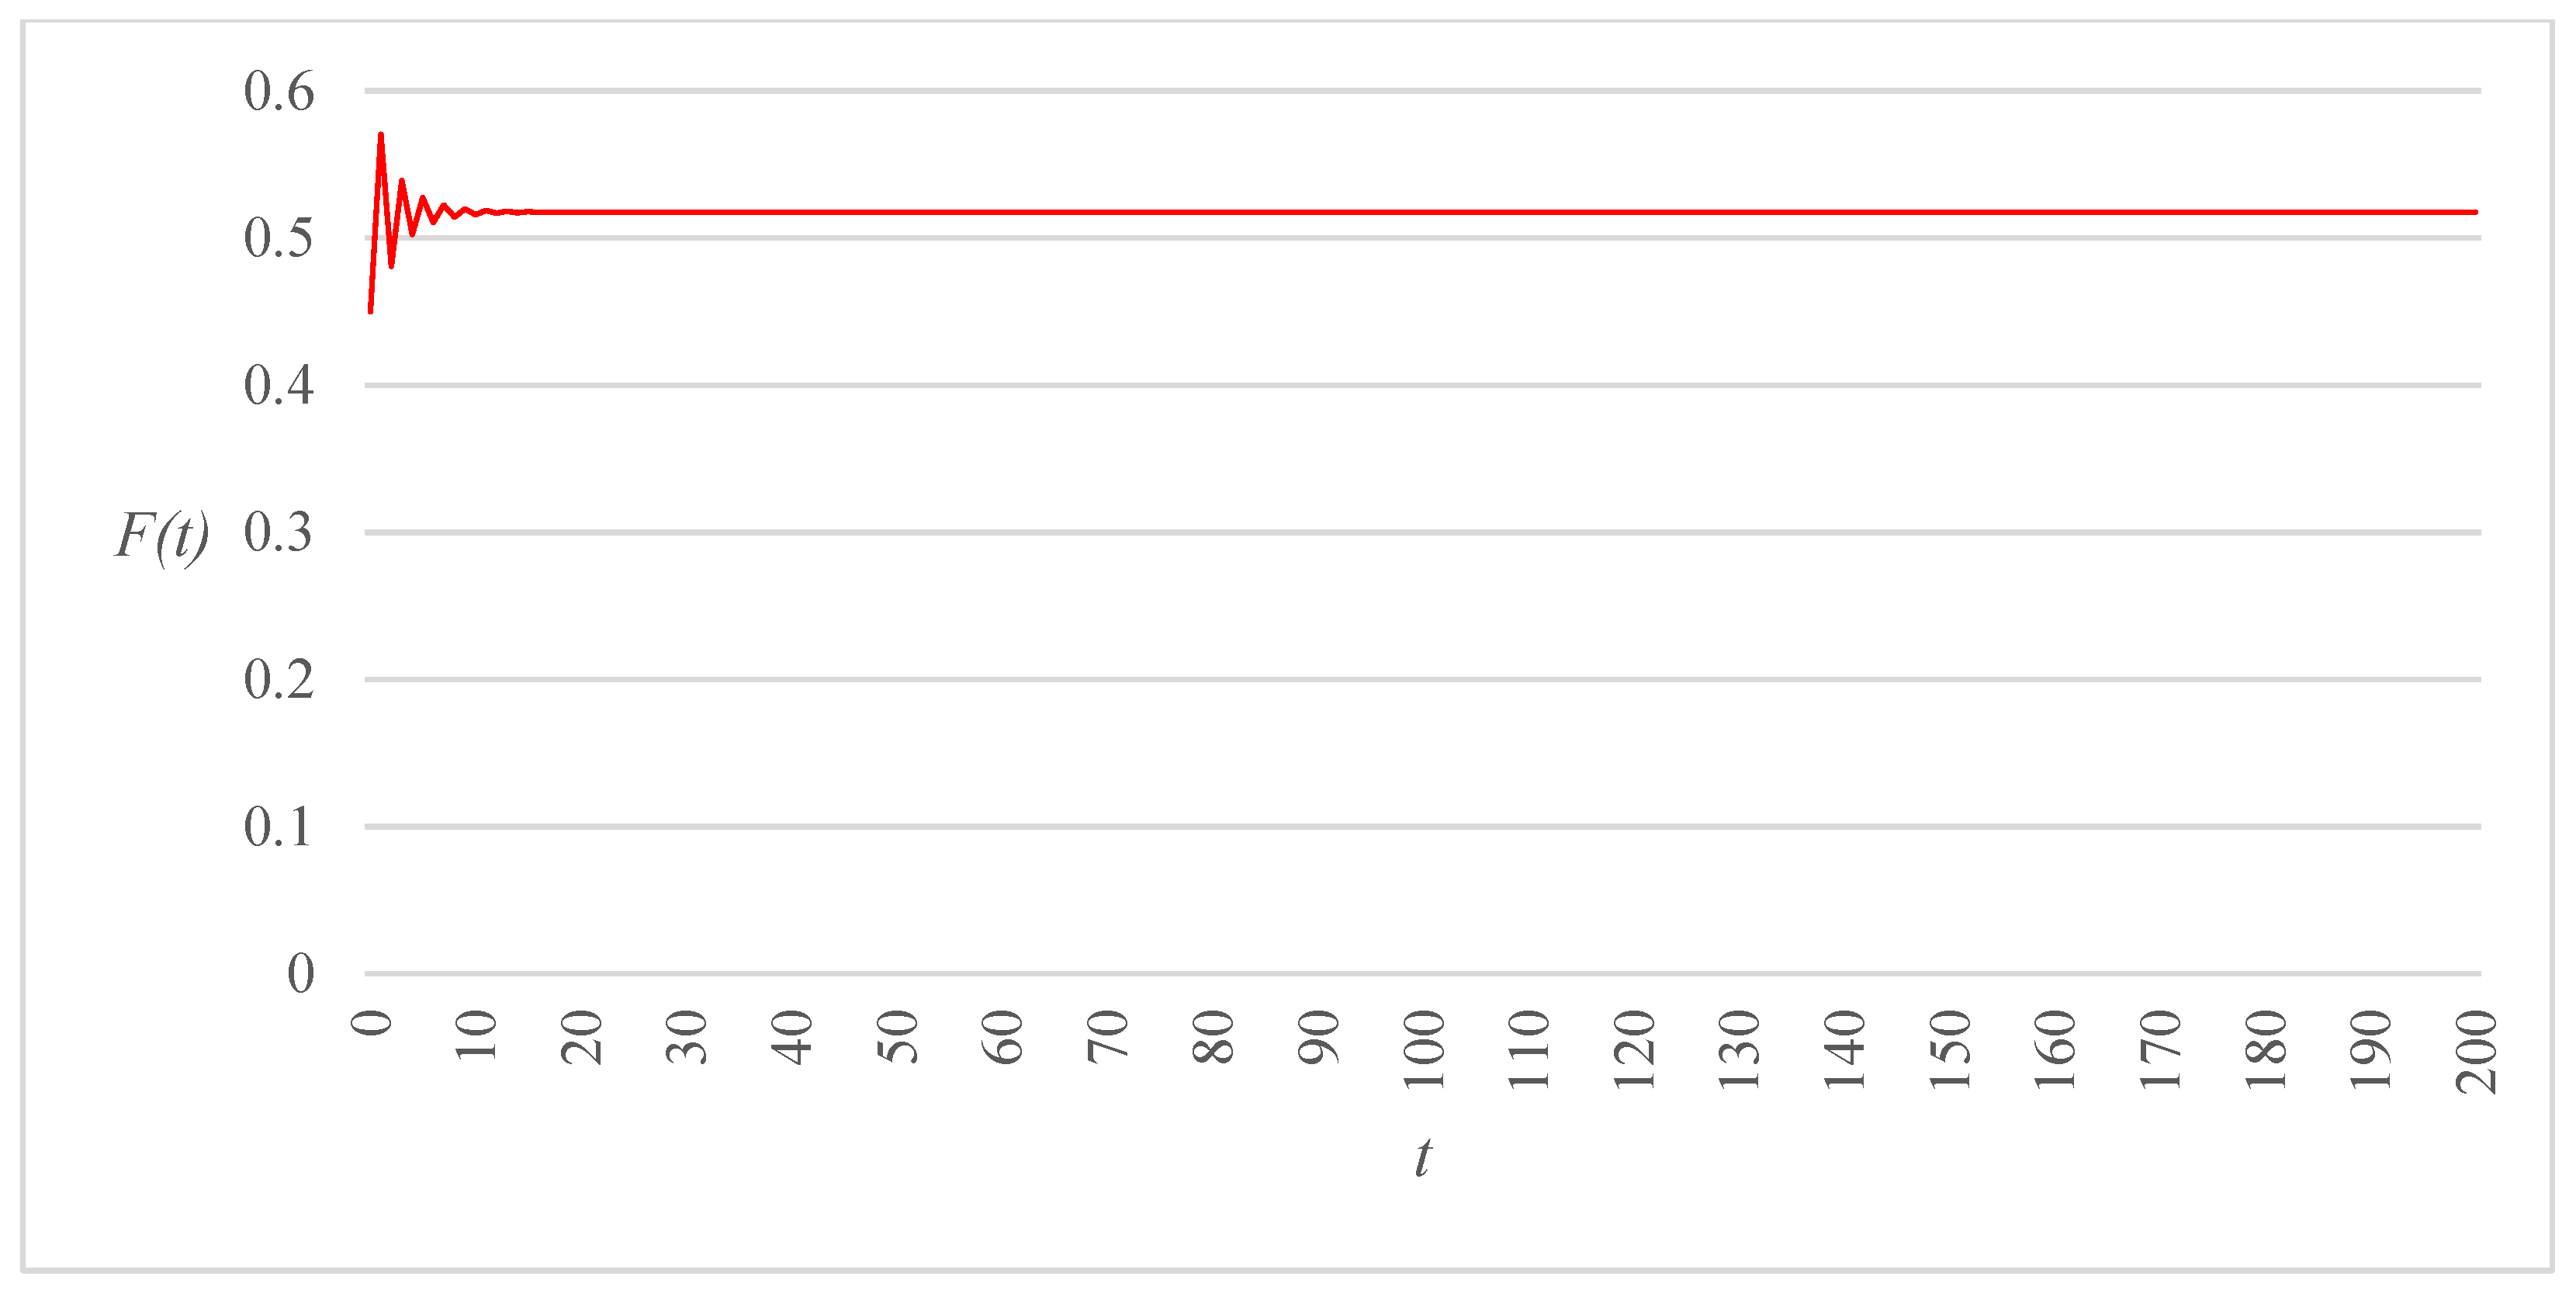
Figure 3,
Figure 4 and
Figure 5 display the time evolution of the system state in the case of habit-free and memoryless drivers
for different values of (
), all other parameters being kept at the same values. Comparison of the three trajectories reveals that decreasing the range of allowable critical gap values may have a significant effect on the long-term behavior of the route choice and gap acceptance dynamics. More specifically, in the first two cases (
Figure 3 and
Figure 4), the system state is attracted to a period-2 cycle, but the amplitude of the oscillations shrinks as a consequence of a reduction of (
). A further decrease in the size of this interval causes the dynamical system to converge to a fixed point following a sequence of damped oscillations (
Figure 5).
The stabilizing effect of route choice inertia and drivers’ memory of past travel costs is illustrated by the examples shown in
Figure 6 and
Figure 7. In the first
, the system state is attracted to a period-2 cycle; in the second, a fast convergence to an equilibrium is observed as a result of only a small reduction of the two parameters
, all other conditions being equal in the two cases.
4. Route Choice–Gap Acceptance Dynamics in a Grid Network with Realistic Functions
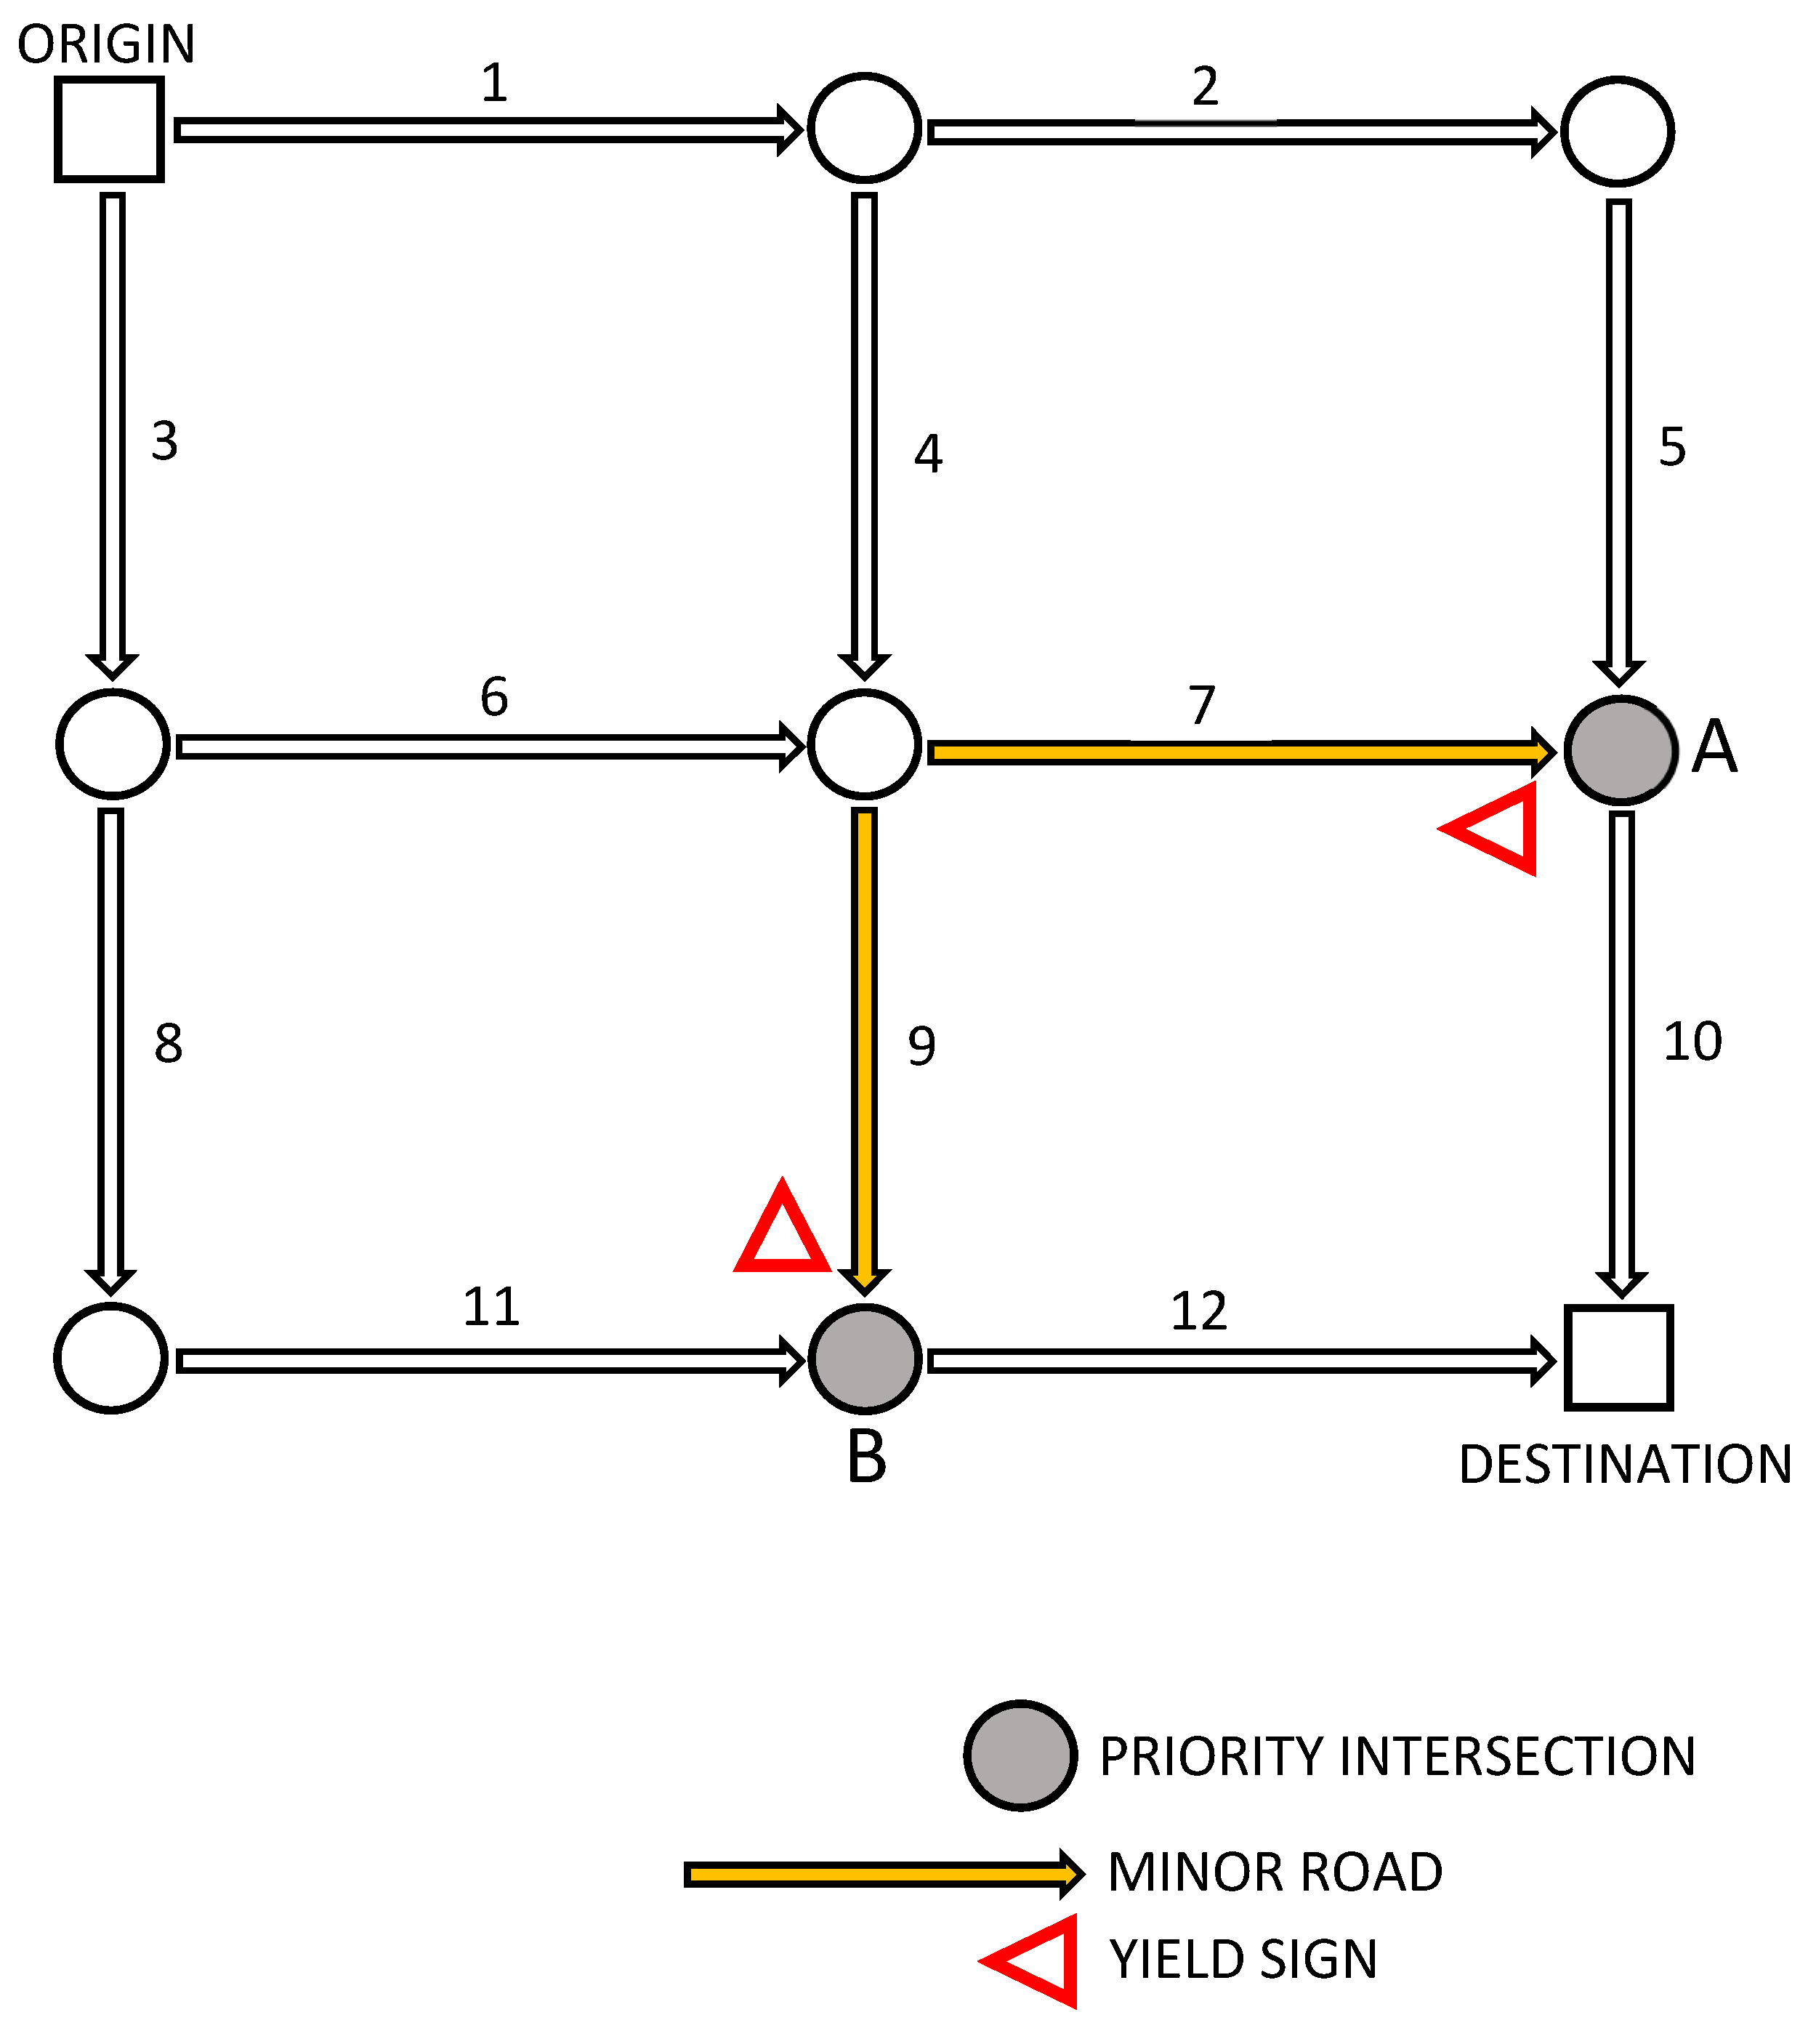
In this section, the proposed day-to-day dynamic process model of route choice and gap acceptance is implemented on the network shown in
Figure 8 in order to investigate numerically its behavior. Realistic functions used in the analysis of unsignalized intersections and in traffic assignment models are employed in lieu of the simpler expressions that were adopted in
Section 3.3 for the sake of analytical tractability.
The network consists of twelve links and nine nodes, two of which (labeled A and B) represent priority intersections. Links 7 and 9 correspond to the minor road approaches that must yield right of way to the major road links 5 and 11, respectively. Each of the six routes connecting the origin to the destination passes through one of the two priority intersections, from either the major or the minor approach side.
Table 1 displays free-flow travel times and capacities of the twelve network links. Note that the capacities of links 7 and 9 are determined endogenously, as they depend on the respective conflicting major road flows both directly and through the flow-dependent critical gaps.
The function expressing the relationship between the average critical gap of minor road drivers and the conflicting major road flow is assumed to have the following form [
21]:
where
λ is a positive parameter whose value determines the sensitivity of the critical gap to major road flow. Note that (57) realistically recognizes that the reduction of the critical gap takes place only when the major road flow exceeds a predetermined threshold
.
The capacity of the minor road approaches to the two priority intersections is determined according to the well-known Siegloch’s formula [
38]:
where
h is the average follow-up time of minor road drivers (measured in seconds).
Travel time on the minor roads approaching priority intersections is modeled by adding to its free-flow value an average delay term (
). The latter is computed through the following function, which allows flow-to-capacity ratios to exceed unity as a result of temporarily oversaturated conditions [
1]:
where
D represents the length of the analysis period (in hours) and
is the link’s flow-to-capacity ratio. Note that delays computed through formula (59) are expressed in seconds.
Travel times of all remaining links are computed by means of the following BPR-type function:
where
represents free-flow travel time and
is the link’s flow-to-capacity ratio.
Akin to the analysis described in
Section 3.3, route choice is described by a Logit model with parameter
.
Using the above-specified functional forms, the proposed day-to-day dynamic process model was implemented on the test network in order to assess numerically the effect of the characteristics of gap acceptance behavior upon the long-term state of the system. More specifically, the following relationships were investigated:
- ▪
Equilibrium values of critical gaps on links 7 and 9 as a function of for fixed ;
- ▪
Average network travel time at equilibrium as a function of for fixed ;
- ▪
Equilibrium values of critical gaps on links 7 and 9 as a function of λ for fixed and ;
- ▪
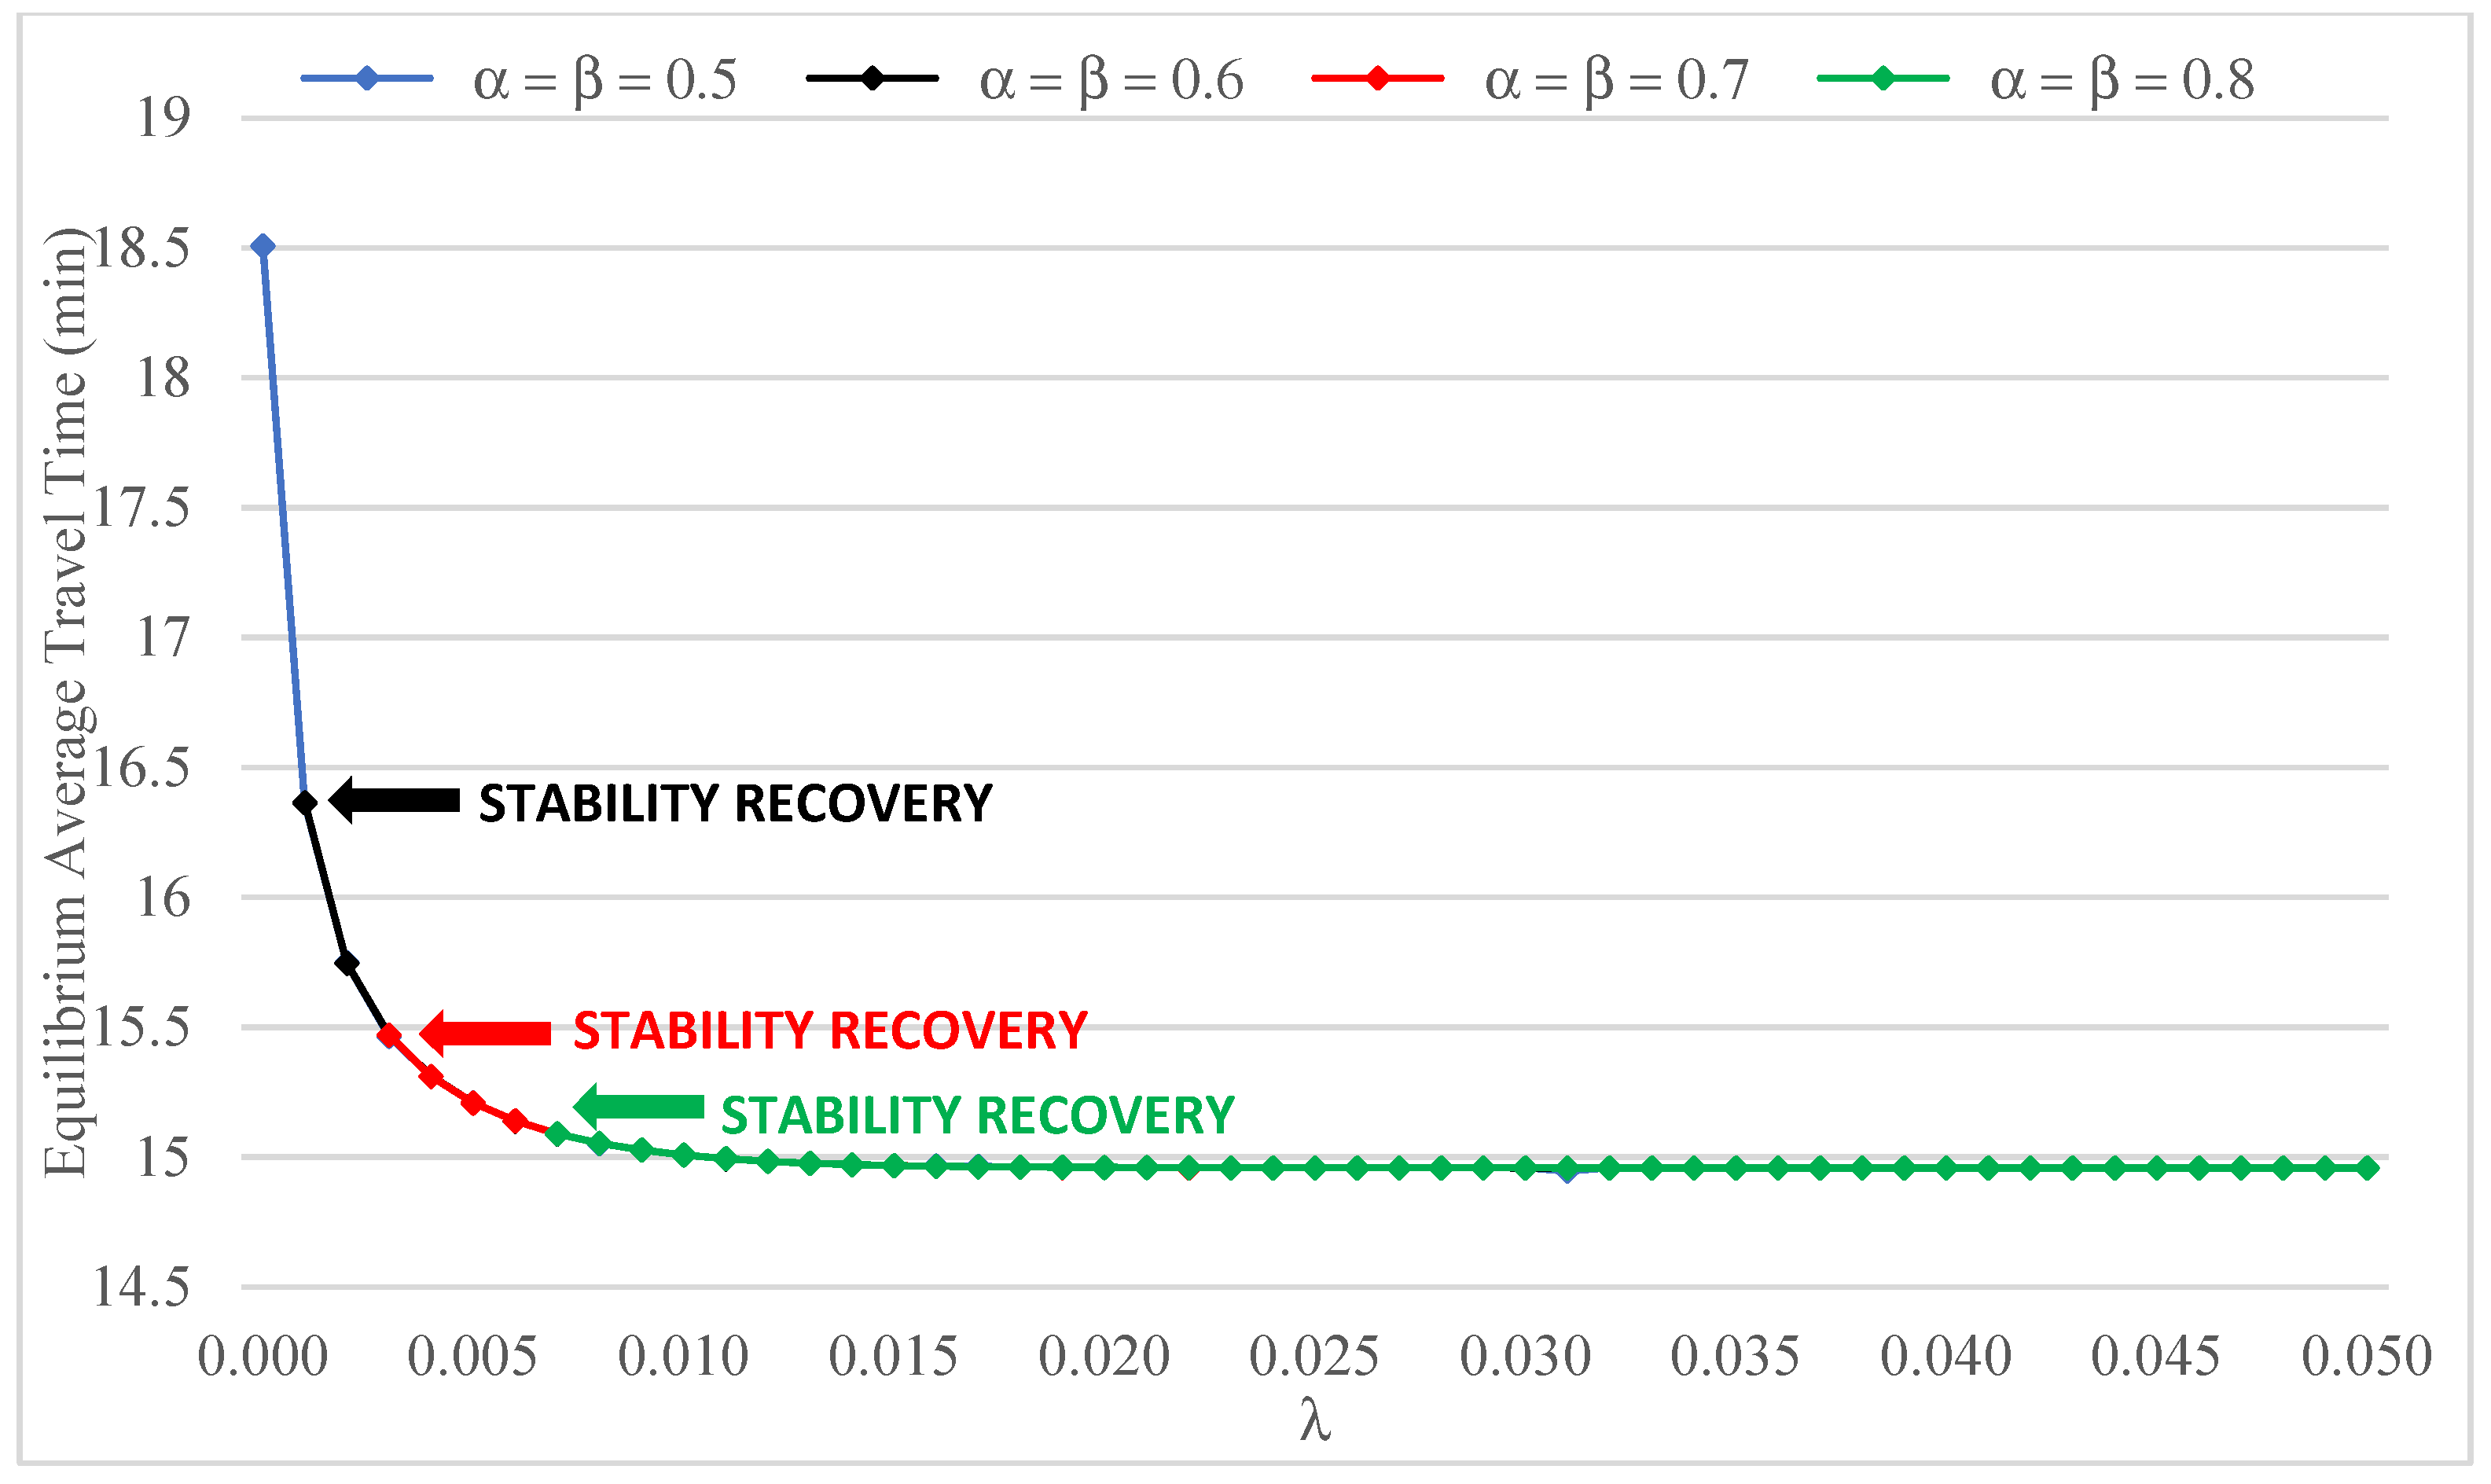
Average network travel time at equilibrium as a function of λ for fixed and .
It should be noted that the above analyses refer to test cases in which the dynamical system converged to a fixed point. The possible occurrence of system instabilities (in the form of long-term evolution toward periodic or aperiodic attractors) was explored as well, and is noted where applicable in the comments to the results. Also note that, due to the symmetry of the network data, equilibrium critical gaps were the same for the two minor approaches (links 7 and 9) whenever convergence to a fixed point was attained.
The impact of other factors and conditions on the outcome of the joint dynamics of route choice and gap acceptance behavior is also worthy of investigation. To this end, parametric variations of the accuracy of drivers’ perception of travel times (represented by ), of the level of network congestion (represented by total travel demand), and of drivers’ habit and memory depth in route choice (represented by and ) are included in the analysis.
On the other hand, the following values were kept fixed throughout the numerical tests: , , and .
Since the analysis of the effect of the initial state of the dynamical system was not among the objectives of the study, all test cases were initialized setting link travel times at their free-flow values, and computing the corresponding link flows and critical gaps. The long-term evolution of the system was simulated by running 2000 iterations (time periods) of the dynamic process. Convergence to a fixed point was ascertained when the flow variation between successive iterations was less than 0.1 vehicles/h for all network links. If this condition was not met, the system trajectory over 2000 periods was observed in order to identify other types of attractors by analyzing the recurrence pattern of link flows.
4.1. Effect of the Range of Critical Gap Values
The drivers’ critical gap on links 7 and 9 is allowed to vary within the interval
as a function of the conflicting major road flow. Since the value of
is held fixed in our analysis, the size of the range of critical gaps is determined by
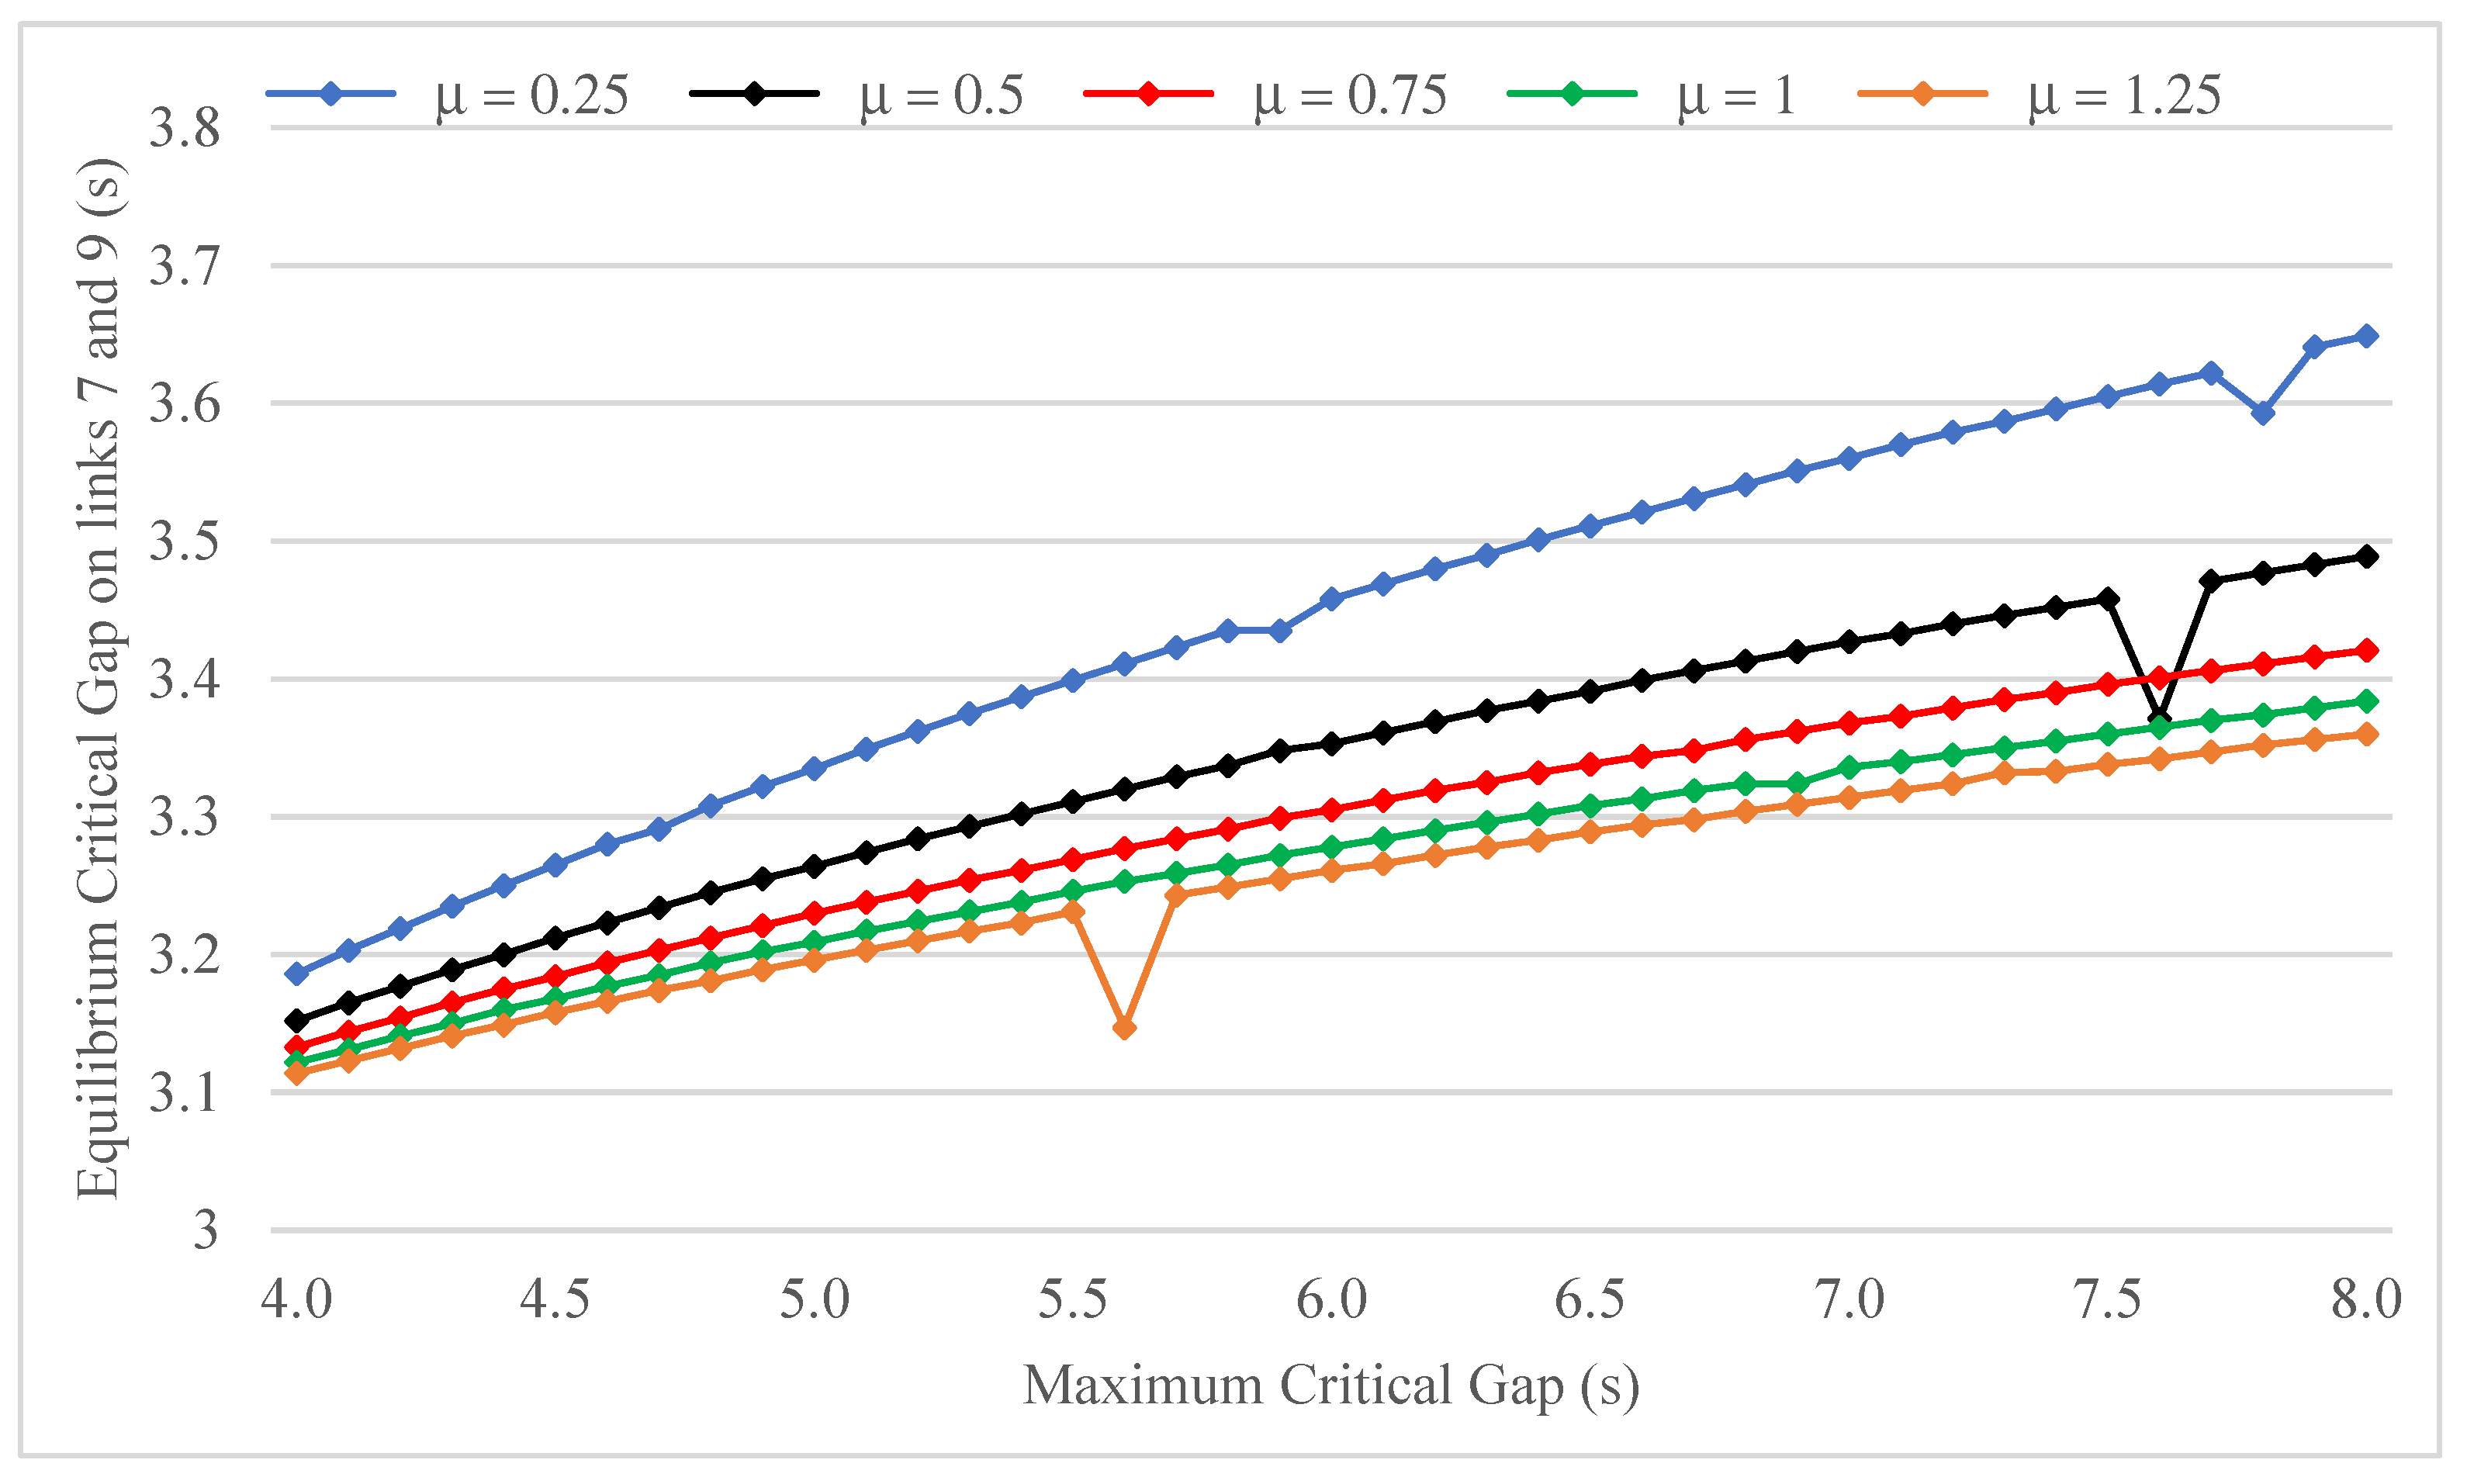
. The effect of the latter on the value of the critical gap at equilibrium is illustrated in
Figure 9 for different values of the Logit parameter
. The graph indicates the existence of a moderately increasing relationship between equilibrium and maximum critical gap for all values of
, with the exception of a few local drops for which no straightforward explanation can be provided. In absolute terms, however, the sensitivity of the equilibrium critical gap to
appears to be limited, with a maximum variation of about 0.5 s. Comparative inspection of the five curves further suggests that higher accuracy of travel times perception (measured by
) tends to increase the risk propensity of minor road drivers for all values of
, and to restrict the range of equilibrium critical gap values.
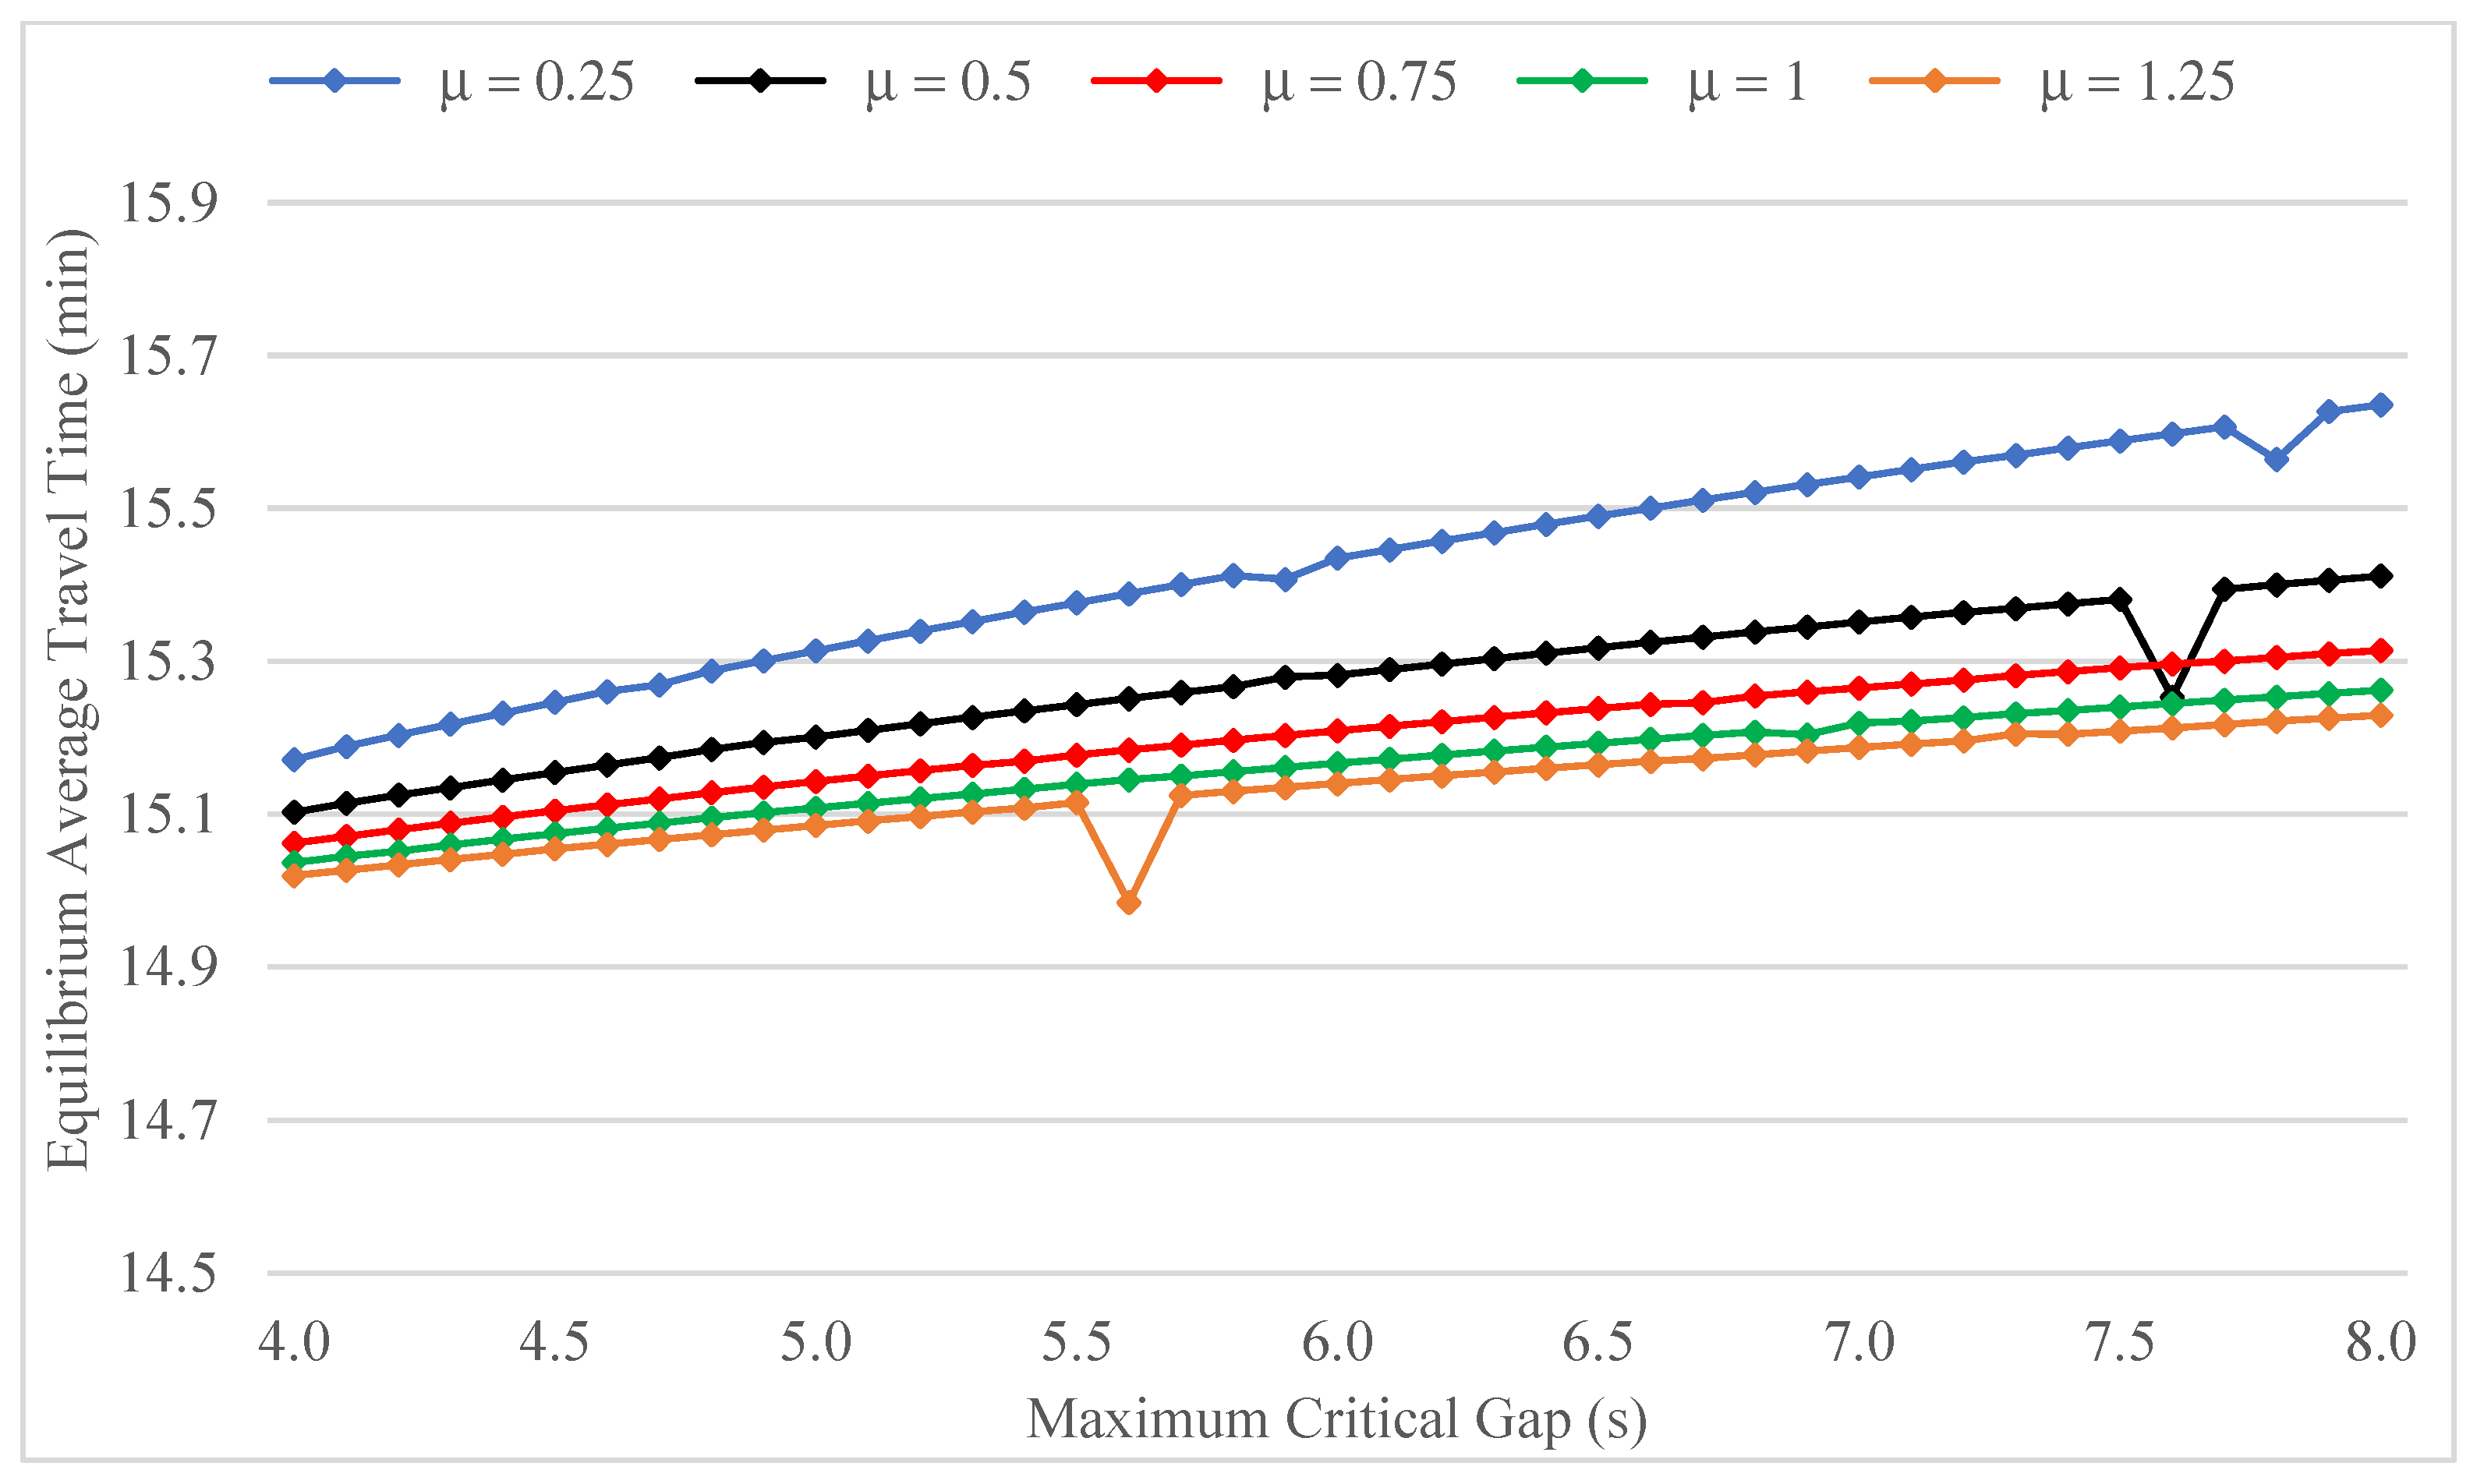
Figure 10 displays the values of average network travel time at equilibrium as a function of maximum critical gap for different Logit parameters. Despite a generally similar shape, the lines in
Figure 10 are seen to exhibit a lower sensitivity to
, as compared to those shown in
Figure 9. This circumstance can be explained by considering that the critical gap contributes to determining minor road capacities and hence minor road delays, which, however, represent only a component of average network travel time. More generally, the relationship between the two descriptors should be considered within the wider framework outlined in
Section 2. This entails taking into account the twofold effect of major road flows on minor road capacities, as well as the ensuing network-level implications in terms of route choice (see the diagram in
Figure 1).
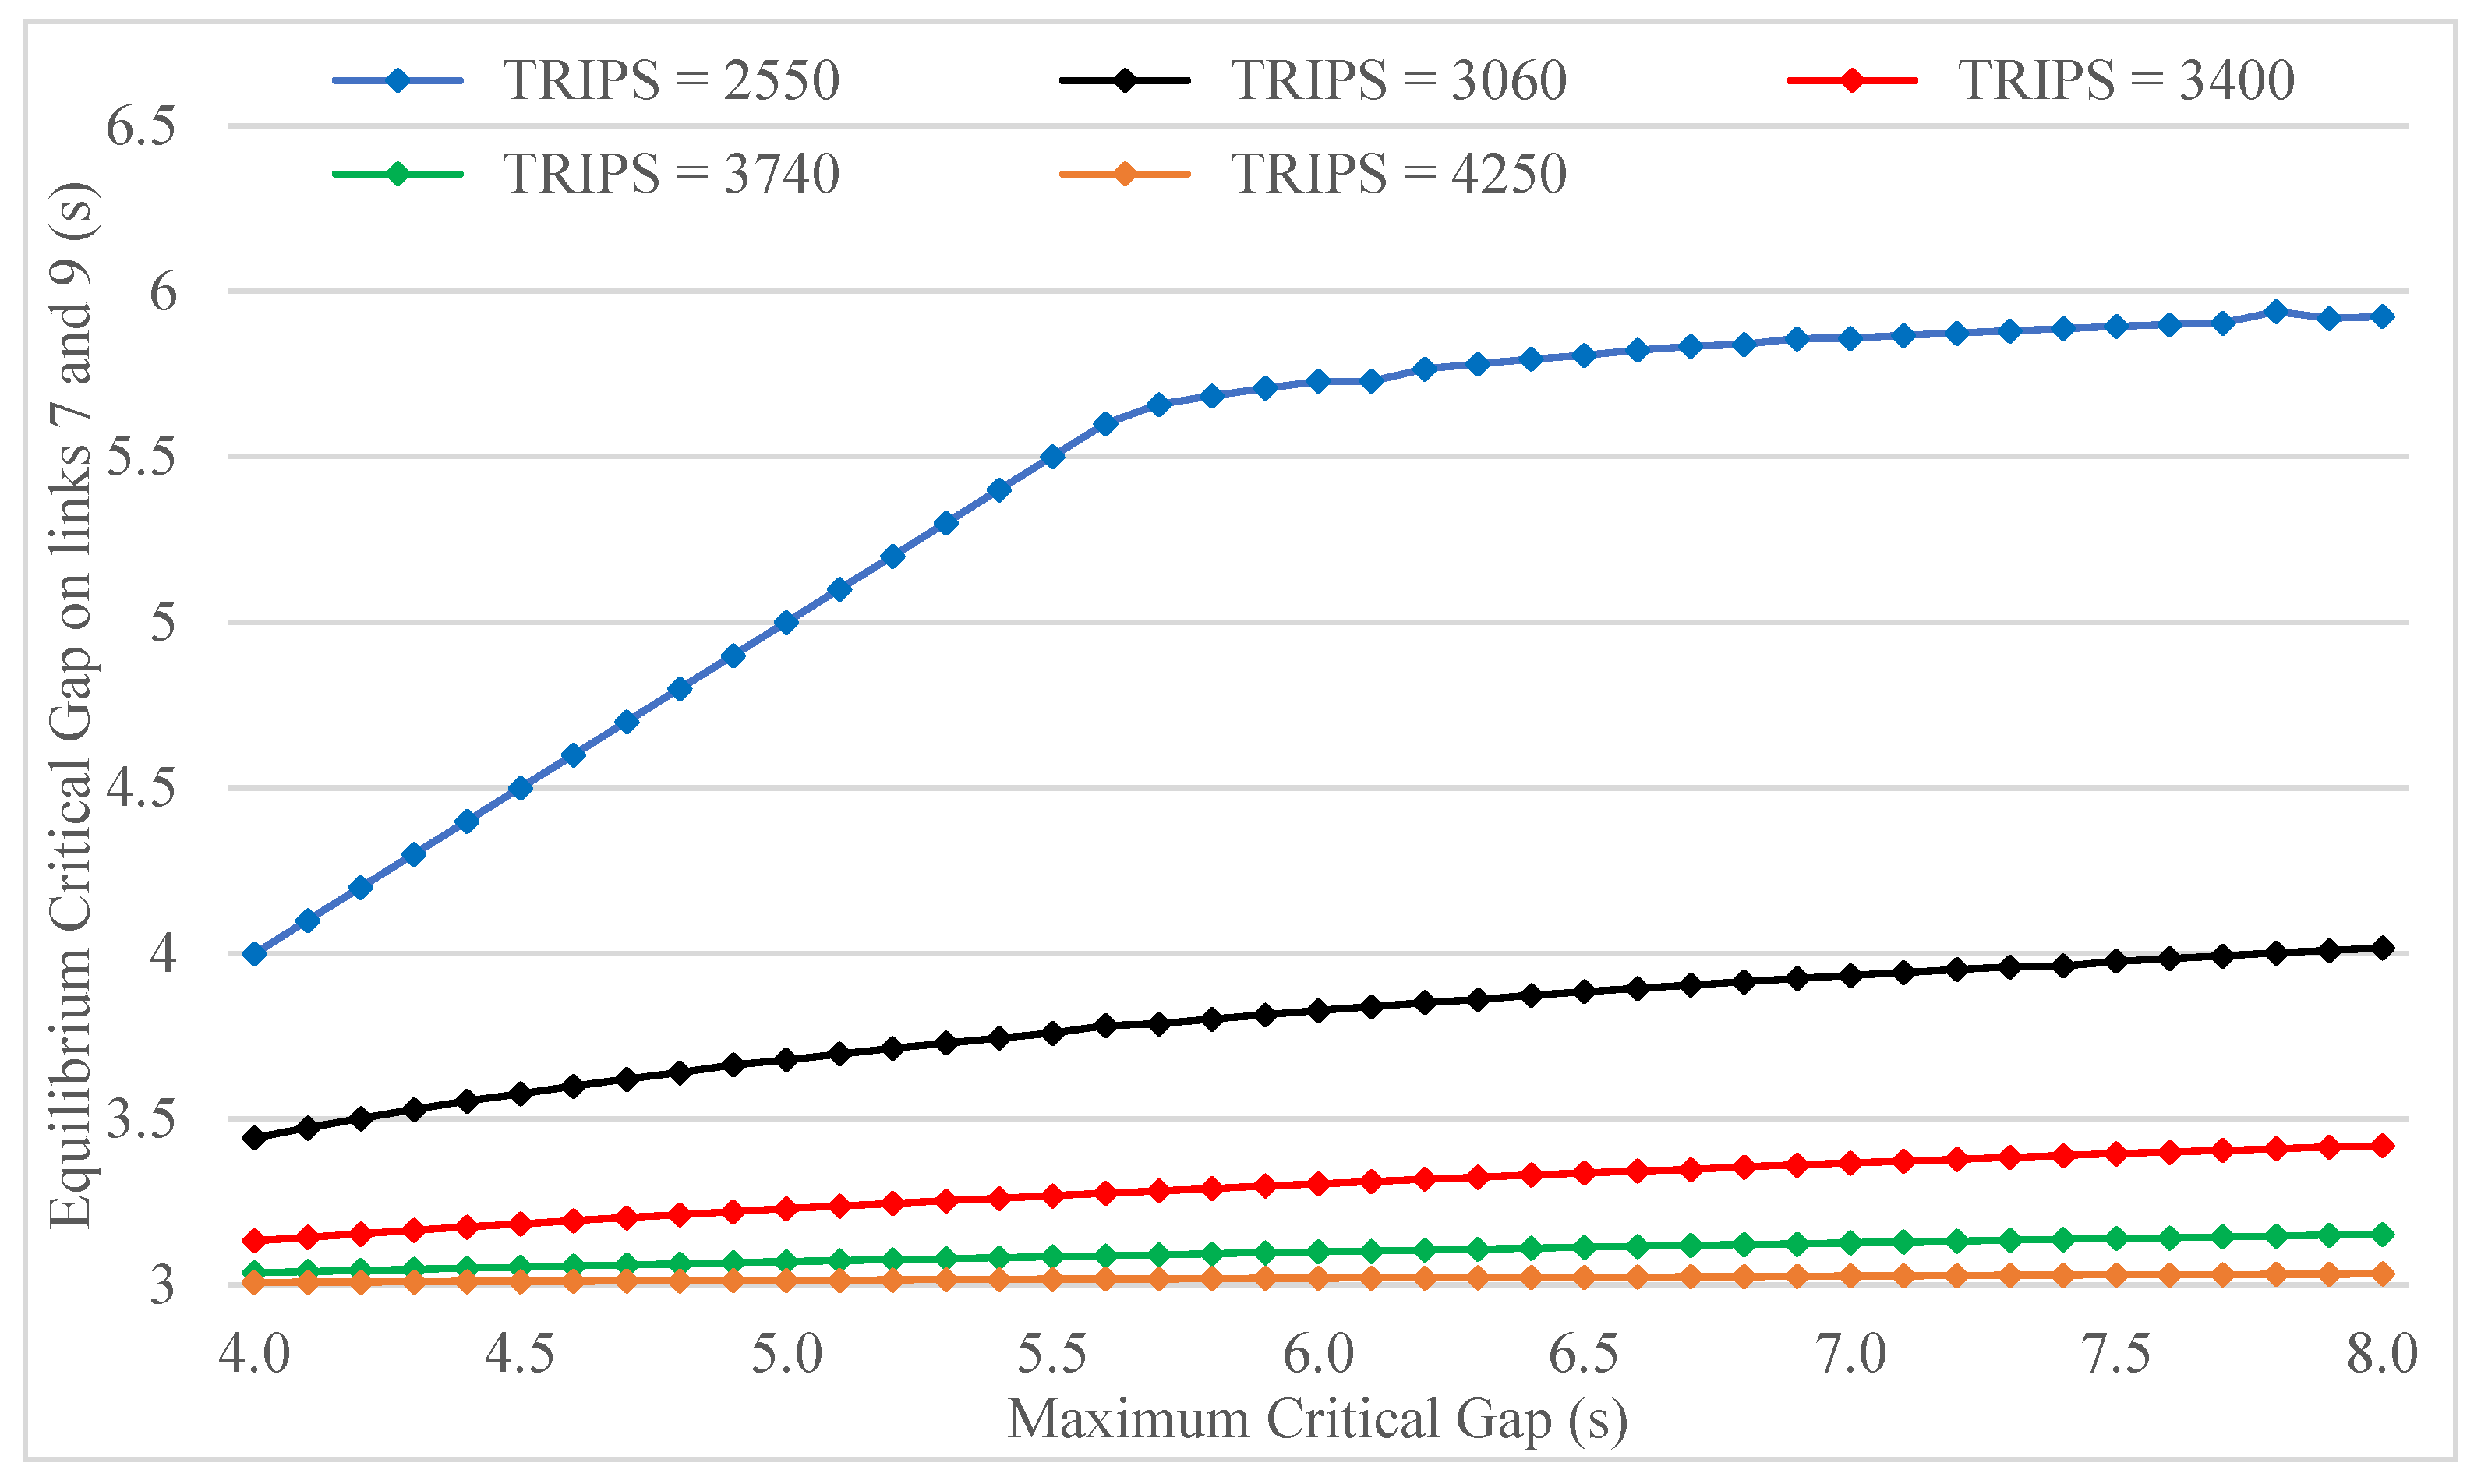
The impact of total origin–destination travel demand on the relationship between equilibrium and maximum critical gap is illustrated in
Figure 11. At the lowest congestion level (TRIPS = 2550), the critical gap reduction effect materializes only for values of
greater than 5.6 s, while for higher travel demands (most notably for TRIPS = 3740 and TRIPS = 4250), the pressure of the major road flow on gap acceptance consistently drives the equilibrium critical gap toward
regardless of the value of
.
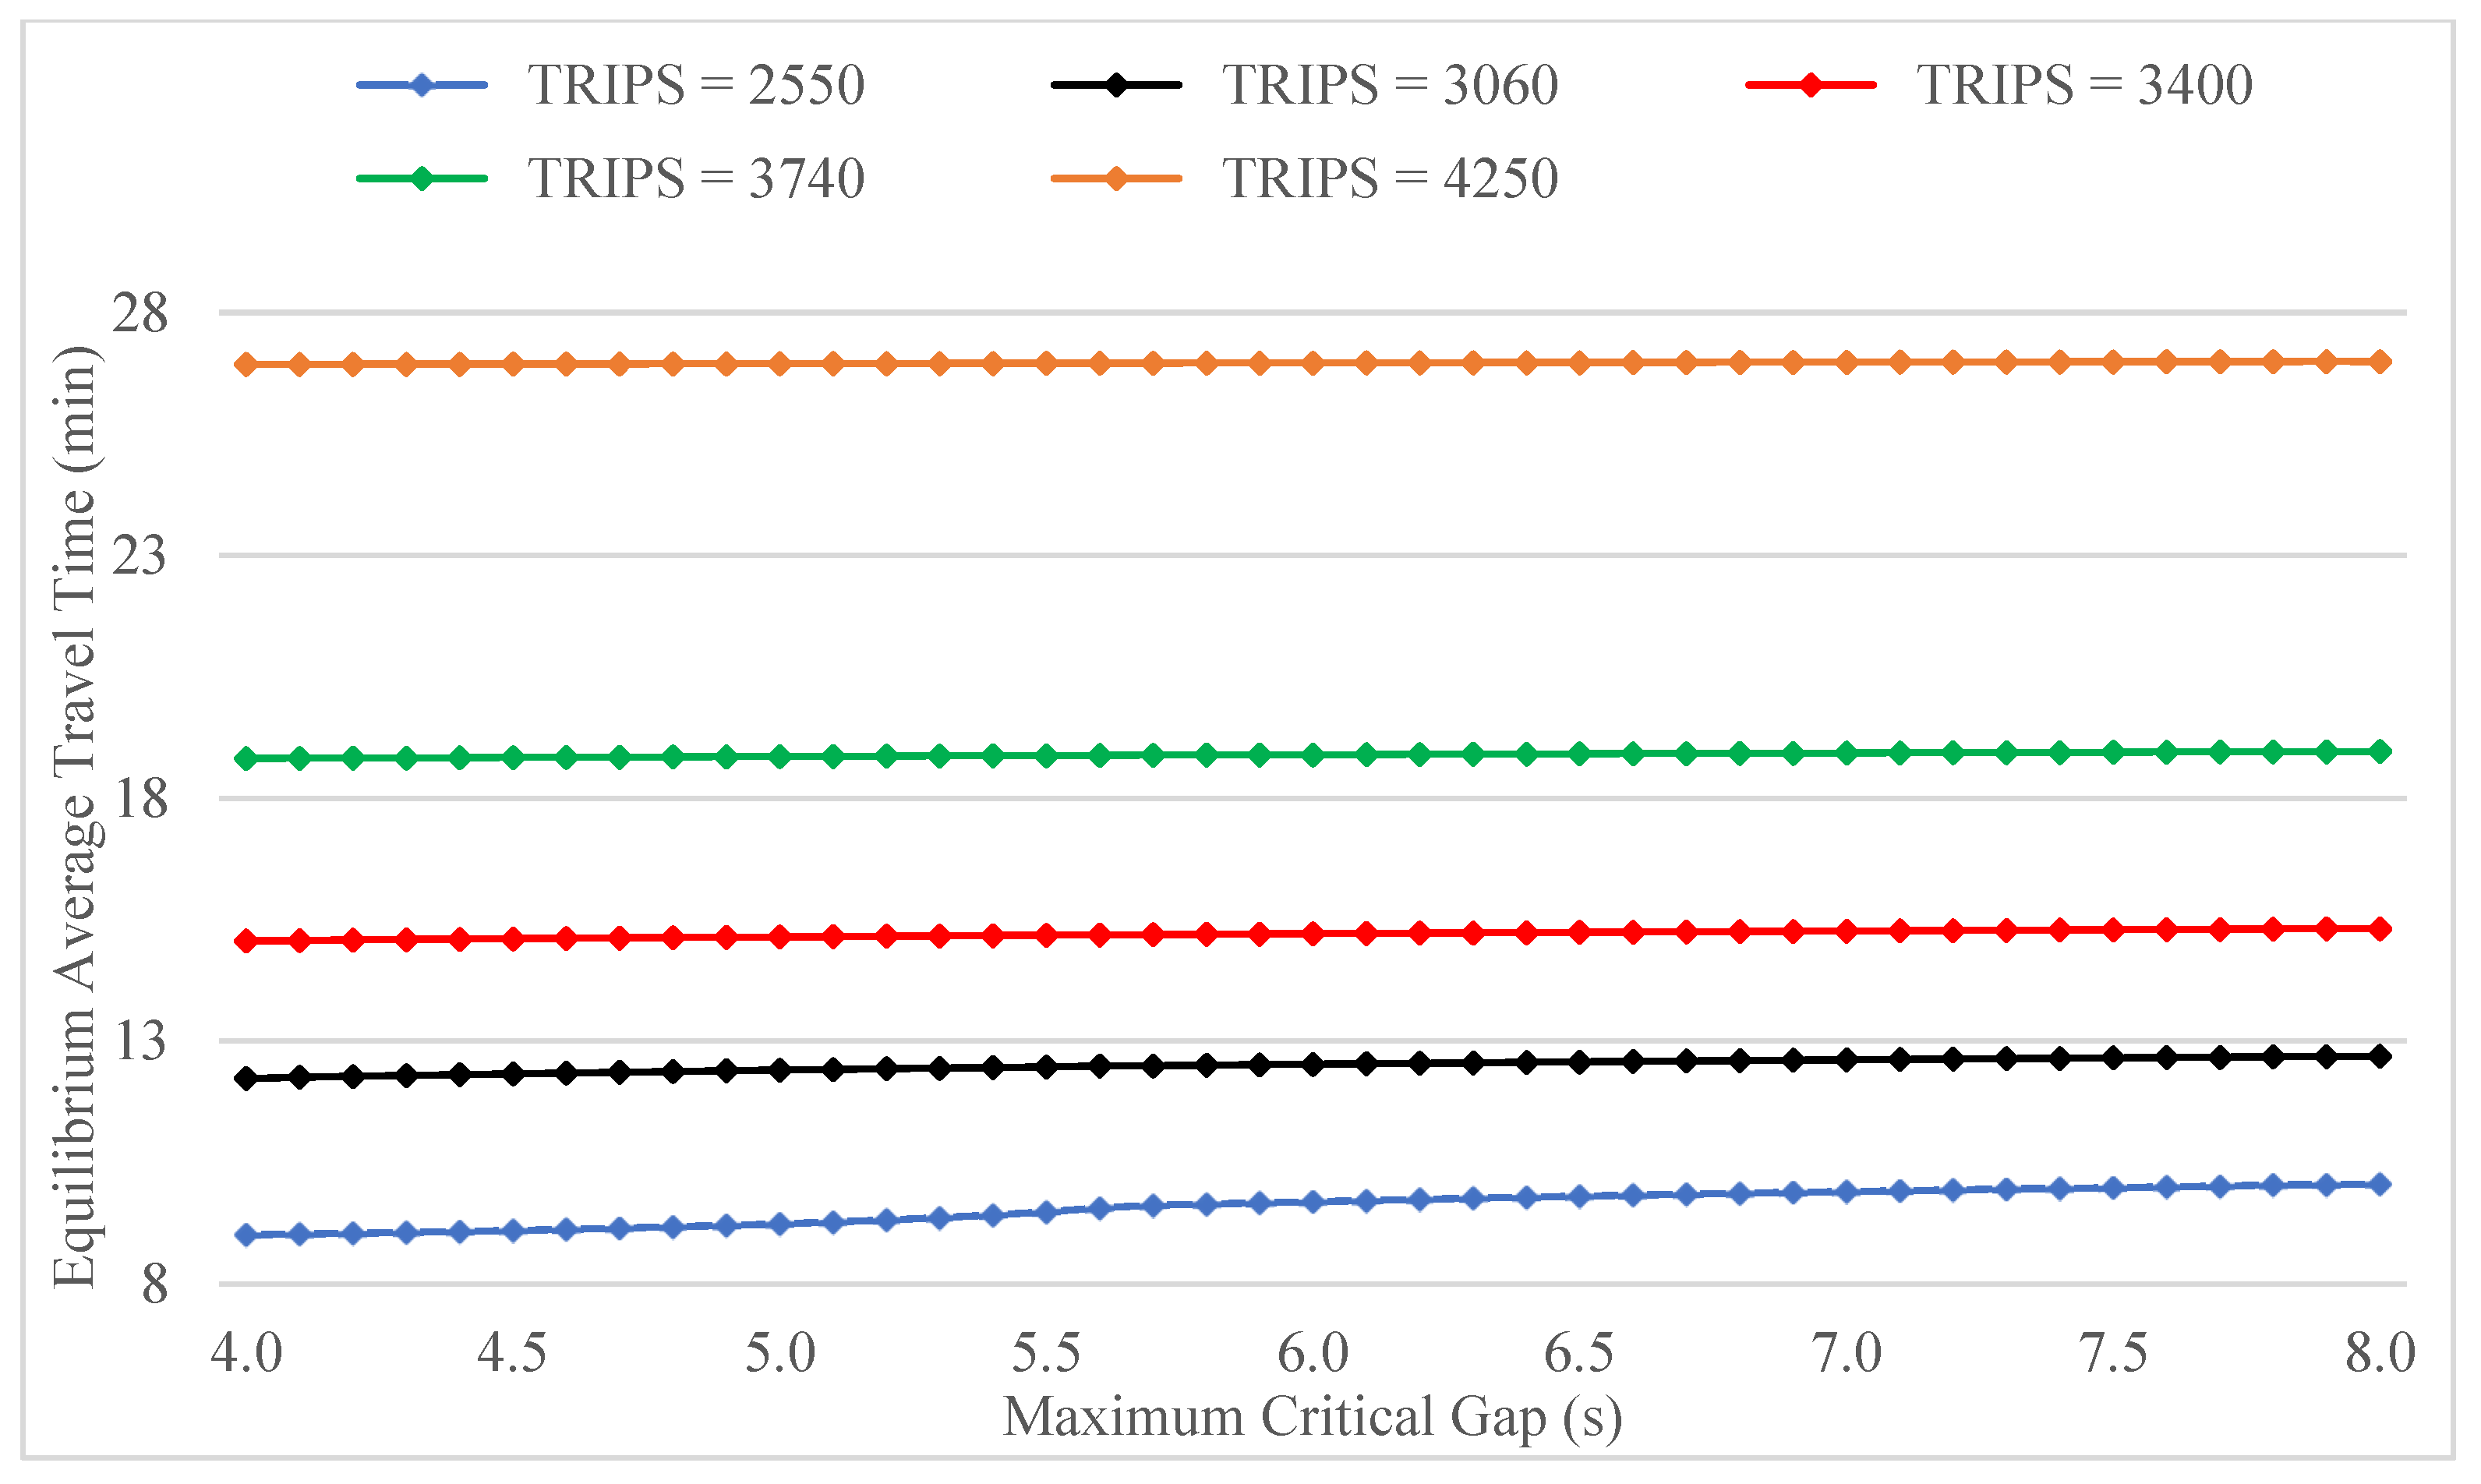
The consequence of this behavior in terms of aggregate network performance is that average travel time at equilibrium is essentially insensitive to maximum critical gap, with the exception of the slightly increasing trend observed for the lowest demand level (
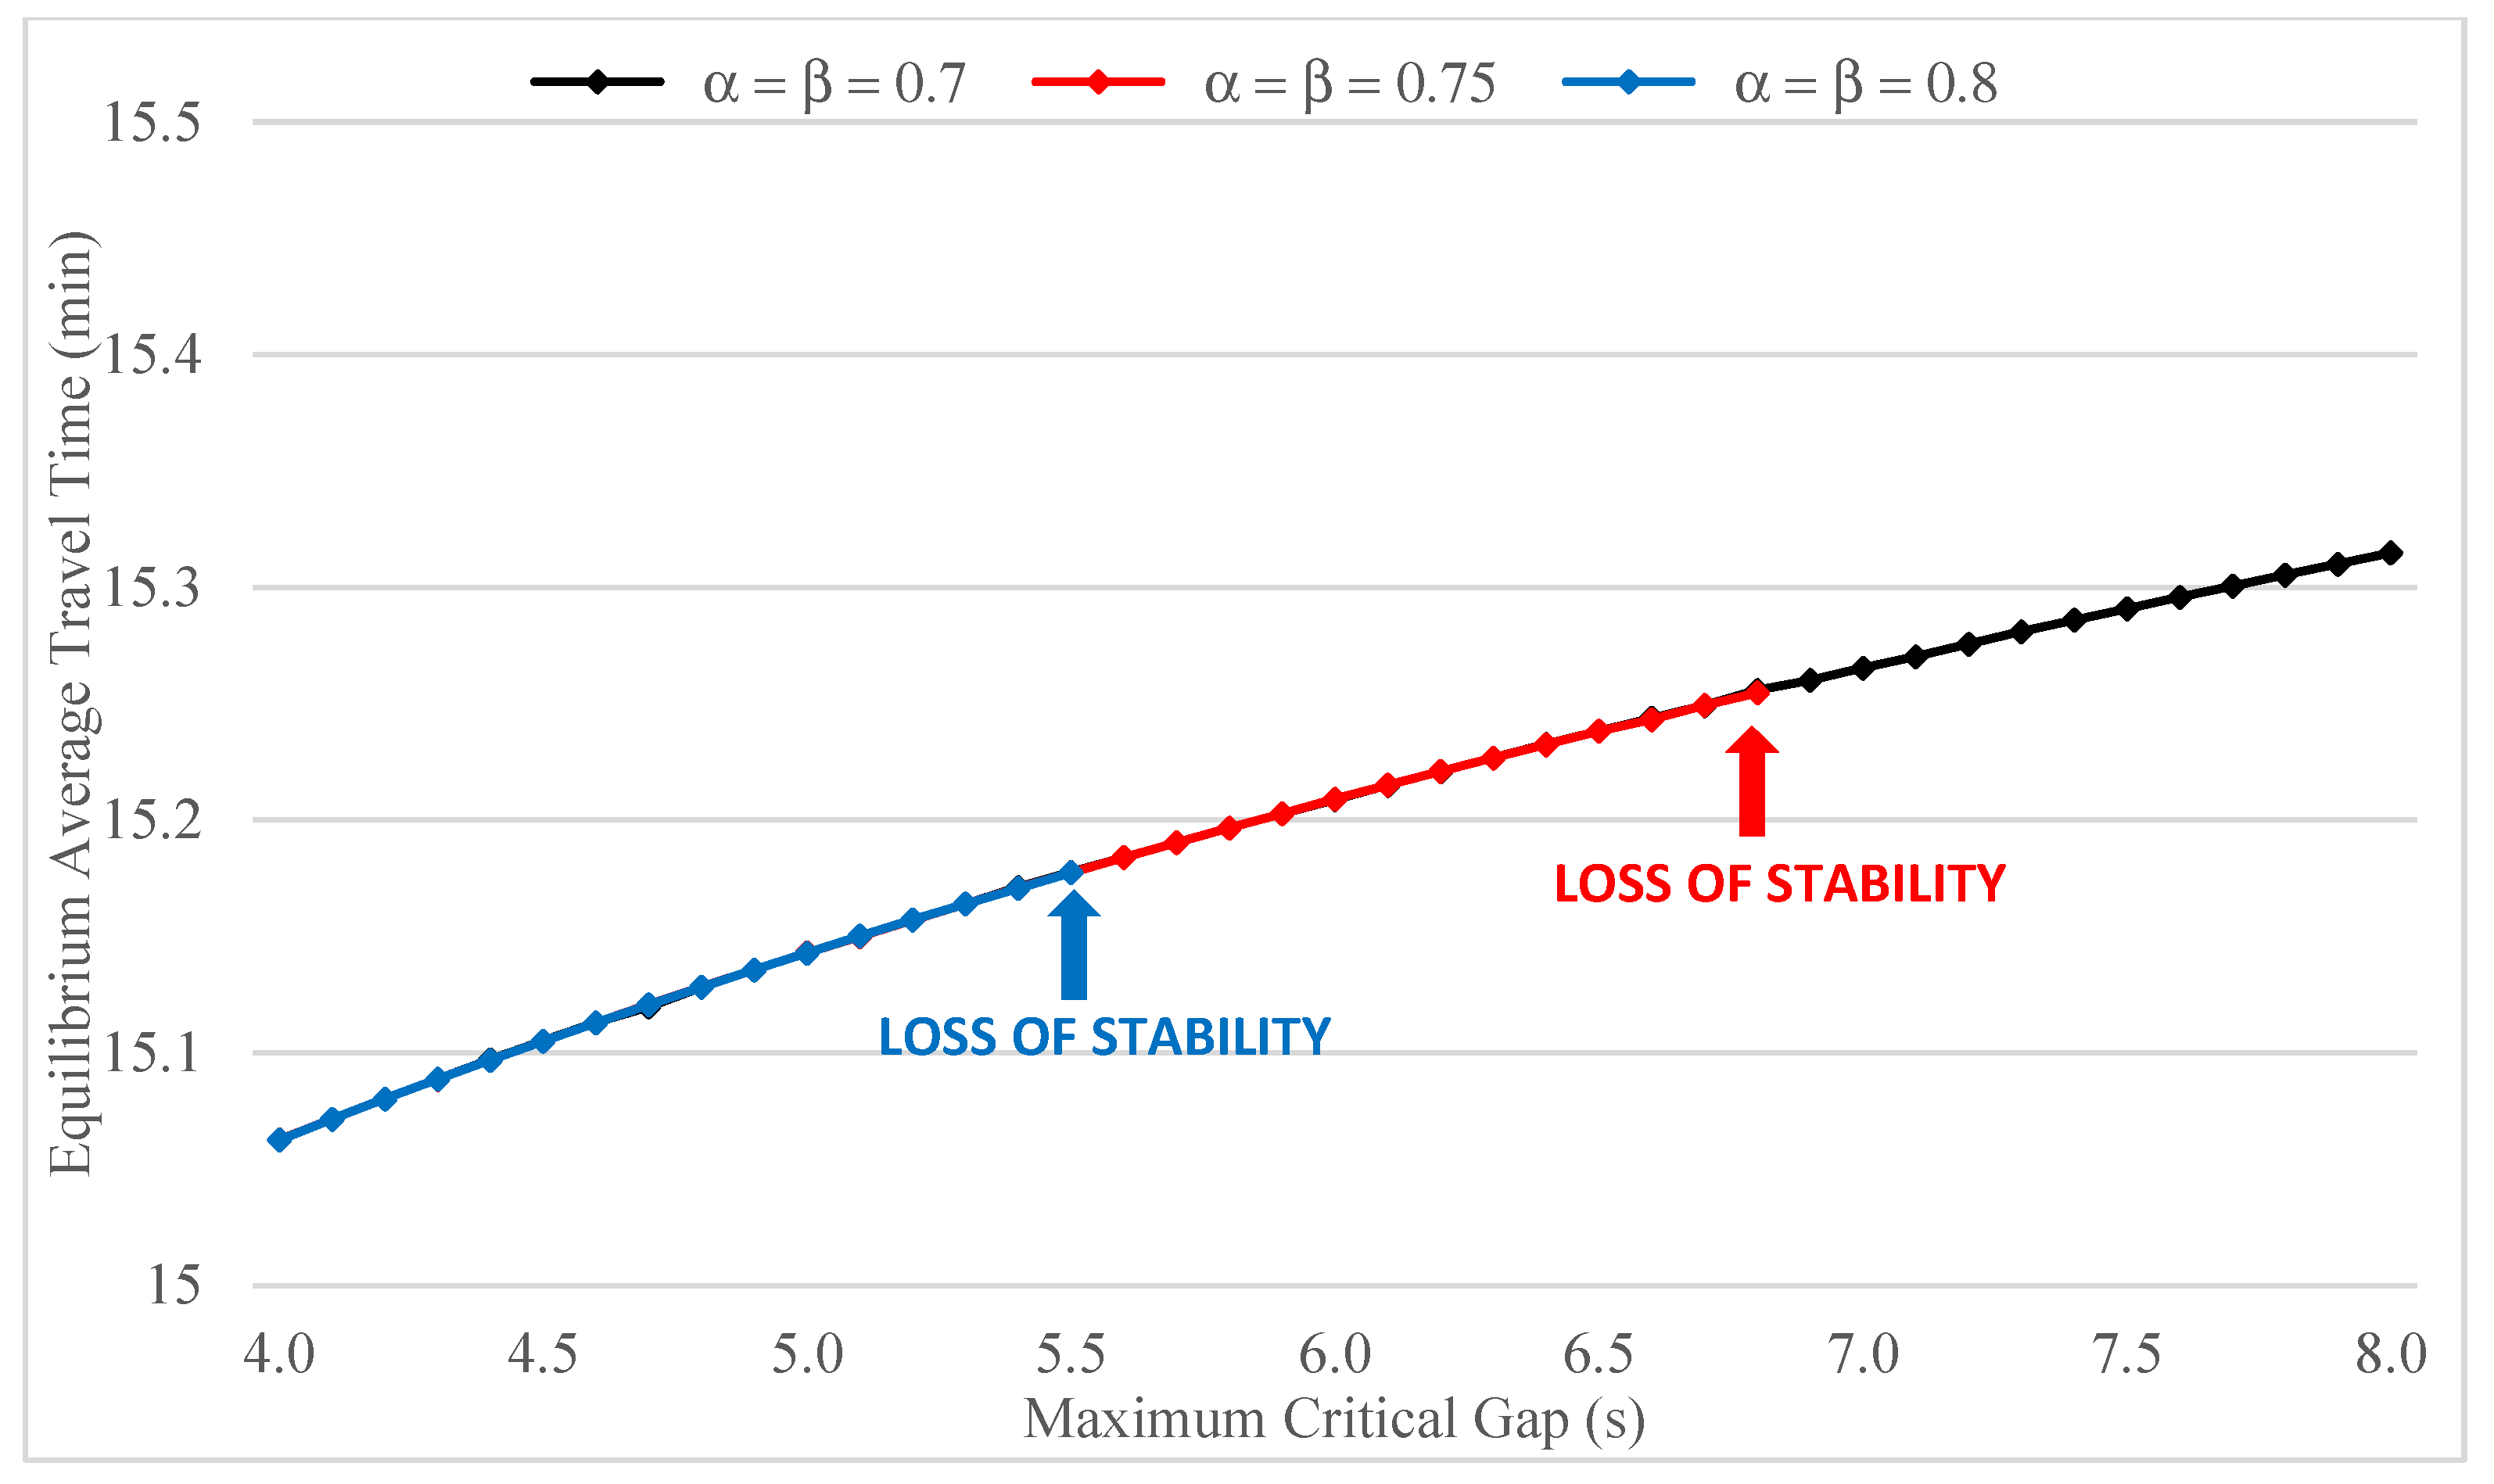
Figure 12).
The analysis reported in
Section 3 indicates that the flow and cost updating parameters
and
may significantly affect system stability. This circumstance is confirmed by the results displayed in
Figure 13 and
Figure 14, which illustrate the relationships between the chosen descriptors (equilibrium critical gap and average travel time) and
for different values of
and
. Both graphs show, in particular, the values of maximum critical gap beyond which stability is lost and the system is no longer attracted to a fixed point.
The interval of values ensuring fixed point stability is seen to shrink as and increase. The behavioral interpretation of this result is that the greater volatility of network states induced by higher flow and cost updating rates needs to be offset by a narrower range of critical gaps in order to preserve system stability.
Also note that, as long as convergence to a fixed point occurs, the equilibrium state is not affected by the values of and . For this reason the three curves shown in both graphs coincide up to the loss of stability points.
4.2. Effect of the Sensitivity of Critical Gap to Major Road Flow
As indicated by Expression (57), the average critical gap of minor road drivers is a decreasing function of major road flow once the latter exceeds a predetermined threshold. The shape of this function is controlled by parameter
λ, which can be interpreted as a measure of the sensitivity of gap acceptance behavior to the intensity of the priority traffic stream. The effect of
λ on the long-term evolution of network states seems, therefore, worthy of investigation. Akin to the analysis described in
Section 4.1, the numerical tests reported in the following take into account the concurrent impact of the accuracy of drivers’ perception of travel times (
), of the level of network congestion (total travel demand), and of drivers’ habit and memory depth in route choice (
and
). The range of feasible critical gaps is held constant in this part of the analysis and is defined by
and
.
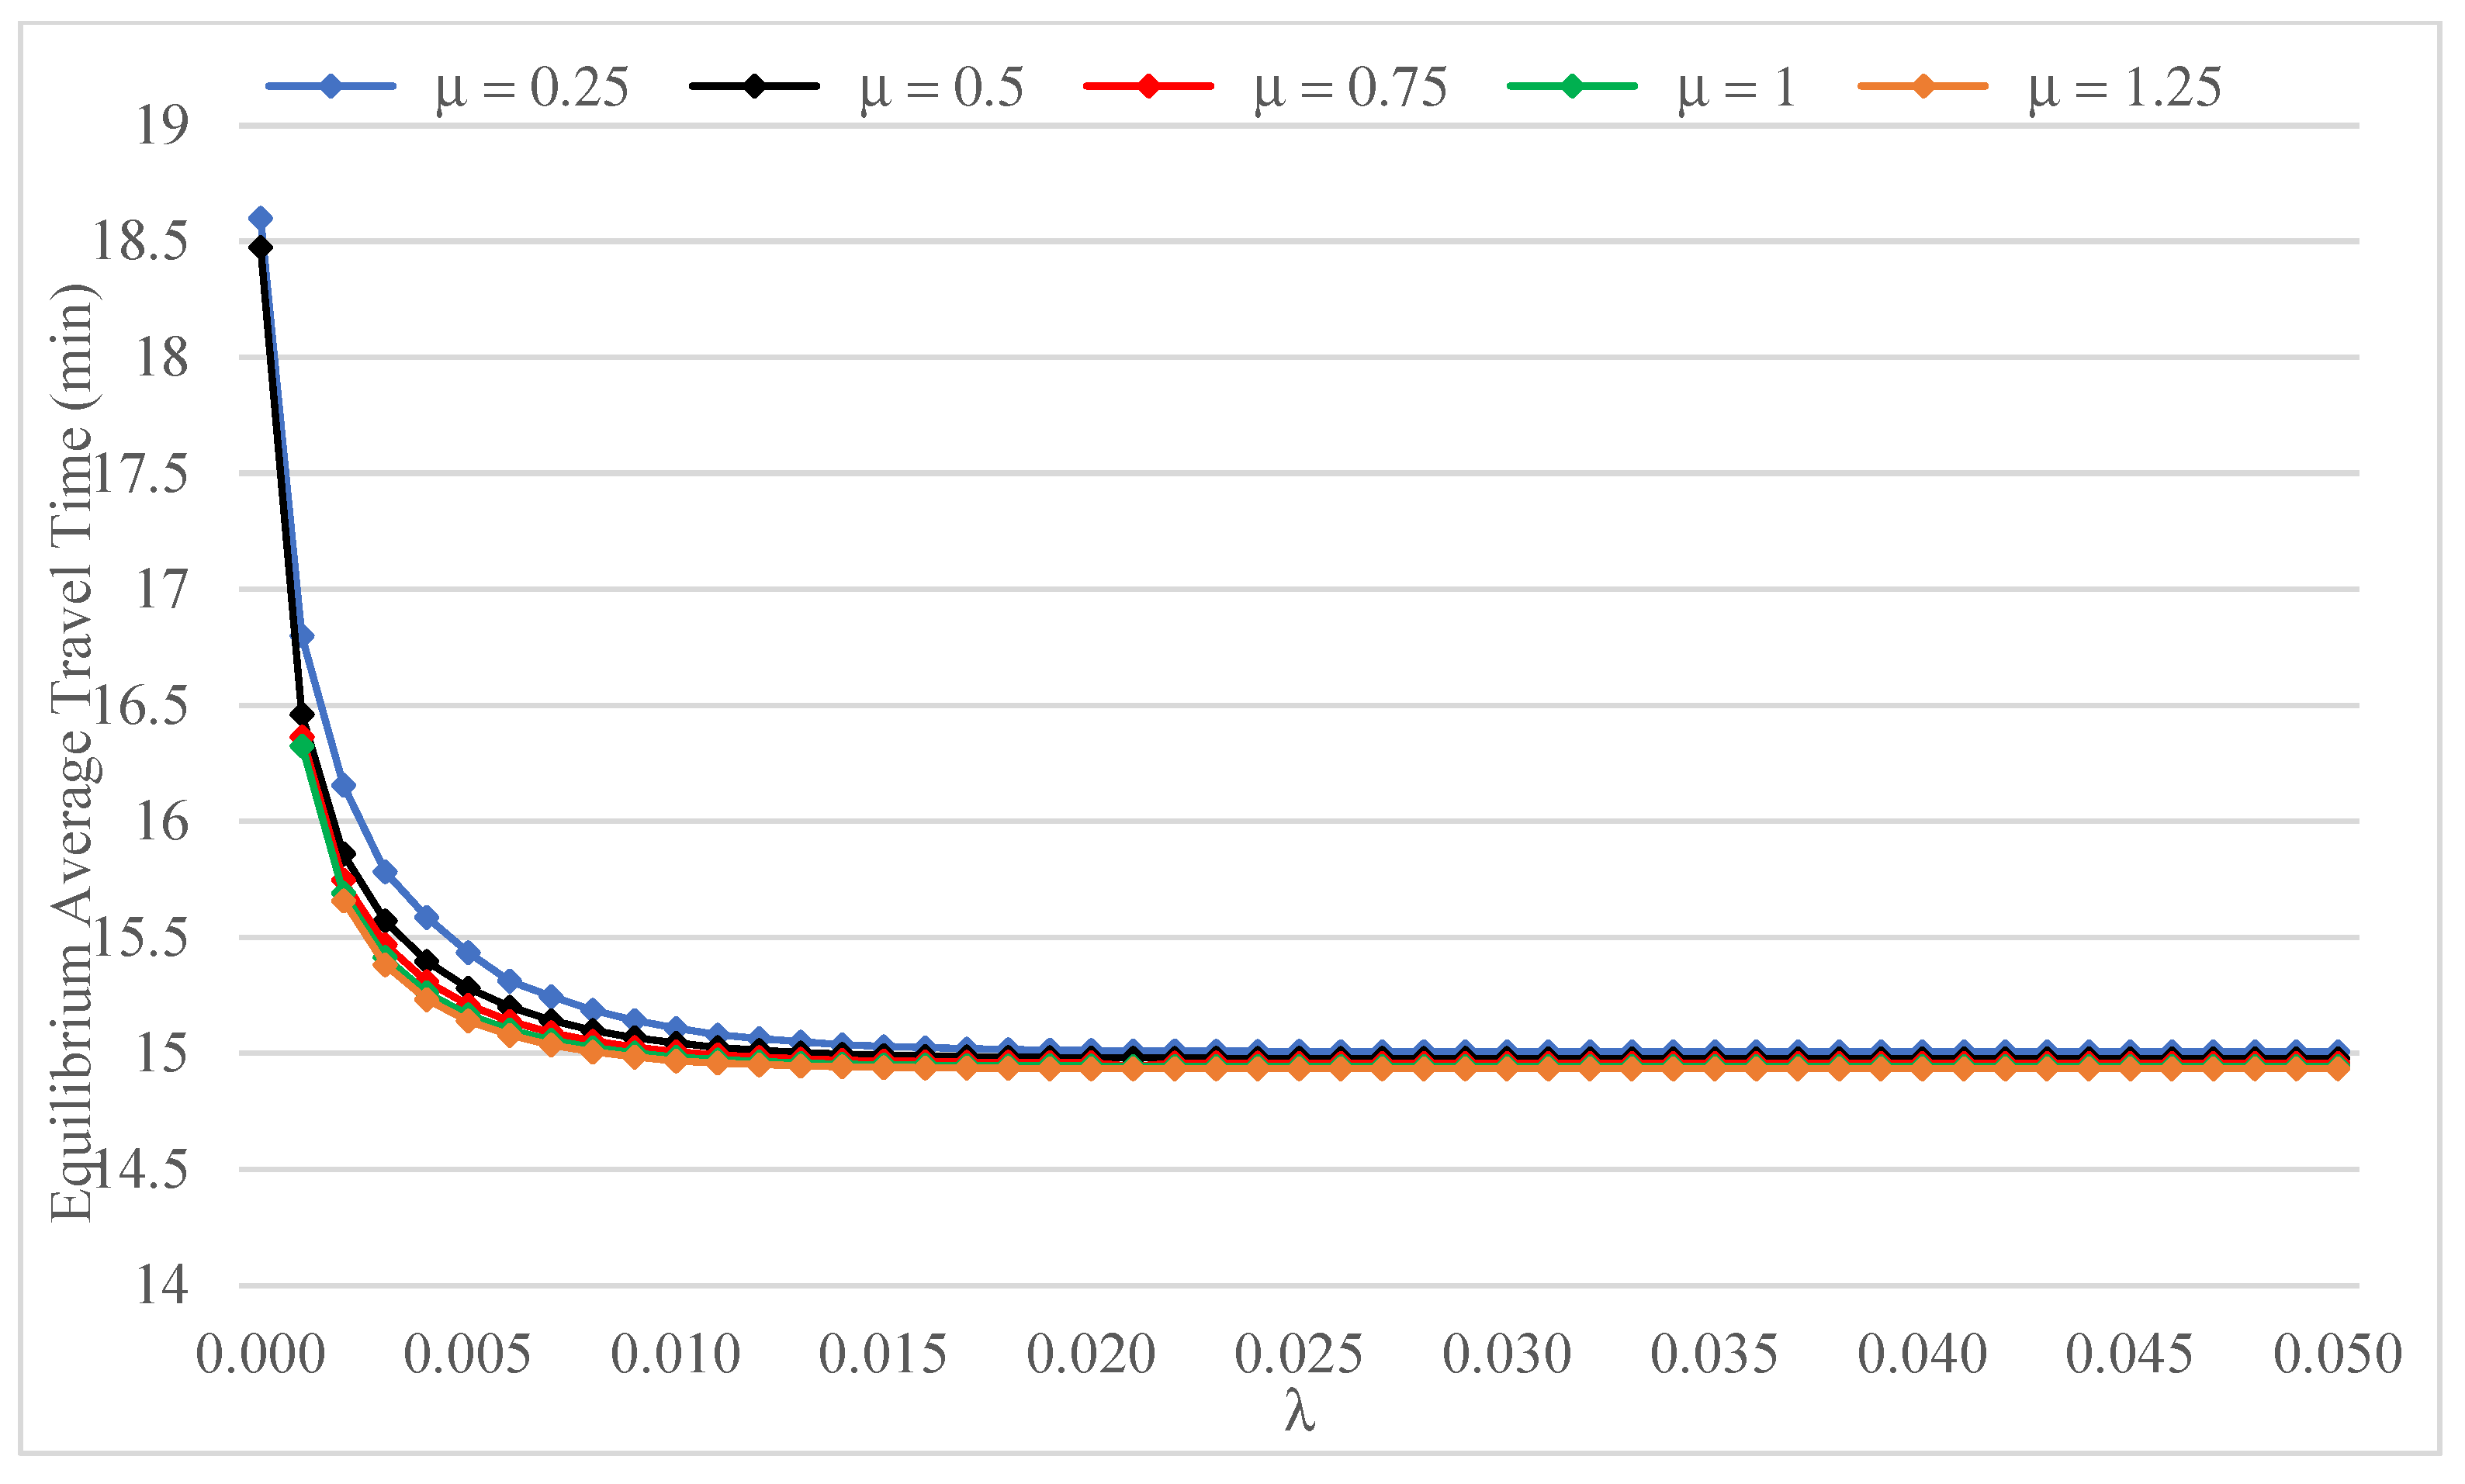
Figure 15 and
Figure 16 show the relationships between the chosen equilibrium descriptors and
λ for various values of the Logit parameter
. Following a steep initial decrease, the equilibrium critical gap levels off at a value corresponding to its lower limit (
Figure 15). More specifically, a value of
λ of about 0.015 is sufficient to push the critical gap to
when the network state reaches a fixed point. On the other hand, joint inspection of the five curves suggests a rather marginal effect of the accuracy of travel time perception on the shape of the relationship under consideration.
Curves of similar shape can be observed in
Figure 16, which shows that network performance at equilibrium improves significantly with increasing
λ only in the first part of the parameter’s range. The value of
has, once again, a limited effect.
The magnitude of total origin–destination travel demand appears to have a more substantial impact on the function relating the equilibrium critical gap to the sensitivity parameter
λ (
Figure 17). For low network congestion (TRIPS = 2550), the influence of major road flows on gap acceptance behavior is negligible, resulting in an equilibrium critical gap only slightly lower than
. Moreover, for values of
λ greater than 0.029, instability emerges and the system state converges to a fixed point only sporadically, as indicated by the intermittent dots in the graph. For higher levels of demand, on the other hand, the equilibrium critical gap consistently reaches
as
λ increases, albeit at considerably different rates depending on the value of TRIPS.
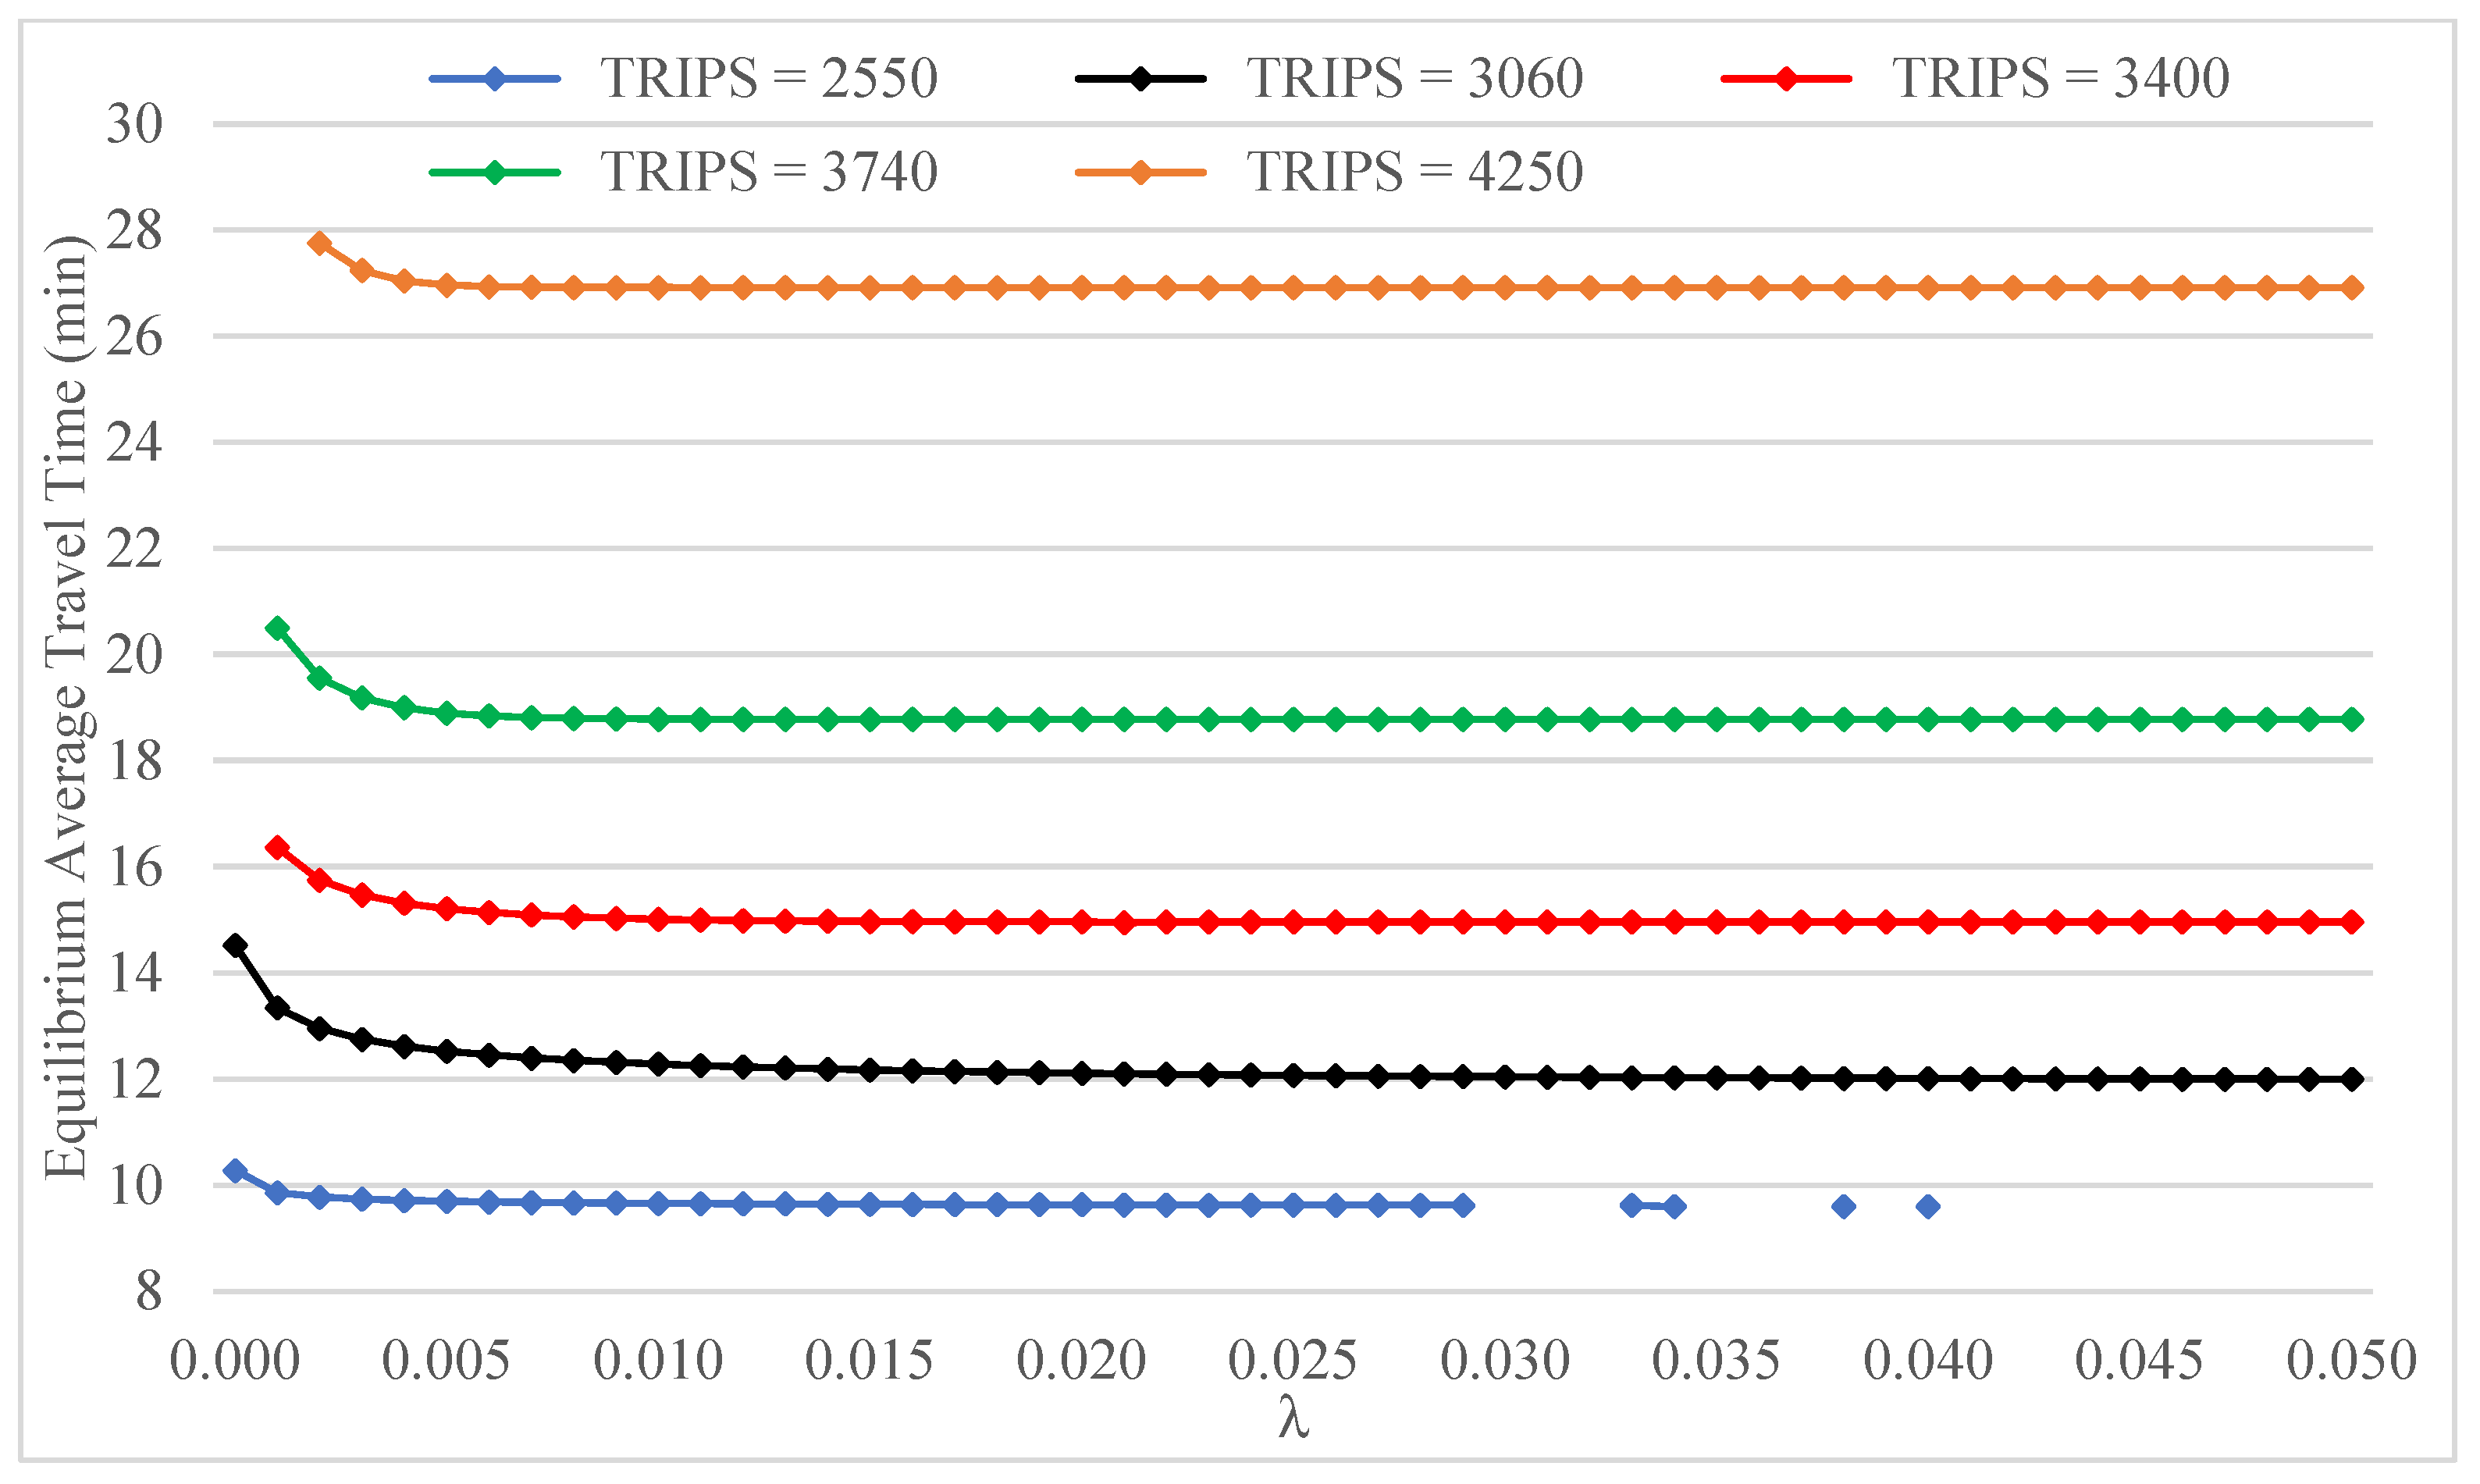
The relationship between equilibrium average travel time and
λ is illustrated in
Figure 18 for the five assumed demand levels. Note, in particular, that for TRIPS = 2550, the negative impact on network performance of the reduced capacity of links 7 and 9, ensuing from their large equilibrium critical gap, is more than offset by the effect of the low network-wide congestion level.
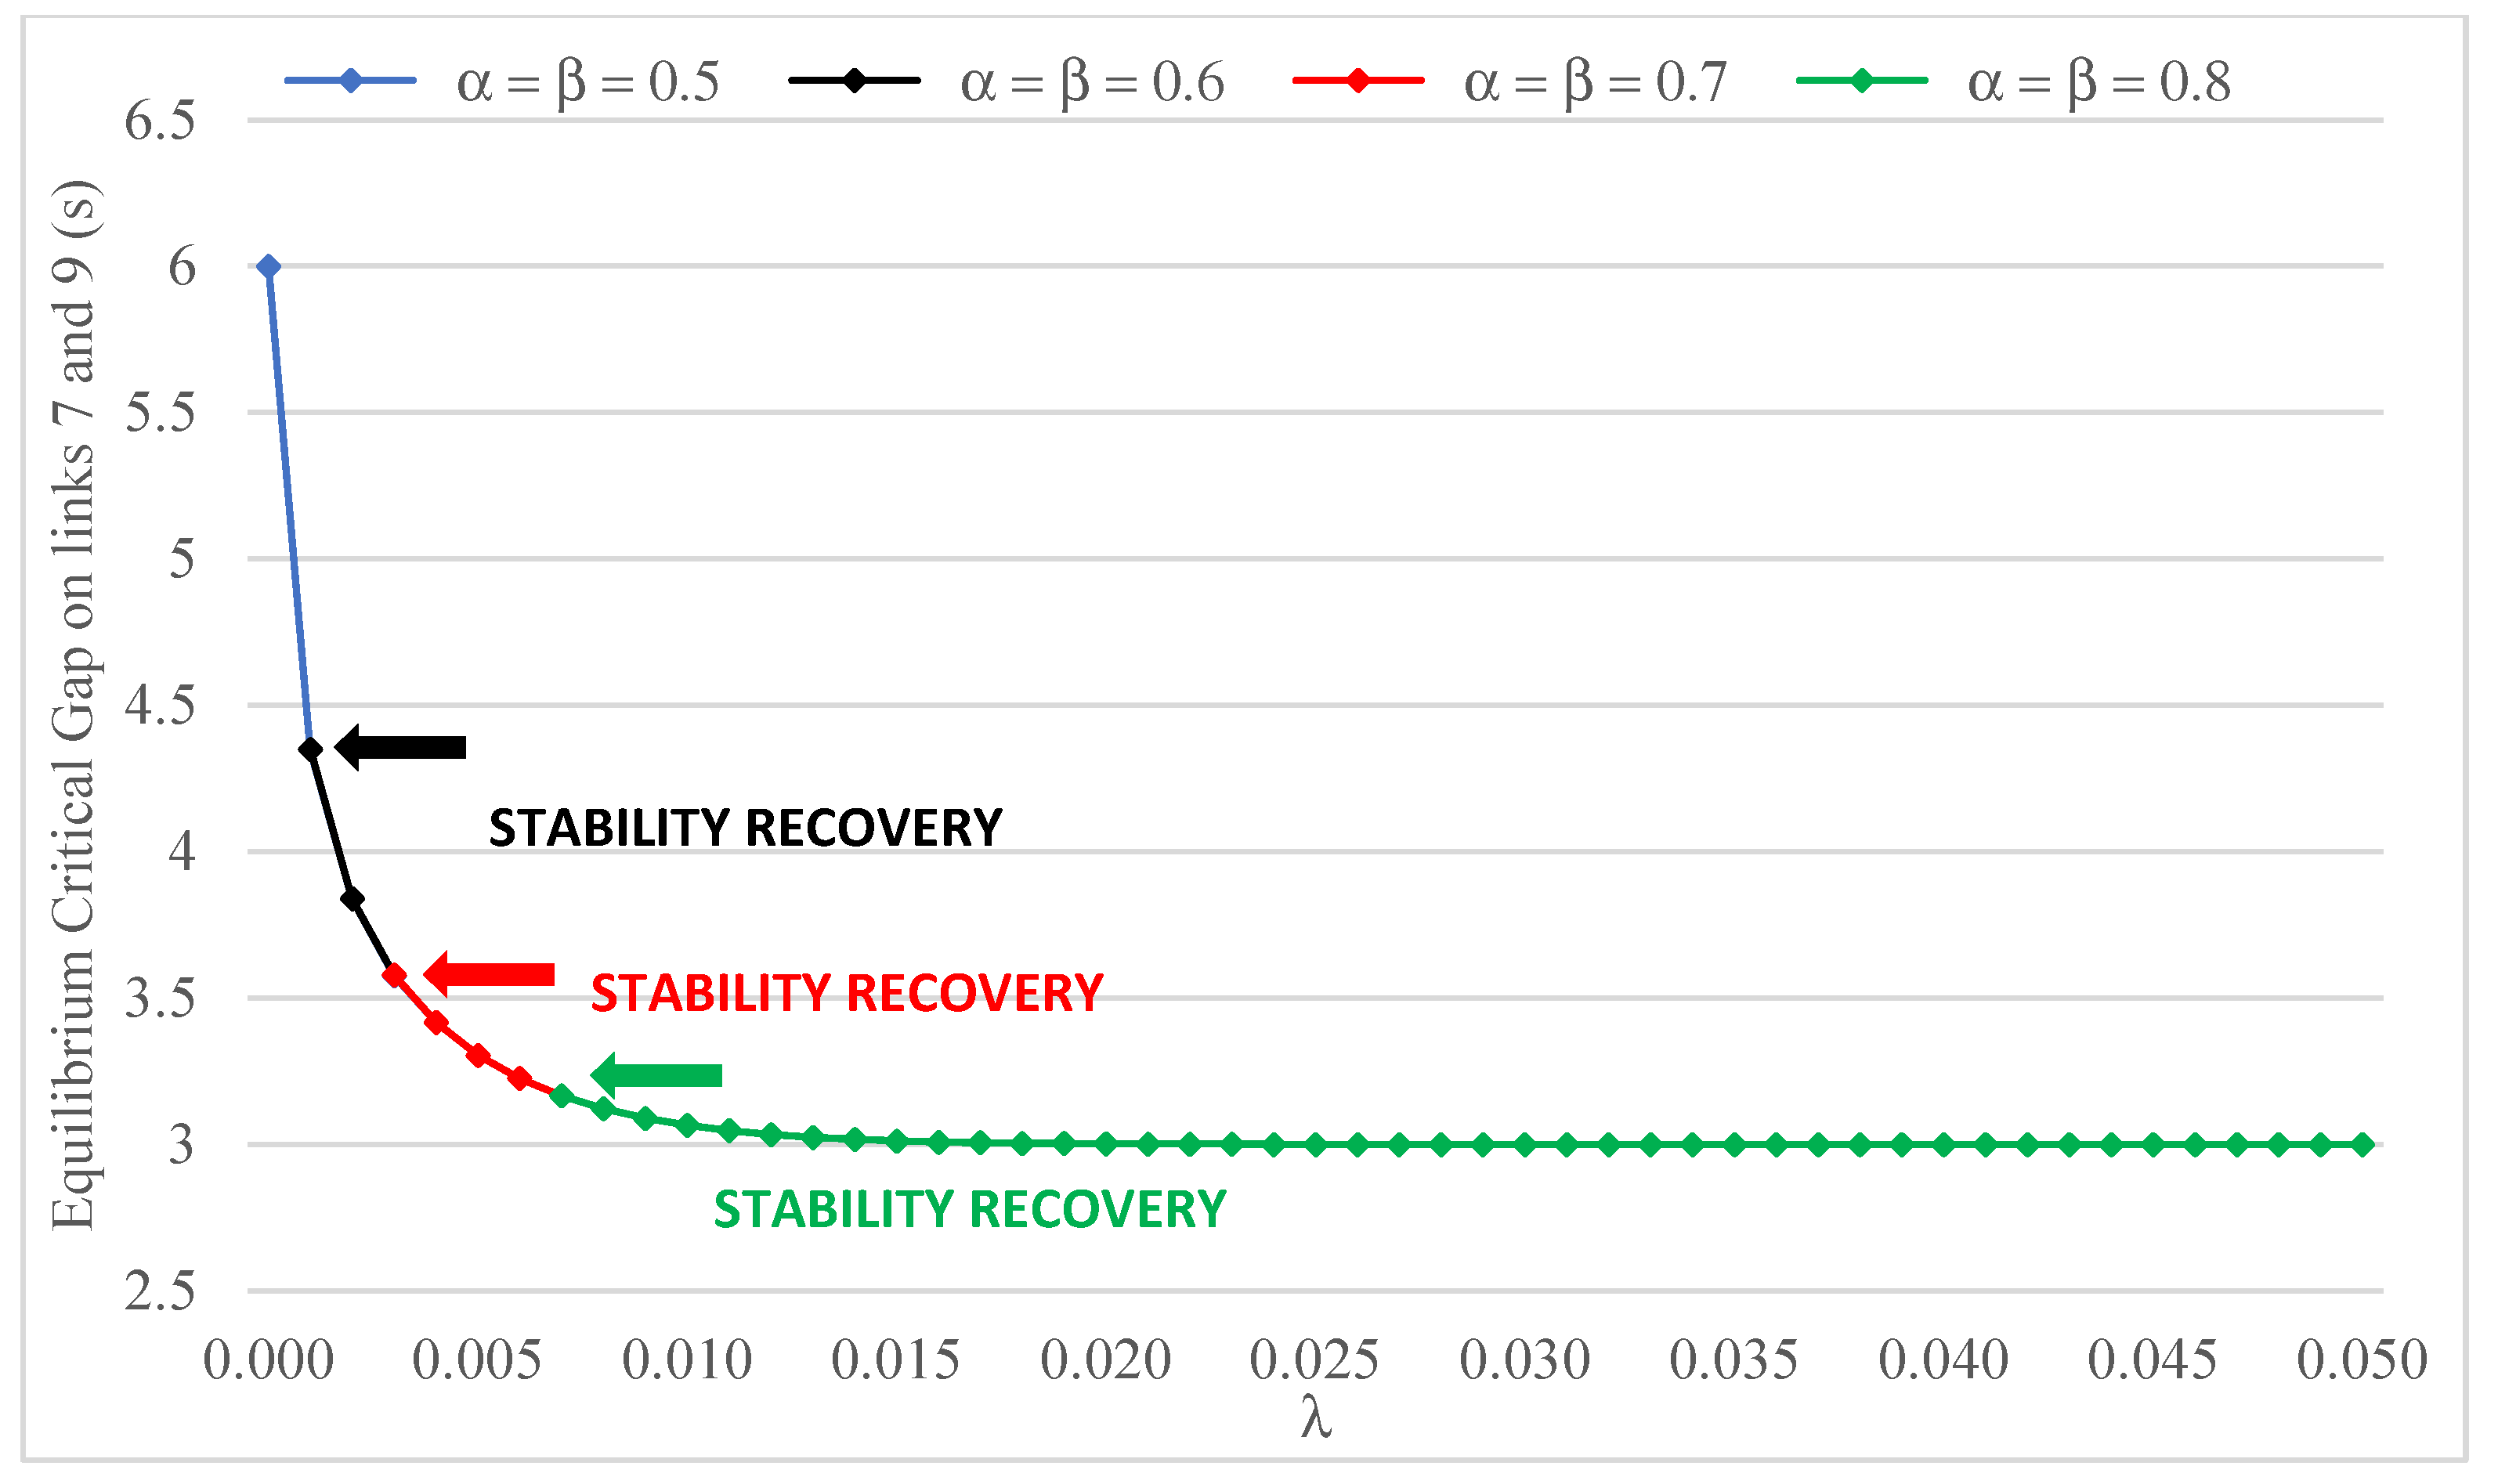
Finally, the effect of the flow and cost updating parameters
and
on the relationship between the two equilibrium descriptors and
λ is illustrated in
Figure 19 and
Figure 20. Both graphs show that instabilities caused by high values of
and
emerge only when the sensitivity of gap acceptance behavior to major road flows is low. The values of
λ above which stability is recovered and the system is attracted to a fixed point are indicated in both figures. A progressive contraction of the stability region is seen to occur as a result of increasing
and
. As already noted in the comments to
Figure 13 and
Figure 14, all curves shown in both graphs overlap since the equilibrium states are not affected by the values of
and
.
5. Conclusions
A new model of the joint day-to-day dynamics of route choice and gap acceptance in road networks with priority intersections has been presented in this paper. Unlike the combined modeling of traffic assignment and signal control, which is a well-documented area of research [
39,
40], the network-level integration of route choice and unsignalized intersection operations with endogenous critical gap appears to be an unexplored topic to date. Notably, the proposed formulation aims at modeling the interaction between behaviors enacted by the same subjects (the network users). Hence, it lacks the hierarchical structure inherent in combined traffic assignment and signal control models, in which the subjects involved (the drivers and the traffic signal setting agency) operate at different levels.
In the proposed model, the critical gap of drivers approaching priority intersections from the minor roads is treated as endogenous. Compared to the usual assumption of a fixed critical gap, this allows us to explicitly assess the effect of the variability of gap acceptance behavior on the evolutionary dynamics of network states, thus resulting in a more flexible modeling framework.
The modeling approach presented in this paper may have significant implications for the planning and design of priority intersections in a dynamic, network-wide perspective. Provided the parameters embedded in the variable critical gap formulation are properly calibrated on observed driver behavior, the model has the potential to deliver improved estimates of intersection approach capacities, delays and queue lengths to be used for policy evaluation.
The combined day-to-day evolution of route choice and gap acceptance has been formulated as a deterministic nonlinear dynamical system. The ensuing analytical and numerical investigations have shown that the long-term outcomes of the process, and notably fixed point stability, are affected by the parameters of the functional relationship between critical gap and major road flow. As in any model involving the interaction between transport demand and supply, the issue of equilibrium stability is of utmost importance. A stable network equilibrium represents a consistent reference state, whose prediction can provide a sound and reliable basis for system planning, design and management.
The specification of the model in an elementary two-link scenario with analytically tractable functions has allowed us to derive explicit fixed-point stability conditions. Then, the combined model has been implemented on a small network with more realistic functions, in order to investigate the joint dynamics of route choice and gap acceptance in interaction with other factors and conditions. More specifically, the level of network congestion, the accuracy of drivers’ perception of travel times, and habit and memory depth in route choice have been considered in the analysis.
To the author’s knowledge, this is the first study providing a rigorous analytical framework for investigating the interaction between day-to-day route choice and gap acceptance behavior by means of a dynamical system approach. However, further developments of the research described in this paper are needed in order to overcome the limitations of the present study.
A key issue to address in future research is the estimation of realistic values of the parameters appearing in Expression (57), namely , , λ and . Of course, alternative functional forms of the relationship between the critical gap and major road flow could be specified and estimated as well. Since in the proposed formulation the above parameters are intended as population averages, extensive observations of drivers’ behavior in real-world settings would be needed to accomplish the estimation task.
Data to be collected at a suitably selected sample of priority intersections should include, in particular, gaps rejected and accepted by minor road drivers for a wide range of major road traffic volumes. Observations covering a broad spectrum of congestion levels would be needed for estimating the rate of decrease of the critical gap and the threshold above which the gap reduction effect materializes. In order to capture the day-to-day dynamics of route choice and gap acceptance, intersections used by drivers traveling repeatedly in the same network, like home-to-work commuters, should be selected as survey sites.
Empirical estimation of the relationship between critical gap and major road flow would then provide the ground for a comparison between the proposed approach and models using fixed critical gap values. This comparison should be based on performance measures such as approach capacities, delays and queue lengths. Concurrently, the implementation of the proposed modeling framework on larger and more realistic networks should be undertaken in order to strengthen the conclusions of the study.
Another worthwhile extension of this work could be the treatment of drivers’ follow-up time as an endogenous variable, since this parameter may depend on the prevailing traffic conditions, just like the critical gap.
As a further development of the proposed approach, a stochastic process model of the combined dynamics under consideration would allow for fully capturing the probabilistic nature of route choice and gap acceptance behavior.
Finally, the impact of the initial conditions on the long-term evolution of the proposed dynamical system could be investigated. In the context of this analysis, particular emphasis should be placed on the identification of the attraction domains of fixed points. Besides being an interesting problem from a theoretical standpoint, this appears to be a key issue with important practical implications, given that multiple equilibria potentially exist in the proposed model.
