Article

Sensory Analysis and Statistical Tools for Finding the Relationship of Sensory Features with the Botanical Origin of Honeys

by
Natalia Żak
* and
Aleksandra Wilczyńska
Department of Quality Management, Gdynia Maritime University, 81-225 Gdynia, Poland
*
Author to whom correspondence should be addressed.
Appl. Sci. 2025, 15(17), 9427; https://doi.org/10.3390/app15179427
Submission received: 16 July 2025 / Revised: 12 August 2025 / Accepted: 19 August 2025 / Published: 28 August 2025
(This article belongs to the Special Issue Sensory Evaluation and Flavor Analysis in Food Science)

Abstract

As a high-value product used as food, medicine, or cosmetics, honey is particularly susceptible to adulteration. Therefore, it must be regularly tested at various stages of its life cycle to ensure its quality and authenticity, especially its botanical origin. Sensory quality features play a huge role in creating the quality of products, but also in determining their authenticity. Sensory analysis helps determine the honey’s overall quality based on attributes like color, aroma, taste, and texture. Sensory evaluation of honey can reveal issues like crystallization, off-flavors, or off-odors that might indicate adulteration or spoilage. The aim of our work was therefore sensory quality assessment of 84 honey samples in order to create sensory profiles for the varietal classification of honeys. In order to obtain information on the differences in sensory features and their classification based on the assessment of honey quality descriptors, a discriminant analysis was carried out. Then, an assessment was carried out to check whether the compared varieties differ in terms of the value of the sensory feature parameter assessment. As a result, a statistical tool was constructed (canonical discriminant functions, distinguishing/classifying the varieties of honeys tested). These models will ensure the repeatability of results in the classification of sensory profiles of varietal honeys on the example of Polish honey varieties. The results indicate that the sensory analysis is a good analytical tool to differentiate honey types. The findings of this study can be applied by honey producers, suppliers, and customers to differentiate and determine honey varieties according to their sensorial attributes.

1. Introduction

Honey is a natural product produced by the honeybee (Apis mellifera) from flower nectar or honeydew found on various plant species. Bees can obtain honey from many different available nectar sources simultaneously, which results in obtaining multifloral honey [1]. When a sufficiently large monoculture of a nectar-producing plant is available near the hive, the honey obtained may come entirely or predominantly from the nectar of a single type of flower, giving honey that can be considered monofloral or varietal, with properties characteristic of a specific botanical origin [2]. Honeys of different varieties differ in their organoleptic and physicochemical properties as well as in their health-promoting effects, which result from their chemical composition. Those properties, as well as organoleptic characteristics: taste, smell and color of honey, have an impact on consumer preferences and price and also are decisive for the use of individual honeys [3]. Varietal honeys are generally considered to be more valuable than multifloral honeys. Dark honeys, such as buckwheat, heather or honeydew, are usually characterized by a higher content of minerals, higher diastatic activity and antioxidant activity than light-colored honeys; therefore, they are considered more “healthy” [4].
The methods used to determine the botanical origin of honey are mainly based on pollen analysis. However, it has many limitations resulting from the fact that the pollen content in honey depends on many factors that often make it impossible to unequivocally confirm the botanical origin [5]. In connection with the above, it is important to develop new methods for classifying and confirming the botanical origin in an unambiguous way to support pollen analysis. The most promising methods for this purpose seem to be those based on finding a specific or non-specific chemical compound—a biomarker or group of compounds—for a selected variety, or based on a characteristic chemical profile (“fingerprint”) [6]. The assessment of organoleptic characteristics: taste, color, smell, degree of crystallization, and then a comparison of the obtained description with the characteristics assigned to individual honey varieties, also plays a supporting role in pollen analysis. Many authors state that a botanical declaration must include sensory analysis, besides melissopalynological analysis and physicochemical analyses, to complement each other for a verified declaration [7]. The problem in Poland and Europe is that legal regulations provide for requirements regarding organoleptic characteristics and minimum pollen content only for the most popular varieties of nectar honeys, such as acacia, lime, rapeseed, buckwheat, and heather. They do not cover less common varieties. The Polish regulation on honey quality requirements [8] states that honey should meet the following organoleptic requirements:
(1)
color—from almost colorless to dark brown;
(2)
consistency—liquid, viscous, partially or completely crystallized;
(3)
taste—variable, depending on the variety;
(4)
smell—variable, depending on the variety.
Disqualifying feature is that the honey does not have a smell and taste that are unusual for a given honey variety; however, this regulation does not specify what the typical tastes and smells of individual honey varieties should be. More detailed organoleptic requirements were included in the currently non-binding Polish standard [9]. Examples of organoleptic characteristics of selected honey varieties are given in Table 1.
Poland plays a significant role in European beekeeping. It ranks fourth in Europe in terms of honey production, and the number of bee colonies in Poland is growing [10]. The most important bee crops, just like in the whole of Central and Eastern Europe, include: rapeseed, acacia, lime, raspberry, buckwheat, heather and honeydew. Because Poland is characterized by a rich floral diversity and diverse native vegetation with long flowering periods, a comprehensive study of honeys from this country could yield botanical and geographical markers that will allow for the identification of honeys. Research on the sensory properties of Polish honeys is scarce, with only a few articles on this topic published in recent years [11,12]. None of the studies carried out so far has included information about sensory profiles of less common honey varieties, such as phacelia or heather honey. As mentioned above, sensory analysis plays a vital role in honey authenticity by helping to identify the honey’s origin and assess its quality. Therefore, the aim of our work was to analyze the Polish honeys from the sensory point of view, and to relate their characteristics to the botanical origin. Additionally, we create discriminant models to ensure repeatability of results in the classification of sensory profiles of varietal honeys on the example of Polish honey varieties.

2. Materials and Methods

2.1. Material

The tested material consisted of 84 samples of fresh, non-standardized varietal honeys, classified into eight varieties. Data on the number of tested samples of subsequent varieties are presented in Table 2.
The samples of tested honeys came directly from beekeepers from all over Poland, from harvests in the years 2020–2024.
Until the analyses were performed, the tested samples were stored in tightly closed individual packages—250 mL glass jars with a “Twist off” closure, at a temperature of 16 ÷ 20 °C.

2.2. Sensory Evaluation of Varietal Honeys

Sensory evaluation of varietal honeys was performed using a 5-point intensity scale. Taste, smell, color, transparency and graininess were assessed according to the author’s evaluation questionnaire presented in Table 3 [8].
The sensory evaluation was carried out by a panel consisting of 10 people (Table 4). The participants in the sensory evaluation study were selected according to the principles of balance:
age (25–40 years old), to ensure sensory maturity without reducing receptor acuity.
gender (5 women + 5 men), to minimize gender differences in perception.
experience, from newly trained to experienced, which enhances panel focus and calibration.
These people were trained and familiarized with the requirements for varietal honeys, including the indication of characteristic features for each variety (Table 5) [8,9] and with the method of conducting sensory analysis according to the requirements of the standard [PN-ISO-8586-2:1996 Sensory analysis—general guidelines for the selection, training and monitoring of assessors—Experts].
Sensory evaluation of the honeys was conducted in sensory booths. The room temperature was 21 ± 1 °C and the relative humidity was 45–60%. The room was free from extraneous odors and acoustic interference.
Samples weighing 10 g ± 0.2 g and kept at a temperature of 20–22 °C were presented to the evaluators in transparent, round, 40–50 mL wide-mouth glass containers (with a glass lid, which was closed during presentation; the lid was opened just before evaluation). Each sample was placed in a separate container, coded with a 3-digit code. Three samples were presented per session. Two sessions were conducted daily, ≥1 h apart. Each session lasted approximately 30–40 min.

2.3. Statistical Analysis—Creating Sensory Profiles of Honey

The evaluation of sensory features of honeys was based on a 5-point verbal scale. For the purposes of the analysis, this scale was transformed into a numerical scale, where number 1 meant the lowest level of the examined feature (intensity), and number 5 meant the highest level of the examined feature. In this way, quantitative variables were obtained. In the first stage, the values of basic statistical measures were determined: arithmetic mean ( x ¯ ) and standard deviation (sd) and range—xmin and xmax.
In the second stage, the hypotheses about the differentiation of the intensity of sensory features depending on the honey variety were verified. Verification was preceded by examining the compliance of all empirical distributions with the normal distribution using the χ2 test of compliance. It was found that almost all distributions did not comply with the normal distribution. It was decided that the Kruskal–Wallis test would be used for a single-factor system.
Then, radar charts were made to graphically present the identification of sensory characteristics of honey varieties from Poland.

2.4. Statistical Tools for Classifying Honey Varieties

Then, canonical discriminant functions were constructed, placing the tested varieties on the plane defined by the first two elements. First, the significance of the discriminant power of seven classification variables (organoleptic characteristics) was tested using the Wilks lambda test.
Statistical analysis was performed using Statistica 13.3.

3. Results and Discussion

3.1. Sensory Analysis—Profiles for Varietal Honeys from POLAND

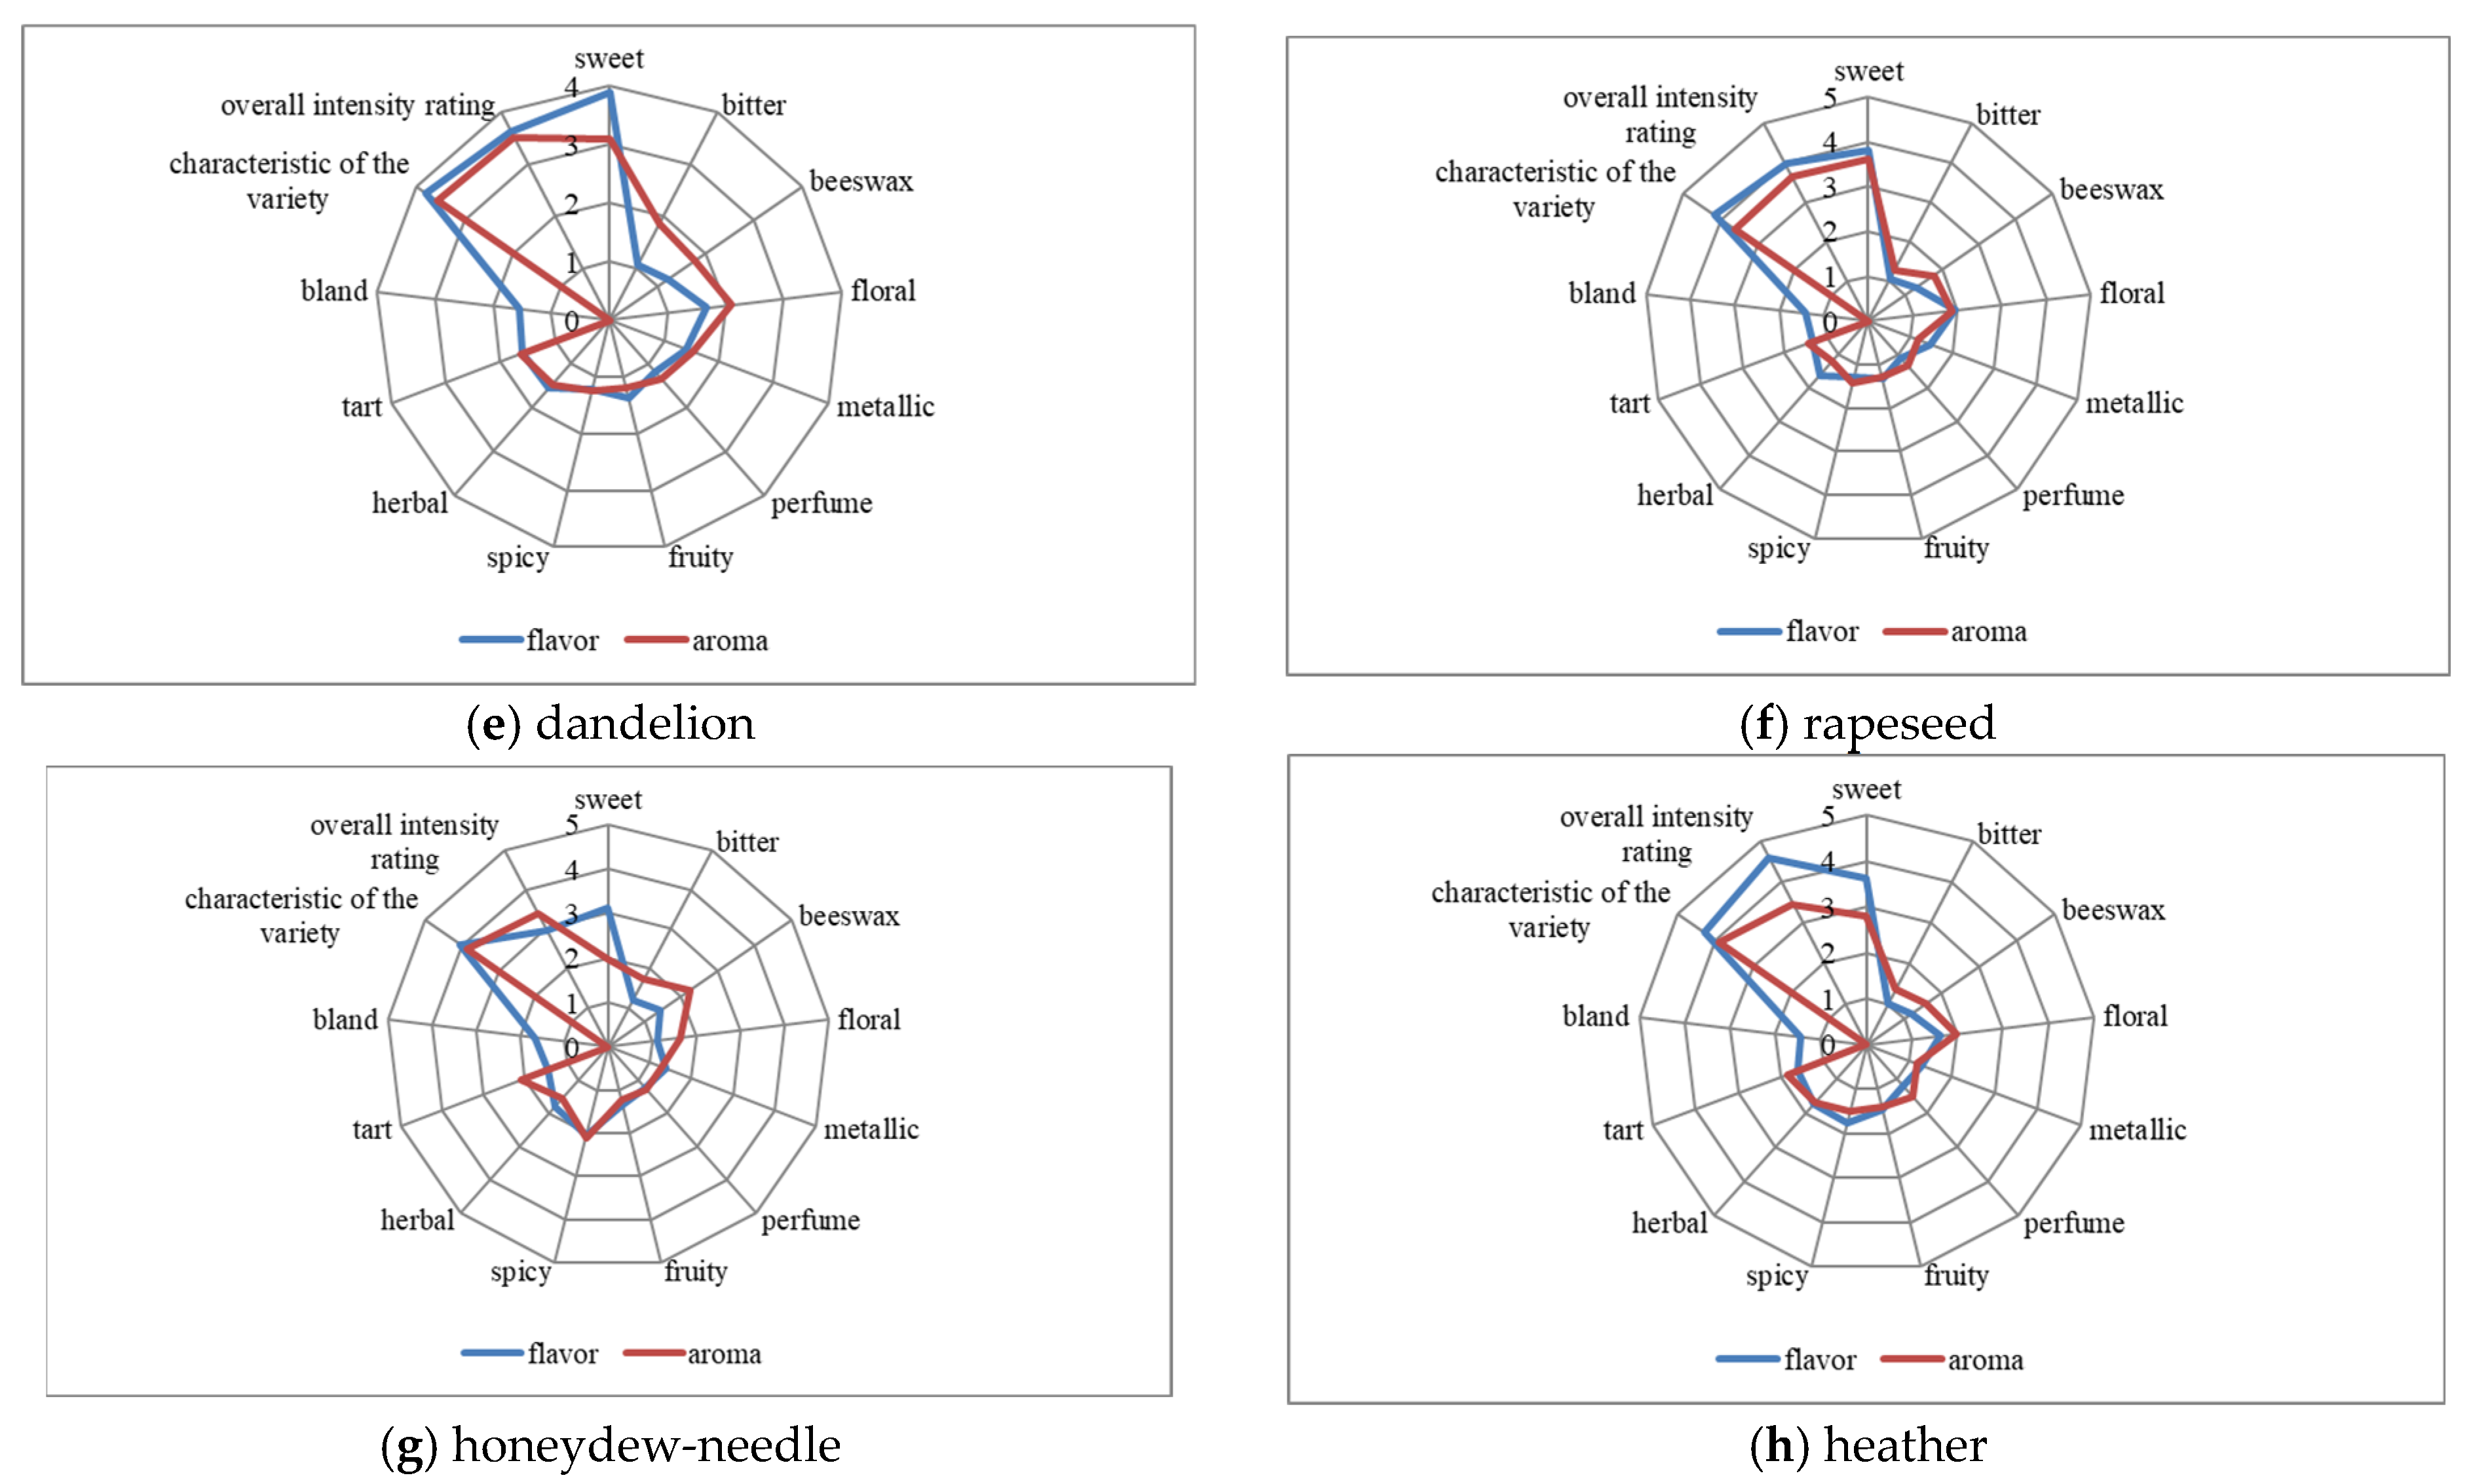
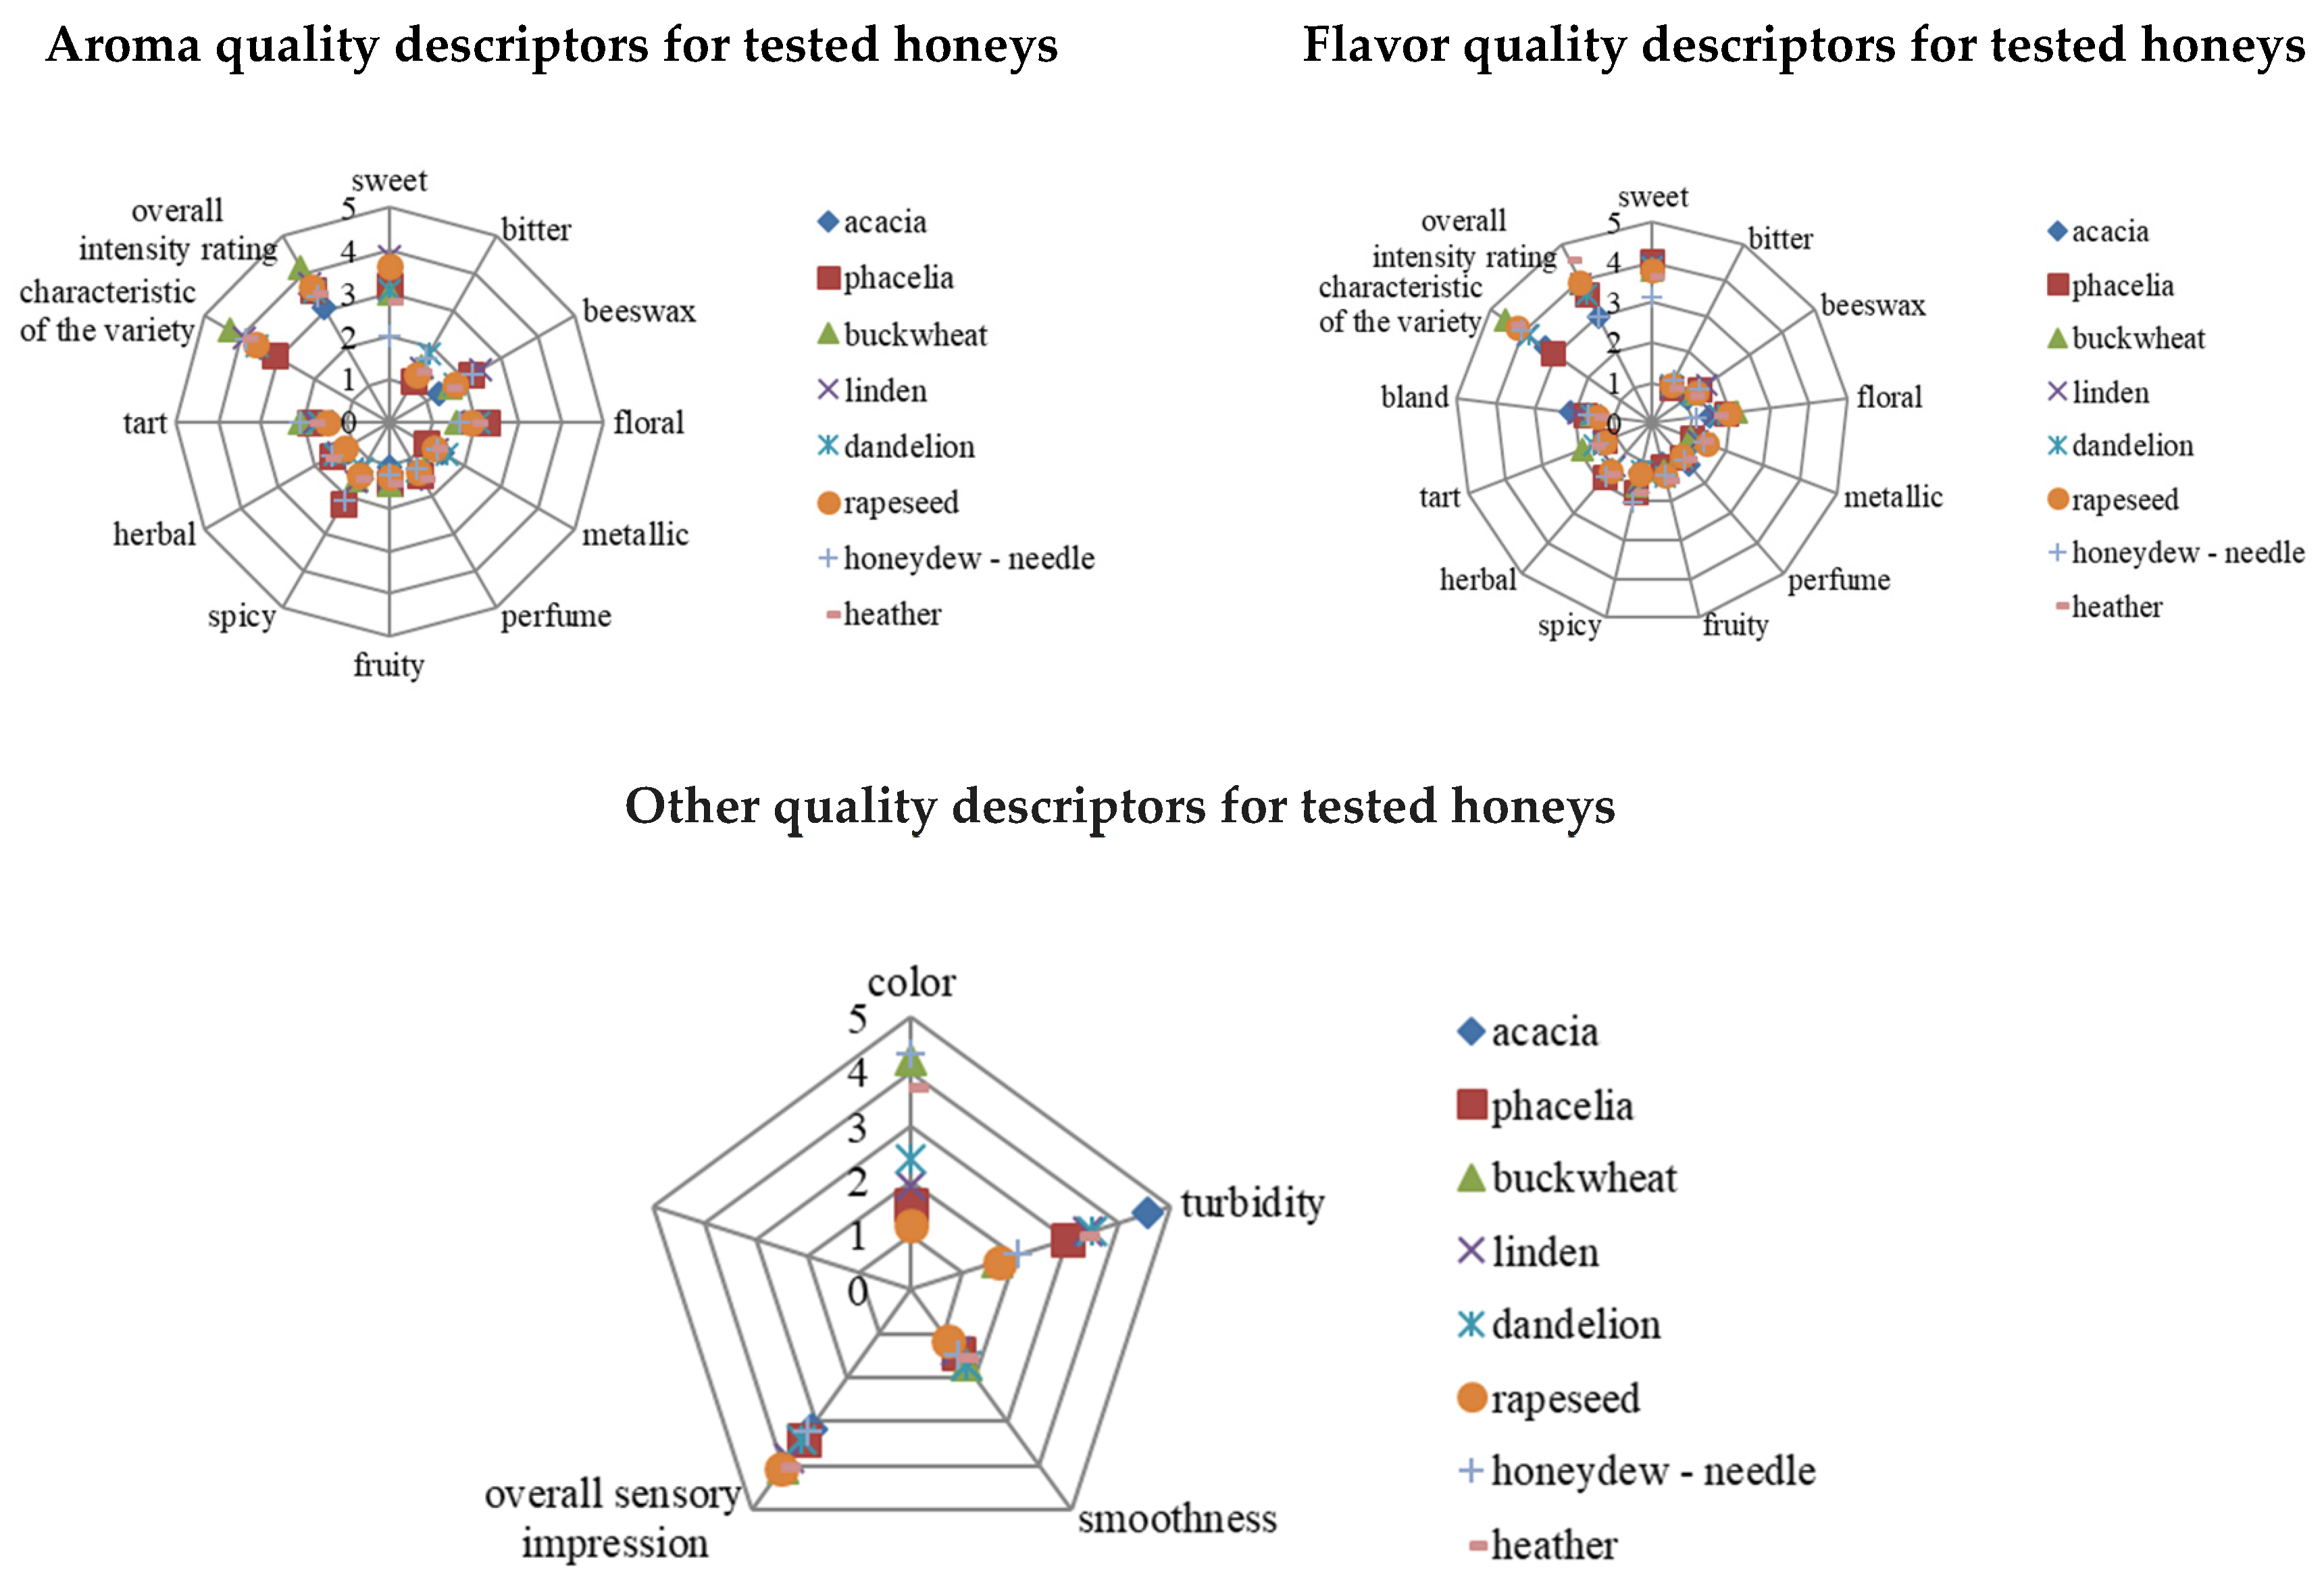
The results of the sensory analysis of honeys are presented in Figure 1 and Figure 2. This begins the attempt to create sensory profiles of honeys. In Figure 1, you can see the various flavor profiles for each variety, marked with a blue line. Additionally, aroma profiles for the varietal honeys were prepared, marked in red in the figures below. Based on the statistical analysis of the results, it was found that all descriptors of the sensory evaluation of varietal honeys are the result of the formation of individual features in a given group.
Both taste and smell, taking into account detailed descriptors characteristic of honeys, occur in each variety with different intensity (Figure 1 and Figure 2). This differentiation was statistically significant (p ≤ 0.05). Only in the case of the occurrence of both the taste and the perfume and herbal smell, the same intensity was found in all honey varieties (p > 0.05).
Analysis of honey aroma descriptors in profiling their characteristic varietal features, the characteristic features of honey varieties (Figure 1). The most intense taste features were indicated for:
sweet aroma—lime honeys (average 3.87 ± 0.84 points) and rapeseed honeys (average 3.63 ± 0.97 points);
bitter aroma—dandelion honeys (average 1.86 ± 1.29 points) and honeydew-conifer honeys (average 1.71 ± 0.77 points);
beeswax aroma—lime honeys (average 2.43 ± 1.42 points), honeydew and conifer honeys (average 2.25 ± 1.34 points) and phacelia honeys (average 2.21 ± 1.12 points);
floral aroma—phacelia honeys (average 2.27 ± 1.35 points);
metallic aroma—dandelion honeys (average 1.53 ± 1.14 points);
fruit aroma—heather honeys (average 1.40 ± 0.65 points), phacelia honeys (average 1.40 ± 0.82 points) and buckwheat honeys (average 1.44 ± 0.84 points);
spicy aroma—honeydew-conifer honeys (average 2.10 ± 0.77 points) and phacelia honeys (average 2.18 ± 1.22 points);
herbal aroma—heather honeys (average 1.68 ± 0.73 points);
tart taste—buckwheat honeys (average 2.08 ± 1.37 points), honeydew honeys and coniferous (2.09 ± 1.25 points);
The average rank values and arithmetic means indicate that the strongest variety-specific aroma was observed in buckwheat honeys (mean score: 4.30 ± 0.85). Lime, honeydew, and heather honeys also formed a distinct group, with an average aroma intensity of approximately 3.9 points. Buckwheat honeys received the highest overall aroma intensity rating (4.15 ± 0.86), while acacia honeys were rated the lowest (3.08 ± 0.85). The intensity of aroma notes in honeys, which did not exceed an average value of 1.5 points, indicates that it was practically absent for the assessors.
Analyzing the significance of honey flavor descriptors in profiling their characteristic varietal features, the characteristic features of honey varieties were indicated (Figure 1). The most intense flavor features were indicated for:
sweet flavor in phacelia honeys (average 4.04 ± 0.67 points);
beeswax flavor—lime honeys (average 1.69 ± 0.88 points);
floral flavor—buckwheat honeys (average 2.16 ± 1.38 points), phacelia honeys (1.87 ± 0.89 points) and rapeseed honeys (1.95 ± 0.83 points);
tart flavor—buckwheat honeys (average 1.91 ± 1 points);
bland flavor—acacia honeys (2.11 ± 1.17 points);
spicy taste—honeydew honeys (average 2.05 ± 0.98 points), heather honeys (average 1.76 ± 1.24 points), phacelia (average 1.77 ± 0.92 points);
herbal taste—phacelia honeys (1.82 ± 1.12 points) and heather honeys (1.72 ± 1.04 points).
Regarding the intensity of the variety-specific taste, the highest scores were recorded for buckwheat honeys (mean: 4.53 ± 0.66). Honeys of other varieties generally exhibited slightly lower taste intensity, such as rapeseed honeys, which scored 4.18 ± 1.05. The highest overall taste intensity was noted in heather honeys (4.59 ± 0.67), while the lowest ratings were observed for acacia and honeydew honeys (mean: 2.96). In the case of a taste note intensity not exceeding an average value of 1.5 points. It was assumed that this taste was practically absent. Additionally, the bitter taste was not tested due to the slight variability of individual results. In five honey varieties, none of the assessors found the presence of this taste.
Statistical analysis showed that the differences in such quality descriptors as color, transparency, graininess (smoothness) and overall assessment depending on the variety are statistically significant (p ≤ 0.05). Data are presented in Figure 1. In the case of honey color, it was noted that the assessors indicated buckwheat honeys (4.22 ± 0.92 points) and honeydew honeys (4.34 ± 0.73 points) as dark. Rapeseed honeys (1.19 ± 0.4 points) were indicated as the lightest. Acacia honeys (4.55 ± 0.57 points) were assessed as the most transparent, while buckwheat honeys (1.67 ± 0.66 points) and rapeseed honeys (1.68 ± 1.11 points) had the lowest level of transparency—they were the most cloudy. In the case of the presence of lumps (graininess), their highest presence was indicated in the case of buckwheat honeys (1.74 ± 0.98 points) and dandelion honeys (1.71 ± 071 points), and the lowest in the case of rapeseed honeys (1.16 ± 0.37 points). A low level of assessment of this feature indicates that the honeys had unnoticeable or very faint lumps and were smooth.
The highest overall assessment of the sensory impression was characterized by the following honeys:
buckwheat (4.04 ± 0.81 points),
rapeseed (4.08 ± 0.71 points),
heather (4 ± 0.83 points).
The lowest overall sensory impression rating was given to the following honeys:
acacia (average 3.15 ± 0.66 points),
honeydew and coniferous (average 3.24 ± 0.7 points).
The assessed descriptors differ between varieties, and the results for each sample within the variety were averaged. This analysis showed that there are certain main components characteristic of a given variety, e.g., phacelia honeys are characterized by the sweetest taste, and heather honeys are characterized by the highest level of the overall taste assessment for honey. On the other hand, buckwheat honeys are characterized by the highest level of aroma characteristic of the variety (Figure 1 and Figure 2).
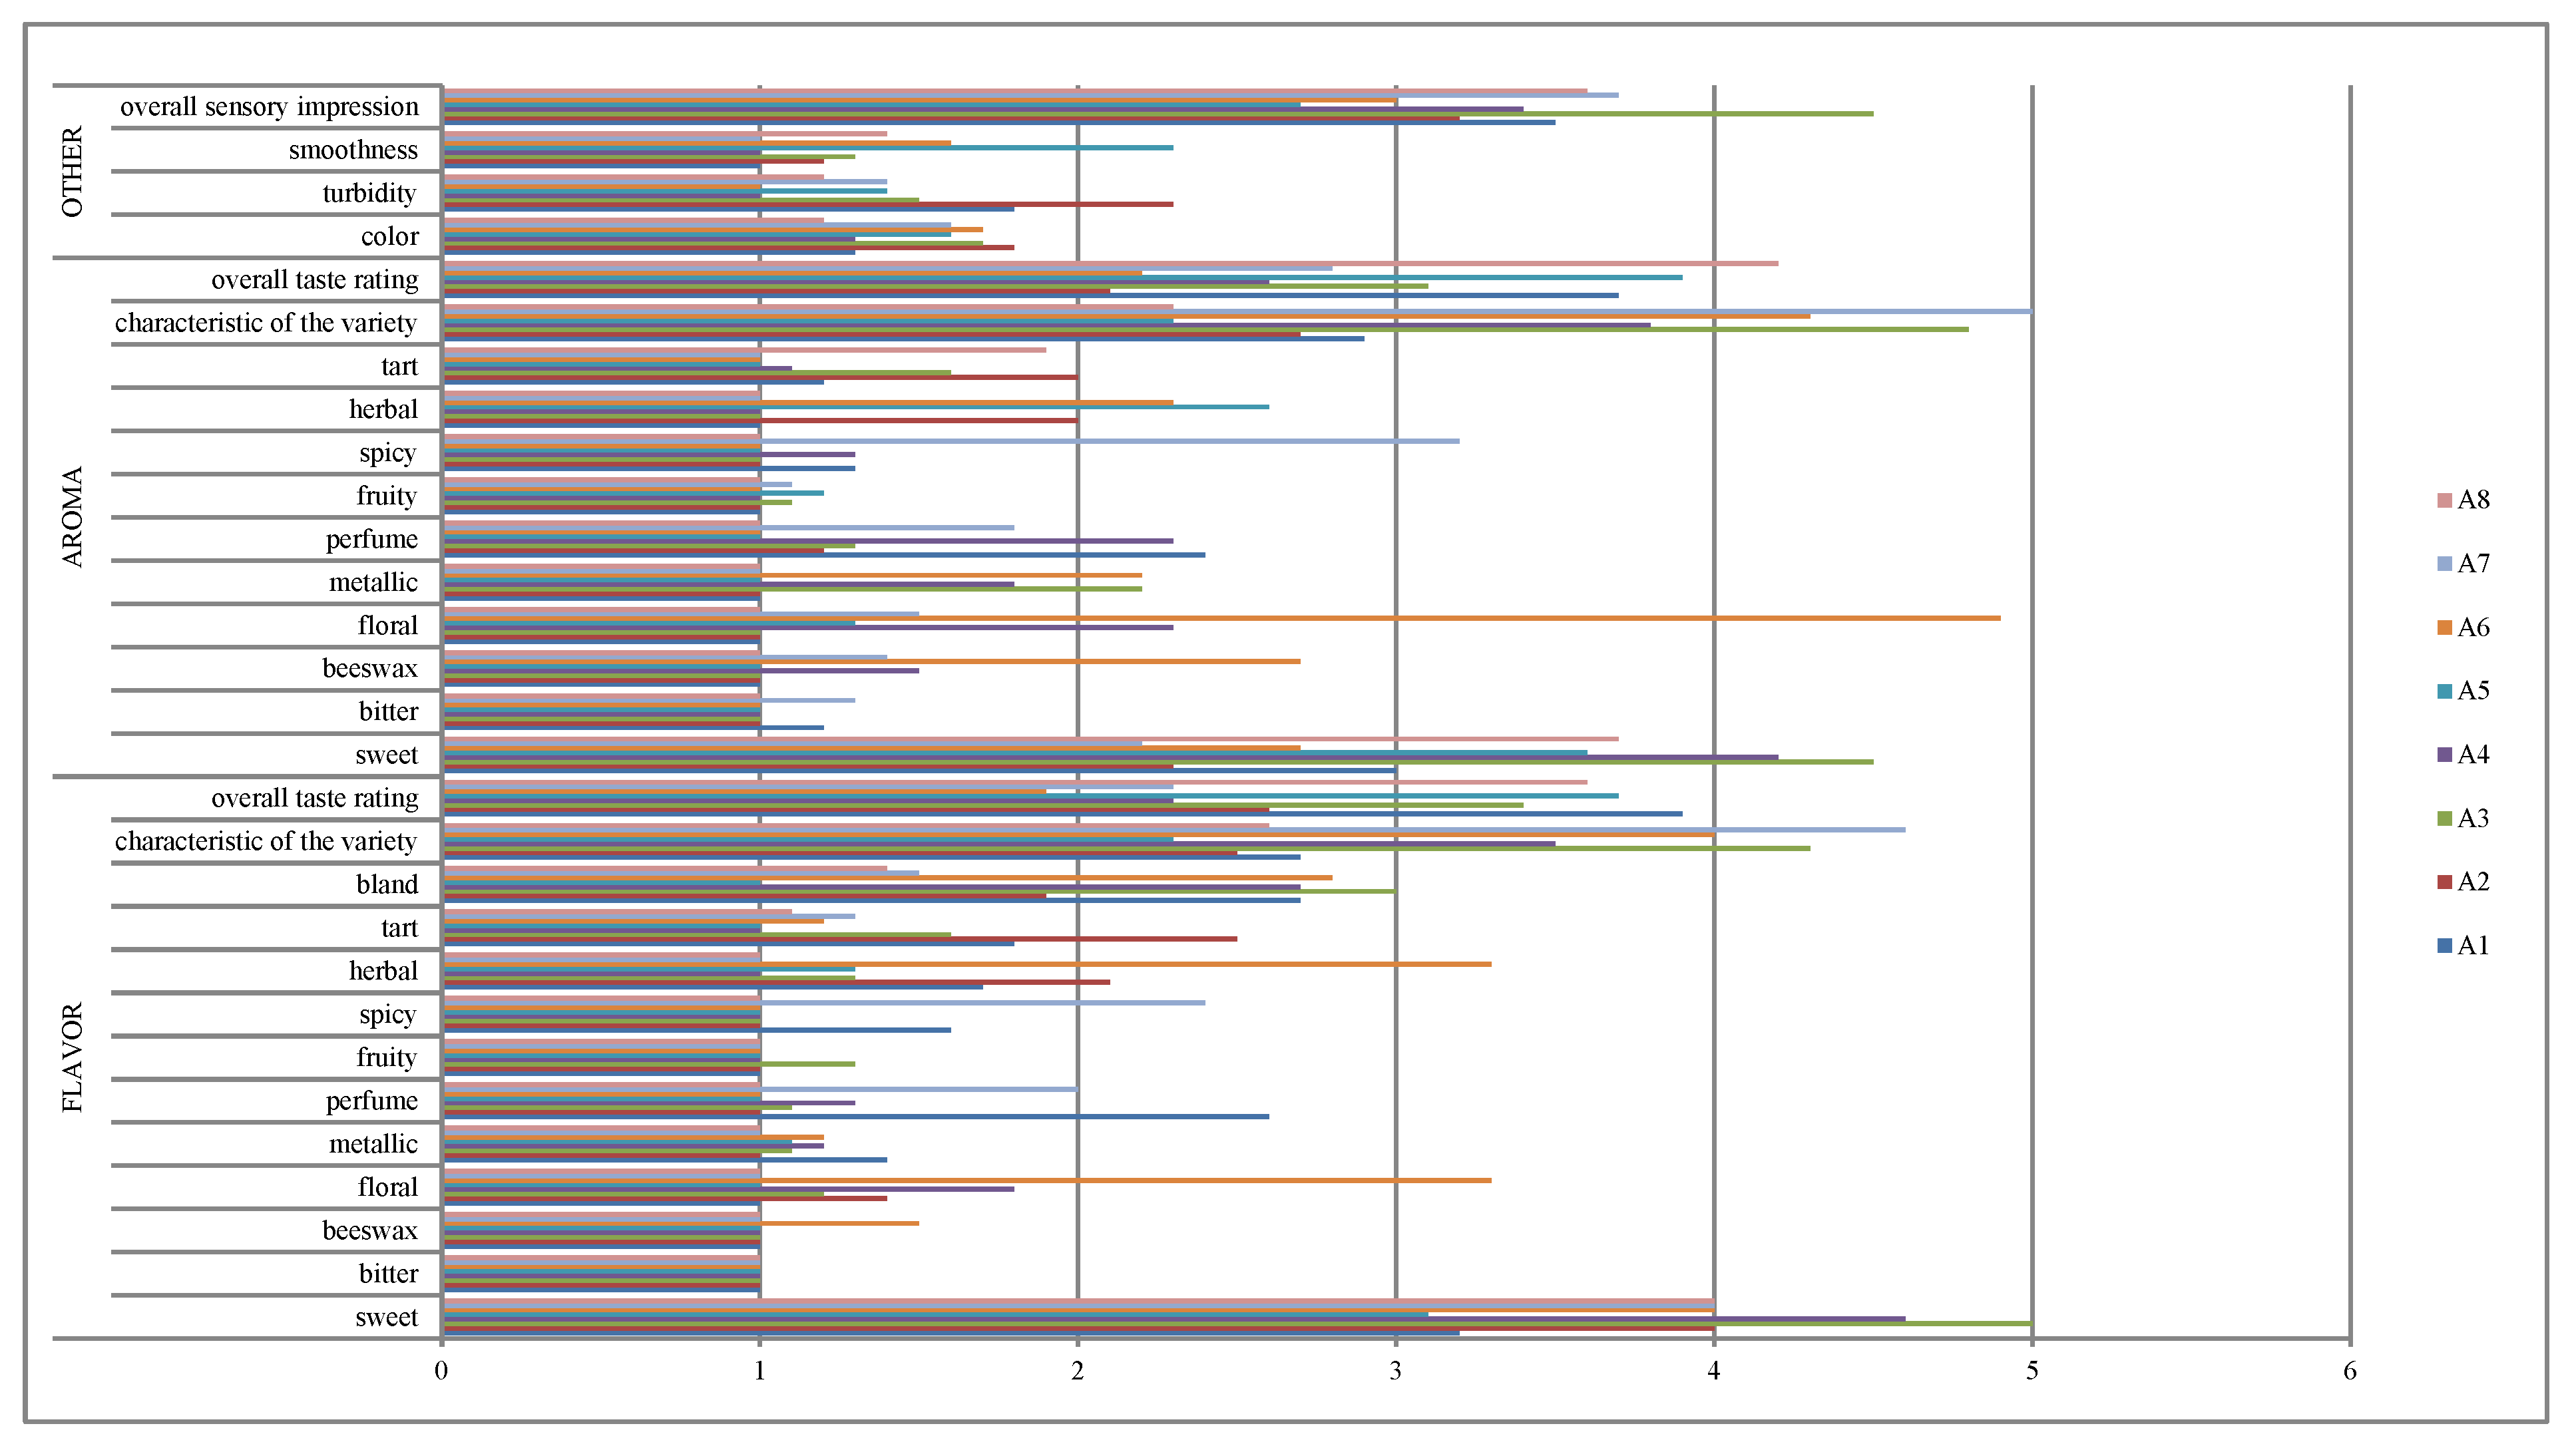
Sensory analysis of seven honey varieties indicates differences in the assessed descriptors of taste, aroma, color, texture and smoothness. Figure 3 shows honey samples of the same botanical origin—acacia honey. Analysis of honey from one botanical origin showed different scales of quality assessment attributes. For example, acacia honeys A3, A6, A7. The sensory profiles created for the specific honeys tested showed that there are some main components that distinguish the honey samples. For example, sample A4 was characterized by the highest level of overall sensory impression, aroma, perfume aroma and taste, and variety-specific taste. The data is presented in Figure 3.

3.2. An Attempt to Create Statistical Tools for Classifying Honey Varieties

The analyses performed above were an introduction to the creation of a statistical tool model. This model aims to clarify and ensure repeatability in classifying honeys into specific sensory profiles for the indicated types of Polish honeys. The assessed quality descriptors were analyzed into those that are important and those that are less important in building the statistical tool. Therefore, the following descriptors were used for further analysis: characteristic taste, taste intensity, smell characteristic of the variety, smell intensity, color, turbidity, and smoothness (Table 4).
In the first stage, the values of basic statistical measures were determined: arithmetic mean ( x ¯ ) and standard deviation (sd). The verification of statistical hypotheses was preceded by examining the compliance of all empirical distributions with the normal distribution. This was performed using the χ2 compliance test. The study showed that all empirical distributions are not identical to the normal distribution; therefore, testing the differentiation of the results of the assessment of individual features depending on the honey variety was performed using the nonparametric Kruskal–Wallis test, with a significance level of α = 0.05. The results are presented in Table 6.
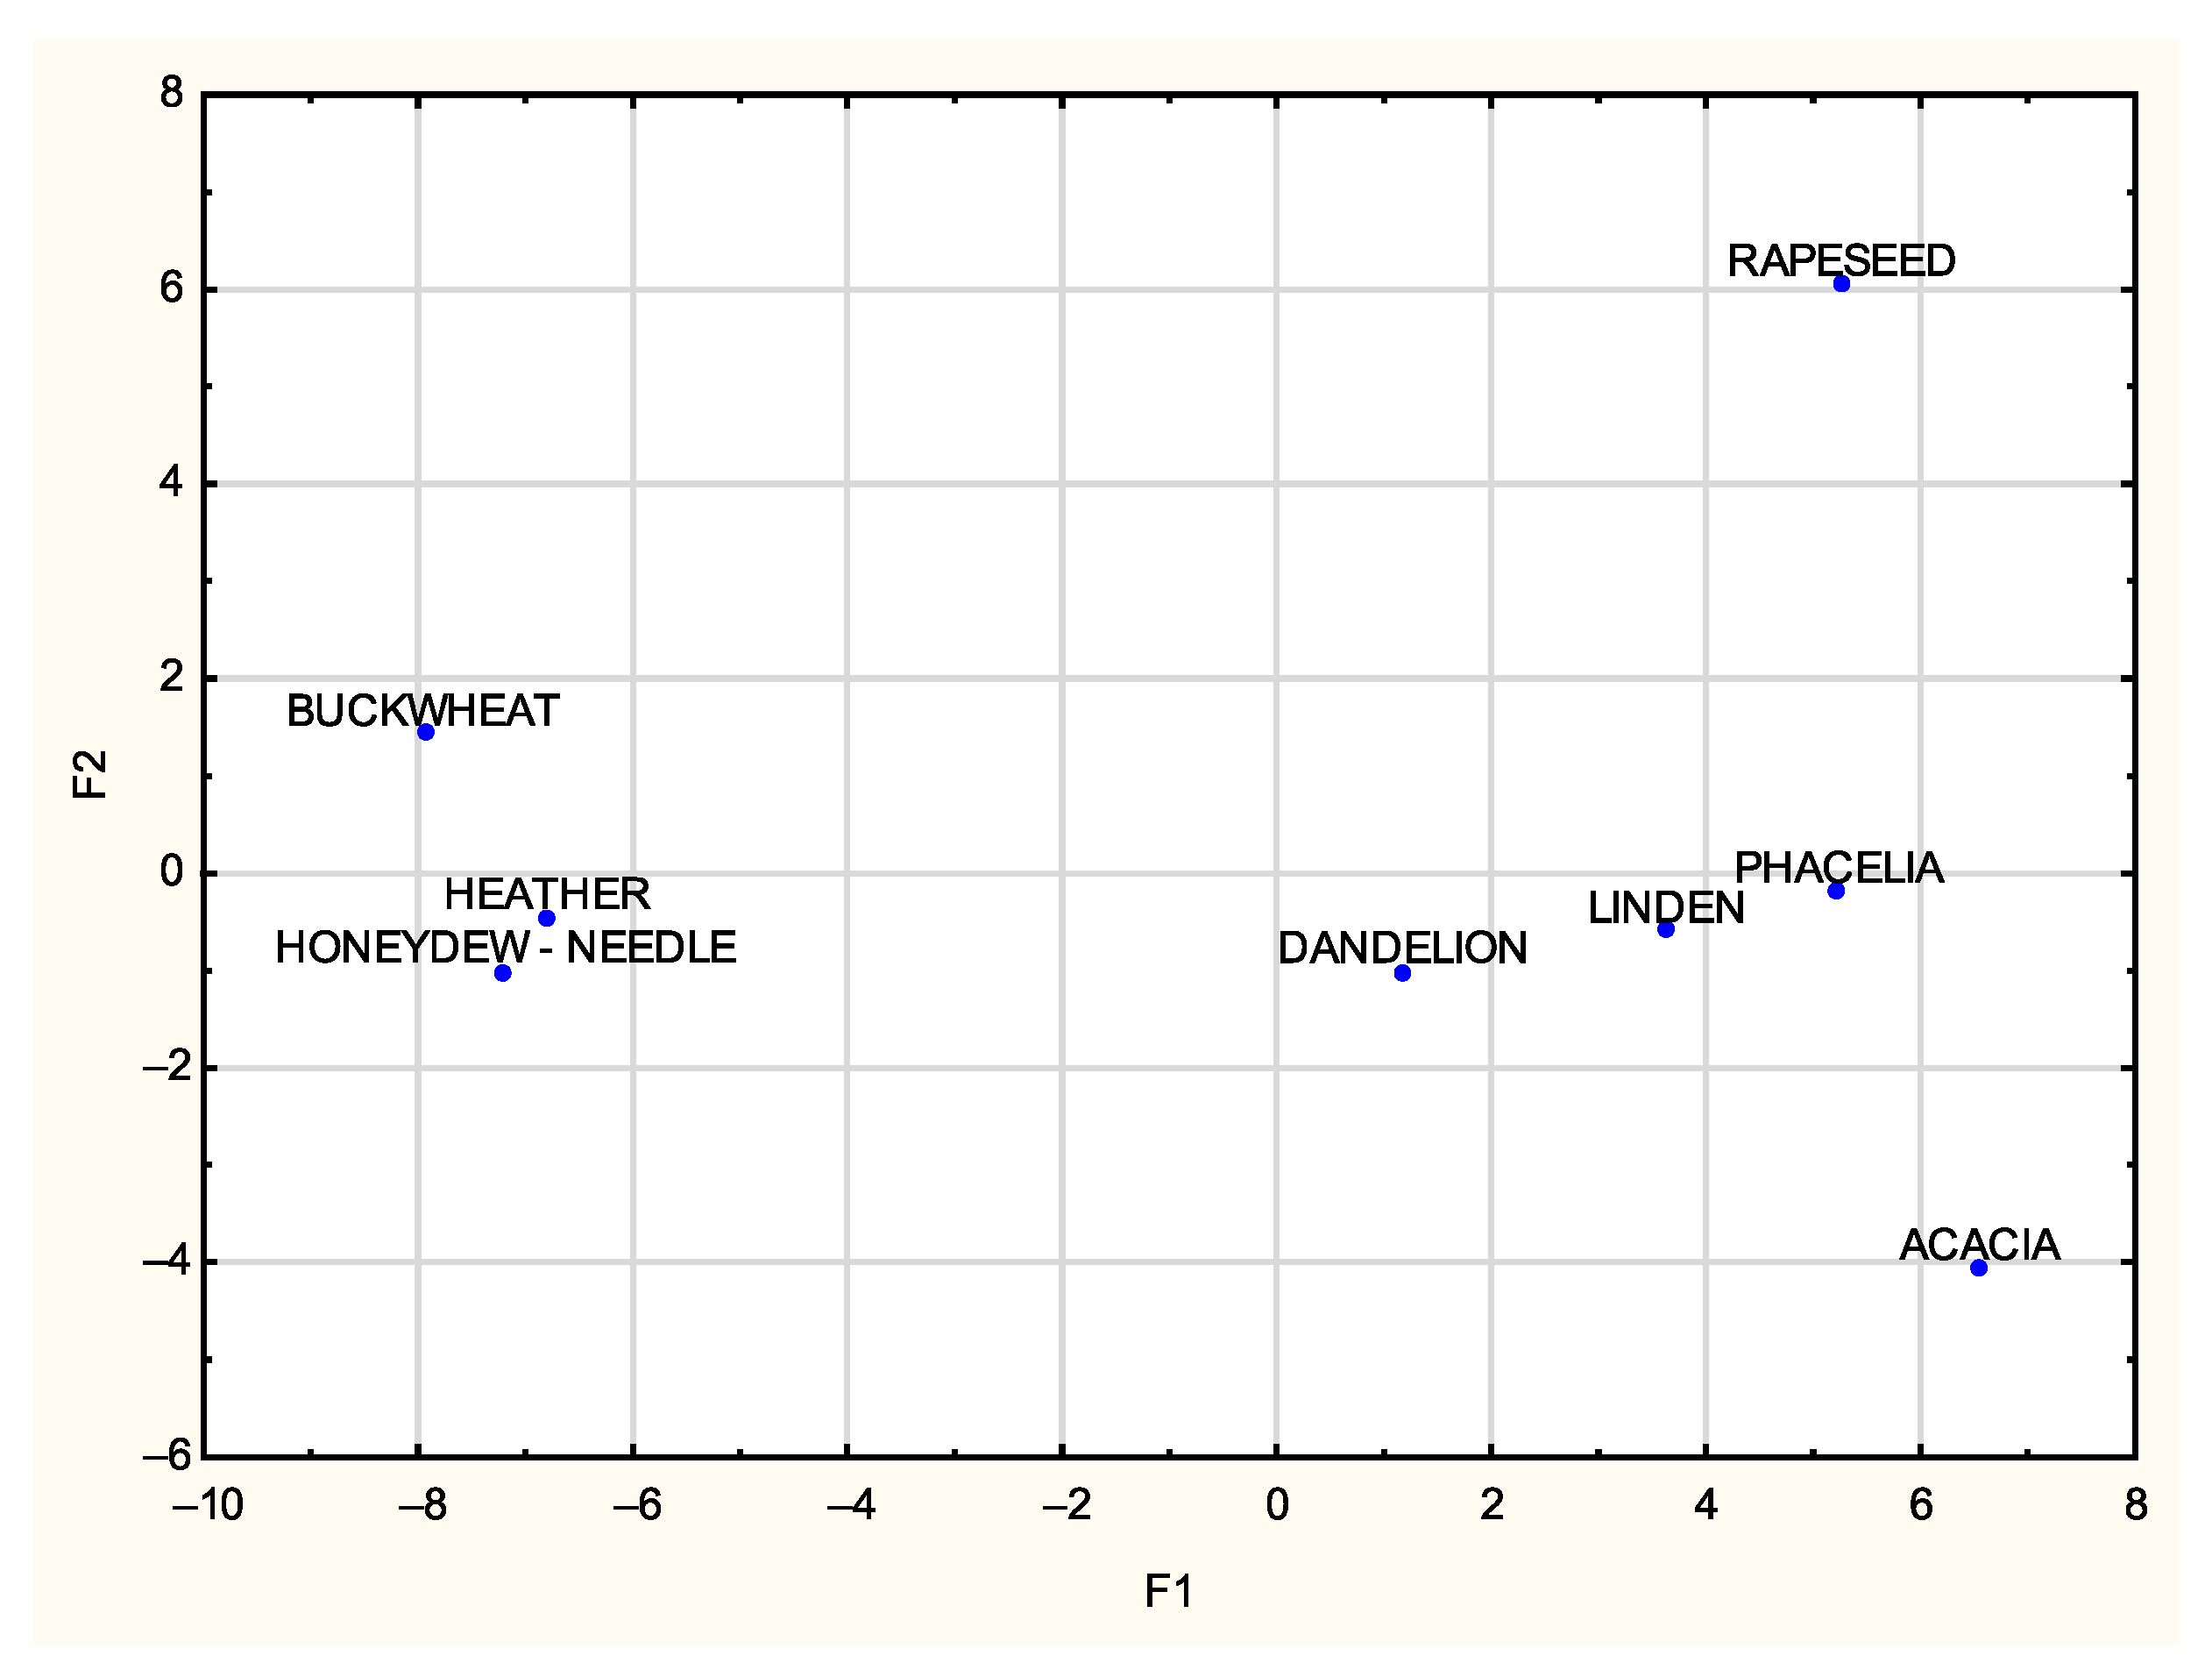
In order to obtain information on botanical differences and their identification based on the evaluation of honey quality descriptors, discriminant analysis was performed. Based on the evaluation, it was verified whether the compared varieties differed in terms of the value of the organoleptic characteristics. Then, canonical discriminant functions were constructed, placing the tested varieties on the plane defined by the first two elements. First, the significance of the discriminant power of seven classification variables (organoleptic characteristics) was tested using the Wilks lambda test. The value of the statistic of this test is 0.0001, the approximate value of the statistic F = 5.724, and the test probability value p < 0.05. Discrimination of honey varieties is therefore highly significant. The analysis of the classification matrix also showed that 100% correct classification of all honey varieties was obtained. Table 7, Table 8 and Figure 4 present the results of the canonical analysis.
Equations:
F1 = 16.66 − 2.44 ∗ CHT − 1.19 ∗ TI + 2.69 ∗ S – 0.90 ∗ SI − 4.76 ∗ C + 0.25 ∗ T + 1.43 ∗ G
F2 = −10.40 + 2.94 ∗ CHT + 1.13 ∗ TI−2.09 ∗ S − 0.57 ∗ SI − 1.25 ∗ C + 2.18 ∗ T + 0.69 ∗ G
(CHT—Characteristic taste, TI—Taste intensity, SI—Smell intensity, T—Turbidity, G—Smoothness)
The equations model presented above allow us to determine the values of F1 and F2. Comparison of these values with the averages of canonical variables (Table 7, Figure 4) allows for identification of the honey variety based on the results of the sensory evaluation (according to the methodology given in the study).

3.3. Discussion

The importance of sensory parameters regarding the quality assessment of varietal honeys can be treated as equal to other designations. Research indicates that both geographical and botanical origin significantly influence the sugar composition and sensory profile of Tanzanian honey [13]. Sensory characteristics have also been shown to be closely associated with specific climatic regions, suggesting that regional environmental conditions play a critical role in shaping flavor and aroma profiles [14]. Furthermore, the place of collection affects the physicochemical properties, microbiological quality and sensory characteristics of honey produced by the Afrotropical stingless bee (Axestotrigona ferruginea). They showed that these factors determine the characteristic for each independent variable in the honeys studied [15].
Physicochemical and sensory analyses of honeys from specific regions, such as the eastern part of Formosa Province (Argentina), suggest that unambiguous classification of honeys based solely on botanical origin remains a challenge. It has been proposed that such classification should be supported by additional analytical parameters, such as antioxidant activity or polyphenol content, to provide sufficient information for distinguishing monofloral from multifloral honeys and to strengthen the determination of regional identity [16]. An attempt to create sensory and chemical profiles of Finnish honeys of different botanical origins has shown that there are possibilities to confirm the varieties of buckwheat honeys that have very characteristic sensory features [17].
An attempt to identify sensory profiles using molecular sensory science was made by Mahmoud et al. The team used techniques such as GC (Gas Chromatography) and GC-O (Gas Chromatography–Olfactometry) in combination with odor activity values (OAV), skip tests and aroma recombination analysis, which plays a key role in distinguishing aroma and aroma compounds in food. The above study did not provide a clear possibility to create sensory profiles of varietal honeys. As a result of the analysis conducted by the authors, it was concluded that it is important to conduct further studies on the creation of sensory profiles of honeys of diverse geographical and botanical origins in the authentication and quality control of unique regional honey products [18].
Sensory evaluation was also used in the certification of the geographical origin of honey produced in the Rtanj Mountains region (Serbia). The above studies allowed to indicate the levels of parameters indicating characteristic features of honey, such as: smell (general, fresh, herbs, fruits), taste (general, fresh, herbs, fruits, stability) and levels of other parameters: sweetness, brightness, astringency, viscosity, pungency, crystal sharpness, burning sensation [19].
Subsequent research has shown the possibility of supporting the honey evaluation process using statistical tools. The geographical origin of chestnut honeys from the Hszpan area was confirmed, but also differentiated between the three locations by means of sensory characteristics and chemical properties of chestnut honeys. The authors showed that multivariate statistical analysis was a helpful tool in determining the differences between production zones, which allowed for the effective differentiation of chestnut honeys from different geographical areas according to their volatile composition and sensory description [20].
The effectiveness of sensory methods was also demonstrated by a team that attempted sensory mode analysis based on aroma compounds assessed using a colorimetric sensor array, sensory analysis, and GC–MS (Gas Chromatography–Mass Spectrometry) analysis combined with multivariate analysis. The team demonstrated good relationships between GC–MS and sensory evaluation. There was decent agreement between the colorimetric sensor array, sensory analysis, and GC–MS data, indicating that the colorimetric sensor array is effective in discriminating between honeys of different botanical origins [21].
Sensory evaluation enables support of pollen analysis methods in the assessment of the botanical origin of honey. As shown by the research of the Danish team. In the following studies, an attempt was made to identify characteristic features of Danish honeys from various regions of Denmark. In addition to the dust method, sensory evaluation, and statistical methods (PCA—Principal Component Analysis, ANOVA–APLSR—Analysis of Variance) were also used to precisely analyze the results [7].
The evaluation of sensory characteristics of varietal honeys allows for the creation of sensory profiles of each variety, along with an indication of botanical differences in each variety. Additionally, this study presents a universal tool—a statistical model that enables the grouping of sensory attributes into profiles specific to each honey variety. This approach ensures the repeatability of results and provides a means to verify the varietal authenticity of the honeys.

4. Conclusions

The results of this study clearly demonstrate that sensory analysis is an effective tool for distinguishing between different varieties of honey. Statistically significant differences (p ≤ 0.05) were observed among the tested samples in terms of taste, aroma, color, turbidity, and consistency, confirming the presence of distinctive sensory profiles characteristic of each botanical origin. Specific flavor and aroma attributes were identified for individual varieties, with buckwheat honey showing the most intense variety-specific notes, phacelia honey scoring highest in sweetness, and heather honey demonstrating the greatest overall flavor intensity. Lime honey was notable for its pronounced waxy and sweet aroma, while rapeseed honey was characterized by its light color and high turbidity.
The highest overall sensory quality scores were assigned to buckwheat, rapeseed, and heather honeys, whereas acacia and coniferous honeydew honeys received the lowest ratings.
The above results confirm the presence of substances characteristic of honeys that create the taste and aroma profiles of varietal honeys, e.g., in the case of the aromatic sensory marker of buckwheat honey, which is p-anisaldehyde (4-methoxybenzaldehyde).
The application of the Kruskal–Wallis test confirmed the discriminative power of all evaluated quality parameters. Furthermore, canonical discriminant analysis validated the potential to classify honey varieties based on their sensory attributes. These findings support the development of a universal statistical model as a reliable tool for botanical authentication of honeys, which can be further refined and adapted to diverse floral sources.
This study represents a pilot investigation that should be expanded in future research. Several limitations can be identified: limited sample scope (the study included selected honey varieties available in Poland; however, the sample size as well as botanical and geographical representativeness were limited, which may restrict the generalizability of the results to broader honey populations), lack of comprehensive chemical analysis (the study primarily focused on sensory and statistical analyses without incorporating a full chemical profile of aroma and flavor compounds, limiting the ability to fully explain the observed sensory differences), and preliminary nature of the statistical model (the developed discriminant analysis model is exploratory and requires further validation on larger and more diverse datasets; the current version may be sensitive to data variability and does not guarantee high accuracy for practical applications).
Experience clearly indicates the need to combine sensory analysis with instrumental methods and to employ advanced multivariate techniques for validating predictive models, such as principal component analysis (PCA) and machine learning algorithms. This will constitute the next phase of the research. Additionally, including a greater number of samples from across Poland and abroad would provide an international dimension to the study.

Author Contributions

Conceptualization, N.Ż. and A.W.; methodology N.Ż. and A.W.; formal analysis, N.Ż. and A.W.; investigation, N.Ż.; data curation, N.Ż. and A.W.; writing—original draft preparation, N.Ż. and A.W.; writing—review and editing, N.Ż.; supervision, A.W.; All authors have read and agreed to the published version of the manuscript.

Funding

This research was supported by the Gdynia Maritime University (projects: WZNJ/2025/PZ/01, WZNJ/2025/PI/01).

Data Availability Statement

The original contributions presented in this study are included in the article. Further inquiries can be directed to the corresponding author.

Conflicts of Interest

The authors declare no conflicts of interest.

References

  1. Council Directive 2014/63/EC of the European Parliament and of the Council of 15 May 2014 Amending Council Directive 2001/110/EC Relating to Honey; European Parliament: Luxembourg, 2014.
  2. Bose, D.; Padmavati, M. Honey Authentication: A review of the issues and challenges associated with honey adulteration. Food Biosci. 2024, 61, 105004. [Google Scholar] [CrossRef]
  3. Cuevas-Glory, L.F.; Pino, J.A.; Santiago, L.S.; Sauri-Duch, E. A review of volatile analytical methods for determining the botanical origin of honey. Food Chem. 2007, 103, 1032–1043. [Google Scholar] [CrossRef]
  4. Wilczyńska, A.; Żak, N. Polyphenols as the Main Compounds Influencing the Antioxidant Effect of Honey—A Review. Int. J. Mol. Sci. 2024, 25, 10606. [Google Scholar] [CrossRef] [PubMed]
  5. Escriche, I.; Juan-Borrás, M.; Visquert, M.; Valiente, J.M. An overview of the challenges when analysing pollen for monofloral honey classification. Food Control 2023, 143, 109305. [Google Scholar] [CrossRef]
  6. Ntakoulas, D.D.; Tsagkaris, A.S.; Raptis, S.; Pasias, I.N.; Raptopoulou, K.G.; Kharoshka, A.; Proestos, C. Study of authenticity, quality characteristics and bioactivity in honey samples from different botanical origins and countries. J. Food Comp. Anal. 2024, 136, 106716. [Google Scholar] [CrossRef]
  7. Stolzenbach, S.; Byrne, D.V.; Bredie, W.L.P. Sensory local uniqueness of Danish honeys. Food Res. Int. 2011, 44, 2766–2774. [Google Scholar] [CrossRef]
  8. Regulation of the Ministry of Agriculture and Rural Development of 3 October 2003 on Detailed Requirements Concerning the Commercial Quality of Honey (Polish Journal of Laws 2023, Item 2513). 2023. Available online: https://www.ecolex.org/details/legislation/regulation-on-detailed-requirements-for-commercial-quality-of-honey-lex-faoc060166/?type=decision&xcountry=Brazil&xpage=3 (accessed on 12 August 2025).
  9. PN-88/A-77626; Polish Standard for the Properties of Honey. Wydawnictwo Normalizacyjne Alfa: Warszawa, Poland, 1998.
  10. Semkiw, P. Stan Pszczelarstwa W Polsce W 2024 R. Available online: https://www.inhort.pl/wp-content/uploads/2025/01/8.2_2024_Raport_stan_pszczelarstwa.pdf (accessed on 15 July 2025).
  11. Starowicz, M.; Lamparski, G.; Ostaszyk, A.; Szmatowicz, B. Quality evaluation of polish honey: On-line survey, sensory study, and consumer acceptance. J. Sens. Stud. 2021, 36, 10. [Google Scholar] [CrossRef]
  12. Kardas, M.; Staśkiewicz-Bartecka, W.; Sołtys, K.; Dul, L.J.; Sapała, A.M.; Kiciak, A.; Bielaszka, A.; Kardas, J. The quality of selected raw and pasteurized honeys based on their sensory profiles and consumer preferences. Front. Nutr. 2024, 10, 1330307. [Google Scholar] [CrossRef] [PubMed]
  13. Mongi, R.J.; Ruhembe, C.C. Sugar profile and sensory properties of honey from different geographical zones and botanical origins in Tanzania. Heliyon 2024, 10, e38094. [Google Scholar] [CrossRef] [PubMed]
  14. Vosoghi, M.; Yousefi, S.; Honarvar, M. Physicochemical and Sensory Properties of Honey Powder from Different Climatic Regions. Appl. Food Res. 2025, 5, 100843. [Google Scholar] [CrossRef]
  15. Manoko, M.L.K.; Mduda, C.A. Harvesting location influences the physicochemical properties, microbiological quality and sensory attributes of honey produced by an Afrotropical stingless bee, Axestotrigona ferruginea. Food Hum. 2024, 3, 100433. [Google Scholar] [CrossRef]
  16. Cabrera, M.; Santander, E. Physicochemical and sensory analysis of honeys from eastern Formosa province (Argentina) and its relationship with their botanical origin. Food Chem. Adv. 2022, 1, 100026. [Google Scholar] [CrossRef]
  17. Kortesniemi, M.; Rosenvald, S.; Laaksonen, O.; Vanag, A.; Ollikka, T.; Vene, K.; Yang, B. Sensory and chemical profiles of Finnish honeys of different botanical origins and consumer preferences. Food Chem. 2018, 246, 351–359. [Google Scholar] [CrossRef] [PubMed]
  18. Mahmoud, M.A.A.; Kılıç-Büyükkurt, Ö.; Fotouh, M.M.A.; Selli, S. Aroma active compounds of honey: Analysis with GC-MS, GC-O, and molecular sensory techniques. J. Food Comp. Anal. 2024, 134, 106545. [Google Scholar] [CrossRef]
  19. Sakač, M.; Novaković, A.; Ikonić, P.; Peulić, T.; Škrobot, D.; Radišić, P.; Šikoparija, B.; Jovanov, P.; Maravić, N.; Marić, A. Geographical origin authentication of honey produced in the region of Rtanj Mountain (Serbia). J. Food Comp. Anal. 2024, 129, 106088. [Google Scholar] [CrossRef]
  20. Castro-Vázquez, L.; Díaz-Maroto, M.C.; de Torres, C.; Pérez-Coello, M.S. Effect of geographical origin on the chemical and sensory characteristics of chestnut honeys. Food Res. Int. 2010, 43, 2335–2340. [Google Scholar] [CrossRef]
  21. Tahir, H.E.; Xiaobo, Z.; Xiaowei, H.; Jiyong, S.; Mariod, A.A. Discrimination of honeys using colorimetric sensor arrays, sensory analysis and gas chromatography techniques. Food Chem. 2016, 206, 37–43. [Google Scholar] [CrossRef] [PubMed]
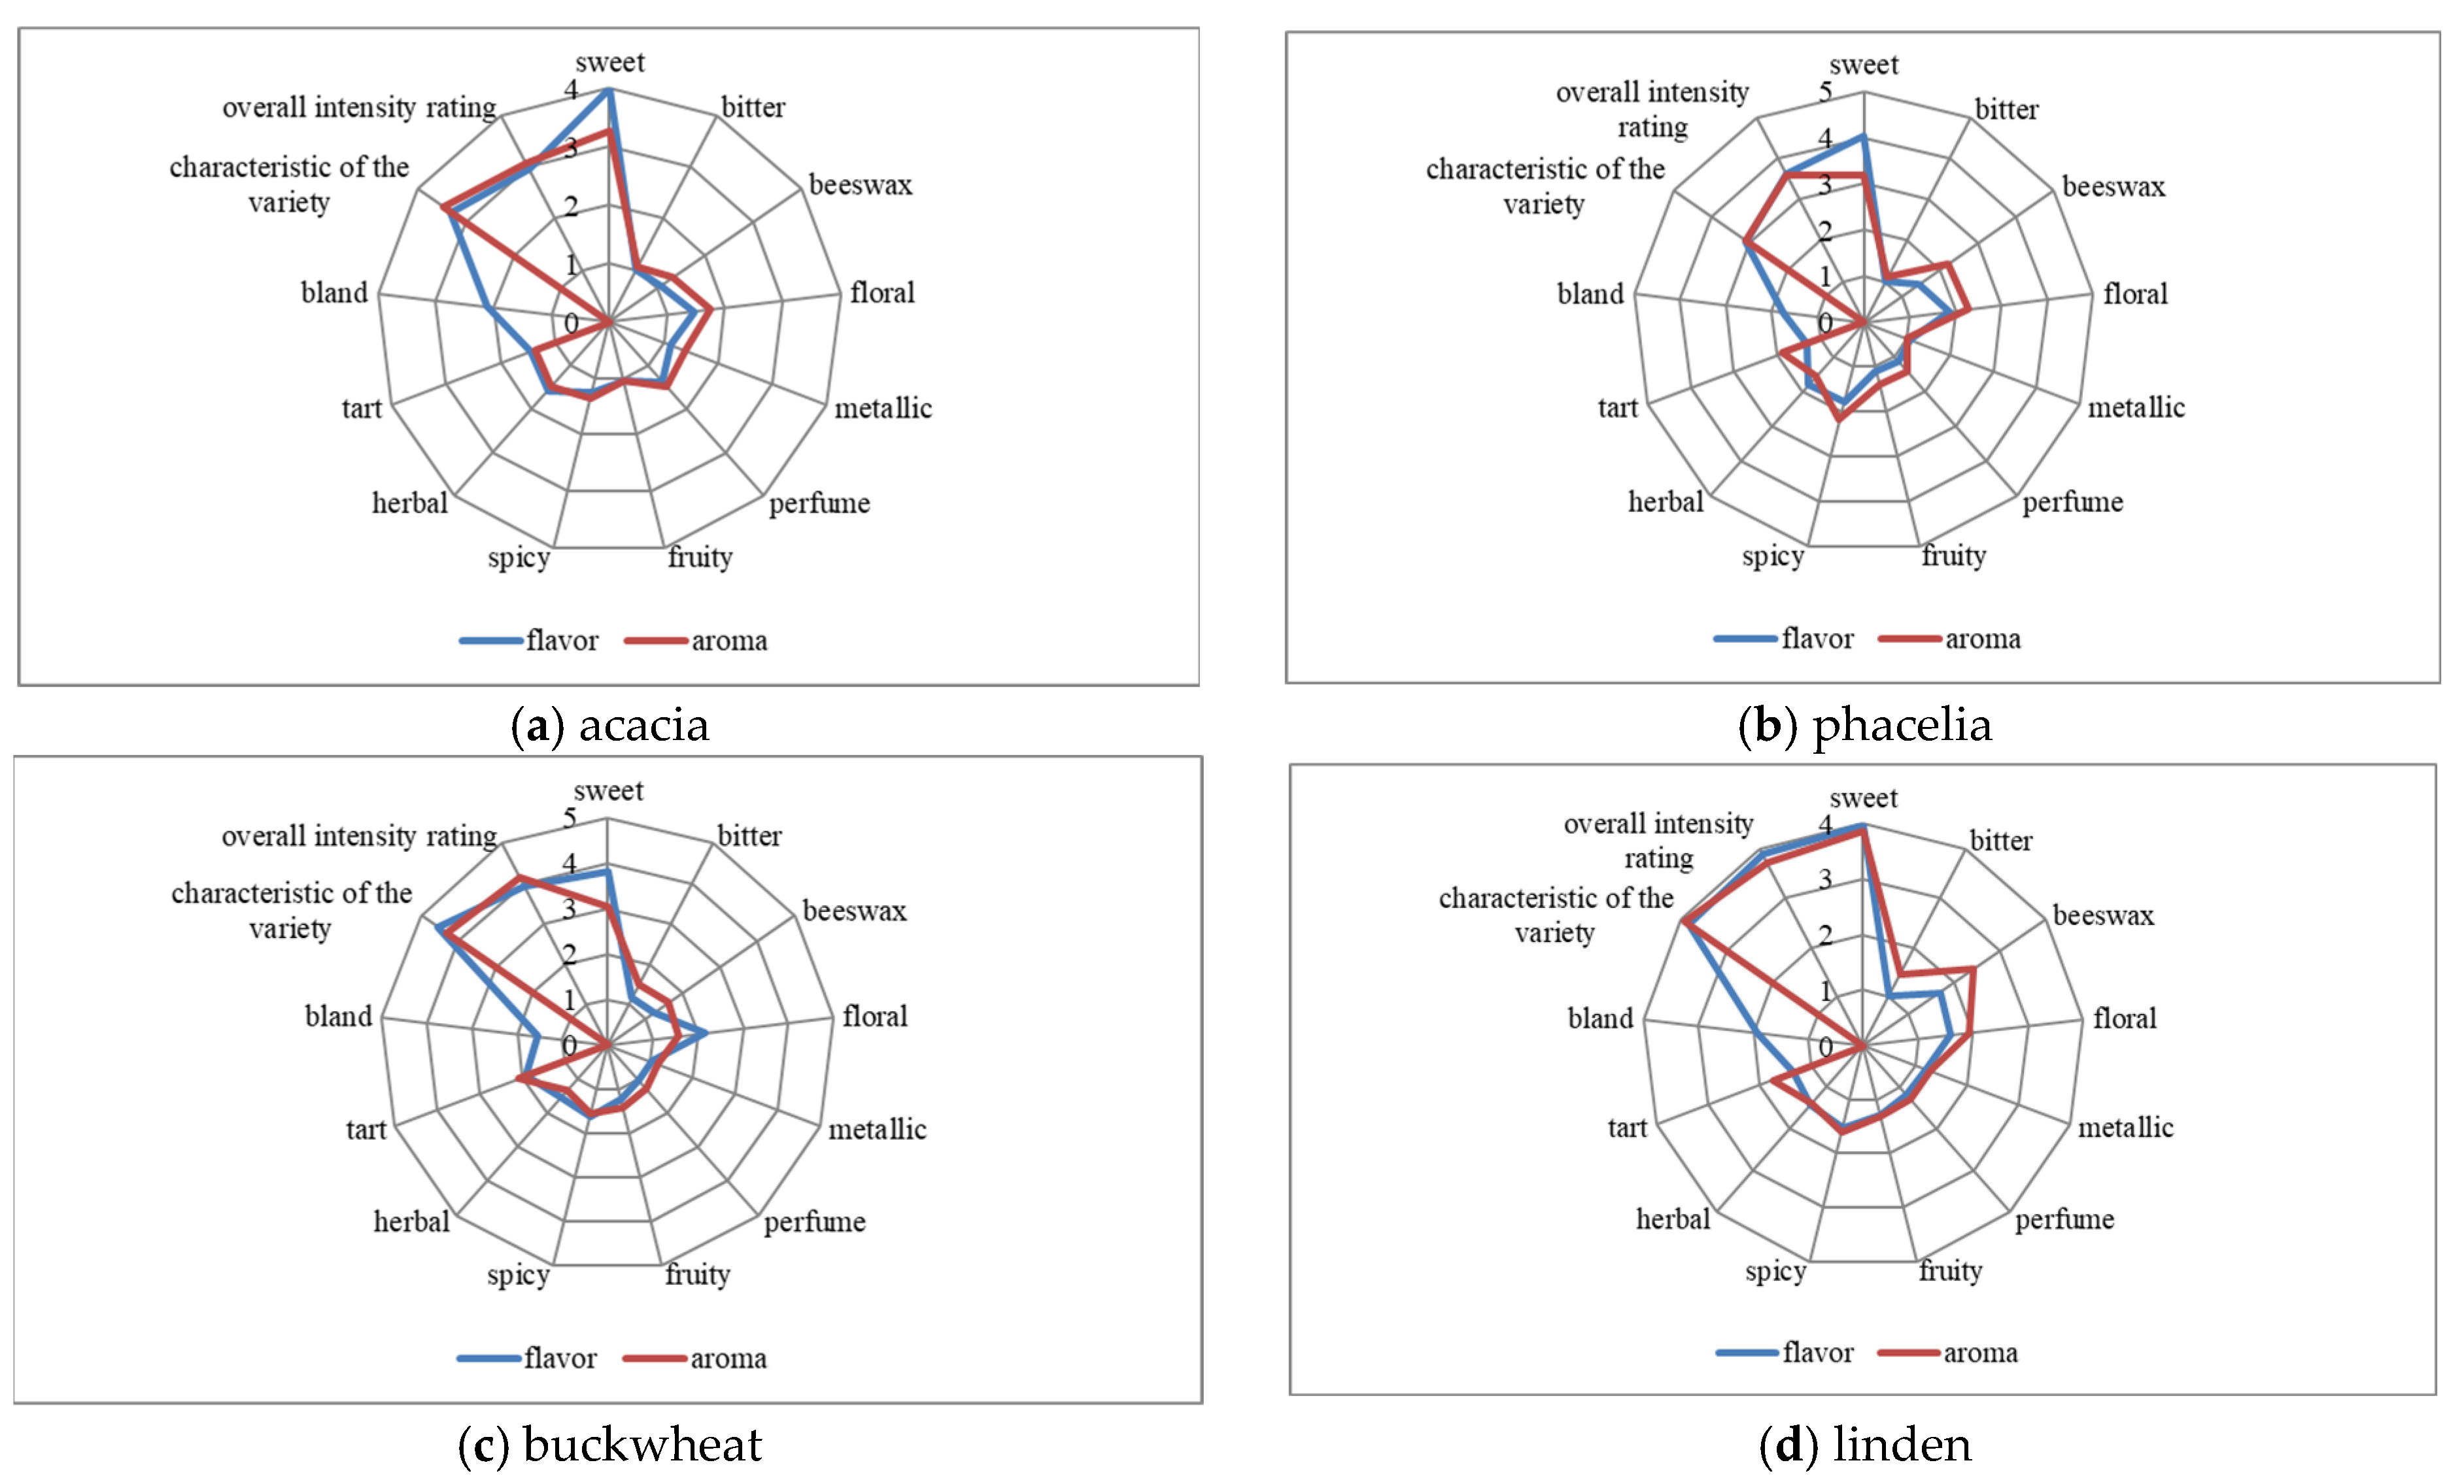
Figure 1. Sensory profiles of aroma and taste of different types of mods from Poland. Source: own study.
Applsci 15 09427 g001aApplsci 15 09427 g001b
Figure 2. Sensory profiles of varietal honeys from Poland. Source: own study.
Applsci 15 09427 g002
Figure 3. Evaluation of quality descriptors for acacia honey samples (samples A1 to A8). Source: own study.
Applsci 15 09427 g003
Figure 4. The position of honey varieties in the system is determined by the first two elements (F1 and F2) based on the results of the sensory evaluation of all organoleptic characteristics. Source: own study.
Applsci 15 09427 g004
Table 1. Examples of organoleptic characteristics of selected honey varieties.
Honey VarietyColor Before CrystallizationColor After CrystallizationAromaTasteConsistency
rapecolorless to light creamwhite or grey creamweak, similar to the scent of rapeseed flowerssweet, slightly blandfast crystallization, gooey consistency
acaciacolorless to straw-colored from white to strawweak, similar to the scent of acacia flowerssweet, slightly blandthick liquid, crystallizing slowly
buckwheatdark tea to brownbrownstrong, similar to the scent of buckwheatsweet, sharpcoarse-grained crystallization, sometimes stratifies
honeydewgreyish-green to brown or almost blackdark brown with a grey or greenish tintslightly spicy or resinousNot very sweet, blandfine-grained consistency
phaceliafrom light cream to strawwhite or creamy grayweak, similar to the scent of flowerssweet, refreshing, slightly sourthick liquid, crystallizes quickly, fine-grained, greasy after crystallization
limefrom greenish yellow to light amberfrom white-yellow to golden yellowstrong, similar to the scent of lime flowerssweet, sharp with a bitter aftertastethick liquid, fine-grained, crumbly after crystallization
heatherreddish brownyellow-orange or brownstrong, similar to the scent of heather flowerslow-sweet, sharp, bitterthick liquid, gelatinous after crystallization, may be medium-grained
dandelionfrom light cream to teafrom light yellow or light gray to light brownstrong, similar to the scent of beeswaxsweet, mild, to sharp, with a bitter aftertastethick liquid, medium-grained after crystallization
Source: own work based on the Polish standard on honey [9].
Table 2. Number of tested samples of subsequent honey varieties.
Lp.Honey Variety20202021202220232024N
1.ACACIA211228
2.PHACELIA222219
3.BUCKWHEAT3323213
4.LINDEN2333314
5.DANDELION2222210
6.RAPESEED3322313
7.HONEYDEW-NEEDLE121228
8.HEATHER221229
total171814181784
Source: own study.
Table 3. Example of a scale for assessing the quality descriptors of varietal honeys.
Feature Scale [pts]
12345
Intensity of taste/smellimperceptibleslightly noticeablemedium noticeablevery noticeablestrongly
perceptible
Taste/smell characteristic of the varietyimperceptibleslightly noticeablemedium noticeablevery noticeablestrongly
perceptible
Lightness of colorlightmedium lightmedium light/mediumdarkvery dark
Transparencyvery cloudycloudyslightly cloudycleartransparent
Grainyimperceptiblevery delicately feltdelicately feltnoticeablevery noticeable
Source: own study.
Table 4. Characteristics of people participating in the research panel.
No.GenderAgeExperience/Role
1.W28freshly trained
2.M30panelist with one year of experience
3.W32experienced in fruit and honey evaluation
4.M27new, aroma sensitivity tested
5.W35floral aroma expert
6.M40panel calibration leader
7.W29honey texture and consistency tests
8.M38experienced in flavor analysis
9.W31deals with sweetness and acidity perception
10.M36honey aroma profiling specialist
Source: own study.
Table 5. Indicated quality descriptors of varietal honeys.
FeatureSymbolDescription
Characteristic tasteCHTA taste described as honey-like, desired for the honey of a given variety, e.g., buckwheat, taste characteristic of buckwheat honey.
Taste intensityTIA feature related to the uniformity of taste, described by the predominance of a given taste, from a weak sensation to a strong sensation.
Smell characteristic of the varietySA taste described as honey-like, desired for the honey of a given variety, e.g., the smell of lime in the case of lime honey.
Smell intensitySIA feature related to the uniformity of smell, describing the predominance of a given sensation.
Brightness of colorBThe degree of color saturation: from light cream, not very intense, to amber, a very intense color.
TransparencyTA feature that is the degree of light transmission, characteristic of fresh honeys, especially acacia honeys. Often referred to as clarity or transparency of honey, but also as cloudy honey, not transparent.
GrainyGThe consistency of honey is a feature that can indicate its freshness, e.g., the absence of lumps, smooth and creamy honey. Honey with lumps is honey in which the honey crystallization characteristic of this product has already occurred during its storage. This feature is indicated by the imperceptible presence of lumps and their perceptibility.
Source: own study.
Table 6. Descriptive statistics and Kruskal–Wallis test results for the honeys tested.
AcaciaPhaceliaBuckwheatLindenDandelionRapeseedHoneydew-NeedleHeather
Characteristic taste x ¯ 3.313.084.533.843.834.184.044.30
sd1.071.380.661.041.031.050.880.87
Average rank406.9383.1746.8548.9545.6655.4597.4680.4
H208.79
p0.000
Taste intensity x ¯ 2.963.623.933.913.623.962.964.59
sd0.931.090.950.961.070.990.560.67
Average rank307.6502.8585.3578.6499.1598275.1794
H193.15
p0.000
Smell characteristic of the variety x ¯ 3.463.104.303.933.583.623.883.93
sd1.161.350.850.970.841.020.911.08
Average rank511.7438.2751.2644.3541.2552627.4643.9
H190.11
p0.000
Smell intensity x ¯ 3.083.584.153.723.523.653.383.47
sd0.851.150.860.950.90.990.491.09
Average rank407.7567.8742.5614.7541.7594.4480.4539.6
H120.35
p0.000
Color x ¯ 1.531.574.221.892.391.194.343.74
sd0.530.520.920.660.530.40.730.74
Average rank289.3302.1915.6398.2547.9187.4942.7851.6
H776.47
p0.000
Turbidity x ¯ 4.553.031.673.433.501.682.063.28
sd0.570.770.660.811.211.110.860.97
Average rank939.2600271691.9703.2271.7365.8656.1
H438.9
p0.000
Smoothness x ¯ 1.351.441.741.371.711.161.481.54
sd0.620.750.980.550.710.370.620.77
Average rank492.3514.7601.5513.8644.3422.9556.1559.8
H60.14
p0.000
Explanations: (arithmetic mean ( x ¯ ) and standard deviation (sd), test statistic (H), test probability value (p). Source: own study.
Table 7. The mean values of the canonical variates for F1 and F2.
Canonical VariablesHoney
AcaciaPhaceliaBuckwheatLindenDandelionRapeseedHoneydeW-NeedleHeather
Averages of Canonical Variates
F16.545.23−7.933.641.185.27−7.16−6.79
F2−4.09−0.211.40−0.62−1.036.04−1.02−0.48
Source: own study.
Table 8. Coefficients of canonical discriminant functions.
SymbolF1F2
Constant-16.66−10.40
Characteristic tasteCHT−2.442.94
Taste intensityTI−1.191.13
Smell characteristic of the varietyS2.69−2.09
Smell intensitySI−0.90−0.57
ColorC−4.76−1.25
TurbidityT0.252.18
SmoothnessG1.430.69
Source: own study.
Disclaimer/Publisher’s Note: The statements, opinions and data contained in all publications are solely those of the individual author(s) and contributor(s) and not of MDPI and/or the editor(s). MDPI and/or the editor(s) disclaim responsibility for any injury to people or property resulting from any ideas, methods, instructions or products referred to in the content.