Article

Numerical Mathematical Model for the Analysis of the Transient Regime Caused by a Phase-to-Earth Fault

1
Department of Fundamental Physics for Engineers, Politehnica University, 300006 Timisoara, Romania
2
Department of Computer Sciences and Electrical Engineering, Lucian Blaga University, 550024 Sibiu, Romania
*
Author to whom correspondence should be addressed.
Appl. Sci. 2025, 15(17), 9389; https://doi.org/10.3390/app15179389
Submission received: 21 July 2025 / Revised: 22 August 2025 / Accepted: 23 August 2025 / Published: 27 August 2025

Abstract

The increasing complexity of electrical power installations requires more and more sophisticated mathematical models for the analysis of their operating regimes in relation to transient regimes. This requirement can be solved by using numerical mathematical models implemented in professional programming environments. MATLAB/Simulink is such a programming environment that allows for the analysis of transient regimes caused by faults occurring in electrical power installations. In this paper, the transient regime caused by the phase-to-ground fault is analyzed using a numerical model of a 20 kV nominal voltage power network, implemented in the MATLAB/Simulink programming environment. The numerical model was validated by comparing the obtained results with those experimentally determined in a real 20 kV network. Using the numerical model, we can analyze how the zero-sequence voltage of the 20 kV bus bars and the fault current in the 20 kV network, which are neutrally treated with a Petersen coil, are influenced by the following parameters: the initial phase of the voltage at the fault location; the regime in which the medium voltage network operates (resonance, under-compensated, or over-compensated); the insulation state (value of the electrical resistance of the insulation); and the value of the resistance at the fault location. The differences between the experimentally obtained results and those obtained using the numerical model are as follows: for the fault current, 6.67% if Rt = 8 Ω and 4.94% if Rt = 268 Ω; for the zero-sequence voltage, 3.21% if Rt = 8 Ω and 6.19% if Rt = 268 Ω.

1. Introduction

The increase in electricity consumption worldwide has led to the expansion of electrical transmission and distribution networks. The use of renewable energy sources for the production of electricity has led to the expansion of electrical distribution networks as well as to their increased complexity. The length of electrical distribution networks (medium voltage) is much greater than that of high voltage electrical networks. Also, high and medium voltage electrical networks are mainly made up of overhead power lines. As a result, they are exposed to atmospheric phenomena in the area in which they are located. The length of these electrical networks and the atmospheric phenomena to which they are exposed make the number of defects that occur in these electrical installations high. The phase-to-ground type defect has the largest share of the total number of defects that occur in medium voltage electrical networks. In [1,2], it is stated that phase-to-ground type defects are the most frequent in electrical distribution networks, without specifying how many percentages of total defects they represent. In [3], it is stated that these defects represent over 80% of the total defects, and in [4] it is stated that these defects represent 70–90% of the total defects that occur in the electrical distribution networks. In [5], it is shown that during two years in a distribution network the phase-to-ground type defects represented 87% of the total defects that occurred in the respective network, and in [6] research is presented regarding the automatic triggering of relay protections depending on the type of defect and the type of electrical lines, both for a year and for each month separately.
From what has been presented, it follows that electrical distribution networks must be provided with sensitive protection systems, which allow selective detection of phase-to-ground faults in their incipient state, so that they do not turn into multiple faults.
An important role in the behavior of medium voltage electrical networks during a phase-to-earth fault is played by the way in which its neutral is connected to the ground. If the neutral of the network is isolated or connected to the ground through a Petersen coil, a phase-to-earth fault does not affect the power supply of consumers, but the network cannot operate for a long time (maximum 5–10 min) with this fault because the voltage of the phases without a fault of the network becomes Uph*√3, where Uph represents the voltage of the phases in the absence of the fault. This increase in the voltage applied to the network insulation can lead to the transformation of the phase-to-earth fault into a multiple fault [7,8]. In [9], numerical simulations are used to assess a new protection system against earth faults in medium voltage networks isolated neutral. The detection criterion is the angle between the phasors of the zero-sequence voltage and the current. In [10], a method based on transient measurements is used, namely, the direction of reactive power, the distribution of zero-sequence current, the amplitude of zero-sequence current, and the slope of the zero-sequence current curve to select the faulty feeder in the network with the isolated neutral.
Distribution networks where the total capacitive current is at most 10 A have isolated neutral [8,11] because, when the instantaneous value of the fault current is zero, the electric arc is extinguished and the fault is eliminated without disconnecting the line with the fault from the source. The most widely used method of connecting the neutral of the medium-voltage network to earth is the one that uses a Petersen coil. The main advantage of these networks is that, by compensating the capacitive current of the medium-voltage network with the Petersen coil, the value of the fault current drops below the value of 10 A, so that the electric arc at the fault location is extinguished naturally, the fault being eliminated in most cases without the need to disconnect the line with the fault from the medium-voltage bus bars of the transformer station [12,13]. The efficiency of the Petersen coil is maximum if the medium-voltage network operates in resonance mode. Since the configuration of the medium voltage network changes over time, the Petersen coil must be adjustable. In [5], an automatic system is presented that allows the Petersen coil to be adjusted so that the medium voltage network operates in resonance.
Selective detection of a phase-to-earth fault is most difficult in distribution networks where a Petersen coil is used to connect the neutral to earth. Various types of protection are used to solve this problem. In [14], a protection is presented that allows the determination of the change in the resistance value at the fault location during the fault and depending on this the sensitivity of the protection is modified, and in [15] some of the practical experiences of fault location, based on the fault information from the Disturbance Recorder and the PowerCAD fault calculation, are presented. In [16,17], a method based on comparing the waveform of the transient fault current with the waveform of the phase currents without a fault is presented, and in [18] a method is presented that uses a detection device that records the transient voltage traveling waves during the fault in the presence and absence of the electric arc, respectively, and in [19] a method is presented in which digital transformers are used to preserve the waveform of the signals. In [20], the causes that can determine the malfunction of the directional protections used for detecting phase-to-earth faults are presented.
In the case where the capacitive current value of the medium voltage network is high (the medium voltage network is made up of cabled electrical lines), the Petersen coil can no longer extinguish the electric arc at the fault location because the resistive component of the capacitive current exceeds the value at which the electric arc naturally extinguishes. In this case, the neutral of the medium voltage network is connected to ground through a resistor. In [21], it is analyzed how the characteristics of the medium voltage network with the neutral connected to ground through a resistor influence the fault current in the case of a phase-to-earth fault.
By controlling the asymmetry of the three-phase voltage system of the medium voltage bus bars, from which the faulty line is supplied, as well as the asymmetry of the phase currents of the faulty line, phase-to-ground faults can be selectively detected [13,22]. By controlling the time variation of the medium voltage line voltages and currents in the transient regime caused by the phase-to-ground fault, these faults can be selectively detected [16,23].
Whichever method is used to detect the phase-to-ground fault, the protection must be set to detect the fault in its early stages but not to act wrongly, even if the impedance at the fault location is high [24].
The calculation of the zero-sequence of the three-phase system of the phase voltages of the medium-voltage bus bars, as well as that of the phase currents of the medium-voltage lines, requires the use of the sequence component method. To be able to use this method, it is necessary that the waveform of both voltages and currents be sinusoidal. As a result, this method can be used only after the damping of the transient components that intervene in the voltages and currents during the phase-to-ground fault [25,26].
The use of numerical models for the analysis of phase-to-ground faults occurring in medium voltage electrical networks allows both the analysis of the transient regime caused by the fault and the analysis of the steady regime in the presence of the fault, without imposing the condition that the voltages and currents have a sinusoidal waveform. As a result, the use of numerical models for the analysis of phase-to-ground faults in medium voltage electrical networks is more general and more efficient than the sequence component method.
The complexity of the equivalent electrical schemes of electrical power installations and electrical distribution networks leads to complicated differential mathematical models. Analytical determination of the solution of differential systems is complicated and time-consuming. The development of computing technic has facilitated the implementation of numerical methods for determining the solution of differential systems in such cases, and numerical simulation of these three-phase electrical circuits has become possible [27,28]. The first programming environment created for the analysis of both stationary and transient regimes was the Electromagnetic Transient Program (EMTP) [29], with its subsequent version EMTP-RV, which has a more accessible and intuitive graphical interface. The Alternative Transient Program (ATP), adapted for use on Personal Computers (PCs), or Power System Computer Aided Design (PSCAD) were initially used for simple electrical circuits, and the user also had the possibility to model his own circuits [29,30]. The authors of [31] describe the Electromagnetic Transient Program (EMTP) and review the initial development of EMTP at the Bonneville Power Administration of the US Department of Energy, starting in 1966. Their study briefly explains the development and status of the ATP-EMTP, EMTP-RV (now EMTP®), EMTDC/PSCAD, and XTAP programs. These programs were used for the analysis of unsymmetrical and transient regimes in [9,15,17].
Although PSpice was designed for the analysis of electronic circuits [32,33], it can also be used for the analysis of electrical power circuits. In [34,35], PSpice is used for the simulation of medium voltage electrical networks.
In [12,17,20], the MATLAB/Simulink (R2015a, R2019a) program is used to analyze the transient regime caused by the phase-to-ground fault in a medium-voltage electrical network.
The comparison between the mentioned programs is not conclusive because the interfaces between the user and the program are friendly, the model libraries are comprehensive, which facilitates the creation of the desired model, and the calculation speeds and storage possibilities are similar. As a result, the choice of simulation program depends on the user’s previous experience and on the way in which the problems that interest them are solved.
Modeling and simulating electrical systems using specialized environments is cheaper, faster, and allows the analysis of a larger number of variables that influence the transient regimes caused by phase-to-ground faults.
Regardless of the size controlled by the protections to detect the phase-to-ground fault in medium voltage electrical networks, their setting requires the analysis of the transient regime caused by the phase-to-ground fault. For this reason, it is very important that the numerical or analytical model used for the transient regime analysis leads to results as close as possible to the real ones.
Although, in recent years, professional programs, specially designed for this purpose, have been used to analyze the operating modes of electrical networks, the errors of these programs are not presented in the literature. In order to determine the errors of these programs, it is necessary to compare the results obtained by numerical simulation with those obtained by measurements in real electrical networks. Since researchers do not have access to real installations, carrying out experimental determinations is very difficult. In this paper, the results obtained by numerical simulation are compared with those determined experimentally in a real situation.
Since the most commonly used medium voltage electrical networks are those that have the neutral connected to ground using a Petersen coil, such a network was chosen in the study presented in the paper.
The objective of this paper is to develop a numerical model implemented in MATLAB/Simulink for an electrical distribution network that allows the analysis of transitory regimes caused by phase-to-ground faults. It analyzes how the characteristics of the distribution network with the neutral connected to ground through a Petersen coil and the conditions under which the fault occurs influence the transient caused by the fault. Also, the numerical model developed is validated by comparing the results obtained using the model with those obtained experimentally in the distribution network.
The numerical model can also be used if the distribution network has an isolated neutral, in which case the resistance or reactance of the Petersen coil has a very high value, theoretically infinite. In the model, the values of these parameters are considered to be 1 MΩ.
If the distribution network has the neutral connected to ground through a resistor in the numerical model, the resistance of the Petersen coil becomes equal to that of the resistor, and the reactance of the Petersen coil has a value of zero.
The paper contains, in addition to the introduction, the following subchapters: Section 2—Objectives and the Studied Case; Section 3—Material and Methods; Section 4—Validation of the Numerical Model; Section 5—Analysis of the Transient Regime Caused by Phase-to-Ground Faults—Numerical Results; Section 6—Discussion; Section 7—Conclusions.

2. Objectives and the Studied Case

The objective of this work is to make a numerical model implemented in MATLAB/Simulink for the analysis of the transient regime caused by phase-to-ground faults that occur in three-phase electrical networks with a voltage of 20 kV. In order to verify the correctness of the numerical model, a real 20 kV network with a known structure was chosen (Figure 1). In the respective 20 kV network, phase-to-ground faults were intentionally caused and the fault current and the zero-sequence voltage related to the 20 kV bar-bus in the transformer station was experimentally determined. The experimentally obtained results were compared with those obtained using the numerical model.
In this paper, we did not set out to analyze the advantages and disadvantages of the various numerical simulation programs of three-phase installations used for the study of transient regimes.
After the MATLAB/Simulink numerical model was validated, comparing the results obtained using the model with those determined experimentally, this was used to analyze the transient regime caused by the phase-to-ground fault.
The purpose of the analysis of the transient regime caused by the phase-to-ground fault is to establish how the transient regime is influenced by the following parameters: the initial phase of the voltage at the moment of the fault occurrence (α); the electrical resistance of the insulation of the three-phase electrical installation (Riz); the resistance to the fault location (Rt); and the operating regime of the electrical network. The medium-voltage network that is neutrally grounded through a Petersen coil operates in the following regimes: resonance, over-compensated 6.1%, under-compensated 4.5%, and under-compensated 36.9%. Except for the resonance regime, experimental determinations were carried out for the other operating regimes of the medium-voltage installation, causing a phase-to-earth fault and modifying the value of the resistance to the fault location (Rt). A single line diagram of the three-phase medium voltage electrical network is shown in Figure 1.
The following notation conventions are used: S—power system with nominal voltage 110 kV; Tr. 1—three-phase transformer 110/20 kV, with the high-voltage windings in a wye connection with ground (Y0) and the medium-voltage windings connected in delta (Δ); NPC—the neutral physical point coil, with a zig-zag winding connection (Z-Z); the 20 kV medium-voltage transmission line on which the fault appears (L2, L3, L4)—20 kV medium-voltage transmission lines; PC—the Petersen coil used to ground the network to a neutral physical point; Rt—the fault resistance; LCS—longitudinal coupler of 20 kV bus bars; Tr.2, Tr.3, Tr.4—step-down transformers 20 kV/0.4 kV, with Δ/Y0 connection; C2, C3, C4—consumers fed through L2, L3, L4 medium-voltage (20 kV) transmission lines; Sf—switch for fault generation; if—instantaneous value of fault current.
The characteristics of the elements of the three-phase electrical installation are presented in Table 1, Table 2, Table 3, Table 4 and Table 5.
The meaning of the quantities that appear in Table 1 is as follows: U1n—nominal voltage in the primary; U2n—nominal voltage in the secondary; usc—short-circuit voltage; i0—no-load current; Psc—active power losses in short-circuit mode; P0—active power losses in no-load mode.
The power of the 110 kV source is considered infinite, which is a simplification that is accepted in the literature [6,7,11,19].
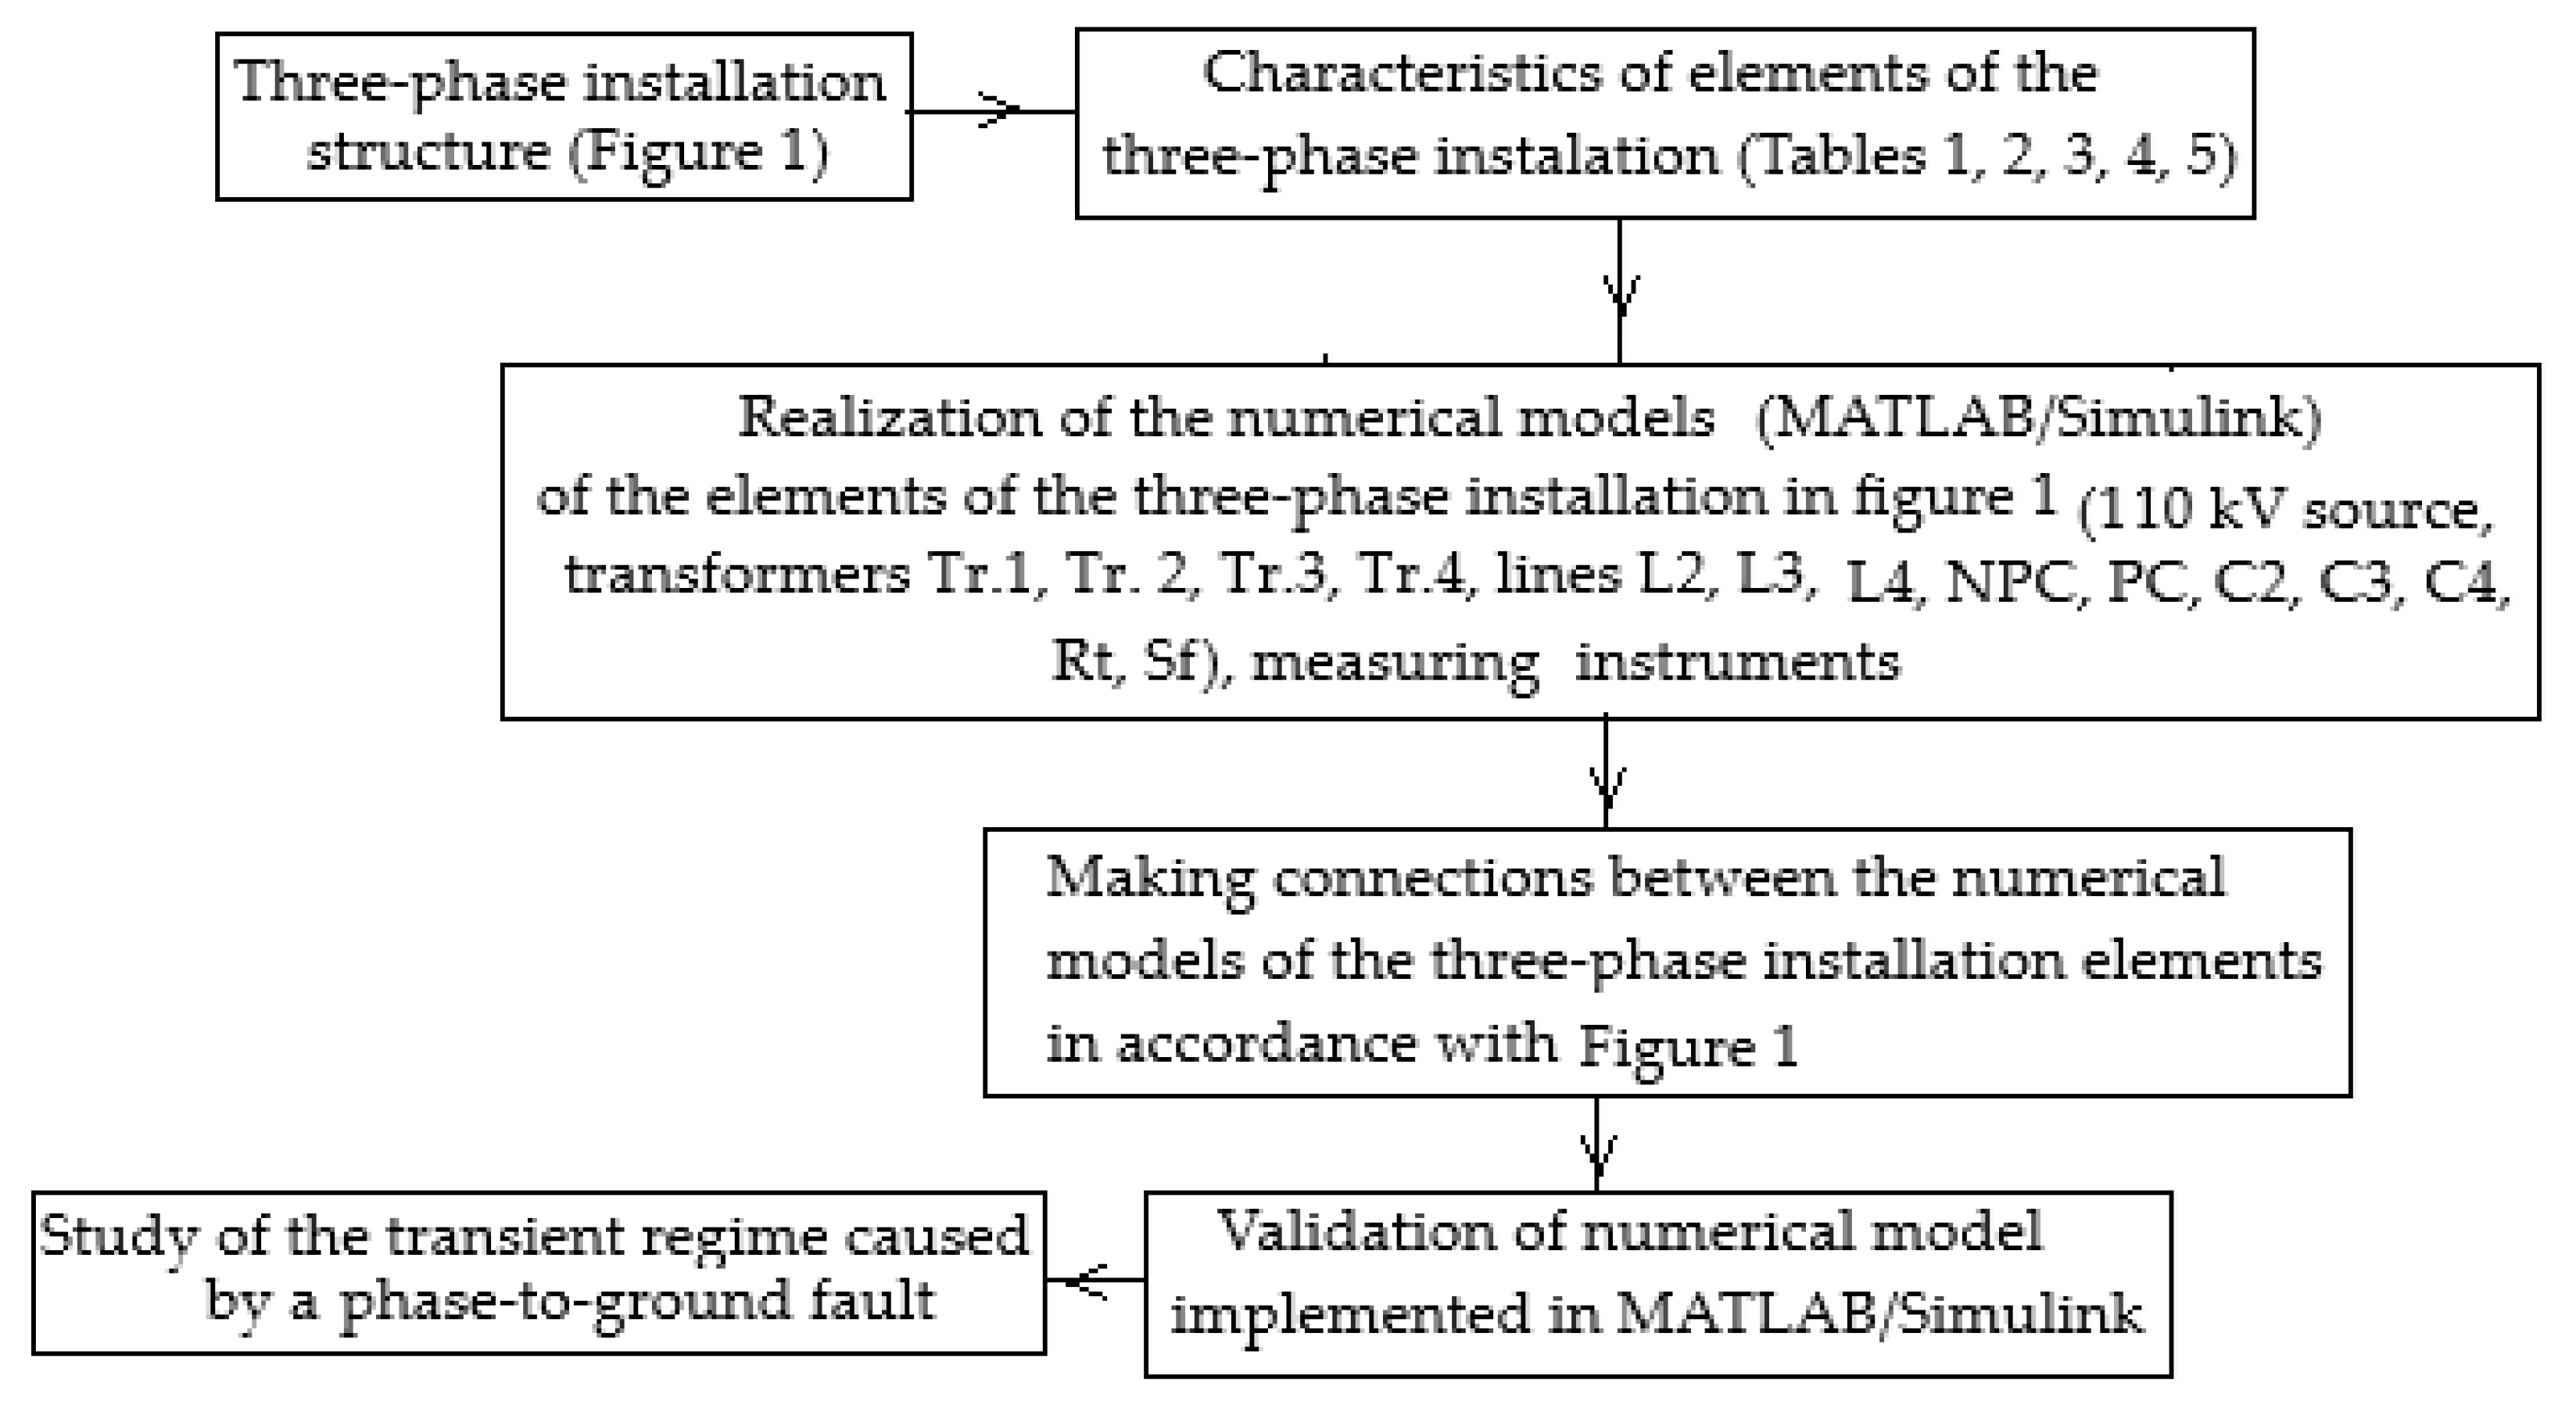
An information flow diagram for the development and implementation of the numerical mathematical models that are necessary for the analysis of the transient regime caused by a phase-to-ground fault in a 20 kV network (Figure 1) is presented in Figure 2.
Considering the transient regime produced by a phase-to-earth fault occurring on one of the 20 kV lines, the contributions of this work can be considered as follows:
(1)
Establishing numerical mathematical models for calculating zero-sequence voltages and currents at the fault location during the transient regime caused by phase-to-earth faults.
(2)
Realization of the block dedicated to the modeling of the three-phase coil with a zig-zag connection (noted as NPC in Figure 1) and its implementation in MATLAB/Simulink.
(3)
Implementing the numerical mathematical model of the analyzed three-phase installation (Figure 1) in the MATLAB/Simulink programming environment.
(4)
Analysis of how the zero-sequence voltage and fault current are influenced by the conditions under which the phase-to-earth fault occurs (initial phase of the voltage at the fault location; insulation state of the 20 kV network (insulation resistance value); operating mode of the 20 kV network (resonance, over-compensated 6.1%, under-compensated 4.5%, under-compensated 36.9%); and contact resistance at the fault location (Rt)).
(5)
Validation of the numerical model of the analyzed three-phase installation implemented in the MATLAB/Simulink programming environment by comparing the results obtained using the model with those determined experimentally.
Since the created numerical model contains all the equipment involved in the structure of an electrical distribution network, it can be used in other cases if the structure of the respective network is taken into account in its design.

3. Materials and Methods

Regardless of the program used, transient regime analysis boils down to solving the differential equations generated by the dynamic elements of the electrical installation being studied (coils, capacitors, electrical machines).
The MATLAB/Simulink program uses a two-step method for integrating differential equations. In the first step, the mathematical model is generated in the form of ordinary differential equations, the procedure called the state variable method. In the next step, the differential mathematical model is integrated using fixed-step or variable-step algorithms.
The main advantage of this method is that it allows for the unitary treatment of electrical networks, electrical machines, and command and control systems, that is, any element that admits equations of state.
Although the precision with which the differential equations describing the simulated physical system can be integrated is remarkable, no simulation program leads to more precise results than the mathematical models used for the simulated components and the precision with which the parameters of the respective models are known.

3.1. Numerical Model of the Electrical Network

Numerical models for three-phase electrical installations offer the possibility to analyze the transient effects caused by a phase-to-ground fault, considering the characteristics of the electrical installation in which the fault occurs.
MATLAB is a program developed by The MathWorks, Inc. that is used in engineering applications for modeling and controlling systems using various “toolboxes” [36,37,38] and whose language and workspace allow for the manipulation of data structures and variables in a way that is similar to object-oriented programming, involving the creation of files (with a .m or .mlx extension) [39,40] and applications that contain a sequence of instructions written in C/C++. The modeling of electrical networks and the simulation of their operating regimes, including transient ones, are facilitated by MATLAB’s Simulink environment, using the Simscape Electrical library [41], which contains three-phase components specific to electrical networks created according to electrical circuit theory and which allow for the integration of differential equations using different algorithms. The models created in this way are hierarchical, and the user has the possibility to create specialized blocks in which the functional and/or organizational details of the model may or may not be visible to other users.
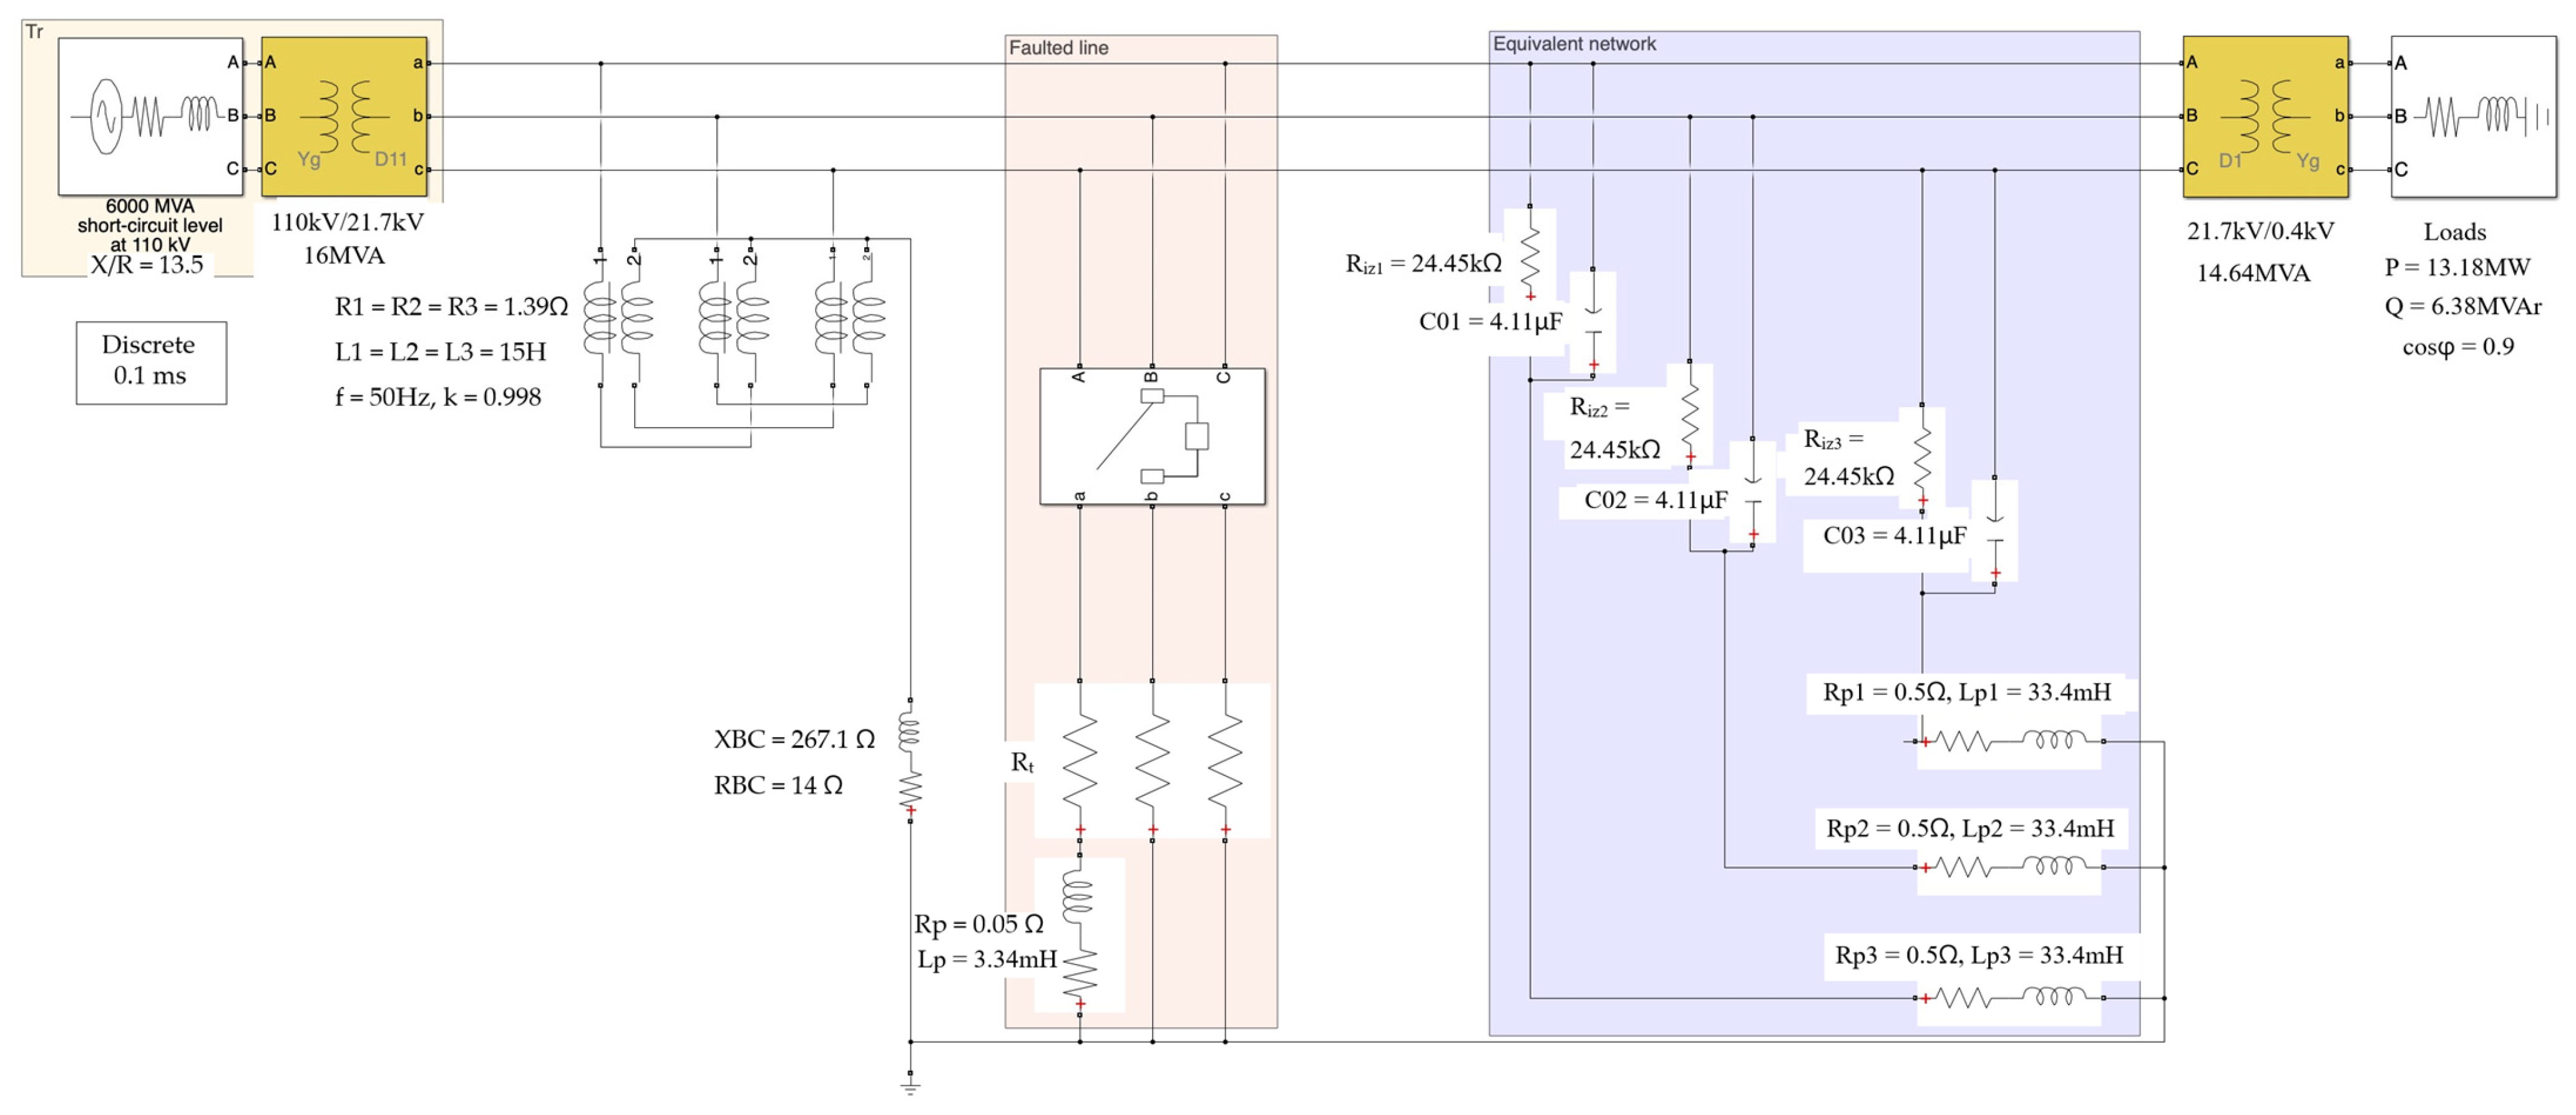
The numerical simulation of the 20 kV nominal voltage power system (Figure 1) requires the numerical modeling of the following elements: the 110 kV source (110 kV bus bar in Figure 1); the 110/20 kV transformer (Tr.1 in Figure 1); the 20 kV electrical network (lines L2, L3, and L4 in Figure 1); the consumers fed through the 20 kV network (Tr.2 and C2, Tr.3 and C3, and Tr.4 and C4 in Figure 1); the three-phase coil with a zig-zag and a neutral (Z0) connection (NPC in Figure 1); the Petersen coil (PC in Figure 1); the circuit breaker used to cause the phase-to-ground fault (Sf in Figure 1); the resistance at the fault location (Rt in Figure 1); and the measuring instruments necessary for recording voltages and currents. Except for the neutral three-phase coil with a zig-zag connection, dedicated simulation blocks were used for the simulation of the elements that are involved in Figure 1, which are contained in the MATLAB/Simulink programming environment.
A variable-step, automatic solver selection, with a relative tolerance of 1 × 10⁻³ and a time tolerance of 1280 eps, was set for the simulation. The default non-adaptive algorithm, using local settings, was used to control the zero-crossing. Default values were also considered for the other solver parameters, including max, min, and initial step size, respectively. The Simulink solver information is available within the model GUI, added to the GitHub (Version R2020b) repository [42].
The values of the 20 kV electrical network element parameters are shown in the model schematic in Figure 3. Since, in medium-voltage electrical networks, the Petersen coil is used to eliminate the phase-to-ground fault without disconnecting the faulted line from the source, i.e., without affecting the consumers supplied through the faulted line, the network must be operated in resonance mode or as close to resonance mode as possible. To ensure the resonance mode, the inductance of the Petersen coil must be automatically adjusted.
Given that the effective values of the fault current in the case of a phase-to-ground fault are below 5 A (so that the fault can be eliminated without disconnecting the faulty line from the source), the voltage drops on the 20 kV lines caused by the fault current can be ignored. As a result, the longitudinal parameters of the 20 kV lines were ignored in the numerical model.
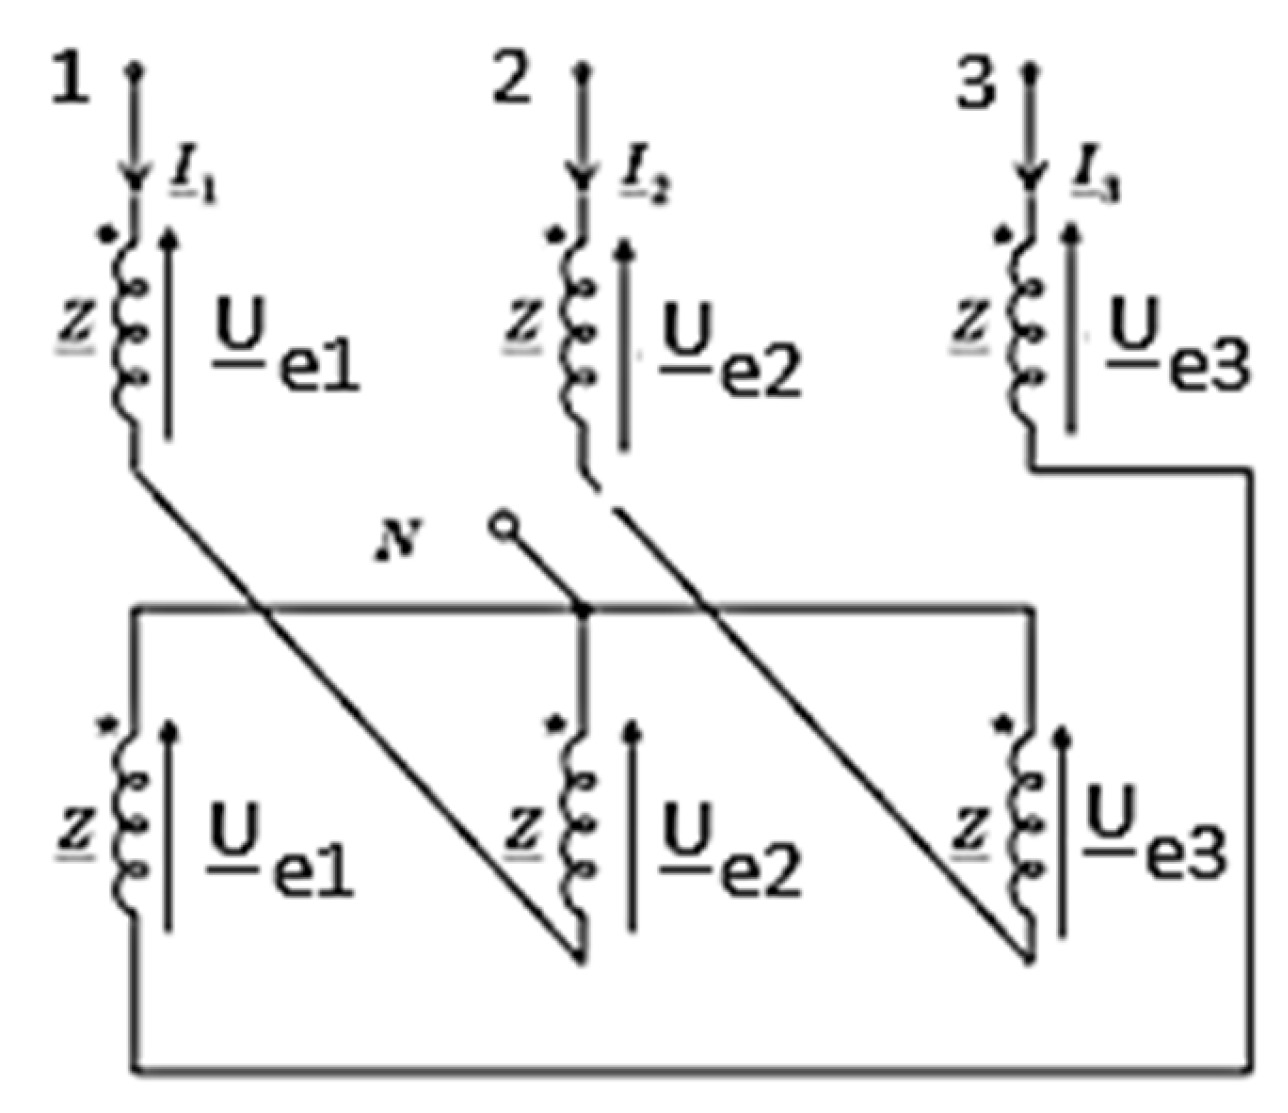
The three-phase coil with zig-zag connection is characterized by the fact that when supplied with a three-phase system of plus sequence voltages its impedance has a high value (no-load impedance), and if supplied with a three-phase system of zero-sequence voltages its impedance is of a very low value (short-circuit impedance). The numerical model of the coil must satisfy the same conditions.
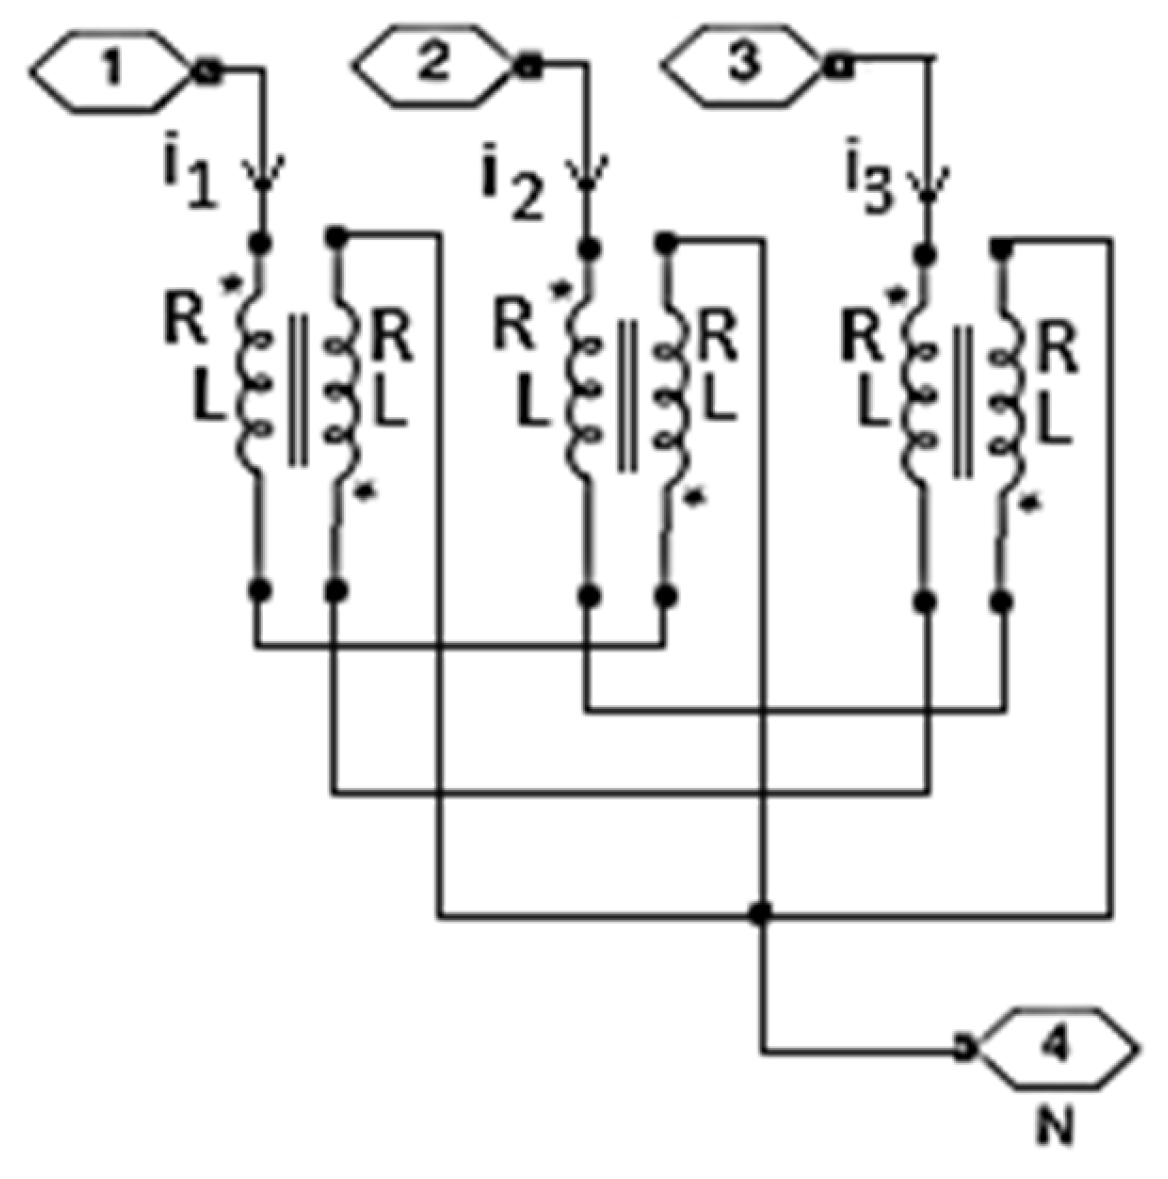
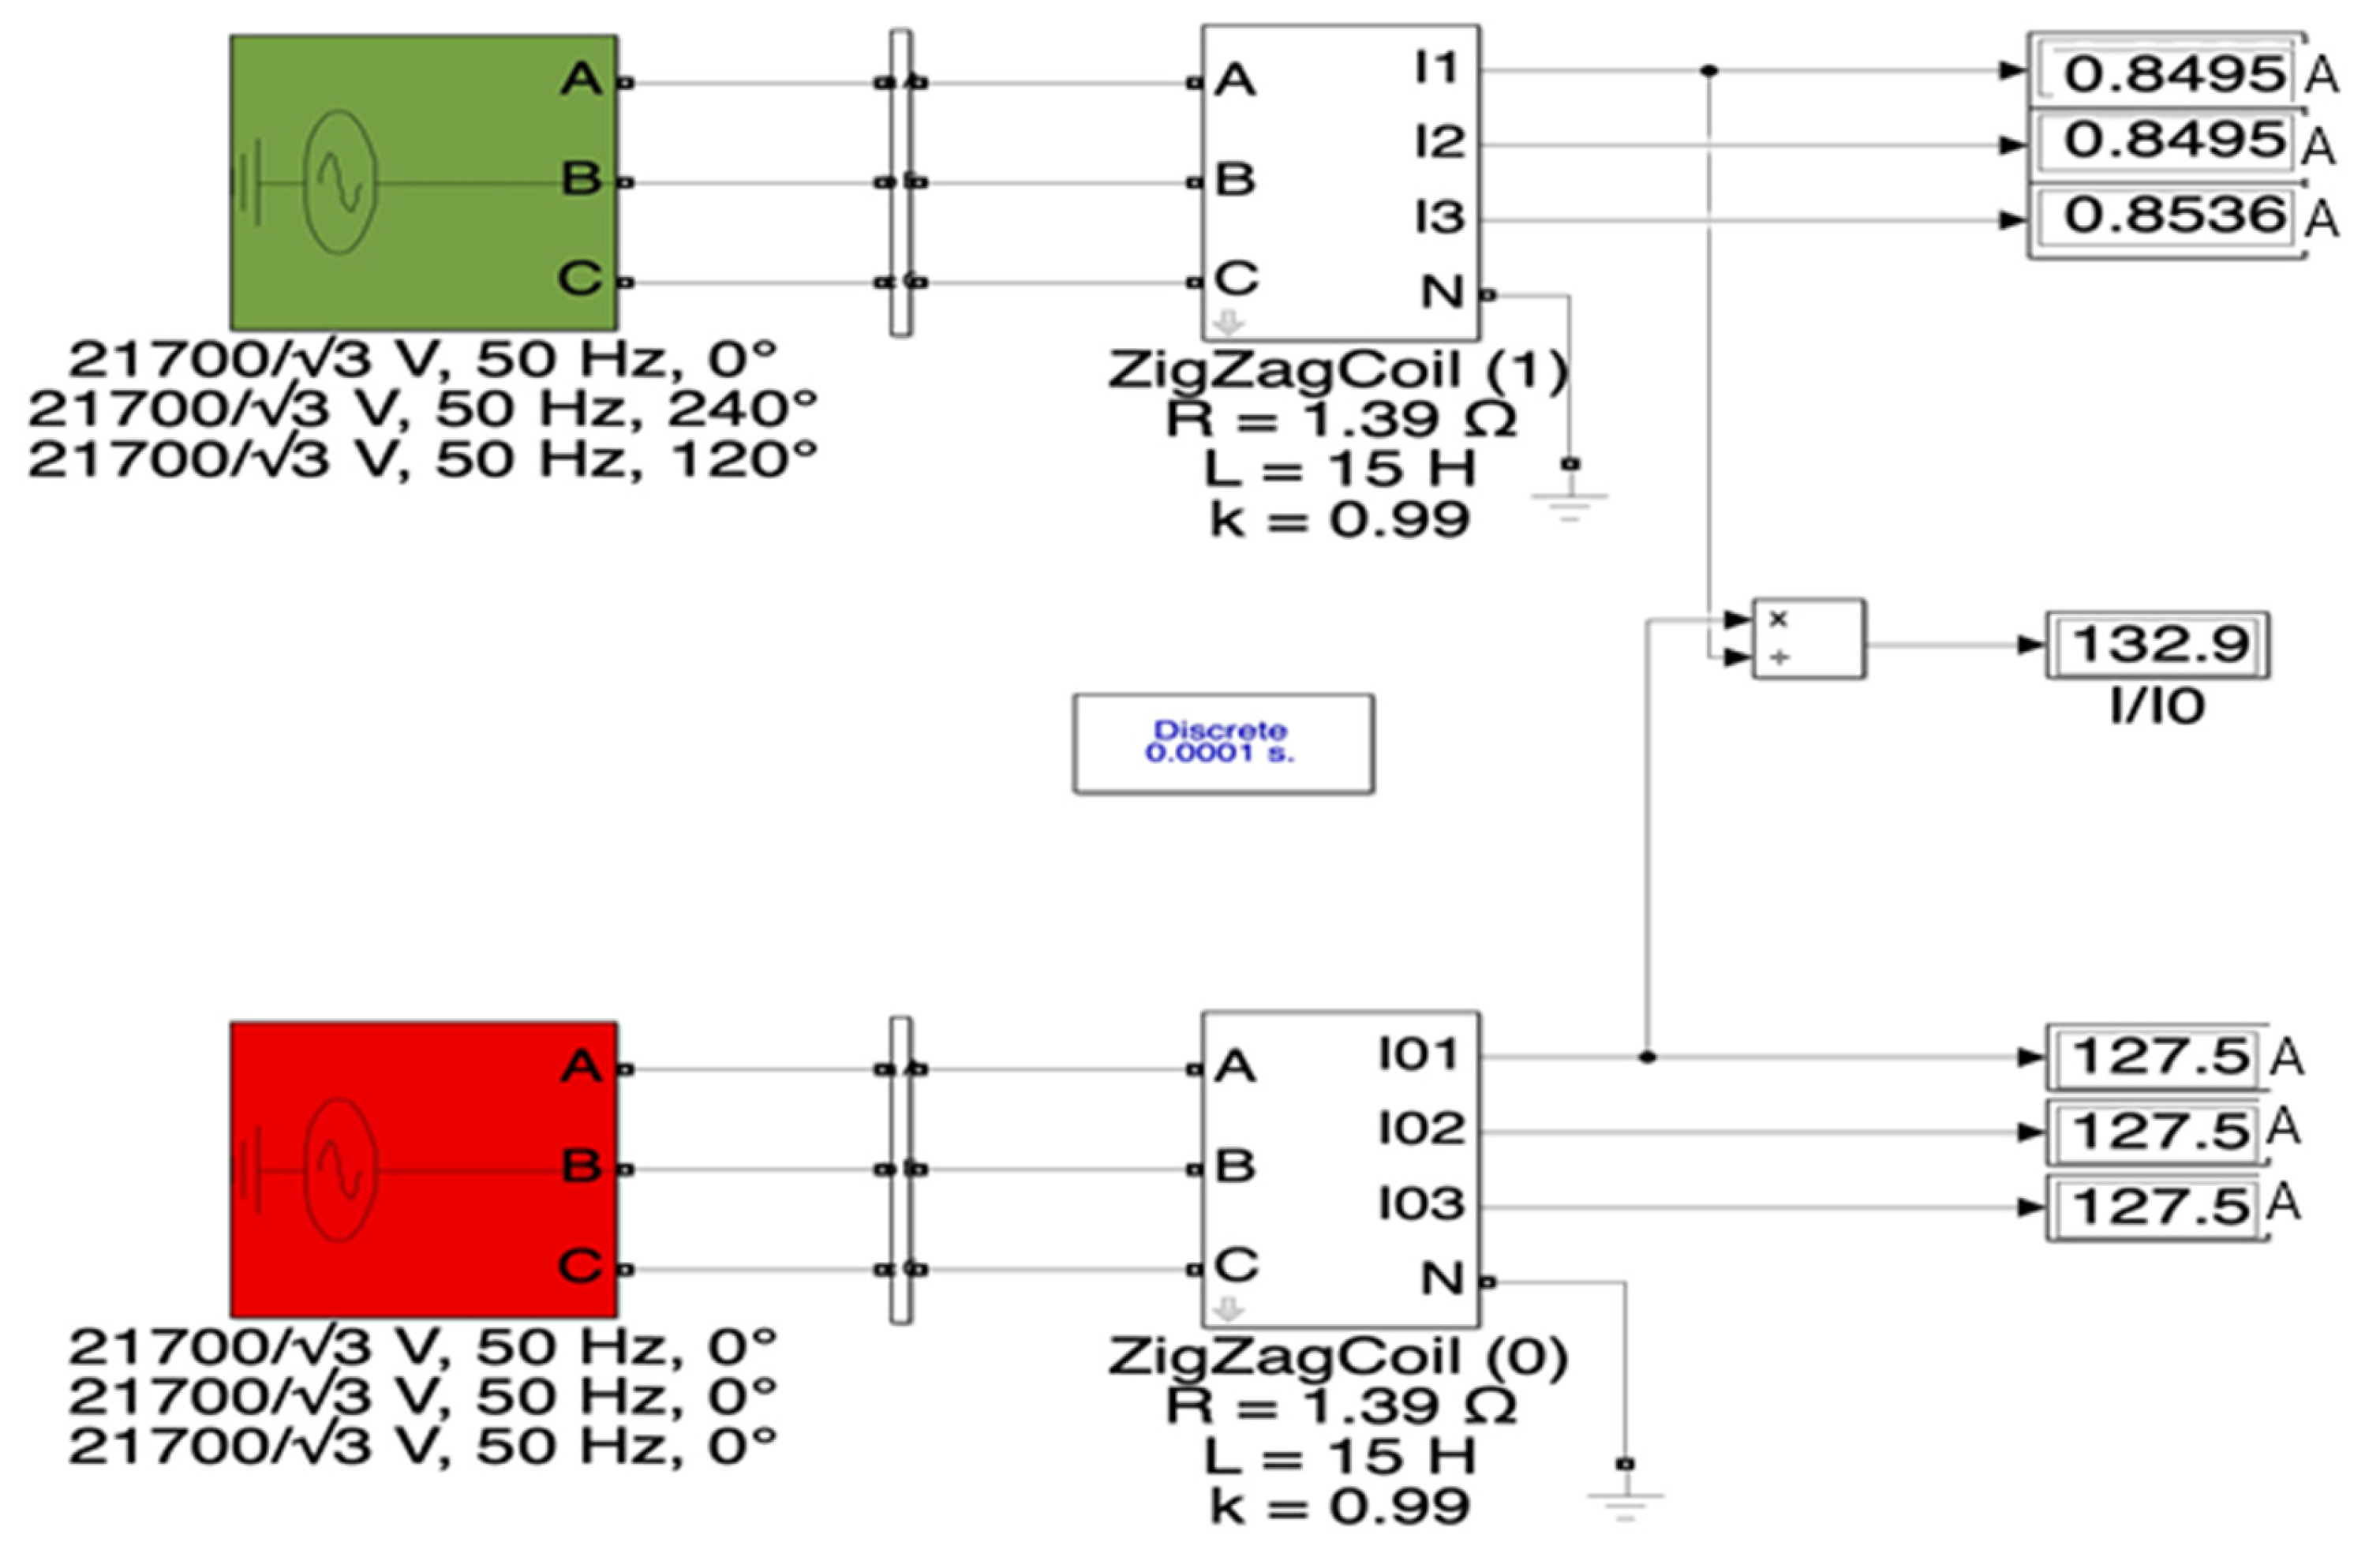
For the numerical simulation in MATLAB/Simulink of the three-phase coil with zig-zag connection (Figure 4) used to create the artificial neutral of the 20 kV network, three “Mutual Inductance” blocks from the Simscape/Electrical/Specialized Power Systems/Passives library (Figure 5) were used. Terminals 1, 2, and 3 are connected to the 20 kV bus-bar system in the transformer station (to which the three-phase phase voltage system is applied), and terminal 4 represents the artificial neutral of the 20 kV network. The 6 coils involved in the model have the same parameters (R, L) and form three groups of two magnetically coupled coils. The coupling inductance (M) is expressed as a function of the self-inductance (L) by the relation M = k × L , where k represents the coupling factor. The model thus created differs from those in the specialized literature. In [43], the three-phase coil with zig-zag connection is modeled in the PSCAD/EMTDC simulator using three single-phase transformers, and in [44] the three-phase coil with zig-zag connection is modeled in the MATLAB simulator using a 5-winding single-phase transformer.
By changing the value of the coupling factor (k), the value of the coupling inductance (M), along with the zero-sequence impedance of the three-phase coil with zig-zag connection, is also changed. This offers the possibility that in the numerical model the desired value for the zero-sequence impedance of the coil used to achieve the artificial null of the 20 kV network can be chosen by changing the value of the coupling factor, which is not allowed by the models presented in [43,44].
In Figure 4 and Figure 5 * indicates the starting terminal of the coil winding.
The model of the three-phase coil with a zigzag connection used to generate the artificial neutral of the medium voltage electrical network in MATLAB/Simulink is shown in Figure 6. Also presented are the values of the parameters of the magnetically coupled coils used to simulate the three-phase coil with zig-zag connection (Z-Z).
To verify the correctness of the model related to the coil with a zig-zag connection, the model was powered with a symmetrical three-phase voltage system (plus sequence), as follows:
u 1 t = 12.5 × 2 × s i n 100 π × t k V u 2 t = 12.5 × 2 × s i n 100 × π × t 120 °   k V u 3 t = 12.5 × 2 × s i n 100 × π × t 240 °   k V
and also with a three-phase zero-sequence voltage system, as follows:
u 1 t = u 2 t = u 3 t = 12.5 × 2 × s i n 100 × π × t   k V
In Figure 7 with A, B, C, the three phases were noted, just like in Figure 3. The results obtained for the phase currents of the three-phase coil with zig-zag connection using the MATLAB/Simulink model are shown in Figure 7. Table 6 summarizes the results obtained by feeding the numerical model of the three-phase coil with zig-zag connection with a three-phase system of positive and zero-sequence voltages, respectively. The meaning of the quantities in Table 6 is as follows: I1, I2, I3—effective value of the phase currents; In—effective value of the neutral current; Zf—phase impedance of the three-phase winding with zig-zag connection.
This result shows that, for the zero-sequence system, the phase impedance of the three-phase coil with a zig-zag connection has a value of 150.1, which is lower than the plus sequence impedance. This result is in accordance with that presented in the literature and obtained experimentally [18,19,21].

3.2. Limitations of the Numerical Model

The MATLAB/Simulink numerical model was created considering the following simplifications, which are commonly accepted in the literature: the elements involved in the 20 kV network structure are linear; the waveform of voltages and currents in the absence of the fault is sinusoidal; electrical lines with distributed parameters are replaced by schemes with lumped parameters; phase parameters (resistances, inductances, phase-to-earth capacitances) identical on the three phases; voltage drops on the line with fault are zero (the longitudinal parameters of the 20 kV lines are ignored); consumers supplied by the 20 kV lines are considered supplied by the line with the fault; the electric arc at the fault location is ignored.
Phase-to-ground faults caused in the 20 kV network do not have an electric arc at the fault location because the phase-to-ground connection is achieved through the resistance Rt. The faulty line is connected to the 20 kV bus bars in the transformer station after the physical realization of the fault. As a result, neglecting the electric arc in the validation of the MATLAB/Simulink numerical model is correct.
Neglecting voltage drops on 20 kV lines is acceptable because they typically represent less than 2% of the nominal voltage of the network. In distribution networks with the neutral connected to earth through a Petersen coil, the effective values of the fault currents in the case of phase-to-ground faults are much lower than the effective value of the nominal phase current of the 20 kV lines.
In the analyzed case, the nominal value of the phase current, considering the apparent power of the consumers identical to that of the 110 kV/20 kV transformer, is 462 A, and the effective value of the fault current in stabilized mode is 2.5 A when Rt = 8 Ω and 2.1 A when Rt = 268 Ω. Therefore, the neglect of voltage drops on the 20 kV lines is fully justified.
The MATLAB/Simulink numerical model created contains all the equipment involved in the structure of an electrical distribution network (sources, transformers, power lines, consumers). As a result, we consider that the results obtained in the case of the real distribution network analyzed are also valid in the case of other electrical distribution networks, provided that the MATLAB/Simulink numerical model takes into account the structure of the respective network.
The proposed test feeder lacks renewables, a contingency in the power system, i.e., a high-penetration of the distributed power generation modifies the load current values upon which the overcurrent protection is also set.
Although possible, the simulations do not include other types of faults, especially high impedance fault conditions. The noise interference is not considered in the study, i.e., for higher values of the fault resistance.

4. Validation of the Numerical Model

The validation of the numerical model associated with the 20 kV network was performed by comparing the results obtained using the numerical model with those obtained experimentally by causing phase-to-ground faults in the real 20 kV network, whose single-wire scheme is presented in Figure 1.

4.1. Experimental Measurements

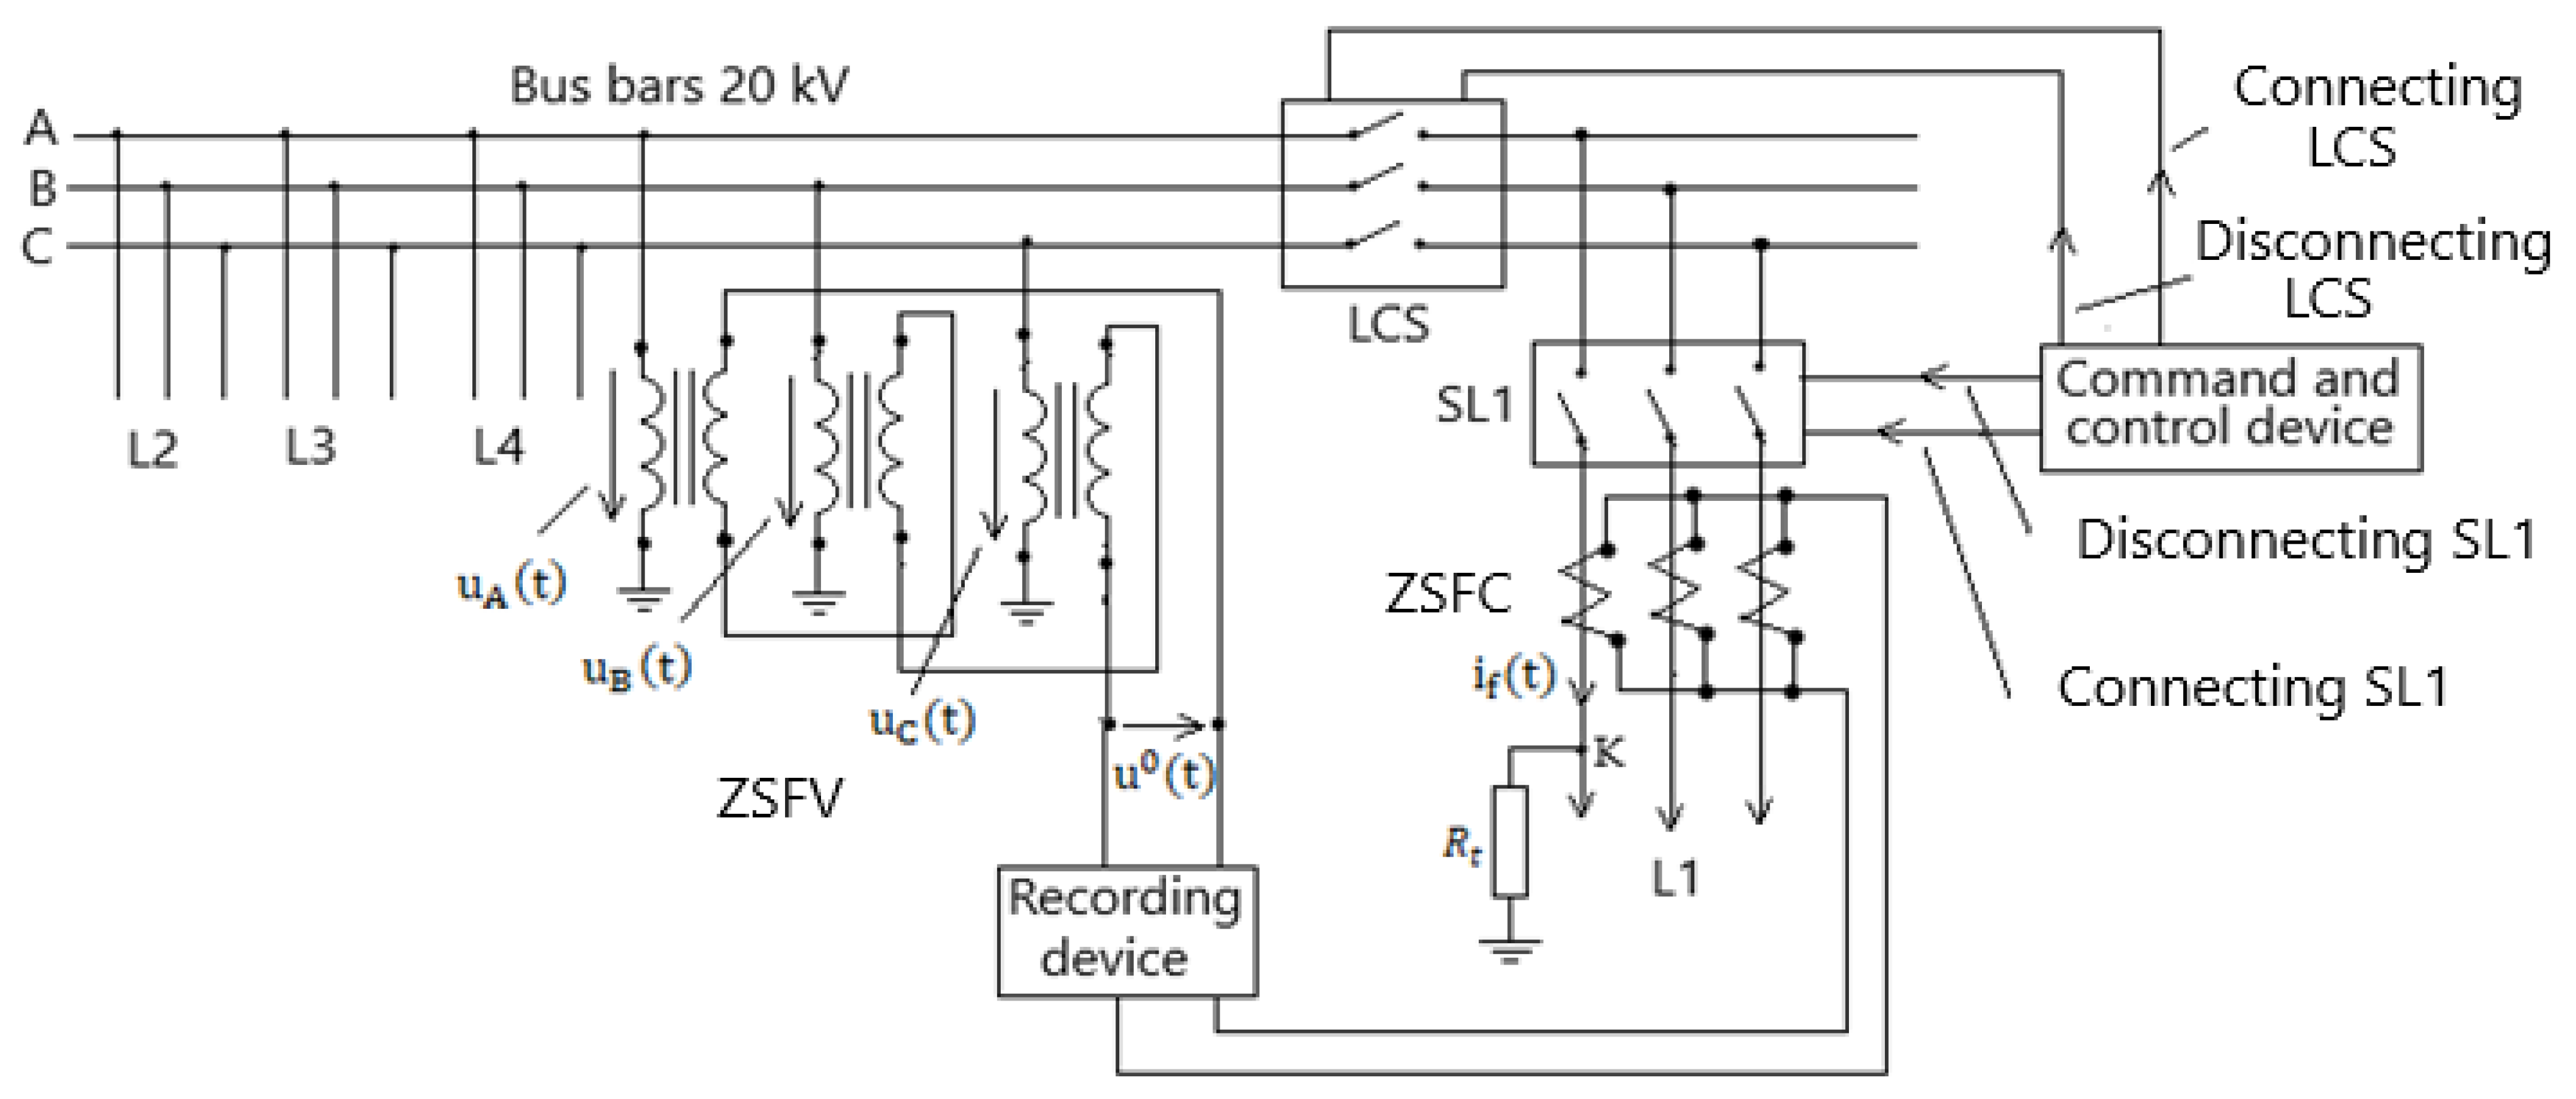
Verification of the results obtained by calculation, using MATLAB/Simulink models, was carried out by experimentally determining the calculated quantities in the 20 kV network analyzed. The experimental determination of zero-sequence voltage and fault current was carried out by recording them with a transient event recorder in electrical networks. Figure 8 shows how the transient event recorder is connected to the secondary circuits in the 110/20 kV transformer station.
The fault is caused on line L1 in Figure 8. The circuit-breaker switching command of the line on which the fault is caused is performed by a special device designed to perform measurements in 20 kV installations. To avoid fault extension during the experiments, the control device also generates the impulse for disconnecting the circuit breaker of the faulted line if the protections of this line do not detect the fault. Also, in case of refusal of the disconnection of the circuit breaker of the faulted line, the controller generates an impulse to command the disconnection of the LCS longitudinal coupling circuit breaker in Figure 8. In Figure 8, ZSFC represents the zero-sequence filter for current and ZSFV represents the zero frequency filter for voltage.
The CDR (Compact Disturbance Recorder) recording device is designed to record disturbances that may occur in electricity transmission and distribution networks, or in the electrical installations of large consumers. The user has the possibility to configure the start of recording on any logical or analog channel. The data containing pre-fault, fault, and post-fault are recorded in the main memory, where they are stored and can be analyzed.
The technical characteristics of the CDR are as follows: overall acquisition accuracy 2%; sampling frequency 2000 Hz; event resolution 500 μs; external synchronization; total recording time (pre-fault, fault, post-fault) 37 s.
The instantaneous values of the zero-sequence voltage related to the 20 kV bars in the transformer station ( u 0 ( t ) ) and the instantaneous value of the fault current ( i f t ) were recorded. The measurements were performed for the resistance values at the fault location (Rt) of 8 Ω and 268 Ω, and the 20 kV network operates in a 4.5% under-compensation regime. The phase-to-ground fault was achieved by connecting phase A (Figure 9) through Rt to ground. Therefore, the electric arc does not intervene in the phase-to-ground fault. The experimental results obtained are presented in Section 4.2.

4.2. Comparison Between Experimental and Simulation Results

Using the MATLAB/Simulink numerical model, the instantaneous value of the zero-sequence voltage related to the 20 kV bars in the transformer station and the instantaneous value of the fault current were determined.
The waveforms of the fault current (if) of the zero-sequence voltage related to the 20 kV bars in the transformer station obtained experimentally are compared with those obtained by simulation using MATLAB/Simulink.
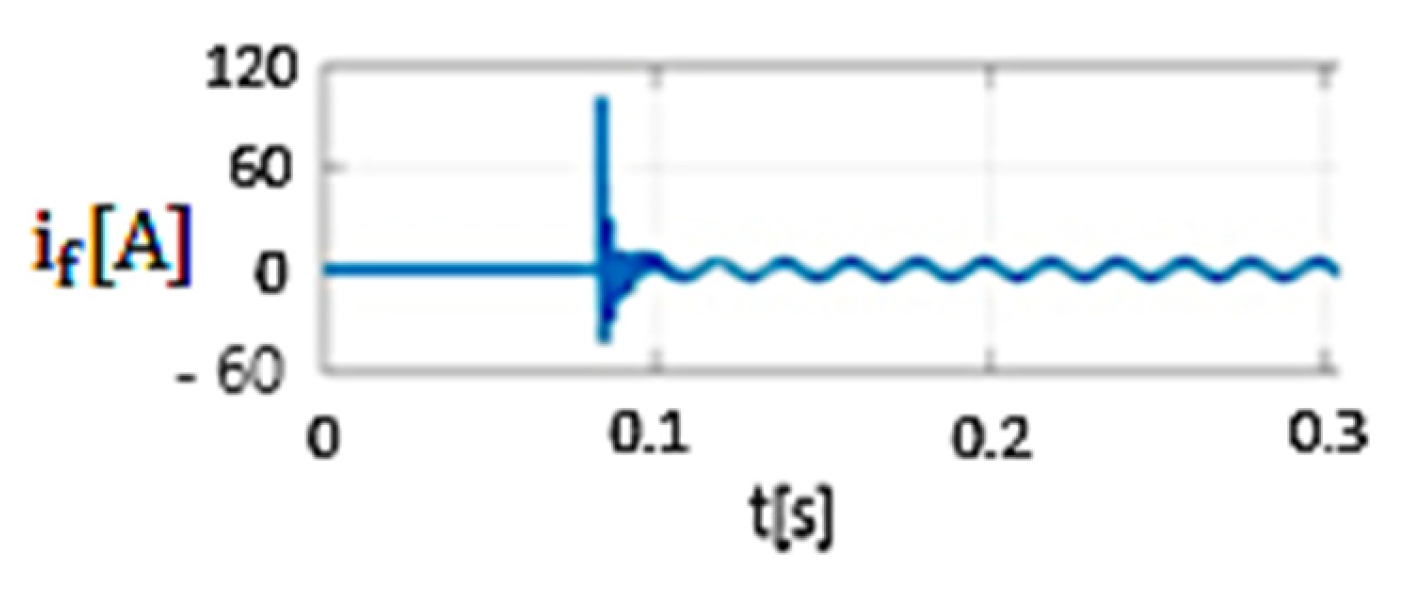
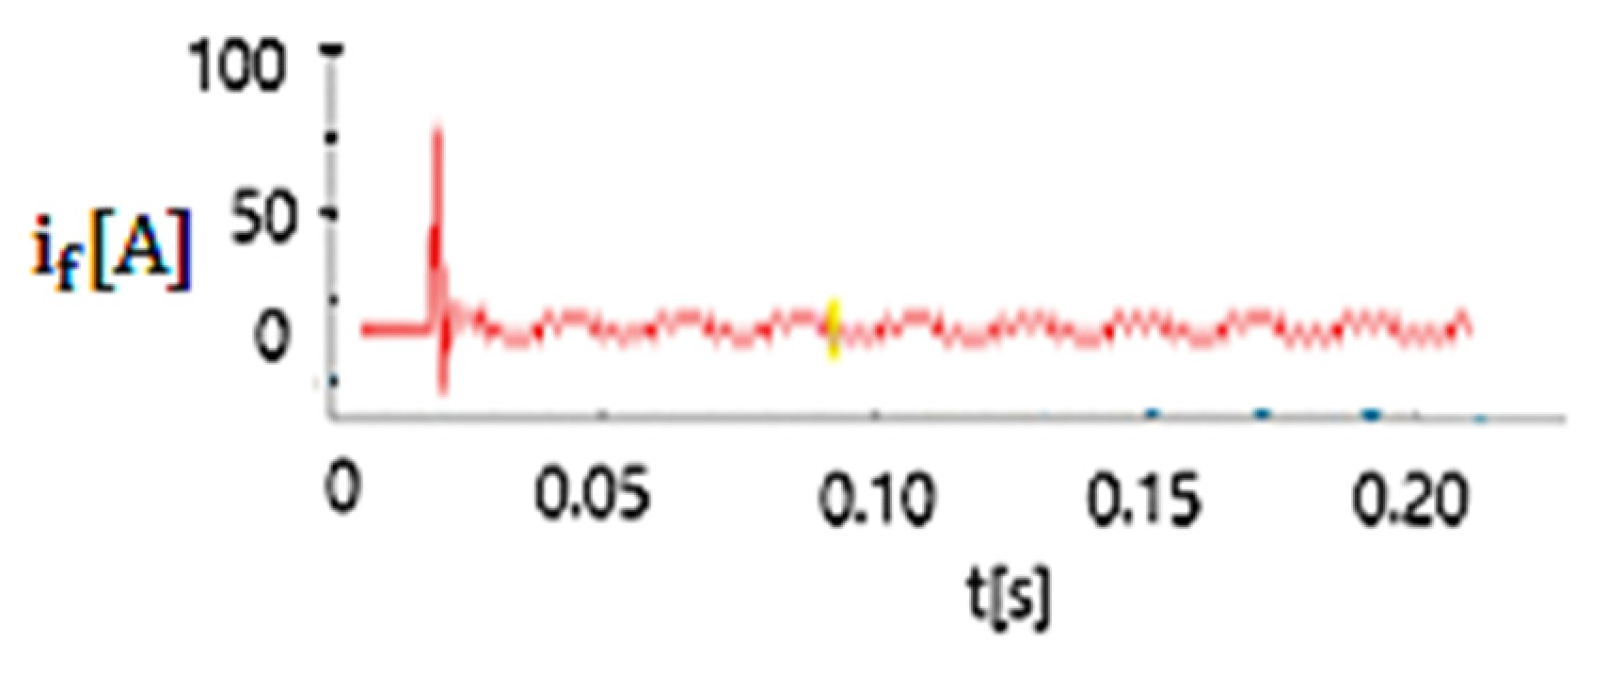
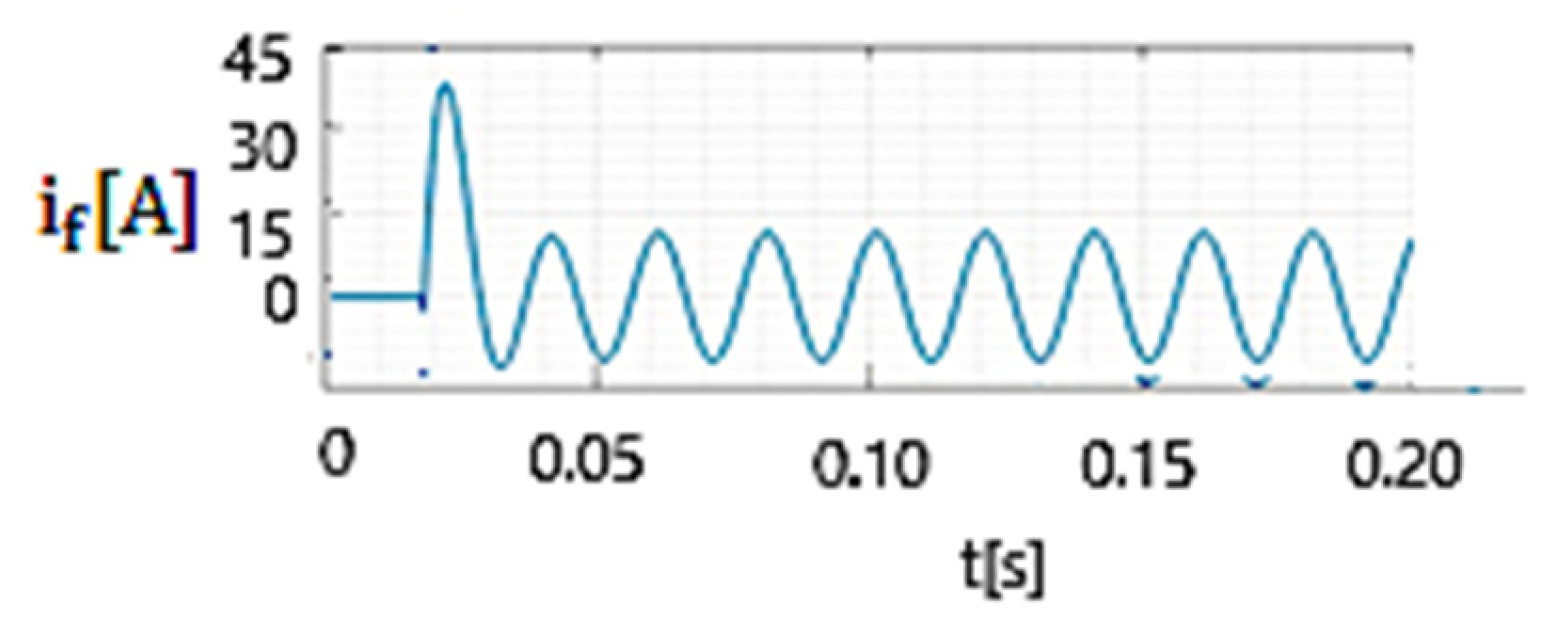
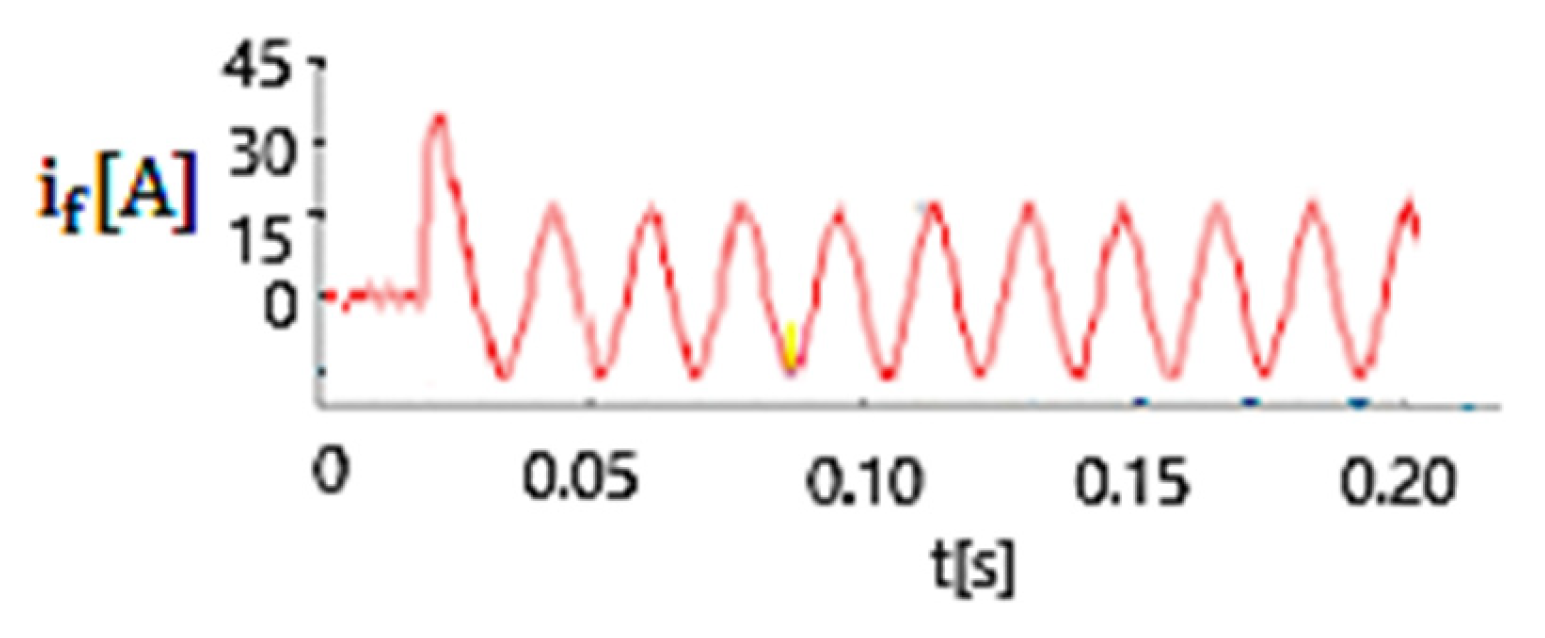
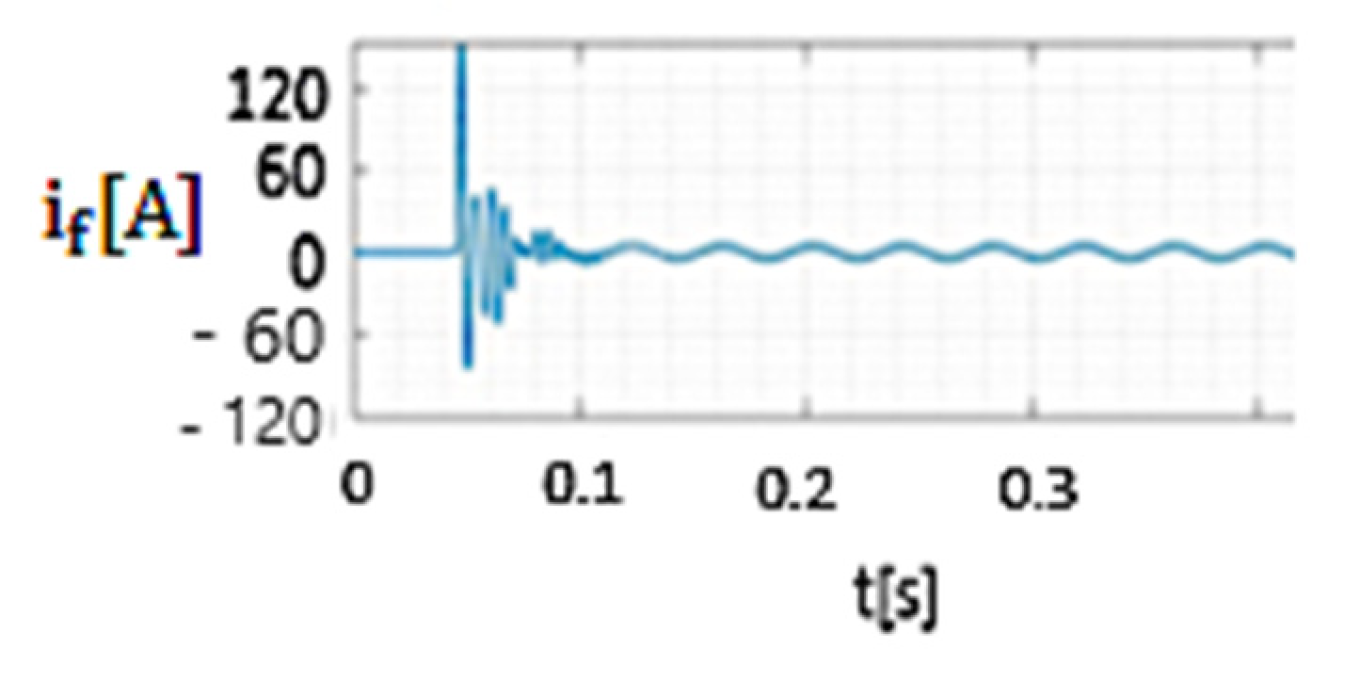
Figure 9 shows the time variation in the fault current obtained using the numerical model in MATLAB/Simulink, while Figure 10 shows the same current determined experimentally when the contact resistance at the fault location is 8 Ω.
Comparing the maximum values of the fault current obtained by the numerical simulation (Figure 9) and experimentally (Figure 10), it can be seen that the difference between the two values (80 A from numerical simulation and 75 A experimentally) is 6.67%, if the experimentally determined fault current value is considered as a reference. It can also be seen that, from the experimental determinations, the damping of the transient component of the fault current occurs over a longer time than that of the numerical simulation. This result is justified by the fact that the numerical simulation did not take into account the presence of current transformers in real installations nor the load of these transformers.
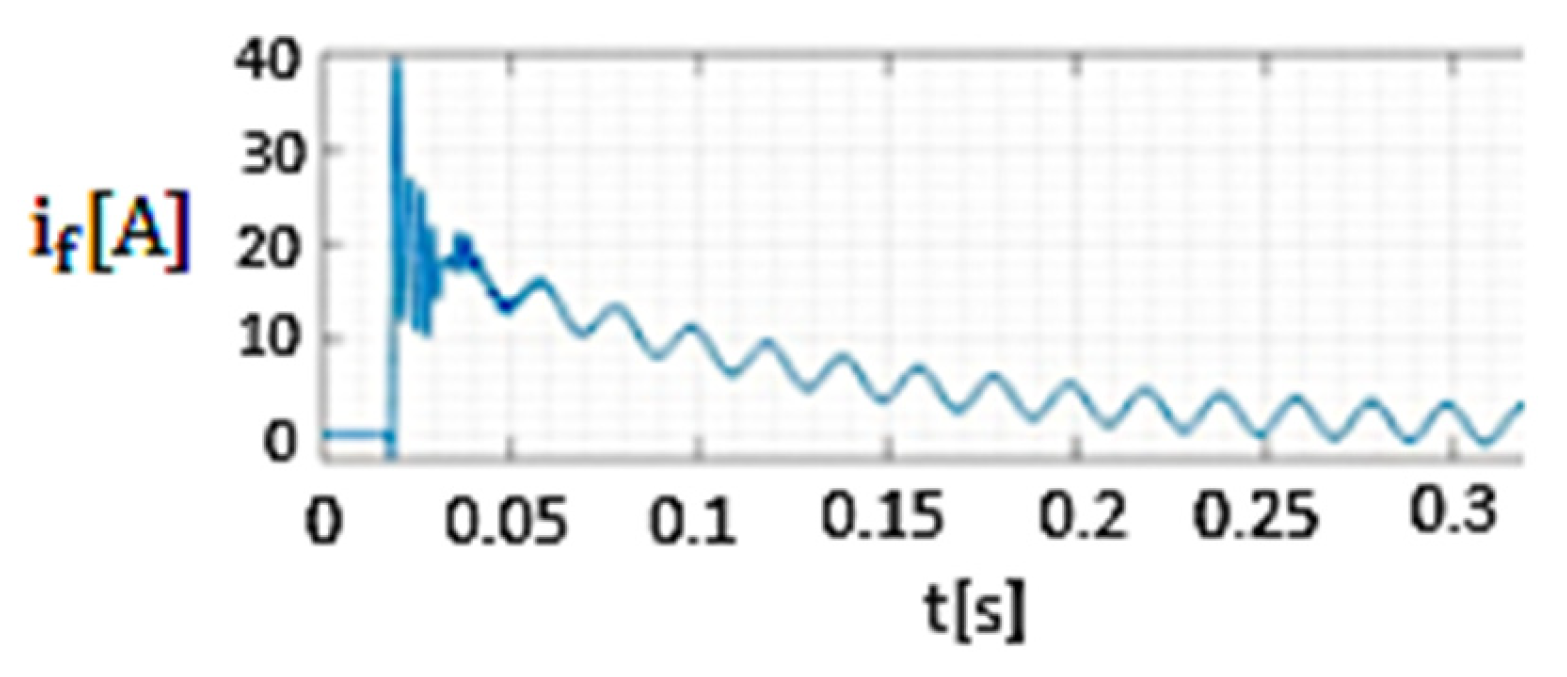
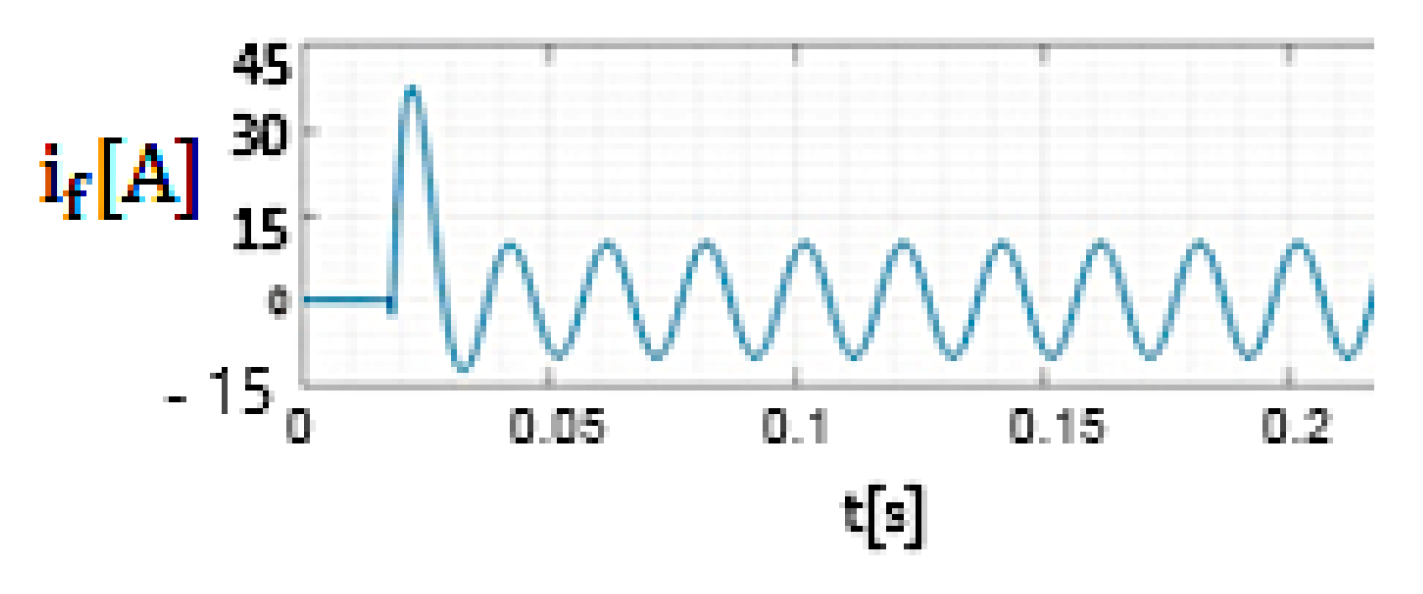
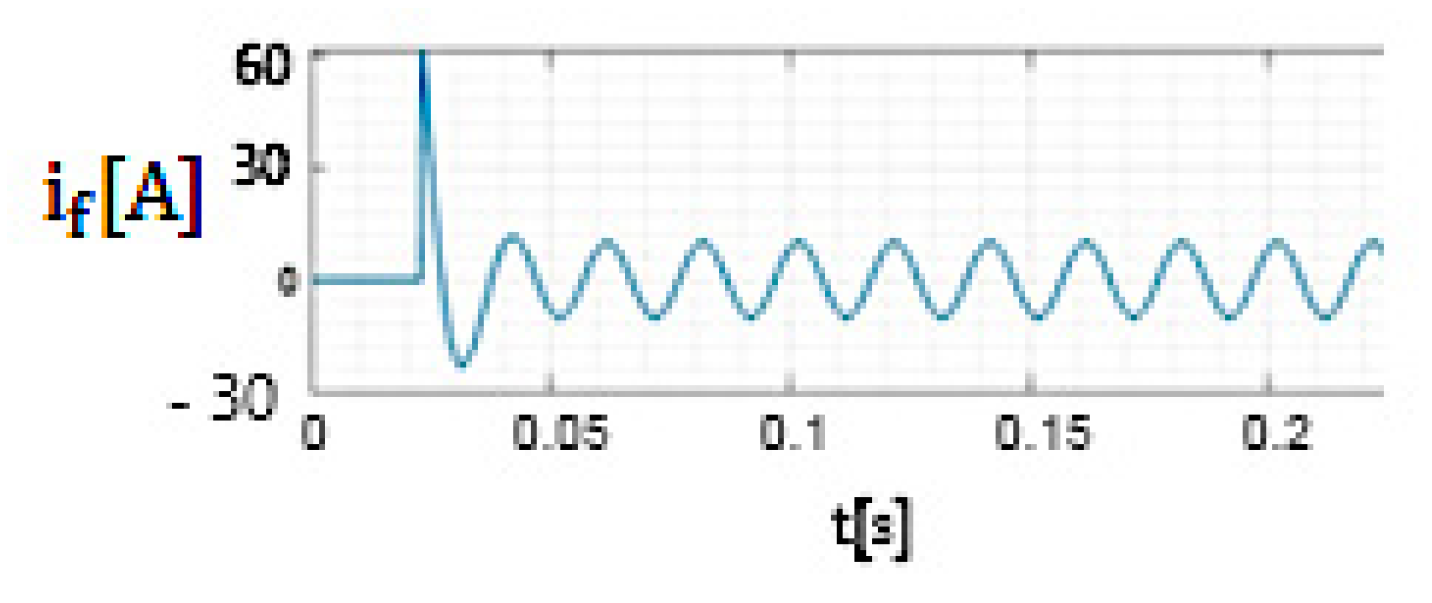
Figure 11 shows the time variation in the fault current obtained using the numerical model in MATLAB/Simulink, while in Figure 12 the same current is determined experimentally when the contact resistance at the fault location is 268 Ω.
Comparing the maximum values of the fault current obtained by the numerical simulation (Figure 11) and experimentally (Figure 12), it can be seen that the difference between the two values (42.5 A from numerical simulation and 40.5 A experimentally) is 4.94% if the experimentally determined fault current value is considered as a reference. It can also be seen that increasing the value of the contact resistance at the fault location (Rt) from 8 Ω to 268 Ω for the time interval necessary to damp the transient component results in the same value from the numerical simulation and the experimental determinations.
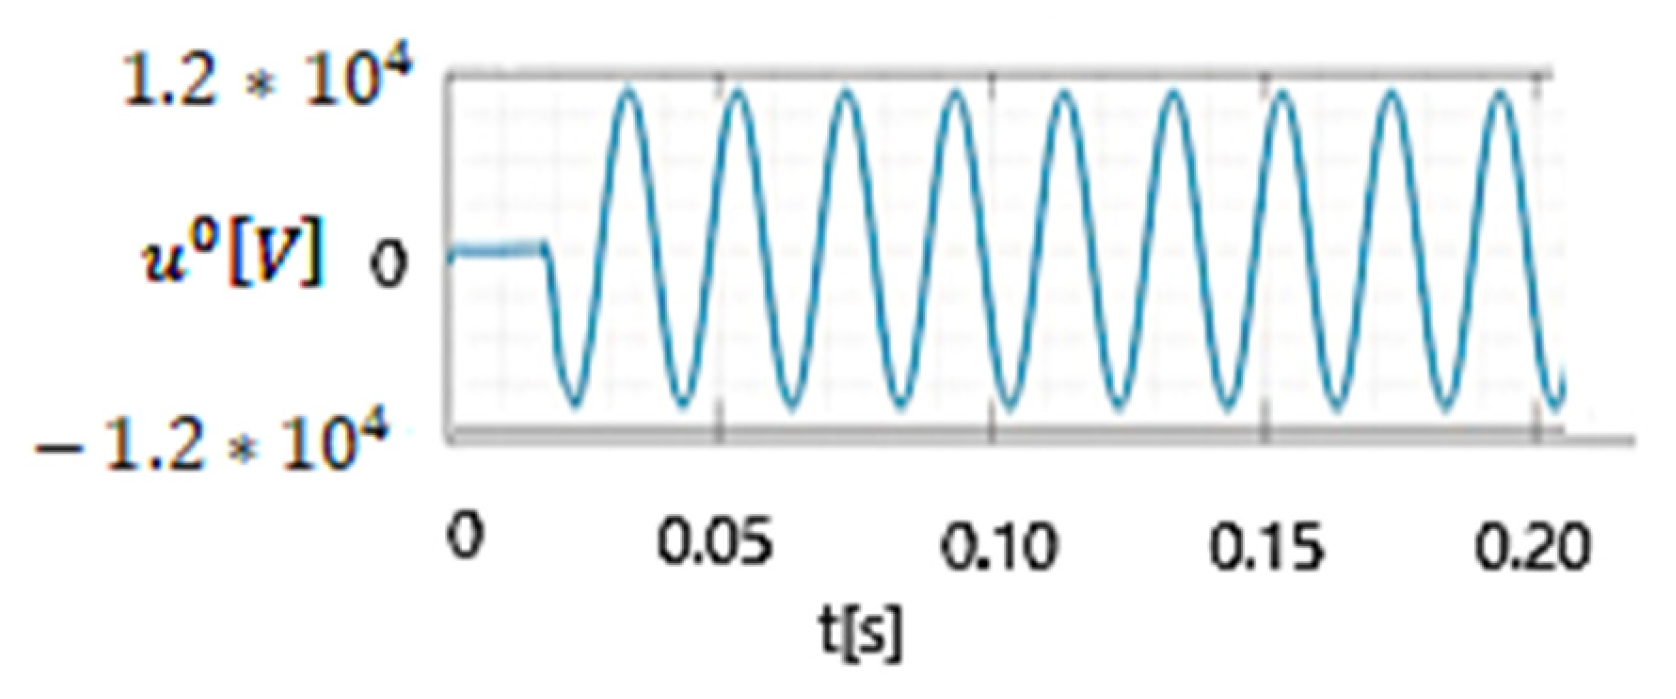
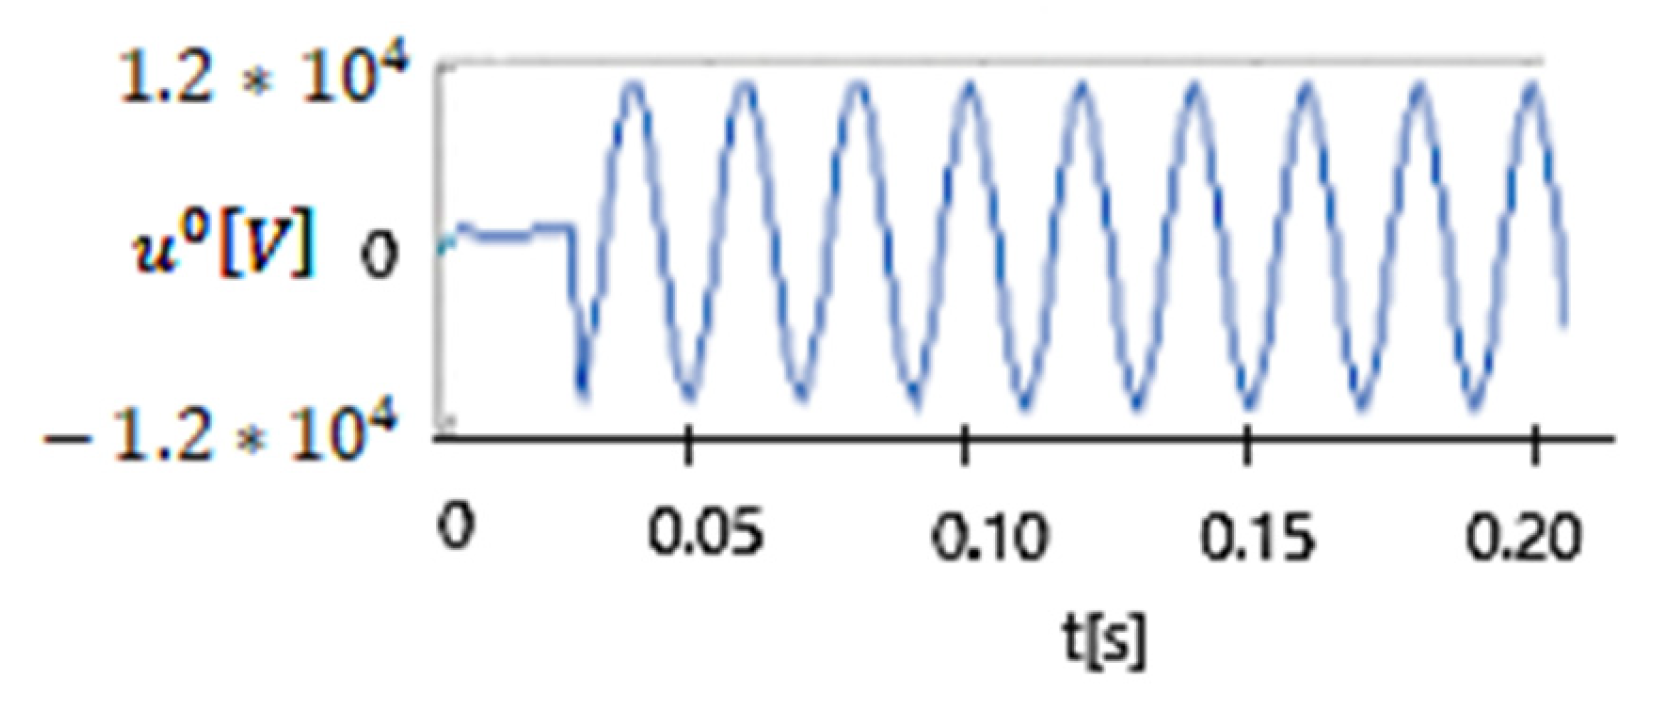
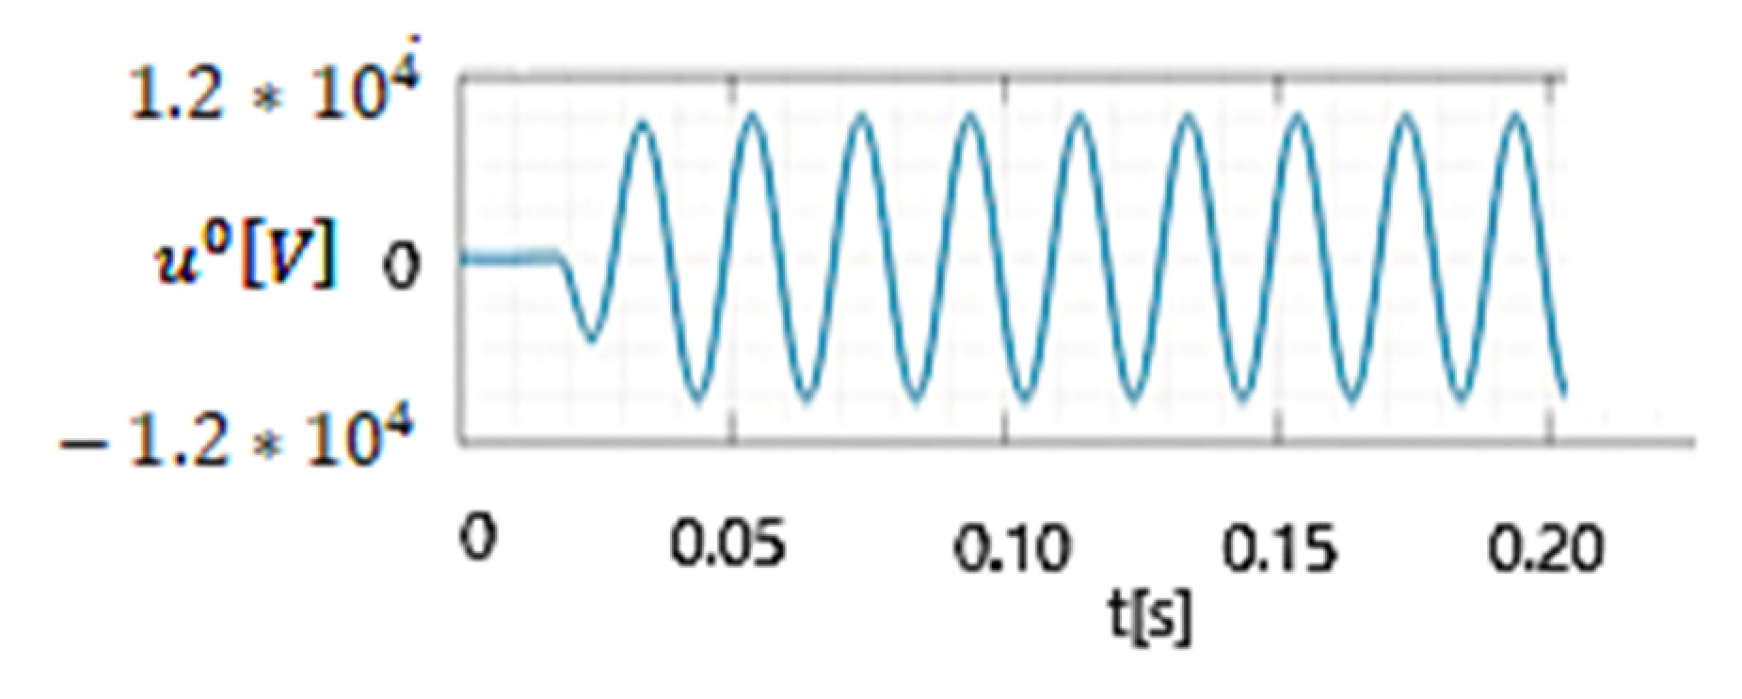
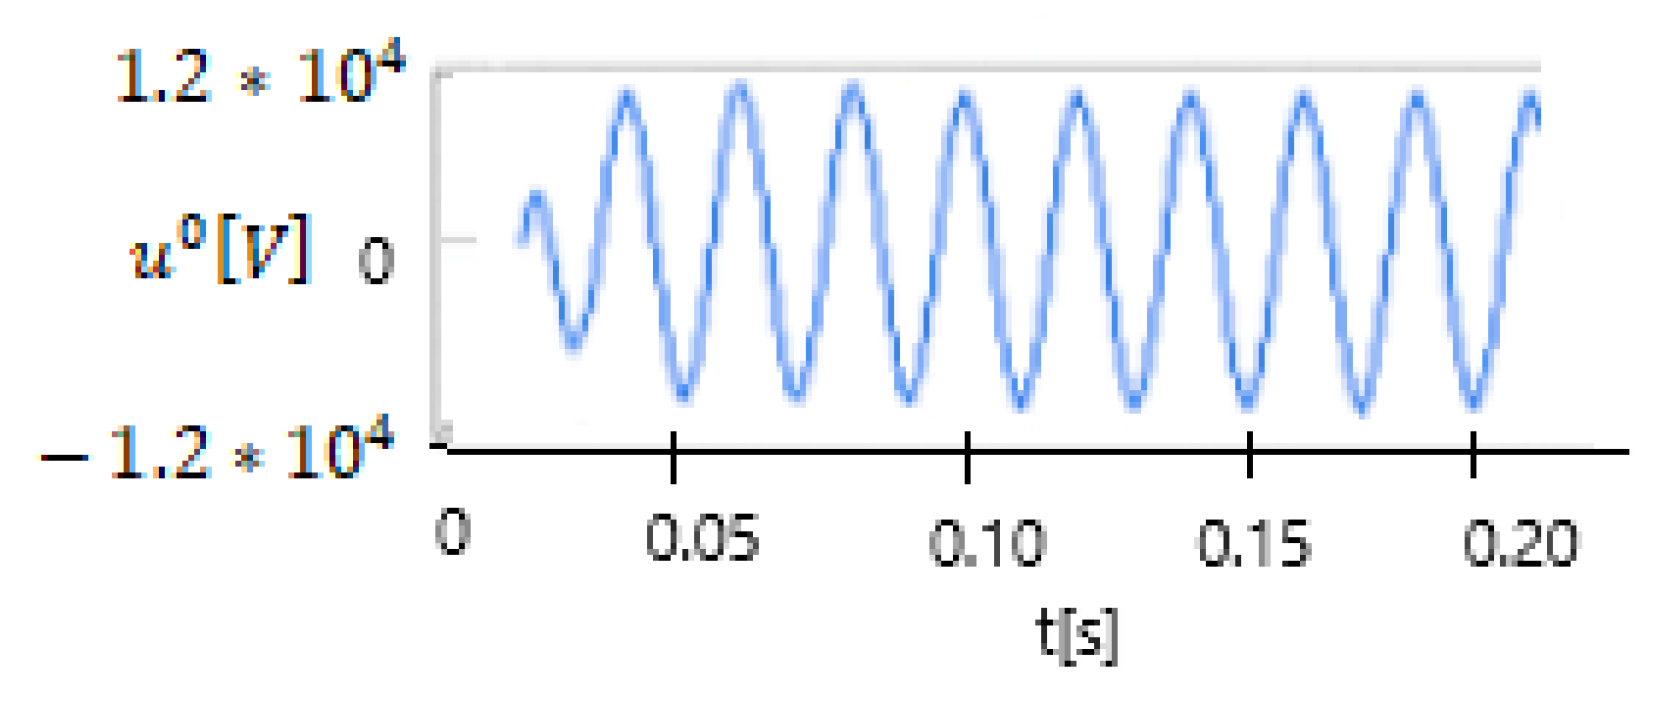
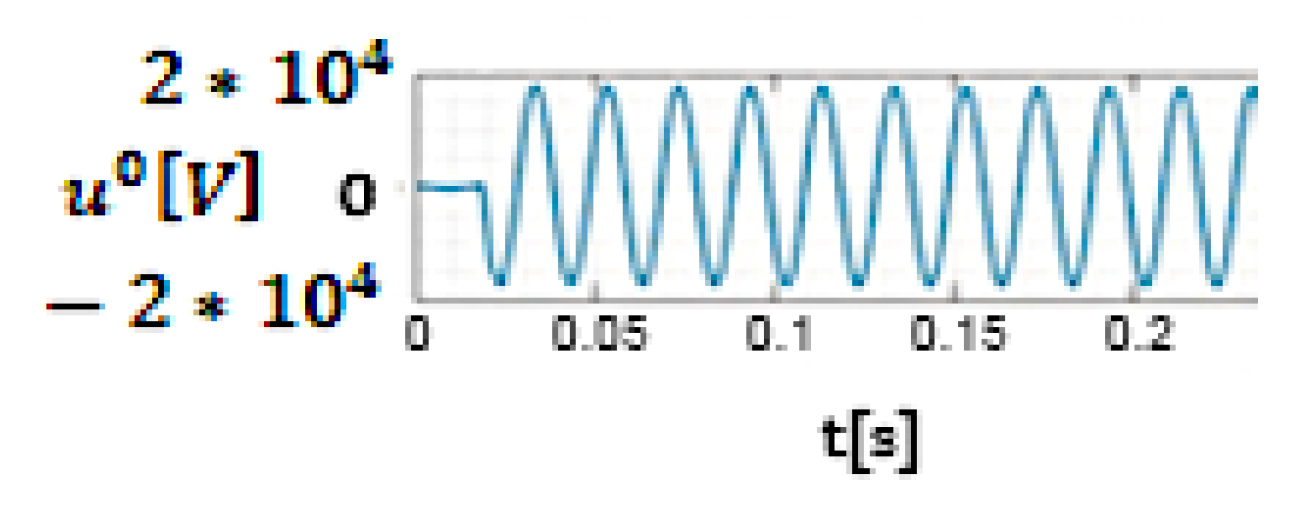
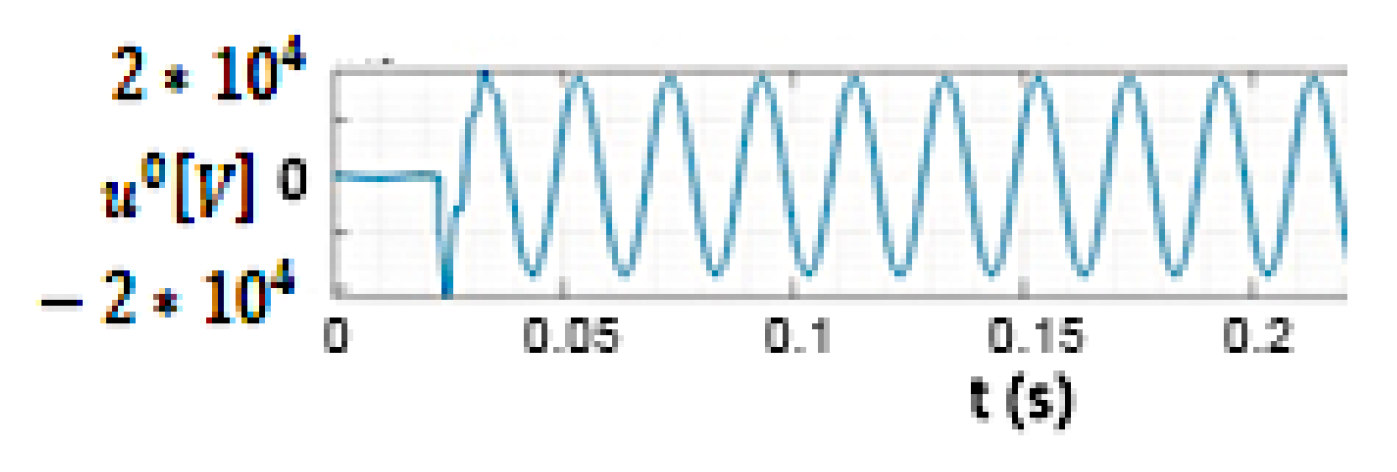
Figure 13 shows the time variation in the zero-sequence voltage of the 20 kV bars obtained using the numerical model in MATLAB/Simulink, while in Figure 14 the same voltage is determined experimentally when the contact resistance at the fault location is 8 Ω.
To calculate the zero-sequence voltage related to the 20 kV bars in the transformer station, the following relationship is used:
u 0 t = u a t + u b t + u c ( t ) 3
where u a t , u b t , u c ( t ) represents the phase voltages related to the 20 kV bars in the transformer station.
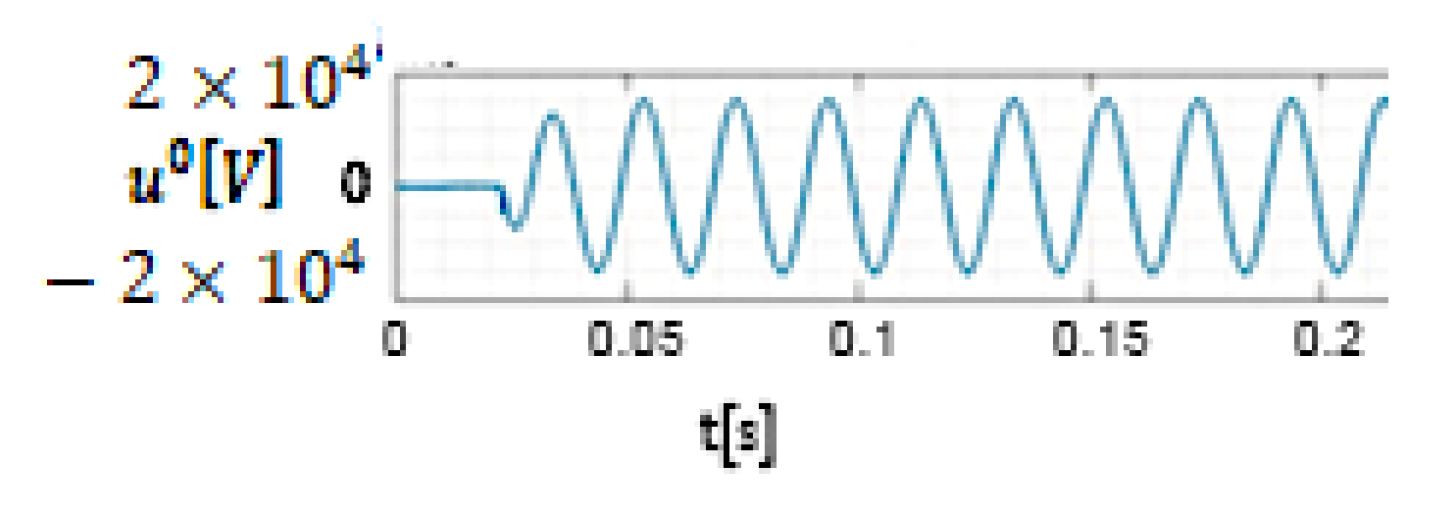
From Figure 13 and Figure 14, it can be seen that the value of the transient component in the zero-sequence voltage of the medium voltage bus bars is much lower than in the fault current, and the difference between the effective values of the zero-sequence voltage in the stabilized regime determined either experimentally (10,900 V) or by numerical simulation (11,250 V) is 3.21% if the experimentally determined zero-sequence voltage of the medium voltage bus-bar value is considered as a reference.
Figure 15 shows the time variation in the zero-sequence voltage of the 20 kV bus bars obtained using the numerical model in MATLAB/Simulink, while in Figure 16 the same voltage is determined experimentally when the contact resistance at the fault location is 268 Ω.
From Figure 15 and Figure 16, it can be seen that the value of the transient component in the zero-sequence voltage of the medium-voltage bars is lower than in the fault current, and the difference between the effective values of the zero-sequence voltage in the stabilized regime determined both experimentally (10,500 V) and by numerical simulation (9850 V) is 6.19% if the experimentally determined zero-sequence voltage of the medium voltage bus-bar value is considered as a reference. Given the precision with which the values of the parameters of the elements involved in the structure of the 20 kV network are known, as well as the accuracy class of the equipment used for the experimental determinations, the differences between the fault current, the zero-sequence voltage of the 20 kV bus bars in the transformer station obtained experimentally, and using the MATLAB/Simulink numerical model are technically acceptable. As a result, the numerical model is used for the analysis of transient regimes caused by phase-to-ground faults.

5. Analysis of the Transient Regime Caused by Phase-to-Ground Faults—Numerical Results

Using the numerical model in Figure 3, we analyze how the transient regime caused by the phase-to-ground fault in the 20 kV electrical network with the single line diagram shown in Figure 1 is influenced by the following parameters: the initial phase of the voltage at the time of the fault (α); the electrical resistance of the insulation of the three-phase electrical installation (Riz); the resistance at the fault location (Rt); and the operating regime of the network, 20 kV. The fault current and the zero-sequence voltage of the 20 kV bus bars are analyzed, since these quantities are most frequently used to detect a phase-to-ground fault in 20 kV networks. The quantities measured during the simulations are saved in a file with the .mat extension and are processed using a program written in MATLAB Live Editor [45]; these are then presented in the form of oscillograms and in tables. For each case studied, the duration of the transient regime, i.e., the time constant of the electrical circuit equivalent to the 20 kV electrical network, can be determined. The maximum values of the fault current of the zero-sequence voltage of the 20 kV bus bars in the transformer station are determined from the transient regime, and the effective values of these quantities is determined from the new permanent regime. In the new permanent regime, the transient components of the fault current and the zero-sequence voltage of the 20 kV bus bars in the transformer station are damped.
The symmetrical three-phase system of phase voltages of the source in the numerical model (uA(t), uB(t), and uC(t) in Figure 3) is expressed according to the following relations:
u A t = 12.5 × 2 × s i n 100 × π × t + α k V u B t = 12.5 × 2 × s i n 100 × π × t + α 120 ° k V u C t = 12.5 × 2 × s i n 100 × π × t + α 240 ° k V

5.1. Influence of the Initial Phase of the Voltage at the Fault Location

To analyze the influence of the initial phase (α from relation (3)) of the voltage at the fault location on the maximum value of the fault current in the transient regime caused by the phase-to-ground fault, the following values were considered for 0 ° , 90 ° . From the calculations performed, it resulted that the maximum value of the fault current during the transient regime is obtained when α = 88°, and the minimum value of the fault current is obtained when α = 0°, if the 20 kV network operates in resonance regime. To verify this, the values 87° and 89° were considered for α. If the 20 kV network operates in resonance regime and the value of the resistance at the fault location is 8 Ω, the time variation in the fault current is presented in Figure 17 when α = 0° and in Figure 18 when α = 88°. The time variation in the zero-sequence voltage related to the 20 kV bus bars is presented in Figure 19 when α = 0° and in Figure 20 when α = 88°.
If the 20 kV network operates in resonance regime and the value of the resistance at the fault location is 268 Ω, the time variation in the fault current is shown in Figure 21 when α = 0 and in Figure 22 when α = 88°. The time variation in the zero-sequence voltage related to the 20 kV bus bars is shown in Figure 23 when α = 0 and in Figure 24 when α = 88°.
Figure 25 shows the dependence of the maximum value of the fault current as a function of the initial phase (α) of the voltage when the 20 kV network operates in resonance mode and the value of the contact resistance at the fault location is either 8 Ω or 268 Ω.
From Figure 25, it follows that when the 20 kV network operates in resonance mode, the ratio between the maximum value of the fault current (α = 88°) and the minimum (α = 0°) is 2.34, and if the 20 kV network operates in 6.1% over-compensation mode, the same ratio becomes 1.79.
From what has been presented, it follows that in the analysis of the transient regime caused by the phase-to-ground fault in a 20 kV network, the initial phase (α) of the voltage at the fault location cannot be ignored, because it has a large influence on the maximum value of the fault current.
The transient component of the zero-sequence voltage of the 20 kV bus bars during the transient regime caused by the phase-to-ground fault has a value much lower than that of the fault current. From Figure 19 and Figure 20 it can be seen that the maximum value of the zero-sequence voltage of the 20 kV bus bars is 2% higher when α = 88°, compared to that when α = 0°.

5.2. Influence of the Operating Mode of the Electrical Network

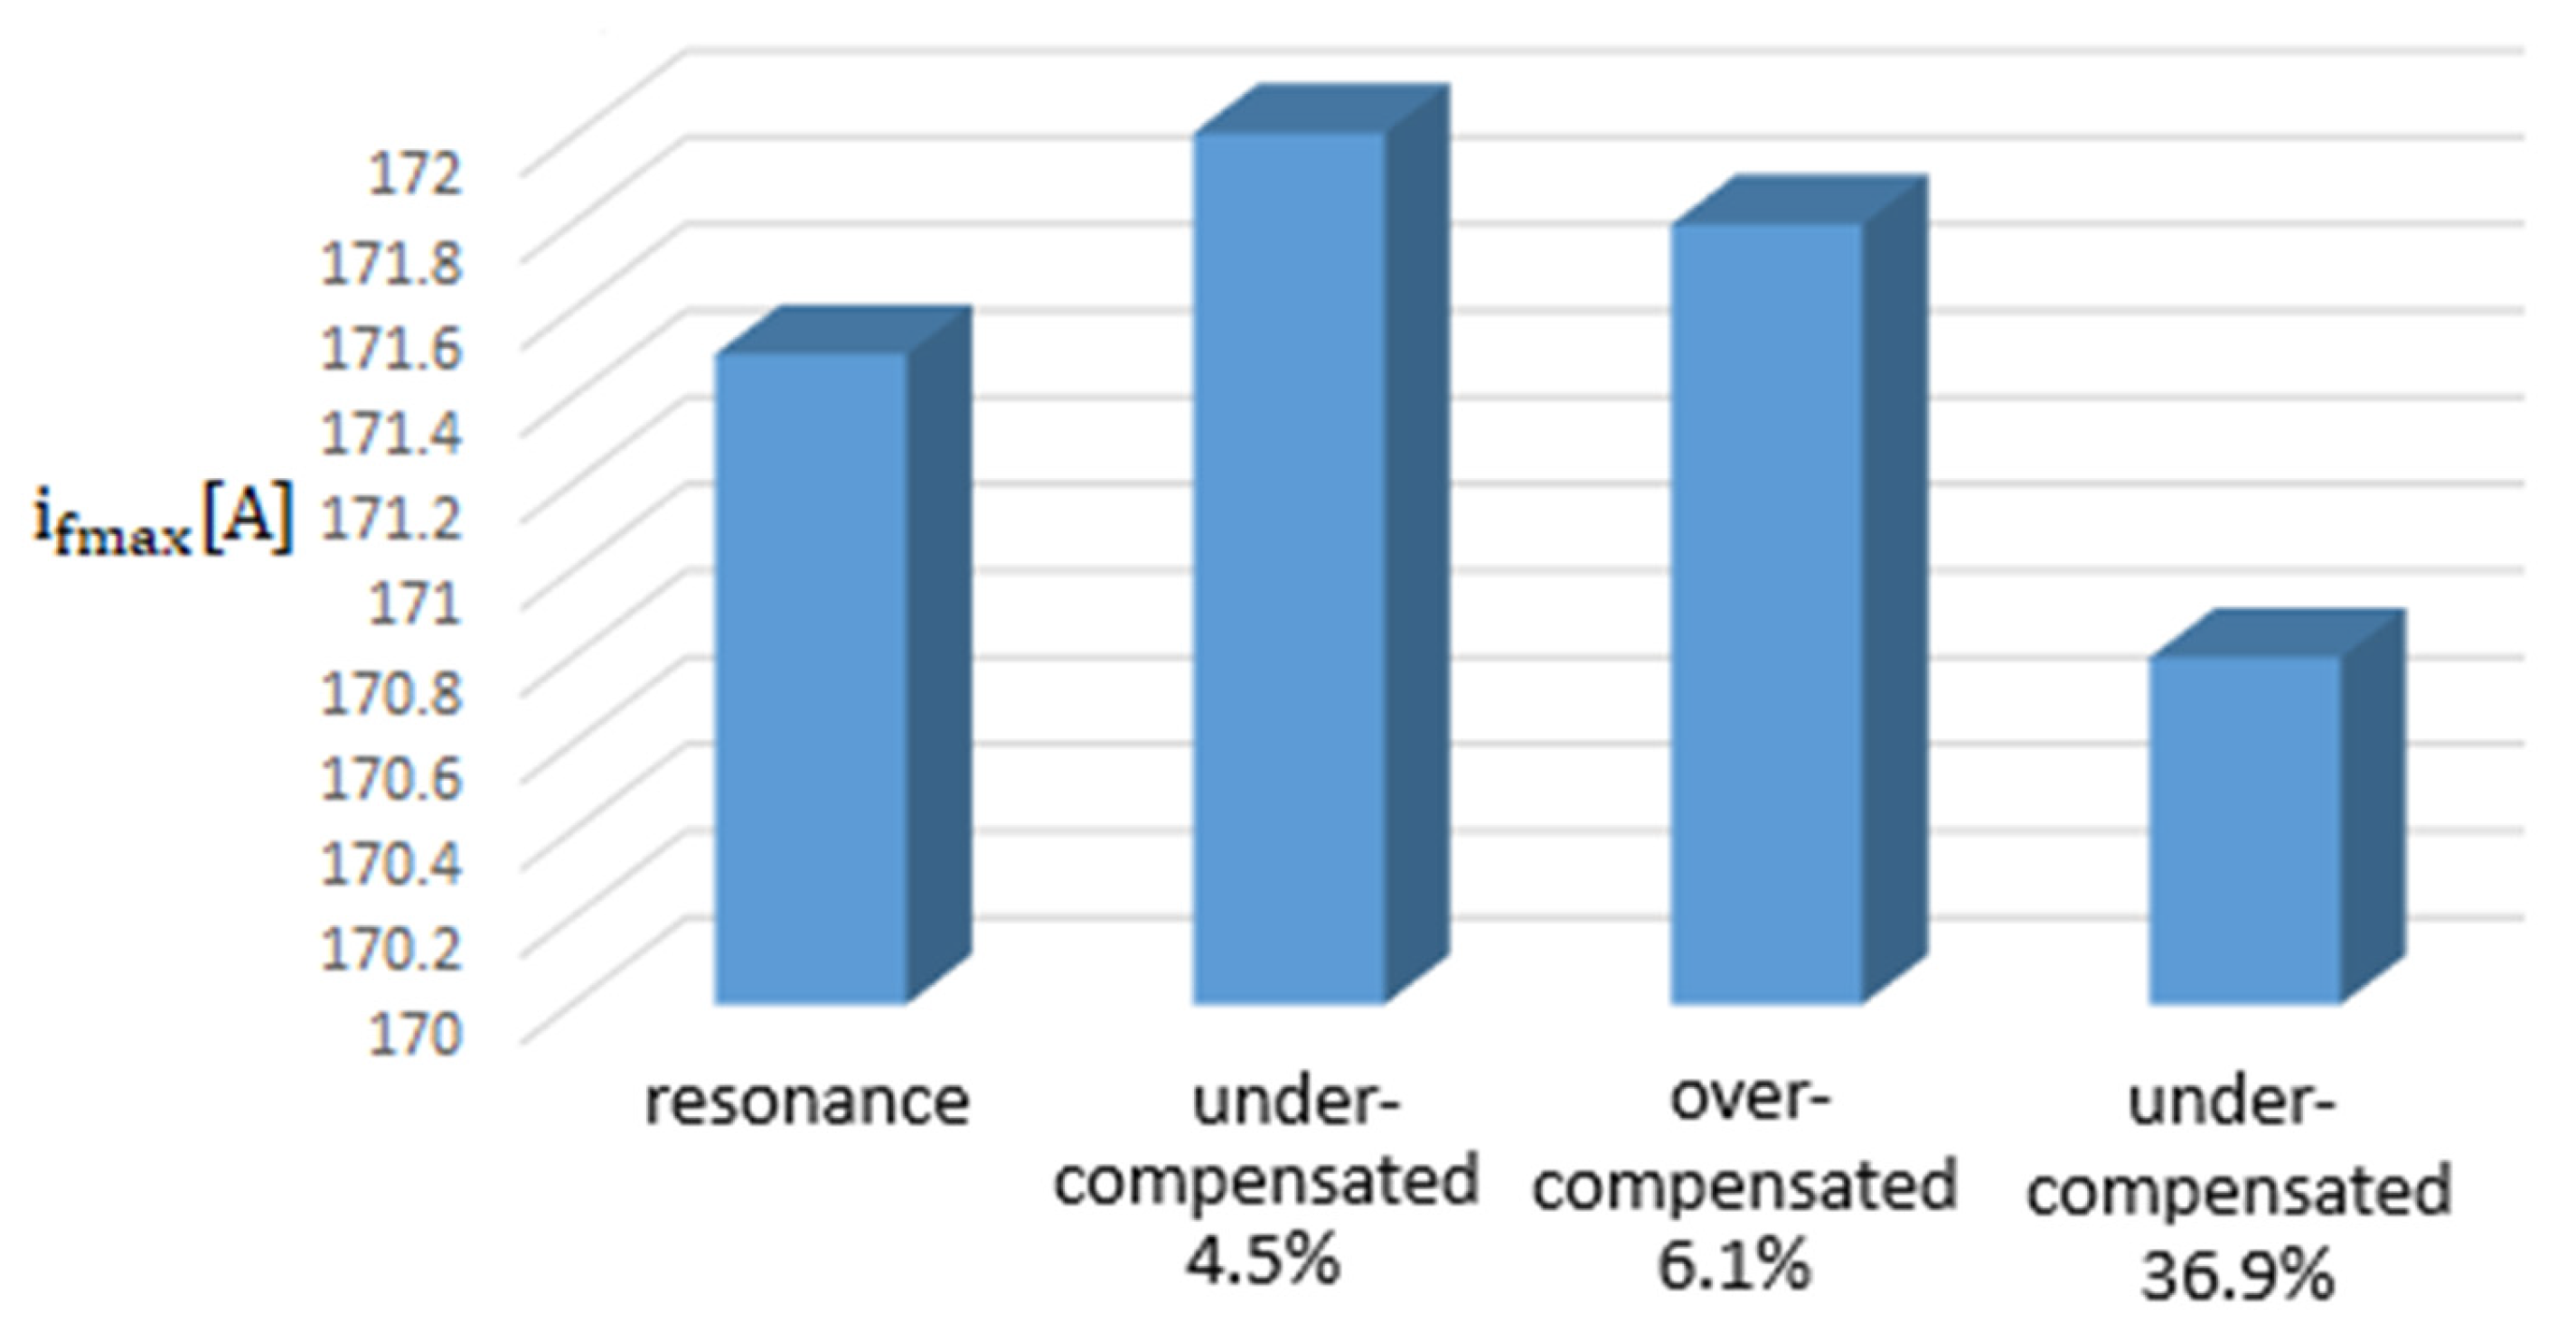
To analyze how the operating mode of the 20 kV network influences the maximum value of the fault current, the following network operating regimes were considered: resonance; under-compensated at 4.5%; over-compensated at 6.1%; and under-compensated at 36.9%. For the contact resistance at the fault location, a value of 8 Ω was considered, and the initial phase of the voltage at the fault location was α = 88° (the value of the initial phase for which the fault current has the highest value). The results obtained are presented in Figure 26.
From Figure 26 it can be seen that the highest value of the fault current is maximum when the 20 kV network operates in a 4.5% under-compensation regime (171.9 A), and minimum when the 20 kV network operates in a 36.9% under-compensation regime (170.7 A).
As a result, we can state that the maximum value of the fault current in the transient regime caused by the phase-to-ground fault is insignificantly influenced by the regime in which the 20 kV network operates but is strongly influenced by the initial phase (α) of the voltage at the fault location. So, in resonance regime the minimum value of the fault current during the transient regime is 20% lower than when the 20 kV network operates in the overcompensated mode of 6.1%.
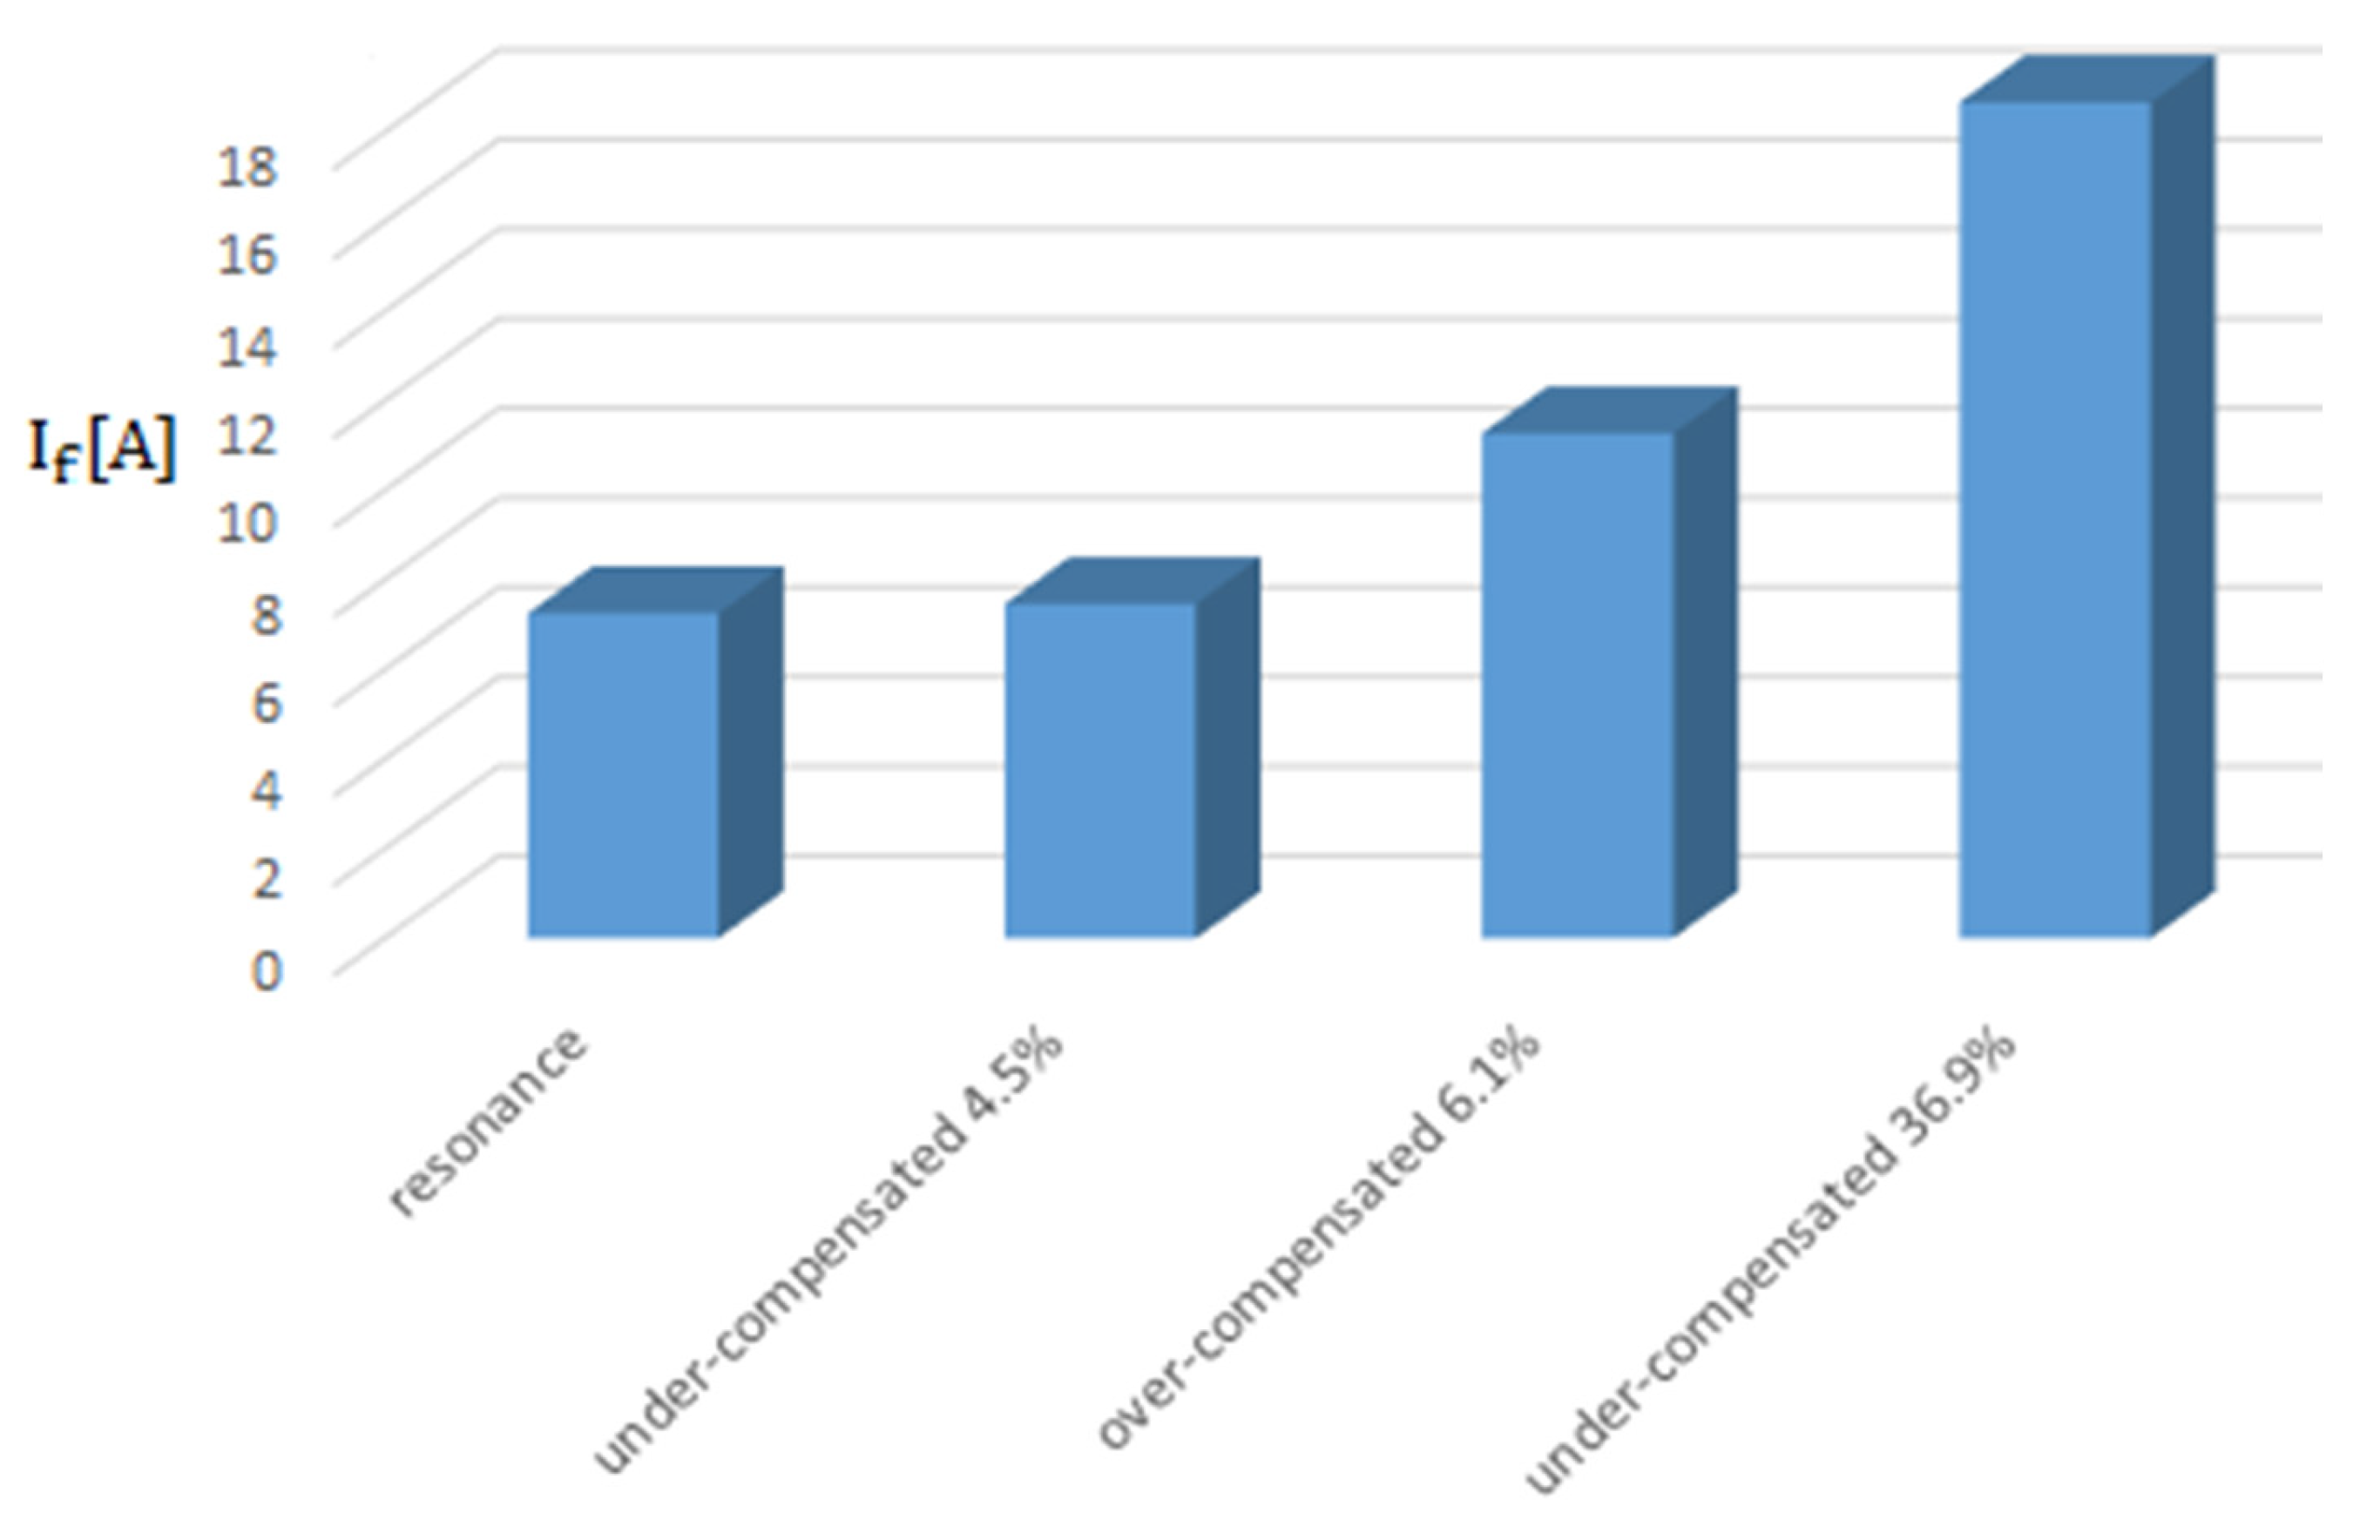
Figure 27 shows the dependence of the effective value of the fault current on the operating mode of the 20 kV network. From this figure it can be seen that the mode in which the network operates influences the effective value of the fault current much more than the maximum value of the fault current. The difference between the maximum value of the fault current if the network operates in resonance mode and in under-compensation mode of 36.9% represents 0.3% of the maximum value of the current when the network operates in resonance mode, and in stabilized mode the same difference is 157.2%. As a result, in calculating the fault current in stabilized mode, the operating mode of the distribution network cannot be ignored.

5.3. The Influence of the Insulation Resistance of the Electrical Network

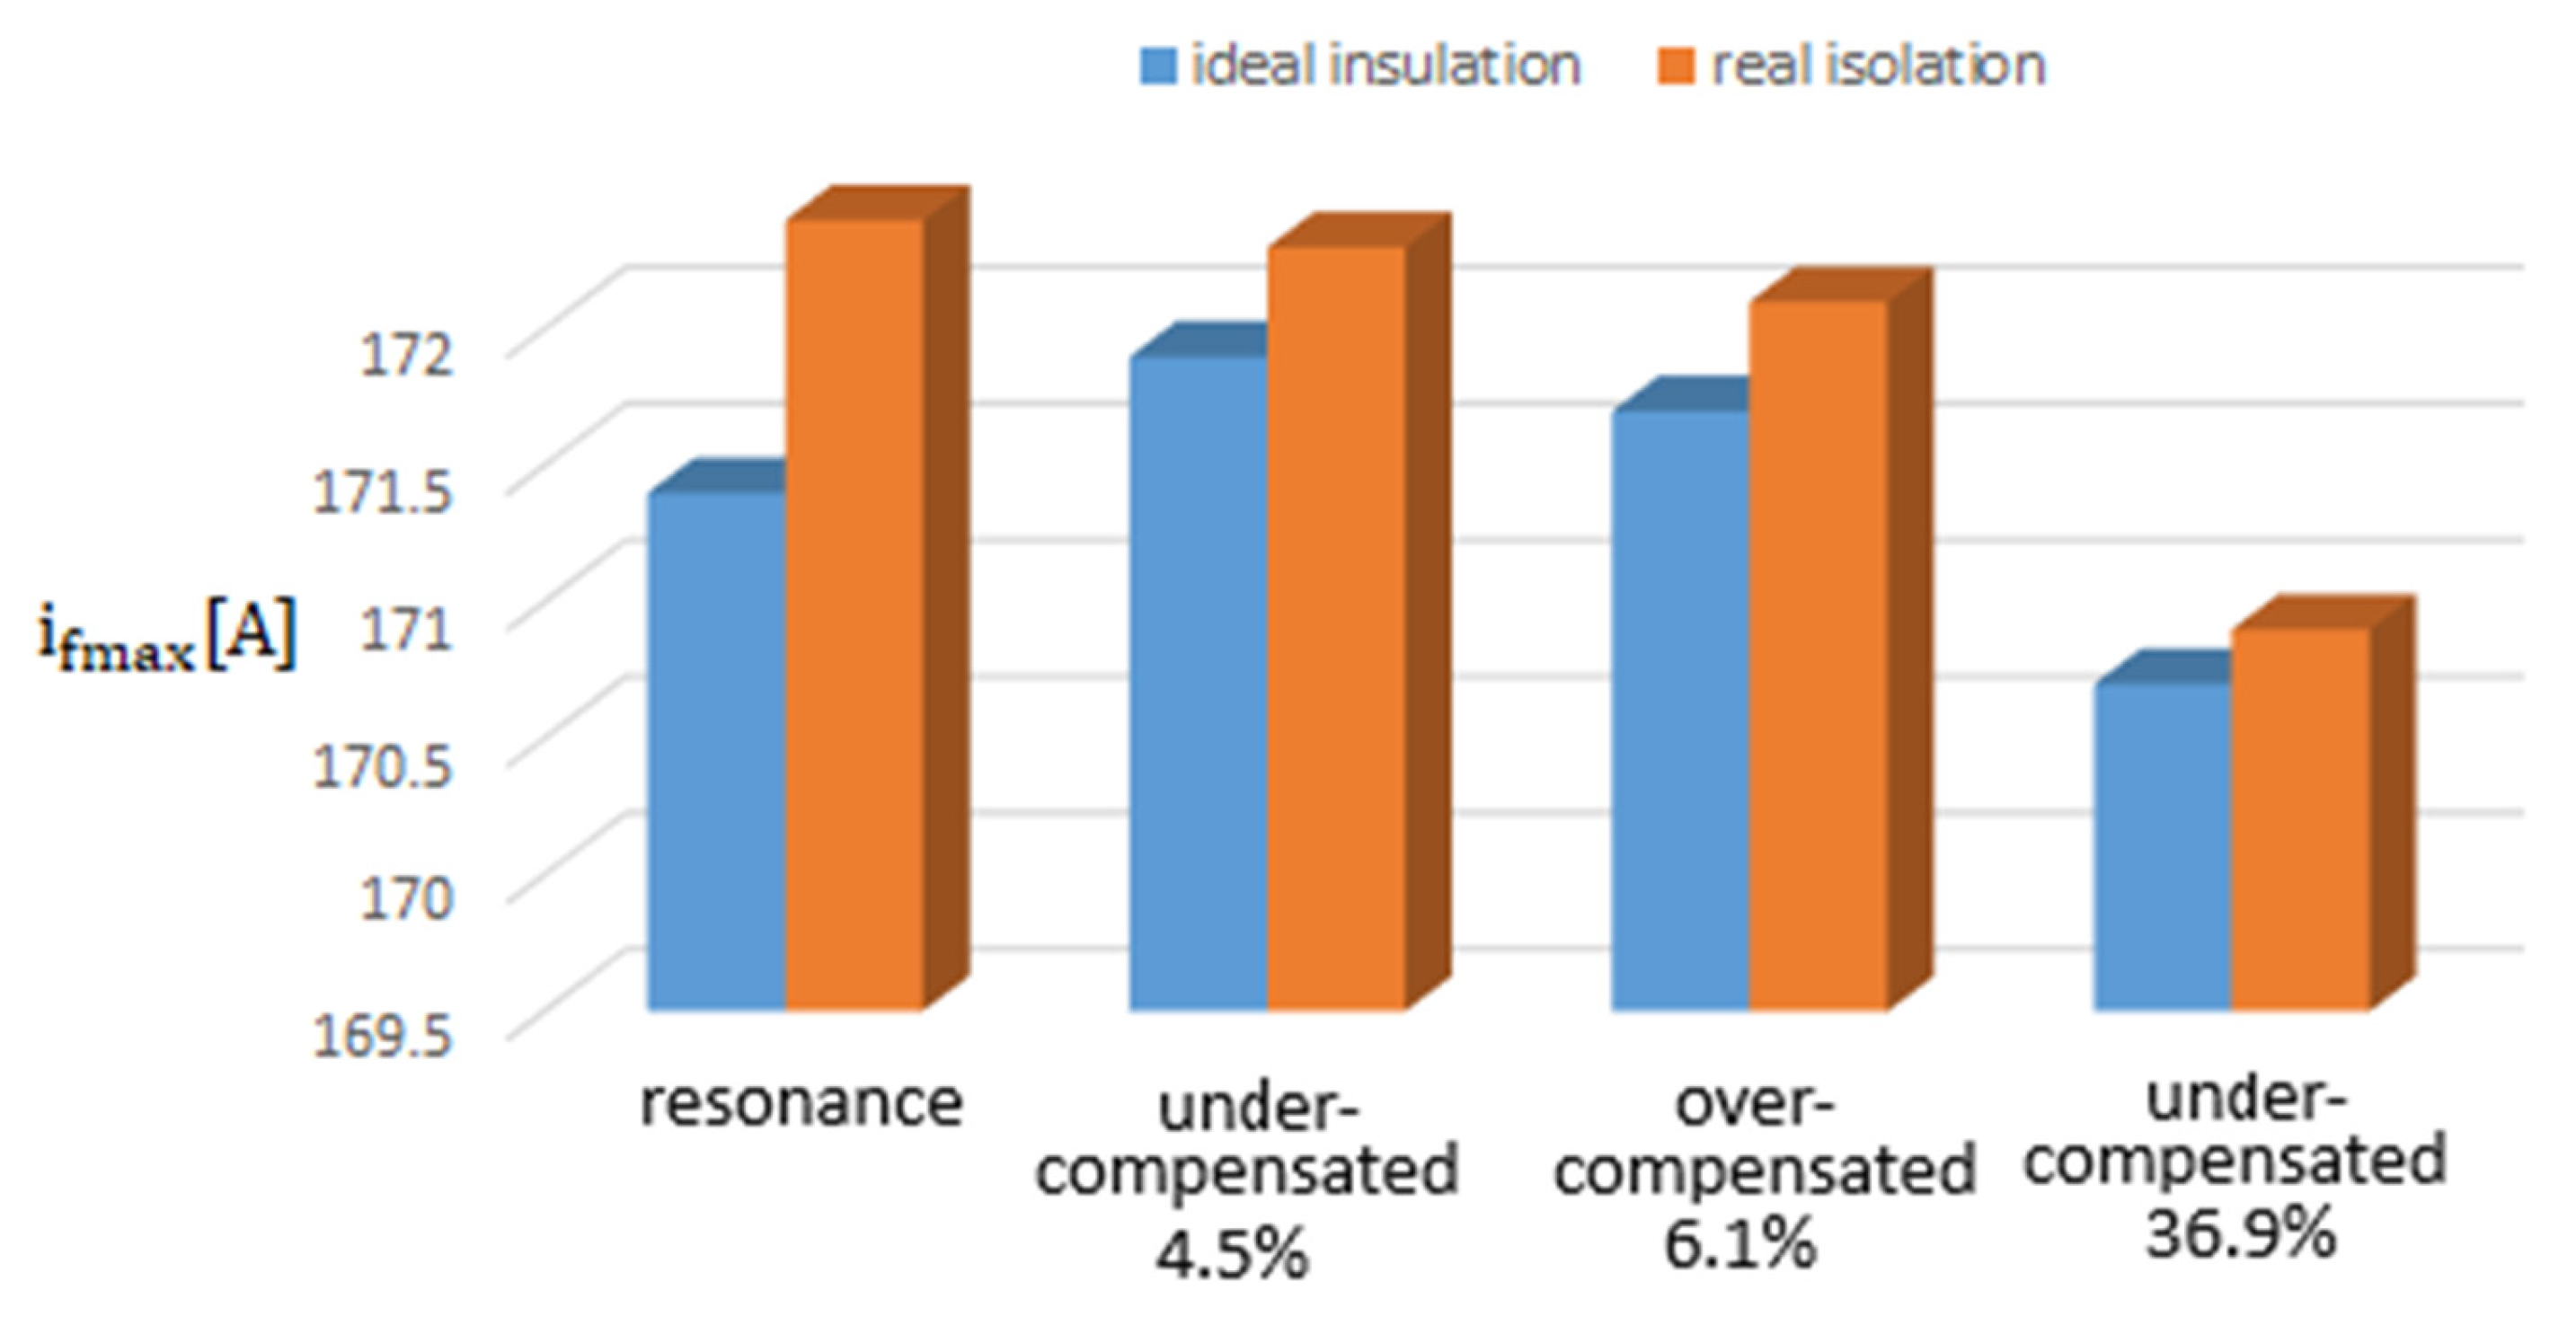
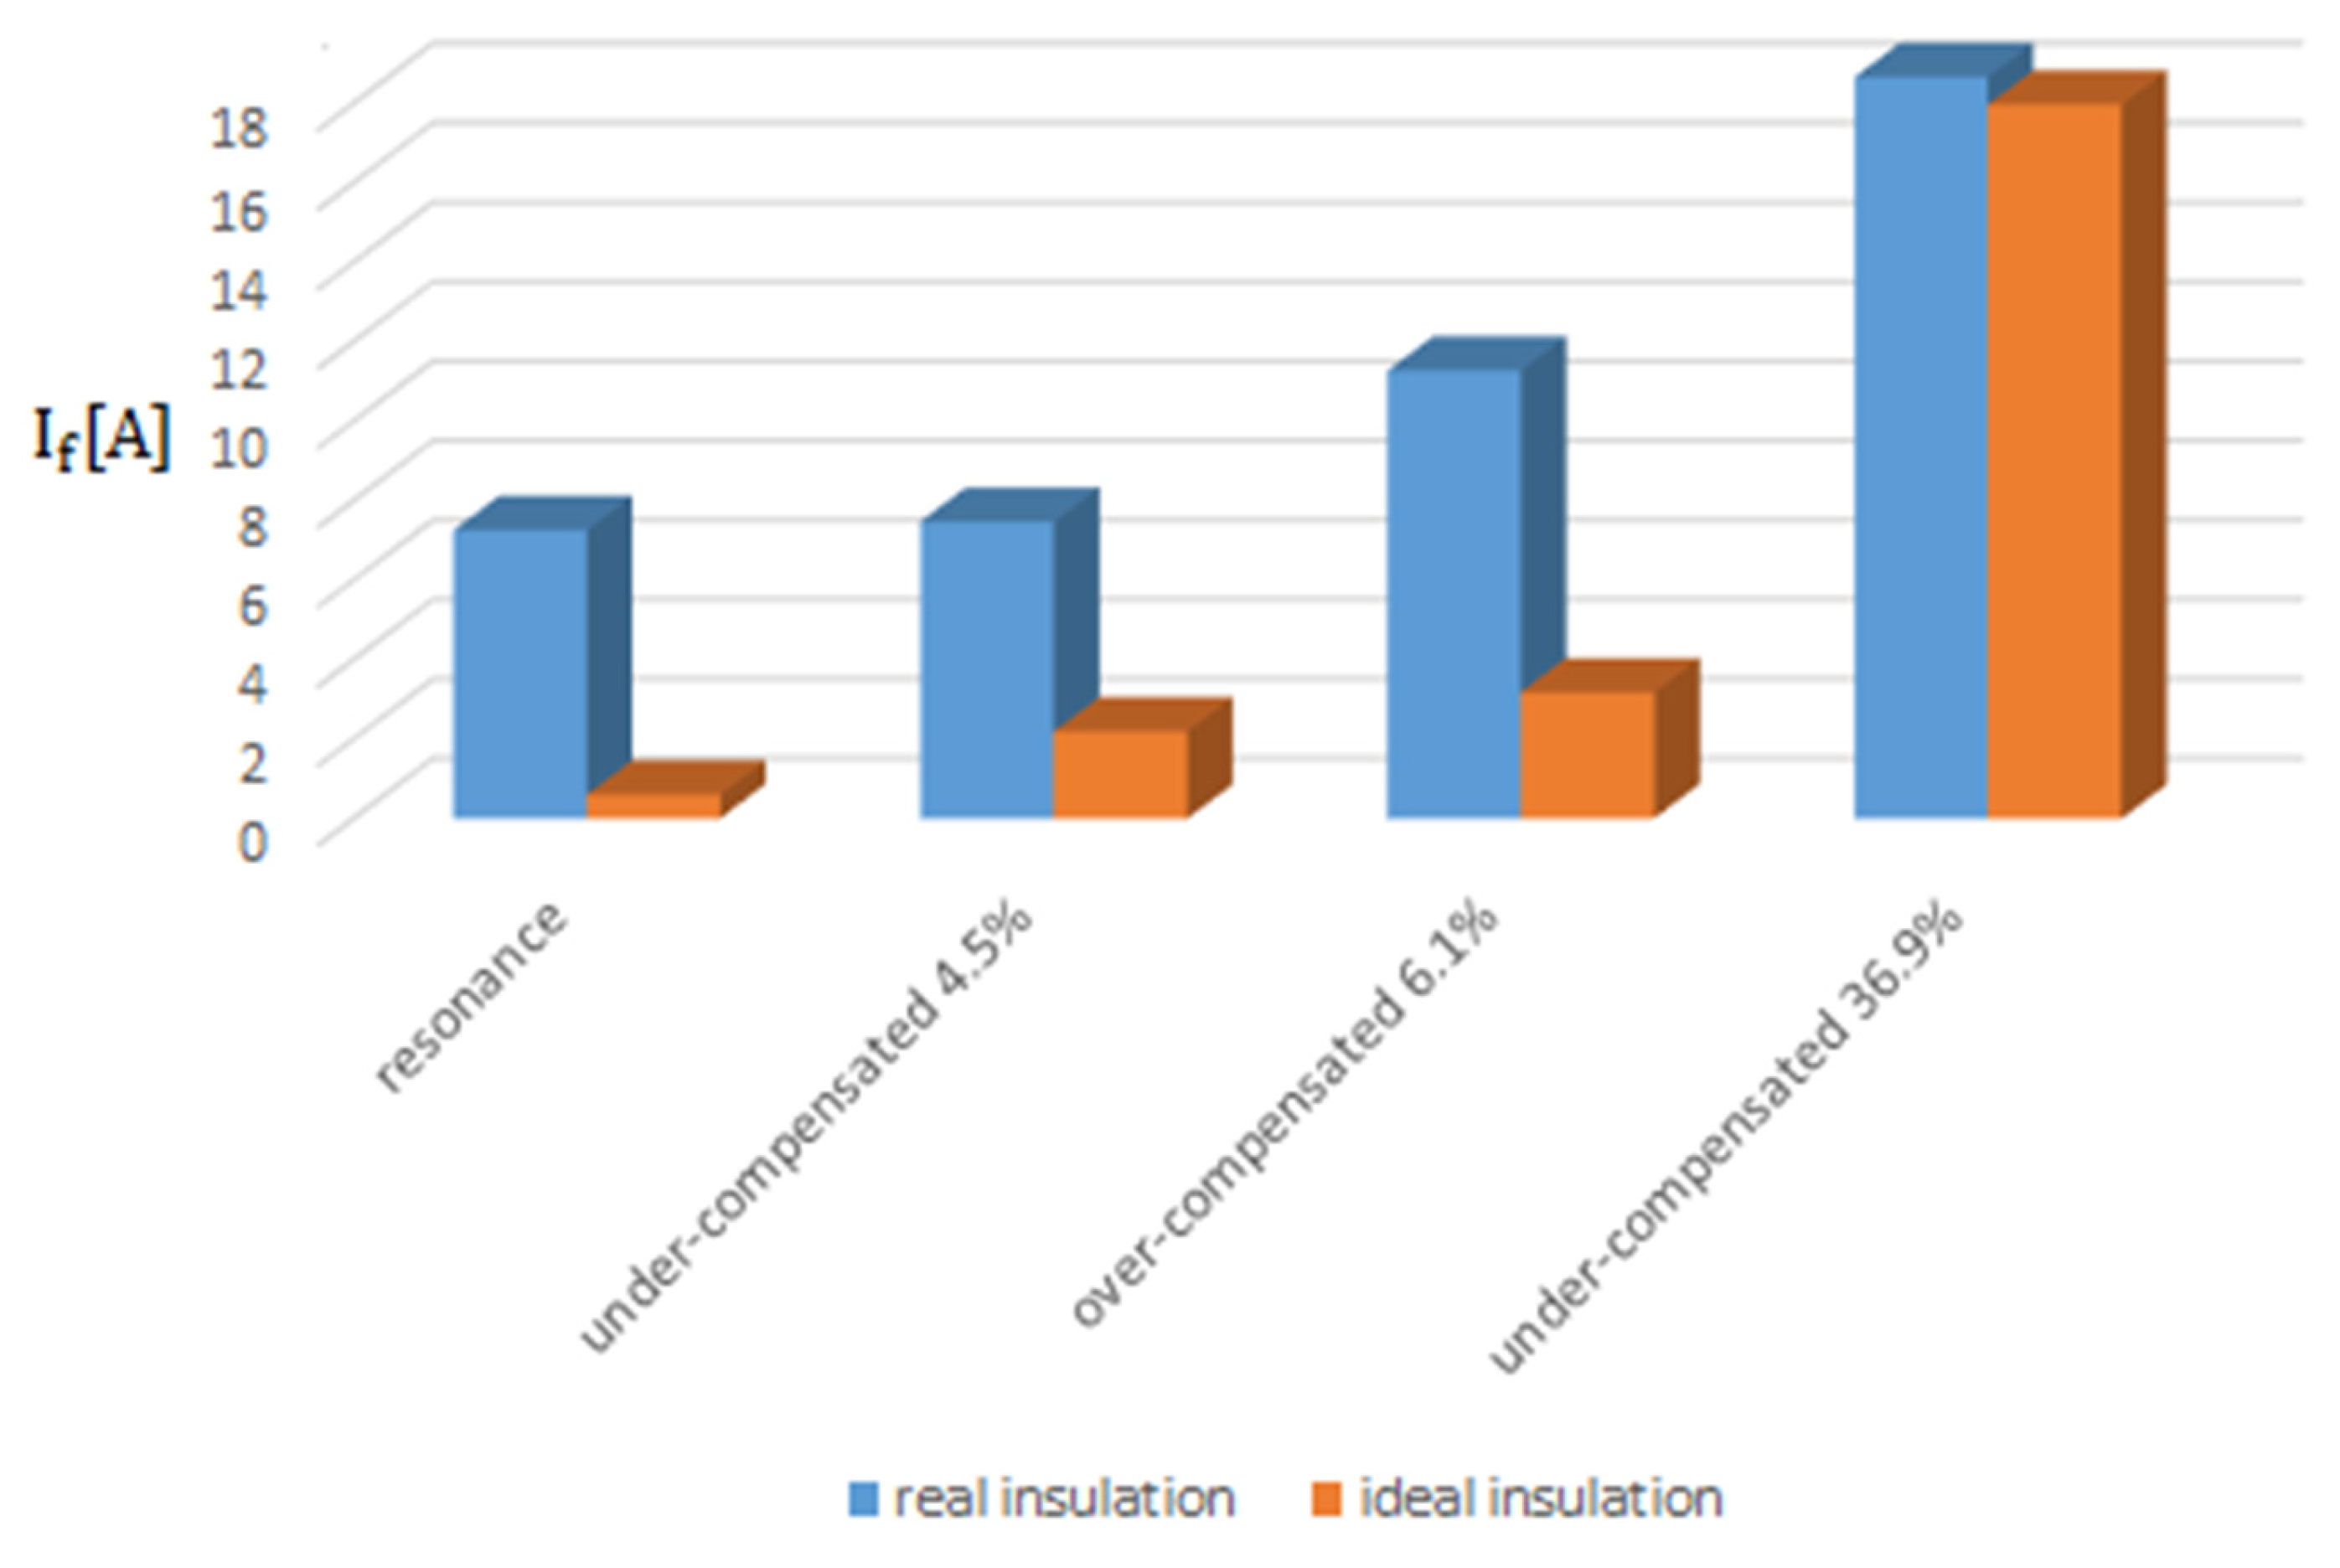
To analyze how the insulation resistance (insulation condition) of the 20 kV network influences the maximum value of the fault current, values of 24.45 kΩ (the insulation resistance of the real network) and infinity (the network insulation is ideal) were considered. It was also considered that the 20 kV network operates in the following regimes: resonance; under-compensated at 4.5%; over-compensated at 6.1%; and under-compensated at 36.9%. For the transition resistance at the fault location, a value of 8 Ω was considered, and for the initial phase of the voltage at the fault location a value of α = 88° was used (the value of the initial phase for which the fault current has the highest value). The results obtained are presented in Figure 28.
Figure 28 shows that the insulation condition of the 20 kV network insignificantly influences the maximum value during the transient regime caused by the phase-to-ground fault of the fault current, regardless of the regime in which the 20 kV network operates.
In resonance regime, the maximum value of the fault current is 172.25 A if the insulation is ideal and 171.25 A if the insulation is real; the difference is 1 A, which represents 0.58% of the value of the fault current when the network insulation is real. If the 20 kV network operates in 36.9% under-compensation mode, the maximum value of the fault current is 170.5 A if the network insulation is ideal and 170.75 A if the network insulation is real; the difference is 0.25 A, which represents 0.15% of the maximum value of the fault current if the network insulation is real.
From Figure 29, it can be seen that the state of the insulation of the distribution network influences much more the effective value of the fault current compared to its maximum value. When the network operates in resonance mode and the insulation is ideal (Riz = ∞), the effective value of the fault current is eight times lower than in the case of the real insulation of the network insulation. For this reason, in stabilized mode the influence of the state of the insulation of the distribution network on the value of the fault current in the case of a phase-to-ground fault cannot be ignored.

5.4. Influence of the Contact Resistance at the Fault Location

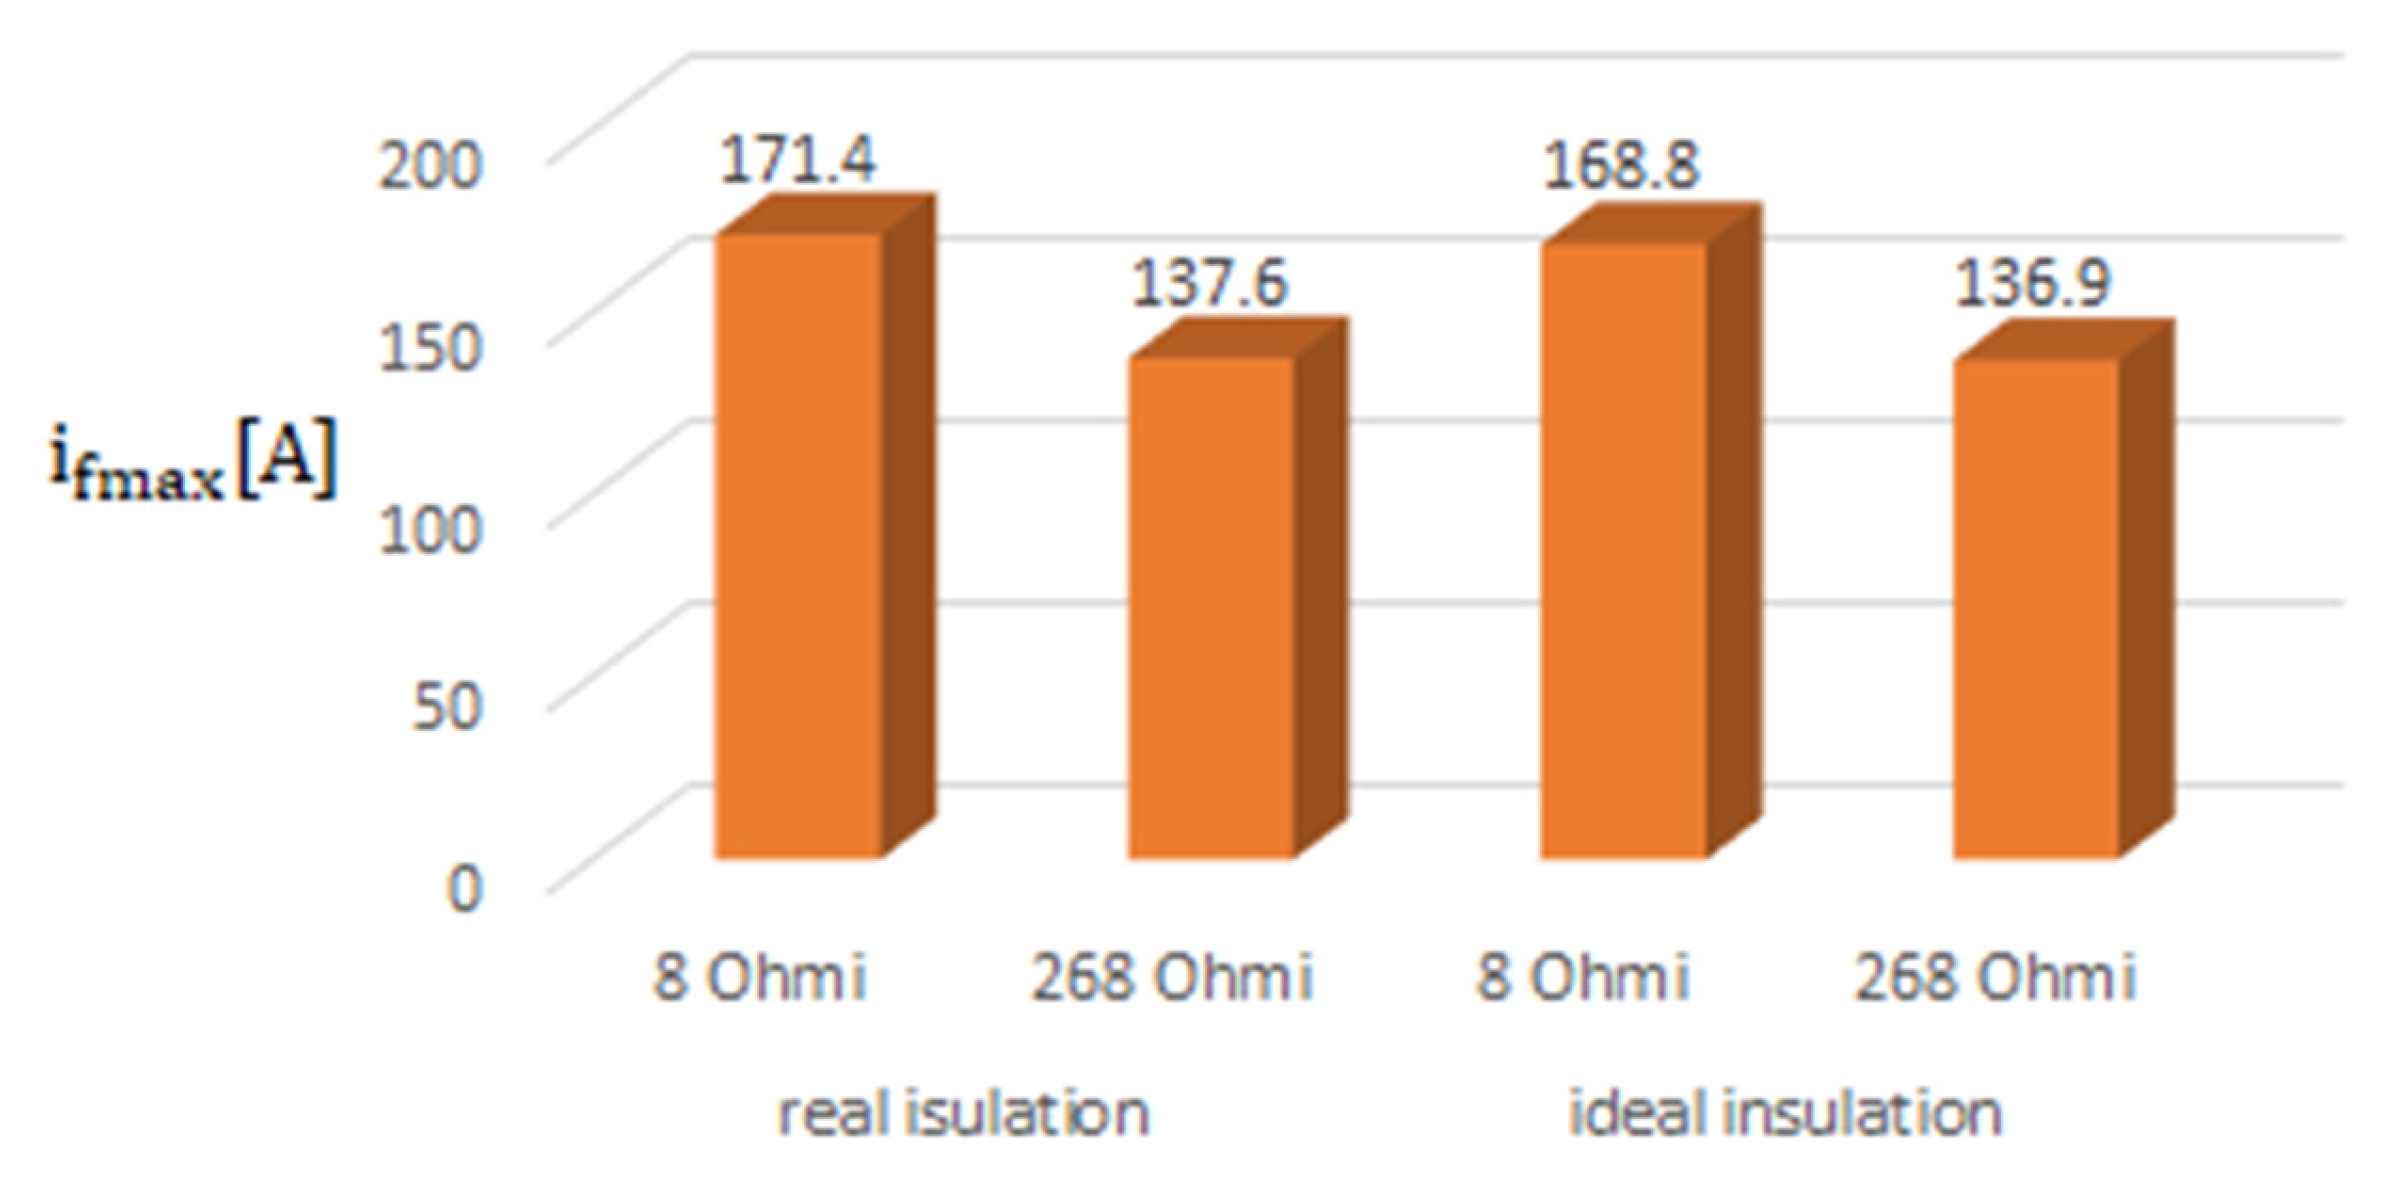
To analyze how the contact resistance value at the fault location (Rt) influences the maximum value of the fault current, the values 8 Ω and 268 Ω were considered. For the insulation resistance of the 20 kV network, values of 24.45 kΩ (the insulation resistance of the real network) and infinity (the network insulation is ideal) were considered. It was also considered that the 20 kV network operates in resonance mode, and for the initial phase of the voltage at the fault location, α = 88° (the value of the initial phase for which the fault current has the highest value). The results obtained are presented in Figure 30.
From Figure 30, it can be seen that when the 20 kV network operates in resonance mode, considering the network insulation as ideal and real, the maximum value of the fault current changes by 1.52% if Rt = 8 Ω and by 0.51% if Rt = 268 Ω.
Since, in the case of the 20 kV network studied, the state of the network insulation does not significantly modify the maximum value of the fault current during the transient regime caused by the phase-to-ground fault, in the analysis of the dependence of the maximum value of the fault current on the value of the resistance at the fault location (Rt), the real insulation of the 20 kV network was taken into account. The results obtained are presented in Table 7.
From Table 7, it can be seen that the maximum value of the fault current during the transient regime caused by the phase-to-ground fault is influenced by the value of the resistance at the fault location (Rt); therefore, in the transient regime analysis this parameter cannot be ignored.
Table 8 shows the dependence of the effective value of the fault current on the resistance value at the fault location (Rt).
From Table 8, it can be seen that the value of the resistance at the fault location influences the effective value less than the maximum value of the fault current, but the operating mode of the network influences the effective value more than the maximum value of the fault current. If Rt = 100 Ω, the effective value represents 89.8% of the effective value of the fault current when Rt = 8 Ω, and the maximum value represents 98.4% of the maximum value of the fault current when Rt = 8 Ω.

5.5. Influence of Phase-to-Earth Capacitance on Fault Current

In order to highlight the sensitivity of the numerical model as a function of the value of the phase-to-earth capacitance of the 20 kV network, its value, determined experimentally, is increased by 4% (in equal steps of 1%) and also decreased by −4% (in equal steps of −1%). The values obtained using the numerical model are compared with the real value of the fault current, determined experimentally. In the analysis carried out, it was considered that the 20 kV network operates in a 4.5% under-compensation regime, and Rt = 8 Ω and 268 Ω. The results obtained are presented in Table 9.
To calculate the difference between the effective values of the fault current obtained using the numerical model or experimentally, the following relationship was used:
ε I f % = I f n u m e r i c a   m o d e l I f e x p e r i m e n t a l l y I f e x p e r i m e n t a l l y × 100
From Table 9, it can be seen that the value of the fault current determined using the numerical model changes significantly depending on the value of the phase-to-earth capacitance of the 20 kV network. When changing the phase-to-earth capacitance value by 4%, the value of the fault current changes by 14.43% if Rt = 8 Ω and by 14.62% if Rt = 268 Ω. It can also be seen that the influence of the phase-to-earth capacitance value of the 20 kV network on the fault current depends insignificantly on the resistance value at the fault location (14.43% if Rt = 8 Ω and 14.62% if Rt = 268 Ω).
The results presented in Table 9 were obtained considering that the measurements from the real 20 kV network are perfect. However, if we assume that the measurement errors are −1%, it results that the difference between the values of the fault current obtained experimentally, and with the help of the numerical model, reaches 0.58% when Rt = 8 Ω and 6.61% when Rt = 268 Ω. This result allows us to say that the 20 kV network is correctly modeled in MATLAB/Simulink.
As a result, when performing the numerical model in MATLAB/Simulink, it is necessary that the value of the phase-to-earth capacitance of the 20 kV network is known as precisely as possible. It is recommended that this capacitance be determined experimentally. If the value of this capacitance is not known precisely, the errors in determining the fault current using the numerical model may become unacceptably large.

6. Discussions

Comparing the fault currents in Figure 16 (α = 0) and in Figure 17 (α = 88°), it can be seen that when the initial phase of the voltage at the fault location (α) is 88°, the maximum value of the fault current is 2.34 times higher than in the case of α = 0 if the contact resistance at the fault location (Rt) has the value of 8 Ω, or 1.62 (Figure 20 and Figure 21) if the contact resistance at the fault location (Rt) has a value of 268 Ω.
Regarding the zero-sequence voltage related to the 20 kV bars, when the contact resistance at the fault location (Rt) has a value of 8 Ω, it can be seen from Figure 18 that for α = 0 its transient component can be ignored, which is no longer valid in the case of α = 88° (Figure 18). From Figure 23 and Figure 24, it can be seen that the transient component of the zero-sequence voltage, when the value of the transition resistance at the fault location (Rt) is 268 Ω, is damped after two periods (approximately 40 ms).
Figure 23 shows the dependence of the maximum value of the fault current as a function of the value of the initial phase of the voltage at the fault location, considering that the 20 kV network operates in resonance mode and in the 6.1% over-compensation mode. From this diagram, it can be seen that the lowest values for the maximum value of the fault current in the transient mode are obtained when the initial phase of the voltage at the fault location has a value of zero. It can also be seen that the highest value of the fault current during the transient mode, which is obtained for α = 88°, is practically the same whether the network operates in resonance mode or in the 6.1% over-compensation mode.
From what is presented, it follows that neglecting the initial phase of the voltage at the fault location in the case of a phase-to-ground fault in the analysis of the transient regime caused by the phase-to-earth fault leads to unacceptable errors in terms of setting the protection properties that have the role of detecting phase-to-earth faults. It can also be seen that the value of the initial phase of the voltage at the fault location influences the maximum value of the fault current much more than the zero-sequence voltage related to the 20 kV bus bars.
From Figure 26, it follows that the operating regime of the 20 kV network influences the maximum value of the fault current during the transient regime, considering the resonance regime as a reference, as follows: 0.26% if the network operates in the under-compensated regime at 4.5%; 0.18% if the network operates in the over-compensated regime at 6.1%; and 0.41% if the network operates in the suction-compensated mode at 36.9%. To calculate these percentages, the following relationship was used:
ε % = i f m a x r e s o n a n c e i f m a x o p e r a t i n g   n e t w o r k   r e g i m e i f m a x r e s o n a n c e × 100
From the above, it follows that the operating mode of the 20 kV network does not significantly influence the maximum value of the fault current in the transient regime. As a result, the operating mode of the 20 kV network can be ignored in the analysis of the transient regime caused by the phase-to-ground fault.
From Figure 28, it can be seen that when the insulation state of the 20 kV network is good (the insulation resistance of the network has a very high value, theoretically considered to be infinite), the maximum value of the fault current during the transient regime is lower than when the insulation resistance of the real 20 kV network is considered (Riz = 24.45 kΩ). Depending on the operating mode of the 20 kV network, the differences are as follows: resonance—0.64%; under-compensated at 4.5—0.29%; over-compensated at 6.1—0.23%; and under-compensated at 36.9—0.15%. The following relationship was used to calculate these percentages:
ε % = i f m a x R i z = i f m a x R i z = 24.45   k Ω i f m a x R i z = × 100
From the above, it follows that the insulation of the 20 kV network does not significantly influence the maximum value of the fault current in the transient regime. As a result, in the analysis of the transient regime caused by the phase-to-ground fault, the ideal insulation can be considered without significantly affecting the results obtained. This statement is no longer valid for the value of the phase-to-ground fault current in the stabilized regime [4,6,8,14]. As a result, these observations must be taken into account when setting the protection properties intended to detect phase-to-ground faults.
From Figure 30, it follows that the contact resistance at the fault location (Rt) has a large influence on the maximum value of the fault current during the transient regime in the case of a phase-to-ground fault, regardless of whether the network insulation is considered ideal or real. If the value of the contact resistance at the fault location increased by 33.5 times, the maximum value of the fault current during the transient regime decreased by 6.196 times when the network insulation was real (Riz = 24.45 kΩ); however, the fault current during the transient regime decreased by 6.181 times if the network insulation was considered ideal (Riz = ). These results show that the dependence of the maximum value of the fault current during the transient regime on the value of the contact resistance at the fault location is not linear. It can also be seen that the value of the contact resistance at the fault location has practically the same influence on the maximum value of the fault current during the transient regime, regardless of the state of the network insulation, which is not valid for the value of the fault current in the stabilized regime [1,2,15,22].
From Table 7, it can be seen that the value of the resistance at the fault location does not linearly influence the maximum value of the fault current. If the 20 kV network contained ideal elements and operated in resonance mode, Rt would influence the fault current value the least. In the considered case, the elements of the 20 kV network being real, Rt influences the fault current the least when the network operates in under-compensation mode at 36.9%.
From Table 8, it can be seen that the effective value of the fault current obtained using the numerical model is greatly influenced by the knowledge of the value of the phase-to-earth capacitance of the 20 kV network. For this reason, we consider that when the numerical model implemented in MATLAB/Simulink is made, it is necessary to know as precisely as possible the value of the phase-to-earth capacitance of the 20 kV network; otherwise, the results obtained using the numerical model may be far from reality.
Simulink enables users not only to build and customize electrical installations models intuitively, without additional programming, due to the available libraries and built in toolboxes, but also to analyze various contingencies in the power system, i.e., different faults or power swings. It also facilitates the setting of the protective relays, which must be reviewed periodically and up-dated according to the latest network parameters values. In a medium voltage network with resonant grounding, regardless of the operating regime of the Petersen coil, the transients of voltage and fault current are shorter and less dangerous when the fault resistance is high. However, the equivalent capacitance and inductance are network characteristics that influence the transient frequencies and thus the protection algorithm performance, i.e., the sampling frequency available in modern re-lays may be a limitation. Together with similar software tools, including open-source libraries designed according to IEC 61850 and available test feeders, could be used to achieve new power system protection algorithms as hardware-in-the-loop simulation against commercial solutions.
It is worth noting that the effective value of the fault current (in the stabilized regime) is influenced differently by the characteristics of the distribution network than the maximum value of the fault current during the transient regime. For this reason, when setting the values of the currents at which the protections must transmit the disconnection pulse of the circuit breaker of the faulty line, the value set for the protection operation time must also be taken into account. If the value set for the time is less than 100 ms, when setting the current value it must be taken into account that the transient component of the fault current may not be damped. If the value set for the time is greater than 100 ms, when setting the current value it must be taken into account that the transient component of the fault current has been damped, so the effective value of the fault current in the stabilized regime must be taken into account. The time required for the damping of the transient component of the fault current depends on the characteristics of the distribution network. Determining the time required to damp the transient component of the fault current requires the creation of a numerical model implemented in MATLAB/Simulink. With the respective model, the transient regime caused by the phase-to-ground fault is analyzed and the time required to damp the transient component of the fault current is determined.
If the IT/MT transformer station is equipped with event recording equipment, the results obtained using the MATLAB/Simulink numerical model can be compared with those obtained using the recording equipment. In this situation, the accuracy of the MATLAB/Simulink numerical model can be established.
The numerical model can also be used if the distribution network has an isolated neutral, in which case the resistance or reactance of the Petersen coil has a very high value, theoretically infinite. In the model (Figure 3), the values of these parameters are considered to be 1 MΩ.
If the distribution network has the neutral connected to ground through a resistor in the numerical model, the resistance of the Petersen coil becomes equal to that of the resistor, and the reactance of the Petersen coil has a value of zero.

7. Conclusions

The following conclusions can be drawn from this study:
(a)
From Table 3 it can be seen that the insulation of the 20 kV network is not ideal; Riz = 24.45 k does not have the value ∞. From Table 4, it can be seen that both the value of the Petersen coil inductance and its resistance depend on the regime in which the 20 kV network operates. Also, the resistance of the Petersen coil is different from zero, so this coil cannot be considered ideal. From Table 5, it can be seen that the three-phase coil with zig-zag connection used to create the artificial neutral of the 20 kV network is not ideal; its resistance and dispersion inductance are not zero. As a result, in creating the MATLAB/Simulink numerical model for the 20 kV network, real parameters must be used for these elements. Considering these elements as ideal can lead to unacceptable errors. In the case of a phase-to-ground fault, considering the Petersen coil and the network insulation as ideal, the calculation error of the fault current (in a stabilized mode) can exceed 30% [34,35].
(b)
The MATLAB/Simulik numerical model made using experimentally determined values for the three-phase coil with zig-zag connection, the Petersen coil, the insulation, and the phase-to-earth electrical capacitance of the 20 kV network led to differences between the fault current values obtained using the model and those determined experimentally of 6.67% if Rt = 8 Ω and 3.21% if Rt = 268 Ω. The differences between the zero-sequence voltage values for the 20 kV bus bars in the transformer station obtained using the MATLAB/Simulink model, determined experimentally, are 3.21% if Rt = 8 Ω and 6.19% if Rt = 268 Ω. These differences were obtained when the 20 kV network operated in a 4.5% under-compensation regime.
(c)
The ratio between the maximum value of the fault current during the transient regime (which is obtained when the 20 kV network operates in resonance mode if the initial phase of the voltage at the fault location is 88°) and the amplitude of the fault current in the permanent regime is 15.5 if Rt = 8 Ω (Figure 17) and 10.2 if Rt = 268 Ω (Figure 22). As a result, in setting the protections that detect phase-to-ground faults, the transient component of the fault current cannot be ignored.
(d)
If the 20 kV network operates in resonance regime, the ratio between the maximum and minimum fault current values as a function of the initial phase of the voltage at the fault location (α) is 2.34, and if the network operates in 6.1% overcompensated regime the same ratio becomes 1.79 (Figure 24). The further the operating regime of the 20 kV network is from the resonance one, the lower the ratio of the maximum and minimum fault current value depending on the initial phase of the voltage at the fault location (α).
(e)
The maximum value of the fault current during the transient regime caused by the phase-to-ground fault is the highest if the 20 kV network operates in resonance regime, and the lowest if the 20 kV network operates under-compensated by 36.9% (Figure 26). The difference between the two values is 0.29%, so the operating regime of the 20 kV network does not significantly influence the maximum value of the fault current.
(f)
The insulation condition of the 20 kV network does not significantly influence the maximum value of the fault current in the transient regime caused by the phase-to-ground fault (Figure 27); 1.52% if Rt = 8 Ω and 0.51% if Rt = 268 Ω. In the stabilized regime (after damping of the transient components), the influence of the insulation condition is much more pronounced [34,35].
(g)
Using the MATLAB/Simulink numerical model for calculating the fault current, it was found that the value of the phase-to-earth capacitance greatly influences the value of the fault current. If the phase-to-earth capacitance increases by 1%, the calculation error of the fault current increases by 3.31%, and if its value decreases by 1% the calculation error of the fault current decreases by 2.51% (Table 9). For this reason, it is recommended that the experimentally determined phase-to-earth capacitance value of the 20 kV network be used in the MATLAB/Simulink numerical model.
The paper shows that the MATLAB/Simulink numerical model is very beneficial for studying the transient regime caused by the phase-to-ground fault in 20 kV networks. It allows the analysis of how various parameters influence the transient regime caused by phase-to-ground faults, thus allowing the obtaining of the voltage and current values necessary for the correct setting of the protections that detect phase-to-ground faults in medium voltage networks. Since the created numerical model contains all the equipment involved in the structure of an electrical distribution network, it can be used in other cases if the structure of the respective network is taken into account in its design.
In the future, we will complete the MATLAB/Simulink model with the numerical model of the electric arc, which occurs very frequently at the fault location in the case of phase-to-ground faults, and we will analyze how the electric arc influences the transient regime caused by the phase-to-ground fault. Also, given the versatility of the Simulink environment, with solvers that can handle hybrid and complex models, future work will focus on the integration of real-time platforms within the Simulink interface to solve dynamic problems in the power system, i.e., feature extraction during transients, communication latency, power flow algorithm testing, and protection system design.

Author Contributions

Conceptualization: D.T. and C.S.; methodology: D.T. and M.G.; software: C.S., D.V. and M.V.; validation: D.T., C.S. and I.T.; formal analysis: D.T., C.S. and M.V.; investigation: D.T. and C.S.; resources: M.G. and D.T.; data curation: D.V. and I.T.; writing—original draft preparation: D.T. and C.S.; writing—review and editing: D.T. and M.V.; visualization: I.T. and D.V.; supervision: D.T. and C.S.; project administration: D.T. and C.S.; funding acquisition: C.S. All authors have read and agreed to the published version of the manuscript.

Funding

This research received no external funding.

Data Availability Statement

The data presented in the paper, obtained by calculation and experimentally, have not been published. Consequently, data sharing is not applicable to this article.

Conflicts of Interest

The authors declare no conflicts of interest.

References

  1. Yang, S.; Jiao, Y.; Chen, Q.; Li, H.; Zhou, L.; Zhu, H. A Single-Phase to Ground Fault Identification Method Based on Extremely Low Frequency Current Detection in Distribution Grids. IEEE Trans. Power Deliv. 2022, 37, 5214–5223. [Google Scholar] [CrossRef]
  2. Lin, J.; Guo, M.; Zheng, Z. Active Location Method for Single-Line-to-Ground Fault of Flexible Grounding Distribution Networks. IEEE Trans. Instrum. Meas. 2023, 72, 3524712. [Google Scholar] [CrossRef]
  3. He, L.; Li, Y.; Chu, X.; Shuai, Z.; Peng, Y.; Shen, J.Z. Single-Phase to Ground Fault Line Identification for Medium Voltage Islanded Microgrids With Neutral Ineffectively Grounded Modes. IEEE Trans. Smart Grid 2022, 13, 4312–4326. [Google Scholar] [CrossRef]
  4. Mukherjee, A.; Kundu, P.K.; Das, A. A supervised principal component analysis-based approach of fault localization in transmission lines for single line to ground faults. Electr. Eng. 2021, 103, 2113–2126. [Google Scholar] [CrossRef]
  5. Toader, D.; Blaj, C.; Ruset, P.; Hategan, I.D.; Pinte, N.; Arvinti, B. Device for Automatic Control of the Petersen Coil. In Soft Computing Applications. Advances in Intelligent Systems and Computing; Balas, V., Jain, L., Kovačević, B., Eds.; Springer: Cham, Switzerland, 2016; Volume 357. [Google Scholar] [CrossRef]
  6. Mehmed-Hamza, M.E.; Filipov, A.B.; Ivanova, M.D. Research and Analysis of Faults in Medium Voltage Distribution Grids. In Proceedings of the 56th International Scientific Conference on Information, Communication and Energy Systems and Technologies (ICEST), Sozopol, Bulgaria, 16–18 June 2021. [Google Scholar]
  7. Paulucci, M. Investigating the impact of short-circuit faults in different neutral configurations: A real case study. In Proceedings of the AEIT International Annual Conference (AEIT), Rome, Italy, 5–7 October 2023. [Google Scholar]
  8. Toader, D.; Vintan, M.; Solea, C.; Vesa, D.; Greconici, M. Analysis of the Possibilities of Selective Detection of a Single Line-to-Ground Fault in a Medium Voltage Network with Isolated Neutral. Energies 2021, 14, 7019. [Google Scholar] [CrossRef]
  9. Penaloza, J.D.R.; Borghetti, A.; Napolitano, F.; Tossani, F.; Nucci, C.A. A New Transient-Based Earth Fault Protection System for Unearthed Meshed Distribution Networks. IEEE Trans. Power Deliv. 2021, 36, 2585–2594. [Google Scholar] [CrossRef]
  10. Guo, A.; Zhang, X.; He, Y.; Xie, S.; Li, W.; Sun, H. A faulty feeder selection method based on the slope of zero sequence current fitting curve for the non-effectively grounded system. Electr. Power Syst. Res. 2023, 217, 109170. [Google Scholar] [CrossRef]
  11. Kuliński, K.; Heyduk, A. Ground Fault in Medium-Voltage Power Networks with an Isolated Neutral Point: Spectral and Wavelet Analysis of Selected Cases in an Example Industrial Network Modeled in the ATP-EMTP Package. Energies 2024, 17, 1532. [Google Scholar] [CrossRef]
  12. Bindi, M.; Piccirilli, M.C.; Luchetta, A.; Grasso, F. A Comprehensive Review of Fault Diagnosis and Prognosis Techniques in High Voltage and Medium Voltage Electrical Power Lines. Energies 2023, 16, 7317. [Google Scholar] [CrossRef]
  13. Atsever, M.B.; Hocaoglu, M.H. A faulty feeder selection method for distribution network with unintentional resonance in zero sequence circuit. Electr. Power Syst. Res. 2023, 223, 109587. [Google Scholar] [CrossRef]
  14. Gukovskiy, Y.L.; Sychev, Y.A.; Pelenev, D.N. The Automatic Correction of Selective Action of Relay Protection System against Single Phase Earth Faults In Electrical Networks of Mining Enterprises. Int. J. Appl. Eng. Res. 2017, 12, 833–838. [Google Scholar]
  15. Čučuković, J.; Hidić, F. Fault Identification in Electrical Power Distribution System–Case Study of the Middle Bosnia Medium Voltage Grid. In Advanced Technologies, Systems, and Applications III. IAT 2018; Avdaković, S., Ed.; Lecture Notes in Networks and Systems; Springer: Cham, Switzerland, 2019; Volume 59. [Google Scholar] [CrossRef]
  16. Tang, Y.; Chang, Y.; Tang, J.; Xu, B.; Ye, M.; Yang, H. A Novel Faulty Phase Selection Method for Single-Phase-to-Ground Fault in Distribution System Based on Transient Current Similarity Measurement. Energies 2021, 14, 4695. [Google Scholar] [CrossRef]
  17. Chang, Y. A Novel Single-Phase-to-Ground Fault Location Method Based on Phase Current Differences in Power Distribution Systems. In Proceedings of the 4th International Conference on Smart Power & Internet Energy Systems (SPIES), Beijing, China, 9–12 December 2022. [Google Scholar] [CrossRef]
  18. Sun, G.; Ma, W.; Wei, S.; Cai, D.; Wang, W.; Xu, C.; Zhang, K.; Wang, Y. A Fault Location Method for Medium Voltage Distribution Network Based on Ground Fault Transfer Device. Electronics 2023, 12, 4790. [Google Scholar] [CrossRef]
  19. Lebedev, V.; Filatova, G. Study of Ground Faults Methods for Branched Overhead Power Lines. In Proceedings of the International Conference on Industrial Engineering, Applications and Manufacturing (ICIEAM), Sochi, Russian, 16–20 May 2022. [Google Scholar]
  20. Butoarca, E.; Ursu, D.; Mircea, P.-M.; Marin, I.; Ciurescu-Tibrian, M.; Buzatu, G.-C. Issues of selective detection and elimination of earth faults in MV networks with the neutral treated by Petersen coil. In Proceedings of the International Conference on Optimization of Electrical and Electronic Equipment (OPTIM) & Intl Aegean Conference on Electrical Machines and Power Electronics (ACEMP), Brasov, Romania, 25–27 May 2017. [Google Scholar]
  21. Toader, D.; Greconici, M.; Vesa, D.; Vintan, M.; Solea, C.; Maghet, A.; Tatai, I. The Influence of the Characteristics of the Medium Voltage Network on the Single Line-to-Ground Fault Current in the Resistor Grounded Neutral Networks. Designs 2021, 5, 53. [Google Scholar] [CrossRef]
  22. Lowczowski, K.; Olejnik, B. Monitoring, Detection and Locating of Transient Earth Fault Using Zero-Sequence Current and Cable Screen Earthing Current in Medium Voltage Cable and Mixed Feeders. Energies 2022, 15, 1066. [Google Scholar] [CrossRef]
  23. Liu, Y.; Cui, Q.; Luo, J.; Guo, H.; Shi, L. A Fault Location Algorithm for Distribution Network Based on Transient Feature Extraction. In Proceedings of the IEEE Sustainable Power and Energy Conference (iSPEC), Chongqing, China, 28–30 November 2023. [Google Scholar] [CrossRef]
  24. Mondal, S.; Pradhan, R. A Critical Analysis on Different High Impedance Fault Detection Schemes. Electr. Power Compon. Syst. 2023, 1–28. [Google Scholar] [CrossRef]
  25. Toader, D.; Vintan, M. Mathematical Models of the Phase Voltages of High-, Medium- and Low-Voltage Busbars in a Substation during a Phase-to-Ground Fault on High-Voltage Busbars. Mathematics 2023, 11, 3032. [Google Scholar] [CrossRef]
  26. Kustov, A.; Zatsepin, E.; Zatsepina, V. Analysis of Transient Regimes for Single-Phase Short Circuits in Electrical Lines with Isolated and Compensated Neutral. In Proceedings of the 2nd International Conference on Control Systems, Mathematical Modeling, Automation and Energy Efficiency (SUMMA), Lipetsk, Russia, 11–13 November 2020. [Google Scholar]
  27. Dinavahi; Lin, N. Real-Time Electromagnetic Transient Simulation of AC-DC Networks; 1 online resource vol. în IEEE Press series on power and energy systems; John Wiley: Hoboken, NJ, USA; IEEE Press: Hoboken, NJ, USA, 2021. [Google Scholar] [CrossRef]
  28. Arrillaga, N.R.W.Ș.J. Power Systems Electromagnetic Tranzients Simulation, 2nd ed.; 1 online resource (xxxii, 493 pages): Illustrations (black and white) vol.; The Institution of Engineering and Technology Stevenage: Stevenage, UK, 2018; Available online: https://books.google.ro/books?hl=ro&lr=&id=b4TYkhpCb80C&oi=fnd&pg=PR23&dq=Power+Systems+Electromagnetic+Tranzients+Simulation&ots=CZsAwl6HGb&sig=LiUfOrSu2VpUfOmDR9yoPyK3hOY&redir_esc=y#v=onepage&q=Power%20Systems%20Electromagnetic%20Tranzients%20Simulation&f=false (accessed on 20 March 2022).
  29. Akihiro Ametani Electromagnetic Transients Program: History and Future, First Published: 04 August 2020. Available online: https://onlinelibrary.wiley.com/doi/full/10.1002/tee.23192 (accessed on 15 February 2022).
  30. Manitoba Hydro International Ltd. PSCAD User’s Guide. May 2018. [Online]. Available online: https://www.pscad.com/knowledge-base/article/160 (accessed on 16 February 2022).
  31. Ametani, A. Electromagnetic Transients Program: History and Future. IEEJ Trans. Electr. Electron. Eng. 2021, 16, 1150–1158. [Google Scholar] [CrossRef]
  32. Vladimirescu, A. “Spice”, in Studio e Professione; McGraw-Hill Italia: Milano, Italy, 1995. [Google Scholar]
  33. Rashid, M.H. SPICE for Power Electronics and Electric Power; CRC Press: Boca Raton, FL, USA, 2005. [Google Scholar] [CrossRef]
  34. Toader, D.; Blaj, C.; Vesa, D.; Tatai, I.; Arvinti, B. Numeric Simulator for the Analysis of Transients due to Fault in Electric Networks. In Proceedings of the of 8th International Conference on Modern Power Systems (MPS), Cluj-Napoca, Romania, 21–23 May 2019. [Google Scholar]
  35. Toader, D.; Haragus, S.; Blaj, C. Numeric Simulation of Faults in Electrical Networks”, FS’09. In Proceedings of the 10th WSEAS International Conference on Fuzzy Systems, Prague, Czech Republic, 23–25 March 2009; pp. 128–135. [Google Scholar]
  36. The Math Works, Inc. Sim-Scape Electrical R2023b User’s Guide (Specialized Power Systems). 12 May 2024. [Online]. Available online: https://www.mathworks.com/help/pdf_doc/sps/%20powersys_ug.pdf (accessed on 18 April 2023).
  37. The Math Works, Inc. “Simulink® R2023b User’s Guide”. September 2023. [Online]. Available online: https://www.mathworks.com/help/pdf_doc/simulink/simulink_ug.pdf (accessed on 23 April 2023).
  38. “MATLAB Fundamentals”. [Online]. Available online: https://www.mathworks.com/learn/training/matlab-fundamentals.html (accessed on 5 July 2023).
  39. “Simulink Fundamentals”. [Online]. Available online: https://www.mathworks.com/learn/training/simulink-fundamentals.html (accessed on 5 July 2023).
  40. “MATLAB App Designer”. [Online]. Available online: https://www.mathworks.com/products/matlab/app-designer.html (accessed on 6 July 2023).
  41. “Simscape Electrical”. [Online]. Available online: https://www.mathworks.com/products/simscape-electrical.html (accessed on 12 July 2023).
  42. Solea, C. A MATLAB/Simulink Distribution Network Model for the Analysis of the Transient Regime Caused by a Phase-to-Earth Fault. (20 August 2025). [Online]. Available online: https://github.com/claudiusolea/medium_voltage_test-feeder_for_transients (accessed on 21 August 2023).
  43. Shen, M.; Ingratta, L.; Roberts, Ș.G. Grounding transformer application, modeling, and simulation. In Proceedings of the 2008 IEEE Power and Energy Society General Meeting—Conversion and Delivery of Electrical Energy in the 21st Century, Pittsburgh, PA, USA, 20–24 July 2008; pp. 1–8. [Google Scholar] [CrossRef]
  44. Hu, C.; Zeng, X.; Tao, J.; Wang, Y. Fault analysis of a grounding transformer. In Proceedings of the 2010 International Conference on Modelling, Identification and Control, Okayama, Japan, 17–19 July 2010; pp. 579–584. [Google Scholar]
  45. “MATLAB Live Editor”. [Online]. Available online: https://www.mathworks.com/products/matlab/live-editor.html (accessed on 15 June 2023).
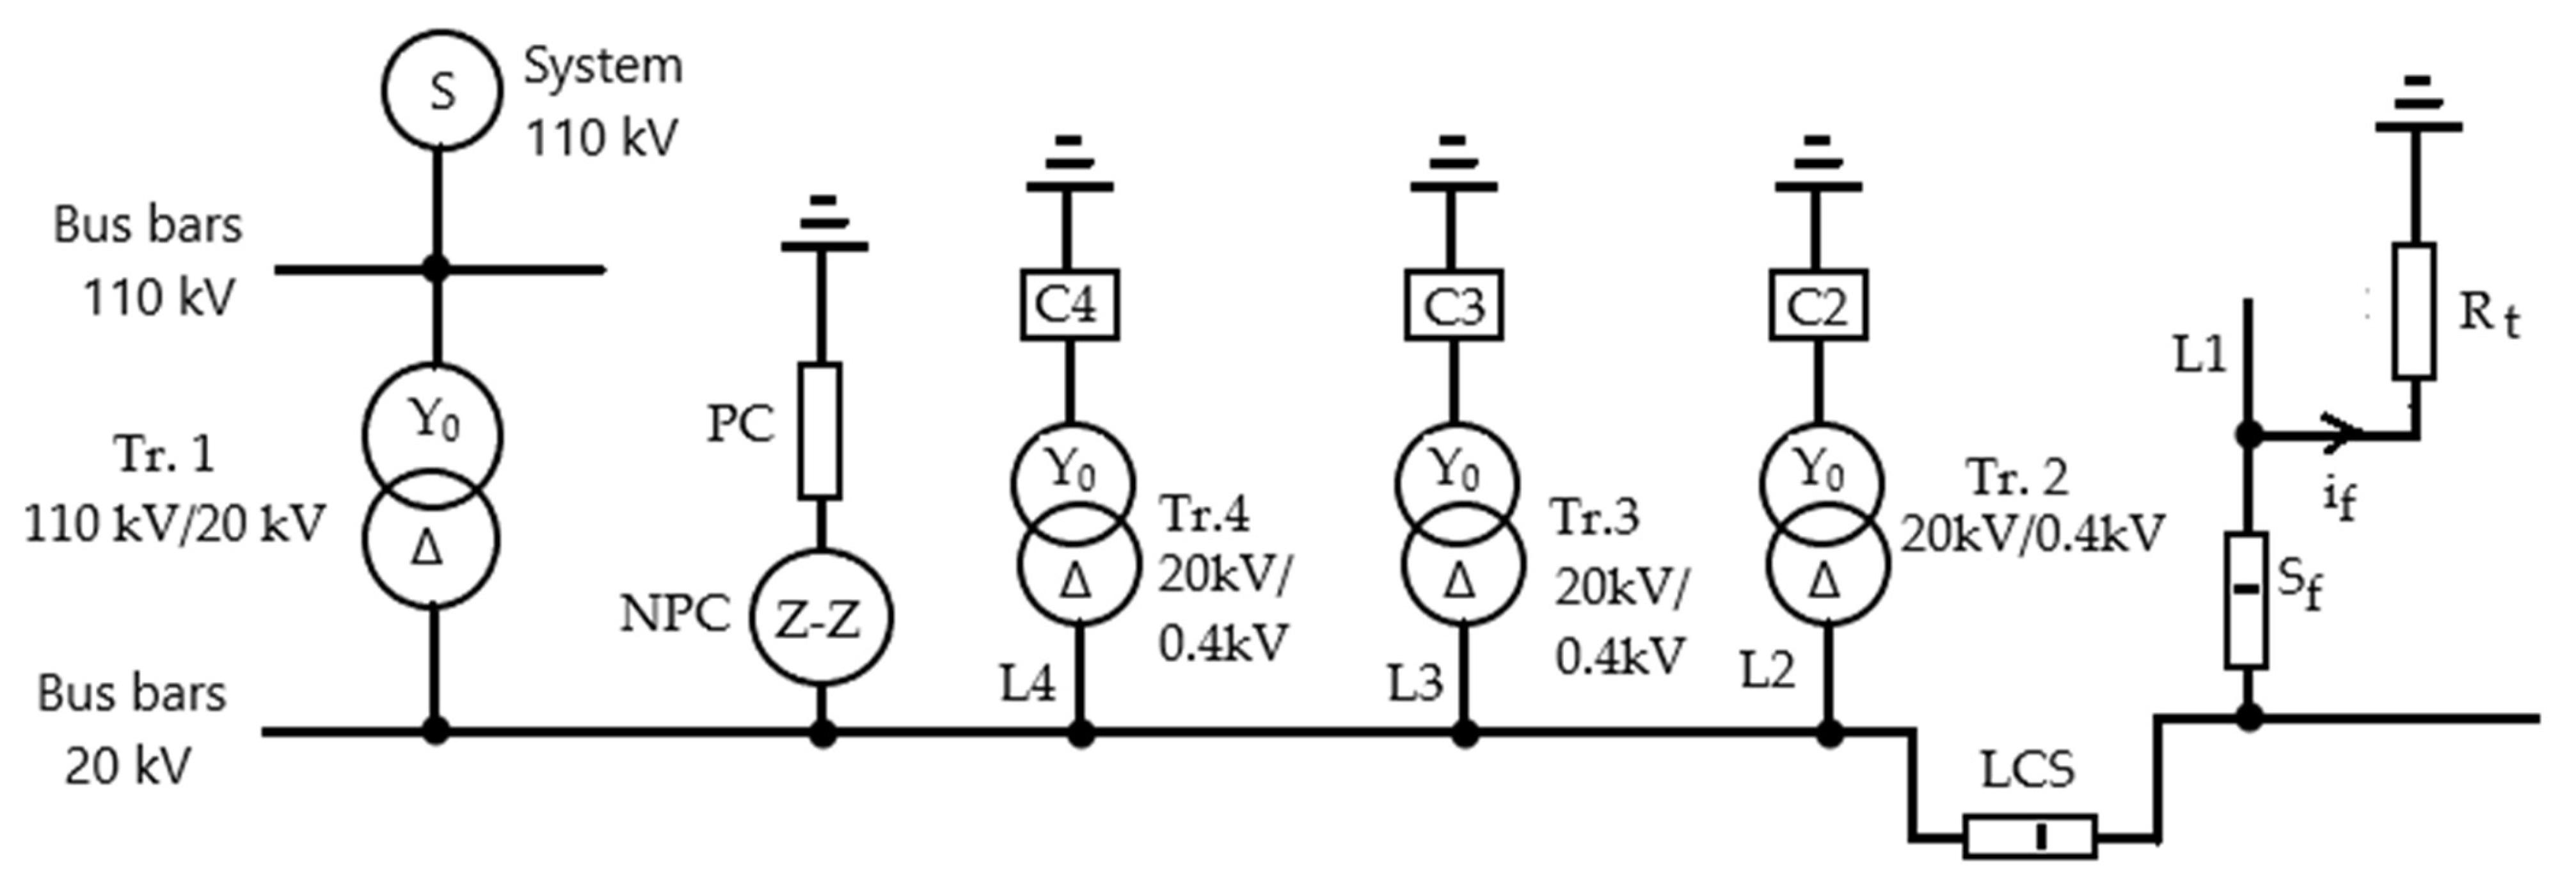
Figure 1. Single line diagram of the three-phase medium-voltage electrical network (20 kV).
Applsci 15 09389 g001
Figure 2. Information flow diagram for establishing numerical mathematical models.
Applsci 15 09389 g002
Figure 3. Simulink model of the three-phase power installation (20 kV network) in Figure 1.
Applsci 15 09389 g003
Figure 4. Diagram of the three-phase zig-zag coil.
Applsci 15 09389 g004
Figure 5. Numerical model of the three-phase zig-zag coil.
Applsci 15 09389 g005
Figure 6. Zig-zag three-phases coil MATLAB/Simulink model.
Applsci 15 09389 g006
Figure 7. Zig-zag three-phases coil MATLAB/Simulink model validation and the effective values of the phase currents.
Applsci 15 09389 g007
Figure 8. Measurement scheme in the network 20 kV.
Applsci 15 09389 g008
Figure 9. Fault current obtained using MATLAB/Simulink (numerical model), where Rt = 8 Ω. Network operates in a 4.5% under-compensation regime.
Applsci 15 09389 g009
Figure 10. Fault current obtained experimentally, where Rt = 8 Ω. Network operates in a 4.5% under-compensation regime.
Applsci 15 09389 g010
Figure 11. Fault current obtained using the numerical model in MATLAB/Simulink, where Rt = 268 Ω. Network operates in a 4.5% under-compensation regime.
Applsci 15 09389 g011
Figure 12. Fault current obtained experimentally, where Rt = 268 Ω. Network operates in a 4.5% under-compensation regime.
Applsci 15 09389 g012
Figure 13. Zero-sequence voltage of 20 kV bus bars obtained using the numerical model in MATLAB/Simulink, where Rt = 8 Ω. Network operates in a 4.5% under-compensation regime.
Applsci 15 09389 g013
Figure 14. Zero-sequence voltage of 20 kV bus bars obtained experimentally, where Rt = 8 Ω. Network operates in a 4.5% under-compensation regime.
Applsci 15 09389 g014
Figure 15. Zero-sequence voltage of 20 kV bus bars obtained using the numerical model in MATLAB/Simulink, where Rt = 268 Ω. Network operates in a 4.5% under-compensation regime.
Applsci 15 09389 g015
Figure 16. Zero-sequence voltage of 20 kV bus bars obtained experimentally, where Rt = 268 Ω. Network operates in a 4.5% under-compensation regime.
Applsci 15 09389 g016
Figure 17. Time variation in the fault current when α = 0°; Rt = 8 Ω; resonance regime.
Applsci 15 09389 g017
Figure 18. Time variation in the fault current when α = 88°; Rt = 8 Ω; resonance regime.
Applsci 15 09389 g018
Figure 19. Time variation in the zero-sequence voltage when α = 0°; Rt = 8 Ω; resonance regime.
Applsci 15 09389 g019
Figure 20. Time variation in the zero-sequence voltage when α = 88°; Rt = 8 Ω; resonance regime.
Applsci 15 09389 g020
Figure 21. Time variation in the fault current when α = 0°; Rt = 268 Ω; resonance regime.
Applsci 15 09389 g021
Figure 22. Time variation in the fault current when α = 88°; Rt = 268 Ω; resonance regime.
Applsci 15 09389 g022
Figure 23. Time variation in the zero-sequence voltage when α = 0°; Rt = 268 Ω; resonance regime.
Applsci 15 09389 g023
Figure 24. Time variation in the zero-sequence voltage when α = 88° and Rt = 268 Ω; resonance regime.
Applsci 15 09389 g024
Figure 25. Dependence of the maximum values of the fault current as a function of the initial phase of the phase voltage with a fault in the network. The 20 kV network operates in the resonance regime and in 6.1% over-compensated mode, with Rt = 8 Ω.
Applsci 15 09389 g025
Figure 26. The maximum values of the fault current depending on the operating regime of the 20 kV electrical network, for Rt = 8 Ω and α = 88°.
Applsci 15 09389 g026
Figure 27. Effective value of the fault current depending on the operating regime of the 20 kV network, Rt = 8 Ω.
Applsci 15 09389 g027
Figure 28. The maximum values of the fault current during the transient regime depends on the insulation condition and the regime in which the 20 kV network operates, i.e., α = 88°, Rt = 8 Ω. Blue—the network insulation is ideal (Riz = ); brown—the insulation of the real network (Riz = 24.45 kΩ).
Applsci 15 09389 g028
Figure 29. The effective values of the fault current depends on the insulation condition and the regime in which the 20 kV network operates, i.e., Rt = 8 Ω. Blue—the network real insulation (Riz = 24.45 kΩ); brown—ideal insulation of the real network (Riz = ).
Applsci 15 09389 g029
Figure 30. Maximum values of the fault current during the transient regime depending on the value of the contact resistance at the fault location for both the ideal network insulation (Riz = ) and the insulation of the real network Riz = 24.45 kΩ. The 20 kV network operates under the resonance regime and α = 88°.
Applsci 15 09389 g030
Table 1. Characteristics of transformers Tr.1, Tr.2, Tr.3, and Tr.4 in Figure 1.
Sn [MVA]Transformer ConnectionsU1n
[kV]
U2n
[kV]
usc
[%]
i0
[%]
Psc
[kW]
P0
[kW]
Tr.116Y01102011113030
Tr.24Δ/Y0200.461.86215
Tr.36.3Δ/Y0200.471.68220
Tr.410Δ/Y0200.471.211025
Table 2. Characteristics of consumers fed by fault-free lines.
Consumers Supplied Through Fault-Free LinesSn
[MVA]
Equivalent Resistance of Consumers [Ω]Equivalent Inductance of Consumers [H]
L21.35275.60.347
L34.5382.120.103
L48.7642.470.0196
Total14.6425.410.0109
Table 3. Phase-to-earth capacitance and insulation resistance values of the 20 kV network.
20 kV LinesL2L3L4Total Network
Phase-to-earth capacitance [μF]0.5961.7551.7574.108
Insulation resistance values [Ω]19,89151,91519,7698151.4
Table 4. Petersen coil parameter values for 20 kV network operating modes.
Operating Modes ResonanceOver-
Compensated
6.1%
Under-
Compensated
4.5%
Under-
Compensated 36.9%
Resistance PC [Ω]13.3629.214.17.1
Inductance PC [H]0.8110.7570.8511.294
Table 5. Parameters of the three-phase zigzag coil.
Resistance
R [Ω]
Self-Inductance
L [H]
Coupling Inductance
Lm [H]
1.391514.987
Table 6. Synthesis of the results obtained with the null coil model.
Sequence TypeI1 [A]I2 [A]I3 [A]In [A]Zf [Ω]
Plus0.84950.84950.8495014,715
Zero127.5127.5127.5382.598.1
Table 7. Dependence of the maximum value of the fault current depending on Rt and the network operating regime. The current is measured in amperes.
Rt (Ω)/Operating Regime81002685751100
Under-compensated at 4.5%171.9169.1140.598.134.6
Over-compensated at 6.1%171.7168.9136.154.131.1
Under-compensated at 36.9%170.7168.7145.673.645.5
Resonance171.4168.3137.656.832.4
Table 8. Dependence of the effective value of the fault current depending on Rt and the network operating regime. The current is measured in amperes.
Rt (Ω)/Operating Regime 81002685751100
Under-compensated at 4.5%7.486.725.955.424.26
Over-compensated at 6.1%11.299.698.948.186.43
Under-compensated at 36.9%18.6516.7614.8413.5110.62
Resonance7.236.495.755.244.12
Table 9. Difference between the fault current values obtained using the numerical model and the fault current obtained experimentally, depending on the phase-to-earth capacitance value of the 20 kV network.
Change in Phase-Ground Capacity Values of the 20 kV Network [%]+4+3+2+10−1−2−3−4
ε I f % Rt = 8 Ω17.513.910.16.383.070.58−1.91−3.98−5.28
Rt = 268 Ω23.9719.8516.0112.539.356.614.232.290.85
Disclaimer/Publisher’s Note: The statements, opinions and data contained in all publications are solely those of the individual author(s) and contributor(s) and not of MDPI and/or the editor(s). MDPI and/or the editor(s) disclaim responsibility for any injury to people or property resulting from any ideas, methods, instructions or products referred to in the content.