1. Introduction
Construction investments are complex undertakings that involve multiple stakeholders, long project durations, and high capital commitments. These projects are inherently exposed to numerous risks, such as design errors, cost overruns, schedule delays, and regulatory uncertainties. Due to their multifaceted nature, construction projects are particularly vulnerable to risk-related disruptions.
In this context, effective risk management is essential to achieving investment success. Various risk assessment approaches are used in construction decision-making, including qualitative methods such as expert judgment, checklists, and risk matrices, as well as quantitative techniques such as sensitivity analysis, expected monetary value, and simulation-based methods like Monte Carlo analysis.
Among these, the risk matrix and Monte Carlo simulation are widely recognized tools that serve different purposes. The risk matrix is often valued for its simplicity and accessibility, while Monte Carlo simulation offers more precise, data-driven insights based on probabilistic modeling.
This paper focuses on a comparative evaluation of these two approaches, applying them to a real-world office building investment project to assess their effectiveness and practical utility in construction risk analysis.
This paper aims to compare two commonly used risk assessment methods, risk matrix and Monte Carlo simulation, in the context of a large-scale office building investment. The research focuses on identifying the key risks that impact the investment value, estimating their probabilities and impacts, and evaluating how each method supports risk-based decision-making. Specifically, the study seeks to answer the following questions:
- -
Which method more accurately reflects the probabilistic distribution of potential cost outcomes?
- -
What types of risks are most influential in the context of high-rise commercial construction?
The scientific contribution of this study lies in the integration of qualitative and quantitative risk analysis based on real investment data, offering practical insights into the management of contractual risks in complex construction environments.
The investment process in construction involves a sequence of factual and legal activities covering design, implementation, commissioning, and, in some cases, the subsequent maintenance, use, and demolition of the structure. Risk is an inherent feature of every stage of this process, influencing cost, schedule, and quality performance. Construction projects are subject to numerous uncertainties arising from technical, environmental, financial, and organizational factors, which can significantly affect project outcomes [
1].
Determining potential risks is a critical component of the planning stage. The early identification of risks enables stakeholders to develop contingency strategies, improving resilience to unforeseen events [
2]. This is particularly important in complex urban developments, where site constraints, regulatory requirements, and market volatility intensify exposure to risk [
3].
Construction risk management integrates both qualitative and quantitative approaches. Qualitative tools, such as risk matrices, provide a structured means of prioritizing threats and opportunities, while quantitative models, including Monte Carlo simulation, allow for probabilistic modeling of cost and schedule outcomes [
4]. Studies by Dikmen et al. [
5] have demonstrated that combining these approaches can improve decision-making by providing a holistic view of uncertainties.
Furthermore, comprehensive risk assessment frameworks, as described in ISO standards emphasize continuous monitoring and review of risk throughout the project life cycle. This ensures that emerging risks are addressed promptly and that management strategies remain aligned with project objectives. In the context of high-rise office developments, such integration of methodologies supports better contractual decision-making and reduces the likelihood of costly overruns [
6,
7].
Obviously, it may not be possible to anticipate all risks that may arise, but if they occur, attempts can be made to mitigate their impact on the investment.
Before risk analysis is initiated with respect to a construction project, one must first define the risks and pinpoint the investment aspects that are most exposed to the identified risks. The method to identify the risk must be selected and the measures to be taken in response to the identified risks should be determined [
8,
9,
10].
Risk is an uncertain event or a group of events that, if they occur, will have either a negative (threat) or a positive (opportunity) impact on achieving the pursued objectives. Risk is defined as the effect of uncertainty on objectives (ISO 31000) [
11]. However, in the construction industry, risk is commonly quantified as the product of the probability of its occurrence and the severity of its consequences (P × I), which serves as a practical basis for prioritizing and managing risks. Risk is measured as a combined probability of a predicted threat or opportunity becoming a reality and the degree of its possible impact on the goals and assumptions of a project. Setting the context aside, risk is strongly related to uncertainty and the notion of randomness [
7,
12,
13,
14,
15].
To identify the risks involved in an investment, the first step is to determine the formula for risk assessment.
The most popular formulas used in projects are “design and build” or “build only” investment variants. The amount and types of risks that may occur during the investment process are determined based on these formulas. Once the investment formula is identified, the risks that may occur during investment implementation can be identified, along with their prospective impact on the investment.
To be able to do that, the risk must first be assessed, or the probability of its occurrence must be estimated. Risk analysis (assessment) uses qualitative and quantitative assessment methods to evaluate threats and opportunities attributed to an investment. It identifies risks for which preventive measures should be implemented to avoid the possible negative consequences [
16,
17,
18,
19,
20,
21,
22,
23,
24,
25,
26,
27,
28].
The risk matrix method or the Monte Carlo method can be used for risk analysis.
A risk matrix is a method of visualizing threats and opportunities on a two-dimensional matrix that accounts for the probability and impact of a threat.
The Monte Carlo method is a computational method that uses random sampling to obtain numerical results; in practical terms, it involves generating a large number of random samples to examine complex systems and processes.
The risk matrix is a tool used to identify, assess, and manage various types of risks involved in the construction process. It features three main categories: levels, probabilities, and consequences. This is a tool for assessing potential risks when considering a prospective investment. Based on the solution emerging from the matrix map, both parties to the contract can take the most effective and informed measures. The data uploaded into the matrix will influence the development of the investment, which means the prior data analysis should be performed responsibly and as accurately as possible.
The matrix is a table that features risk types arranged in rows and strategies arranged in columns. Values are then entered into individual cells to determine the scale of impact on individual types of risk.
This method uses data that are arranged into a set of organized potential risks. The investment as a whole depends largely on the experience of project team members who assess individual risks.
Additionally, construction and investment management teams can use the risk matrix to better understand the risks that may emerge during a construction investment and to learn how to address these risks to minimize the negative impact on the investment [
29].
The Monte Carlo analysis is a mathematical method based on multiple probability simulations to model processes that are too complex to be able to predict their outcomes using an analytical approach. This method was used to determine the Probabilistic Space to stipulate a potential change in the investment value based on risk analysis.
Stochastic risk management methods (those that depend on random variables as a function of time) rely on the aspect of skill (e.g., creating a forecasting model) as opposed to guessing.
Risk is related to uncertainty, which is an inherent feature of our daily existence rather than a specific element of construction contracts.
Risk measurement is fundamentally a statistical problem, in which a statistical estimate of the distribution of changes in the value of an item or one of its functions is calculated based on historical observations and a specific model. Addressing unexpected, abnormal, and extreme outcomes rather than predictable, normal, or average ones is a particularly interesting and significant challenge in the theory of probability and statistics that deal with managing and measuring risk.
The problem of price increase or decrease if a given risk occurs can be intuitively defined using a particular distribution of probability in which changes of smaller amplitude are more probable than major fluctuations. After all, both in statistics and in the economy, below-average deviations occur much more often than extreme changes.
Uncertainty that accompanies the future state of a given phenomenon (e.g., a change in the cost of construction investment) can be represented by a Probabilistic Space.
The Monte Carlo analysis, designed for modeling processes that are too complex to predict their outcomes using an analytical approach, is one of the tools that can be used to determine the Probabilistic Space for a change in the cost of investment. This method predicts a set of outcomes based on an estimated range of values by relying on the assumed probability distributions [
30,
31].
However, in line with modern risk management practices, proactive mitigation planning is preferred over reactive actions taken after adverse events occur.
2. Literature Review
Risk management in construction projects has evolved significantly over recent decades due to the increasing complexity, cost, and time-sensitivity of modern developments. The construction industry, characterized by its dynamic and uncertain environment, has become a fertile ground for the development and application of risk identification, assessment, and mitigation tools.
Risk in construction is commonly defined as the possibility of experiencing losses due to uncertainty in the investment process, which may result in budget overruns, delays, or reduced performance quality. According to Wang et al. (2024) [
9], green construction projects, in particular, are exposed to multidimensional risks including technical, economic, environmental, and legal uncertainties. Similar conclusions were drawn by Wuni and Yahaya (2023) [
7], who emphasized the hierarchical nature of construction risks and the importance of structured assessment frameworks.
Two of the most commonly applied tools in construction risk analysis are the risk matrix and Monte Carlo simulation. The risk matrix is a qualitative tool that visually represents the likelihood and impact of various risk factors. As noted by Pietras (2017) [
29], the matrix approach provides a systematic method for assessing threats and categorizing them to prioritize managerial attention. Its popularity stems from its simplicity and the ease with which it communicates risk information to decision-makers.
In contrast, Monte Carlo simulation is a quantitative technique rooted in probability theory and statistical modeling. It involves performing thousands of simulations using random values derived from probability distributions to predict a range of possible outcomes (McNeil et al., 2005) [
13]. This method is particularly useful in modeling complex systems where interactions between risk factors may be non-linear or not intuitively predictable. As Walczak (2015) [
30] notes, Monte Carlo simulation provides not only point estimates of potential outcomes but also full distributions, enabling more informed risk-based decisions.
Several comparative studies have highlighted the complementary nature of both approaches. Ward and Chapman (2003) [
10] suggested that the integration of qualitative and quantitative methods in project management transforms risk management into uncertainty management, allowing for more adaptive and responsive planning. The PMBOK Guide (2004) [
6] similarly recommends combining different methods to improve robustness in project planning.
Kapliński (2013) [
22] applied utility theory to risk management in construction, emphasizing the value of simulation-based approaches in estimating financial exposure. Meanwhile, Skorupka (2007) [
27] proposed a detailed model for identifying and assessing construction project risks using both historical data and expert judgment, further supporting hybrid methodologies.
In conclusion, the literature supports the use of both the risk matrix and Monte Carlo simulation in construction risk analysis. The matrix is effective in early-stage risk identification and prioritization, while the Monte Carlo method adds depth and probabilistic rigor to decision-making. Their combined use can enhance risk visibility and support better project outcomes.
Risk management in construction investment decision-making has been widely discussed in the literature due to the sector’s exposure to multidimensional uncertainties. Studies emphasize that construction decisions are often influenced by dynamic market conditions, regulatory environments, site constraints, and stakeholder interests, all of which contribute to risk complexity.
In recent years, researchers have classified construction risks into categories such as financial, legal, environmental, technical, and managerial risks. For example, Zhang et al. (2020) [
32] highlighted the importance of the early identification of financial and legal risks in public–private partnership (PPP) projects. Similarly, Aven and Renn (2010) [
33] proposed a systemic approach to uncertainty analysis that integrates both objective and subjective dimensions of risk.
In terms of methodology, numerous risk assessment approaches have been applied across construction studies. Qualitative tools, such as risk checklists, interviews, and risk mapping, allow for rapid assessment based on expert judgment. Quantitative techniques, such as sensitivity analysis, expected value, fuzzy logic, and simulation-based methods, offer more rigorous and replicable outcomes.
Monte Carlo simulation has gained popularity in recent years due to its ability to incorporate uncertainty into probabilistic models, especially in cost estimation and schedule forecasting. In contrast, risk matrix models, although more limited in precision, remain popular for their intuitive format and ease of use, particularly in early project phases.
This study aims to bridge the gap between qualitative and quantitative methods by providing a direct comparison between risk matrix and Monte Carlo simulation applied to the same construction investment context.
3. Methodology
3.1. Creating a Risk Matrix
Risk Matrix analysis consists of 4 basic steps:
Risk identification: The first step is to identify potential threats and opportunities associated with the construction investment. These may include factors such as changes in relevant construction regulations, delays in the delivery of materials, weather conditions, problems with hiring qualified workers, or even unfavorable geological conditions at the construction site [
18,
23,
34].
Risk assessment: Next, each identified risk is assessed in terms of its impact and the probability of it taking place. In the construction sector, the risk impact can accommodate additional costs, schedule delays, loss of reputation, and even a risk to worker safety. Probability is defined as the chance that a given risk will happen in the course of an investment [
17].
Creating a risk matrix: A risk matrix can be created based on the assessment of the risk impact and the risk probability. Typically, the degree of impact (low to high) and probability (rare to frequent) are presented in a table or in a figure. Individual cells in the matrix represent different combinations of the impact and the probability for different types of risks.
Risk management: Once a risk matrix has been created, project teams can focus on high-risk areas to develop strategies to address those risks. This may include preventive measures, insurance-based risk transfer, accepting risk, or seeking alternative solutions [
35].
Risk identification and assessment are outlined in
Section 4.2. The next step is to identify the risk priority values worthy of particular attention. The probability and impact calculations based on data in
Table 1 and
Table 2 are as follows:
Probability scale:
Very high (5)—85–100%;
High (4)—60–84%;
Moderate (3)—35–59%;
Low (2)—15–34%;
Negligible (1)—0–14%.
Impact scale:
Catastrophic (5)—>PLN * 1,000,001;
Significant (4)—PLN 650,001–PLN 1,000,000;
Moderate (3)—PLN 350,001–PLN 650,000;
Low (2)—PLN 150,001–PLN 350,000;
Negligible (1)—PLN 0–PLN 150,000.
Priority was calculated by multiplying the probability of occurrence and the impact.
* Abbreviations: PLN—Polish Zloty, the currency of Poland; PLN—Polish Zloty, as per ISO 4217 currency code list (alpha code: PLN, numeric code: 985) [
36].
It should be noted that the P × I values used in the risk matrix are derived from ordinal (ranked) scales rather than continuous numerical data. While this approach does not yield precise probabilistic measurements, it is widely accepted in practice for early-stage, semi-quantitative risk assessment. In this study, the use of ordinal scales was necessary due to the limited availability of quantitative data at the initial planning phase.
Risk prioritization was conducted by multiplying the ordinal scores of probability and impact assigned to each identified risk. These scores were defined on a 5-point scale (1 = negligible, 2 = low, 3 = moderate, 4 = high, 5 = very high), and their product (P × I) was used to obtain a semi-quantitative risk priority value, as presented in
Table 2.
For the purpose of this study, 12 key risks were selected for further analysis. The selection was based on the results of an initial risk identification phase, which generated a comprehensive list of potential threats and opportunities for the project. This initial list was compiled through expert interviews, historical project documentation review, and brainstorming sessions with the project management team.
The prioritization of risks was performed using a qualitative assessment method, in which each identified risk was rated according to its estimated probability of occurrence and potential impact on cost, schedule, and quality. The top 12 risks with the highest combined scores were selected for detailed quantitative analysis using both the risk matrix and Monte Carlo simulation methods.
This targeted selection allowed for a focused evaluation of the most critical risks that could significantly influence the project’s performance. While a larger number of risks could be analyzed, such an approach might dilute the focus of the study and reduce the clarity of the comparative analysis between the two applied methodologies.
It is important to note that the values obtained from the P × I matrix are semi-quantitative estimates, as both probability and impact are based on ordinal scales rather than continuous data. While this approach does not offer fully probabilistic precision, it provides a practical and widely accepted method in the construction industry for prioritizing risks under uncertainty. This limitation was considered when interpreting the final results.
Among the twelve analyzed risks, ten were identified as threats that could increase costs, while two were recognized as opportunities potentially leading to cost savings.
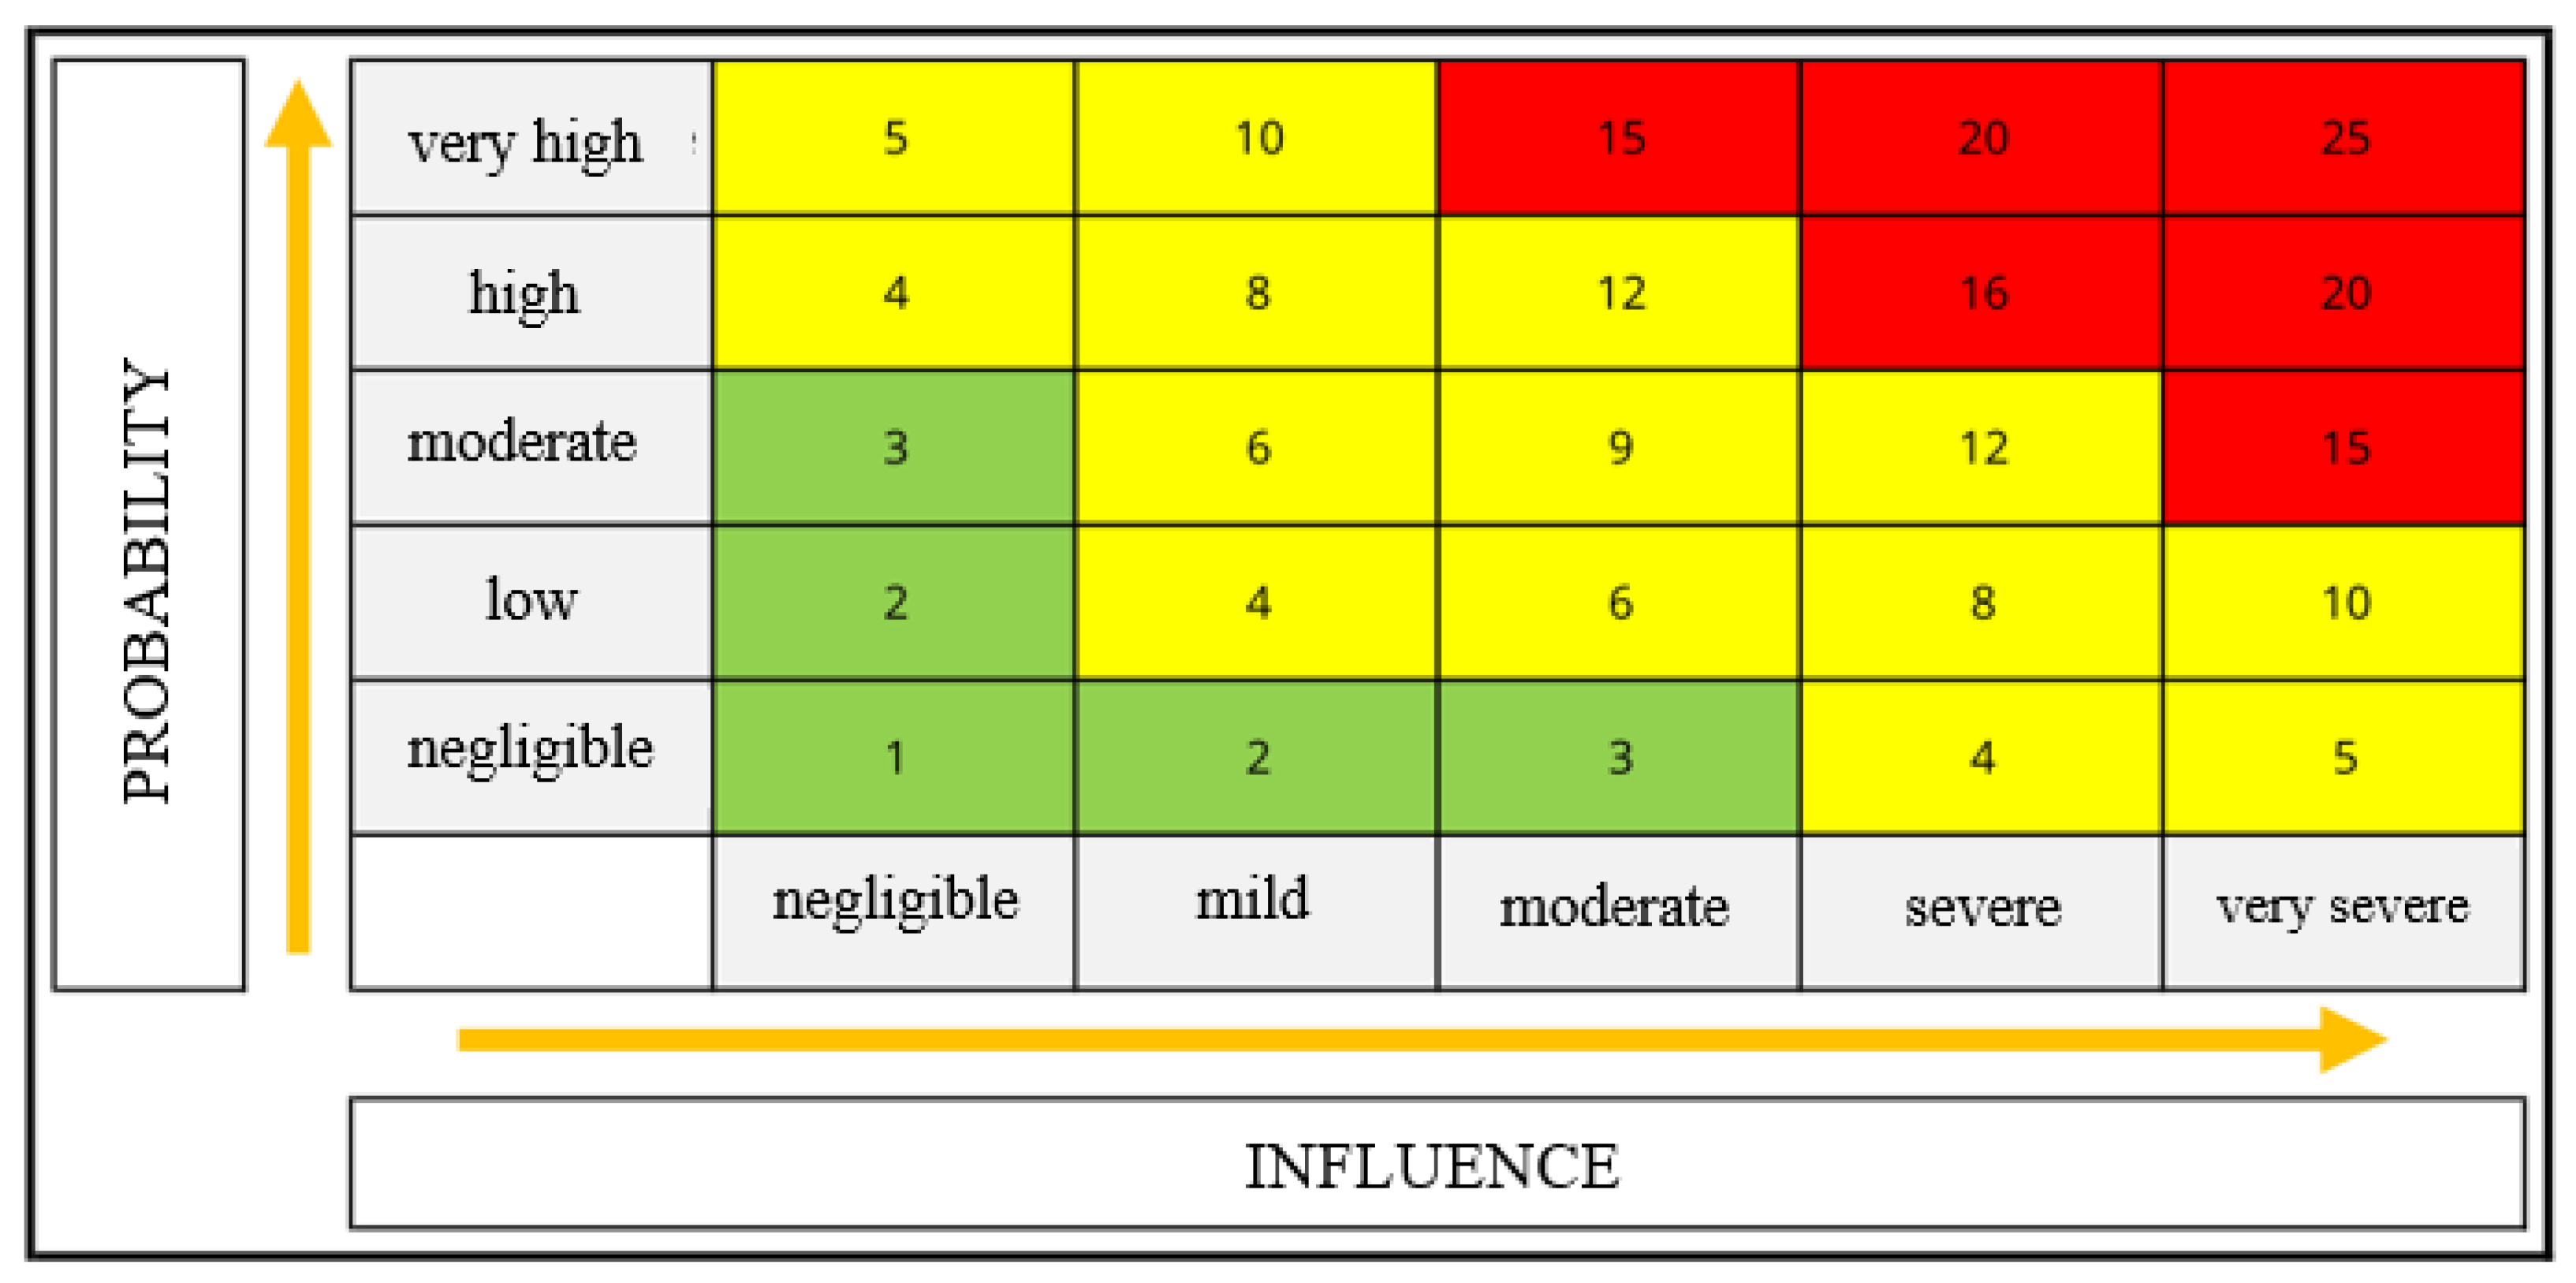
The next step is to determine the risks that are most relevant and should be monitored and controlled more frequently, based on the risk matrix [
Figure 1].
The color code used in the table below:
Red—risks that have a severe impact on the investment. These risks are most likely to occur and are associated with the most severe impact on the investment.
Green—risks that have a moderate impact on the investment. These risks are relatively likely to occur and involve moderate costs.
Yellow—risks that have a low impact on the investment. These risks are relatively likely to occur and involve low costs.
3.2. The Monte Carlo Method
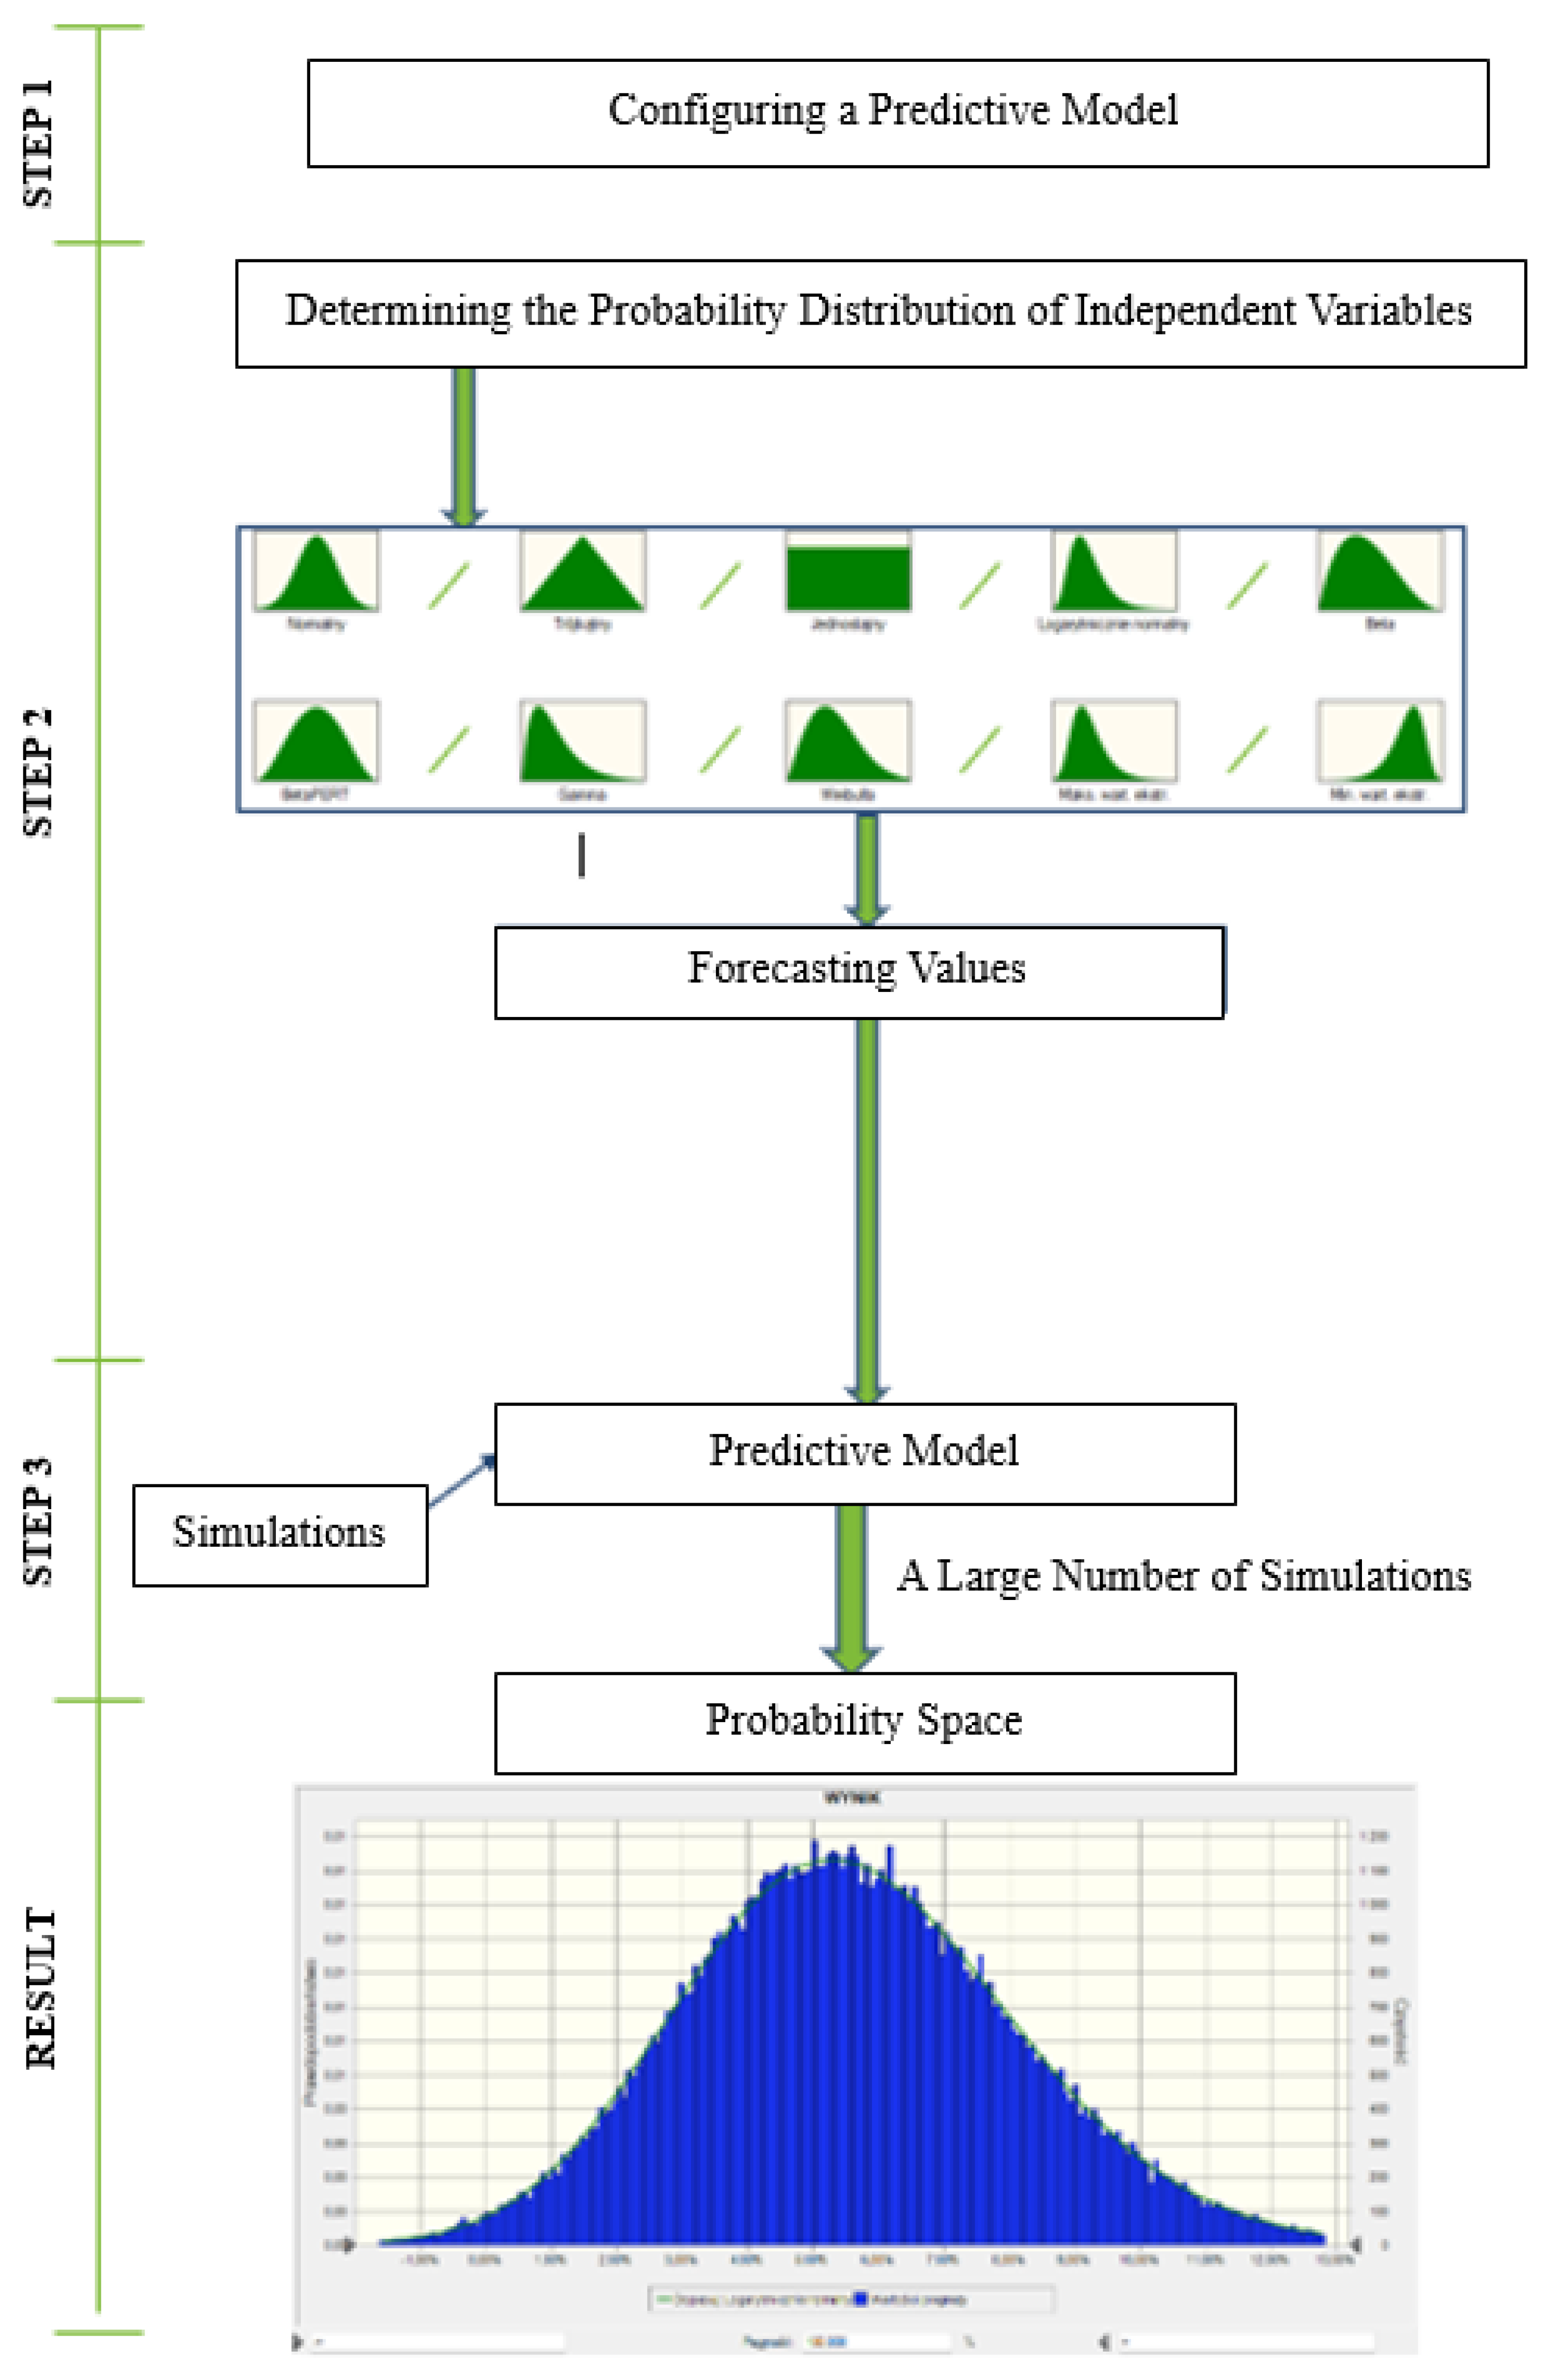
Any tool for the Monte Carlo analysis involves three basic steps:
Configuring a forecasting model by specifying both the dependent variable to be predicted and the independent variables (also called input, risk, or predictor variables) to be used to formulate the forecast.
Determining the probability distribution of independent variables. A range of probable values is determined with an assigned probability weight based on historical data and the analyst’s best judgment.
The simulations should be repeated to generate random values for the independent variables. Simulations should be continued until sufficient outcomes are produced to create a representative sample with a close to infinite number of possible combinations.
A flowchart of the Monte Carlo analysis is presented below, followed by a detailed description of the subsequent steps [
Figure 2].
The probability distribution was determined in the next step of the analysis.
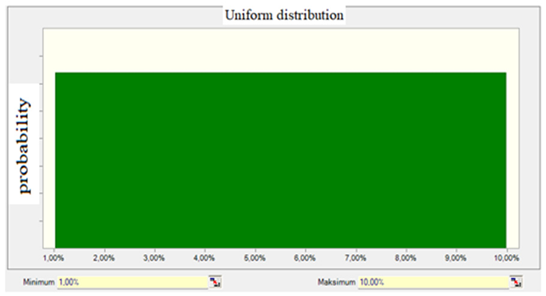
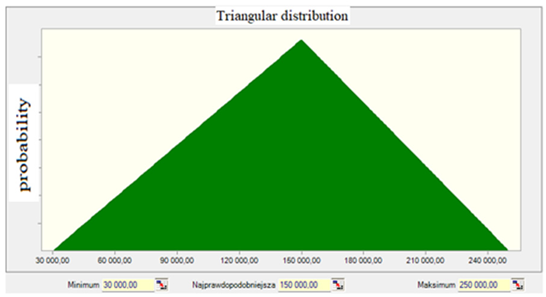
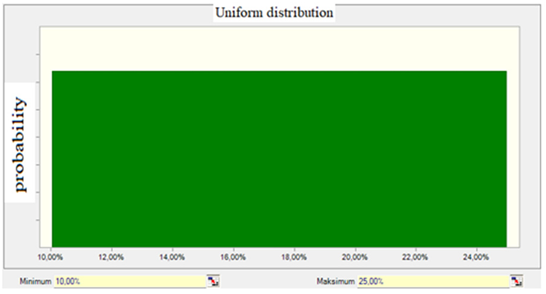
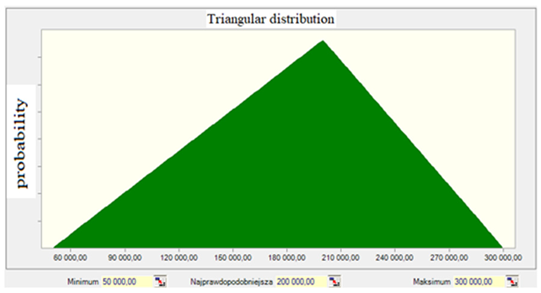
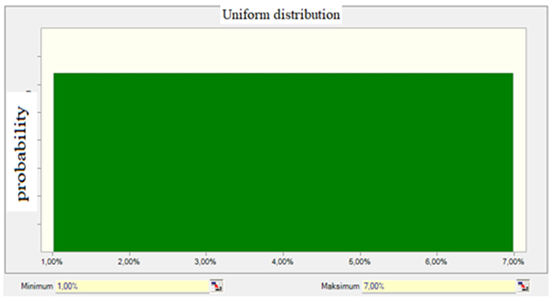
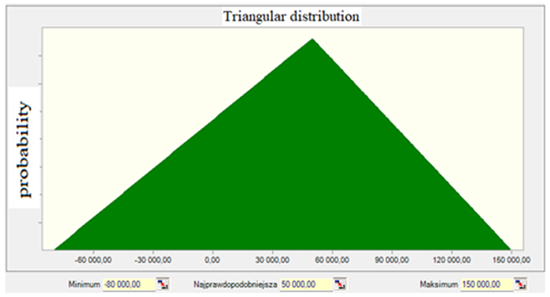
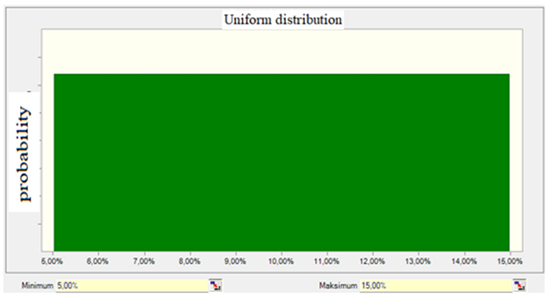
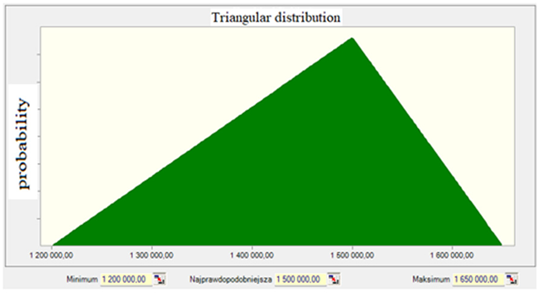
Two types of probability distributions were selected for the independent variables in relation to:
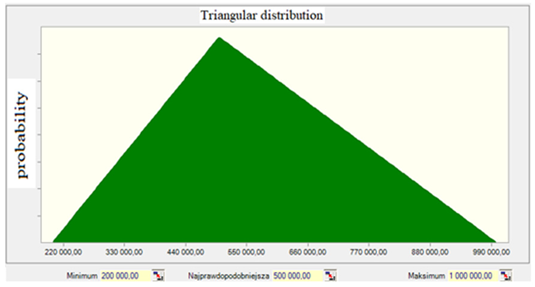
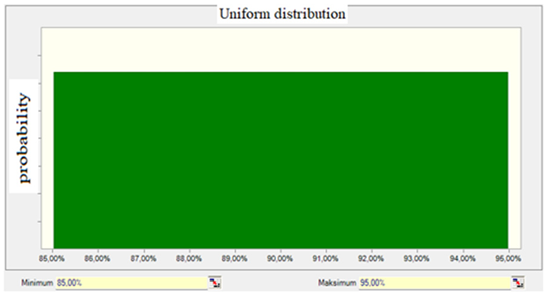
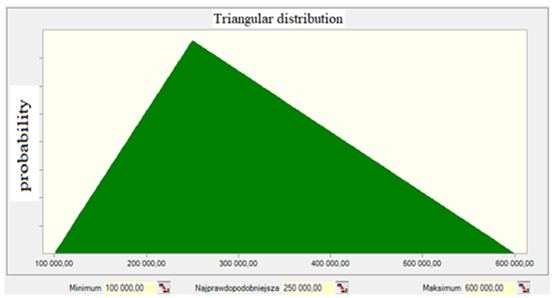
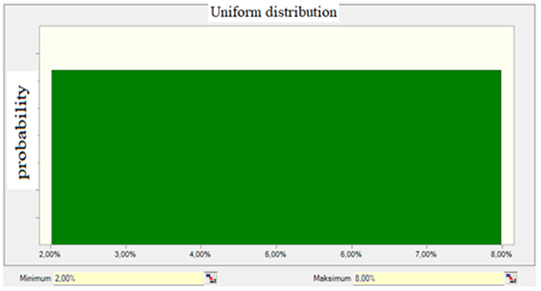
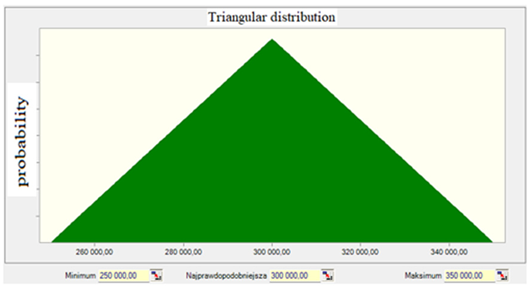
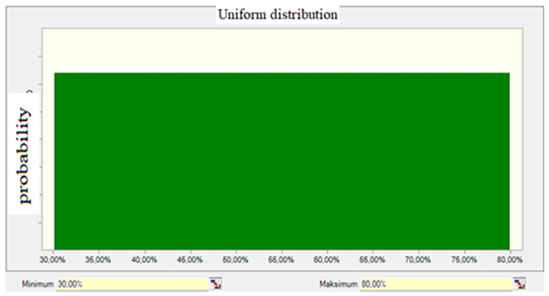
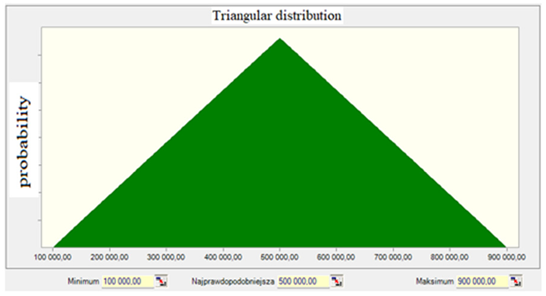
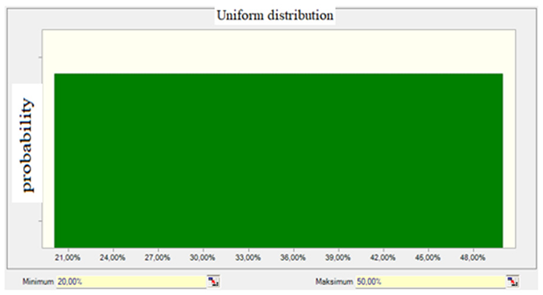
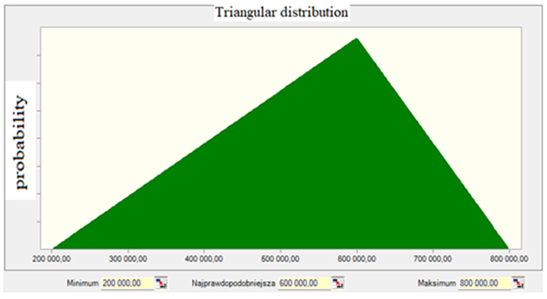
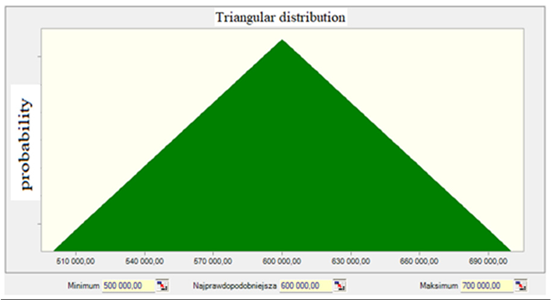
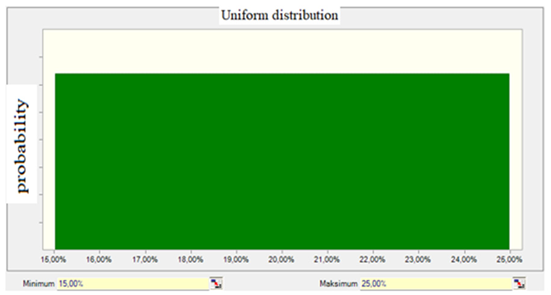
In the Monte Carlo simulation, two types of probability distributions were applied: triangular distribution and uniform distribution. The triangular distribution was chosen because it is widely used in construction risk analyses, particularly in situations where empirical data are limited, and experts can estimate only the minimum, most likely, and maximum values for a given variable. This distribution reflects the intuitive perception of risk by practitioners and allows for relatively simple modeling of uncertainty.
The uniform distribution was used for risks where there was no basis for assuming a specific most likely value, assuming that all values within a given range have equal probability of occurrence. This approach helps to avoid overemphasizing any particular value in situations of high uncertainty.
Alternatively, other distributions such as normal, lognormal, or beta-PERT can be applied in construction risk assessments, as they may better represent the variability of certain parameters when appropriate statistical data are available. In this study, simpler distributions were deliberately chosen to facilitate the interpretation of results, ensure comparability with the risk matrix outcomes, and maintain the consistency of assumptions across all analyzed cases.
4. Results
4.1. Description and Profile of the Investment
This analysis was performed for an office building located in the center of Warsaw, with a roof height of 230 m. The building has over 70,000 square meters of office space spread over 53 floors and a representative lobby space featuring decorated walls. In addition to the office space, the building houses conference rooms, relaxation zones, restaurants, cafés, and a viewing terrace with a panoramic view over Warsaw. The building also features four underground floors featuring a parking space, technical rooms, and additional usable spaces.
The building consists of the following elements:
* Abbreviations: HVAC—heating, ventilation and air conditioning; BMS—building management system.
The building was constructed in accordance with the principles of sustainable development and is fitted with systems that make the building spaces more comfortable and safe. The building has been awarded the highest rating in the BREEAM certification system, which validates its compliance with high ecological and sustainable development standards. It has the following additional features:
Rigidity and stability: The tower structure is designed for maximum stiffness and stability. The reinforced concrete core is surrounded by steel frames, as the building was designed to withstand dynamic loads such as vibration and wind loads.
Anti-vibration system: Vibration-damping systems, such as mass dynamic dampers, are used on the upper floors to reduce wind-induced vibrations and to give extra comfort to the occupants.
Facade: The glass and steel used in the façade balance aesthetic appeal with energy efficiency so that the building meets high sustainability standards. The building is also fitted with photovoltaic panels and rainwater recovery systems.
The building reflects modern architecture and advanced construction technologies that combine functionality, comfort, and sustainable development. Construction costs are significant due to the high quality of the materials used, advanced technical systems, and innovative, environmentally friendly solutions. The total construction cost was estimated at PLN 2 billion.
4.2. Identifying the Most Popular Risks for the Analyzed Investment
This chapter presents the risks identified for the office building based on the available investment data.
The input data for the analysis will be determined in the following steps:
As in any investment, both threats and opportunities were identified for the office building concerned.
Table 3, below, presents the identified risks along with their description.
Ranges of values are defined for the identified risks.
Table 4, below, specifies the minimum and maximum values, based on which the most probable value is calculated.
The values below were estimated based on technical documentation, tender cost estimates, risk costs in benchmark investments, and the know-how of the analysts.
Probabilities of the identified risks are defined in minimum and maximum values [
Table 5].
The risk probabilities are estimated based on benchmark investments and the know-how of the analysts.
The best probability for the discussed risks applicable to the office building was determined based on the available data [
Table 6]. The probability was estimated by an analyst to perform a risk analysis that was based on their own experience and available insights.
4.3. Results
4.3.1. The Risk Matrix
Risk values were calculated according to the scale of their occurrence, based on the available data.
Table 7, below, presents the calculated risk exposure values.
The risk value was calculated as the product of the impact on cost and the probability value determined according to the priority rating.
The risk exposure value was assessed at PLN −552,000.00.
The calculated value should be interpreted as a cost reduction opportunity on the condition that the identified risks are monitored and managed.
The following can be concluded from the risk matrix analysis:
The most significant risks that should be monitored during the implementation of the investment:
- ∘
Value engineering (façade replacements) as an opportunity.
- ∘
Unidentified networks as a threat.
- ∘
Errors in the design documentation as a threat.
Currently, the contractor is most likely to achieve savings of PLN 552,000.00.
4.3.2. The Monte Carlo Method
Table 8, below, summarizes the selection of probability distributions for the independent variables.
The next steps involve simulations [
Table 9]. In total, 200,000 (two hundred thousand) simulations were performed to determine additional costs that would apply if the identified risks materialized in order to create the Probabilistic Space for a changed investment value, in accordance with the methodology discussed in the above Methodology section.
The columns contain the following data:
[1] No.—number;
[2] Risk—risk designation;
[3] SIM Value—a value produced in the Monte Carlo simulation based on the probability distribution for specific risk values;
[4] SIM PROB—simulated value from 0% to 100% independently for each risk;
[5] Min—lower limit of the probability value for a given risk;
[6] Max—upper limit of the probability value for a given risk;
[7] SIM Probability Range—a value produced in the Monte Carlo simulation based on the probability distribution for a specific probability of risk occurrence;
[8]
Result—value from column [
3] if the value from column [
7] is greater than or equal to the value from column [
4] (materialization of risk).
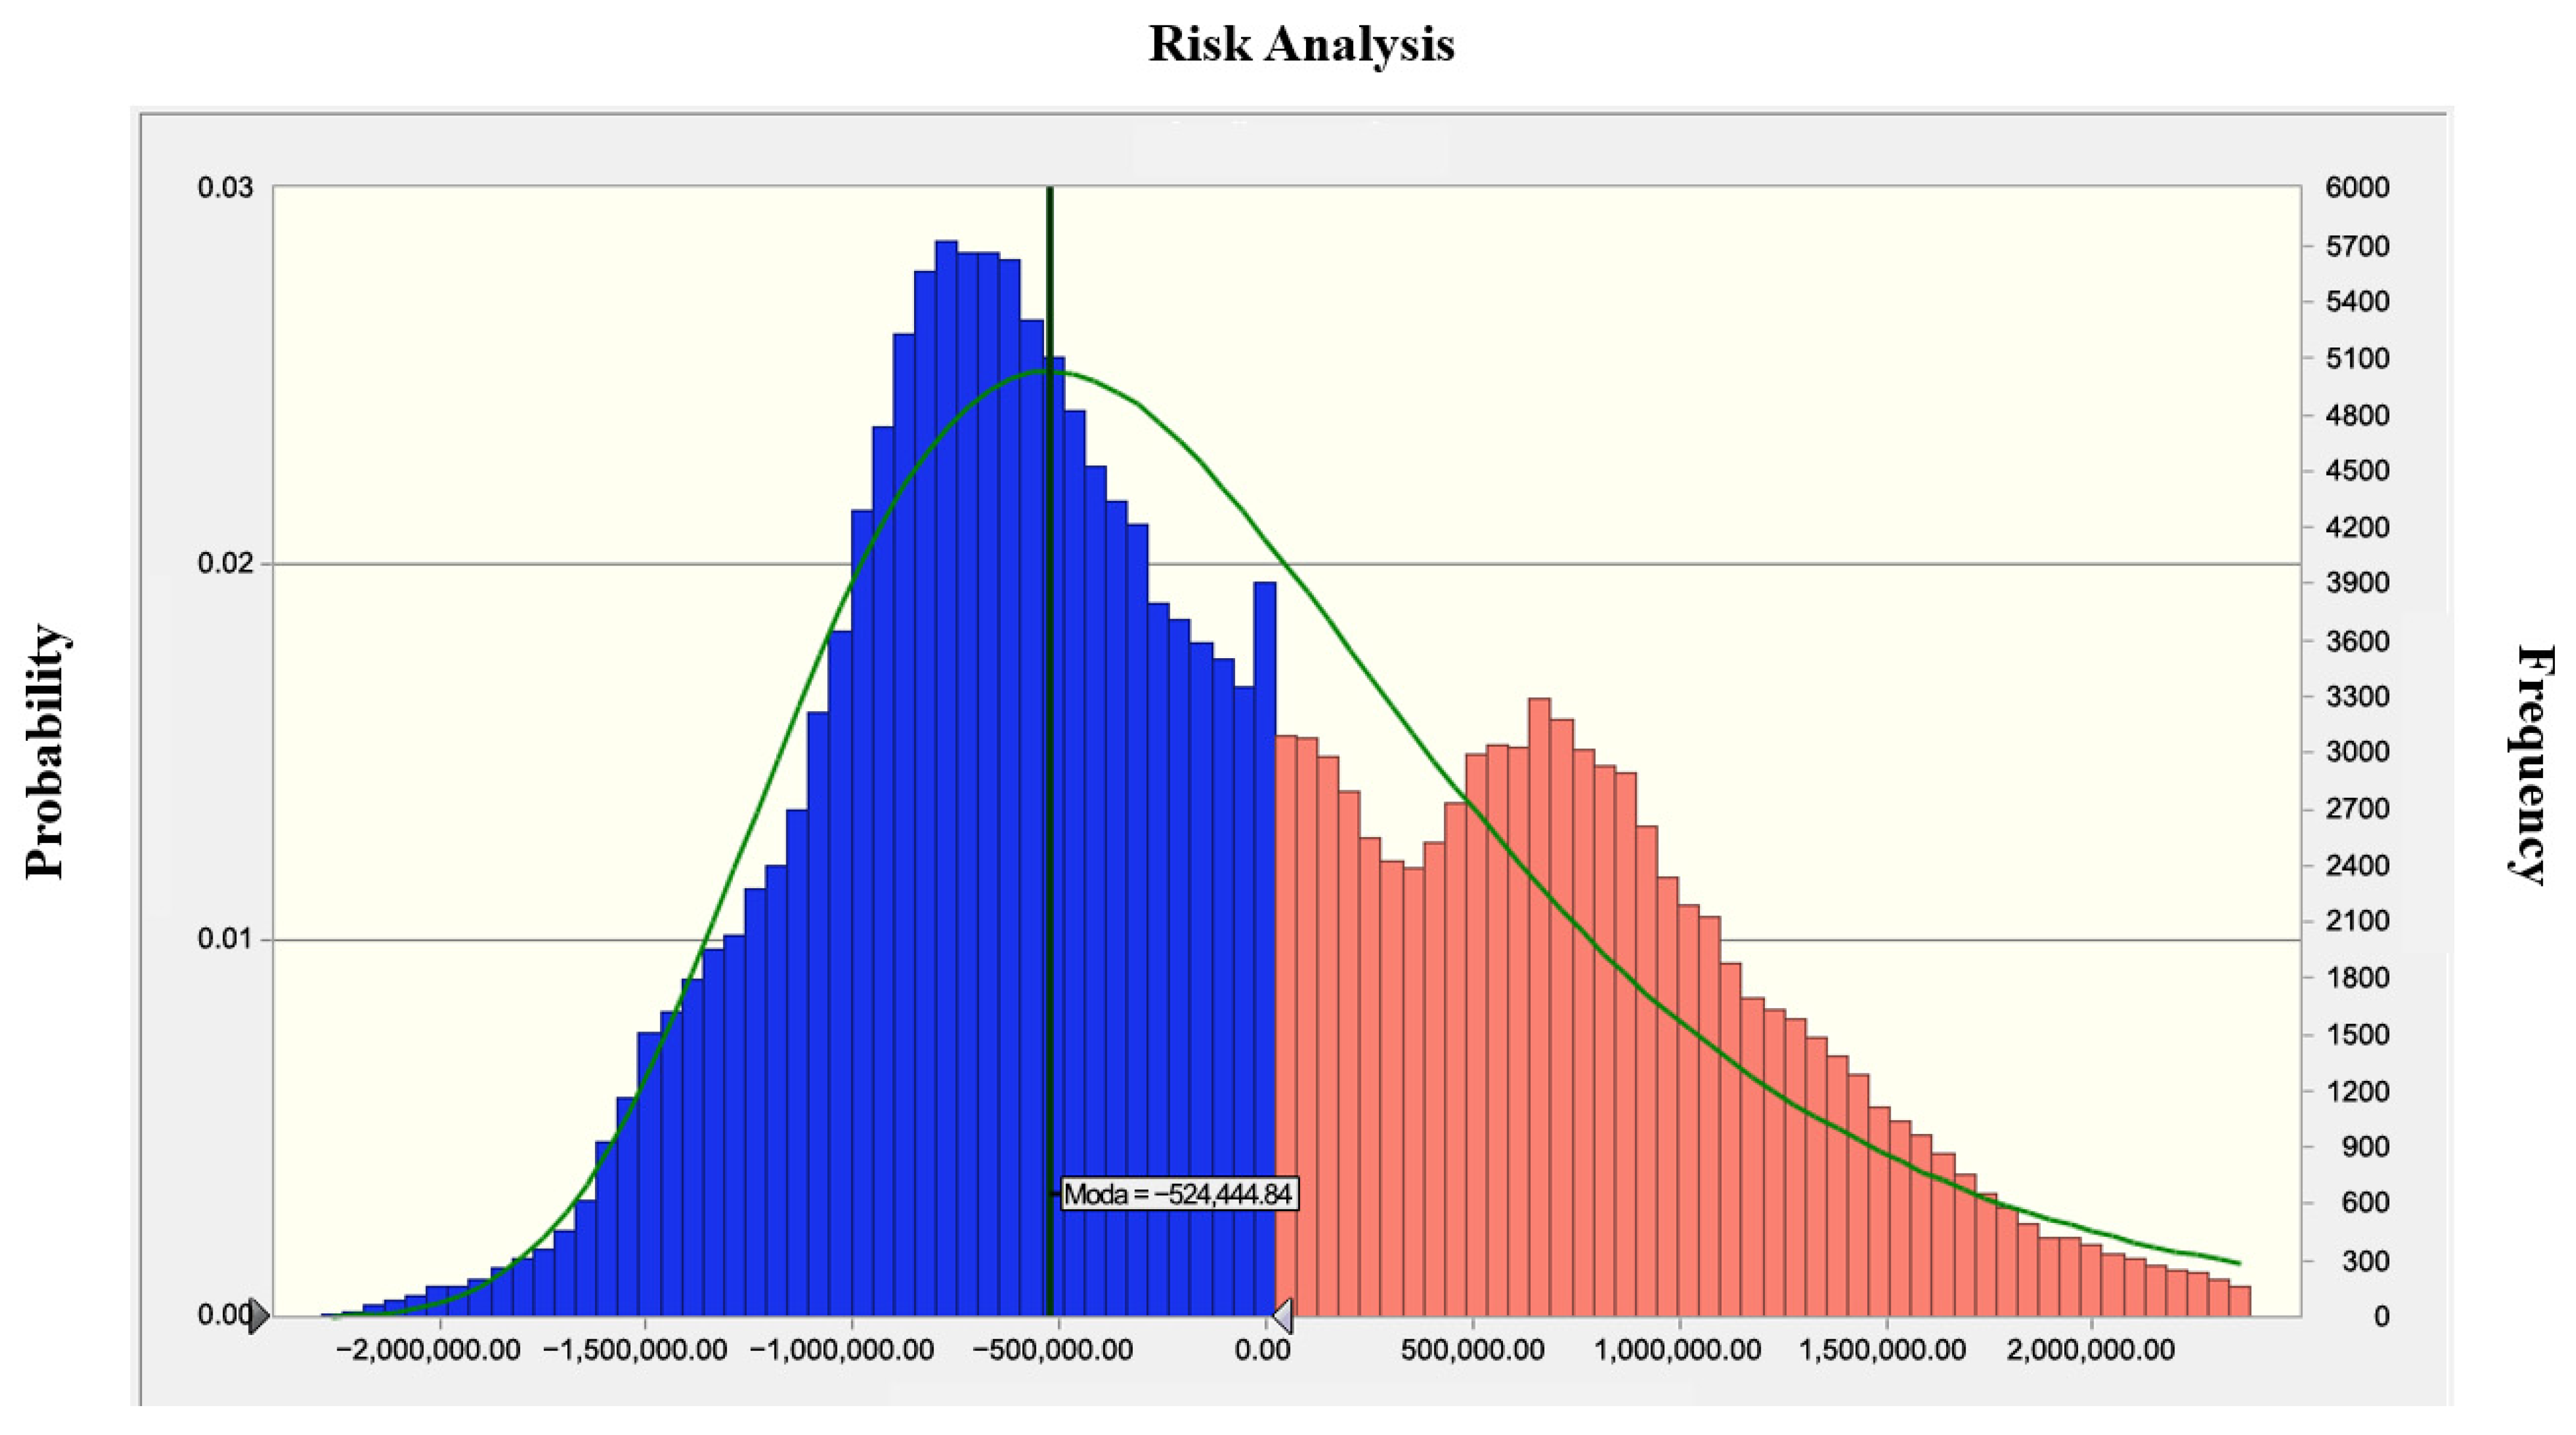
The results of the Monte Carlo analysis are presented on the next page [
Figure 3].
Analysis results of selected measurements:
Mode (most probable value) = PLN −524,444.84;
A 59.587% certainty of an increase in the implementation costs less than or equal to 0.00;
Minimum value of −2,285,715.52;
Maximum value of 4,119,905.54.
The following can be concluded from the Monte Carlo Analysis:
The most significant risk that should be monitored during the implementation of the investment:
- ∘
Value engineering (façade replacements) as an opportunity.
- ∘
Unusual increase in the costs of production factors.
- ∘
Non-inventoried networks.
Currently, the contractor is most likely to achieve savings of PLN 524,444.84.
It can be concluded with almost 60% certainty that the identified risks in total will not generate any additional costs for the contractor.
4.3.3. Comparative Analysis of Both Methods
This analysis demonstrated that both methods are based on the same input data. The first step was to determine the risks involved in the investment, the risk exposure values, and the risk probability, based on the available project data, the analyst’s best judgment, and experts’ assessments.
Once the calculations are performed, it transpires that both methods produce similar probability outcomes and reveal some saving opportunities provided that the investment risks are properly monitored and controlled. For comparison, the value of savings calculated using the risk matrix and the Monte Carlo approach amounts to PLN 552,000.00 and PLN 524,444.84, respectively. In a series of simulations, the Monte Carlo method produced a more accurate value.
Not only is the amount of possible contractual savings similar, but so is the analyzed risk that was identified as the one that should be closely monitored and regularly reassessed throughout the investment implementation. In both analyses, the value engineering (substitutes for facades) opportunity is the first risk that is highly likely to occur. In this specific case, the risk should be managed in such a way that the opportunity is materialized, given the significant value of the possible savings.
This cost-saving opportunity is followed by two risks classified as threats, whose assessment differs slightly in the two methods used in this study.
In the risk matrix, non-inventoried networks are the most probable risk that may occur during the investment implementation phase, followed by errors in the design documentation. Non-inventoried networks are secondary to unusual increases in the costs of acquiring production factors in the Monte Carlo analysis.
Considerable attention should be given to observing, monitoring, and controlling threats so as to prevent their occurrence or to take risk management measures so as to contain the possible consequences.
These similarities and differences between the methods discussed are presented in
Table 10, below.
Apart from the discussed similarities and differences, no other additional input data were identified in the comparative analysis of both methods, as the risk matrix method is a rather basic and limited approach to risk analysis.
Also, it can be confidently concluded that the Monte Carlo risk analysis features a number of additional options and outcomes in addition to determining the opportunities and risks associated with an investment. This method can reveal additional opportunities; in a way, it builds on and complements the risk matrix approach to risk analysis.
In the Monte Carlo analysis conducted using the example of
Figure 3, it can be concluded with almost 60% certainty that the identified risks in total will not generate any additional costs for the contractor. Additionally, the following maximum and minimum values can be determined for the risks that may occur:
Minimum value: PLN −2,285,715.52;
Maximum value: PLN 4,119,905.54.
Based on the results and the scope of the analyzed methods taken together, it can be concluded that the risk values obtained with each method are similar; both methods reveal similar threats and risk opportunities that may emerge during the investment. Overall, the risk matrix is a more basic method based on expert knowledge; it produces valid results that can be achieved without significant cost. The Monte Carlo method is a much more accurate approach that reveals additional dependencies and results that the risk matrix method does not detect, but the simulations can only be performed using dedicated software.
Table 10 provides a comparative overview of the results obtained using the risk matrix and Monte Carlo simulation approaches. As shown, both methods yield similar rankings for the analyzed risks, yet the Monte Carlo method offers additional probabilistic insights.
5. Discussion
The results of the risk assessment using both the risk matrix and Monte Carlo simulation confirm the utility and complementarity of these methods in managing uncertainty in construction projects. While the numerical difference between the estimated savings using both approaches was relatively small (PLN 552,000.00 vs. PLN 524,444.84), the methodologies offered distinct advantages in terms of transparency, depth, and interpretive capacity.
Both the risk matrix analysis and the Monte Carlo simulation produced very similar predicted savings. This convergence may be attributed to the fact that both approaches rely on the same input data—namely, the identification and assessment of the probability and impact of selected risks. Although the methods differ in how they process this information, when expert estimates are similar, it is possible to obtain comparable final results.
The risk matrix enables a qualitative evaluation and prioritization of risks using scoring scales, while Monte Carlo models parameter variability in a probabilistic manner. If the probability distributions in Monte Carlo are selected in a way that is consistent with the assessments used in the risk matrix, there is a high likelihood of achieving comparable outcomes.
Moreover, the analyzed risks were characterized by relatively high cost impacts and were clearly distinguished from other factors, which may have strengthened the correlation between the results of both methods. This suggests that in projects dominated by high-probability, high-impact risks, the results of a risk matrix analysis may approximately correspond to those obtained from Monte Carlo simulations. However, in more complex projects, with a larger number of risks of varying nature and influence distributions, the differences between these methods may be more pronounced.
The risk matrix method, although relatively simple, proved effective in identifying and prioritizing key risks and opportunities. Its visual representation allowed for straightforward communication of risk severity and likelihood, making it a useful tool for early-stage project planning and management. The matrix revealed that value engineering (specifically façade replacements) posed the most significant opportunity, while non-inventoried networks and errors in design documentation were the most critical threats. These results align with findings by Skorupka (2007) [
27] and Anysz and Zbiciak (2013) [
16], who emphasized that technical and design-related risks are among the most common and impactful in large-scale urban construction projects.
The comparison between the risk matrix and Monte Carlo simulation is particularly relevant in construction investment planning, where both time and financial predictability are crucial. While the risk matrix offers a rapid, intuitive classification of risks, it lacks depth in terms of probabilistic outcomes. Monte Carlo simulation, on the other hand, allows for a more robust, data-driven analysis of uncertainty and potential variability in outcomes.
By applying both approaches to the same set of risks, this study demonstrates how the two methods can complement one another in real-world project settings. This is particularly useful in construction, where decision-makers must balance simplicity, speed, and analytical accuracy when assessing threats to project success. The results suggest that although both methods produce comparable rankings, the Monte Carlo approach provides a higher resolution view of risk exposure, which can support better-informed strategic decisions.
On the other hand, the Monte Carlo simulation enabled a more nuanced and probabilistic understanding of risk behavior. Its advantage lies in the ability to simulate a broad spectrum of possible outcomes by integrating uncertainty into both the impact and probability of risk events. This approach not only confirmed the results of the risk matrix but also provided insight into the distribution of possible cost changes, which is critical for financial planning. The ability to quantify the likelihood of budget overruns or savings adds significant value to strategic decision-making, particularly in projects with high financial exposure, as supported by McNeil et al. (2005) [
13] and Ward and Chapman (2003) [
10].
Interestingly, the simulation revealed that there is nearly 60% certainty that no additional costs will be incurred due to the identified risks. This finding has major implications: with proper monitoring and risk management, the contractor is more likely to remain within budget or even generate cost savings. Such insights are difficult to obtain with qualitative tools alone and demonstrate the benefit of combining deterministic and stochastic methods.
The Monte Carlo simulation result, indicating an approximately 60% probability of avoiding cost overruns, can serve as a valuable decision-support tool for both contract negotiations and project financing planning. In practice, this means that, at the current level of identified risks, there is a realistic chance of maintaining costs within the planned budget; however, the uncertainty remains significant enough to require the implementation of protective measures.
In the contract negotiation process, this result can be used as a basis for introducing appropriate risk allocation clauses (e.g., price adjustment clauses, contingency allowances) and for negotiating flexible payment schedules that account for possible cost variations during project execution.
From the perspective of project financing, the result can help determine the size of contingency funds and financial reserves that should be secured to address potential cost overrun risks. It is also advisable to conduct additional sensitivity analyses to identify those project parameters that have the greatest influence on the likelihood of cost overruns, enabling their more effective monitoring during project implementation.
Moreover, both analyses highlighted that value engineering consistently appears as the highest-impact opportunity. This supports the argument that risks in construction are not solely threats but can also be opportunities for optimization, especially when design and construction processes are re-evaluated in light of emerging market conditions or technical innovations.
In the opportunity assessment, the value engineering approach was applied, with one of the highest-ranked actions being the replacement of the building’s façade. This assessment was based on three main criteria:
Impact on investment costs—potential savings from using alternative materials and technologies with lower procurement and installation costs, while maintaining the required technical quality.
Impact on schedule—potential reduction in construction time through the use of prefabricated or modular façade elements, which limits on-site work.
Impact on operation—improved energy efficiency and reduced building maintenance costs over its life cycle.
Particular attention was paid to ensuring that the proposed change would not negatively affect the architectural integrity of the project or the standards of sustainable development. The change in materials was preceded by an analysis of compliance with the original architectural concept and applicable regulations. Environmental criteria such as durability, recyclability, and impact on the building’s energy balance were also considered.
As a result, the façade replacement was assessed as an action that can deliver significant economic benefits while maintaining compliance with design requirements and green building principles, confirming the validity of recognizing it as a key opportunity in the value engineering process.
However, certain limitations of the study should be acknowledged. First, the input data for risk values and probabilities relied on expert judgment and benchmark projects, which may introduce subjectivity. Second, the analysis focused on a limited number of risks (12 total), while actual construction projects often involve dozens of interacting variables. As pointed out in the literature (Wang et al., 2024) [
9], comprehensive risk management in green or high-rise buildings must consider additional environmental, regulatory, and operational risks.
In summary, the combination of qualitative and quantitative methods provided a robust and comprehensive framework for risk analysis in the studied office building project. Future applications could expand this approach by incorporating real-time risk monitoring, sensitivity analysis, and dynamic reassessment during project implementation. This would further enhance adaptability and increase the likelihood of successful project delivery.
Therefore, incorporating both qualitative and quantitative methods in risk assessment may enhance the reliability of investment decisions in construction projects.
6. Conclusions
This paper discusses the phenomenon of risk and its nature, determinants, and management. Risk is an inherent part of life and business and is not specific to the construction sector. It is broadly understood and can be managed in many ways to achieve the expected outcomes.
Risk refers to uncertainty about the outcome and can evolve into threats and opportunities. In the context of construction investments, risk can be defined as contractual losses or savings.
Each stakeholder who takes part in an investment process pursues their contractual obligations, including risk management, with as much diligence as is reasonably possible. Individual parties are responsible for different scopes of risk. They have to analyze investment records to keep track of the requirements that may apply and should cooperate at every stage of the investment.
After all documents are collected to determine and identify the relevant risks, risk management planning must be followed by a risk management plan, which involves decision-making to eliminate or limit the risks that have emerged. The final stage is to monitor and control the assigned risks throughout the investment period.
Taking this into consideration, risk can be effectively analyzed, controlled, and modified as the events unfold. However, account should be taken of the fact that unidentified risks are not easy to manage, and therefore the contractual risks must be meticulously determined in as much detail as possible.
In this article, risks were identified for an office building located in Warsaw and calculated using two methods: the risk matrix analysis and the Monte Carlo method.
Twelve risks were included in the analyses, of which ten involved an increase in investment costs and two were opportunities to achieve savings. A probability and a value were assigned to each of the risks in case the relevant risk occurs.
The risk matrix was first discussed. It was used to estimate the priority values for risks and to calculate the ensuing risk values. The Monte Carlo analysis was then explored, with which the risk value was estimated based on simulations using dedicated software.
Finally, both methods were compared as presented in
Table 10, both producing similar results.
In this study, the analyses carried out included 12 risk variants; however, construction investments typically involve significantly more risks, which often change in the course of the investment process. Where a dozen or so risks are involved, it can be difficult to estimate the probability and impact of each individual risk or to determine the risk priority in the risk matrix. This may lead to errors that affect the monitoring and control of risk management. In this case, Monte Carlo analyses produced better and more accurate outcomes and reduced the margin of error, which translates into better risk management. Additionally, different risk management approaches can be tested at the simulation stage to minimize the impact on investments.
Based on the information discussed and the calculations performed, it can be concluded that determining the most accurate risks and managing them in a systematic way is the precondition for any successful investment. The more we attempt to eliminate or limit the impact of the overall investment risks, the easier it becomes to perform a contract without any additional cost increases and losses during and after the contractual relationship.
Therefore, each stakeholder starting an investment should make every effort to ensure that the most precise number of defined risks, well-identified priorities, and detailed risk management instructions are included in the table of contractual risks at the early stage of an investment in order to minimize or eliminate any impending risks [
33].
7. Practical Implications
From a practical perspective, the findings of this study provide valuable insights for construction managers, investors, and project stakeholders. The comparison of risk matrix and Monte Carlo simulation illustrates that relying on a single method may not always capture the full scope of risk exposure. Therefore, construction practitioners are encouraged to apply a dual-method approach, especially in complex or large-scale projects, to improve risk visibility and enhance planning accuracy.
Moreover, the use of Monte Carlo simulation can support financial decision-making by providing a probabilistic view of possible cost overruns or savings, which is particularly beneficial during contract negotiations and contingency planning. On the other hand, the risk matrix remains a valuable tool in early project phases when time is limited and quick assessments are required.
Overall, integrating both approaches into the project lifecycle enables more robust risk management strategies that are adaptable to the dynamic nature of construction projects.
In summary, the findings of this study offer valuable practical insights for stakeholders involved in the planning and execution of complex construction projects, particularly high-rise commercial developments:
Decision-making support: The dual-method approach (risk matrix + Monte Carlo simulation) provides both intuitive and data-driven frameworks for identifying and managing key contractual risks.
Budget risk awareness: By quantifying the probability and financial impact of specific risks, project managers can make more informed decisions about contingency planning and resource allocation.
Opportunity optimization: Identifying value engineering as a high-impact opportunity demonstrates that risk analysis should not only focus on threats but also actively seek design and execution improvements.
Adaptability for contractors: The proposed methodology can be readily adapted by general contractors or project managers to improve their internal risk management systems during tender preparation and implementation phases.
8. Limitations and Future Work
Despite the robustness of the methodology, several limitations must be acknowledged:
The analysis was limited to 12 key risks identified as having the highest potential impact on the project’s success. Although this selection represents the most critical threats and opportunities from a project management perspective, it does not encompass all possible risks that may arise during project execution. Consequently, the results should be interpreted with caution, particularly when attempting to generalize the findings to other projects or contexts.
Moreover, the exclusion of lower-priority risks means that certain cumulative effects of minor risks may not have been fully captured. In future studies, expanding the scope of analysis to include a broader range of risks could provide a more comprehensive picture of the project’s risk landscape, though it would also require more extensive data collection and potentially more complex modeling.
Reliance on expert judgment: Input values for probabilities and impacts were derived from technical documentation and expert estimation, which may introduce subjective bias.
Single-case focus: The study focused on one high-rise office building investment, which may limit generalizability to other types of construction projects (e.g., infrastructure, industrial, residential).
Traditional approaches to risk assessment, such as static risk matrices, provide a snapshot of the risk landscape at a specific point in the project life cycle. In reality, however, risks in construction projects are dynamic and can change significantly during project execution due to, for example, scope modifications, market fluctuations, weather conditions, or resource availability issues.
To enhance the effectiveness of risk management, it is recommended to implement a dynamic risk assessment update strategy, which includes:
Regular risk reviews—e.g., monthly or quarterly sessions to update the risk register, assessments, and response plans.
Monitoring early warning indicators—tracking project parameters (progress, productivity, budget deviations) that may signal an increased likelihood of certain risks occurring.
Use of digital tools—leveraging BIM platforms and project management systems to collect real-time data and automatically analyze changes in risk profiles.
Continuous model calibration—updating probability distributions in simulation models, such as Monte Carlo, as new data becomes available.
Involvement of key stakeholders—engaging the client, contractors, and designers in regular risk review processes to improve the completeness of identification and assessment.
Such an approach enables the early detection and mitigation of emerging threats, minimizing their impact on project cost and schedule, while also improving prediction accuracy compared to static risk assessment models.
Another limitation of this study lies in the assumption of independence between the identified risks in the Monte Carlo simulation. In real-world construction projects, some risk factors may be interrelated or correlated, potentially amplifying or reducing their combined impact. Advanced modeling techniques, such as correlation matrices or optimization algorithms (e.g., hill-climbing), could be used in future research to address this limitation and enhance the realism of the simulation outputs.
Future research directions could include:
Applying the hybrid method across a diverse range of construction projects to assess its scalability and generalizability.
Integrating sensitivity analysis or tornado diagrams to determine the most influential variables.
Enhancing real-time risk monitoring through integration with BIM systems or IoT data sources.
Comparing the outcomes of different probabilistic distributions beyond the triangular and uniform models to assess their impact on simulation accuracy.
