Article

Multi-Scale Context Fusion Method with Spatial Attention for Accurate Crop Disease Detection

1
College of Computer Science and Technology, Shenyang University of Chemical Technology, Shenyang 110142, China
2
Key Laboratory of Intelligent Technology for Chemical Process Industry of Liaoning Province, Shenyang 110142, China
*
Author to whom correspondence should be addressed.
Appl. Sci. 2025, 15(17), 9341; https://doi.org/10.3390/app15179341
Submission received: 1 August 2025 / Revised: 18 August 2025 / Accepted: 21 August 2025 / Published: 26 August 2025
(This article belongs to the Special Issue Deep Learning for Image Processing and Computer Vision)

Abstract

Crop diseases not only severely affect crop quality but also lead to significant reductions in yield. To address the challenge of accurate crop disease detection in complex environments, we propose a novel detection method based on the YOLO11 model, termed YOLO-MSCM. To enhance the extraction of small-object features, we introduce the MCSA module, which improves the model’s spatial feature perception. Additionally, a SimRepHMS module is designed to leverage local contextual information and strengthen multi-scale feature fusion. To improve the model’s adaptability and generalization capability, we employ DynamicConv, which dynamically adjusts channel weights based on input-specific patterns. For more accurate bounding box localization, we incorporate the WIoUv3 loss function to optimize box regression. Experimental results demonstrate that YOLO-MSCM achieves improvements of 6.1% in precision, 9.1% in recall, 6.2% in mAP@50, and 3.7% in mAP@50:95 compared to the baseline YOLO11n model. Comparative evaluations with several mainstream and state-of-the-art models further validate the superior detection performance of YOLO-MSCM, offering a reliable and effective solution for accurate crop disease detection in complex scenarios.

1. Introduction

As the world’s largest agricultural producer, agriculture plays a key pillar role in China’s economy and is crucial for national economic development [1,2]. However, during the crop cultivation process, environmental factors make crops highly susceptible to various diseases [3]. This not only affects the quality of crops but also leads to more serious issues such as reduced food production. Among the common types of crop diseases, fungal diseases lower the market value of crops by damaging their leaves, stems, or fruits and may introduce harmful substances, while insect pests directly damage various parts of the crops, causing plant injury or even crop death. In practical agricultural production, both types of diseases cause significant losses to agriculture. Therefore, accurately detecting crop diseases is extremely important for ensuring the quality of agricultural products and reducing economic losses.
Driven by advancements in deep learning technologies, the integration of agricultural engineering and artificial intelligence has emerged as a key trend in modern agricultural practices [4,5,6,7,8,9,10,11]. Image-based detection and localization methods for object recognition have been widely applied across various fields of agricultural monitoring [12,13,14,15,16,17,18,19,20]. Rahman, C.R. et al. [21] introduced a CNN-based framework for rice pest and disease identification by fine-tuning established models such as VGG16 and InceptionV3, which demonstrated strong classification performance. Additionally, they developed a compact two-stage CNN architecture that significantly compressed the model, reducing its parameter count by 99% relative to VGG16 and achieving a classification accuracy of 93.3%, thereby enabling efficient execution on mobile platforms. The model was trained on a specific dataset, indicating limitations in its adaptability to cross-regional or diverse field conditions, which highlights the need for further enhancement of its generalization performance. Mathew, M. P. et al. [22] proposed a modified YOLOv5 architecture to identify bacterial spot disease on sweet pepper foliage, enabling rapid identification in large-scale farmland. This approach captures field images using smartphones and leverages YOLOv5 for real-time disease detection, offering both high accuracy and speed, thus allowing farmers to detect and manage diseases promptly. Despite its efficiency, the study focused only on a single disease—bacterial spot—and lacked comprehensive multi-disease recognition capabilities. Xue, Z. Y. et al. [23] proposed an improved pest and disease detection model for tea plants named YOLO-Tea, which integrates ACmix, CBAM, and RFB modules into YOLOv5 and employs GCNet to reduce resource consumption. The model significantly enhances detection accuracy and efficiency for tea leaf diseases and pests under complex natural conditions. The experimental results demonstrate that YOLO-Tea achieves performance gains of 5.5%, 1.8%, and 7.0% over Faster R-CNN in AP0.5, APTLB, and APGMB, respectively. Furthermore, it shows superior results compared to SSD, with improvements of 7.7%, 7.8%, and 5.2% across the same evaluation metrics. Overall performance improvements range from 0.3% to 15.0%. One limitation, however, is that the dataset was collected only during well-lit afternoon hours, without considering low-light conditions in the early morning or at night. Further improvements are needed to enhance the model’s adaptability across different lighting environments. Zhao, S. Y. et al. [24] proposed a Faster R-CNN model with multi-scale feature fusion for detecting multiple diseases in greenhouse-grown strawberries. By integrating ResNet, FPN, and CBAM modules, the model effectively improves recognition performance for small lesions in complex backgrounds. However, the high architectural complexity and substantial computational demands hinder its applicability in resource-constrained environments such as lightweight or edge computing scenarios.
Zhao, Y. F. et al. [25] introduced an enhanced detection framework named SPD-YOLOv7, specifically designed for pest identification in maize crops under challenging conditions such as small object size, image blur, low resolution, and interspecies variation. Based on YOLOv7, the model incorporates a Space-to-Depth Convolution (SPD-Conv) module to retain small-target features and integrates ELAN-W with CBAM to improve feature extraction efficiency. Coupled with data augmentation strategies including Gaussian noise and brightness adjustment, the framework enhances robustness and generalization. Experimental results show that SPD-YOLOv7 achieves an accuracy of 98.38% and an average accuracy of 99.4%, outperforming the original YOLOv7 by 2.46% and 3.19%, respectively. The model maintains real-time detection performance; however, its architecture is more complex than that of the original YOLOv7, which poses challenges for deployment on embedded devices. Sun, D. Z. et al. [26] proposed an improved YOLOv8 model tailored for pest detection in tobacco under complex environmental conditions. The model incorporates the AFPN structure, the VoV-GSCSP module, and a parameter-free SimAM attention module, effectively lowering computational complexity and model size while preserving high detection accuracy. Despite overall performance improvements, the gains in accuracy remain modest, with mAP@0.5 increasing by only 1%, recall improving by 2.7%, and precision rising by 2.4%. Thus, the enhancement in detection accuracy is relatively limited.
The above research results demonstrate that object detection technology has become increasingly mature in the field of crop disease identification, offering strong technical support for precision agriculture management. However, most existing studies remain confined to specific diseases of individual crops [27,28,29,30,31,32,33,34,35], with the developed models typically optimized for particular data distributions and application scenarios. This results in limited generalization capability, making it difficult for these models to adapt to the diverse conditions found in real-world field environments, thus significantly hindering the large-scale deployment and practical application of such technologies in agriculture. To overcome this bottleneck and further enhance the precision in identifying and controlling plant diseases, this paper proposes an improved object detection framework named YOLO-MSCM. This framework is designed to boost the detection accuracy and robustness of the model in complex natural scenes involving multiple crop diseases, thereby promoting the development of intelligent plant protection technologies toward greater generality and practicality.
The improvements in this method are mainly reflected in the following four aspects:
  • We propose an attention module incorporating multi-scale spatial perception—MCSA. MCSA fuses multi-scale spatial information through parallel branches and employs a lightweight gating network to dynamically adjust the weights of each branch, thereby enhancing the focusing ability of spatial attention.
  • A context-aware feature enhancement module—SimRepHMS—is proposed. SimRepHMS introduces a multi-branch depthwise separable bottleneck structure that captures contextual dependencies through cascaded multi-scale receptive fields. It then adaptively enhances the fused feature maps to highlight key regions, thus improving the feature fusion effectiveness across different levels.
  • To further enhance the adaptability and representational power of feature expression, the DynamicConv dynamic convolution mechanism is introduced. This mechanism generates attention weights based on the feature vectors obtained through global average pooling and dynamically selects and fuses multiple expert convolution kernels, thereby improving robustness and generalization performance across varying environmental conditions.
  • WIoUv3 is adopted as the loss function to enhance the model’s emphasis on localization accuracy and mitigate the negative impact of low-quality anchor boxes by suppressing harmful gradients in the later training stages, ultimately improving training stability.

2. Materials and Methods

To validate the effectiveness of the proposed YOLO-MSCM framework, we conducted experiments using a self-constructed dataset and compared the performance against baseline models. The following section details the data, model architecture, and key components of the proposed method.

2.1. Dataset

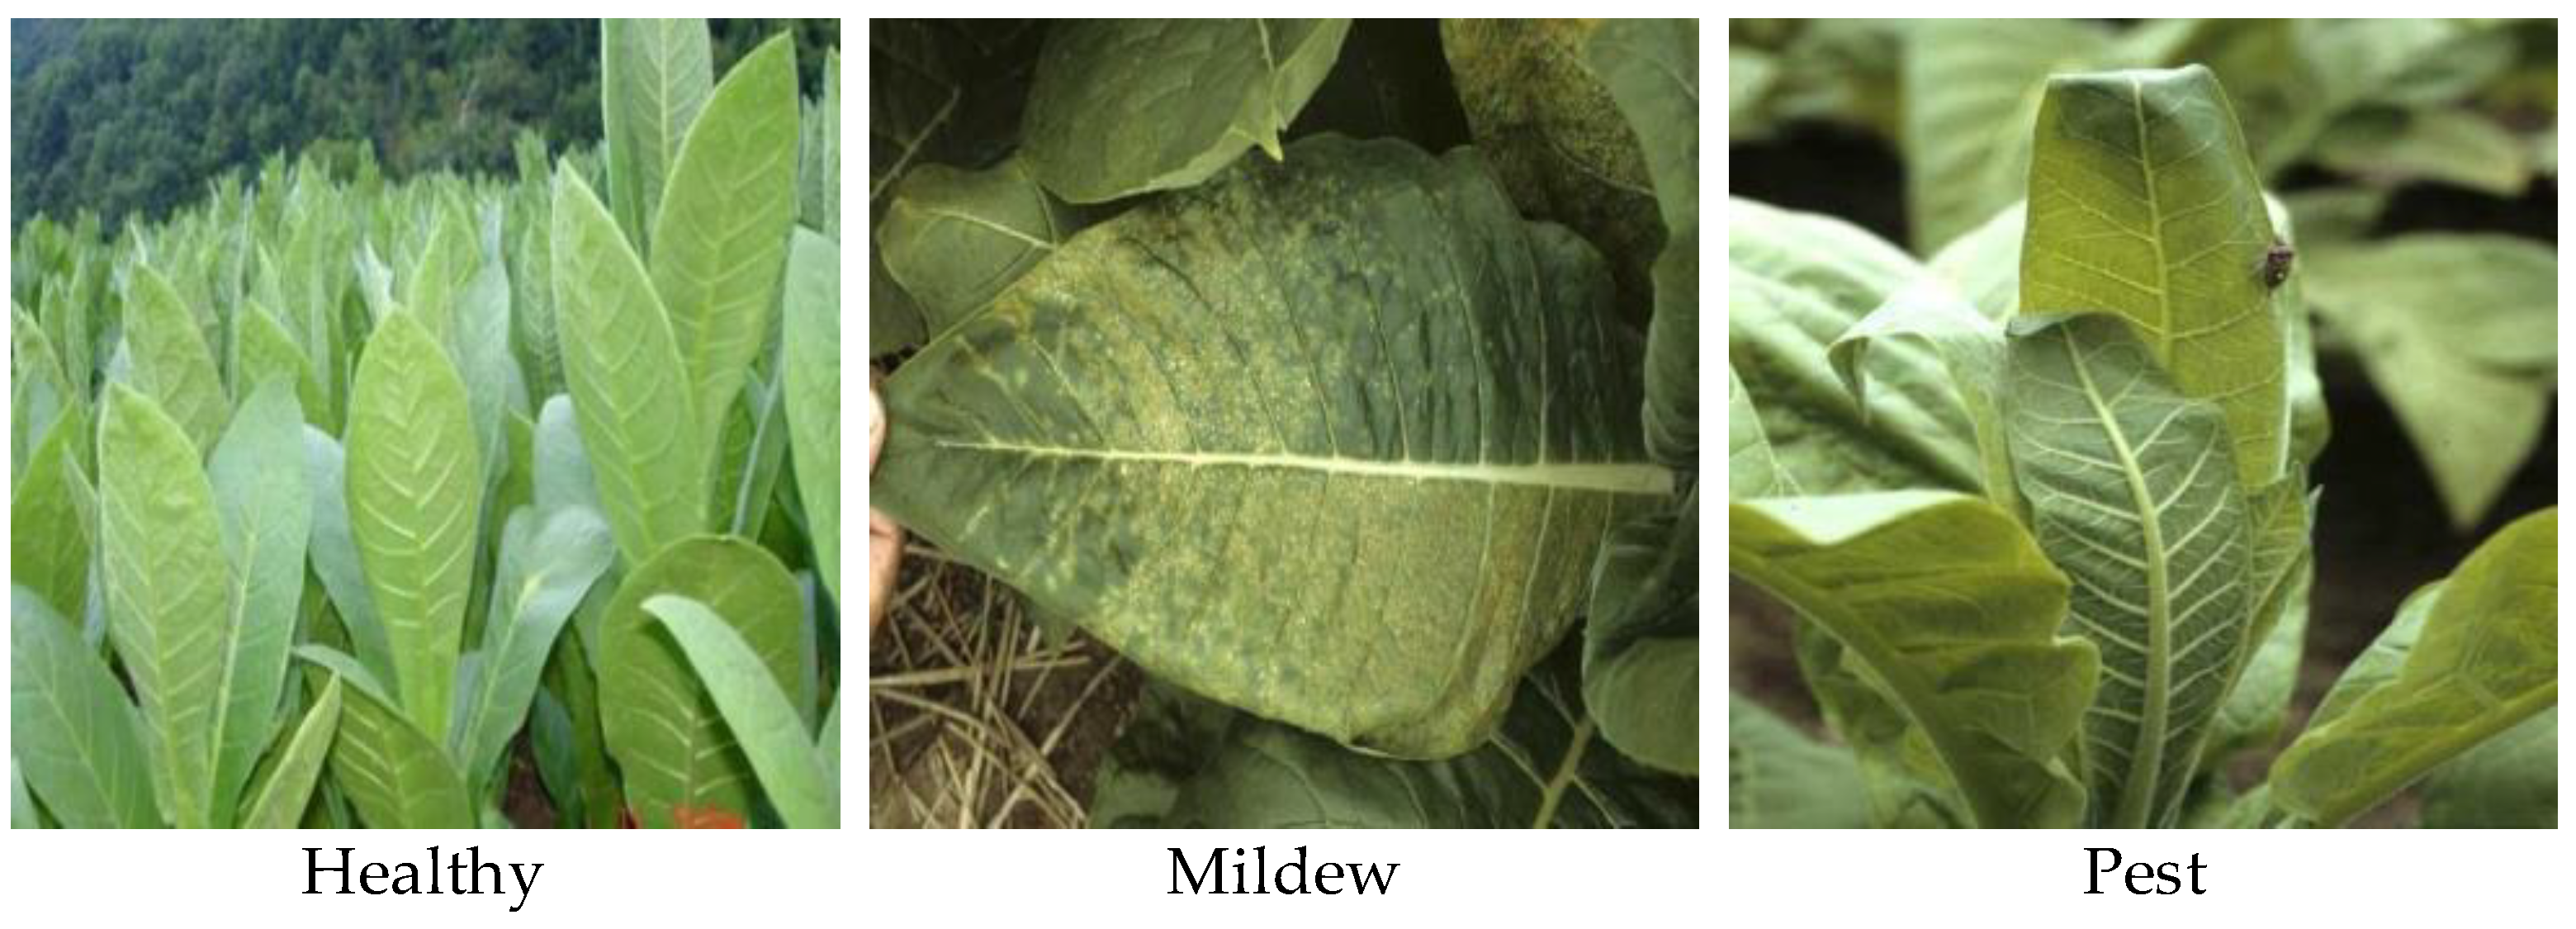
In this study, we used a self-constructed crop disease dataset for model training and validation. The dataset contains a variety of crop disease images collected from the internet, with diverse collection conditions, most of which were taken during the day. The device resolution is no less than 720p. The annotations are based on standardized phenotypic features (such as lesion morphology, color variation, and spatial distribution), ensuring high-fidelity label quality and cross-species consistency. This dataset includes four types of crops: soybean, spinach, tobacco, and lettuce. It covers three label categories: healthy, mildew [36], and pest [37], comprising a total of 2656 images. Details are shown in Figure 1.
During the data preprocessing phase, we carefully identified and removed interfering samples and mislabeled data to enhance the quality of the dataset. Interfering samples are defined as images with severe motion blur, occlusion, or non-standard viewpoints, factors that may affect the effective extraction of features. For mislabeled samples, we employed systematic manual checks and made corrections or deletions based on the consistency between image content and label annotations, ensuring the accuracy and internal consistency of the dataset’s labels.
After preprocessing, the dataset was split into training, validation, and test sets in an 8:1:1 ratio. During the splitting process, stratified sampling by class was used to ensure that the class distribution in each subset remained consistent with the original dataset. This approach effectively avoids evaluation bias caused by class imbalance and ensures that each class is adequately represented in both training and evaluation stages.
To address the limitations imposed by a small dataset and to improve the model’s generalization ability, three data augmentation techniques were applied during training: random brightness adjustment, addition of Gaussian noise, and contrast adjustment. The effects of data augmentation are shown in Figure 2. By simulating real-world disturbances such as lighting variations and sensor noise, these techniques effectively increased the diversity of the training data, thereby enhancing the model’s robustness in real-world application scenarios. The number of images and corresponding label statistics of the final dataset are detailed in Table 1.

2.2. YOLO11

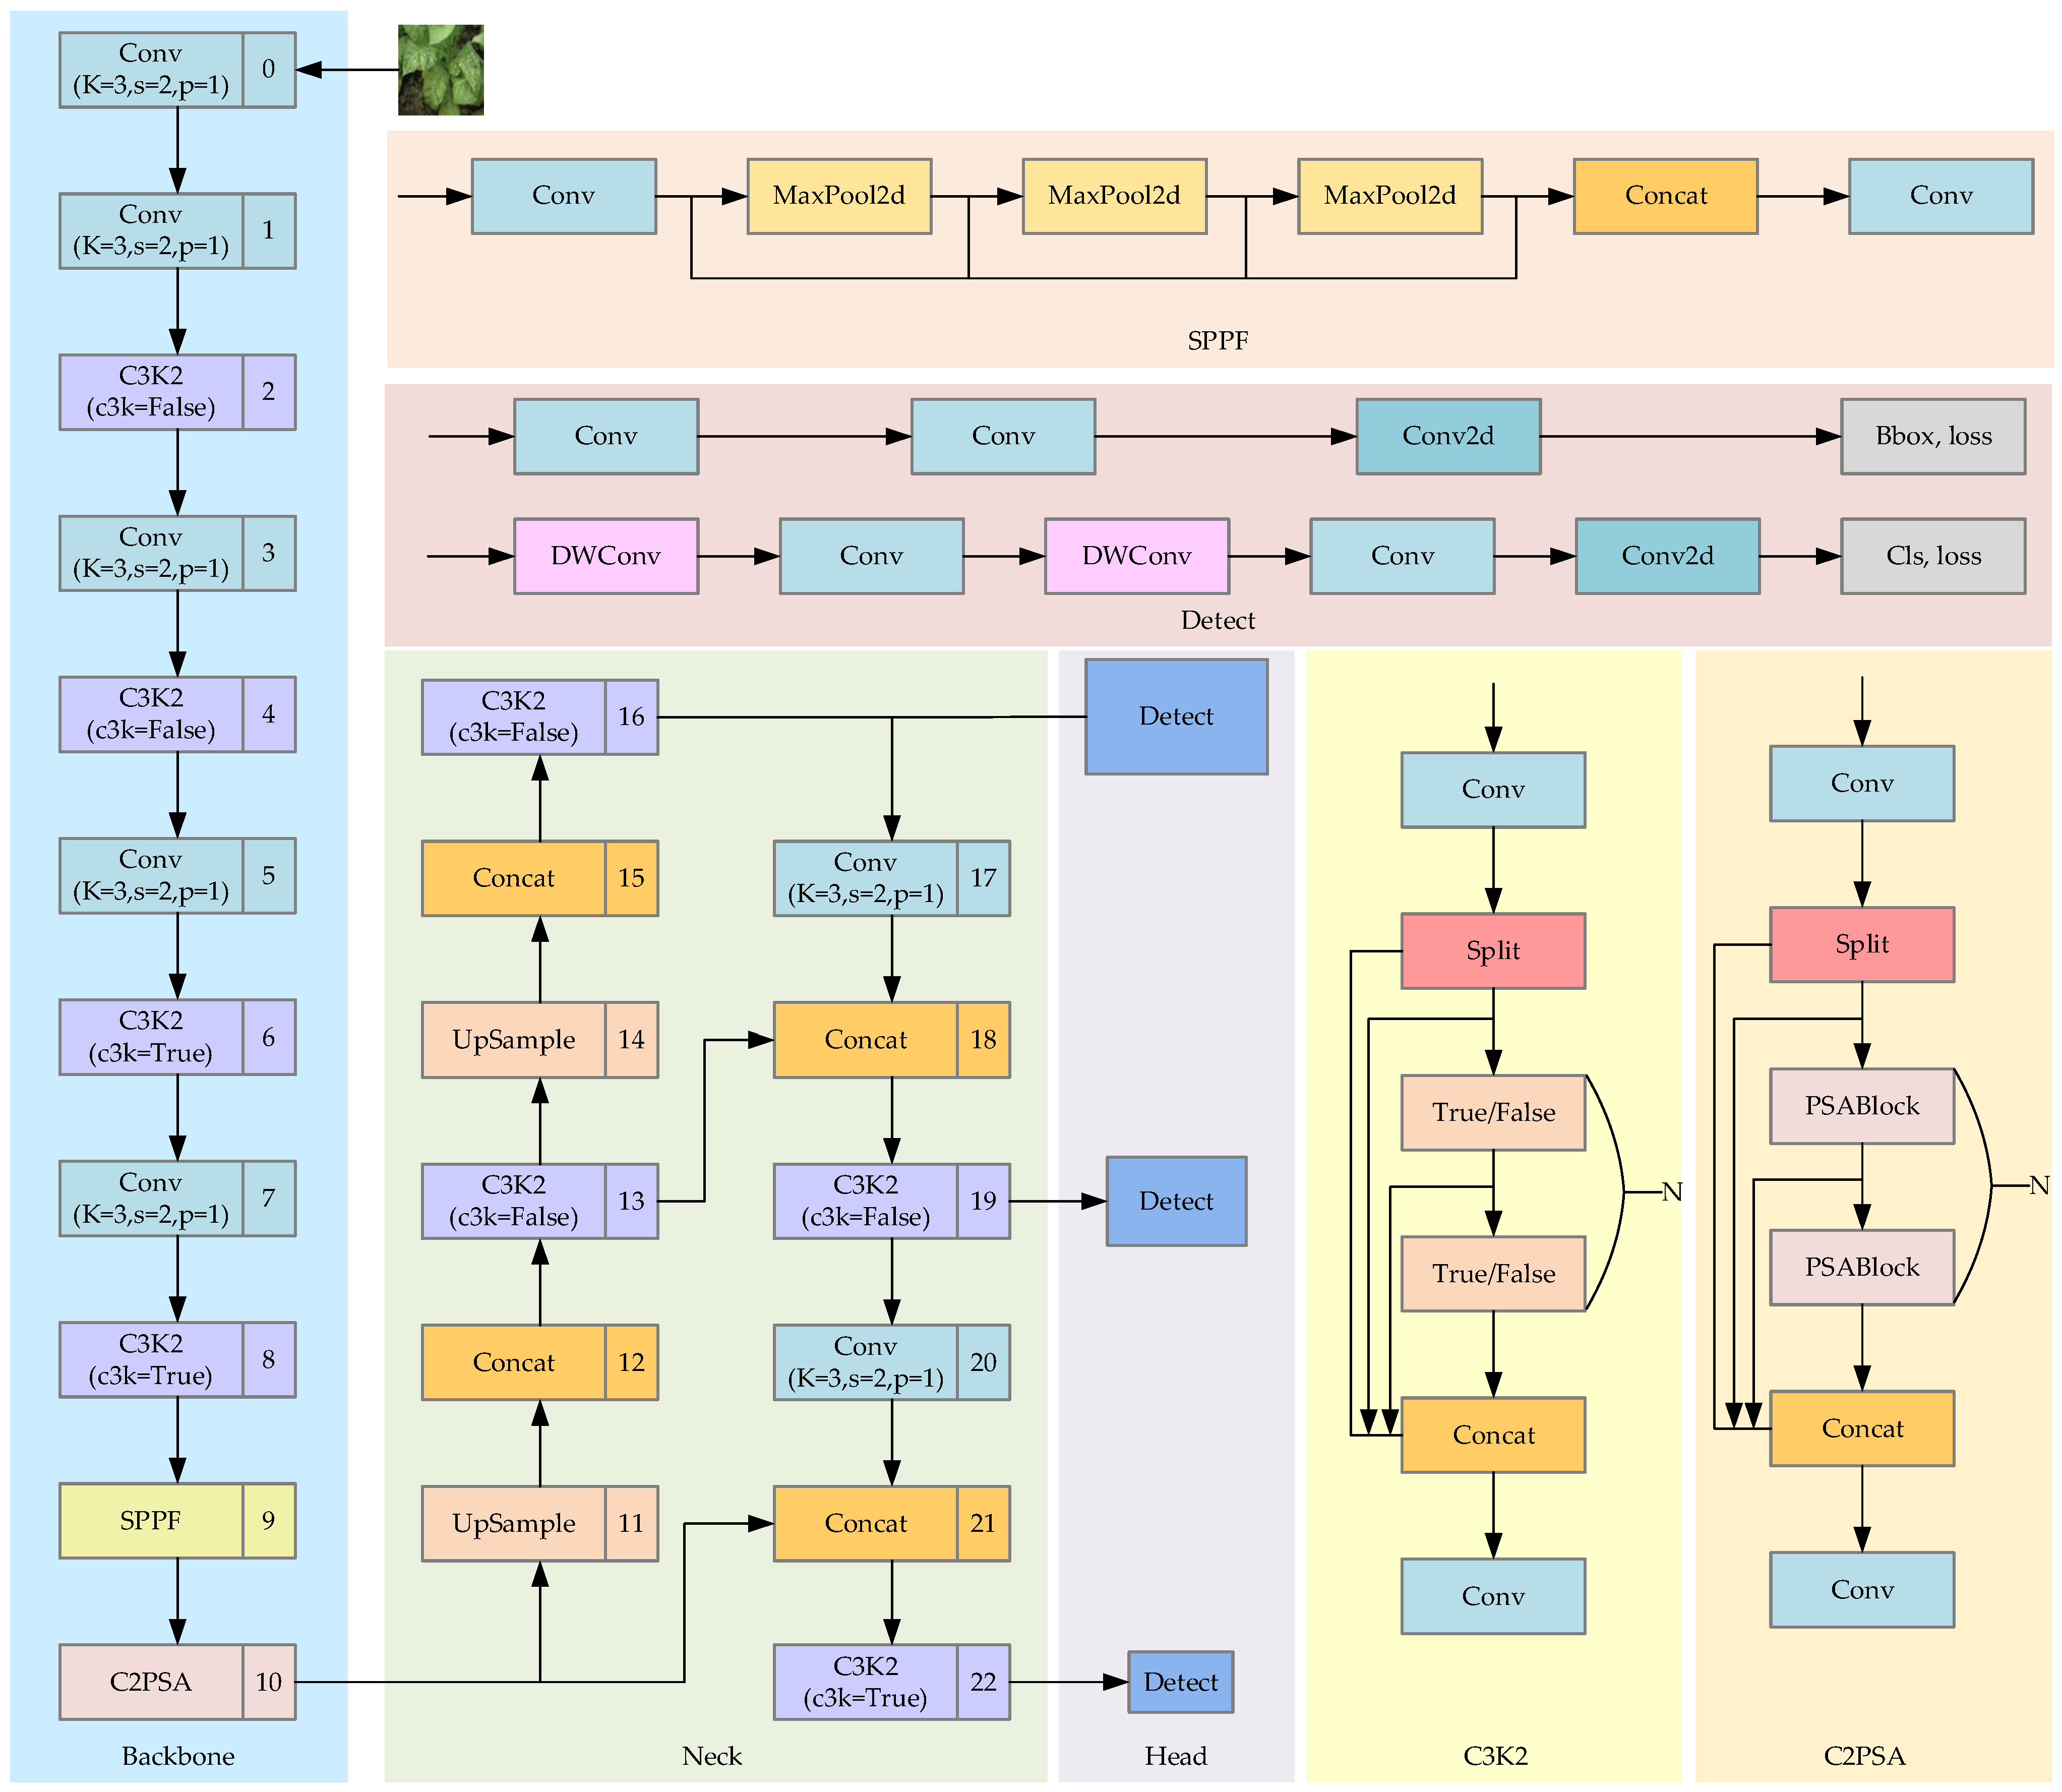
YOLO11, the most recent version in the YOLO family developed by Ultralytics, builds on YOLOv8 to enable multi-task learning across detection, segmentation, and classification scenarios. The architecture of YOLO11 is composed of three key modules: the backbone, the neck, and the head. The overall structure is shown in Figure 3. This design not only inherits the consistent architectural paradigm of the YOLO series but also integrates new modules into each component to enhance overall performance. The backbone is responsible for extracting multi-scale features from the input image. The improved C3k2 module combines repeated convolutions with an efficient information flow, optimizing the feature extraction process while reducing computational burden. Additionally, the C2PSA module enhances the ability to extract key features through a position-sensitive attention mechanism. The neck adopts the Path Aggregation Feature Pyramid Network (PAFPN). By aggregating features through both bottom-up and top-down pathways, it effectively fuses shallow spatial detail information with deep semantic information, enabling more efficient feature representation and utilization. This significantly improves the model’s multi-scale feature expression and strengthens its detection capability in complex scenes. The detection head adopts a decoupled architecture, where the regression and classification tasks are processed through independent branches to handle object localization and category prediction separately. To enhance computational efficiency, the detection head integrates DWConv, effectively minimizing model complexity and FLOPs without compromising detection accuracy. In addition, YOLO11 combines DFL and CIoU loss functions to optimize the localization process, resulting in improved coordinate prediction accuracy. For classification, Binary Cross-Entropy loss is utilized to strengthen the model’s discriminative performance.

2.3. YOLO-MSCM

Although the YOLO11 model demonstrates strong performance in general object detection tasks, it still faces certain challenges when detecting crop diseases in complex environments. These issues mainly include the following: insufficient sensitivity to multi-scale features, leading to missed detections; limited feature fusion capability, making it difficult to effectively handle morphologically varied disease lesions; and inadequate bounding box localization accuracy, affecting recognition performance in dense or overlapping areas. To address these problems, this paper proposes the YOLO-MSCM model with several key improvements. Firstly, the backbone is enhanced with an MCSA module that leverages multi-scale spatial perception to better capture and emphasize subtle lesion characteristics. Secondly, a SimRepHMS module is introduced into the neck network to model contextual information through heterogeneous multi-scale structures, improving the fusion effect between multi-level features. Additionally, DynamicConv is integrated into the backbone to enable adaptive channel weighting, thereby improving the model’s resilience and generalization capability in diverse environmental conditions. Finally, the WIoUv3 loss function is used to optimize the bounding box regression process, improving localization accuracy and training stability. The architectural overview of the proposed YOLO-MSCM model is presented in Figure 4.

2.3.1. MCSA

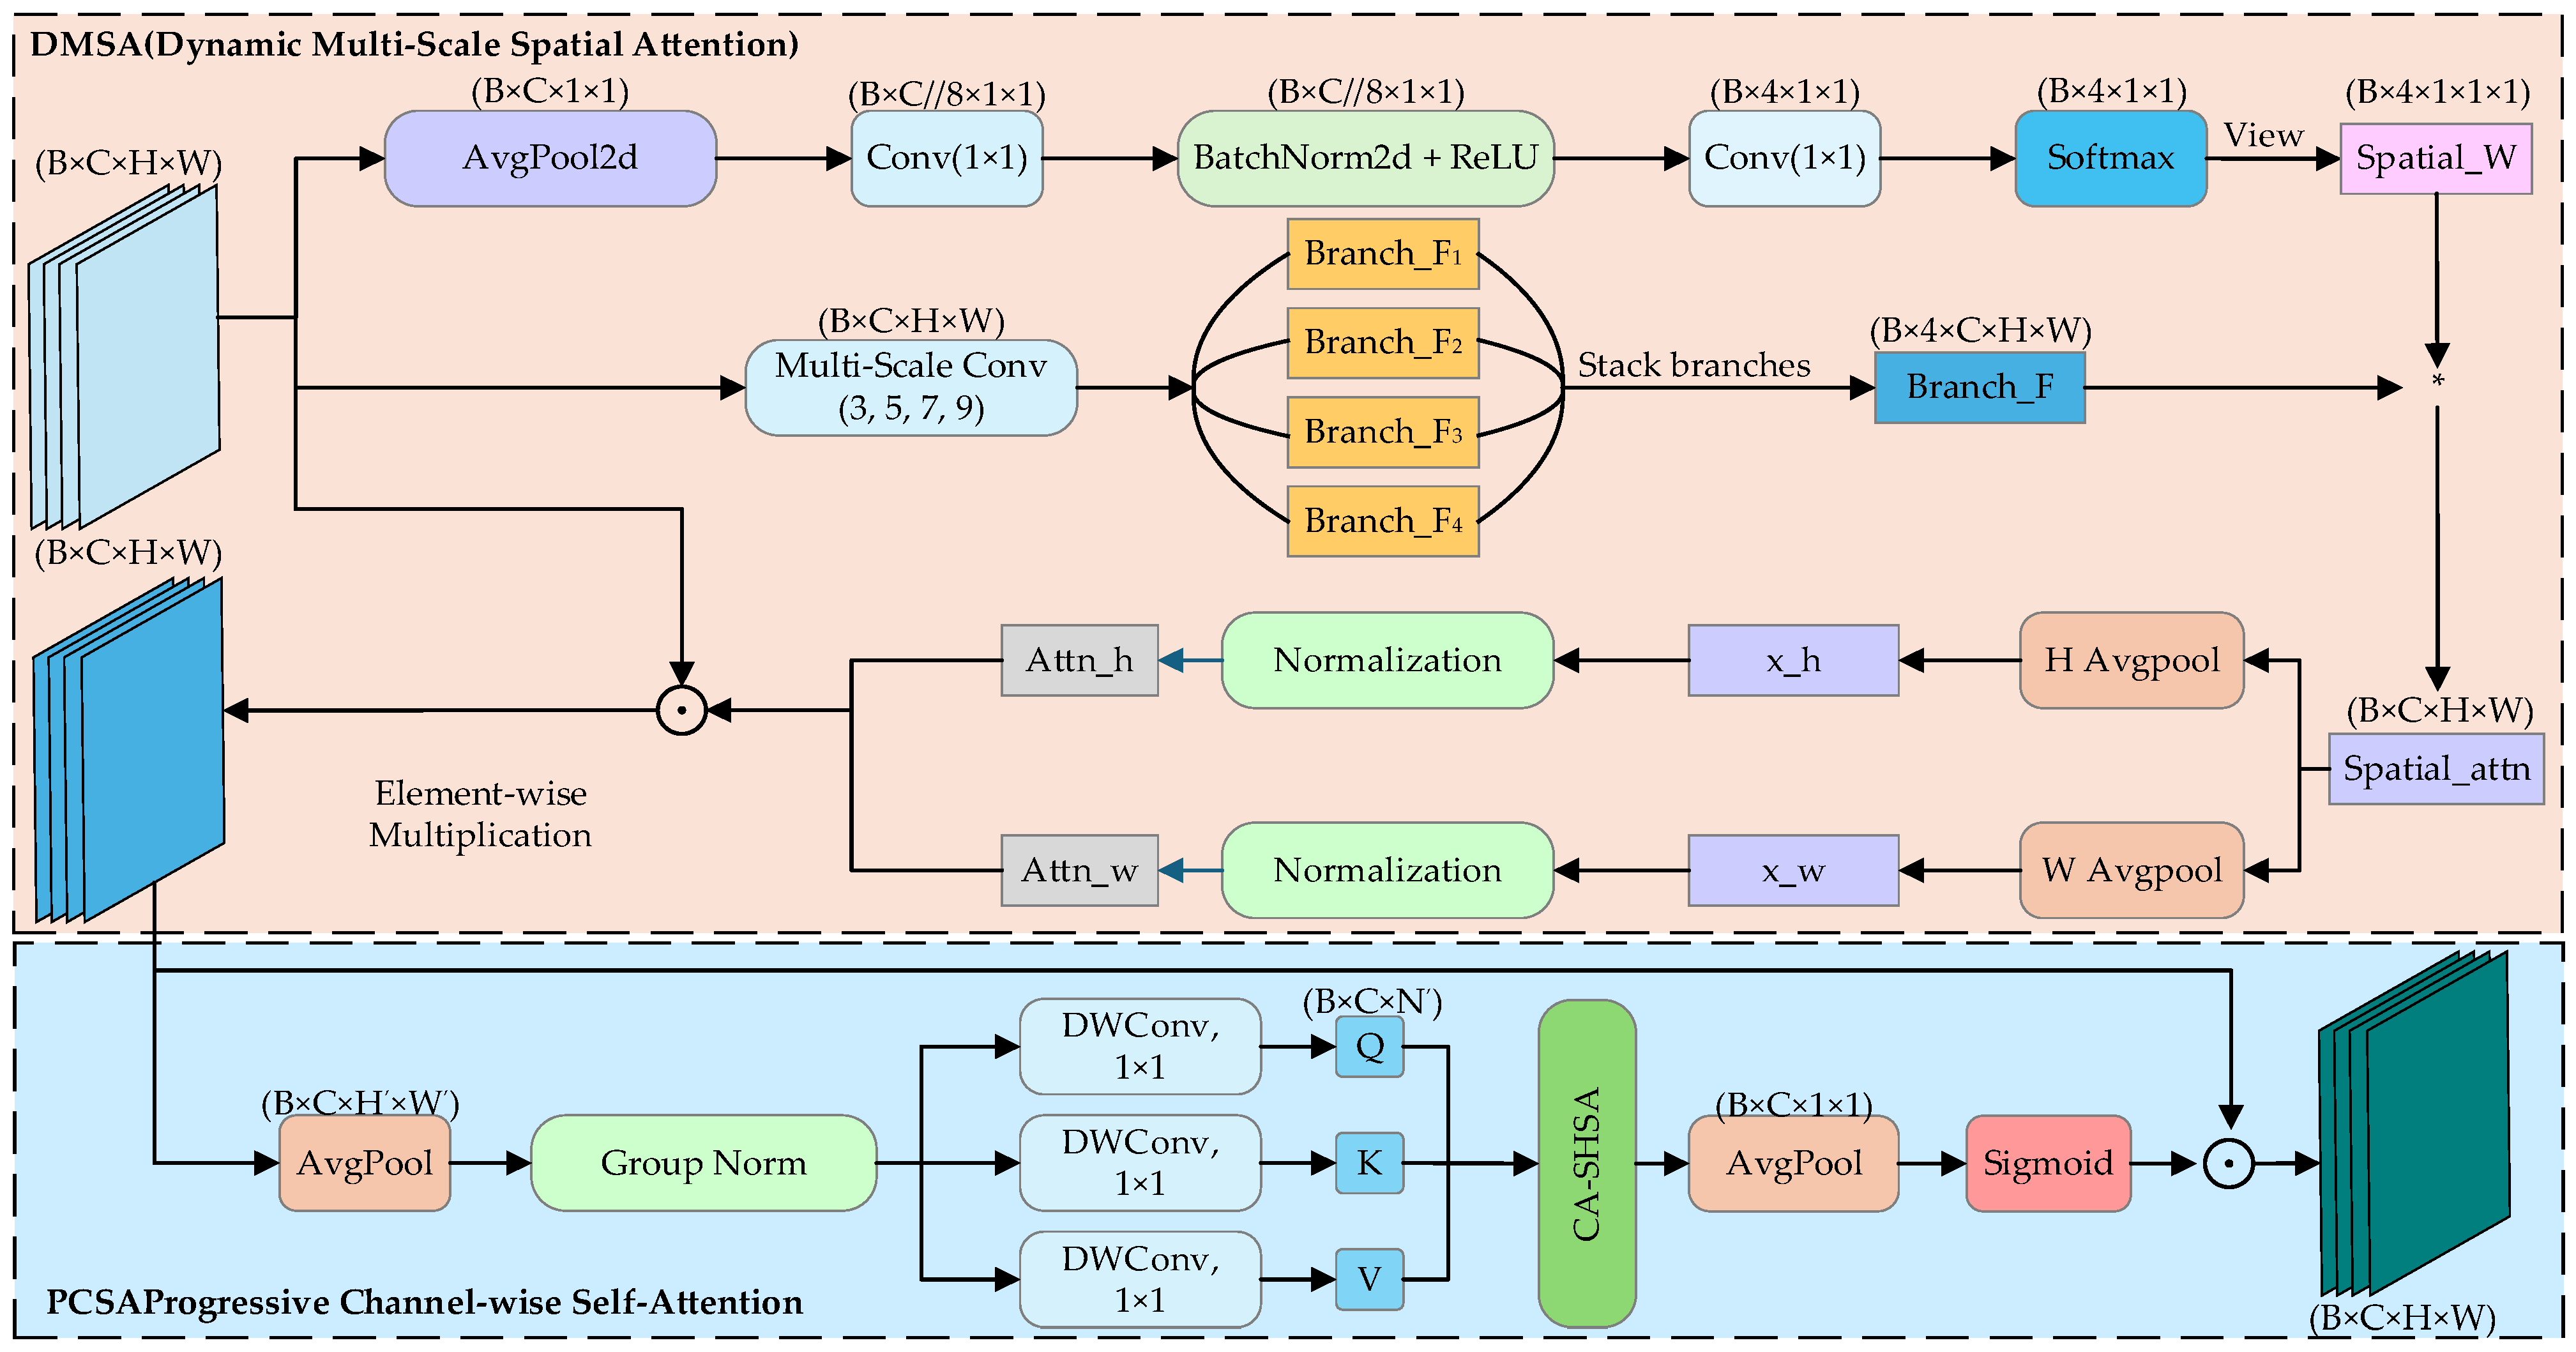
The proposed MCSA (Multi-Scale Channel and Spatial Attention) module improves spatial feature representation by jointly modeling spatial patterns and channel dependencies. It is designed to enhance the model’s capacity to prioritize informative regions in feature maps. The module is composed of two complementary submodules: DMSA and PCSA. A schematic diagram of the MCSA architecture is presented in Figure 5, where B refers to the batch size, C indicates the number of channels, and H × W represents the spatial dimensions of the feature maps.
In the MCSA module, the weights for each branch, referred to as branch_weights, are first calculated through a lightweight gating network. Subsequently, convolutions with four different kernel sizes (3, 5, 7, 9) are applied to the input feature maps to extract multi-scale spatial features. These features are then fused in a weighted manner using the previously generated weights to produce a spatial attention map named Spatial_attn. Afterwards, average pooling is performed on Spatial_attn along the width and height directions, respectively, to obtain two statistical vectors, which are normalized through GroupNorm to form the attention matrices x_h and x_w that have decoupled spatial dimensions. After expanding these two matrices back to their original spatial dimensions, they are element-wise multiplied with the input feature maps, achieving effective attention focusing on the spatial dimensions. The main computational formulas are as follows:
F = S t a c k ( F 1 , F 2 , F 3 , F 4 )
S p a t i a l A t t n ( X ) = i = 1 4 W i F i
D M S A ( X ) = X A t t n h A t t n w
where F i denotes the multi-scale spatial features extracted using convolutional kernels of different sizes, and W i represents the dynamic weights corresponding to different branches. A t t n h and A t t n w denote the spatial attention weights generated along the height and width dimensions, respectively, after applying average pooling and normalization.
The PCSA module enhances channel-wise feature representation by progressively compressing the input tensor and applying a lightweight self-attention mechanism across channel dimensions. This approach first reduces spatial redundancy through hierarchical aggregation, then computes inter-channel correlations using a simplified attention structure, enabling efficient feature refinement.
X p = P o o l ( 7 , 7 ) ( H , W ) ( H , W ) ( X d )
F p r o j = D W C o n v l d ( 1 , 1 ) C C
Q = F p r o j Q ( X p ) , K = F p r o j K ( X p ) , V = F p r o j V ( X p )
X a t t n = A t t n ( Q , K , V ) = S o f t m a x ( Q K T C ) V
P C S A ( X d ) = X d × σ ( P o o l ( H , W ) ( H , W ) ( 1 , 1 ) ( X a t t n ) )
Here, X d denotes the output features of DMSA. P o o l ( k , k ) ( H , W ) ( H , W ) ( ) denotes a pooling operation with a kernel size of k × k, which resizes the resolution from (H, W) to (H′, W′). F p r o j ( ) represents the linear projection operation that generates the Q (query), K (key), and V (value). S o f t m a x ( ) refers to the Softmax activation function. σ ( ) denotes the normalized Sigmoid function.
The MCSA module integrates spatial and channel-wise attention mechanisms through a sequential composition of SMSA and PCSA components. SMSA enhances feature maps with refined spatial priors, while PCSA mitigates semantic discrepancies across channels to facilitate more coherent feature aggregation. The output of MCSA is
M C S A ( X ) = P C S A ( D M S A ( X ) )

2.3.2. SimRepHMS

This section introduces a module designed for multi-scale feature fusion, named SimRepHMS. The module aims to achieve efficient cross-level information fusion and multi-scale feature modeling while maintaining a low computational cost. Its overall structure is shown in Figure 6.
The input features are first transformed in the channel dimension using a 1 × 1 convolution, followed by partitioning into N parallel pathways, each maintaining an equal number of channels. The first branch directly retains the original input features without any processing. Starting from the second branch, the input is sequentially passed through M-stacked blocks. Each block contains multiple depthwise separable convolutions with different kernel sizes, which are used to extract multi-scale spatial features. A cascaded connection is adopted between the branches, allowing subsequent branches to receive partial intermediate outputs from the previous ones, thereby enabling cross-branch information transfer. After all branches have been processed, their outputs are concatenated and then fused and adjusted in the channel dimension through another 1×1 convolution, generating the final output feature map, whose channel dimension is compatible with the detection head or other subsequent modules.
On this basis, the fused feature map is further enhanced. Specifically, spatial statistical modeling is first performed on the fused feature map by calculating its mean value across the spatial dimensions and then computing the squared deviation of each spatial location from this mean. Next, normalization is applied based on the squared deviation term to generate a spatial attention weight map. Finally, this attention weight map is element-wise multiplied with the original fused feature map to strengthen key regions and suppress irrelevant responses, thereby further improving the feature representation capability. The main computational formulas are as follows:
Y = i = 1 M α i ( X W i )
t ^ = w t t + b t
x ^ i = w t x i + b t
b t = 0.5 ( t + μ t ) w t
e t ( w t , b t , y , x t ) = ( y t t ^ ) + 1 N 1 i = 1 N 1 ( y 0 x ^ i ) 2
Here, X represents the input feature map, α i denotes the weighting coefficient of the i-th block, W i refers to the convolution kernel in the i-th block, M denotes the total number of distinct convolution kernels. Y represents the feature map after feature fusion. Formula (14) defines the energy function, where t and x i denote the input feature representations for the target and neighboring neurons, respectively. w i denotes the corresponding linear transformation weight parameters, and b t represents the bias term. N indicates the number of neurons in a single channel, λ denotes the weight assigned to the regularization term, μ t and σ t 2 denote the expected value and variance associated with the neuronal outputs. By optimizing Formula (14) with the incorporation of a regularization component, the ultimate energy formulation is derived as follows:
e t = 4 ( σ ^ 2 + λ ) ( t μ t ) 2 + 2 σ ^ 2 + 2 λ

2.3.3. DynamicConv

DynamicConv is an adaptive computation method that can dynamically select different convolution kernels based on the input features. Specifically, the DynamicConv module first applies global average pooling to the input data, compressing and fusing the information into a single feature vector. Then, a two-layer multi-layer perceptron (MLP) generates weights based on this feature vector. These weights are used to dynamically combine multiple expert convolution kernels, allowing each input to adaptively select the optimal combination of kernels for processing. This mechanism improves the flexibility and accuracy of feature extraction. Its structure is shown in Figure 7. Such a design is suitable for models that require high adaptability, as it can automatically adjust its behavior across different tasks and inputs. The computational formula is as follows:
α = s o f t m a x ( M L P ( P o o l ( X ) ) )
Y = i = 1 M α i ( X W i )
Here, X represents the input feature map, and M denotes the number of expert convolution kernels. α i is the i-th weight obtained through the softmax function, W i denotes the convolution kernel of the i-th expert module, and denotes the convolution operation.

2.3.4. WIoUv3

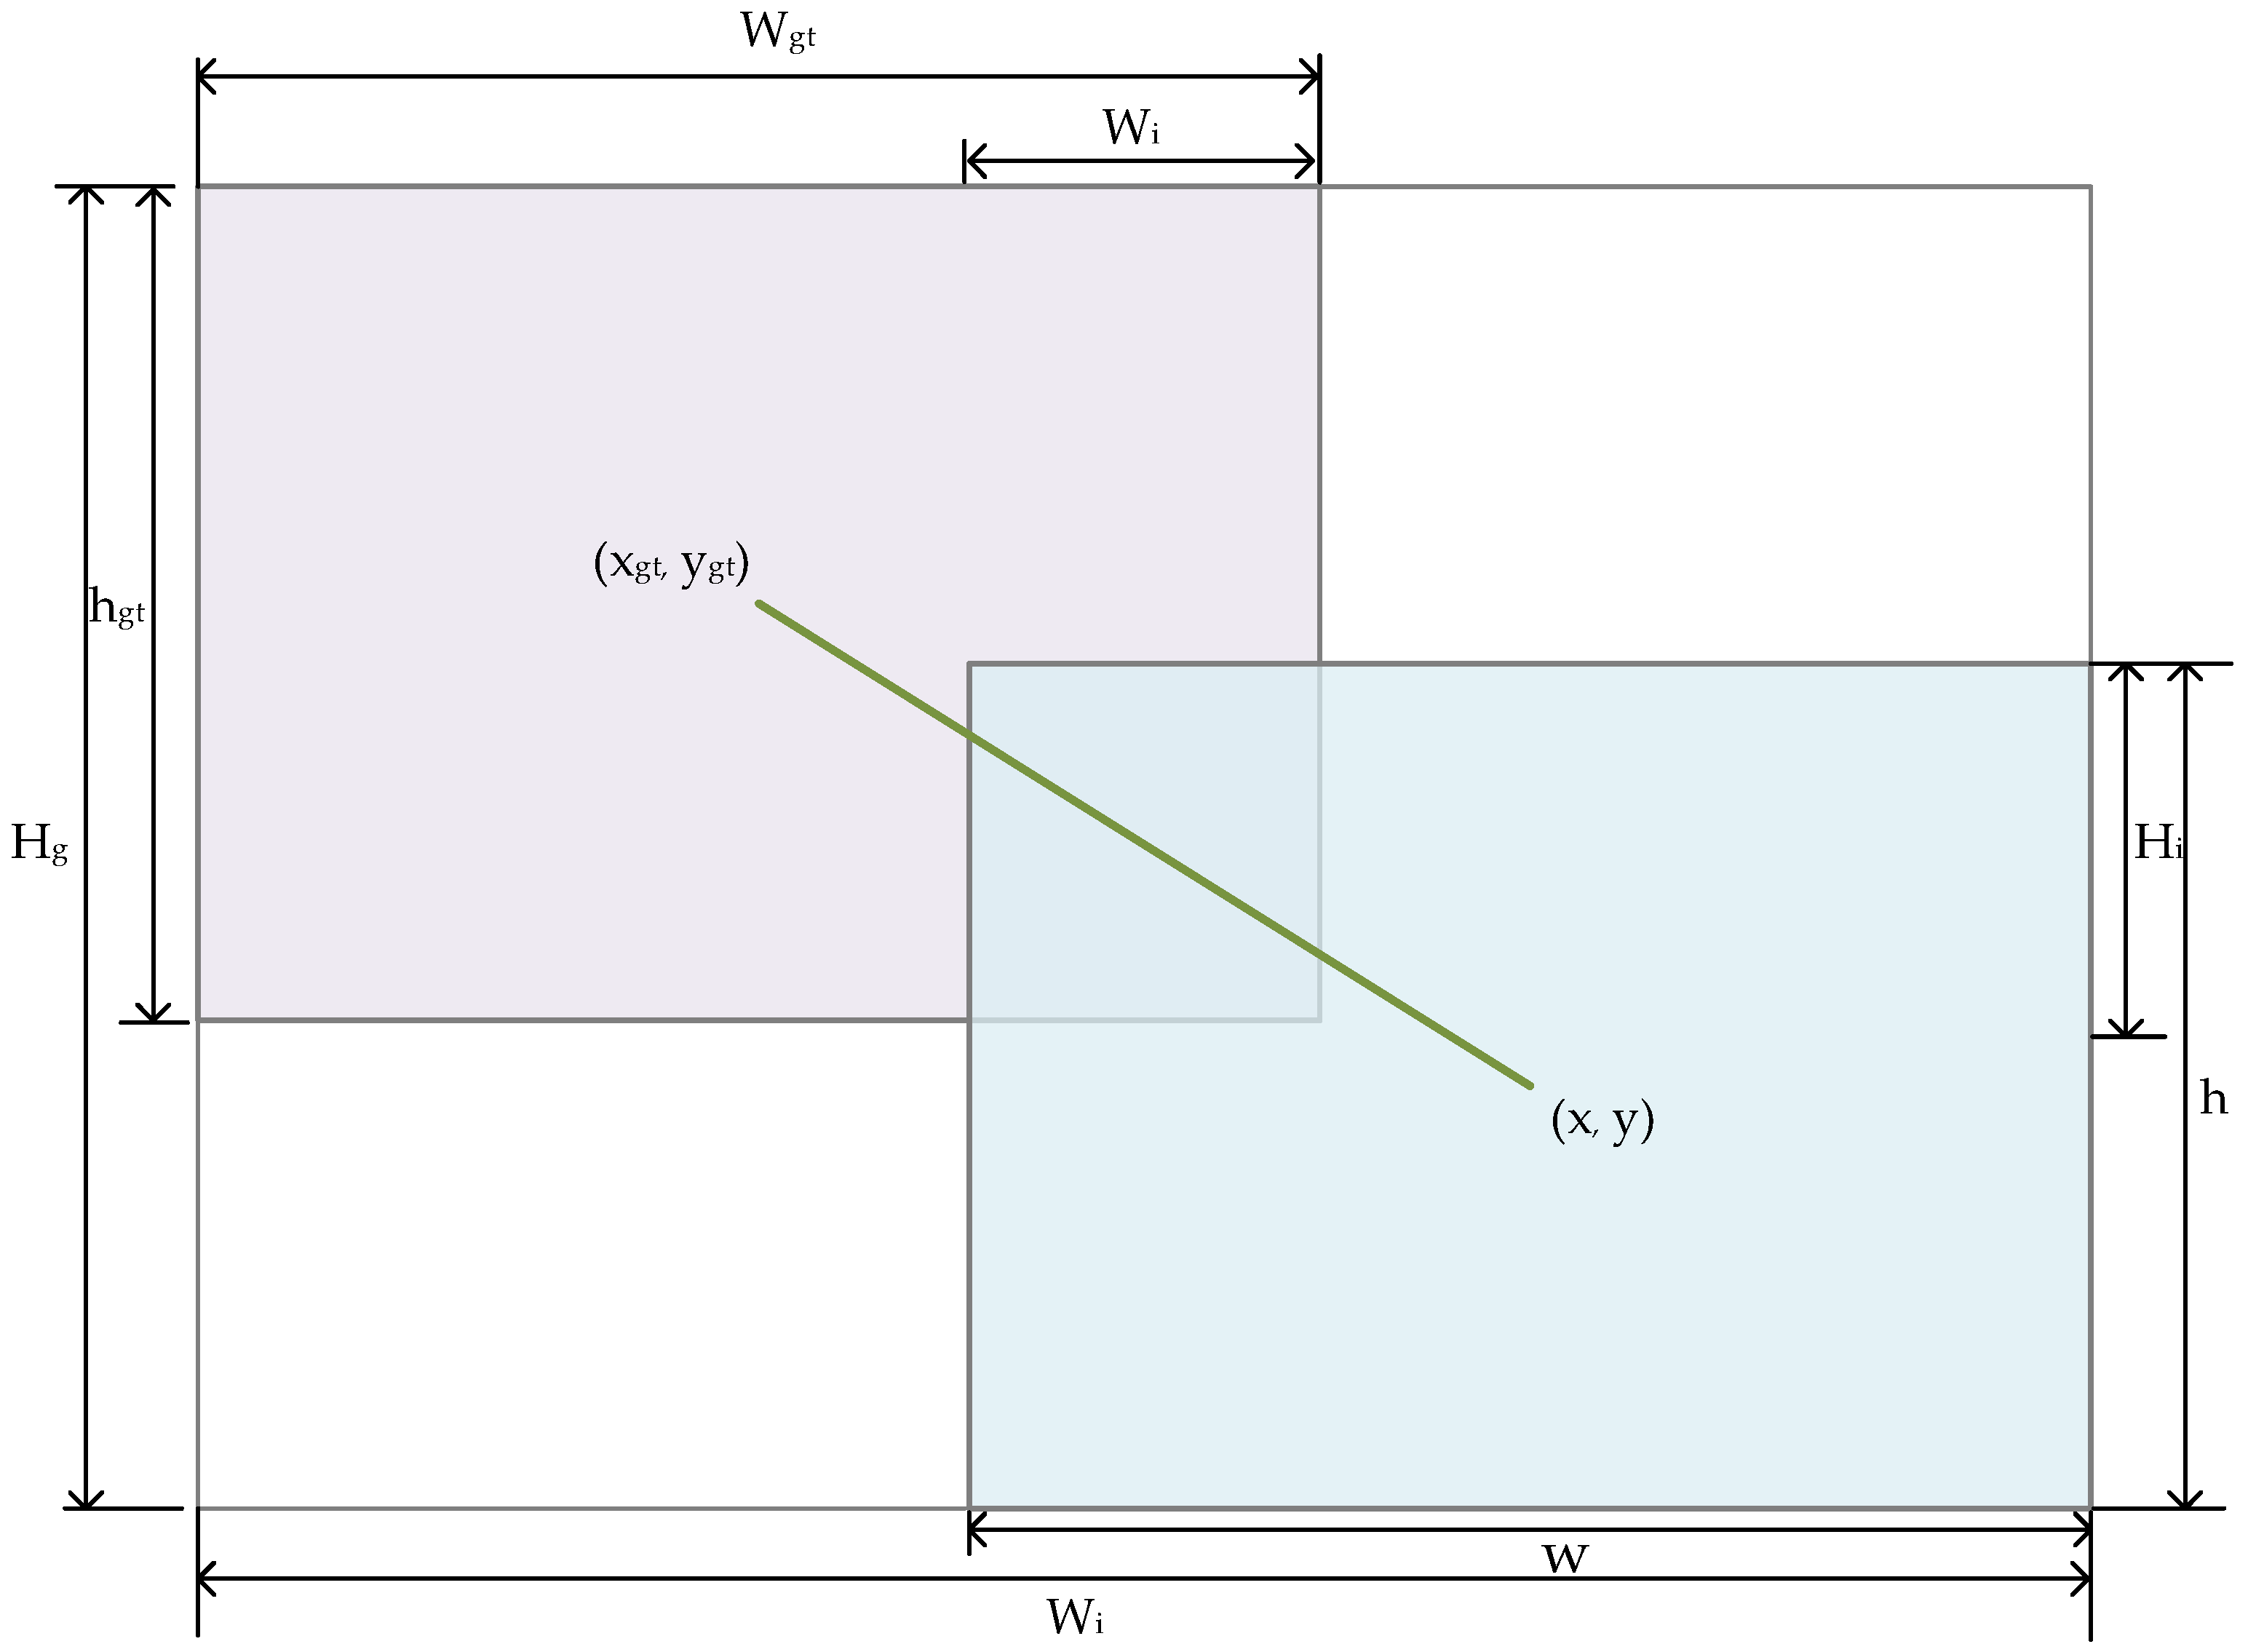
The Wise-IoU criterion is employed to guide bounding box regression in this study. The parameters involved in this objective are visually illustrated in Figure 8. Compared to CIoU, WIoUv3 incorporates a novel adaptive non-monotonic weighting strategy, which enhances the model’s emphasis on localization accuracy during training and increases its responsiveness to small objects. In addition, WIoUv3 gradually diminishes the influence of poorly aligned anchors during the final training phases, which helps suppress detrimental gradients and enhances overall training efficiency. Finally, WIoUv3 emphasizes the accuracy of the center position, which is crucial for tracking small, fast-moving UAV targets. Based on the research task in this paper, these characteristics of WIoUv3 can help the model more accurately locate and track small UAVs, thereby enhancing the overall detection and tracking performance. The computational formula is as follows:
L W I o U v 3 = ( 1 W i H i S u ) e x p [ ( x x g t ) 2 + ( y y g t ) 2 ( W g 2 + H g 2 ) ] γ
γ = β δ α β δ
β = L I o U L ¯ I o U [ 0 , + )
Here, β represents the anomaly score of the anchor box, with lower values corresponding to better alignment with the ground truth. γ is the non-monotonic focusing coefficient, used to reduce the interference of low-quality anchor boxes during training; δ is a hyperparameter that adjusts the influence of β ; ( x , y ) and ( x g t , y g t ) are the center coordinates of the predicted bounding box and the ground truth box, respectively; W g and H g denote the dimensions of the smallest bounding region encompassing both the ground truth and predicted boxes; S u denotes the area of the non-overlapping part between the predicted box and the ground truth box; L I o U denotes the IoU-based regression loss for the current anchor box, reflecting the localization discrepancy. The IoU-based loss is computed for the current anchor, and L ¯ I o U denotes the mean IoU loss computed over the entire set of anchor boxes, serving as a global measure of localization accuracy.

3. Results

This section presents a comprehensive evaluation of the proposed YOLO-MSCM framework, including the experimental setup, performance metrics, ablation studies, and comparisons with state-of-the-art models. The results are organized to systematically demonstrate the effectiveness, efficiency, and generalization capability of the improved architecture in multi-crop disease detection tasks.

3.1. Experimental Environment

The experimental environment utilized in this study is Ubuntu 22.04 (CPU: AMD Ryzen 5 3600, GPU: NVIDIA GeForce RTX2080Ti 11 GB). Python 3.9.0, CUDA 11.8, and PyTorch 2.1.0 were used for model construction. Additionally, no pre-trained weights were used in any of the experiments. Detailed parameter configurations can be found in Table 2.
In this study, all models are trained under the same hyperparameters, training strategies, and data partitioning methods to ensure a fair comparison. To fully account for the inherent randomness in the training process of deep neural networks (e.g., random seed, weight initialization, etc.), each comparative experiment is independently repeated three times. The experimental results presented in this paper are the averages of the three independent runs, which enhances the reliability and robustness of the performance evaluation.

3.2. Experiment Metrics

A diverse set of well-established evaluation metrics is selected to rigorously assess the model’s detection performance from multiple perspectives. These include the following: Mean Average Precision (map), which is used to assess the accuracy of the model in detecting and classifying objects. Precision (P), which measures the proportion of predictions that are correctly identified as positive samples out of all predictions made as positive. Recall (R), which reflects the proportion of actual positive samples that are correctly predicted as positive by the model. Parameter count (Params), a key metric for measuring model complexity [38]. FPS (Frames Per Second) is used as a key metric to evaluate the real-time inference capability of a model. It is inversely proportional to latency and provides a practical measure of the model’s runtime performance [39,40]. Computational cost (GFLOPs), which provides an effective measure of the model’s computational complexity during inference and reflects its potential computational burden when deployed on edge devices.
Assuming there are N categories, and the A P for the i-th category is A P i , the formulas for calculating R e c a l l , P r e c i s i o n , m A P , and F P S are shown below:
R e c a l l = T P T P + F N
P r e c i s i o n = T P T P + F P
m A P = 1 N i = 1 N A P i
F P S = 1 T i n f e r e n c e
Here, T P denotes the count of true-positive predictions made by the model, F P denotes the count of false-positive predictions made by the model, F N denotes the count of false-negative predictions made by the model, and T i n f e r e n c e denotes the overall inference duration required by the model. The experimental analysis is organized under appropriate subsections to ensure clarity and readability. Results are presented in a clear and succinct manner, accompanied by thorough interpretation and supported conclusions.

3.3. Attention Mechanism Comparison Experiment

To evaluate the effectiveness of different attention mechanisms in the crop disease detection task and further validate the performance advantages of the proposed MCSA module, we incorporated several mainstream attention modules—including CBAM, SE, SimAM, ECA, GAM, Coord, Moga, and SCSA—into the YOLO11 baseline model. All models were compared under the same experimental conditions to ensure fairness. Table 3 presents a summary of the experimental outcomes.
As shown in the table, the baseline model achieves an mAP@50 of 85.7% and an mAP@50:95 of 56.6% on this task. After incorporating various attention mechanisms, the overall detection performance improves to some extent. However, the improvements brought by CBAM and SE are limited, and in some cases, performance slightly declines, indicating their relatively weak adaptability in fine-grained detection tasks for crop disease. In contrast, SimAM and Coord demonstrate stronger feature enhancement capabilities, improving mAP@50 to 88.6% and 88.9%, respectively, showing certain application potential. Moga and SCSA perform particularly well in terms of recall (R), achieving 79.3% and 80.6%, respectively, suggesting their advantages in complex background scenes and small-target recognition. The proposed MCSA module achieves the best performance across all evaluation metrics. Specifically, precision (P) reaches 89.3%, recall (R) is 80.4%, mAP@50 is improved to 89.9%, and mAP@50:95 reaches 59.9%. This significant improvement is attributed to the core innovation of the MCSA module—multi-scale spatial perception. More specifically, MCSA effectively captures spatial information across different object scales by fusing multi-scale convolution branches, thereby enhancing the model’s ability to focus on key regions in complex backgrounds. Furthermore, combined with an adaptive weight allocation mechanism, MCSA dynamically adjusts the contribution of each scale branch, enabling more accurate target localization and feature representation. In terms of computational cost, most attention modules do not increase computational complexity, except for GAM, Moga, and MCSA. While MCSA introduces a slight additional computational burden due to the increased number of convolution operations, it still maintains a lightweight characteristic. In summary, through systematic comparisons with multiple mainstream attention mechanisms, the proposed MCSA module demonstrates stronger robustness and generalization capability in the crop disease detection task. It significantly improves detection performance in complex environments and exhibits promising application potential.
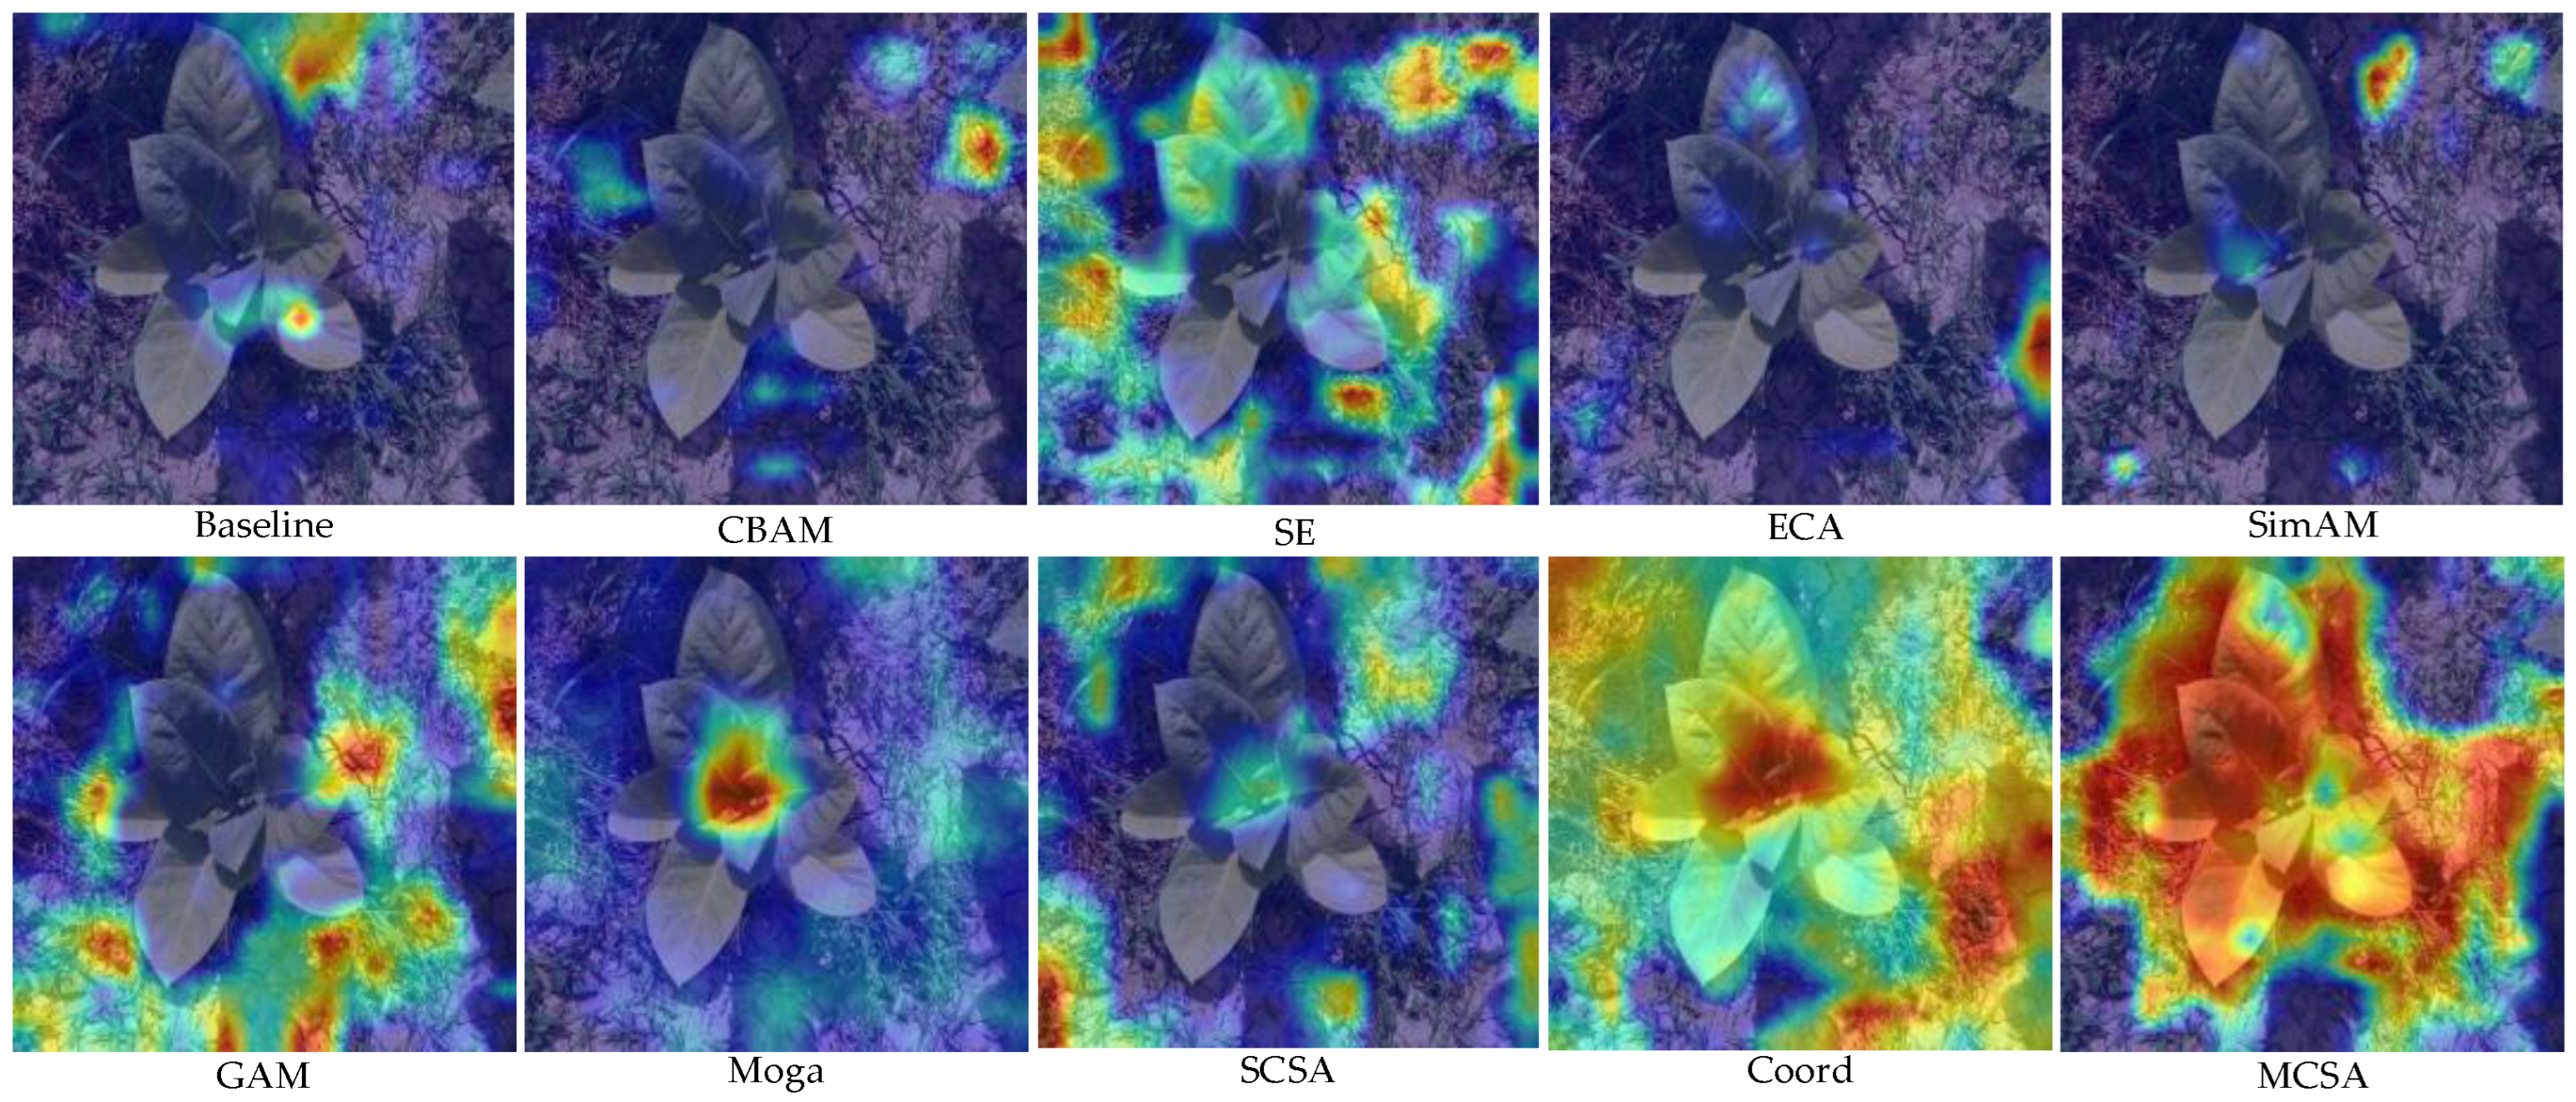
To visually assess the effectiveness of the proposed MCSA module in feature extraction, Grad-CAM++ [41] was utilized to generate class activation maps for comparative visualization. A total of nine attention mechanisms—namely CBAM, SE, SimAM, ECA, GAM, Moga, SCSA, Coord, and the proposed MCSA—were selected for this analysis, with their corresponding heatmaps displayed in Figure 9. In these visualizations, warmer (redder) regions reflect higher model sensitivity and focus during the detection process. The results reveal that most conventional attention modules not only highlight the target areas but also activate irrelevant background regions, which may mislead the model and impair its detection performance [42]. By contrast, the proposed MCSA module produces a more precise and focused attention distribution, effectively suppressing activations outside the target region and thereby improving the model’s focus on key characteristics. These findings suggest that MCSA offers improved localization accuracy and greater interpretability compared to existing attention mechanisms.

3.4. Comparative Experiment of Loss Functions

Aimed at analyzing the influence of various loss functions on the detection performance of the YOLO11n model, and seeking to demonstrate the advantage of WIoUv3 in target localization and bounding box regression, this paper sequentially replaced the original CIoU loss function used in the model with several advanced bounding box regression loss functions, including GIoU, DIoU, EIoU, ShapeIoU, MPDIoU, FocalerIoU, and WIoUv3. A comparative analysis was conducted under the same experimental conditions to evaluate the performance of each loss function on a unified dataset. As shown in Table 4, the detection performance metrics for each loss function are presented, including precision, recall, mAP@50, and mAP@50:95.
The results show that WIoUv3 achieves the highest overall performance across all evaluation metrics. Specifically, it reaches an mAP@50 of 88.9% and an mAP@50:95 of 58.6%, marking improvements of 3.2 and 2.0 percentage points, respectively, over the CIoU baseline. Although the improvement in mAP@50 over GIoU and FocalerIoU is relatively modest (approximately 0.7%), and the recall is slightly lower than that of EIoU by 0.2 percentage points, WIoUv3 achieves the highest precision (P) of 88.3%, outperforming the second best, FocalerIoU, by 1.8 percentage points. This improvement is particularly crucial, as it indicates that WIoUv3 effectively reduces false positives and provides more confident detection results, reflecting better localization accuracy. These findings suggest that, while the gains in certain individual metrics may seem marginal, WIoUv3 strikes the best balance between precision, recall, and detection accuracy, making it the most well-rounded and effective loss function among all evaluated methods.
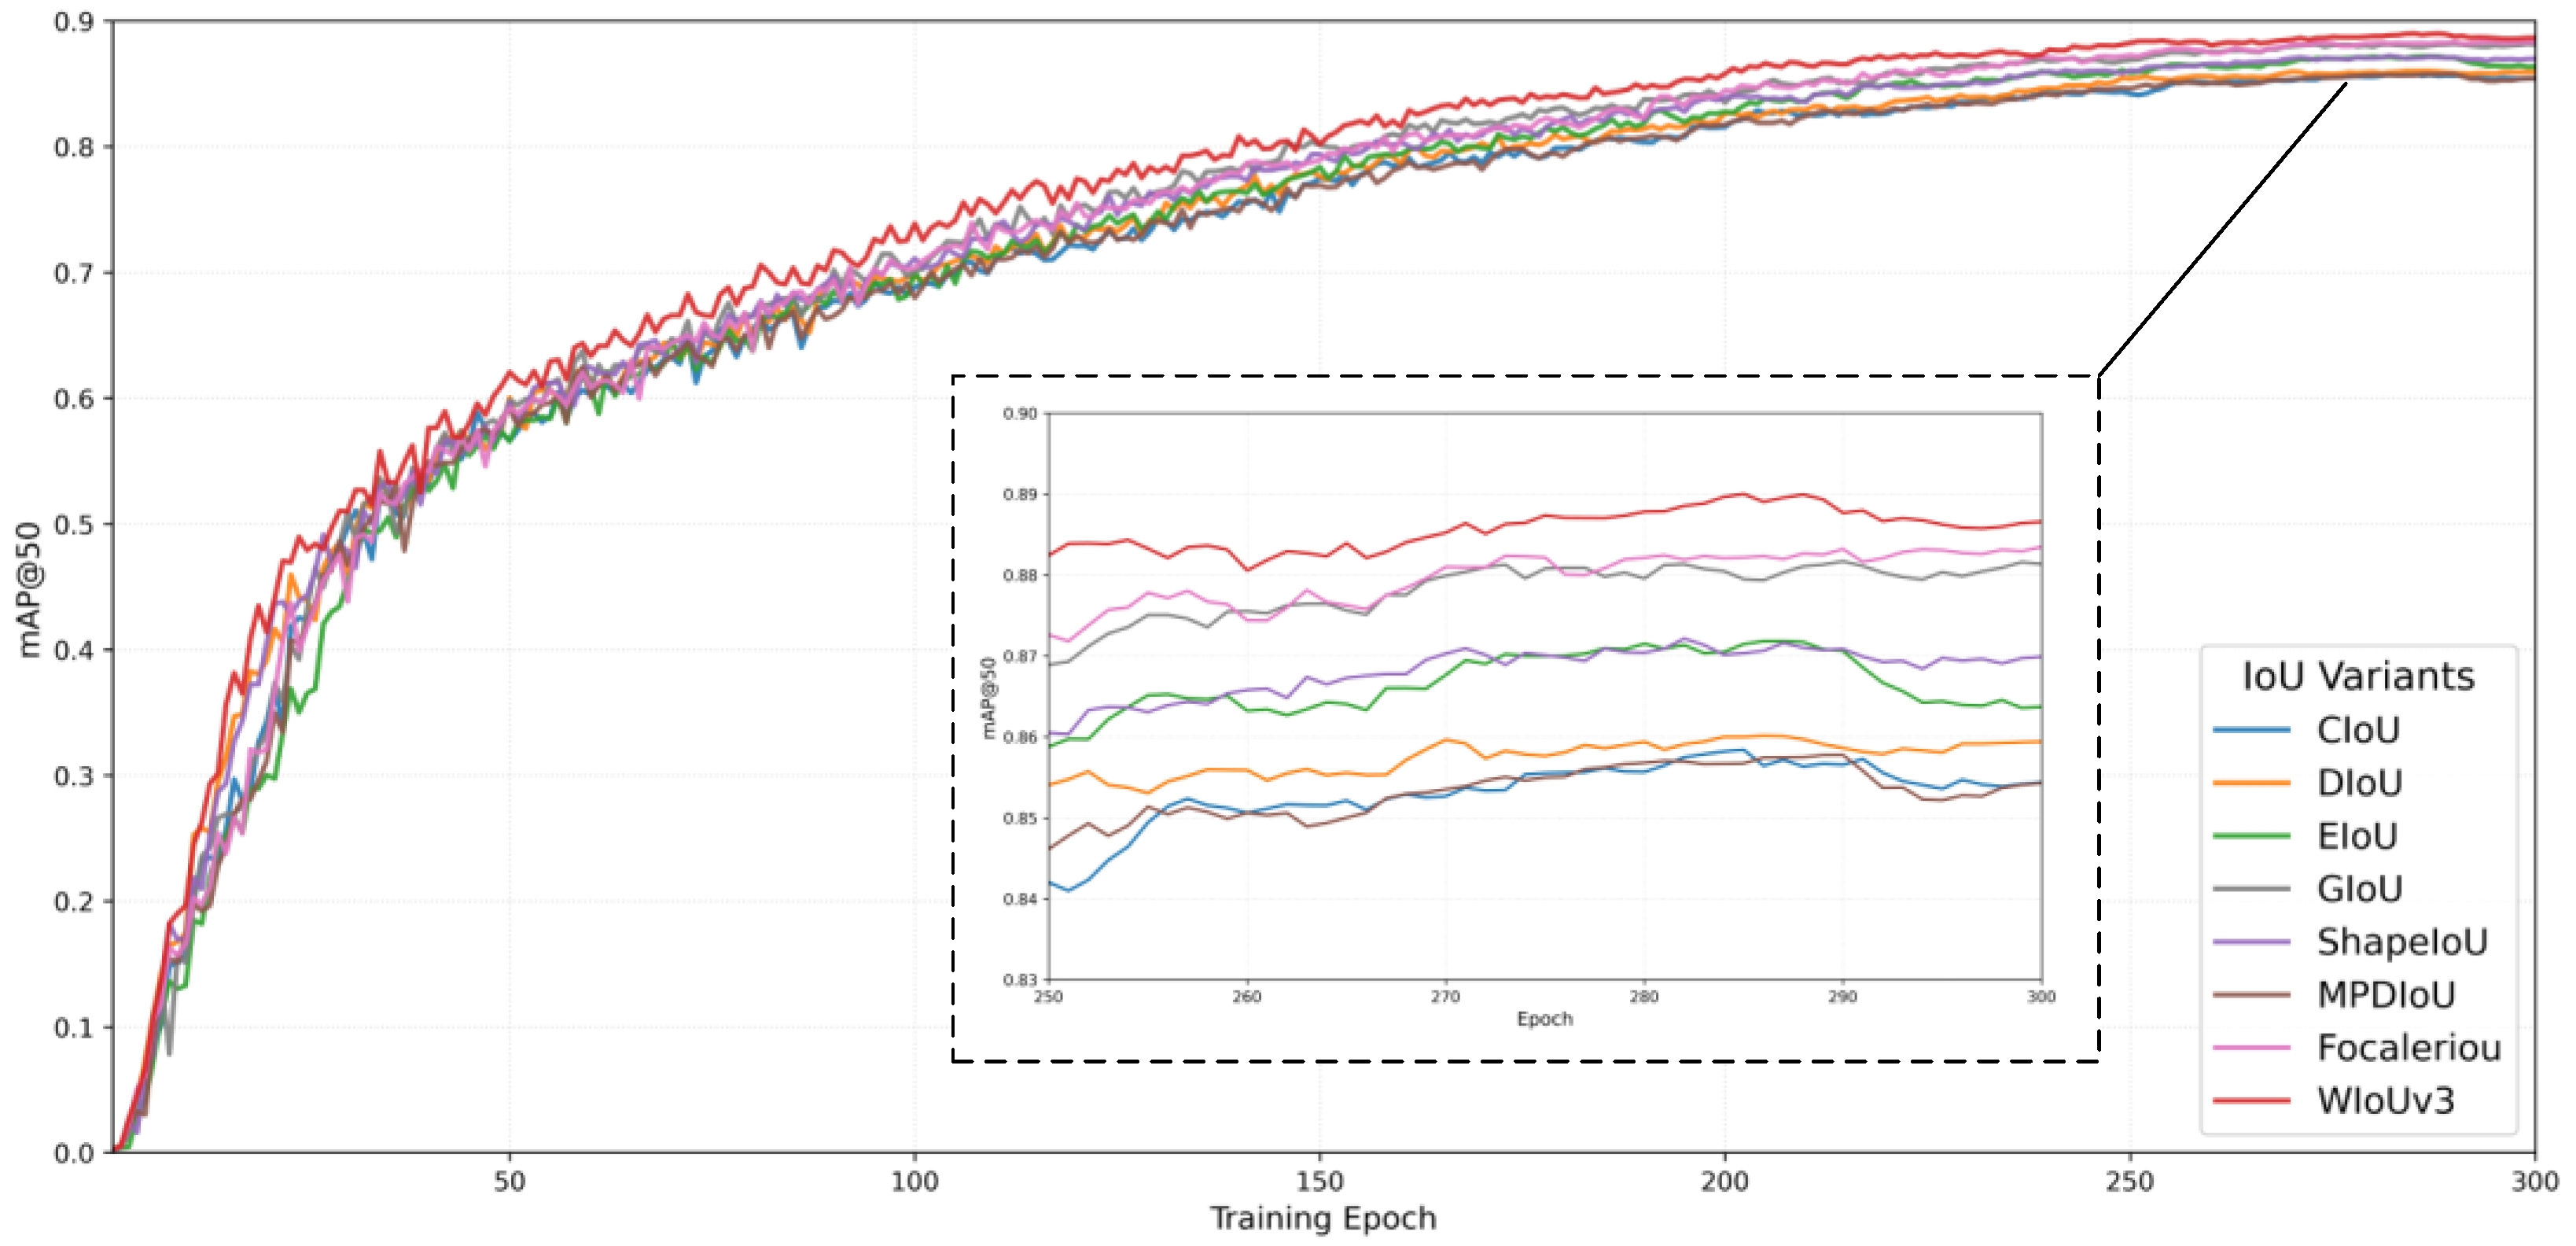
To intuitively compare the impact of different loss functions on model accuracy, Figure 10 was plotted for comparison. As illustrated in the figure, after the same number of training rounds, WIoUv3 exhibits a more stable convergence trend and achieves higher final accuracy, clearly outperforming other loss functions. This indicates that WIoUv3 has better performance in terms of enhancing the learning efficiency of the model and maintaining training stability.

3.5. Ablation Experiment

To further evaluate the actual impact of each proposed module in the network architecture, this section conducts a series of ablation experiments based on YOLO11 as the baseline model. Eight different improvement strategies were tested on the same dataset to comprehensively assess the specific influence of the proposed MCSA and SimRepHMS modules, as well as the introduced DynamicConv and WIoUv3 modules, on object detection performance. The experimental results are summarized in Table 5.
From the data in the table, it can be observed that without any improvements, the baseline model achieves an mAP@50 of 85.7%, an mAP@50–95 of 56.6%, with 2.58M parameters and a computational complexity of 6.3 GFLOPs. When only the MCSA module is added, the model’s mAP@50 increases to 89.9% and mAP@50–95 rises to 59.9%, indicating that the MCSA module significantly improves detection accuracy. At the same time, both parameter count and computational cost remain unchanged, demonstrating its good lightweight characteristics. When the SimRepHMS module is further introduced, the mAP@50 reaches 89.2% and the mAP@50–95 improves to 59.5%. Although this module brings considerable performance gains, it also causes a slight increase in both parameter count and computational cost. In comparison, the DynamicConv module provides relatively smaller performance improvements, increasing mAP@50 to 86.5% and mAP@50–95 to 56.3%, while maintaining the original model’s lightweight advantage to some extent.
When MCSA is used in combination with SimRepHMS, the mAP@50 decreases by 0.2%, and the mAP@50–95 significantly drops by 1.1%. Similarly, when SimRepHMS is combined with DynamicConv, performance also deteriorates, with mAP@50 and mAP@50–95 decreasing by 2.1% and 2.4%, respectively. Through a thorough structural analysis, it was found that the source of the performance decline in both cases is attributed to the multi-branch architecture of SimRepHMS. Specifically, the role of MCSA is to selectively enhance key features and suppress irrelevant responses through channel and spatial attention mechanisms. However, when used in conjunction with SimRepHMS, the multi-branch structure of SimRepHMS reintroduces new feature response patterns through independent convolution operations. Some of these branches activate noise regions that were previously suppressed by MCSA, leading to negative effects. A similar issue arises when SimRepHMS is combined with DynamicConv. DynamicConv relies on the multi-branch structure of SimRepHMS to generate dynamic convolution kernels. However, when SimRepHMS is reparameterized into a single convolution kernel, its feature processing method changes, causing a mismatch between the convolution features generated by DynamicConv and the actual processing path, thus resulting in a performance drop. When all three modules—MCSA, SimRepHMS, and DynamicConv—are used together, MCSA effectively purifies the input features at the feature input stage, enhancing the reliability of the dynamic convolutions generated by DynamicConv and improving the discriminability of the features processed by DynamicConv. After DynamicConv processes the features, they are passed to SimRepHMS, which fully leverages its multi-branch structure for more efficient feature fusion. This further expands the receptive field and contextual information, ultimately improving detection performance. As a result, when MCSA, SimRepHMS, and DynamicConv are used together, the model’s mAP@50 increases to 90.4%. Although the increase in mAP@50–95 is only 0.6%, the model demonstrates strong robustness and generalization ability. Finally, after integrating all four modules—including the WIoUv3 loss function—the model achieves the best overall performance across all metrics: mAP@50 reaches 91.9%, and mAP@50–95 increases to 60.4%, with 2.88M parameters and a computational complexity of 7.8 GFLOPs. This result indicates that the introduction of WIoUv3 effectively improves the precision of bounding box regression, thereby significantly enhancing the overall detection performance.
In summary, through the gradual integration of the four improved modules—MCSA, SimRepHMS, DynamicConv, and WIoUv3—the experiments fully validate the effectiveness of each module in improving detection accuracy and their ability to work synergistically. At the same time, the model achieves higher detection efficiency while keeping computational costs under control, offering practical technical support for future deployment on edge devices. This makes it especially suitable for high-precision real-time detection tasks such as crop disease identification.

3.6. Improved YOLO-MSCM Comparison Experiment

To evaluate the performance of the proposed YOLO-MSCM model for crop disease detection, we conducted a comprehensive comparison with the lightweight object detection model YOLO11n. As shown in Table 6, under the same experimental conditions, YOLO-MSCM significantly outperforms YOLO11n across all key evaluation metrics. Specifically, YOLO-MSCM achieves a precision (P) of 88.8%, a recall (R) of 85.5%, an mAP@50 of 91.9%, and an mAP@50:95 of 60.3%. These represent improvements of 6.1%, 9.1%, 6.2%, and 3.7%, respectively, over YOLO11n, fully demonstrating its superior target recognition capability and higher detection accuracy. In terms of model complexity, YOLO-MSCM has 2.88M parameters and a computational cost of 7.8G FLOPs. Compared to YOLO11n (2.58M parameters, 6.3G FLOPs), only a small additional computational overhead is introduced, yet a significant improvement in detection performance is achieved. This indicates that, while maintaining model lightweight characteristics, by integrating multi-level spatial perception with contextual aggregation strategies, YOLO-MSCM strengthens the model’s sensitivity to disease lesion regions, leading to more reliable and generalizable feature representations.
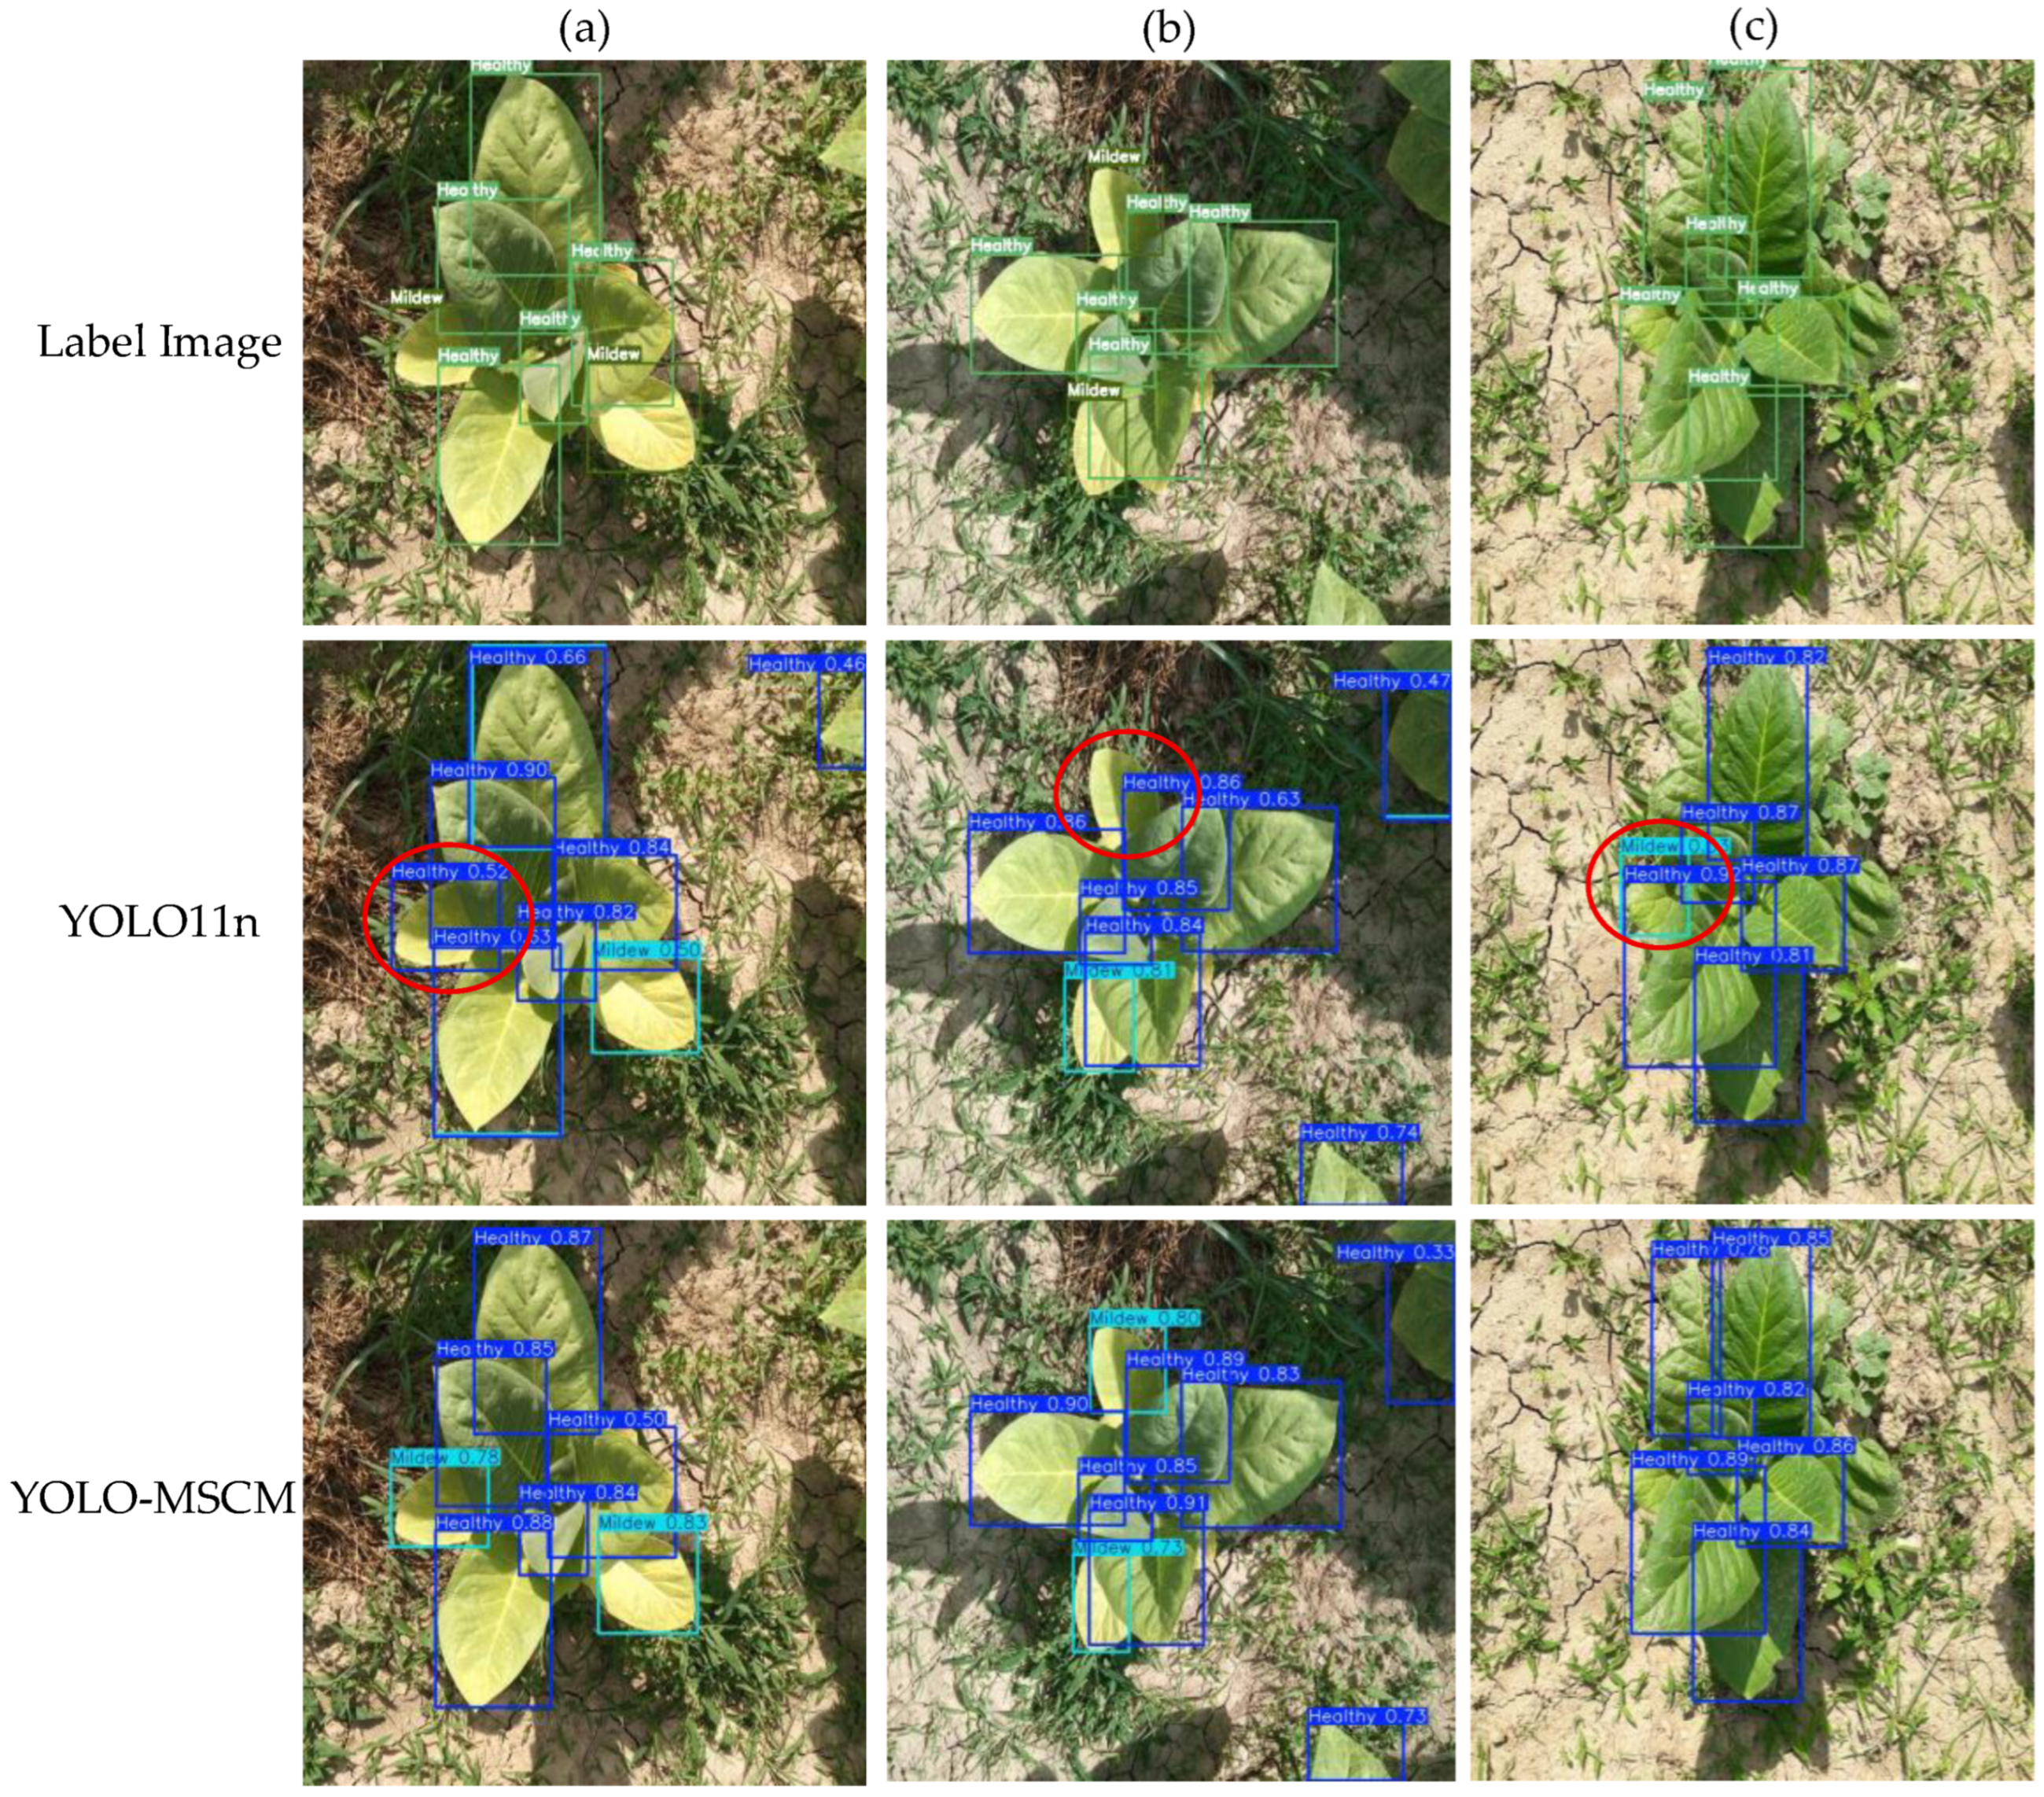
In field environments, the main factors affecting detection performance include insufficient lighting and occlusion of the target objects. To further analyze the model’s performance in complex agricultural scenarios, we selected representative images from the test set for experimentation, as shown in Figure 11, aiming to comprehensively evaluate the model’s accuracy and stability in real-world application scenarios. According to the results of (a) and (b), YOLO11 tends to miss lesion areas on crop leaves under low-light conditions, especially when there is strong background interference, leading to incorrect or missed detections. In comparison, YOLO-MSCM introduces SimRepHMS, which utilizes Local Context Modeling to combine information from the target and its surrounding regions. This enhances feature expression and helps the model better capture subtle or hard-to-distinguish details in low-light environments. The results shown in (c) indicate that when the target is heavily occluded, YOLO11 fails to extract sufficient effective features, resulting in a decline in lesion recognition capability and incorrect detections. In contrast, YOLO-MSCM employs the MCSA mechanism, which enhances the model’s capacity to detect objects across multiple scales. Even under partial occlusion, it maintains relatively good detection performance. Experimental results fully validate that YOLO-MSCM exhibits stronger robustness and practicality in complex field environments, indicating its strong adaptability to real-world farming contexts featuring varying lighting conditions or the presence of occlusion.

3.7. Comparison of Different Detection Models

To assess the effectiveness of the proposed YOLO-MSCM framework in detecting crop diseases, a range of advanced detection architectures were selected as benchmark models, including Faster R-CNN-VGG, RT-DETR-R50, the YOLOv8 to YOLOv13 family, and the recently introduced domain-specific YOLO-Tobacco. All models were trained and evaluated under the same dataset, training strategy, and experimental environment to ensure a fair and comprehensive comparison. As shown in Table 7, the proposed YOLO-MSCM model achieved superior performance across all evaluation metrics.
In terms of detection accuracy, YOLO-MSCM achieved a precision of 88.9% and a recall of 85.4%, outperforming all other models. This indicates that the model not only maintains a relatively low false-positive rate but also demonstrates strong capability in identifying infected areas, effectively reducing the rate of missed detections. The model also achieved the highest performance among all compared models in two key average precision metrics under different IoU thresholds, attaining 91.9% in mAP@0.5 and 60.4% in mAP@0.5:0.95. These results highlight YOLO-MSCM’s excellent robustness and generalization ability in detecting crop diseases under varying object scales and occlusion levels.
From the perspective of model efficiency and deployment feasibility, YOLO-MSCM also demonstrated notable advantages. It contained only 2.88 million parameters and required 7.8 GFLOPs for inference, significantly lower than most high-performance models such as YOLO11s and YOLOv13s. Simultaneously, the model achieved a high inference speed of 181.8 FPS, demonstrating strong potential for real-time implementation on resource-constrained edge platforms. In comparison, YOLO-Tobacco had a similar parameter count (2.47 M), but its mAP@50:95 was only 52.5%, indicating that its detection accuracy still has considerable room for improvement.

4. Discussion

Strict prevention and control of crop diseases is a crucial prerequisite for ensuring the economic benefits of crop cultivation. However, the complexity of field environments poses significant challenges to the automatic detection of plant diseases. Aiming to enhance detection accuracy and robustness for crop diseases under complex agricultural conditions, we introduce an optimized lightweight object detection framework—YOLO-MSCM. In model comparison experiments, YOLO-MSCM outperformed current mainstream detection models across multiple precision-related evaluation metrics, demonstrating notable performance advantages. However, due to the introduction of multiple improved modules, the network structure of the model became deeper, resulting in increased inference time and a corresponding decrease in the frame rate (FPS). While YOLO-MSCM maintains a high inference speed of 181.8 FPS, satisfying fundamental real-time constraints, its deployment in real-world agricultural environments still faces challenges due to hardware limitations, including constrained processing power and memory throughput. Therefore, its parameter count and computational cost may affect deployment efficiency and system stability. In addition, the generalization ability of the current model under different climatic conditions and crop growth stages still requires further validation. The dataset used in this study was primarily collected under clear weather conditions, where lighting remained relatively consistent, and the image capture angles were relatively fixed. Additionally, the dataset does not fully cover images of crops at different growth stages. These factors somewhat limit the environmental and visual diversity of the data. We acknowledge that obtaining accurately labeled images of various crop diseases under different field conditions is a challenging task, and data collection has been constrained by practical conditions. Nevertheless, the dataset has been carefully curated to include key disease types of major crops, making it a valid model evaluation benchmark under controlled yet representative agricultural conditions. Experimental results show that, thanks to targeted data augmentation and attention mechanisms, YOLO-MSCM still demonstrates strong detection capability despite the limited data diversity. However, the lack of environmental variation remains an objective limitation of this study. In agricultural practical applications, the above factors are still challenges that need to be addressed during model deployment. Subsequent work will focus on model compression and dataset expansion.

5. Conclusions

In the context of intelligent development in modern agriculture, automated detection of crop diseases has become an important means to improve agricultural production efficiency and ensure food security. In response to crop disease—a common and highly damaging agricultural disease—this paper proposes an improved lightweight object detection model named YOLO-MSCM, aiming to enhance the accuracy and robustness of existing detection models in complex field environments. Based on YOLO11-n, YOLO-MSCM integrates the concepts of multi-scale spatial perception and local contextual modeling and proposes the MCSA module and SimRepHMS module to effectively improve the model’s feature extraction and fusion capabilities. At the same time, DynamicConv is introduced to further enhance feature expression ability, and the WIoUv3 loss function is adopted to optimize the bounding box regression process. Experimental results on the dataset show that YOLO-MSCM achieves a precision (P) of 88.9%, a recall rate (R) of 85.4%, an mAP@50 of 91.9%, and an mAP@50:95 of 60.4%. Compared with the baseline model YOLO11n, YOLO-MSCM improves precision (P) by 6.1 percentage points, recall rate (R) by 9.1 percentage points, mAP@50 by 6.2 percentage points, and mAP@50:95 by 3.7 percentage points, verifying the effectiveness of the improvements made to YOLO-MSCM. Moreover, through comparative experiments with multiple mainstream models, the results show that YOLO-MSCM surpasses all mainstream models in detection accuracy, demonstrating the advancement of YOLO-MSCM in crop disease detection.
Although YOLO-MSCM can achieve the accurate detection of crop diseases, there are still some limitations. To further optimize deployment efficiency, future efforts will focus on applying compression methods like pruning and distillation, aiming to reduce both parameter count and computational overhead while enhancing frame processing speed and real-time responsiveness. In addition, we plan to expand the current dataset by incorporating disease images under different weather conditions (such as cloudy, rainy, and low-light conditions) and from various perspectives (such as oblique shots and close-ups). We also intend to conduct field data collection across multiple regions and growing seasons to build a larger-scale, real-world scenario dataset. The new dataset will gradually include more crops and disease types, and annotations will be made with respect to disease severity levels. On this expanded dataset, we will perform a comprehensive Grad-CAM++ analysis to visualize and interpret model attention patterns across diverse and challenging conditions. Insights gained from these visualizations—particularly regarding false positives, false negatives, and misaligned feature activations—will be used to iteratively refine and improve the existing modules of YOLO-MSCM. This data-driven refinement process will not only enhance the model’s cross-species generalization capability but also drive the evolution of YOLO-MSCM from a specialized detection framework into a more universal and robust solution for real-world plant disease detection.
At the same time, we acknowledge that the current evaluation primarily relies on theoretical computational load and average inference speed and has yet to encompass more granular system-level metrics such as memory usage, power consumption, and hardware utilization. In future work, we plan to introduce more advanced performance evaluation metrics—such as energy efficiency ratio (FLOPs/Watt), memory bandwidth utilization, and core occupancy—and conduct in-depth analyses across various target hardware platforms (e.g., Jetson series and Raspberry Pi) to further quantify the model’s comprehensive performance in real-world deployment environments. Furthermore, to enhance the statistical rigor of our experimental comparisons, we will adopt advanced validation methods, including paired hypothesis testing (e.g., paired t-test and Wilcoxon signed-rank test) and effect size analysis, to systematically assess model performance in subsequent experiments. This combined approach will not only improve the reliability and reproducibility of our results but also provide a more holistic and scientifically robust evaluation framework for edge-aware plant disease detection models.
Author Contributions

Conceptualization, Y.Z. and L.H.; methodology, L.H.; validation, Y.Z. and L.H.; formal analysis, Y.Z. and S.X.; investigation, S.X. and Y.Z.; data curation, L.H. and Y.Z.; writing—original draft preparation, L.H.; writing—review and editing, Y.Z. and L.H.; visualization, L.H. and S.X.; supervision, S.X. and Y.Z.; project administration, S.X.; funding acquisition, Y.Z. All authors have read and agreed to the published version of the manuscript.

Funding

This research was funded by the Scientific Research Project of Liaoning Province Education Department under grant LJKMZ20220782.

Institutional Review Board Statement

Not applicable.

Informed Consent Statement

Not applicable.

Data Availability Statement

The data that support the findings of this study are available on request from the corresponding author.

Acknowledgments

We would like to extend our sincere appreciation to our classmates for their support and assistance throughout the experimental phase. Our heartfelt thanks also go out to the many mentors and colleagues who have offered us invaluable guidance and encouragement.

Conflicts of Interest

The authors declare no conflicts of interest.

References

  1. Mei, Y.; Miao, J.Y.; Lu, Y.H. Digital Villages Construction Accelerates High-Quality Economic Development in Rural China through Promoting Digit Entrepreneurship. Sustainability 2022, 14, 14224. [Google Scholar] [CrossRef]
  2. Mrówczyńska-Kamińska, A.; Bajan, B. Importance and share of agribusiness in the Chinese economy (2000–2014). Heliyon 2019, 5, e02884. [Google Scholar] [CrossRef]
  3. Yang, Q.; Du, T.; Li, N.; Liang, J.; Javed, T.; Wang, H.; Guo, J.; Liu, Y. Bibliometric Analysis on the Impact of Climate Change on Crop Pest and Disease. Agronomy 2023, 13, 920. [Google Scholar] [CrossRef]
  4. Kanna, S.K.; Ramalingam, K.; Prabu, P.C. YOLO deep learning algorithm for object detection in agriculture: A review. J. Agric. Eng. 2024, 55. [Google Scholar] [CrossRef]
  5. Li, X.; Cai, M.; Tan, X.; Yin, C.; Chen, W.; Liu, Z.; Wen, J.; Han, Y. An efficient transformer network for detecting multi-scale chicken in complex free-range farming environments via improved RT-DETR. Comput. Electron. Agric. 2024, 224, 109160. [Google Scholar] [CrossRef]
  6. Liu, Y.; Zhou, F.; Zheng, W.; Bai, T.; Chen, X.; Guo, L. Recognition of Foal Nursing Behavior Based on an Improved RT-DETR Model. Animals 2025, 15, 340. [Google Scholar] [CrossRef] [PubMed]
  7. Sun, L.; Liu, G.; Yang, H.; Jiang, X.; Liu, J.; Wang, X.; Yang, H.; Yang, S. LAD-RCNN: A Powerful Tool for Livestock Face Detection and Normalization. Animals 2023, 13, 1446. [Google Scholar] [CrossRef] [PubMed]
  8. Wang, C.; Du, P.; Wu, H.; Li, J.; Zhao, C.; Zhu, H. A cucumber leaf disease severity classification method based on the fusion of DeepLabV3+and U-Net. Comput. Electron. Agric. 2021, 189, 106373. [Google Scholar] [CrossRef]
  9. Zhang, S.W.; Zhang, C.L. Modified U-Net for plant diseased leaf image segmentation. Comput. Electron. Agric. 2023, 204, 107511. [Google Scholar] [CrossRef]
  10. Hu, R.; Su, W.-H.; Li, J.-L.; Peng, Y. Real-time lettuce-weed localization and weed severity classification based on lightweight YOLO convolutional neural networks for intelligent intra-row weed control. Comput. Electron. Agric. 2024, 226, 109404. [Google Scholar] [CrossRef]
  11. Wu, M.; Lin, H.; Shi, X.; Zhu, S.; Zheng, B. MTS-YOLO: A Multi-Task Lightweight and Efficient Model for Tomato Fruit Bunch Maturity and Stem Detection. Horticulturae 2024, 10, 1006. [Google Scholar] [CrossRef]
  12. Chen, J.S.; Liu, M.; Li, J.S.; Chen, J.X. LFA-YOLO: Detection of Lychee Fruit Anthracnose Based on Uav Images and Deep Learning. Appl. Eng. Agric. 2024, 40, 515–523. [Google Scholar] [CrossRef]
  13. Dang, F.; Chen, D.; Lu, Y.; Li, Z. YOLOWeeds: A novel benchmark of YOLO object detectors for multi-class weed detection in cotton production systems. Comput. Electron. Agric. 2023, 205, 107655. [Google Scholar] [CrossRef]
  14. Du, X.; Cheng, H.; Ma, Z.; Lu, W.; Wang, M.; Meng, Z.; Jiang, C.; Hong, F. DSW-YOLO: A detection method for ground-planted strawberry fruits under different occlusion levels. Comput. Electron. Agric. 2023, 214, 108304. [Google Scholar] [CrossRef]
  15. Fang, H.; Shi, B.; Sun, Y.; Xiong, N.; Zhang, L. APEST-YOLO: Amulti-Scale Agricultural Pest Detection Model Based on Deep Learning. Appl. Eng. Agric. 2024, 40, 553–564. [Google Scholar] [CrossRef]
  16. Bai, Y.; Yu, J.; Yang, S.; Ning, J. An improved YOLO algorithm for detecting flowers and fruits on strawberry seedlings. Biosyst. Eng. 2024, 237, 1–12. [Google Scholar] [CrossRef]
  17. Chen, L.; Wu, L.G.; Wu, Y.Q. Maturity detection of Hemerocallis citrina Baroni based on LTCB YOLO and lightweight and efficient layer aggregation network. Int. J. Agric. Biol. Eng. 2025, 18, 278–287. [Google Scholar] [CrossRef]
  18. Gao, A.; Geng, A.; Zhang, Z.; Zhang, J.; Hu, X.; Li, K. Dynamic detection method for falling ears of maize harvester based on improved YOLO-V4. Int. J. Agric. Biol. Eng. 2022, 15, 22–32. [Google Scholar] [CrossRef]
  19. Hu, H.; Kaizu, Y.; Zhang, H.; Xu, Y.; Imou, K.; Li, M.; Huang, J.; Dai, S. Recognition and localization of strawberries from 3D binocular cameras for a strawberry picking robot using coupled YOLO/Mask R-CNN. Int. J. Agric. Biol. Eng. 2022, 15, 175–179. [Google Scholar] [CrossRef]
  20. Shi, R.; Li, T.; Yamaguchi, Y. An attribution-based pruning method for real-time mango detection with YOLO network. Comput. Electron. Agric. 2020, 169, 105214. [Google Scholar] [CrossRef]
  21. Rahman, C.R.; Arko, P.S.; Ali, M.E.; Khan, M.A.I.; Apon, S.H.; Nowrin, F.; Wasif, A. Identification and recognition of rice diseases and pests using convolutional neural networks. Biosyst. Eng. 2020, 194, 112–120. [Google Scholar] [CrossRef]
  22. Mathew, M.P.; Mahesh, T.Y. Leaf-based disease detection in bell pepper plant using YOLO v5. Signal Image Video Process. 2022, 16, 841–847. [Google Scholar] [CrossRef]
  23. Xue, Z.; Xu, R.; Bai, D.; Lin, H. YOLO-Tea: A Tea Disease Detection Model Improved by YOLOv5. Forests 2023, 14, 415. [Google Scholar] [CrossRef]
  24. Zhao, S.; Liu, J.; Wu, S. Multiple disease detection method for greenhouse-cultivated strawberry based on multiscale feature fusion Faster R_CNN. Comput. Electron. Agric. 2022, 199, 107176. [Google Scholar] [CrossRef]
  25. Feng, Z.; Shi, R.; Jiang, Y.; Han, Y.; Ma, Z.; Ren, Y. SPD-YOLO: A Method for Detecting Maize Disease Pests Using Improved YOLOv7. Comput. Mater. Contin. 2025, 84, 3559–3575. [Google Scholar] [CrossRef]
  26. Sun, D.; Zhang, K.; Zhong, H.; Xie, J.; Xue, X.; Yan, M.; Wu, W.; Li, J. Efficient Tobacco Pest Detection in Complex Environments Using an Enhanced YOLOv8 Model. Agriculture 2024, 14, 353. [Google Scholar] [CrossRef]
  27. Yang, S.; Wang, B.; Ru, S.; Yang, R.; Wu, J. Maize Seed Damage Identification Method Based on Improved YOLOV8n. Agronomy 2025, 15, 710. [Google Scholar] [CrossRef]
  28. Wang, T.; Zhang, K.; Zhang, W.; Wang, R.; Wan, S.; Rao, Y.; Jiang, Z.; Gu, L. Tea picking point detection and location based on Mask-RCNN. Inf. Process. Agric. 2023, 10, 267–275. [Google Scholar] [CrossRef]
  29. Yadav, S.; Tewari, A.S. CONF-RCNN: A conformer and faster region-based convolutional neural network model for multi-label classification of tomato leaves disease in real field environment. J. Plant Dis. Prot. 2025, 132, 61. [Google Scholar] [CrossRef]
  30. Yu, J.H.; Zhang, B. MDP-YOLO: A Lightweight YOLOV5S Algorithm for Multi-Scale Pest Detection. Eng. Agric. 2023, 43, e20230065. [Google Scholar] [CrossRef]
  31. Zheng, T.; Zhu, Y.; Liu, S.; Li, Y.; Jiang, M. Detection of citrus in the natural environment using Dense-TRU-YOLO. Int. J. Agric. Biol. Eng. 2025, 18, 260–266. [Google Scholar] [CrossRef]
  32. Fang, K.; Zhou, R.; Deng, N.; Li, C.; Zhu, X. RLDD-YOLOv11n: Research on Rice Leaf Disease Detection Based on YOLOv11. Agronomy 2025, 15, 1266. [Google Scholar] [CrossRef]
  33. Gao, L.; Cao, H.; Zou, H.; Wu, H. DMN-YOLO: A Robust YOLOv11 Model for Detecting Apple Leaf Diseases in Complex Field Conditions. Agriculture 2025, 15, 1138. [Google Scholar] [CrossRef]
  34. Qin, J.; Chen, Z.; Zhang, Y.; Nie, J.; Yan, T.; Wan, B. YOLO-CT: A method based on improved YOLOv8n-Pose for detecting multi-species mature cherry tomatoes and locating picking points in complex environments. Measurement 2025, 254, 117954. [Google Scholar] [CrossRef]
  35. Yang, L.; Zhang, T.; Zhou, S.; Guo, J. AAB-YOLO: An Improved YOLOv11 Network for Apple Detection in Natural Environments. Agriculture 2025, 15, 836. [Google Scholar] [CrossRef]
  36. Zhou, J.; Cheng, Y.; Yu, L.; Zhang, J.; Zou, X. Characteristics of fungal communities and the sources of mold contamination in mildewed tobacco leaves stored under different climatic conditions. Appl. Microbiol. Biotechnol. 2022, 106, 131–144. [Google Scholar] [CrossRef]
  37. Xue, W.; Xu, P.; Wang, X.; Ren, G.; Wang, X. Natural-Enemy-Based Biocontrol of Tobacco Arthropod Pests in China. Agronomy 2023, 13, 1972. [Google Scholar] [CrossRef]
  38. Dun, J.; Yang, H.; Yuan, S.; Tang, Y. EER-DETR: An Improved Method for Detecting Defects on the Surface of Solar Panels Based on RT-DETR. Appl. Sci. 2025, 15, 6217. [Google Scholar] [CrossRef]
  39. Song, L.; Lu, S.; Tong, Y.; Han, F. YOLOv8s-GSW: A real-time detection model for hexagonal barbed wire breakpoints. J. Supercomput. 2025, 81, 222. [Google Scholar] [CrossRef]
  40. Zhang, T.; Pan, Y. Real-time detection of a camouflaged object in unstructured scenarios based on hierarchical aggregated attention lightweight network. Adv. Eng. Inform. 2023, 57, 102082. [Google Scholar] [CrossRef]
  41. Chattopadhyay, A.; Sarkar, A.; Howlader, P.; Vineeth, N. BalasubramanianGrad-CAM++: Improved Visual Explanations for Deep Convolutional Networks. In Proceedings of the 2018 IEEE Winter Conference on Applications of Computer Vision (WACV), Lake Tahoe, NV, USA, 12–15 March 2018. [Google Scholar]
  42. Bao, H.; Qi, X. Image restoration based on SimAM attention mechanism and constraint adversarial network. Evol. Syst. 2025, 16, 39. [Google Scholar] [CrossRef]
Figure 1. Sample images from the self-constructed crop disease dataset, covering four crop types and three health conditions: healthy, mildew, and pest-infected.
Applsci 15 09341 g001
Figure 2. Data enhancement example: (a) Original image. (b) Random brightness adjustment. (c) Addition of Gaussian noise. (d) Contrast adjustment.
Applsci 15 09341 g002
Figure 3. The architecture of YOLO11 features a backbone enhanced by the C3k2 and C2PSA modules for multi-scale feature extraction. The neck incorporates the SPPF module for hierarchical feature aggregation. The decoupled detection head, combined with the DWConv modules, enables efficient object localization and classification.
Applsci 15 09341 g003
Figure 4. Architecture of the proposed YOLO-MSCM model, integrating MCSA, SimRepHMS, DynamicConv, and WIoUv3 loss to enhance detection accuracy and robustness for crop diseases in complex environments.
Applsci 15 09341 g004
Figure 5. Architecture of the Multi-Scale Channel and Spatial Attention (MCSA) module, comprising Dual Multi-Scale Attention (DMSA) and Parallel Channel–Spatial Attention (PCSA) submodules.
Applsci 15 09341 g005
Figure 6. Architecture of the SimRepHMS module for efficient multi-scale feature fusion and cross-level information integration.
Applsci 15 09341 g006
Figure 7. Architecture of the DynamicConv module, which adaptively combines multiple expert convolution kernels via input-aware weighting generated by an MLP-based gating mechanism.
Applsci 15 09341 g007
Figure 8. Visualization of key parameters in the WIoUv3 loss function, illustrating the adaptive weighting mechanism and geometric relationships for improved bounding box regression.
Applsci 15 09341 g008
Figure 9. Comparison of attention heatmaps generated by different attention mechanisms based on Grad-CAM++. The proposed MCSA module demonstrates stronger spatial selectivity, able to focus attention precisely on the target object, maintaining high concentration even under complex background conditions. In contrast, the responses of other attention mechanisms are more dispersed, with redundant activations in irrelevant areas.
Applsci 15 09341 g009
Figure 10. Training convergence comparison of different loss functions, showing the convergence characteristics of WIoUv3.
Applsci 15 09341 g010
Figure 11. The comparison of the detection performance of YOLO11n and YOLO-MSCM under different lighting conditions and occlusion situations demonstrates the performance differences between the two models in complex scenarios. YOLO11n shows significant false positives and missed detections in scenes with occlusion.
Applsci 15 09341 g011
Table 1. Image and label counts in the datasets.
DatasetNumber of ImagesNumber of Labels
HealthyMildewPest
Total265612,55538264917
Train2124986931103939
Validation2661377363503
Test2661309353475
Table 2. Hyperparameter settings.
ConfigurationsValues
Training epochs300
Resolution640 × 640
Batch size32
Workers8
OptimizerSGD
Momentum0.9
Activation functionSiLU
Initial learning rate0.01
Weight decay0.0005
Table 3. Comparison of mAP, precision, and recall for various attention mechanisms in crop disease detection.
ModelP (%)R (%)mAP@50 (%)mAP@50:95 (%)GFLOPs (G)
Baseline82.776.485.756.66.3
CBAM83.279.086.857.36.3
SE82.774.984.955.76.3
SimAM87.179.688.658.66.3
ECA86.775.386.756.66.3
GAM85.178.987.758.66.7
Coord87.279.688.959.66.3
Moga88.079.388.958.57.3
SCSA83.880.688.859.16.3
MCSA89.380.489.959.96.9
Table 4. Performance comparison of different loss functions in bounding box regression for YOLO11n.
Loss FunctionP (%)R (%)mAP@50 (%)mAP50:95 (%)
CIoU82.776.485.756.6
GIoU86.278.388.258.5
DIoU84.176.286.057.2
EIoU84.079.187.256.9
ShapeIoU82.777.187.257.9
MPDIoU80.477.885.556.5
FocalerIoU86.578.088.258.2
WIoUv388.378.988.958.6
Table 5. Ablation study of the proposed modules in YOLO11 for crop disease detection.
MCSASimRepHMSDynamicConvWIoUv3mAP@50 (%)mAP@50–95Params (M)GFLOPs (G)
85.756.62.586.3
89.959.92.586.3
89.259.52.877.3
86.556.32.586.3
89.758.82.877.8
89.959.82.586.9
87.157.13.007.5
90.460.02.887.8
91.960.42.887.8
Table 6. Performance comparison between YOLO-MSCM and YOLO11n in crop disease detection.
ModelP (%)R (%)mAP@50 (%)mAP@50:95Params (M)GFLOPs (G)
YOLO11n82.776.485.756.62.586.3
YOLO-MSCM88.885.591.960.32.887.8
Table 7. Performance evaluation of YOLO-MSCM against leading detection frameworks.
ModelP (%)R (%)mAP@50 (%)MAP@50:95 (%)Params (M)GFLOPs (G)FPS (f·s−1)
Faster R-CNN-VGG65.581.279.839.0136.73401.729.0
RT-DETR-R5084.471.779.553.741.94125.657.8
YOLOv8n82.973.282.552.63.008.1294.1
YOLOv8s84.579.686.457.411.128.4149.3
YOLOv9t84.078.384.656.11.977.6217.4
YOLOv9s87.879.288.759.97.1726.7149.3
YOLOv10n81.974.484.254.82.276.5303.0
YOLOv10s85.275.585.258.77.2221.4158.7
YOLO11n82.776.485.756.62.586.3263.2
YOLO11s88.079.387.759.79.4121.3149.3
YOLOv12n79.675.482.752.22.566.3158.7
YOLOv12s84.877.585.459.29.2321.2116.3
YOLOv13n78.876.283.553.22.456.2151.5
YOLOv13s87.480.788.659.89.0020.794.3
YOLO-Tobacco79.075.583.052.52.4716.3137.0
YOLO-MSCM88.985.491.960.42.887.8181.8
Disclaimer/Publisher’s Note: The statements, opinions and data contained in all publications are solely those of the individual author(s) and contributor(s) and not of MDPI and/or the editor(s). MDPI and/or the editor(s) disclaim responsibility for any injury to people or property resulting from any ideas, methods, instructions or products referred to in the content.