Article

An Accurate and Efficient Diabetic Retinopathy Diagnosis Method via Depthwise Separable Convolution and Multi-View Attention Mechanism

School of Artificial Intelligence, Capital University of Economics and Business, 121 Zhangjialukou, Fengtai District, Beijing 100070, China
*
Author to whom correspondence should be addressed.
These authors contributed equally to this work.
Appl. Sci. 2025, 15(17), 9298; https://doi.org/10.3390/app15179298
Submission received: 15 July 2025 / Revised: 21 August 2025 / Accepted: 21 August 2025 / Published: 24 August 2025

Abstract

Diabetic retinopathy (DR), a critical ocular disease that can lead to blindness, demands early and accurate diagnosis to prevent vision loss. Current automated DR diagnosis methods face two core challenges: first, subtle early lesions such as microaneurysms are often missed due to insufficient feature extraction; second, there is a persistent trade-off between model accuracy and efficiency—lightweight architectures often sacrifice precision for real-time performance, while high-accuracy models are computationally expensive and difficult to deploy on resource-constrained edge devices. To address these issues, this study presents a novel deep learning framework integrating depthwise separable convolution and a multi-view attention mechanism (MVAM) for efficient DR diagnosis using retinal images. The framework employs multi-scale feature fusion via parallel 3 × 3 and 5 × 5 convolutions to capture lesions of varying sizes and incorporates Gabor filters to enhance vascular texture and directional lesion modeling, improving sensitivity to early structural abnormalities while reducing computational costs. Experimental results on both the diabetic retinopathy (DR) dataset and ocular disease (OD) dataset demonstrate the superiority of the proposed method: it achieves a high accuracy of 0.9697 on the DR dataset and 0.9669 on the OD dataset, outperforming traditional methods such as CNN_eye, VGG, and UNet by more than 1 percentage point. Moreover, its training time is only half that of U-Net (on DR dataset) and VGG (on OD dataset), highlighting its potential for clinical DR screening.

1. Introduction

Diabetic retinopathy (DR), a prevalent and potentially blinding complication of diabetes, poses a significant global health challenge. With the escalating incidence of diabetes worldwide, the early detection of DR is crucial for preventing vision loss, as timely intervention can substantially reduce the risk of progression to severe stages. Conventionally, manual diagnosis by ophthalmologists through the examination of retinal fundus images is the gold standard for DR screening. However, this approach is labor-intensive, time-consuming, and subject to inter-observer variability, limiting its scalability for large-scale population screening.
In response, numerous automated DR diagnosis methods based on machine learning have been developed. Traditional machine learning algorithms, such as support vector machines and random forests, rely on hand-crafted features, which often struggle to capture the complex and subtle pathological characteristics of early-stage DR [1]. Deep learning, especially convolutional neural networks (CNNs), has shown remarkable success in medical image analysis by automatically extracting hierarchical features from raw images. Nevertheless, existing CNN-based approaches for DR diagnosis face several challenges. Melo et al. [2] defined microaneurysm as follows: microaneurysms appear in the retinal photographs as “isolated, spherical, red dots”. For instance, models like AlexNet and VGG may require substantial computational resources and have limited sensitivity to microaneurysms, while architectures such as UNet may lack the ability to efficiently integrate multi-level feature information [3].
To address these limitations, this study aims to develop an efficient and accurate deep learning framework for the early diagnosis of DR. Our proposed method innovatively combines multi-scale feature aggregation and attention mechanisms, which dynamically emphasizes critical features (e.g., lesion regions in retinal images) by assigning higher weights to diagnostically relevant information. By fusing features from different scales, the model can enhance sensitivity to both macroscopic and microscopic pathological features, while the attention mechanisms enable the model to focus on critical regions, reducing unnecessary computations [4]. Additionally, a multi-view feature fusion module is introduced, leveraging parallel convolutions with 3 × 3 and 5 × 5 receptive fields to capture lesion features of diverse sizes, accommodating the scale variations of microaneurysms and exudates commonly observed in early DR. Inspired by human visual perception, Gabor filters, which mimic human visual sensitivity to texture and direction and enhance the detection of oriented structures like retinal vessels in four orientations (0°, 45°, 90°, and 135°), are incorporated to enhance the model’s ability to detect vascular texture changes and directional lesion patterns, facilitating the identification of early structural abnormalities.
The rest of this paper is organized as follows. Section 2 reviews related work on DR diagnosis. Section 3 details the proposed method, including network architecture and key modules. Section 4 presents the experimental setup and results. Lastly, Section 5 delves into the study’s outcomes, discusses its limitations, and proposes future research directions, and Section 6 synthesizes the key contributions of this research.

2. Related Work

2.1. Traditional Deep Learning-Based DR Diagnosis Methods

Early deep learning approaches for diabetic retinopathy (DR) diagnosis focused on leveraging convolutional neural networks (CNNs) to directly classify fundus images. Gulshan et al. [5] pioneered the use of deep CNNs, demonstrating that such models could achieve ophthalmologist-level accuracy in large-scale datasets, though with heavy reliance on annotated data. Gayathri et al. [6] addressed computational efficiency by proposing a lightweight CNN, balancing model complexity and diagnostic performance for resource-constrained environments. Anas et al. [7] proposed an improved Support Vector Machine (SVM) that optimizes image detail processing through the attention mechanism. Daniel et al. [8] developed and validated a deep learning system for multi-ethnic patients with diabetes, leveraging large-scale multi-ethnic data to enhance model adaptability. Neetha and Albert [9] proposed a method to optimize thick blood vessel segmentation, providing cleaner inputs for the classifier. Nilarun and Souvik [10] proposed a hybrid convolutional neural network framework that can effectively extract discriminative features from retinal fundus images. Valluri et al. [11] developed an automated and cost-effective method to identify diabetic retinopathy samples. Yasashvini et al. [12] constructed a hybrid architecture integrating CNN, ResNet, and DenseNet through the combination of pre-trained models and transfer learning strategies. V. K. U. Ahamed Gani and N. Shanmugasundaram [13] proposed a method inspired by the dynamic collaboration and adaptive adjustment of cheetah groups, which significantly improved the model’s recognition accuracy for pathological features such as microaneurysms and hemorrhages. However, their parameter tuning relies on empirical settings. Sumod and Sumathy [14] proposed a fusion model based on graph convolutional neural networks, which extracts retinal image features through a variational autoencoder and combines GCNN to mine topological associations, providing a new method for DR detection that integrates local features and global structures. The size of a lesion instance is usually very small compared with the original resolution of the fundus images, making them difficult to detect. Sarhan et al. [15] analyzed the lesion-versus-image scale carefully and proposed a large-size feature pyramid network (LFPN) to preserve more image details for mini-lesion instance detection. Madarapu et al. [16] proposed a novel multi-resolution convolutional attention network (MuR-CAN), which enhances the detection of lesions of different scales in diabetic retinopathy by emphasizing discriminative features. Zhang et al. [17] proposed the deep convolutional neural network DnCNN, which accelerates training and improves denoising performance through residual learning and batch normalization. Raghavendra et al. [18] proposed an 18-layer convolutional neural network for glaucoma diagnosis, providing an efficient deep learning solution for the early automatic detection of glaucoma. Ting et al. [8] further extended this by developing a multi-ethnic validated deep learning system (DLS), highlighting the potential for global DR screening. However, these methods often struggle with detecting subtle early lesions like microaneurysms, leading to high miss rates in preproliferative stages.

2.2. Multi-Modal Imaging and Advanced Feature Engineering

Research has increasingly integrated multi-modal imaging to supplement traditional fundus photography. Chen et al. [19] demonstrated that the synergistic combination of multi-scale network architectures and multi-scale input patches contributes to a distinct improvement in the performance of retinal blood vessel segmentation tasks. Zhang et al. [20] proposed a two-stage TUnet-LBF model, which achieves high-precision retinal blood vessel segmentation on three public datasets by fusing Transformer Unet with an improved Local Binary Fitting function. Levine et al. [21] aimed to assess the global, zonal, and local correlations between changes in vessel density and retinal sensitivity across different severities of diabetic retinopathy. Selvaganapathy et al. [22] proposed that through an “adaptive multi-scale” design, the segmented images are input into an adaptive multi-scale MobileNet to complete the detection of diabetic retinopathy. Hwang et al. [23] utilized Optical Coherence Tomography Angiography (OCTA) to automate quantification of capillary nonperfusion, a key DR biomarker. The multimodal DR dataset constructed by Pooja Bidwai et al. [24] and its explainable design not only provide cross-modal data support for research in the field but also enhance the model’s joint capture ability of retinal structural and pathological features through the feature fusion mechanism. Pooja Bidwai et al. [25] constructed a multimodal dataset consisting of 222 OCTA and fundus images from 76 patients and completed the classification of NPDR stages, providing cross-modal data support for AI model training in early DR detection and research on retinal structural variations. To improve the model’s generalization ability, Mostafa et al. [26] applied a multimodal extension of Manifold Mixup to the connected multimodal features. Filter and shape information optimization are key to advancing DR diagnosis. Corso et al. [27] compared filters like Gabor, LoG, and steerable ones, showing complementary strengths that could address single-filter limits in our framework. Wang et al. [28] proved that shape feature fusion cuts small lesion miss rates by 12–15 percent, supplementing texture-focused models. Our method uses Gabor filters and multi-scale convolutions, but integrating diverse filters or shape descriptors could better capture multi-dimensional lesion features. These improvements align with multimodal fusion trends, boosting DR diagnosis robustness for clinical use. Álvaro et al. [29] proposed a novel self-supervised multimodal pre-training method, which enables the network to learn common features across modalities and unique features of the input modality by integrating unlabeled image pairs of retinal color photography and fluorescein angiography, thereby improving the grading accuracy of diabetic retinopathy. Yin et al. [30] first applied Transformers to multimodal medical image classification, improving the average accuracy while reducing the number of parameters and enhancing computational efficiency. Gengchen et al. [31] achieved superior fusion performance and balanced model efficiency with performance by separately extracting modality-specific and shared features through a dual-branch autoencoder. Jiayuan et al. [32] outperformed SIFT on six types of multimodal datasets, including optical–infrared and SAR–optical, by detecting feature points through phase congruency. Tao et al. [33] proposed the Hybrid-Fusion Network (Hi-Net) for multimodal MR image synthesis, achieving adaptive weighted fusion of inter-modality correlations. Couturier et al. [34] leveraged OCTA to reveal microvascular abnormalities in retinal plexuses undetected by fluorescein angiography (FA), demonstrating the value of structural features. Akram et al. [35] combined handcrafted features (e.g., shape and intensity) with ensemble classifiers to detect DR lesions, while Shanthi et al. [36] modified AlexNet for automated grading, showcasing the impact of feature engineering on classification accuracy. These approaches, however, often require specialized imaging equipment or manual feature design, limiting scalability.

2.3. Lightweight Architectures and Edge Computing Optimization

To enable portable DR screening, studies have focused on lightweight model design. Roychowdhury et al. [37] developed the DREAM system to handle varied imaging conditions via machine learning, while Guo et al. [38] proposed the Angel-Eye FPGA framework for CNN acceleration on embedded devices. Jun et al. [39] proposed the MBAB-YOLO lightweight architecture, which provides a solution for real-time small target detection, balancing accuracy and efficiency by fusing multi-branch convolutional networks with hybrid attention blocks. Hulin et al. [40] proposed the Slim-neck lightweight design based on GSConv, which balances model accuracy and speed through novel convolution techniques, providing an efficient solution for edge device deployment. Matteo et al. [41] proposed the first lightweight neural architecture search tool targeting temporal convolutional networks, achieving a 15.9–152× reduction in the number of parameters while maintaining accuracy. Ruidong et al. [42] proposed an FPGA-based lightweight CNN acceleration architecture, which provides an efficient inference solution for edge computing. Sebastian and Guido [43] contributed a universal and lightweight cloud-edge orchestration platform that fully decouples the optimization logic from the infrastructure. Wenbin et al. [44] proposed the ESFCU-Net lightweight hybrid architecture, which demonstrates clinical application potential by incorporating self-attention and edge enhancement mechanisms. Qiangqiang et al. [45] established a computational resource scheduling model and developed an end-to-end optimization algorithm, leading to a significant reduction in energy consumption. Shi et al. [46] proposed a task offloading strategy for mobile edge computing based on quantum particle swarm optimization, which significantly reduces system energy consumption. Li and Huang [47] proposed a joint optimization method for computing offload strategy and resource allocation in mobile edge computing, achieving co-optimization of system energy consumption and delay.
Existing methods for DR diagnosis face three critical challenges. First, subtle early-stage lesions like microaneurysms are frequently missed due to insufficient feature extraction in shallow or lightweight networks. Second, most models rely heavily on large annotated datasets, a bottleneck for clinical adoption due to high annotation costs and time constraints. Third, a persistent trade-off exists between model accuracy and efficiency—lightweight architectures often sacrifice precision to achieve real-time inference, while high-accuracy models are too computationally intensive for edge deployment in resource-constrained settings. To address these gaps, this study proposes a lightweight network integrating multi-view feature fusion with inverted residual blocks. By leveraging multi-scale convolutional branches and attention mechanisms (e.g., MVAM modules), the model enhances sensitivity to subtle pathological features while maintaining computational efficiency. The design prioritizes end-to-end learnability to reduce dependence on extensive annotations, aiming to deliver a balanced solution that combines high diagnostic accuracy with practical edge deployment feasibility for clinical-scale DR screening.

3. Methodology

3.1. Overview of the Methodology

This study presents a neural network-based framework for diabetic retinopathy diagnosis, optimized for accuracy and efficiency. As shown in Figure 1, the pipeline processes retinal images through three main components: feature extraction, feature representation, and classification. It integrates depth-separable convolutions, MobileNetV2 inverted residual blocks, and MVAM (multi-view attention mechanism) blocks.
In the feature extraction phase, the initial depthwise separable convolution with ReLU6, MobileNetV2 inverted residual blocks, and MVAM modules work in tandem. The depth-separable convolution reduces computational load while capturing basic image features. MobileNetV2 blocks further extract hierarchical features efficiently, and MVAM modules enhance the network’s focus on diagnostically relevant regions (e.g., blood vessels and lesions in retinal images) through a multi-view attention mechanism, which also lays a foundation for high accuracy, as it highlights which image areas influence the diagnosis.
After feature extraction, global average pooling and flattening operations prepare the feature representations for the classification layer. The classification layer, composed of linear transformations, dropout (to prevent overfitting), Hardswish activation, and Log-Softmax, produces the final diagnosis.
This modular design balances computational efficiency (via lightweight operations like depth-separable convolutions and MobileNetV2 blocks) and representational power (via MVAM-enhanced feature attention). The attention-driven feature selection enables fast yet accurate screening for early diabetic retinopathy detection; clinicians and researchers can inspect which retinal regions the model prioritizes, bridging the gap between black-box neural networks and clinical interpretability needs.

3.2. Feature Extraction

The feature extraction backbone of our proposed model is primarily built upon the efficient MobileNetV2 architecture, augmented with a custom multi-view attention mechanism (MVAM) module. This combination leverages the computational efficiency of MobileNetV2 while enhancing its representational power for subtle and critical features in retinal images through focused attention. This section details the two key components: depthwise separable convolution (the core of MobileNetV2) and the MVAM module. To facilitate the reproducibility of the proposed model, the detailed training configurations, covering aspects such as the training process, LR scheduler, loss function, dataset split, and computing device align with the implementation details are described in Section 4.1 and Section 4.2.

3.2.1. Depthwise Separable Convolution Layer

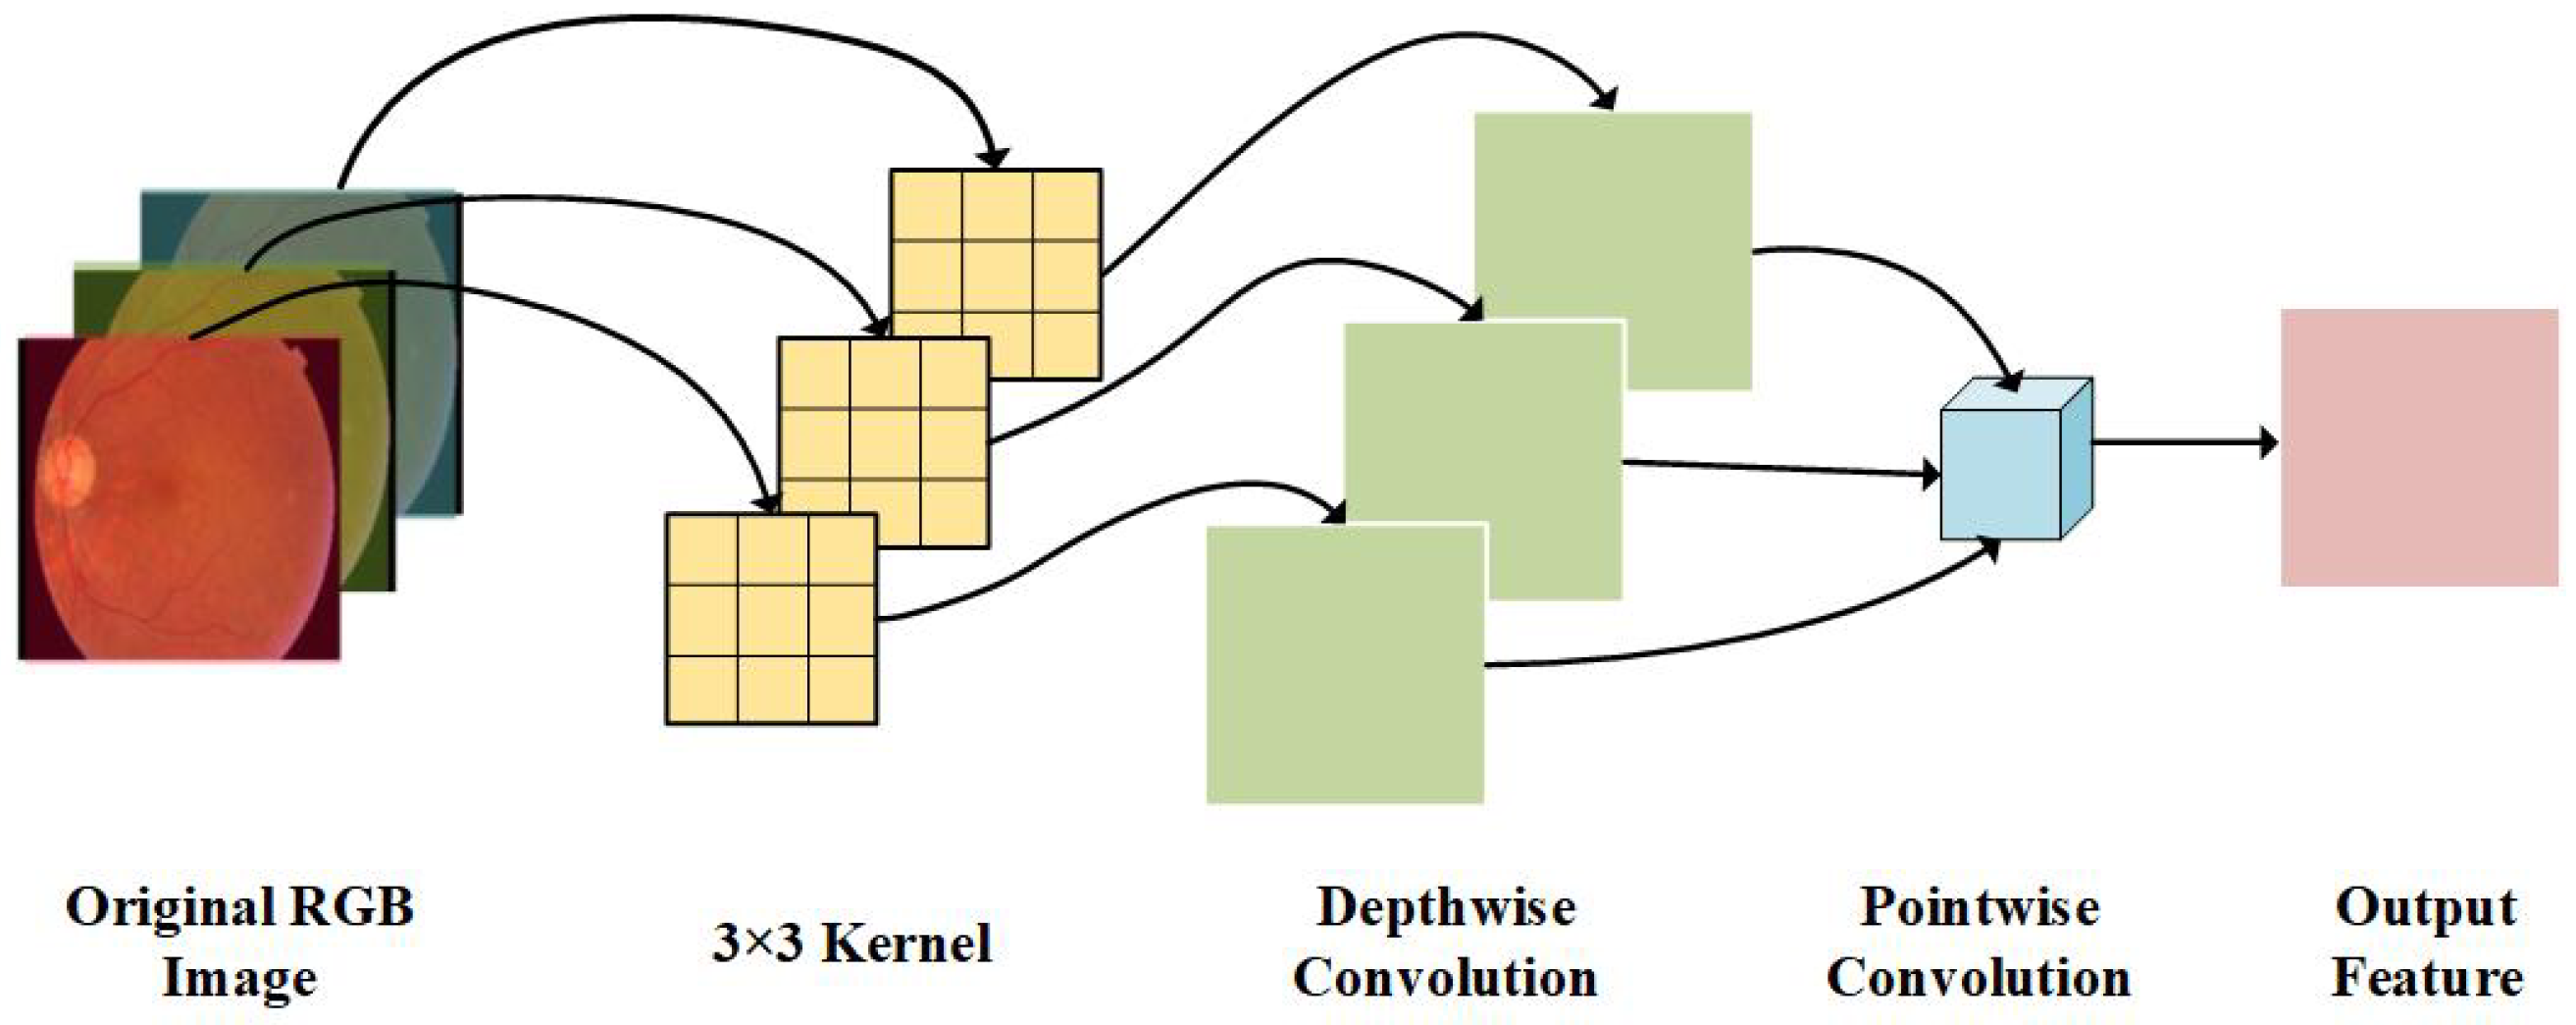
Depthwise separable convolution decomposes standard convolution into depthwise (per-channel spatial filtering) and pointwise (cross-channel feature fusion) steps, reducing computational cost while preserving feature expressiveness. As shown in Figure 2, we leverage the depthwise separable convolution layer to dissect fundus images. This layer decomposes the traditional convolution process into two sequential operations: depthwise convolution and pointwise convolution.
First, depthwise convolution employs individual kernels to convolve each channel of the input fundus image separately, effectively capturing localized spatial features like retinal vessel textures and optic disc shapes within distinct channels. Subsequently, pointwise convolution utilizes 1 × 1 kernels to fuse these channel-specific features across all channels, integrating multi-channel information to highlight interactions between retinal structures (e.g., abnormal vessels and hemorrhages). By separating spatial and channel-wise feature extraction, the depthwise separable convolution layer achieves significant advantages. It drastically reduces computational complexity and model parameters compared to standard convolution, as the independent channel processing in depthwise convolution and compact 1 × 1 kernel operation in pointwise convolution avoid redundant calculations. This efficiency enables the model to handle high-resolution fundus images effectively, while still extracting discriminative features essential for identifying subtle pathological changes in diabetic retinopathy, thus balancing feature richness and computational feasibility for accurate diagnosis.

3.2.2. MVAM Layer for Feature Refinement

In the pipeline of our diabetic retinopathy (DR) diagnosis approach, the multi-view attention mechanism (MVAM) is a pivotal component for extracting and refining discriminative features from retinal images. In the multi-view attention mechanism (MVAM), a “view” refers to a distinct perspective for analyzing retinal image features to capture diverse pathological characteristics of DR. Specifically, three complementary views are integrated: the scale view, which addresses the size variations of DR lesions; the texture view, which leverages Gabor filters oriented at 0°, 45°, 90°, and 135° to model vascular texture and directional lesion patterns; and the attention view, which dynamically emphasizes diagnostically relevant features through dual attention mechanisms, with channel attention recalibrating feature channels to prioritize those encoding pathological information and spatial attention highlighting spatial regions with high lesion probability.
As illustrated in Figure 3, the process commences with the input feature, which is first fed into the multi-scale and Gabor block. Within this block, parallel convolutional operations are executed: a 3 × 3 convolution (Conv3 × 3) and a 5 × 5 convolution (Conv5 × 5). These convolutions are designed to capture multi-scale information inherent in the retinal images. The outputs of these two convolutions are then combined through an addition operation (⊕). Subsequently, the Gabor filter is applied to the combined result. The Gabor filter is adept at extracting texture-related features, which are crucial for identifying DR-associated abnormalities such as vascular distortions and exudates. In the proposed multi-view attention mechanism of the diabetic retinopathy (DR) diagnosis framework, Gabor filters are incorporated to mimic human visual characteristics, enhancing the model’s ability to model vascular texture and lesion direction sensitivity for effective identification of early structural abnormalities in retinal images. The filter parameters are tailored to DR pathological features and retinal image properties, with details as follows: Four orientations cover the main directional distributions of retinal vessels and lesions. A 5 × 5 kernel size with 2-padding ensures consistent feature map dimensions, avoiding small-lesion information loss. The carrier component wavelength balances fine vascular textures and large lesions, while the Gaussian envelope standard deviation restricts the filter’s receptive field to focus on pathological regions. Kernels are initialized via full tensor operations: [−1, 1] coordinate grids for the 5 × 5 kernel are transformed to polar coordinates, then combined with Gaussian and carrier components to form each orientation’s kernel; four kernels are stacked into a [4, 1, 5, 5] weight tensor. This design provides a reliable feature basis for multi-scale fusion and attention refinement, aiding early DR diagnosis accuracy. After the Gabor operation, a combination step integrates these multi-scale and texture-enhanced features, preparing them for further refinement.
The result from the multi-scale and Gabor block is then forwarded to the dual-attention block. This block consists of two parallel attention mechanisms: channel attention and spatial attention. In the multi-view attention mechanism, the dual attention mechanism consists of channel attention (CA) and spatial attention (SA), which work in parallel based on the feature map fused from multi-scale features and Gabor features (denoted as fused, with dimensions B × C × H × W , where B is the batch size, C is the number of channels, and H and W are the height and width of the feature map, respectively). Together, they achieve precise focusing on key features for diabetic retinopathy (DR) diagnosis, and the specific workflow and mathematical explanations are as follows. First, channel attention aims to calibrate the importance of different feature channels, highlighting channels that carry lesion information while suppressing irrelevant channels. Its implementation process is as follows: adaptive average pooling and adaptive max pooling are respectively applied to the input fused to compress the spatial dimension to 1 × 1, thereby aggregating the global information of each channel. The mathematical expression of the average pooling output avg_pool(fused) is AP ( fused ) c = 1 H × W i = 1 H j = 1 W fused b , c , i , j (where b is the batch index and c is the channel index), and the maximum pooling output max _ pool ( fused ) is MP ( fused ) c = max i = 1 H , j = 1 W fused b , c , i , j ; subsequently, the two pooling results are each flattened into a B × C vector and input into a shared fully connected (FC) layer. This FC layer first reduces the dimension (from C to C / r , where r is the reduction ratio, set to 16 in the code) to reduce computational complexity, with the mathematical expression FC 1 ( x ) = ReLU ( W 1 x + b 1 ) (where W 1 R C / r × C and b 1 R C / r ), then restores the dimension to C through a dimension-increasing operation and generates channel weights via Sigmoid activation with the expression FC 2 ( x ) = σ ( W 2 x + b 2 ) (where W 2 R C × C / r , b 2 R C , and σ is the Sigmoid function). Finally, the channel attention weight ca is the weighted sum of the outputs from the two pooling paths, with the mathematical expression ca = σ ( FC 2 ( FC 1 ( AP ( fused ) flatten ) ) + FC 2 ( FC 1 ( MP ( fused ) flatten ) ) ) , and its dimension is expanded back to B × C × 1 × 1 to match the spatial dimension of fused. Second, spatial attention is used to locate spatial regions in the feature map that are critical for DR diagnosis (such as lesion locations) and suppress background noise. Its implementation process is as follows: average pooling and maximum pooling are respectively performed on fused along the channel dimension to generate two single-channel feature maps with dimensions B × 1 × H × W to aggregate global information in the channel dimension. The channel-wise average pooling output avg _ out has the mathematical expression avg _ out b , 1 , i , j = 1 C c = 1 C fused b , c , i , j , and the channel-wise maximum pooling output max _ out is max _ out b , 1 , i , j = max c = 1 C fused b , c , i , j ; these two single-channel feature maps are concatenated along the channel dimension to obtain a feature map combined with dimensions B × 2 × H × W ; subsequently, a 7 × 7 convolution operation (with padding = 3 in the code to maintain the spatial dimension) is applied to combined, with the mathematical expression Conv ( combined ) = W 3 combined + b 3 (where W 3 R 1 × 2 × 7 × 7 , b 3 R 1 , and * denotes the convolution operation), and the spatial attention weight sa is generated via Sigmoid activation, with the expression sa = σ ( W 3 [ avg _ out , max _ out ] + b 3 ) and dimensions B × 1 × H × W . In the collaborative work of the dual attention mechanism, the channel attention weight ca and spatial attention weight sa are first multiplied element-wise to obtain a joint attention weight that integrates channel and spatial information, which is then used for residual connection with the original input feature map x (i.e., x + ca × sa ). This residual design prevents the loss of feature information and enables the model to focus on key features filtered by the attention mechanism, ultimately achieving accurate extraction of DR-related pathological features and providing more discriminative feature support for subsequent classification tasks. Channel attention focuses on recalibrating the importance of different feature channels. It identifies and emphasizes the channels that carry the most discriminative information for DR diagnosis, while suppressing less relevant ones. In parallel, spatial attention pinpoints the spatial regions within the feature maps that are critical for detecting DR lesions. By simultaneously leveraging both channel-wise and spatial-wise attentions, the dual-attention block refines the features to a greater extent, making them more discriminative.
Finally, the refined features from the dual-attention block undergo a residual connection. This connection serves to preserve the original input information while integrating the attention-refined features, ensuring that no valuable information is lost during the feature refinement process. The output of this entire mechanism is the refined feature, which is enriched with multi-scale, texture, and attention-highlighted information, ready for subsequent DR diagnosis tasks such as classification or segmentation. Overall, the multi-view attention mechanism effectively integrates multi-scale feature extraction, texture analysis via Gabor filtering, and dual-attention refinement to boost the representational power of features for accurate DR diagnosis.

3.3. Feature Representation and Classification Layer

In our proposed framework, the feature representation and classification processes are structured to effectively transform and interpret learned features for the task at hand. For feature representation, after extracting hierarchical features through preceding network components, an average pool operation is first applied. This average pool step serves to downsample the feature maps, reducing spatial dimensions while retaining a condensed summary of the spatial information. Subsequently, a flatten operation is employed to reshape the multi-dimensional feature maps into a one-dimensional vector, facilitating the subsequent processing in the classification stage.
Moving on to the classification layer, the flattened feature vector is fed into a sequence of operations as visualized. It starts with a linear layer that projects the feature vector into a higher-dimensional or more discriminative space. Next, a hardswish activation function is introduced, which introduces non-linearity to help the model learn complex decision boundaries, while maintaining computational efficiency suitable for both training and inference. Following this, a dropout layer is utilized to mitigate overfitting by randomly “dropping out” a fraction of the input units during training, enhancing the model’s generalization ability. Another linear layer then refines the feature representation, and finally, a log softmax operation is applied to convert the output into a probability distribution over the target classes, enabling the model to produce interpretable classification scores for prediction. Collectively, these components in the feature representation and classification layer work in tandem to transform raw features into a form amenable to accurate and robust classification.

4. Experimental Section

4.1. Dataset and Preprocessing

The dataset utilized in this study consists of high-resolution retinal images captured under diverse imaging conditions, with Diabetic Retinopathy (DR) assessments performed by a medical professional [48]. Each image is labeled on a scale of 0 to 1, where 0 indicates the presence of diabetic retinopathy and 1 denotes no diabetic retinopathy. This labeling scheme, along with the varied imaging conditions, provides a valuable resource for training and evaluating models aimed at DR diagnosis. Table 1 presents basic information on the two experimental datasets, the diagnosis of diabetic retinopathy dataset (DR dataset) [49] and the ocular disease recognition dataset (OD dataset) [50]. The DR dataset contains a total of 2848 images, with 1411 images in the DR class and 1437 images in the No_DR class. The OD dataset has a larger total of 6112 images, including 3445 DR images and 2667 No_DR images.
To enhance the model’s generalization ability and optimize performance, a series of carefully designed data preprocessing and augmentation operations was applied to input retinal images.
First, all images were uniformly resized to 255 × 255 pixels. This standard dimension preserves key retinal features (e.g., blood vessels and lesions) while ensuring consistency in model input, facilitating stable feature extraction across the dataset.
For data augmentation, multiple random transformation techniques were employed. Images were horizontally and vertically flipped with a probability of 0.5. These flips artificially expand dataset diversity, enabling the model to learn feature representations from different visual perspectives. Additionally, random rotations were applied, with angles ranging from −30° to + 30°. This helps the model develop robustness to target orientations, simulating real-world variations in retinal image acquisition.
After these spatial transformations, images were converted to tensor format. Normalization was then performed using ImageNet dataset statistics, adjusting pixel value means to [0.485, 0.456, 0.406] and standard deviations to [0.229, 0.224, 0.225]. This normalization strategy accelerates training convergence and improves model stability by aligning the input data distribution with the pre-training context of many components of the neural network, ensuring consistent feature scaling during both training and inference.
Table 2 and Table 3 list the proposed model’s training configurations on the DR dataset and OD dataset.

4.2. Experimental Setup

To comprehensively evaluate the MVAM model’s performance in diabetic retinopathy classification, we compared it against classic architectures (CNN-Eye, AlexNet, VGG, ShuffleNet, and U-Net), a recent state-of-the-art method (LANet [51]), and an ablation variant. Key metrics, including precision, recall, F1-score, and accuracy, were used to quantify performance.
All models were trained and tested on the same retinal image dataset (consistent support = 231 samples) to ensure fair comparison. The metrics were calculated using standard classification evaluation formulas:
P r e c i s i o n = T P T P + F P
R e c a l l = T P T P + F N
F 1 - s c o r e = 2 × P r e c i s i o n × R e c a l l P r e c i s i o n + R e c a l l
A c c u r a c y = T P + T N T P + T N + F P + F N

4.3. Comparison of Experimental Results of Different Methods

Table 4 and Table 5 present a side-by-side comparison of performance metrics across models on the DR dataset and the OD dataset. Our method achieved the highest accuracy across both datasets, reaching 0.9697 on the DR dataset and 0.9669 on the OD dataset. Specifically, on the DR dataset, it outperformed the second-ranked U-Net by 1.30 percentage points in accuracy, with notable advantages in precision (0.9696) and recall (0.9698)—metrics critical for detecting subtle lesions like microaneurysms. On the OD dataset, it surpassed LANet (the closest competitor) by 1.07 percentage points in accuracy, demonstrating robust generalization to broader ocular disease contexts. Traditional models such as CNN_Eye and AlexNet showed lower performance due to limited feature representation capabilities, while lightweight architectures like ShuffleNet sacrificed precision for efficiency. These results validate that our method’s integration of multi-scale feature fusion and attention mechanisms effectively enhances sensitivity to pathological features while maintaining competitive performance across diverse datasets.

4.4. Training Loss/Accuracy Analysis

The two datasets were split into training, validation, and test sets with a ratio of 7:2:1, stored in separate directories for model training, optimization, and evaluation. All images were resized to 255 × 255, augmented with random horizontal/vertical flipping (p = 0.5) and random rotation (30°), converted to tensors, and normalized using ImageNet mean ([0.485, 0.456, 0.406]) and std ([0.229, 0.224, 0.225]). A batch size of 32 was used, with shuffling enabled for training and validation loaders. The model was trained for 60 epochs using the Adam optimizer, a dynamic learning rate starting at 1 × 10 3 and reduced to 1/10 every 10 epochs via StepLR scheduler, and cross-entropy loss for the DR vs. No DR binary classification task. To evaluate the model’s learning dynamics, training and validation loss/accuracy curves across epochs were analyzed.
For loss (Figure 4), the training loss of both datasets exhibited a rapid decline in the initial 10 epochs, dropping from 0.7 to 0.2 and 0.5 to 0.1, respectively. The validation loss followed a concurrent trend but with minor fluctuations, implying reasonable generalization ability.
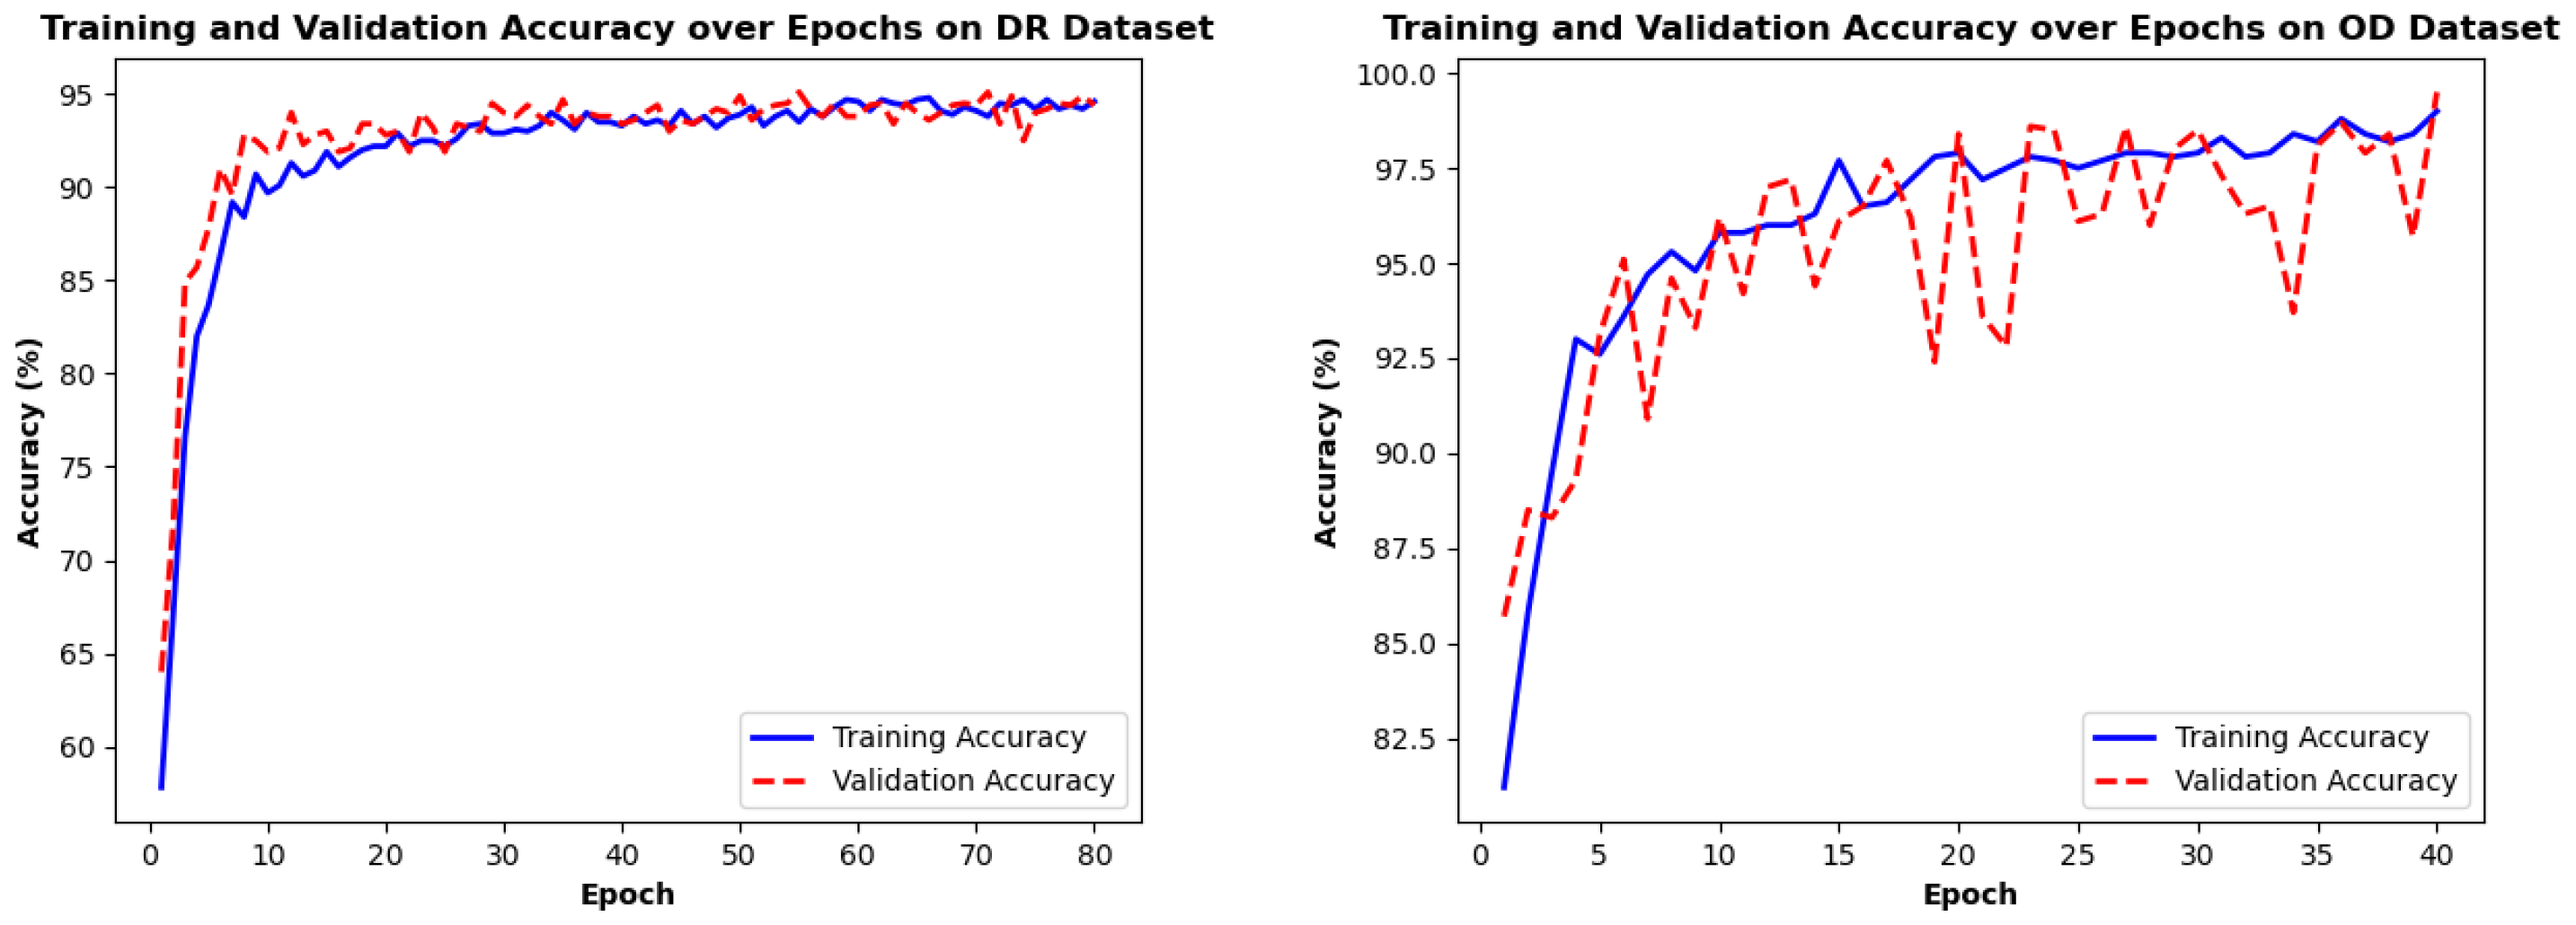
As shown in Figure 5, training accuracy surged to 95% within the first 10 epochs and 20 epochs of the two datasets and plateaued thereafter. Validation accuracy closely tracked training accuracy, maintaining a narrow gap, which verified effective generalization to unseen retinal images.
Fast initial convergence within the first 20 epochs was enabled by the efficient feature extraction of MobileNet V2 and attention mechanisms, while stable generalization was indicated by the minimal gap between training and validation metrics, suggesting no severe overfitting. Additionally, convergence saturation observed post—epoch 50 implied that 50–60 epochs sufficed for model convergence.

4.5. Training Time Efficiency Analysis

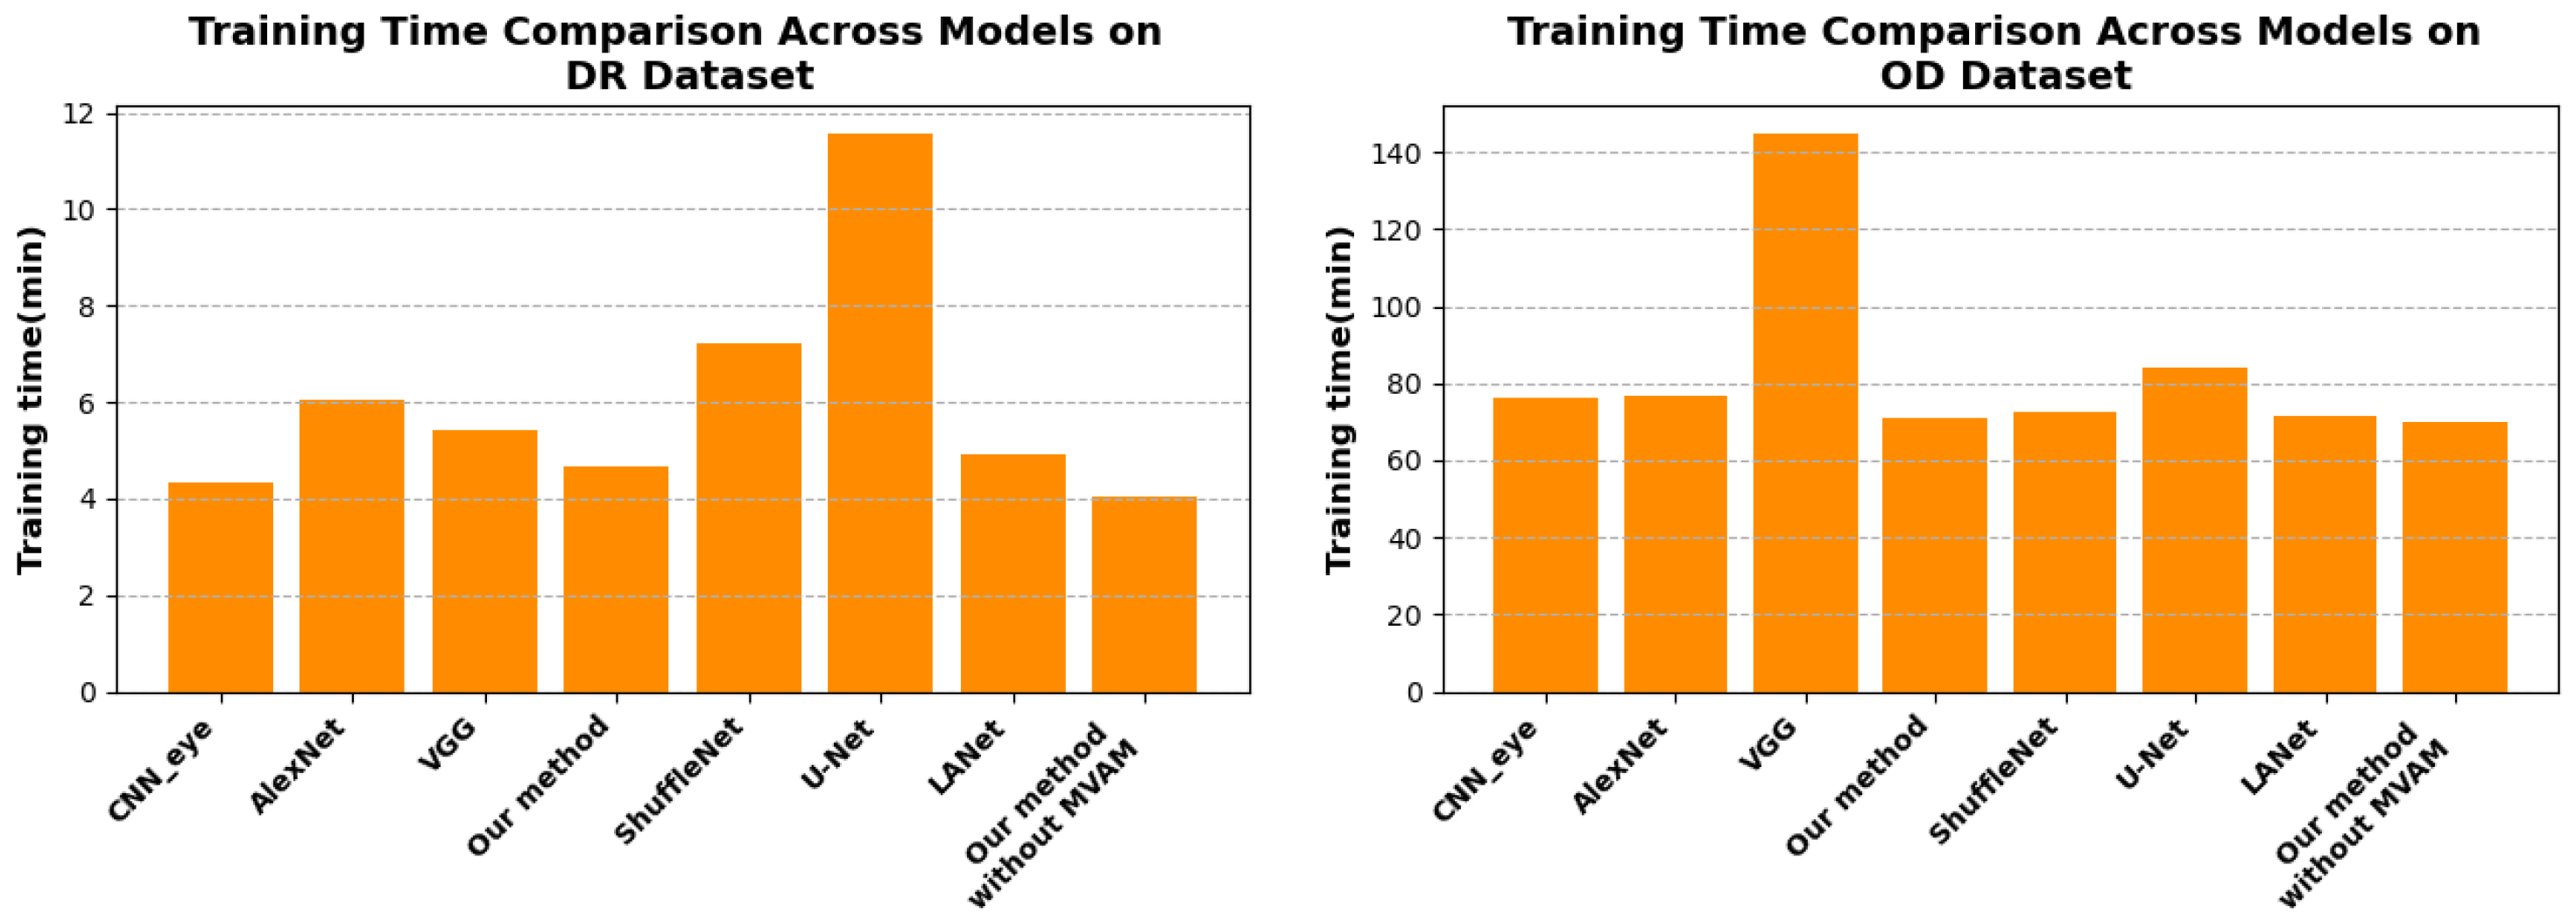
The comparative analysis of training time (visualized in Figure 6) further validates the efficiency advantage of our proposed method. In terms of total training time, our model requires only 5 min, which is significantly shorter than most baseline models. For instance, the CNN-Eye model takes 5.5 min, and the U-Net model consumes 15 min. Even the relatively lightweight ShuffleNet model (12 min) exceeds our method in total training time. For the first dataset, which is relatively small, a lightweight version of VGG is employed. For the second dataset, which has a larger number of images with greater dimensions, the original version of VGG is utilized. This study adopts a classification variant of the U-Net architecture, which retains U-Net’s core “encoder–decoder + skip connection” framework while optimizing for classification tasks. The original U-Net is a segmentation model that outputs feature maps with the same spatial dimensions as the input for pixel-level prediction; in contrast, this variant is designed for classification and outputs 1D class vectors matching the number of target categories.
In practical clinical application scenarios, where rapid model development and deployment are crucial for large-scale diabetic retinopathy screening, our method’s time efficiency can significantly reduce the overall workflow duration. This advantage not only accelerates the iteration cycle of model optimization but also lowers the computational resource consumption, making it more feasible for integration into real-world diagnostic systems with limited hardware resources.
The training time analysis confirms that our method achieves a favorable balance between accuracy and efficiency. Its superior time-saving performance positions it as a more practical solution for time-sensitive medical imaging tasks.

4.6. Ablation Experiments

Ablation experiments were conducted to quantify the contribution of key components in the proposed framework. We evaluated three critical modules: depthwise separable convolution, multi-view attention mechanism, and the MobileNet V2 backbone. All experiments retained the same training pipeline, dataset splits, and evaluation metrics for consistency. Quantitative results are summarized in Table 6 and Table 7.
Removing MVAM (without MVAM) causes a consistent drop in metrics (e.g., the F1-score reduces by 3%). This validates MVAM’s role in enhancing feature discriminability by focusing on multi-scale semantic regions, critical for refining representations in retinal image analysis. The Without Depthwise Separable Convolution variant shows marginal performance degradation compared to our method but outperforms models missing MVAM or MobileNet V2. Depthwise separable convolution optimizes early-stage feature extraction with reduced computational cost, though its influence is secondary to MVAM. Replacing the MobileNet V2 block leads to the largest performance decline (e.g., accuracy drops by 4%). This underscores MobileNet V2’s efficiency in learning hierarchical features, providing a robust backbone for downstream modules like MVAM.
These results confirm that each component contributes to the framework’s performance. The full integration in our method achieves optimal results, validating the modular design’s rationality for diabetic retinopathy diagnosis tasks.

5. Discussion

Despite our proposed method achieving robust performance in DR diagnosis across both the DR dataset and OD dataset, several limitations should be acknowledged to inform future research directions.
Firstly, the representativeness of the datasets used in this study presents a key constraint. While the diabetic retinopathy dataset and ocular disease dataset encompass diverse imaging conditions, the underrepresentation of rare DR lesion subtypes (e.g., atypical exudate patterns or uncommon microaneurysm distributions) may restrict the model’s generalization to such cases. This aligns with clinical realities, where rare DR subtypes constitute a small proportion of clinical cases and are challenging to annotate due to their scarcity, potentially limiting the model’s applicability in complex real-world screening scenarios. Expanding the datasets to include more diverse rare lesions through multi-center collaborations could enhance the model’s universality.
Secondly, the model’s sensitivity to ultra-early microlesions requires further optimization. Although the multi-view attention mechanism (MVAM) enhances the detection of subtle structures like microaneurysms via multi-scale feature fusion (3 × 3 and 5 × 5 convolutions) and Gabor texture analysis, extremely tiny microaneurysms may still be missed. This limitation arises from the weak feature signals of such lesions, which are easily overshadowed by normal vascular textures, combined with inherent image noise that reduces the signal-to-noise ratio. Refining the MVAM’s spatial attention weights to prioritize high-resolution local regions could improve detection of these ultra-tiny features.
Thirdly, the model’s performance is contingent on input image quality and imaging consistency across both datasets. Variations in fundus camera specifications, illumination conditions, or patient motion artifacts may degrade feature extraction accuracy, particularly for low-contrast lesions. While data augmentation (e.g., random rotations and horizontal/vertical flips) was employed to enhance robustness, integrating image preprocessing modules tailored to quality assessment and correction could further strengthen the model’s resilience to such variations.
To address these limitations, future work will focus on leveraging federated learning to aggregate multi-institutional data, thereby enriching rare lesion samples in both datasets without compromising patient privacy. Additionally, incorporating 3D OCT angiography data to complement 2D fundus images could provide depth information that aids in distinguishing ultra-tiny lesions from normal vasculature. These advancements are expected to further advance DR screening toward greater intelligence and precision.

6. Conclusions

This study proposes a novel method integrating depthwise separable convolutions and a multi-view attention mechanism (MVAM) for accurate and efficient diabetic retinopathy (DR) diagnosis. By combining multi-scale feature fusion, Gabor texture analysis, and dual-channel attention, the framework addresses key challenges in detecting subtle early lesions and balancing accuracy with computational efficiency. Experimental results on the DR dataset (2848 images) and OD dataset (6112 images) demonstrate its superiority: it achieves 0.9697 accuracy on the DR dataset and 0.9669 on the OD dataset, outperforming models like U-Net and LANet by over 1 percentage point. With a training time of only 5 min (half that of U-Net and VGG), the lightweight design enables edge deployment. This work advances AI-based medical imaging diagnostics, supporting improved global access to DR screening, with future work focusing on leveraging federated learning to enrich rare lesion samples in both datasets and incorporating 3D OCT angiography data to further enhance diagnostic precision.

Author Contributions

Conceptualization, Q.Y. and Y.W.; methodology, Q.Y. and Y.W.; software, Y.W.; validation, Y.W., F.L., and Q.Y.; formal analysis, Z.W.; writing—original draft preparation, Y.W.; writing—review and editing, Q.Y. and F.L.; visualization, Y.W. and Q.Y.; supervision, Z.W. and Q.Y.; funding acquisition, Q.Y. All authors have read and agreed to the published version of the manuscript.

Funding

This research was funded by the R&D Program of Beijing Municipal Education Commission, grant number SM202410038001.

Institutional Review Board Statement

Not applicable.

Informed Consent Statement

Not applicable.

Data Availability Statement

Publicly available datasets were used in this study. The DR dataset can be found at: https://www.kaggle.com/datasets/pkdarabi/diagnosis-of-diabetic-retinopathy (accessed on 16 August 2025), and the OD dataset can be found at: https://www.kaggle.com/datasets/andrewmvd/ocular-disease-recognition-odir5k (accessed on 16 August 2025).

Acknowledgments

We would like to express our gratitude to those who contributed to the completion of this research and the associate editor and the reviewers for their useful feedback that improved this paper.

Conflicts of Interest

The authors declare no conflicts of interest.

References

  1. Chen, Q.; Sun, X.; Zhang, N.; Cao, Y.; Liu, B. Mini Lesions Detection on Diabetic Retinopathy Images via Large Scale CNN Features. In Proceedings of the IEEE 31st International Conference on Tools with Artificial Intelligence (ICTAI), Portland, OR, USA, 4–6 November 2019. [Google Scholar] [CrossRef]
  2. Tânia Melo, T.; Mendonça, A.M.; Campilho, A. Microaneurysm detection in color eye fundus images for diabetic retinopathy screening. Comput. Biol. Med. 2020, 126, 103995. [Google Scholar] [CrossRef] [PubMed]
  3. Liu, C.; Peng, K.; Peng, Z.; Zhang, X. MSFF-UNet: Image segmentation in colorectal glands using an encoder-decoder U-shaped architecture with multi-scale feature fusion. Multimed. Tools Appl. 2023, 83, 42681–42701. [Google Scholar] [CrossRef]
  4. Carrera, E.; González, A.; Carrera, R. Automated detection of diabetic retinopathy using SVM. In Proceedings of the IEEE XXIV International Conference on Electronics, Electrical Engineering and Computing (INTERCON), Cusco, Peru, 15–18 August 2017. [Google Scholar]
  5. Gulshan, V.; Peng, L.; Coram, M.; Stumpe, M.C.; Wu, D.; Narayanaswamy, A.; Venugopalan, S.; Widner, K.; Madams, T.; Cuadros, J.; et al. Development and Validation of a Deep Learning Algorithm for Detection of Diabetic Retinopathy in Retinal Fundus Photographs. JAMA 2016, 316, 2402–2410. [Google Scholar] [CrossRef]
  6. Gayathri, S.; Gopi, V.P.; Palanisamy, P. A lightweight CNN for Diabetic Retinopathy classification from fundus images. Biomed. Signal Process. Control 2020, 62, 102115. [Google Scholar]
  7. Bilal, A.; Imran, A.; Baig, T.; Liu, X.; Long, H.; Alzahrani, A.; Shafiq, M. Improved Support Vector Machine based on CNN-SVD for vision-threatening diabetic retinopathy detection and classification. PLoS ONE 2024, 19, e0295951. [Google Scholar] [CrossRef]
  8. Ting, D.; Cheung, C.; Lim, G.; Tan, G.; Quang, N.; Gan, A.; Hamzah, H.; Garcia-Franco, R.; Yeo, I.; Lee, S.; et al. Development and Validation of a Deep Learning System for Diabetic Retinopathy and Related Eye Diseases Using Retinal Images from Multiethnic Populations with Diabetes. J. Am. Med. Assoc. 2017, 318, 2211–2223. [Google Scholar] [CrossRef]
  9. Thomas, N.; Jerome, S. Diabetic retinopathy detection using EADBSC and improved dilated ensemble CNN-based classification. Multimed. Tools Appl. 2024, 83, 33573–33595. [Google Scholar] [CrossRef]
  10. Mukherjee, N.; Sengupta, S. A Hybrid CNN Model for Deep Feature Extraction for Diabetic Retinopathy Detection and Gradation. J. Circuits. Syst. Comput. 2023, 23, 2350036. [Google Scholar] [CrossRef]
  11. Sravya, V.S.; Srinivasu, P.N.; Shafi, J.; Hołubowski, W.; Zielonka, A. Advanced Diabetic Retinopathy Detection with the R–CNN: A Unified Visual Health Solution. Int. J. Appl. Math. Comput. Sci. 2024, 34, 661–678. [Google Scholar] [CrossRef]
  12. Yasashvini, R.; Vergin Raja Sarobin, M.; Panjanathan, R.; Graceline Jasmine, S.; Jani Anbarasi, L. Diabetic Retinopathy Classification Using CNN and Hybrid Deep Convolutional Neural Networks. Symmetry 2022, 14, 1932. [Google Scholar] [CrossRef]
  13. Ahamed Gani, V.K.U.; Shanmugasundaram, N. Cheetah optimized CNN: A bio-inspired neural network for automated diabetic retinopathy detection. AIP Adv. 2025, 15, 055314. [Google Scholar] [CrossRef]
  14. Sundar, S.; Sumathy, S. Classification of Diabetic Retinopathy Disease Levels by Extracting Topological Features Using Graph Neural Networks. IEEE Access 2023, 11, 51435–51444. [Google Scholar] [CrossRef]
  15. Sarhan, M.H.; Albarqouni, S.; Yigitsoy, M.; Navab, N.; Eslami, A. Multi-scale Microaneurysms Segmentation Using Embedding Triplet Loss. Lect. Notes Comput. Sci. 2019, 11764, 174–182. [Google Scholar] [CrossRef]
  16. Madarapu, S.; Ari, S.; Mahapatra, K. A multi-resolution convolutional attention network for efficient diabetic retinopathy classification. Comput. Electr. Eng. 2024, 117, 109243. [Google Scholar] [CrossRef]
  17. Zhang, K.; Zuo, W.; Chen, Y.; Meng, D.; Zhang, L. Beyond a Gaussian Denoiser: Residual Learning of Deep CNN for Image Denoising. IEEE Trans. Image Process. 2017, 26, 3142–3155. [Google Scholar] [CrossRef]
  18. Raghavendra, U.; Fujita, H.; Bhandary, S.; Gudigar, A.; Hong, T.; Acharya, U. Deep convolution neural network for accurate diagnosis of glaucoma using digital fundus images. Inf. Sci. 2018, 441, 41–49. [Google Scholar] [CrossRef]
  19. Ding, C.; Li, R.; Zheng, Z.; Chen, Y.; Wen, D.; Zhang, L.; Wei, W.; Zhang, Y. Multiple Multi-Scale Neural Networks Knowledge Transfer and Integration for Accurate Pixel-Level Retinal Blood Vessel Segmentation. Appl. Sci. 2021, 11, 11907. [Google Scholar] [CrossRef]
  20. Zhang, H.; Ni, W.; Luo, Y.; Feng, Y.; Song, R.; Wang, X. TUnet-LBF: Retinal fundus image fine segmentation model based on transformer Unet network and LBF. Comput. Biol. Med. 2023, 159, 106937. [Google Scholar] [CrossRef]
  21. Levine, E.S.; Moult, E.M.; Greig, E.C.; Zhao, Y.; Pramil, V.; Gendelman, I.; Alibhai, A.Y.; Baumal, C.R.; Witkin, A.J.; Duker, J.S.; et al. Multiscale Correlation of Microvascular Changes on Optical Coherence Tomography Angiography With Retinal Sensitivity in Diabetic Retinopathy. Retina 2022, 42, 357–368. [Google Scholar] [CrossRef]
  22. Nandhini Selvaganapathy, N.; Siddhan, S.; Sundararajan, P.; Balasundaram, S. Automatic screening of retinal lesions for detecting diabetic retinopathy using adaptive multiscale MobileNet with abnormality segmentation from public dataset. Network 2024, 1–33. [Google Scholar] [CrossRef]
  23. Hwang, T.S.; Gao, S.S.; Liu, L.; Lauer, A.K.; Bailey, S.T.; Flaxel, C.J.; Wilson, D.J.; Huang, D.; Jia, Y. Automated Quantification of Capillary Nonperfusion Using Optical Coherence Tomography Angiography in Diabetic Retinopathy. JAMA Ophthalmol. 2016, 134, 367–373. [Google Scholar] [CrossRef] [PubMed]
  24. Bidwai, P.; Gite, S.; Pahuja, N.; Pahuja, K.; Kotecha, K.; Jain, N.; Ramanna, S. Multimodal image fusion for the detection of diabetic retinopathy using optimized explainable AI-based Light GBM classifier. Inf. Fusion 2024, 111, 102526. [Google Scholar] [CrossRef]
  25. Bidwai, P.; Gite, S.; Gupta, A.; Pahuja, K.; Kotecha, K. Multimodal dataset using OCTA and fundus images for the study of diabetic retinopathy. Data Brief 2024, 52, 110033. [Google Scholar] [CrossRef] [PubMed]
  26. El Habib Daho, M.; Li, Y.; Zeghlache, R.; Atse, Y.C.; Le Boité, H.; Bonnin, S.; Cosette, D.; Deman, P.; Borderie, L.; Lepicard, C.; et al. Improved Automatic Diabetic Retinopathy Severity Classification Using Deep Multimodal Fusion of UWF-CFP and OCTA Images. In Proceedings of the Ophthalmic Medical Image Analysis (OMIA 2023), Vancouver, BC, Canada, 12 October 2023; Springer: Cham, Switzerland, 2023; pp. 11–20. [Google Scholar] [CrossRef]
  27. Corso, R.; Khan, F.; Yezzi, A.; Comelli, A. Features for Active Contour and Surface Segmentation: A Review. Arch. Comput. Methods Eng. 2025; Early Access. [Google Scholar] [CrossRef]
  28. Wang, B.; Li, B.; Li, L.; Zhang, Z.; Qiu, S.; Wang, H. Object Recognition Using Shape and Texture Tactile Information: A Fusion Network Based on Data Augmentation and Attention Mechanism. IEEE Trans. Haptics 2024, 18, 136–150. [Google Scholar] [CrossRef]
  29. Hervella, A.S.; Rouco, J.; Novo, J.; Ortega, M. Multimodal image encoding pre-training for diabetic retinopathy grading. Comput. Biol. Med. 2022, 143, 105302. [Google Scholar] [CrossRef]
  30. Dai, Y.; Gao, Y.; Liu, F. TransMed: Transformers Advance Multi-Modal Medical Image Classification. Diagnostics 2021, 11, 1384. [Google Scholar] [CrossRef]
  31. Ma, G.; Qiu, X.; Tan, X. DMFusion: A dual-branch multi-scale feature fusion network for medical multi-modal image fusion. Biomed. Signal Process. Control 2025, 105, 107572. [Google Scholar] [CrossRef]
  32. Li, J.; Hu, Q.; Ai, M. RIFT: Multi-Modal Image Matching Based on Radiation-Variation Insensitive Feature Transform. IEEE Trans. Image Process. 2019, 29, 3296–3310. [Google Scholar] [CrossRef]
  33. Zhou, T.; Fu, H.; Chen, G.; Shen, J.; Shao, L. Hi-Net: Hybrid-Fusion Network for Multi-Modal MR Image Synthesis. IEEE Trans. Med. Imaging 2020, 39, 2772–2781. [Google Scholar] [CrossRef]
  34. Couturier, A.; Mané, V.; Bonnin, S.; Erginay, A.; Massin, P.; Gaudric, A.; Tadayoni, R. Capillary Plexus Anomalies in Diabetic Retinopathy on Optical Coherence Tomography Angiography. Retina 2015, 35, 2384–2391. [Google Scholar] [CrossRef] [PubMed]
  35. Akram, M.U.; Khalid, S.; Tariq, A.; Khan, S.A.; Azam, F. Detection and classification of retinal lesions for grading of diabetic retinopathy. Comput. Biol. Med. 2014, 45, 161–171. [Google Scholar] [CrossRef]
  36. Shanthi, T.; Sabeenian, R.S. Modified Alexnet architecture for classification of diabetic retinopathy images. Comput. Electr. Eng. 2019, 76, 56–64. [Google Scholar] [CrossRef]
  37. Roychowdhury, S.; Koozekanani, D.D.; Parhi, K.K. DREAM: Diabetic Retinopathy Analysis Using Machine Learning. IEEE J. Biomed. Health Inform. 2014, 18, 1717–1728. [Google Scholar] [CrossRef] [PubMed]
  38. Guo, K.; Sui, L.; Qiu, J.; Yu, J.; Wang, J.; Yao, S. Angel-Eye: A Complete Design Flow for Mapping CNN Onto Embedded FPGA. IEEE Trans. Comput.-Aided Des. Integr. Circuits Syst. 2018, 37, 35–47. [Google Scholar] [CrossRef]
  39. Zhang, J.; Meng, Y.; Yu, X.; Bi, H.; Chen, Z.; Li, H. MBAB-YOLO: A Modified Lightweight Architecture for Real-Time Small Target Detection. IEEE Access 2023, 11, 78384–78401. [Google Scholar] [CrossRef]
  40. Li, H.; Li, J.; Wei, H.; Liu, Z.; Zhan, Z.; Ren, Q. Slim-neck by GSConv: A lightweight-design for real-time detector architectures. J. Real-Time Image Process. 2024, 21, 62. [Google Scholar] [CrossRef]
  41. Risso, M.; Burrello, A.; Conti, F.; Lamberti, L.; Chen, Y.; Benini, L. Lightweight Neural Architecture Search for Temporal Convolutional Networks at the Edge. IEEE Trans. Comput. 2023, 72, 744–758. [Google Scholar] [CrossRef]
  42. Wu, R.; Liu, B.; Fu, P.; Chen, H. An efficient lightweight CNN acceleration architecture for edge computing based-on FPGA. Appl. Intell. 2023, 53, 13867–13881. [Google Scholar] [CrossRef]
  43. Böhm, S.; Wirtz, G. PULCEO—A Novel Architecture for Universal and Lightweight Cloud-Edge Orchestration. In Proceedings of the 2023 IEEE International Conference on Service-Oriented System Engineering (SOSE), Athens, Greece, 17–20 July 2023. [Google Scholar] [CrossRef]
  44. Yang, W.; Chang, X.; Guo, X. ESFCU-Net: A Lightweight Hybrid Architecture Incorporating Self-Attention and Edge Enhancement Mechanisms for Enhanced Polyp Image Segmentation. Int. J. Imaging Syst. Technol. 2025, 35, e70026. [Google Scholar] [CrossRef]
  45. Jiang, Q.; Zheng, L.; Zhou, Y.; Liu, H.; Kong, Q.; Zhang, Y. Efficient On-Orbit Remote Sensing Imagery Processing via Satellite Edge Computing Resource Scheduling Optimization. IEEE Trans. Geosci. Remote Sens. 2025, 63, 1000519. [Google Scholar] [CrossRef]
  46. Dong, S.; Xia, Y.; Kamruzzaman, J. Quantum Particle Swarm Optimization for Task Offloading in Mobile Edge Computing. IEEE Trans. Ind. Inform. 2023, 19, 9113–9122. [Google Scholar] [CrossRef]
  47. Li, T.; Huang, Y. Joint Optimization of Computing Offload Strategy and Resource Allocation in Mobile Edge Computing. In Proceedings of the Computer Supported Cooperative Work and Social Computing (ChineseCSCW 2024), Hohhot, China, 11–13 July 2024; Volume 2344, pp. 3–17. [Google Scholar] [CrossRef]
  48. Darabi, P.K. Diagnosis of Diabetic Retinopathy Dataset. 2024. Available online: https://www.researchgate.net/publication/382264856_Diagnosis_of_Diabetic_Retinopathy (accessed on 16 August 2025).
  49. Pkdarabi. Diagnosis of Diabetic Retinopathy. 2024. Available online: https://www.kaggle.com/datasets/pkdarabi/diagnosis-of-diabetic-retinopathy (accessed on 16 August 2025).
  50. Abhinav099802. Eye Disease Image Dataset—Mendeley. 2025. Available online: https://www.kaggle.com/datasets/abhinav099802/eye-disease-image-dataset (accessed on 16 August 2025).
  51. Xia, X.; Zhan, K.; Fang, Y.; Jiang, W.; Shen, F. Lesion-aware network for diabetic retinopathy diagnosis. Int. J. Imaging Syst. Technol. 2023, 33, 1914–1928. [Google Scholar] [CrossRef]
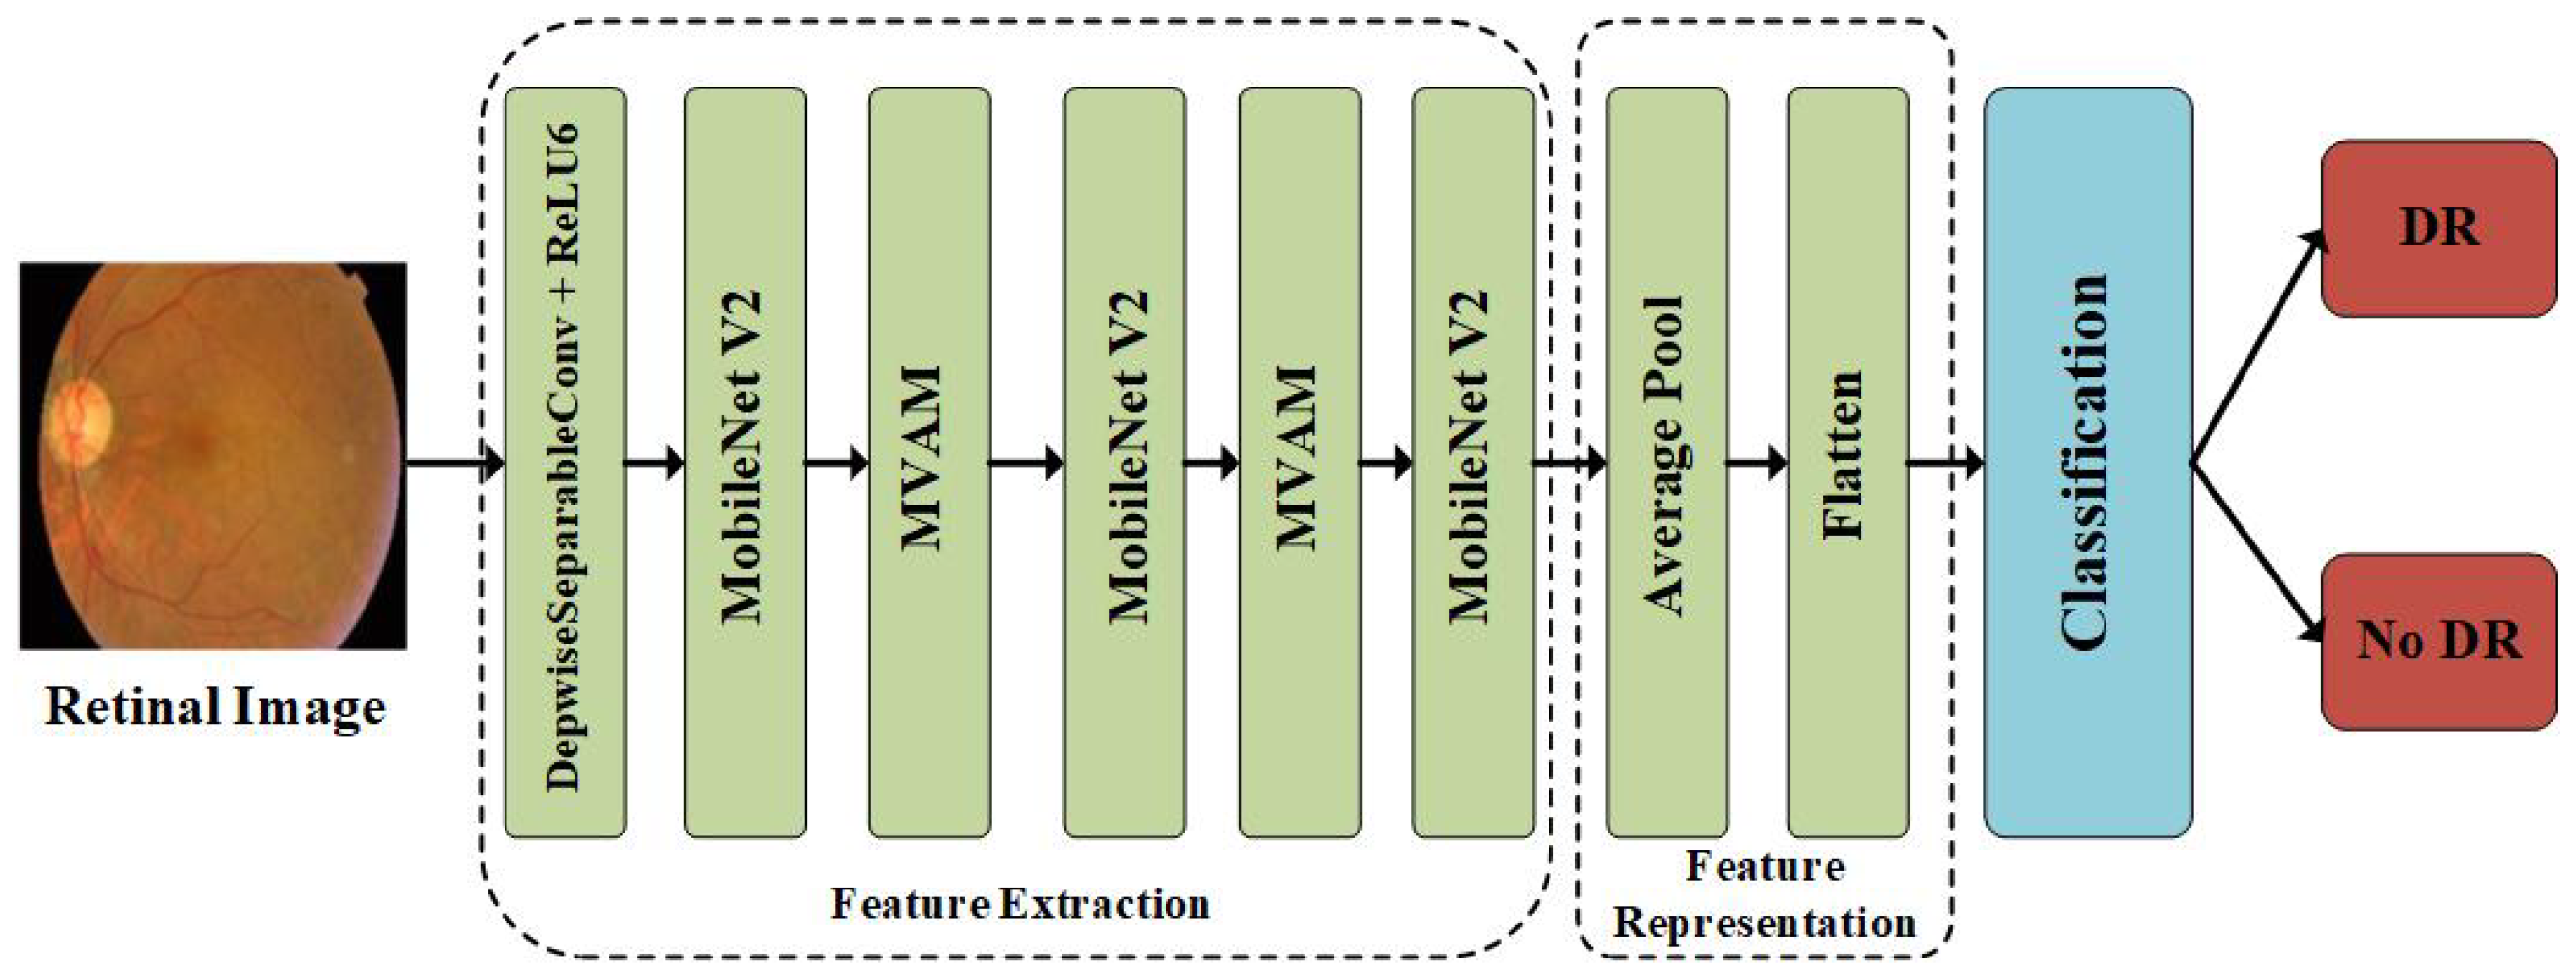
Figure 1. Overview of our method.
Applsci 15 09298 g001
Figure 2. Depthwise separable convolution layer.
Applsci 15 09298 g002
Figure 3. Framework of multi-view attention mechanism.
Applsci 15 09298 g003
Figure 4. Training and validation loss curves over epochs on DR dataset and OD dataset. The blue solid line represents the training loss, and the red dashed line represents the validation loss.
Applsci 15 09298 g004
Figure 5. Training and validation accuracy curves over epochs on DR dataset and OD dataset. The blue solid line represents the training accuracy, and the red dashed line represents the validation accuracy.
Applsci 15 09298 g005
Figure 6. Training time consumption between different methods on DR dataset and OD dataset.
Applsci 15 09298 g006
Table 1. Basic information on experimental datasets.
DatasetTotal SamplesDRNo_DR
DR dataset284814111437
OD dataset611234452667
Table 2. Training configurations for the proposed model on DR dataset.
Param. CategoryParam. NameValue/Setting
Training ProcessEpochs80
Batch Size32
OptimizerAdam (lr = 1 × 10 3 , wd = 1 × 10 4 )
LR SchedulerTypeReduceLROnPlateau
Factor/Patience0.5/20
Loss and DataLoss FunctionNLLLoss (reduction = “sum”)
Dataset SplitTrain:Val:Test = 7:2:1
DeviceComputing DeviceMPS (Priority)/CPU
Table 3. Training configurations for the proposed model on OD dataset.
Param. CategoryParam. NameValue/Setting
Training ProcessEpochs40
Batch Size32
OptimizerAdam (lr = 1 × 10 3 , wd = 1 × 10 4 )
LR SchedulerTypeReduceLROnPlateau
Factor/Patience0.5/20
Loss and DataLoss FunctionNLLLoss (reduction = “sum”)
Dataset SplitTrain:Val:Test = 7:2:1
DeviceComputing DeviceMPS (Priority)/CPU
Table 4. Comparison of different methods on DR dataset.
CNN_EyeAlexNetVGGU-NetShuffleNetLANetOur Method
Precision0.93550.94420.94020.95760.93510.96520.9696
Recall0.93480.94340.93900.95630.93490.94070.9698
F1-score0.93500.94370.93930.95660.93500.95280.9697
Accuracy0.93510.94770.93940.95670.93510.95240.9697
Table 5. Comparison of different methods on OD dataset.
CNN_EyeAlexNetVGG16U-NetShuffleNetLANetOur Method
Precision0.94260.95320.95240.95330.94180.95040.9662
Recall0.94490.95230.95470.95490.94170.99070.9686
F1-score0.94320.95270.95310.95390.94170.95430.9668
Accuracy0.94340.95290.95330.95410.94190.95620.9669
Table 6. Ablation experiments results on DR dataset.
PrecisionRecallF1-ScoreAccuracy
Without MVAM0.94020.93900.93930.9394
Without Depthwise Separable Convolution0.94450.94370.94360.9437
Without MobileNet V20.93080.93070.93070.9307
Our Method0.96960.96980.96970.9697
Table 7. Ablation experiments results on OD dataset.
PrecisionRecallF1-ScoreAccuracy
Without MVAM0.93560.93680.93530.9353
Without Depthwise Separable Convolution0.93430.93560.93500.9352
Without MobileNet V20.92260.92530.92140.9214
Our Method0.96620.96860.96680.9669
Disclaimer/Publisher’s Note: The statements, opinions and data contained in all publications are solely those of the individual author(s) and contributor(s) and not of MDPI and/or the editor(s). MDPI and/or the editor(s) disclaim responsibility for any injury to people or property resulting from any ideas, methods, instructions or products referred to in the content.