Article

AEDMA-NDMAI: Automatic Extraction and Daily Monitoring of Algal Blooms Using Normalized Difference MODIS Algae Index

by
Vikash Kumar Mishra
1,*,
James Falconer
1,
Amit Kumar Mishra
2,
Fred Nicolls
1 and
Stephen Paine
1
1
Department of Electrical Engineering, University of Cape Town, Cape Town 7700, South Africa
2
National Spectrum Center, Aberystwyth University, Aberystwyth SY23 3FL, UK
*
Author to whom correspondence should be addressed.
Appl. Sci. 2025, 15(17), 9275; https://doi.org/10.3390/app15179275
Submission received: 24 May 2025 / Revised: 30 June 2025 / Accepted: 3 July 2025 / Published: 23 August 2025

Abstract

Algal blooms are ecological phenomena with long-lasting effects on the ecosystem and on the climate. Often, they reduce the oxygen level underwater, creating adverse circumstances for aquatic species’ survival, development, and reproduction. In this article, the mapping of algal bloom incidents and their daily monitoring is automated using Python script and the Earthdata website. The automation is carried out in eight separate modules and then integrated. Test site dictionary, configuration, query data, download MODIS data, open image data, clip data, implementing a novel Normalized Difference MODIS Algae Index (NDMAI), and threshold are the eight modules used for automating the extraction and daily monitoring. This automation requires two inputs: firstly, the bounding box, i.e., lower left coordinate (LLC) and upper right coordinate (URC) of the test site, and secondly, the date range. In this article, eight test sites are used to extract algal bloom incidents, and a ninth test site is used for the extraction and daily monitoring, which are reported by the NASA Earth Observatory (NEO). The proposed framework automates the process of enhancing algal bloom features in MODIS imagery, and daily monitoring is successfully accomplished, and the results perfectly match the algal bloom region in the test sites reported by the NEO.

1. Introduction

The general term for any algae formation, whether microscopic, e.g., phytoplankton and cyanobacteria, or macroscopic, e.g., seagrass, is an algal bloom. Harmful algal blooms (HABs), red tides, water blooms, and algal mats or scums are other terms also used instead of algal bloom [1]. Algal blooms have three major categories, viz., cyanobacteria blooms, which are generally blue and green [1,2]; dinoflagellate blooms, also known as red tides, which are red, brown, and yellow [3]; and diatom blooms, which are brown in color [4]. There are several reasons for the rapid growth of algae in aquatic ecosystems [5]. The most significant factors are nutrient overloading [6], increased water temperature [7], and changes in water stratification [8]. Algal blooms, while appearing vibrant, can wreak havoc on aquatic ecosystems. Their rapid growth has consequences like oxygen depletion [9,10], food web disruption [10,11], and habitat alterations [12,13].
MODIS plays a crucial role in monitoring Earth activities. Since its temporal resolution is 1–2 days, it is useful for monitoring daily activities. MODIS is an essential instrument on board NASA’s Terra, which launched in 1999, whereas Aqua launched in 2002. It collects data on a global scale across 36 spectral bands, and at four spatial resolutions: 250 m, 500 m, 1 km, and 5.6 km [14]. These features make it popular for Earth observation, including ocean monitoring [15] and other applications like land cover and land change detection, fire detection and tracking, and natural disaster response [16].
MODIS leverages the power of multispectral data to observe Earth from space, collecting information across a range of wavelengths from visible (0.4 μm) to infrared (14.4 μm); MODIS provides a richer picture of the planet compared to sensors that capture data in a single band [17]. Due to this, discrimination of terrestrial features is easy and efficient in multispectral data, as the spectral signature varies with the variation in the electromagnetic spectrum [18]. Combining spectral bands with arithmetical operators has good effects in delineating and enhancing a feature by suppressing others in the imagery, better known as spectral indices [19]. With its 36 spectral bands, MODIS offers a rich platform for developing and applying various spectral indices.
Due to the sudden change in environmental factors (like temperature, salinity, wind speed, artificial activities like agriculture, and industrial and pathogenic waste), aquatic ecosystems can experience algal blooms. Algal blooms are a kind of aquatic pollutant that has several consequences for aquatic animals, ecosystems, the environment, and human beings, directly and indirectly. An early detection and alarm system is required to avoid and reduce their consequences. Since MODIS has daily global coverage, it has been utilized to fulfill the objective of researching the extraction of algal blooms and their daily monitoring.
This research article has significant novelties. First, the interaction with the Earthdata website is automated. Second, the data is downloaded automatically based on the central coordinates of the location and specific date range. Third, if the date range has N (N is greater than 0) days, the data will be downloaded for all days. Fourth, the study area will be automatically clipped based on the LLC and URC. Fifth, a novel index is proposed to enhance algal bloom features in the clipped imageries. From downloading data to algal bloom extraction, the output data will be saved automatically in the designated folders created while defining the test site attributes.

2. Materials and Methods

Specific platforms and resources are utilized in the automation process of algal bloom extraction and daily monitoring, as discussed in the sections below.

2.1. Web Resources and Software

The NASA Earth Observatory (NEO) studies incidents of algal bloom and reports them at https://earthobservatory.nasa.gov/, accessed on 14 May 2025; the test sites for this study were selected based on the NEO’s reports. The longitude and latitude of the LLC and URC were fetched from Google Maps. The script for the algal bloom extraction was written in Python 3.12 and used the libraries numpy, matplotlib, pandas, geopandas, earthaccess, geometry, rioxarray, xarray, rasterio, earthpy, and osgeo. The Python script interacts with the Earthdata website https://www.earthdata.nasa.gov/ (accessed on 14 May 2025) to deal with the MODIS images. The Earthdata website needs login credentials to download the images; this login credential is available in a file saved with the. netrc extension in the USER’S directory.

2.2. Data Set

MODIS releases data in different forms and formats. The temporal resolution also varies. The data that were considered in this study are MOD09GQ and MOD09GA. MOD09GQ—MODIS Surface Reflectance Daily Level 2 Global coverage and 250 m spatial resolution: This file contains two bands of spectral data centered at 645 nm (RED) and 858 nm (NIR). MOD09GA—MODIS Surface Reflectance Daily Level 2 Global coverage of 500 m spatial resolution: this file contains seven bands of spectral data, which are tabulated in Table 1.

2.3. Test Sites

During 2003 and 2023, numerous algal bloom incidents were reported on the NEO website. Nine sites were selected to test the automation process in this article. The details of the test sites and their LLC and URC are given in Table 2.
The images of the test sites and the highlighted regions of algal bloom incidents are reported on the NEO’s website [20,21,22,23,24,25,26,27]. A collage of images of the test site is shown in Figure 1.

2.4. Proposed Method for Automatic Extraction

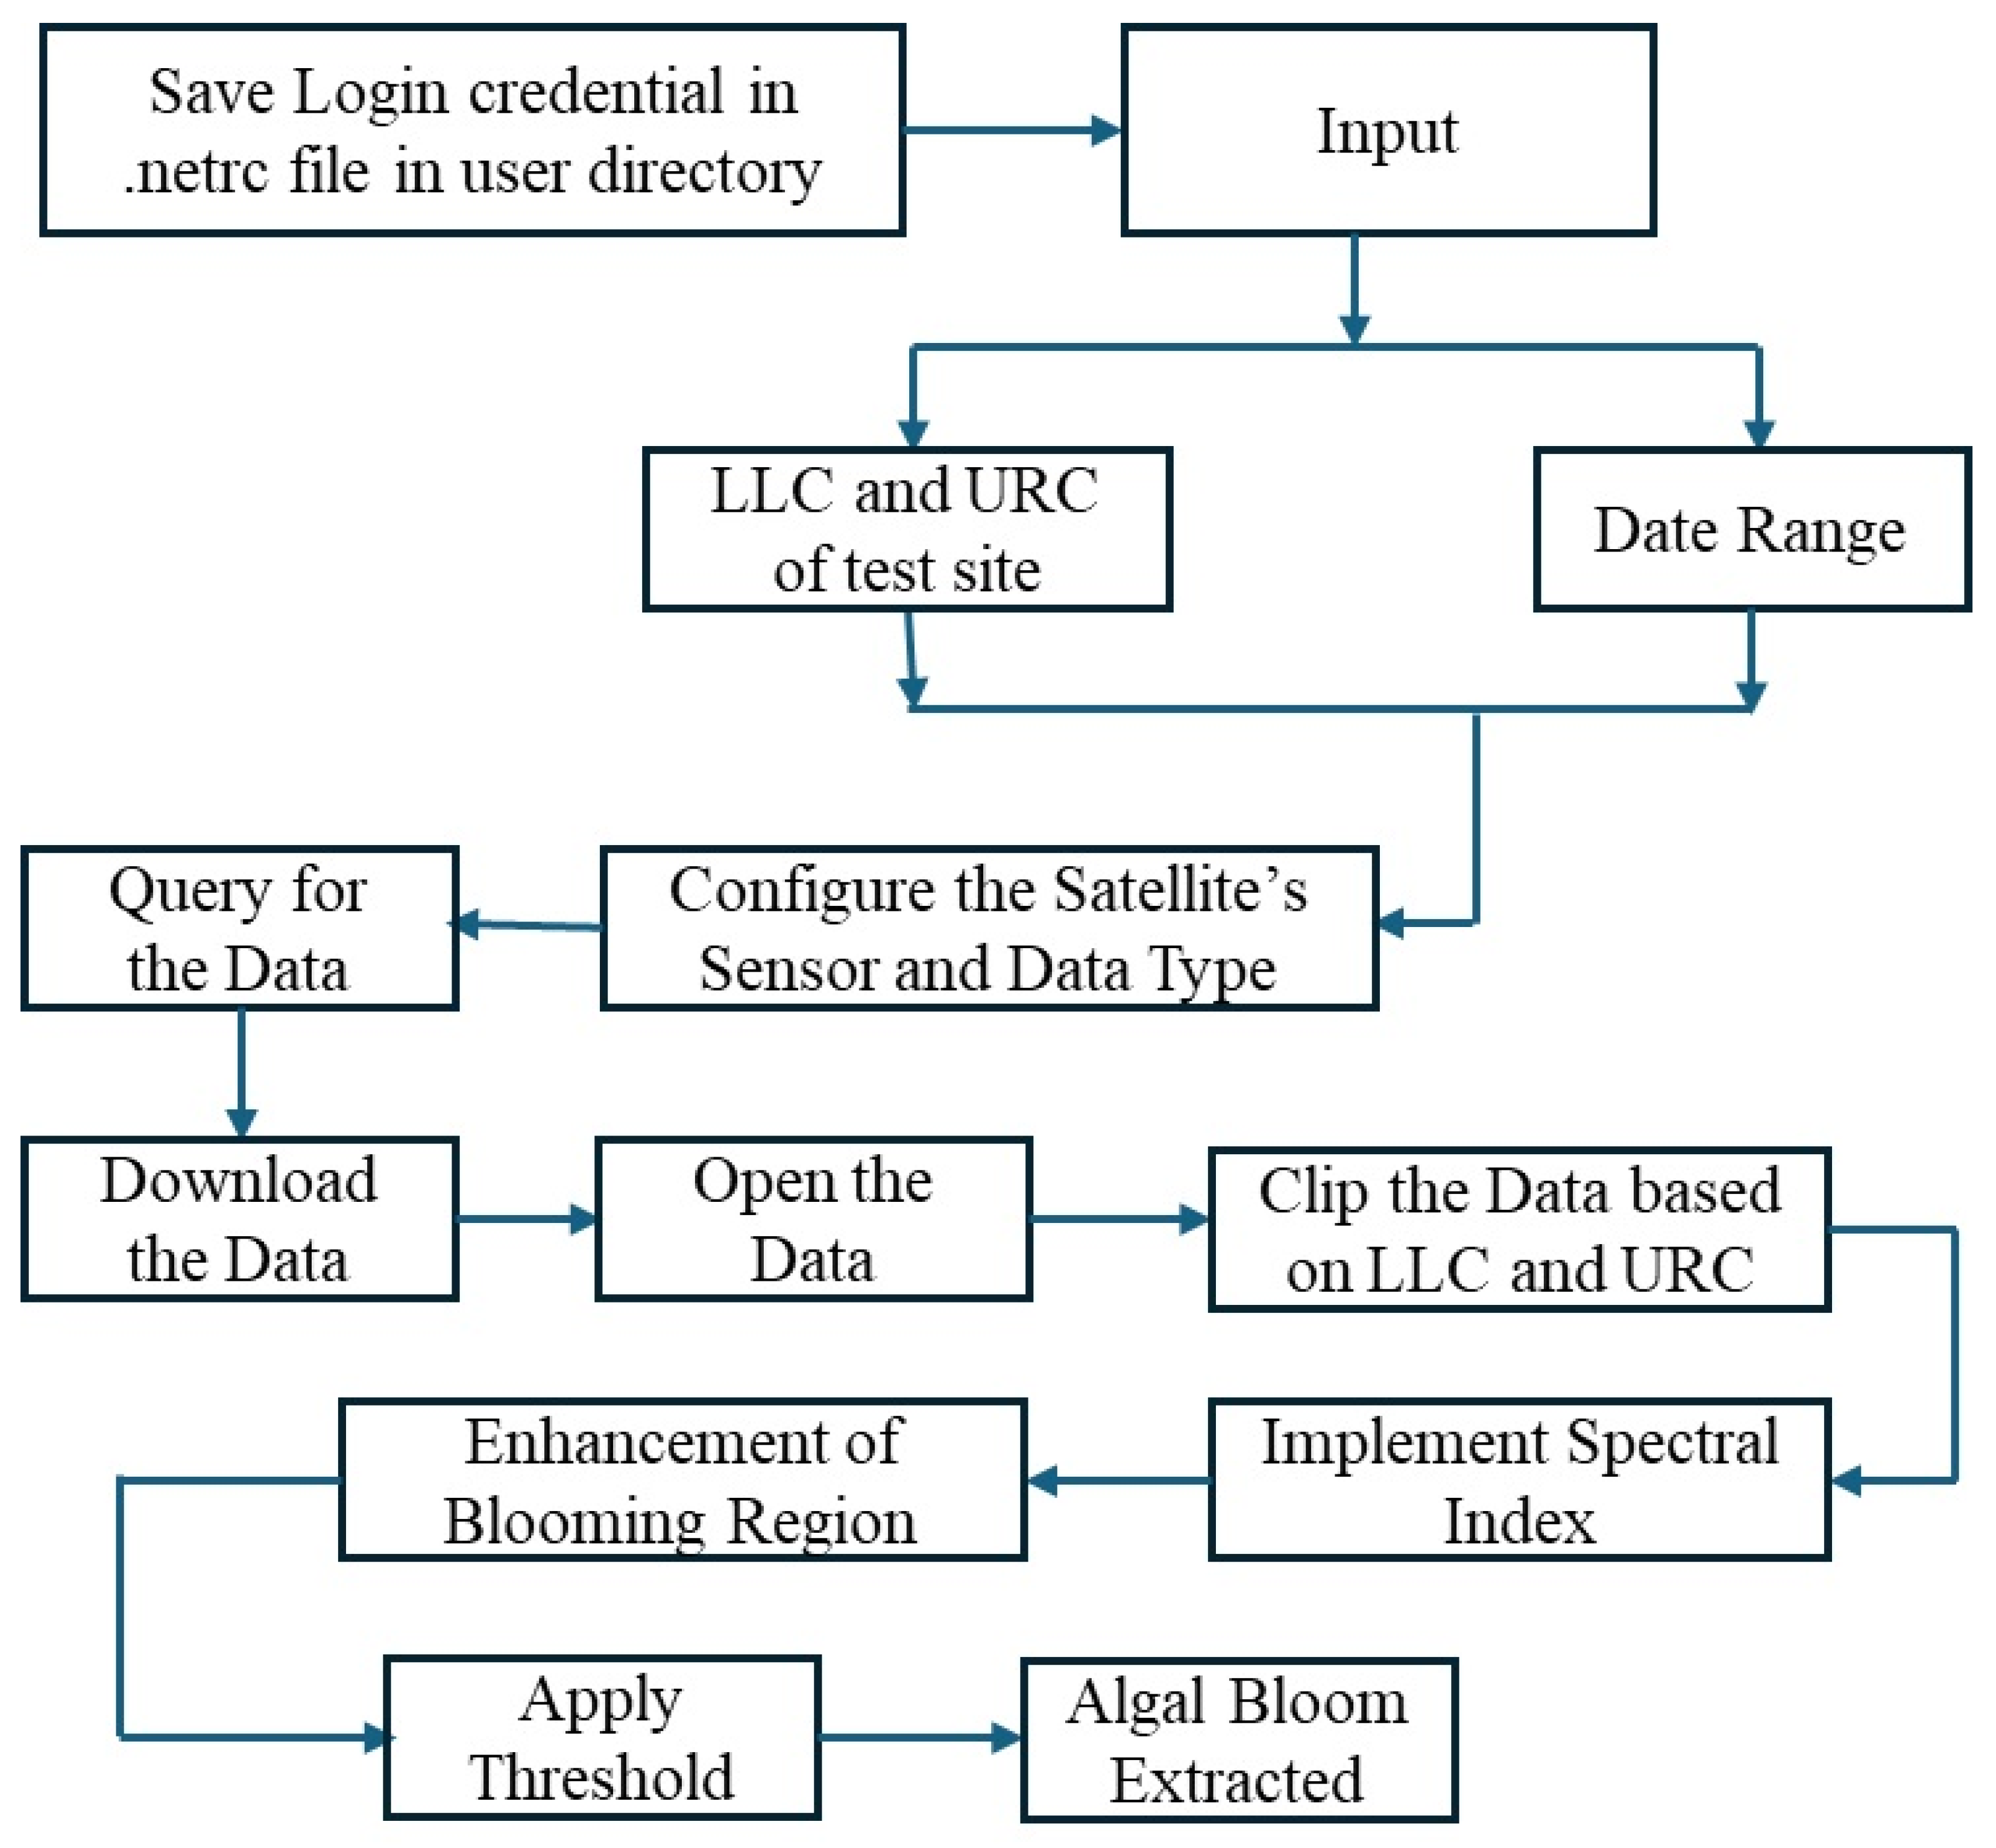
The automatic extraction of algal blooms and their daily monitoring using the Earthdata website were implemented in eight modules, depicted in Figure 2.
Module 1—Study Area (test_site_dict): This module deals with the study area and the period of algal bloom monitoring by maintaining a dictionary of all test sites. There can be more than one study area, so N defines the number of test sites. The date range defines the dates considered for the study; it can be one day or more than a day; the dates are inputted in the YYYY-MM-DD format. Next, a location name is required to create a folder in which to save the processed data. Finally, the LLC and URC of the study area are input to fetch the study area in one of the granules available in the website’s database.
Module 2—Configuration of Satellite Sensor (config): This module configures the satellite sensor’s name and the required data type. Since MODIS provides data at three spatial resolutions (1 km, 500 m, and 250 m), fetching the correct data from the correct sensor is of the utmost importance.
Module 3—Query Data (query_data): This module utilizes the “earthaccess” library for Python. The search\textunderscore data function requires four parameters: the type of resolution, coordinates of the study area, temporal dates, and cloud service.
Module 4—Downloading the Data (download_modis_data): Once the query module identifies one of the granules in the specified ranges of date and location, the download function from “earthaccess” is used to fetch the data with the data_links generated for the specific granules.
Module 5—Opening the Downloaded Image Data (open_img_data): The inbuilt libraries rioxarray and xarray from Python are used to deal with the raster data. The inbuilt functions in the libraries are utilized to read and write the band images of the downloaded imagery.
Module 6—Clipping the Study Area (clipped_dataset): A single granule includes a larger area. The geometry library is used to crop the image to the desired study area. The LLC and URC are used as a bounding box to define the study area.
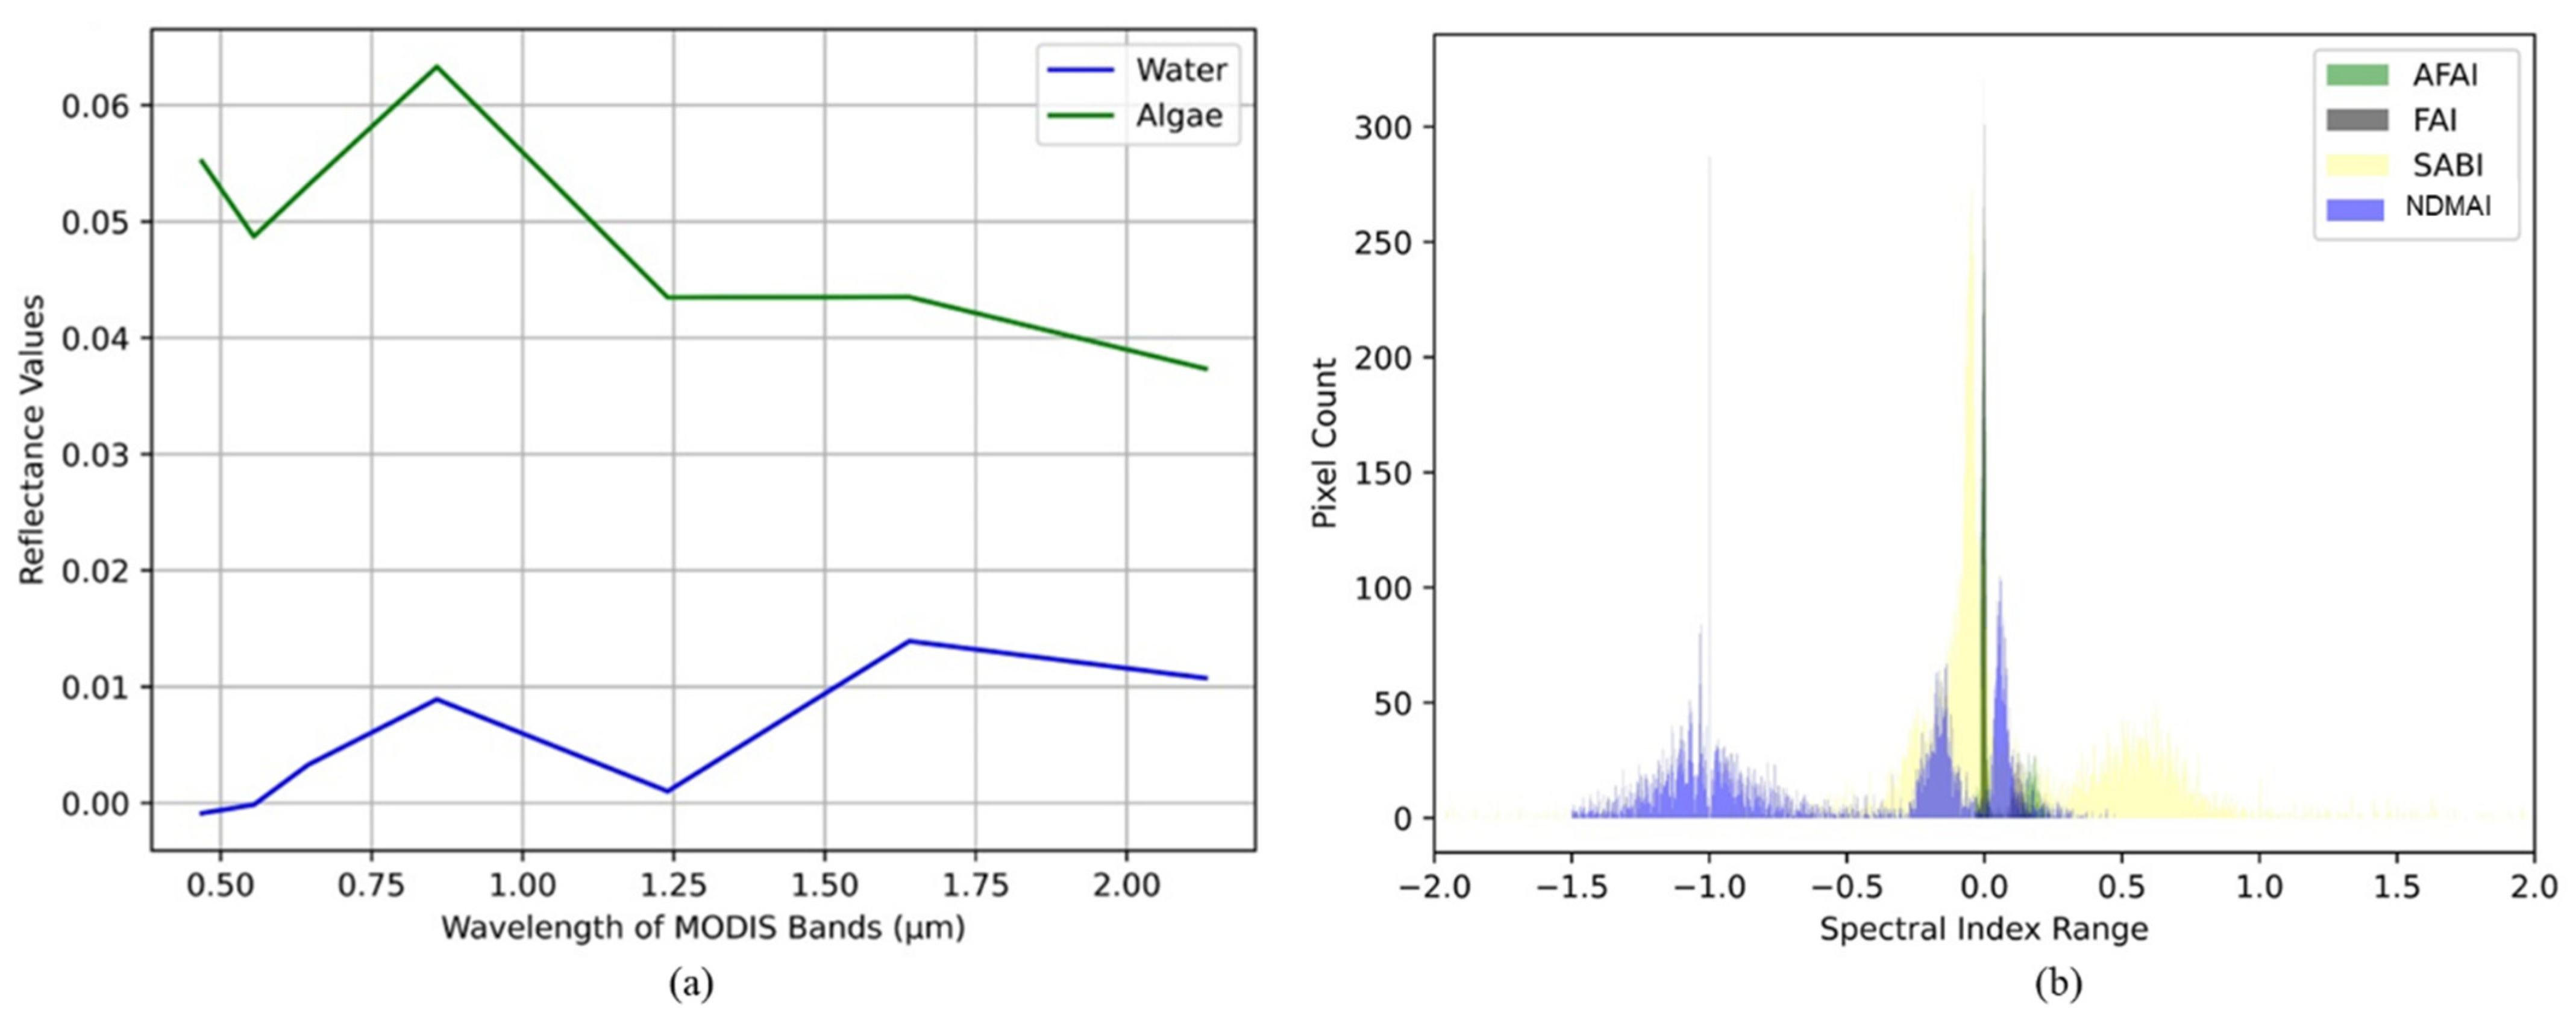
Module 7—Proposed Spectral Index for Algal Bloom: Spectral indices are applied to enhance the algal bloom in the water bodies. Both 500 m and 250 m spectral bands are analyzed and the spectral response curves are studied, as shown in Figure 3.
Due to band limitations and coarser resolution, different spectral indices are proposed for both data sets, termed Normalized Difference MODIS Algae Indices (NDMAIs), for the data sets at both 500 m and 250 m spatial resolutions. The SRC is analyzed, and the following observations are made:
i.
The spectral response is high in the VIS range and low in the SWIR range for algae, and vice versa for water.
ii.
The reflectance in NIR is higher than in VIS for algae and water,
iii.
The reflectance of the algae feature is lowest in SWIR2, whereas reflectance is comparatively high for the water feature.
The above facts compelled us to choose the NIR and SWIR2 bands; the difference between the two selected bands will give significantly positive values for algae features and negative values for water features. Consequently, this difference will enhance the feature of interest, i.e., algae, by suppressing the background, i.e., water. The NDMAI for 500 m resolution data is defined and implemented as mentioned in Equation (1):
N D M A I 500 = ( R N I R R S W I R 2 ) ( R N I R + R S W I R 2 )
The 250 m spatial resolution data give only two bands, red and NIR. The spectral index is defined and implemented through Equation (2).
N D M A I 250 = ( R R E D R N I R ) ( R R E D + R N I R )
Module 8—Threshold: The spectral index imagery is used to identify the threshold for the algal bloom features, and the enhanced blooming regions in the image are analyzed carefully to determine the range of the algal blooms. This range is then used to generate the threshold imagery.
The complete Python script for these modules has been uploaded to GitHub. The integration of the module provides a tool to download the MODIS data from Earthdata and process it for blooming region extraction and daily monitoring; the tool can be explored via the public access link https://github.com/JamesFalconer/modis_data_download_and_process_tool (accessed on 14 May 2025).

3. Results

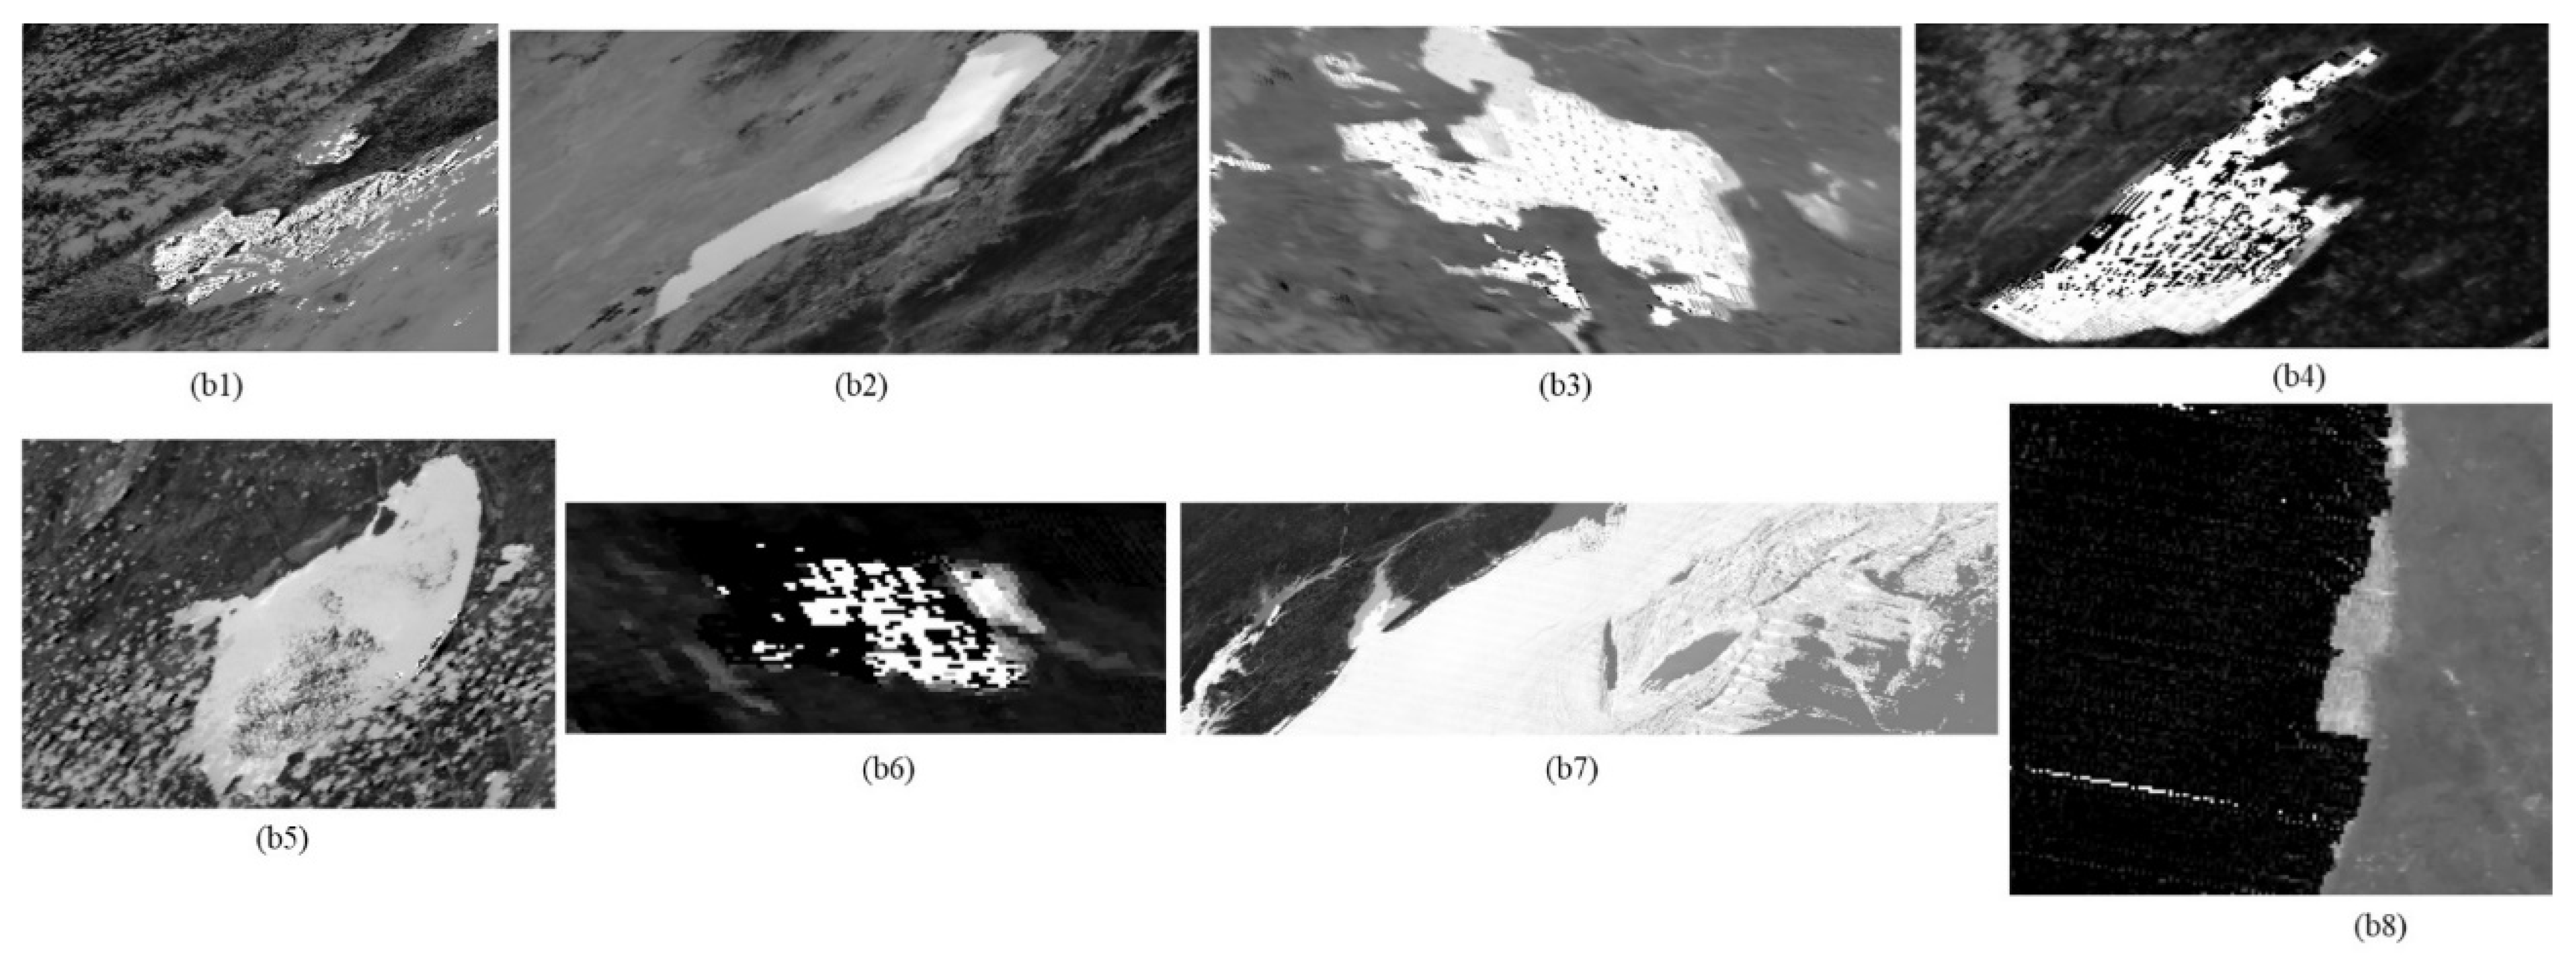
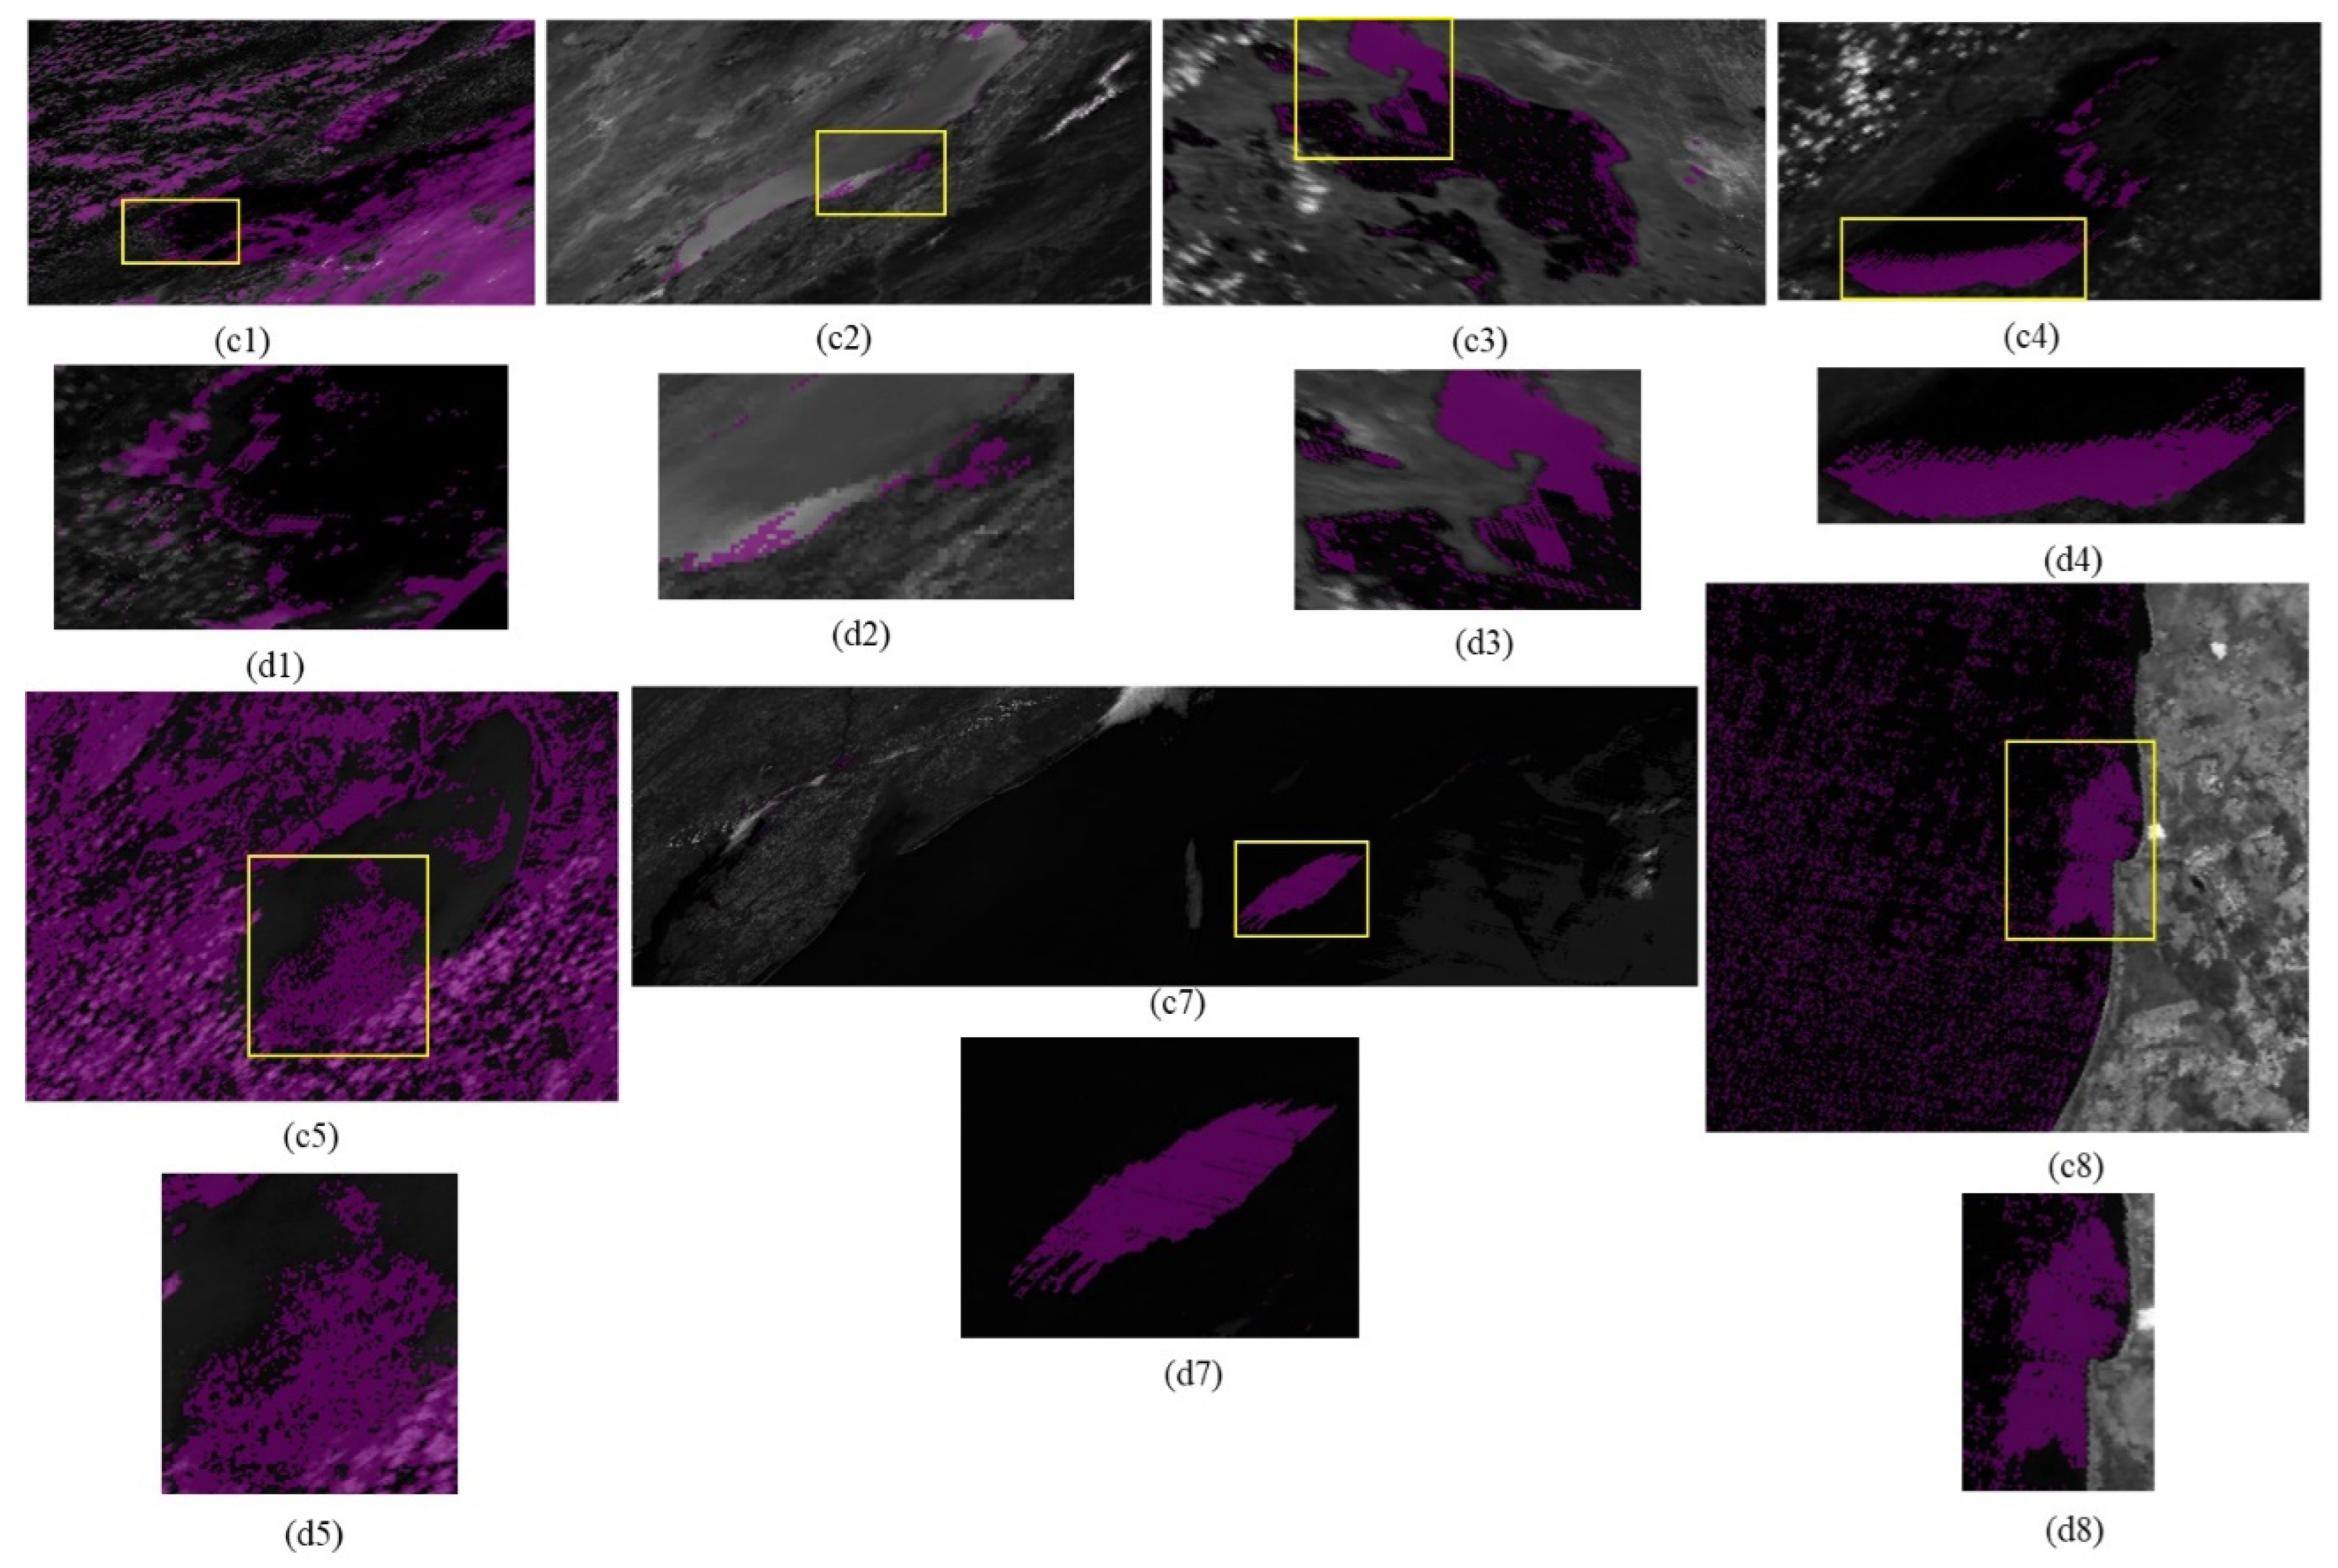
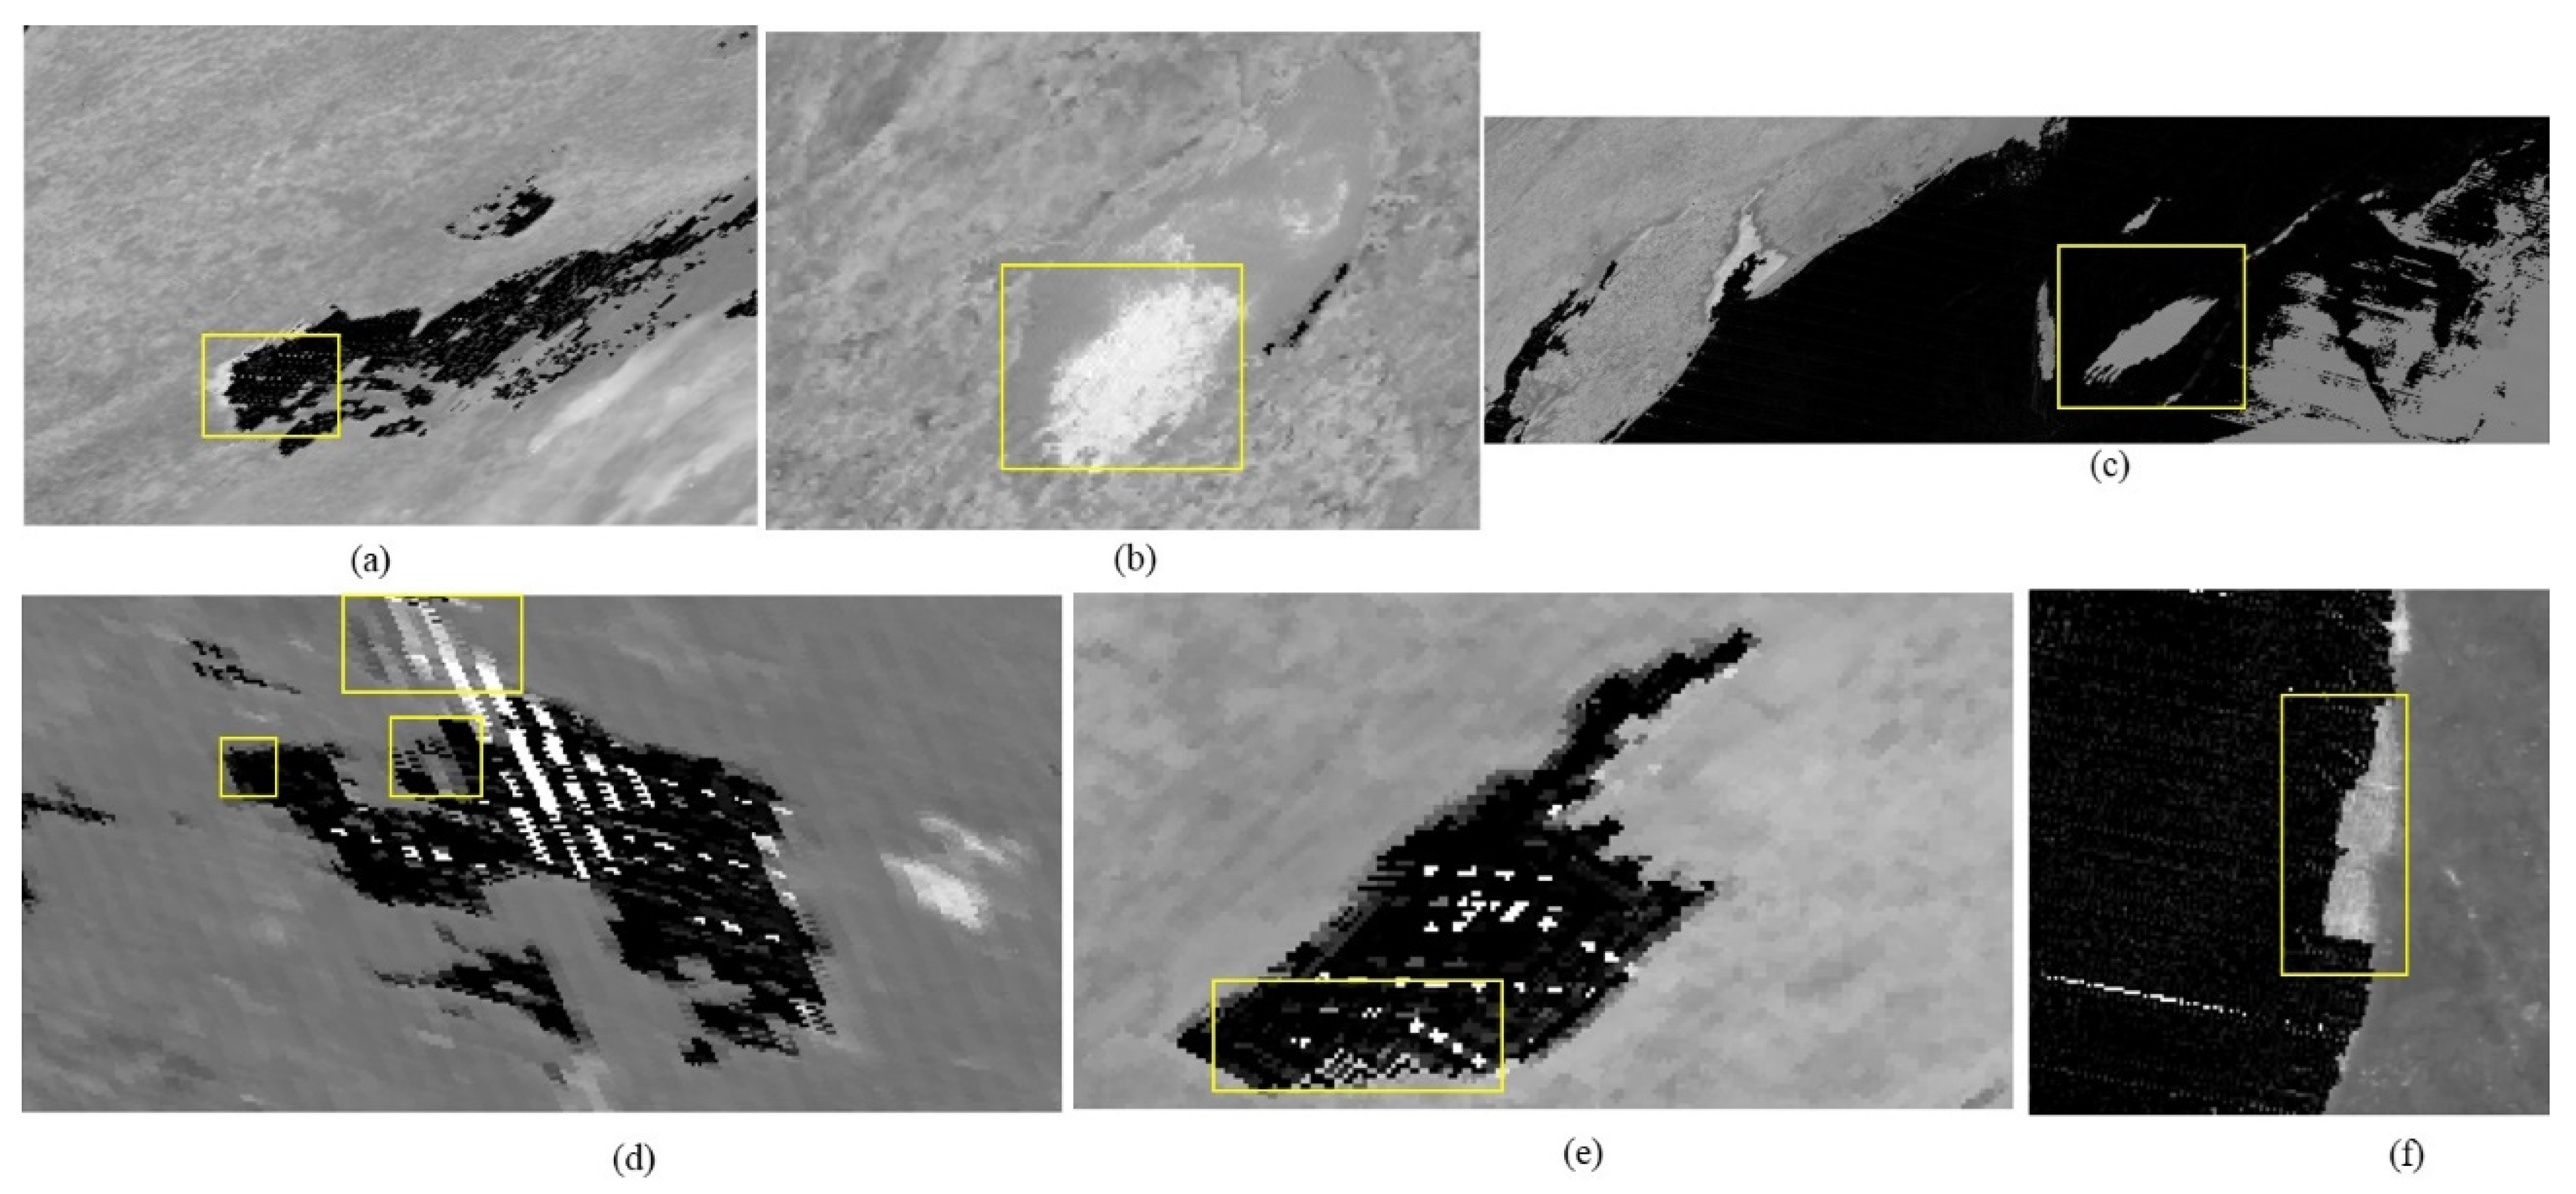
The proposed method was executed for the eight test sites. It requires two inputs: the LLC and URC of the test site and the date range. The technique first involves logging in with a valid credential on the Earthdata website, querying its database, fetching the required granule, downloading it, clipping it according to the LLC and URC, and applying a defined spectral index to enhance the desired feature. Since these test sites are algal bloom-affected, specific regions within the sites are also highlighted in the NEO imagery. The proposed method successfully automates the extraction of algal blooms at all test sites, which is represented through Figure 4, Figure 5, Figure 6 and Figure 7. The threshold of algal bloom features corresponding to the test sites is provided in Table 3.
In April 2003, an algal bloom impacted the extensive region of the West Coast of South Africa. The entire month of April was impacted by cloud coverage, and only data from 22 April to 26 April is cloud-free. Although the proposed technique performed monitoring for the entire month, successful extraction and monitoring only occurred during a certain period, which is represented in Figure 8 and Figure 9.

4. Discussion

MODIS provides data at three spatial resolutions. This article uses data sets from 250 m and 500 m spatial resolutions to automate the process. MOD09GQ and MOD09GA files on the Earthdata website deal with MODIS Surface Reflectance Daily Level-2 Global data at 250 m and 500 m spatial resolutions, respectively. From the spectral response curve, it is observed that the spectral response is higher in the visible band than in the infrared bands for algal bloom features.
The 250 m data set has only two bands, red and NIR, which are formulated in the spectral index to extract algal features. In contrast, the 500 m data set has seven bands. An exhaustive study is performed using these bands; NIR and SWIR1 are identified as most suitable for the study of algal bloom features, as depicted in Figure 10a. A novel index is proposed, the Normalized Difference MODIS Algae Index (NDMAI), and is also compared with the adjusted floating algae index (AFAI), floating algae index (FAI) and surface algal bloom index (SABI). The NDMAI outperforms these indices, as it discriminates water, land, and algal bloom features by creating a suitable threshold range for each without any feature mixing, which is depicted in Figure 10b.

5. Performance Analysis and Validation of NDMAI

The proposed index, the NDMAI, is compared with existing indices like the FAI, AFAI, and SABI. The MODIS data from 500 m is utilized to apply the Band Math module of the ENvironment for Visualizing Images (ENVI) software (ENVI 5.1); the corresponding results are shown in Figure 11.
It can be visualized from Figure 11 that the proposed index is quite efficient in enhancing algal bloom features by suppressing the surrounding features of water and land. Figure 11a shows a True Color Composite image of the MODIS 500 m resolution imagery from the data collected on 8 February 2023 in the region of the West Coast of South Africa. The bluish region shows the region covered by an algal bloom. A visualization of algal bloom extraction by the FAI and AFAI is shown in (b) and (c), whereas extraction by the SABI is shown in (c). The extraction by the proposed NDMAI is shown in (e); the visualization of (a) to (e) shows that the enhancement by the NDMAI perfectly matches with the RGB image.
Further, the spectral index imageries shown in Figure 11b–e were classified using the Support Vector Machine (SVM) classifier from the Supervised Classification Module of ENVI. The chosen samples from the three regions, viz., algal bloom, water, and land, included 900 pixels from algal bloom, 1000 pixels from water, and 1700 pixels from land features. There were 142,186 pixels in the imagery, which were classified. The classified imagery is shown in Figure 12, and the statistical results are shown in Table 4.
It is observed from Table 4 that the proposed index extracts algal blooms with 99.17% accuracy and outperforms the existing FAI, AFAI, and SABI. The stacked imagery gives the highest accuracy of 100%. However, it utilizes all seven bands from the MODIS 500 m data. In contrast, the proposed index only utilizes two bands, NIR and SWIR2, so it will have better computational efficiency due to the optimal use of bands compared to indices with a large number of bands.
Other parameters, like the confusion matrix, error of commission, and producer’s accuracy for the proposed NDMAI, are also analyzed and tabulated in Table 5, Table 6 and Table 7.

6. Conclusions and Future Scope

The proposed automation technique successfully extracts algal bloom features. Nine test sites were selected to extract algal bloom regions from NASA’s Earth Observatory reports. Out of eight test sites, the technique enhanced the blooming regions at seven sites. In the case of Lake Villarrica, the spectral index imagery had many dead pixels, which prohibited the identification of the threshold range. The blooming region was enhanced using both 250 m and 500 m spatial resolution data. The proposed technique requires two inputs for its execution: the latitude and longitude of the lower left coordinate and upper right coordinate of the test sites, and the date range (which could be greater than or equal to one day). After successfully enhancing the algal bloom features in the specific lakes on the date the NEO reported, further daily monitoring was also attempted on the West Coast of South Africa, which experienced a significant impact of red tide in April 2003, and was successfully performed for several consecutive days between 22 April and 26 April; the other days of the month were cloudy, and not successive, so they are not reported.
Since the spatial resolution of MODIS is coarser, dealing with small test sites and enhancing algal bloom features may not be possible. The NEO reported that most of the test sites used Landsat-8 and Landsat-9 sensors, which have a spatial resolution of 30 m. The other drawback of the proposed technique is that it deals with a single granule at a time. If the test site belongs to two granules, then the technique does not deal with the mosaicking of the granules. This mosaicking may be incorporated in the future. Furthermore, similarly to the Earthdata portal, there are portals like EarthExplorer and DataSpace Copernicus, which can be automated and integrated with the existing methods to establish a rich monitoring system and overcome the problems of dealing with small regions.
This automation has a vast potential for the future. Several other natural phenomena need daily monitoring, like floods. There are other spectral indices, such as vegetation indices for enhancing vegetation features, water indices for delineating water bodies, and urban indices for extracting urban features. MODIS provides 36 spectral bands; these multispectral bands can be exhaustively analyzed to delineate specific features by formulating the novel index. By changing the spectral index, several other features can be extracted, and daily monitoring is also possible with the proposed technique.

Author Contributions

Conceptualization, V.K.M.; methodology, V.K.M.; software, J.F.; validation, V.K.M., A.K.M., F.N. and S.P.; formal analysis, V.K.M., A.K.M. and F.N.; investigation, V.K.M.; resources, V.K.M. and J.F.; data curation, V.K.M. and J.F.; writing—V.K.M.; writing—review and editing, A.K.M., F.N. and S.P.; visualization, V.K.M., J.F. and F.N.; supervision, A.K.M. and F.N.; project administration, S.P. and V.K.M.; funding acquisition, F.N. All authors have read and agreed to the published version of the manuscript.

Funding

This work was supported by Project SmartPol funded by the MARTERA 73/78 Scheme.

Institutional Review Board Statement

Not applicable.

Informed Consent Statement

Not applicable.

Data Availability Statement

Publicly available datasets were analyzed in this study. This data can be found here: [https://www.earthdata.nasa.gov/].

Conflicts of Interest

The authors declare no conflicts of interest.

Abbreviations

The following abbreviations are used in this manuscript:
AEDMAAutomatic Extraction and Daily Monitoring of Algal Bloom
NDMAINormalized Difference MODIS Algae Index
LLCLower Left Coordinate
URCUpper Right Coordinate
NEONASA Earth Observatory

References

  1. Anderson, D.M.; Boerlage, S.F.; Dixon, M.B. Harmful Algal Blooms (HABs) and Desalination: A Guide to Impacts, Monitoring and Management; UNESCO: Paris, France, 2017. [Google Scholar]
  2. Yan, X.; Xu, X.; Wang, M.; Wang, G.; Wu, S.; Li, Z.; Sun, H.; Shi, A.; Yang, Y. Climate warming and cyanobacteria blooms: Looks at their relationships from a new perspective. Water Res. 2017, 125, 449–457. [Google Scholar] [CrossRef] [PubMed]
  3. Cribari, K.J. The Use of Environmental DNA for Understanding Changing Ecosystems: Monitoring Harmful Algal Blooms. Ph.D. Thesis, University of Washington, Seattle, WA, USA, 2019. [Google Scholar]
  4. Fu, M.; Wang, Z.; Pu, X.; Xu, Z.; Zhu, M. Changes of nutrient concentrations and N:P:Si ratios and their possible impacts on the Huanghai Sea ecosystem. Acta Oceanol. Sin. 2012, 31, 101–112. [Google Scholar] [CrossRef]
  5. Anderson, D.M. Approaches to monitoring, control and management of harmful algal blooms (HABs). Ocean Coast. Manag. 2009, 52, 342–347. [Google Scholar] [CrossRef] [PubMed]
  6. Van Liew, M.W.; Feng, S.; Pathak, T.B. Assessing Climate Change Impacts on Water Balance, Runoff, and Water Quality at the Field Scale for Four Locations in the Heartland. Trans. ASABE 2013, 56, 883–900. [Google Scholar] [CrossRef]
  7. Lin, Q.; Zhang, K.; McGowan, S.; Capo, E.; Shen, J. Synergistic impacts of nutrient enrichment and climate change on long-term water quality and ecological dynamics in contrasting shallow-lake zones. Limnol. Oceanogr. 2021, 66, 3271–3286. [Google Scholar] [CrossRef]
  8. Kim, D.; Choi, J.-G.; Park, J.; Kwon, J.-I.; Kim, M.-H.; Jo, Y.-H. Upwelling processes driven by contributions from wind and current in the Southwest East Sea (Japan Sea). Front. Mar. Sci. 2023, 10, 1165366. [Google Scholar] [CrossRef]
  9. Anderson, D.M.; Fensin, E.; Gobler, C.J.; Hoeglund, A.E.; Hubbard, K.A.; Kulis, D.M.; Landsberg, J.H.; Lefebvre, K.A.; Provoost, P.; Richlen, M.L.; et al. Marine harmful algal blooms (HABs) in the United States: History, current status and future trends. Harmful Algae 2021, 102, 101975. [Google Scholar] [CrossRef] [PubMed]
  10. Loureiro, S.; Reñé, A.; Garcés, E.; Camp, J.; Vaqué, D. Harmful algal blooms (HABs), dissolved organic matter (DOM), and planktonic microbial community dynamics at a near-shore and a harbour station influenced by upwelling (SW Iberian Peninsula). J. Sea Res. 2011, 65, 401–413. [Google Scholar] [CrossRef]
  11. Leising, A.W.; Pierson, J.J.; Halsband-Lenk, C.; Horner, R.; Postel, J. Copepod grazing during spring blooms: Does Calanus pacificus avoid harmful diatoms? Prog. Oceanogr. 2005, 67, 384–405. [Google Scholar] [CrossRef]
  12. Lanari, M.; Copertino, M.S.; Colling, L.A.; Bom, F.C. The impact of short-term depositions of macroalgal blooms on widgeon-grass meadows in a river-dominated estuary. Harmful Algae 2018, 78, 36–46. [Google Scholar] [CrossRef] [PubMed]
  13. Zhang, H.; Fennel, K.; Laurent, A.; Bian, C. A numerical model study of the main factors contributing to hypoxia and its interannual and short-term variability in the East China Sea. Biogeosciences 2020, 17, 5745–5761. [Google Scholar] [CrossRef]
  14. Friedl, M.A.; Sulla-Menashe, D.; Skole, B.; Hook, S.; Dwyer, J.L.; Morisette, A.; Schaaf, C.B. Modis collection 5 global land cover: Algorithm refinements and land cover product transitions. Remote Sens. Environ. 2010, 114, 168–182. [Google Scholar] [CrossRef]
  15. O’Reilly, J.E.; Calibration, S.P.; Team, V.A. Seawifs postlaunch calibration and validation activities. Deep Sea Res. Part II Top. Stud. Oceanogr. 2000, 47, 847–889. [Google Scholar]
  16. Justice, C.O.; Giglio, L.; Roy, D.; Boschetti, L.; Csiszar, I.; Davies, D.; Korontzi, S.; Schroeder, W.; O’Neal, K.; Morisette, J. MODIS-Derived Global Fire Products. In Land Remote Sensing and Global Environmental Change: NASA’s Earth Observing System and the Science of ASTER and MODIS; Ramachandran, B., Justice, C., Abrams, M., Eds.; Springer: New York, NY, USA, 2010; Volume 11. [Google Scholar] [CrossRef]
  17. Vermote, E. MOD09A1 MODIS Surface Reflectance 8-Day L3 Global 500m SIN Grid V006; NASA EOSDIS Land Processes DAAC; NASA: Washington, DC, USA, 2015. [CrossRef]
  18. Jensen, J.R. Introductory Digital Image Processing: A Remote Sensing Perspective, 3rd ed.; Prentice Hall: Hoboken, NJ, USA, 2005. [Google Scholar]
  19. Tran, T.V.; Reef, R.; Zhu, X. A Review of Spectral Indices for Mangrove Remote Sensing. Remote Sens. 2022, 14, 4868. [Google Scholar] [CrossRef]
  20. Patel, K. Eerie Blooms in Lake Erie. NASA Earth Science Applied Sciences, 07 2019. Image Obtained from NASA Earth Observatory. Available online: https://earthobservatory.nasa.gov/images/145453/eerie-blooms-in-lake-erie (accessed on 22 January 2025).
  21. Early Detection of Algae Yields Savings. NASA Earth Science Ap-Plied Sciences, 06 2017. Image Obtained from NASA Earth Observatory. Available online: https://earthobservatory.nasa.gov/images/146983/early-detection-of-algae-yields-savings (accessed on 22 January 2025).
  22. Thomas, A.B. The Blooming Blues. NASA Earth Observatory, 2017. Image Obtained from NASA Earth Observatory. Available online: https://earthobservatory.nasa.gov/images/146835/the-blooming-blues (accessed on 28 January 2025).
  23. Hansen, K. Algae Boom in Lake Erie, 07 2015. Image Obtained from NASA Earth Observatory. Available online: https://earthobservatory.nasa.gov/images/86327/algae-boom-in-lake-erie (accessed on 28 January 2025).
  24. Cassidy, E. Algae Bloom in Lake Okeechobee, 07 2023. Image Obtained from NASA Earth Observatory. Available online: https://earthobservatory.nasa.gov/images/151581/algae-bloom-in-lake-okeechobee (accessed on 2 February 2025).
  25. Doermann, L. Algae in the Andes, 05 2023. Image Obtained from NASA Earth Observatory. Available online: https://earthobservatory.nasa.gov/images/151363/algae-in-the-andes (accessed on 2 February 2025).
  26. Hansen, K. Bloomin’ Atlantic. NASA Earth Observatory, 04 2023. Image Obtained from NASA Earth Observatory. Available online: https://earthobservatory.nasa.gov/images/151261/bloomin-atlantic (accessed on 10 February 2025).
  27. Observatory, N.E. Phytoplankton off South African Coast. NASA Earth Observatory, 04 2003. Image Obtained from NASA Earth Observatory. Available online: https://earthobservatory.nasa.gov/images/11293/phytoplankton-off-south-african-coast (accessed on 10 February 2025).
Figure 1. Incidents of algal bloom in different locations around the world reported by the NASA Earth Observatory: (a) Lake Erie, 30 July 2019; (b) Utah Lake, 20 June 2017; (c) Siling Lake, 12 September 2017; (d) Lake St. Clair, 28 July 2015; (e) Lake Okeechobee, 12 June 2023; (f) Lake Villarrica, 2 May 2023; (g) Atlantic Ocean, 20 April 2023; (h) Eland’s Bay, 10 February 2023; (i) West Coast, RSA, April 2003.
Applsci 15 09275 g001
Figure 2. A flow chart of the modules used in the proposed methodology.
Applsci 15 09275 g002
Figure 3. The spectral reflectance curve (SRC) of the water and red tide features in the different bands of the MODIS (500 m resolution) data for the images of 8 February 2023.
Applsci 15 09275 g003
Figure 4. The RGB imagery (a1a8) of all the test sites from S. No. 1 to 8 shown in Table 1 with corresponding dates from the MODIS 500 m data set.
Applsci 15 09275 g004
Figure 5. The spectral index imagery (b1b8) for 200 m data set for the test site shown through S. No. 1 to 8 in Table 1.
Applsci 15 09275 g005
Figure 6. The threshold imageries of the test sites and the bloomed regions in yellow rectangles (c1c8), and the zoom in of yellow rectangles in (d1d8) for better visualization, due to the dead pixels for the test cite Lake Villarrica the corresponding images (c6 and d6) are not shown.
Applsci 15 09275 g006
Figure 7. The automation technique successfully extracts algal bloom regions in the 500 m resolution images: (a) Lake Erie, (b) Lake Okeechobee, (c) Atlantic Ocean near Philadelphia Coast, (d) Siling Lake, (e) Lake St. Clair, and (f) Eland’s Bay.
Applsci 15 09275 g007
Figure 8. The daily monitoring of algal bloom incidents on the West Coast of South Africa, including St. Helena Bay, Eland’s Bay and Lambert’s Bay, during April 2003. (ae) RGB imagery of MODIS 500 m data for red tide from 22 April to 26 April 2003; (a′e′) depict the output of the spectral index for the 250 m images corresponding to (ae), and (c) represents the threshold image of (a″e″). The purple color shows the extracted red tide incident.
Applsci 15 09275 g008
Figure 9. The spectral index imagery of the West Coast of South Africa from 22 April to 26 April 2003 in (ae); the proposed method successfully enhanced the blooming region in the 500 m MODIS imagery.
Applsci 15 09275 g009
Figure 10. The MODIS 500 m bands were analyzed using spectral response curves for two features, water and algal bloom (red tide), which are shown in (a), and (b) defines the threshold range for other existing indices used for algal bloom extraction.
Applsci 15 09275 g010
Figure 11. Visualization of the True Color Composite, and the existing indices and proposed index for algal bloom detection: (a) RGB, (b) FAI, (c) AFAI, (d) SABI, and (e) NDMAI.
Applsci 15 09275 g011
Figure 12. Classified imagery of the (a) MODIS stacked imagery with seven bands, (b) FAI, (c) AFAI, (d) SABI, and (e) NDMAI.
Applsci 15 09275 g012
Table 1. Bands of MODIS utilized in the study.
BandReflected Range (μm)Band Explanation
10.62–0.67Red
20.84–0.88NIR
30.46–0.48Blue
40.55–0.57Green
51.23–1.25SWIR
61.62–1.65SWIR1
72.11–2.16SWIR2
Table 2. Details of the test sites corresponding to the incidents of algal bloom reported by the NEO.
S. No.Study AreaDateNEO’s Image SensorLLCURC
1Lake Erie30 July 2019Landsat-841°08′20.2″ N 83°36′39.6″ W43°10′38.1″ N 78°40′40.8″ W
2Utah Lake20 June 2017Landsat-840°00′47.9″ N 112°01′11.3″ W40°21′43.7″ N 111°37′12.6″ W
3Siling Lake12 September 2017Landsat-831°27′51.5″ N 88°28′18.6″ E32°04′08.7″ N 89°24′00.6″ E
4Lake St. Clair28 July 2015Landsat-842°17′28.8″ N 82°57′22.9″ W42°42′41.4″ N 82°23′55.7″ W
5Lake Okeechobee12 June 2023Landsat-926°41′10.3″ N 81°07′38.4″ W27°13′32.0″ N 80°38′32.3″ W
6Lake Villarrica2 May 2023Landsat-839°19′28.3″ S 72°14′16.6″ W39°11′59.5″ S 71°57′13.4″ W
7Atlantic Ocean20 April 2023MODIS38°04′53.4″ N 76°16′58.3″ W40°45′20.1″ N 70°14′25.0″ W
8Eland’s Bay10 February 2023MODIS32°36′39.0″ S 17°50′31.6″ E32°00′43.0″ S 18°30′04.6″ E
9West Coast, RSAApril 2003MODIS33°05′48.0″ S 17°42′36.8″ E31°44′16.0″ S 18°29′10.5″ E
Table 3. The details of the threshold values for the proposed index and suitable thresholds for the algal blooms at the chosen test sites.
S. No.Study AreaIndex RangeThreshold for Algal Bloom
1Lake Erie−1 to 1−0.1 to 0.5
2Utah Lake−1 to 10 to 0.2
3Siling Lake−1 to 10.5 to 0.9
4Lake St. Clair−1 to 10.4 to 1
5Lake Okeechobee−1 to 1−0.7 to 0
6Lake Villarrica−1 to 1Dead pixels
7Atlantic Ocean−1 to 10.13 to 0.25
8Eland’s Bay−1 to 10.5 to 0.9
9West Coast−1 to 10.5 to 0.9
Table 4. The results of the classification and accuracy assessment of the proposed and existing indices for the algal bloom extraction.
ImageryAlgal BloomsWaterLandClassification Accuracy (%)Kappa Coefficient
MODIS stacked imagery with 7 bands18,21765,21058,7591001.0
FAI20,31563,28358,58898.000.9686
AFAI17,70665,90758,57398.470.9760
SABI0080,94761,23971.860.5493
NDMAI19,11864,31558,75399.170.9870
Table 5. Confusion matrix of the proposed NDMAI.
ClassAlgal Bloom (%)Water (%)Land (%)Total (%)
Algal Bloom99.780.001.5925.69
Water0.0099.900.0027.75
Land0.220.1098.4146.56
Total100.00100.00100.00100.00
Table 6. Commission and omission errors of the proposed NDMAI.
ClassCommission (%)Omission (%)Commission (Pixels)Omission (Pixels)
Algal Bloom2.920.2227/9252/900
Water0.000.100/9991/1000
Land0.181.593/167627/1700
Table 7. Producer’s and user’s accuracy of the proposed NDMAI.
ClassProd. Acc. (%)User Acc. (%)Prod. Acc. (Pixels)User Acc. (Pixels)
Algal Bloom99.7897.08898/900898/925
Water99.90100.00999/1000999/999
Land98.4199.821673/17001673/1676
Disclaimer/Publisher’s Note: The statements, opinions and data contained in all publications are solely those of the individual author(s) and contributor(s) and not of MDPI and/or the editor(s). MDPI and/or the editor(s) disclaim responsibility for any injury to people or property resulting from any ideas, methods, instructions or products referred to in the content.