1. Introduction
The propagation of ultrasonic waves through a medium is governed by fundamental interaction phenomena, including attenuation, scattering, reflection, and transmission [
1]. In solids, this behavior is primarily dictated by the elastic modulus and density. However, the material’s viscosity and its temperature dependence also exert a significant influence on wave propagation [
2,
3]. Temperature, in particular, plays a critical role among external factors. An increase in temperature not only reduces material density but also alters the elastic modulus, which in turn modifies the material’s viscosity and leads to changes in viscous loss due to thermal absorption [
4].
For polymeric materials, their unique viscoelasticity-the simultaneous manifestation of viscous fluid characteristics (energy dissipation) and elastic solid behavior (energy storage) serves as a critical distinguishing feature from metallic materials and represents the most effective indicator of mechanical properties [
5,
6]. Variations in molecular chain structure, glass transition temperature, and Young’s modulus, which stem from differences in manufacturing processes, raw materials, and key processing parameters like pressure and shear, are directly reflected in the material’s viscosity. Consequently, viscosity in polymers is a complex, temperature-and time-dependent property that varies significantly across different materials [
7,
8].
When a polymer is subjected to continuous ultrasonic irradiation, energy is dissipated as heat due to internal friction, a phenomenon termed viscous loss [
9,
10,
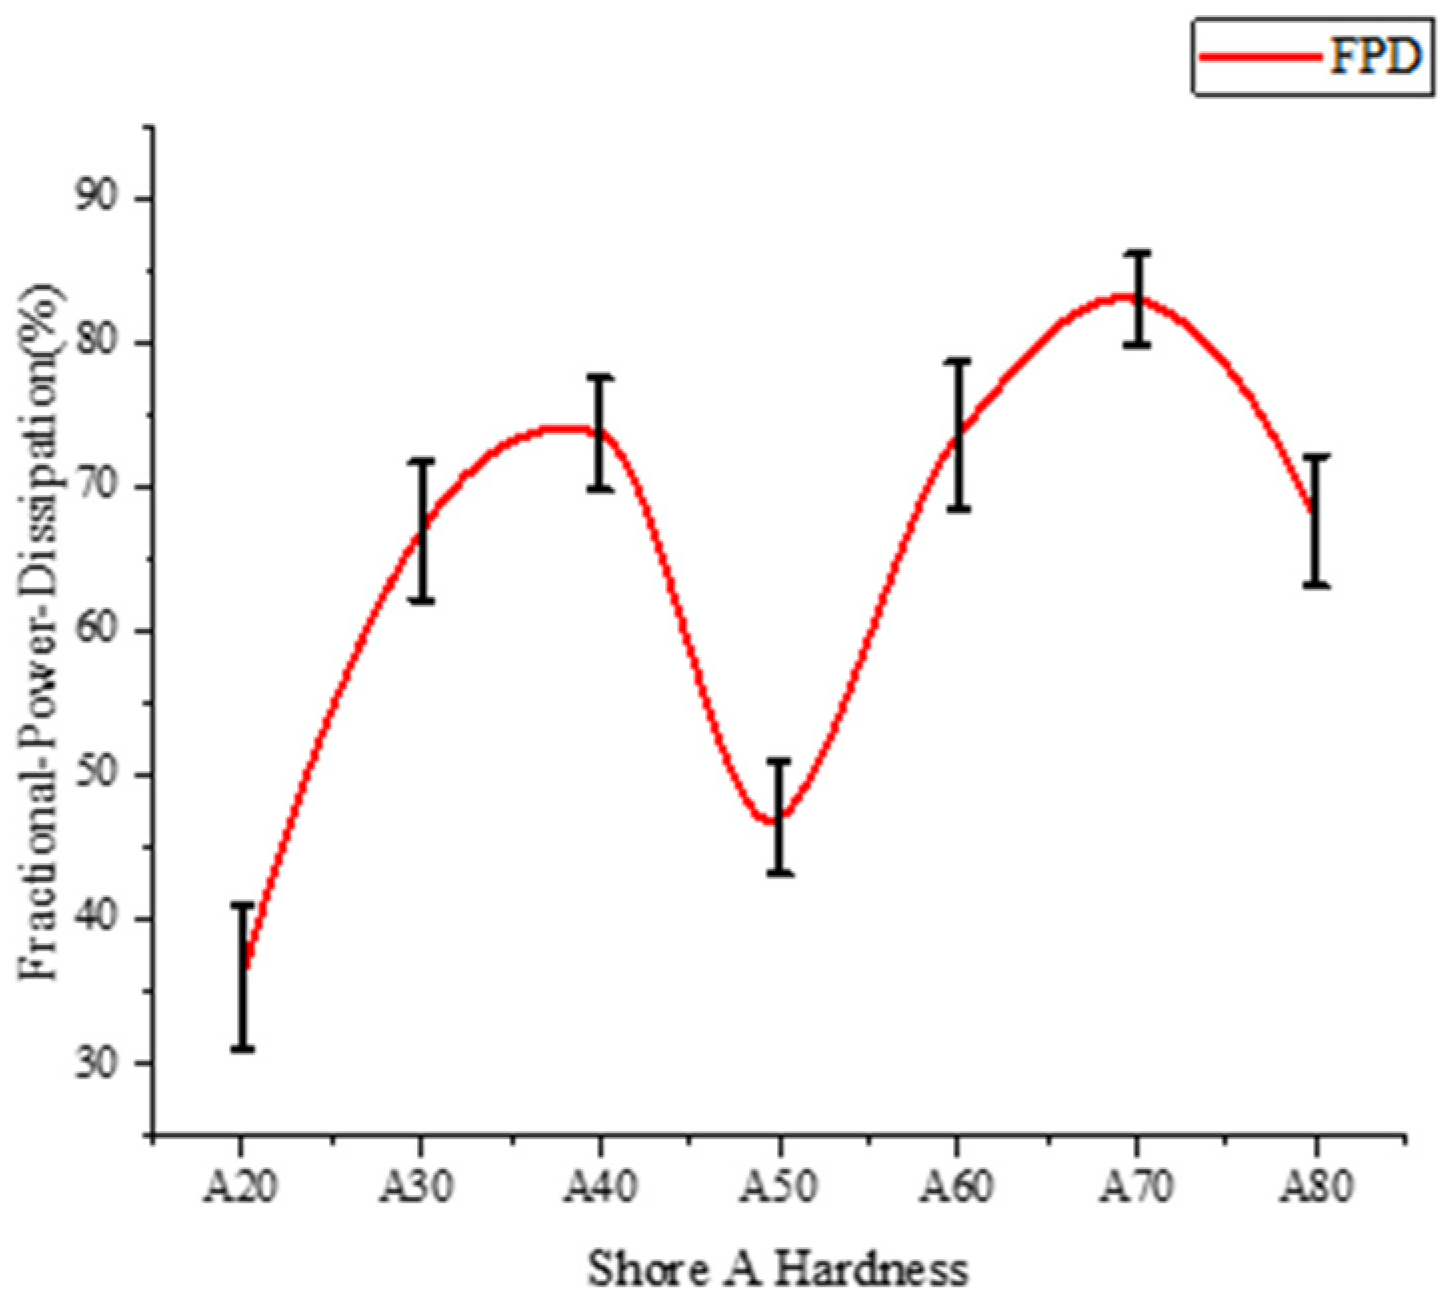
11]. Because different polymers possess distinct viscosities, their viscous loss characteristics vary accordingly. Conventional Fractional-Power-Dissipation (FPD) methods can quantify total ultrasonic energy loss but cannot differentiate between scattering loss and viscous loss [
12]. To isolate the viscous loss of different polymer materials from the total loss, real-time temperature monitoring using thermodynamic formulas presents a viable approach.
Traditional temperature measurement techniques, which rely on achieving thermodynamic equilibrium, are typically limited to surface measurements and cannot capture internal viscous heating phenomena [
13,
14,
15]. Current ultrasonic thermometry technologies offer several alternatives. One approach involves analyzing the time-of-flight shift in ultrasonic echo signals before and after heating to establish a correlation with temperature change [
16]. Another method utilizes the frequency shift in the propagating wave, which is also temperature-dependent [
17]. Still other technique utilizes the attenuation characteristics of ultrasonic waves during propagation in a medium, combining the relationship between the attenuation coefficient and temperature change to achieve non-destructive measurement of temperature [
18].
However, none of the aforementioned techniques utilize the relationship between temperature and viscosity. This study employs a phase-shift thermometry method based on transmitted signals. The core principle lies in detecting phase variations in the transmitted signal, which are caused by minute changes in sound velocity during temperature fluctuations. Ultrasonic irradiation induces viscous heating; by measuring the resulting phase shift, we can determine the internal temperature rise. Correlating this temperature change with viscous loss allows for the calculation of its proportion relative to total energy dissipation. This approach has inherent limitations and is only applicable to linear viscoelastic materials—those exhibiting a stress response that follows the Boltzmann superposition principle with respect to strain history under small-strain conditions. It is not applicable to non-Newtonian materials.
In this work, we investigated seven polyurethane samples with similar densities and sound velocities but varying Shore hardness. Each specimen exhibited a distinct thermal response and viscous dissipation profile under focused ultrasound, reflecting their intrinsic viscous dissipation index differences. The proposed methodology primarily focuses on differentiating materials through their viscous dissipation index derived from viscous loss mechanisms, rather than employing rheometric techniques such as slip-aware multigap protocols utilizing steady torsional or Couette flows [
19]. The phase-shift measurement methodology demonstrated high sensitivity in characterizing these material-specific variations, enabling precise differentiation. This technique holds potential for medical applications, where non-contact measurements of phase shifts in biological tissues could assess viscosity-related pathological changes, opening a new frontier in medical ultrasonography.
2. Theoretical Background
Under periodic oscillatory loading, viscoelastic materials [
20] develop stress responses at the excitation frequency, resulting in energy dissipation through viscous mechanisms [
21,
22]. For a linear viscoelastic material whose stress response at any given time exhibits a linear superposition relationship with the strain history in accordance with the Boltzmann superposition principle, the complex modulus is defined as the combination of the storage modulus and the loss modulus:
where the real part of the complex modulus is the storage modulus
, which is the energy stored due to the elastic deformation, the imaginary part of the complex modulus is the loss modulus
, also called viscous loss, which is the energy lost as heat,
and
are the amplitude of the stress and strain, respectively,
is the lag angle of the strain.
For a viscoelastic material vibrating under a sinusoidal strain of frequency
, the heat generation of the micro unit cell per unit of time is given by [
23]:
By submitting
in Equation (1), the average heat production per unit volume
is directly related to the loss modulus
of the material. This equation is a bridge between the macroscopic heat production and the microscopic viscosity of the material:
In the process of acoustic wave propagation, the acoustic field is usually characterized by the acoustic pressure
, mass velocity v and density
changes in the medium, for focused ultrasound acting on the acoustic and temperature fields inside the biological tissues research, at low power, for linear, no flow of the ideal homogeneous medium is usually used to solve the Helmholtz equation, which is the central governing equation for frequency domain analysis in acoustics [
24]:
where
is the Laplace operator, the wave number
is defined as
,
for the angular frequency,
indicates the distribution of sound pressure in space.
In the actual propagation, the propagation medium is always non-ideal, the energy of the acoustic wave will gradually decay with the distance, that is, the medium absorbs the acoustic wave, at this time, the fluctuation equation in the solid viscoelastic medium is [
5]:
where
is the right-angle coordinate system,
is the applied force along the coordinate axis,
is the displacement vector, and
is the density of the medium.
In terms of heat transfer, the Pennes [
25] biological tissue heat transfer model was used to describe the heat transfer based on the fact that tissues are isotropic and homogeneous continuous media:
where
represents the density of tissue,
is the tissue specific heat capacity,
is the tissue thermal conductivity,
is the tissue temperature,
represents the specific heat capacity of blood,
is the blood perfusion rate,
is the blood temperature, and
represents the ultrasonic heating source. The blood perfusion term can be omitted because the study object is for polymer materials, lacks significant blood perfusion, and heat transfer is mainly dominated by heat conduction. By combining the acoustic field with the Pennes bioheat transfer equation, the energy lost in the form of heat during ultrasonic irradiation of the material can be modeled.
When an intermediate layer with thickness
and acoustic impedance
is embedded in a medium of acoustic impedance
, an acoustic plane-wave
incident from Medium 1 into Medium 2. Part of the wave is reflected back into Medium 1 called reflected wave (
), and part transmits into the intermediate layer (
). Upon
reaching the far boundary of the layer, the wave is again partially reflected (
) and partially transmitted into Medium 1 (
) on the opposite side. Denote the pressure amplitudes of the incident, reflected, and transmitted waves as
,
and
respectively. the ratio of transmitted wave sound intensity
to incident wave sound intensity
is [
26]:
In the above equation
,
,
, the ratio of reflected wave sound intensity to incident wave sound intensity is:
Thus the ratio of the reflected wave sound pressure amplitude to the incident wave sound pressure amplitude is:
Traditional Fractional-Power-Dissipation [
27] by analyzing the ultrasound in the material of the reflected and transmitted signals to measure its energy loss, the energy of the sound waves reflected back from the interface is the echo reduction
ER, and the energy transmitted out of the material is the insertion loss
IL:
When the transmitted sound wave propagates in the material, the energy is lost due to the scattering caused by the non-uniform structure and the heat absorption caused by the viscosity, and the percentage of the loss caused by the scattering and the viscosity is the
:
3. Simulation of Temperature Field
To illustrate the methodological basis, a simulation was performed. As the temperature within the polyurethane rises, a non-uniform temperature field is generated, altering the local speed of sound and inducing a phase shift in the transmitted signal. A coupled acoustic-thermal model was implemented in COMSOL Multiphysics 6.3 using a two-dimensional axisymmetric configuration. The study comprises two distinct analytical approaches: pressure acoustics analysis in the frequency domain, and bioheat transfer analysis in the time domain.
The model was initialized at a uniform temperature of 300 K. A single-element focusing transducer was simulated with an operating frequency of 600 kHz, a focal length of 90 mm, and an aperture diameter of 56 mm. Perfectly matched layers (cylindrical) of 5 mm thickness were applied to the model’s outer boundaries to prevent reflections. The thermal boundary conditions were set as follows: the radiation boundary temperature was fixed at 300 K with thermally insulated boundaries. The transducer was modeled to radiate with a specified vibration velocity. A defined heat source was applied for a duration of 4 s to simulate the heating process. A refined mesh was employed in the near-field of the transducer and within the sample material, with a maximum element size of
, where
is the wavelength of the emitted signal, and the remaining grid size is predefined and hyperfine. The material properties for the polyurethane samples, measured at 25 °C, are listed in
Table 1.
Figure 1 presents simulated internal temperature distributions in polyurethane plates with varying Shore hardness (A20–A80) under 13.5W ultrasonic irradiation for 3 s. Samples with lower peak temperatures (e.g., A20 and A50) demonstrate more uniform heating patterns, with elevated temperature regions covering nearly the entire focal zone and penetrating through the material thickness. In contrast, samples exhibiting higher peak temperatures (particularly A70) show concentrated heating primarily at the focal point, displaying distinct conical temperature distributions throughout the material. Analysis of
Figure 1 and
Table 1 reveals that the Shore A20 polyurethane exhibits the lowest sound velocity and density among all tested samples, corresponding to its minimal temperature rise. While both sound velocity and density generally increase with Shore hardness (except for a notable decrease at A50), the A80 specimen demonstrates significantly higher sound velocity and density yet substantially reduced heating compared to A70, accompanied by distinct morphological characteristics suggesting its glass transition temperature may have surpassed a critical threshold, resulting in fundamentally different thermoacoustic behavior. The maximum temperature elevation observed in the A70 sample likely stems from its optimal combination of molecular chain mobility and enhanced viscous dissipation capacity.
As the acoustic wave propagates through the simulated temperature fields shown in
Figure 1, the local variations in sound velocity induce a cumulative phase shift. This phase shift, measured relative to a reference signal unaffected by the thermal gradient, varies depending on the temperature field’s magnitude and distribution. The phase shift magnitude varies with different temperature fields due to temperature-dependent sound velocity variations. Furthermore, ultrasonic wave diffraction occurs when propagating through heterogeneous media or encountering boundary discontinuities, resulting in wavefront distortion and altered phase accumulation.
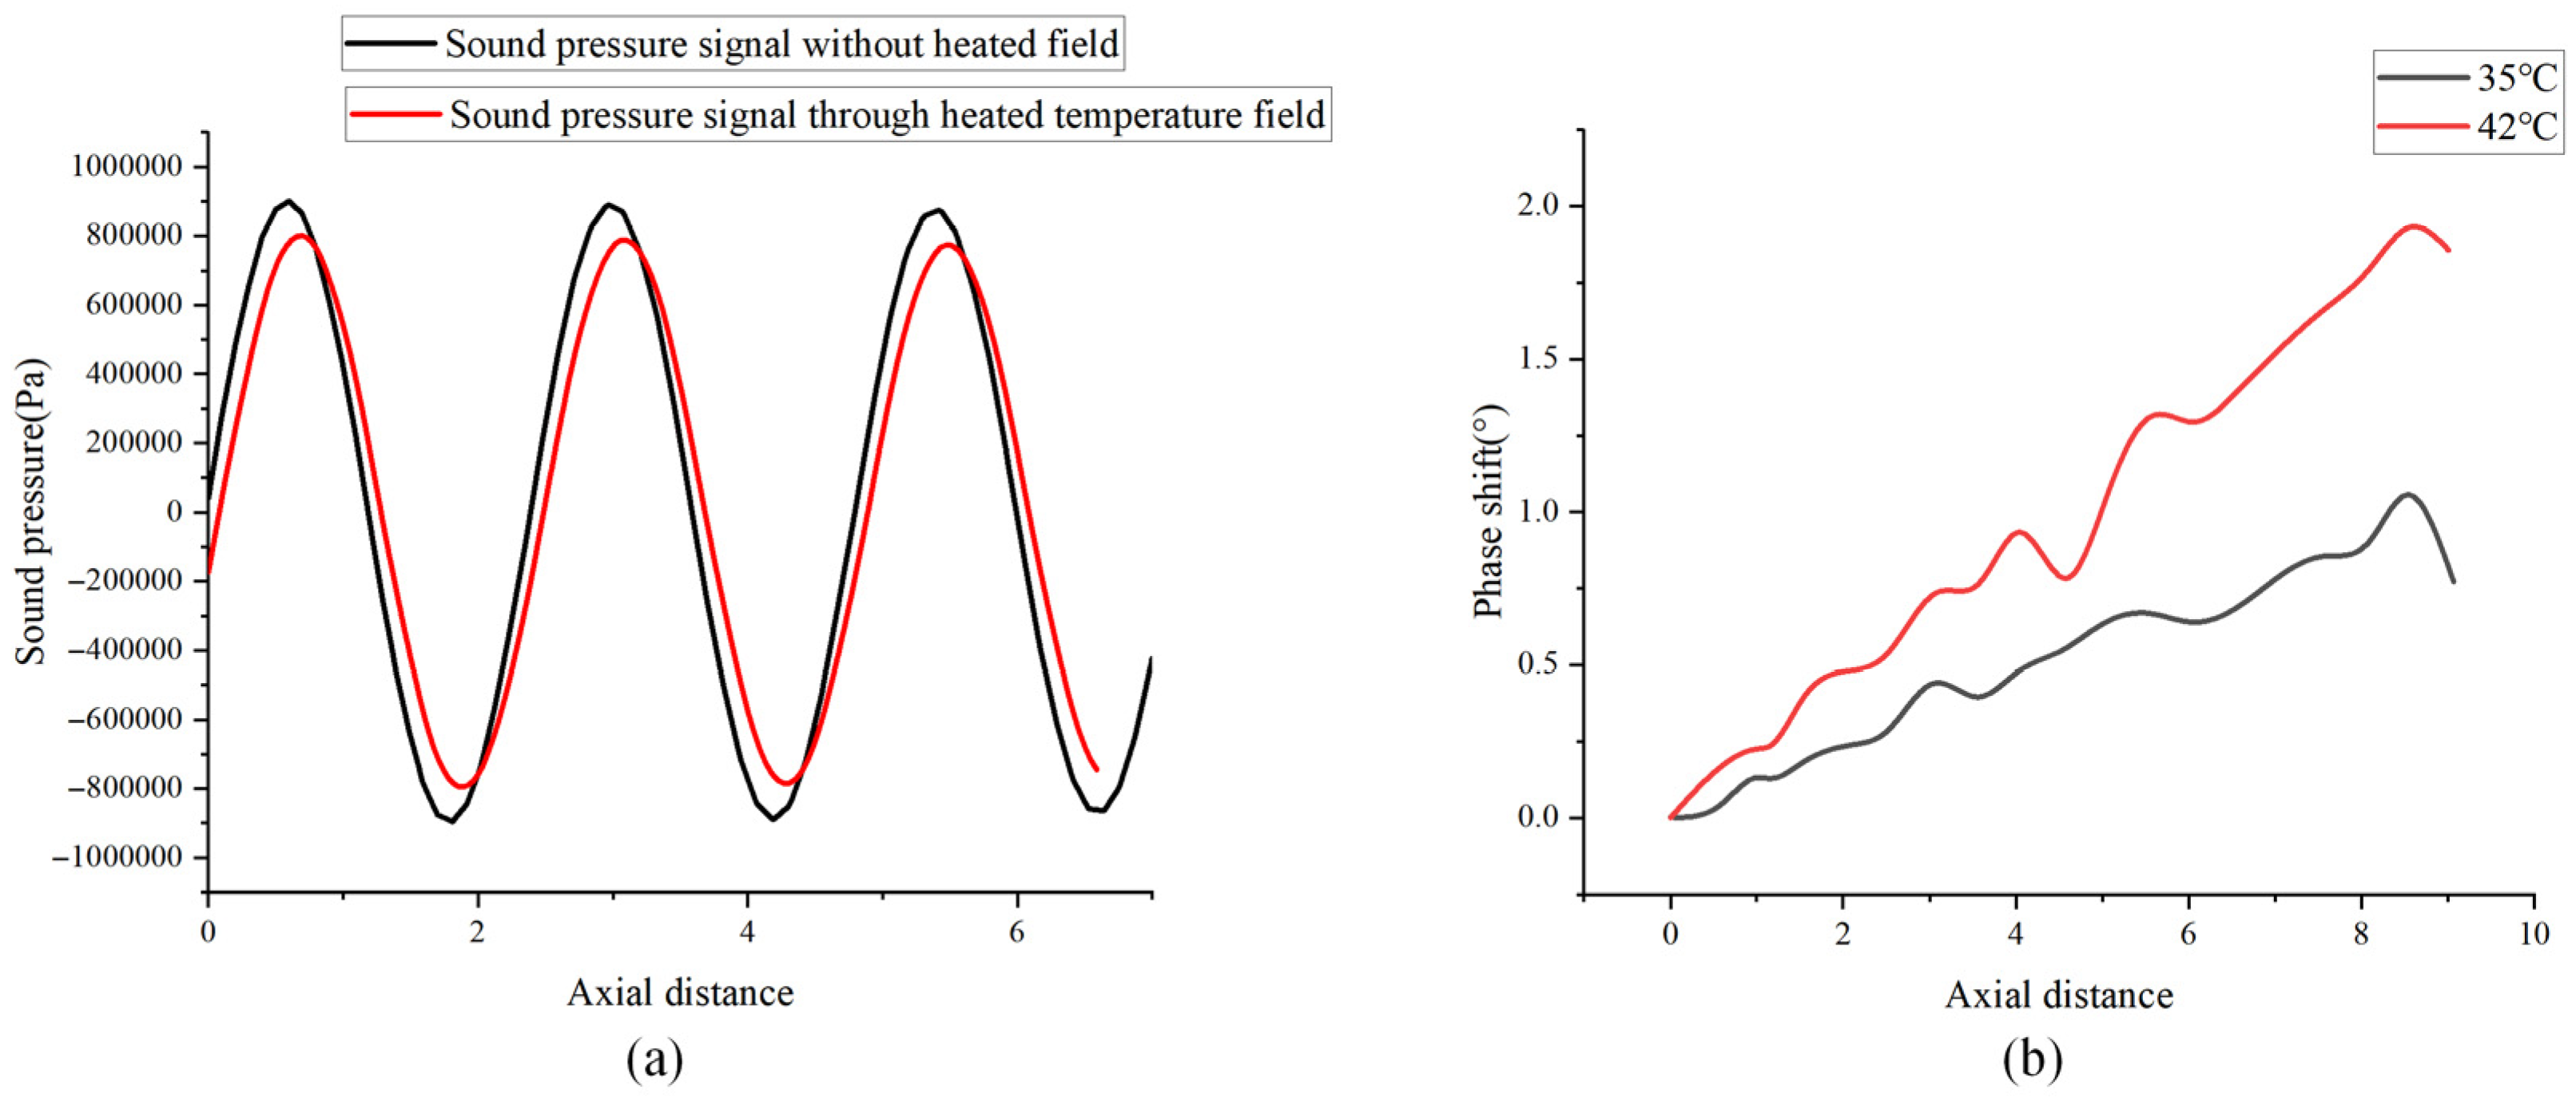
Figure 2a shows the phenomenon of phase shifting due to changes in the speed of sound inside the sample as the sound wave passes through the temperature field. At 42 °C, the phase shift is overall greater than the corresponding value at 35 °C, indicating that the increase in temperature has a significant effect on the phase change in the ultrasonic propagation path, and that the phase shift is greater as the acoustic wave propagates axially within the sample due to phase accumulation.
4. Experiments
4.1. Experimental Setup
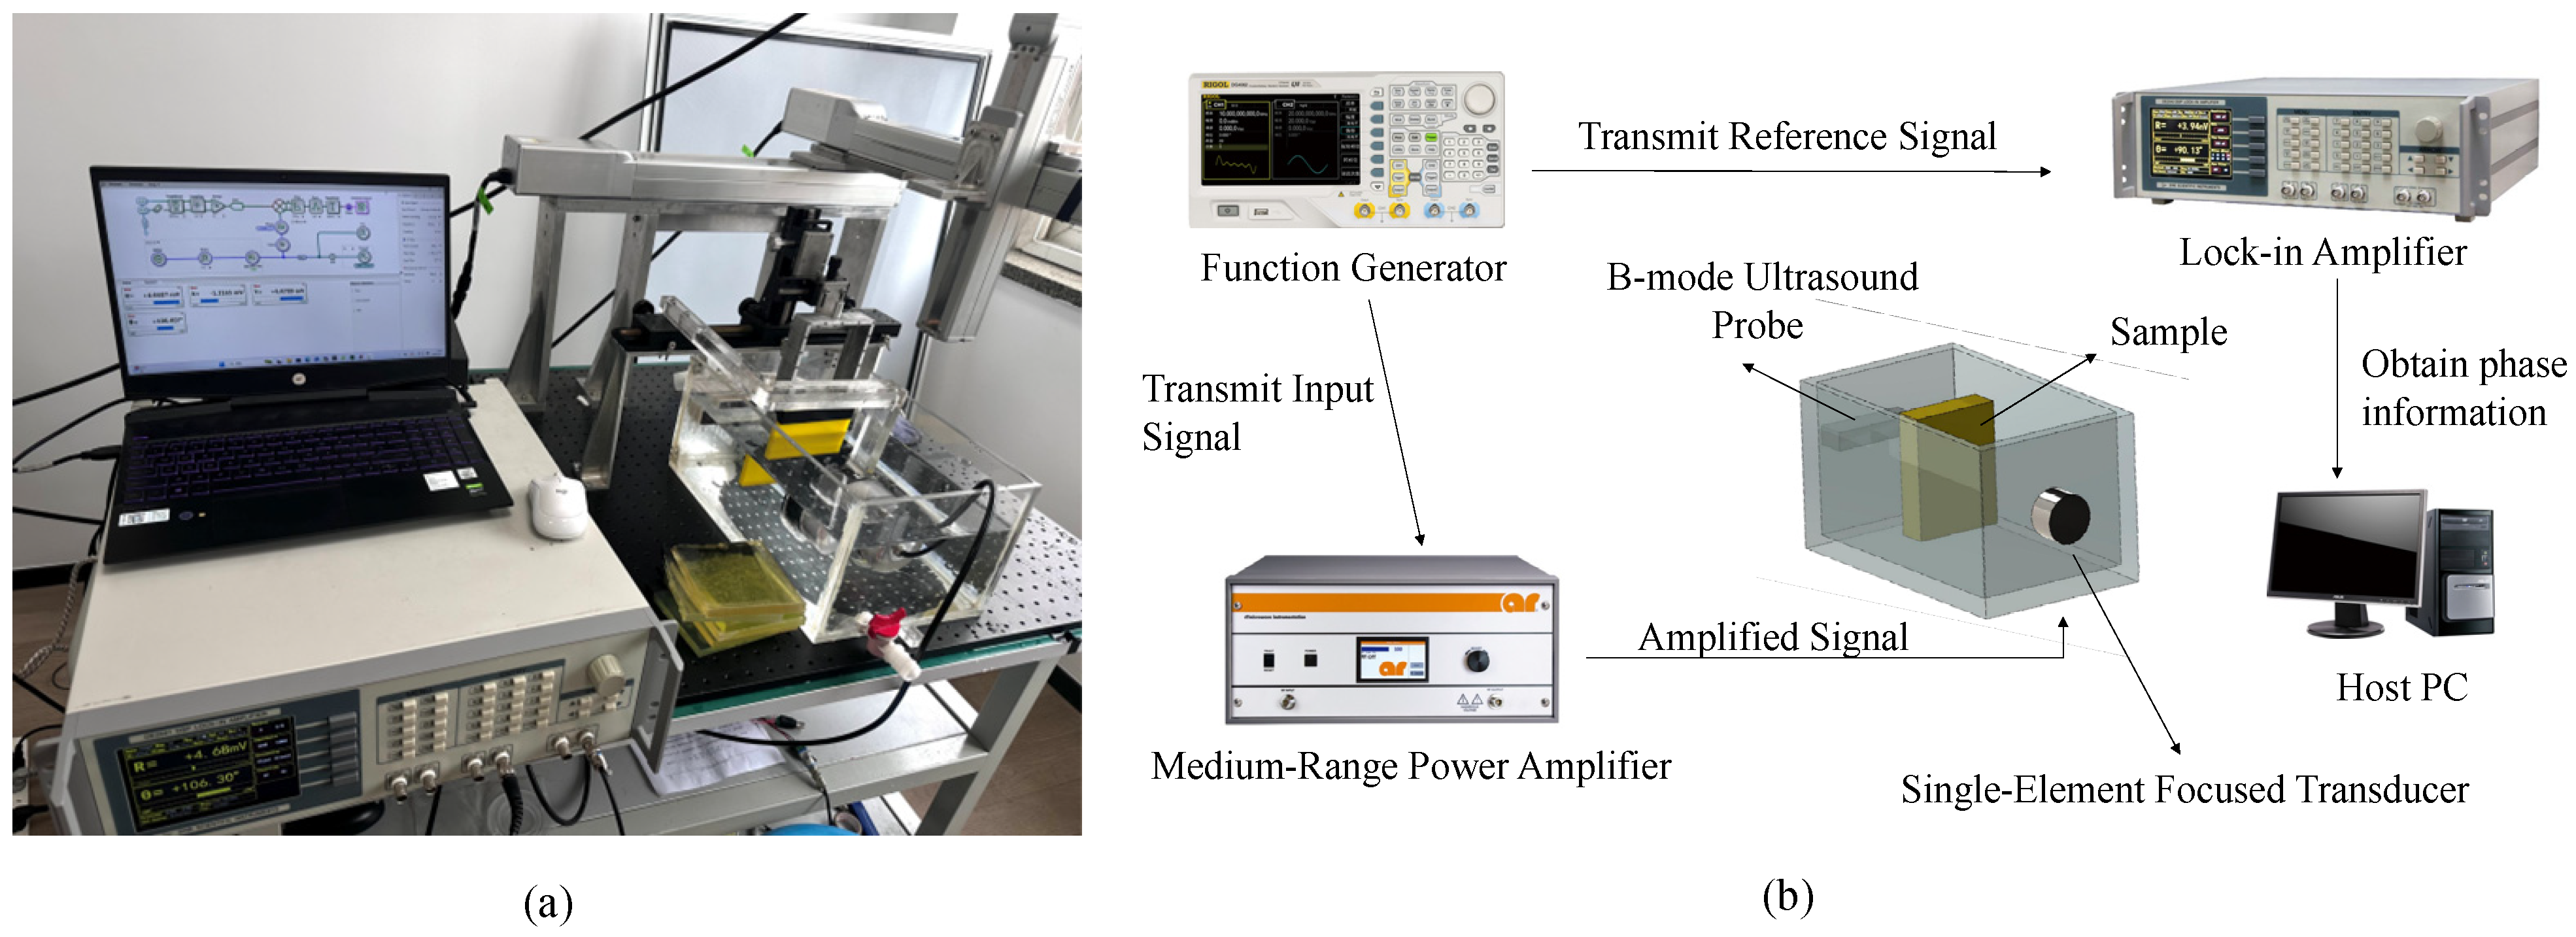
The experimental setup is depicted in
Figure 3. The excitation system comprised a function generator (RIGOL, DG4062, RIGOL TECHNOLOGIES CO., Ltd., Suzhou, China), a power amplifier (AR, 800A3B, AMETEK, Souderton, PA, USA), and a single-element focused transducer (focal length 9 cm, aperture diameter 5.6 cm, angular aperture 36.2°, operating frequency 600 kHz, Lab-made transducer, Hangzhou, China). The receiving system consisted of a hydrophone probe. Signal analysis was performed using a lock-in amplifier (Sine Scientific Instrument, OE2041, SSI INSTRUMENT, Guangzhou, China) connected to a host computer running custom analysis software (LIA_Console_V1.7.6.231031, SSI INSTRUMENT, Guangzhou, China), which captured the phase and amplitude of the transmitted signal.
4.2. Experimental Procedure
Seven polyurethane plates with Shore hardness ranging from A20 to A80 were used. Prior to testing, their densities were measured at 25 °C. To minimize interference from surface bubbles, all seven standard samples were immersed in degassed water or 30 min. The experimental protocol employed degassed ultrapure water prepared using a dedicated degassing system (DEDU, DMD-50K model) to ensure optimal acoustic transmission properties and eliminate potential interference from dissolved gases.
The experiments employed high-intensity focused ultrasound (HIFU) in the medical frequency range, which induces rapid and significant temperature rise within a short duration. This approach allows for efficient and effective comparison of viscous dissipation index variations across different materials. Each sample was positioned at the focal point of the transducer. To measure viscous loss, a continuous wave (600 kHz, 500 mV) was emitted and amplified to achieve incident acoustic powers of 7.2 W, 13.5 W, and 17 W. The receiving probe was connected to the lock-in amplifier, and the phase and amplitude of the transmitted signal were recorded for 3 s at 0.1 s intervals. The collection point was located approximately 2.5 mm radially from the focal axis. For determining transmission coefficients and sound velocities, a 600 kHz burst signal (50 ms-on, 50 ms-off) was used to analyze time delays and amplitude changes between the received and reference signals.
4.3. Data Inversion and Analysis
The phase variation in a propagating ultrasonic wave is intrinsically linked to the propagation velocity, which is dependent on both material properties and temperature. Consequently, for a given sample subjected to controlled heating at specific power levels, the temperature-dependent phase shift can be measured and utilized to derive the local sound velocity through the following inversion formula. Subsequently, the temperature distribution can be determined based on the established sound velocity-temperature correlation, thereby enabling the conversion of phase differences into temperature gradients. Finally, the viscous loss fraction can be quantitatively calculated from these derived parameters.
Based on the temperature field characteristics of focused ultrasound, according to the basic principle of phase shift temperature measurement of ultrasound transmission signals, it is known that when the emitted ultrasound radially and vertically transmits a non-uniform temperature field from the highest temperature, then the time of ultrasound passing through the non-uniform temperature field can be expressed as:
where
denotes the temperature at the position
at the time
,
denotes the sound velocity of ultrasound in the internal temperature field of the sample, and
is the radius of the radial distribution of the temperature field in the heated part. At this point, the phase shift through the non-uniform temperature field can be expressed as:
where
denotes the sound velocity of sample at room temperature,
denotes the phase shift, and
denotes the ultrasonic frequency of the incident probe. When the internal temperature field of the sample changes, the phase shift
will also change, so the sound velocity at the current temperature can be obtained by detecting the phase shift
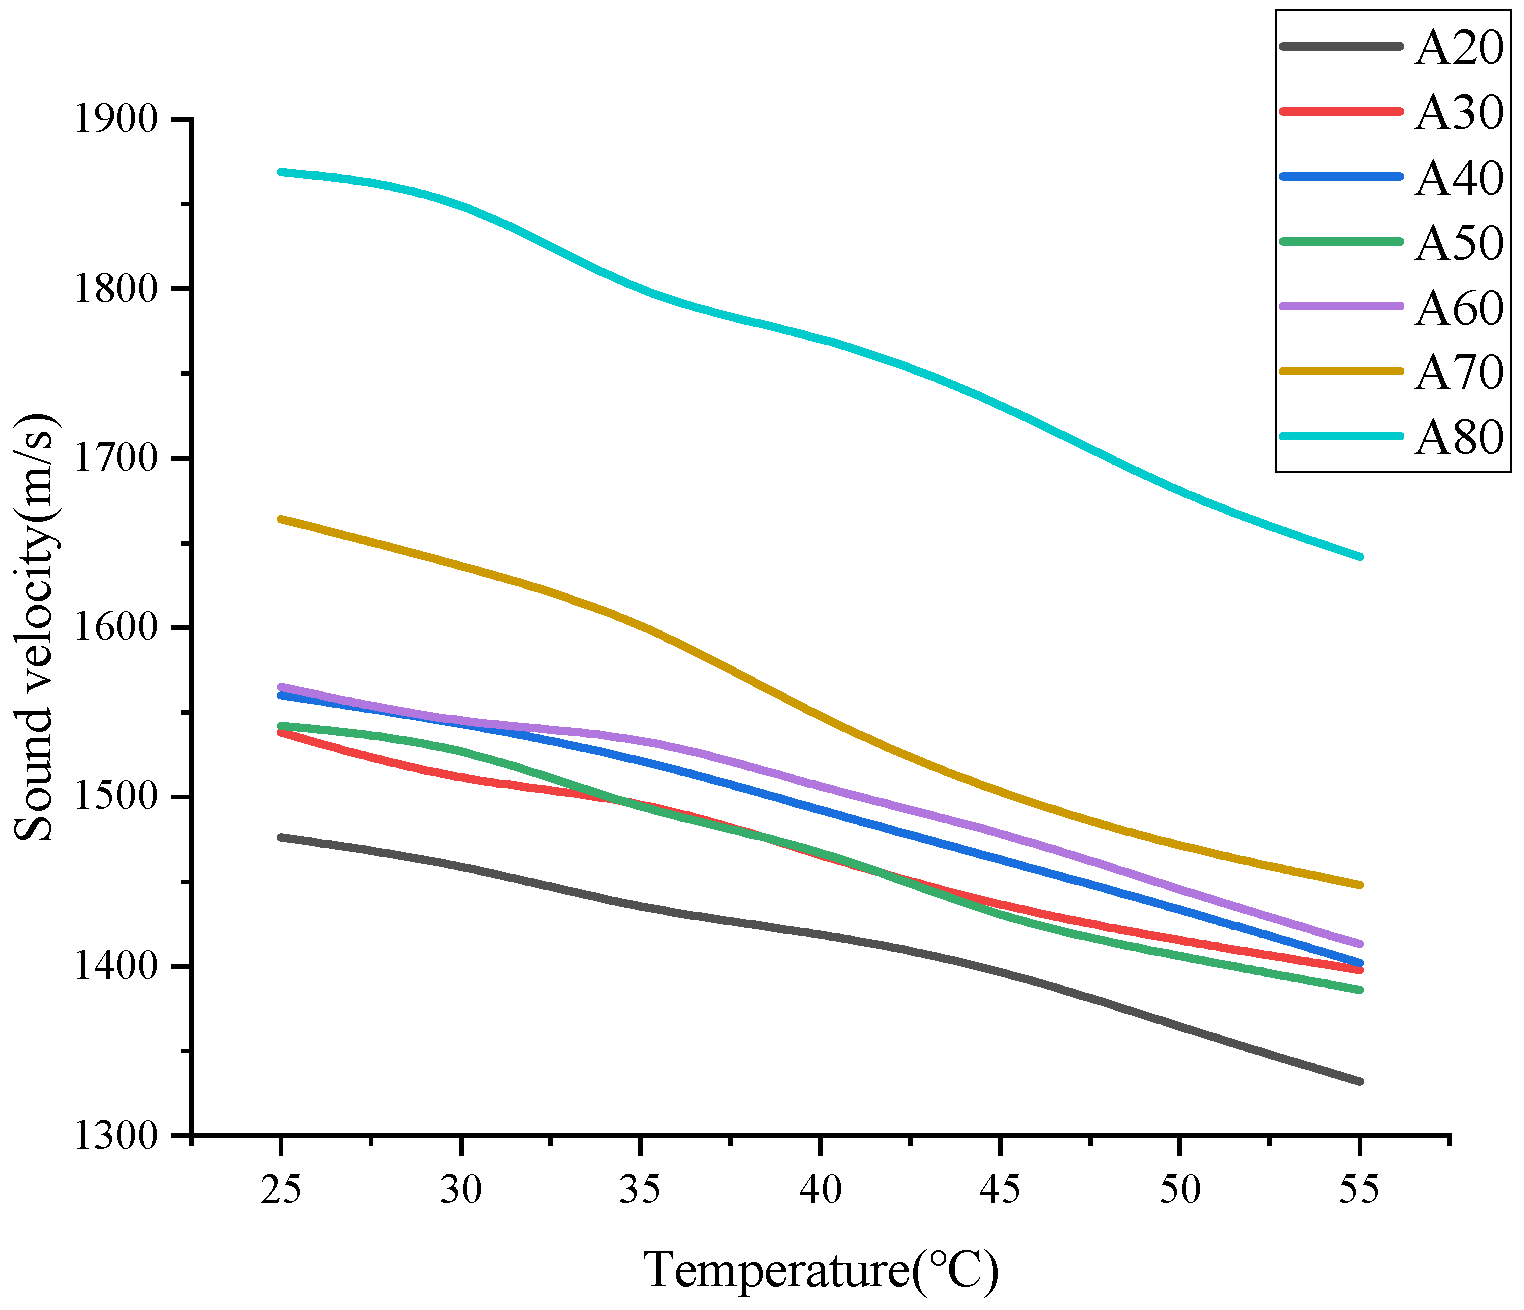
and then converted to the current temperature according to the correlation between the temperature and the velocity of sound. The correlation between the temperature and the velocity of sound obtained from experimental measurements is as follows in
Figure 4.
Once the temperature rise
is known, the viscous loss
can be calculated. Based on the simulation results, the isotherm at a radial distance of 2 mm from the focal point is approximately linear along the axial direction. We therefore estimate the viscous loss within this small cylindrical volume. The proportion of viscous loss
relative to the total dissipated energy
is given by:
where
is the specific heat capacity of the sample, m is the mass,
is the temperature difference,
is the percentage of viscous loss,
is the energy lost to viscous loss,
is the total energy lost due to scattering and viscous loss, and
is the incident energy.
4.4. Thermocouple Temperature Measurement
To validate the accuracy of the simulated temperature distribution and to confirm that the measured phase shifts are indeed caused by internal temperature variations, we employed thermocouples to monitor the rear surface temperature during ultrasonic irradiation. The experimental measurements were then compared with simulation results. This comparative analysis was conducted to verify that the observed phase shifts were caused by temperature increases, thereby excluding the possibility that these shifts resulted from surface interactions (e.g., acoustic scattering or reflection artifacts) in the high-hardness polyurethane samples.
The validation experiment employed a K-type adhesive thermocouple (KPS-ZT-TT-K-30-2000-LX), measurement range: −40 to 200 °C) attached to the rear surface of the A70 polyurethane plate at the focal region. Temperature measurements were recorded in real-time using a custom LabVIEW program to monitor temperature variations during ultrasonic irradiation. The experimental temperature data were then compared with simulation results. Throughout the experiment, the water temperature was maintained at 27 °C to ensure consistent testing conditions.
6. Conclusions
Current methods for measuring polymer viscosity are predominantly limited to low-frequency conditions, leaving a gap in effective high-frequency characterization. This study presents an improved methodology that accurately characterizes the polymer viscous dissipation index under high-frequency ultrasound. By employing phase-shift thermometry, we convert measured phase variations in transmitted signals—resulting from minute sound velocity changes during heating—into temperature profiles. Subsequent thermodynamic analysis determines the proportion of viscous loss in the total energy dissipation, providing an effective metric for the material viscous dissipation index. Due to the inherent limitations of the underlying principle, the proposed method is only applicable to viscoelastic materials that exhibit temperature-dependent sound velocity variations and possess homogeneous internal structures without cavity or bubble interference. However, this method is unsuitable for high-viscosity viscoelastic materials (e.g., ), as ultrasonic heating may merely induce localized softening without producing significant sound velocity changes. Furthermore, the method cannot be applied to non-Newtonian materials such as toothpaste or blood.
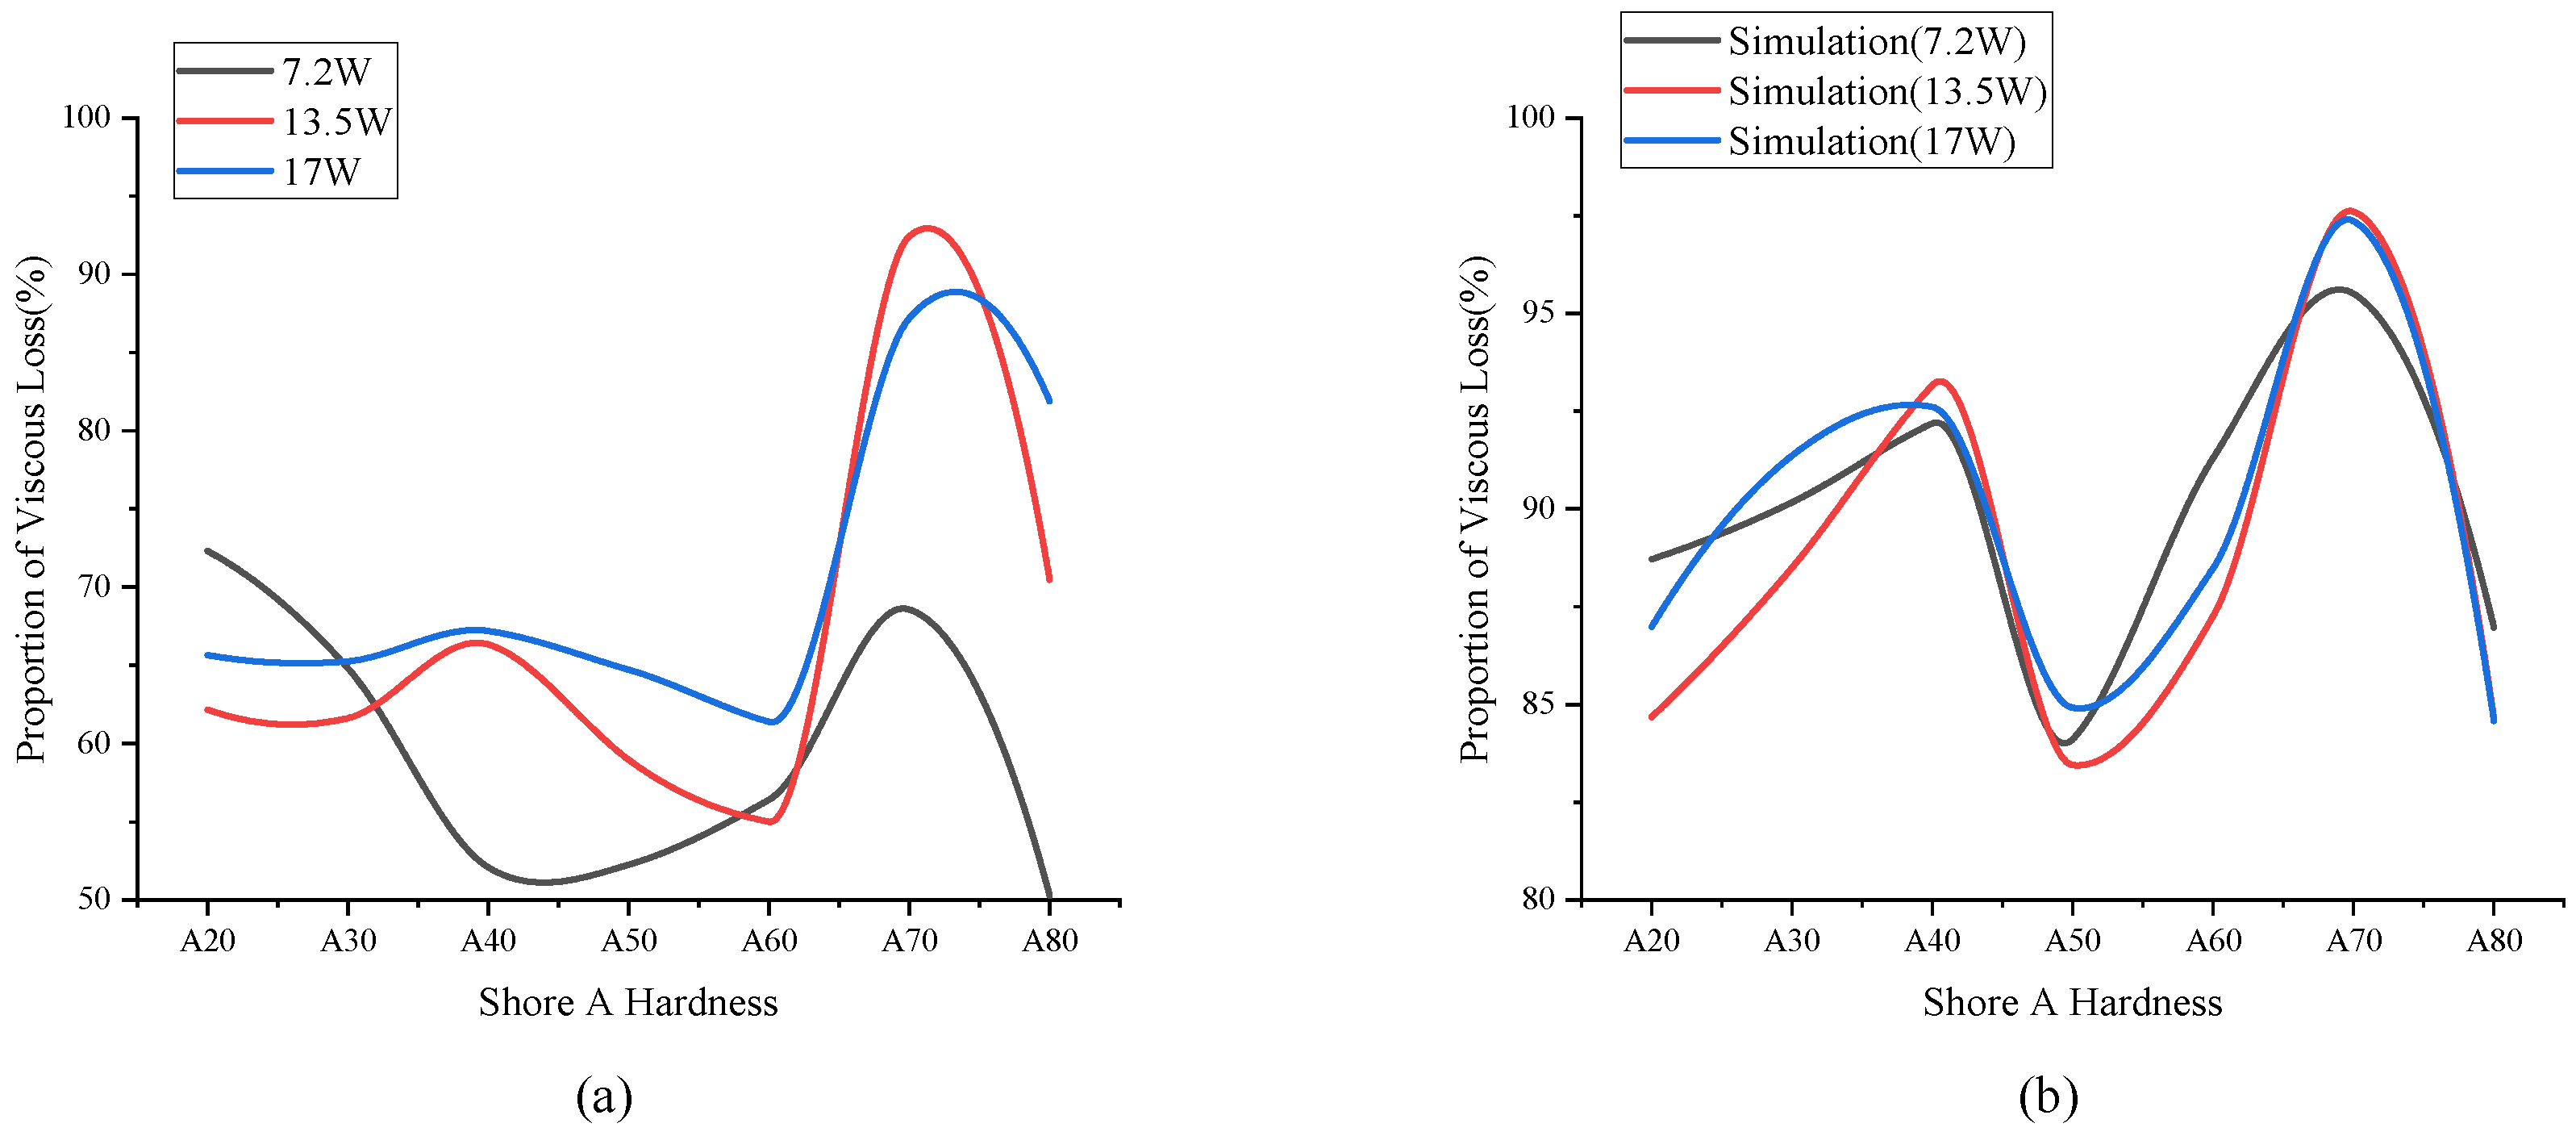
Experimental and simulation results demonstrate that the phase-shift thermometry method achieves high measurement accuracy, revealing a consistent temperature–hardness correlation. However, it is essential to properly control both the minimum incident power to reduce experimental interference and the applied ultrasound frequency. Excessive frequency levels would increase the Deborah number of polymer chains, resulting in viscosity reduction that significantly compromises measurement accuracy. While the calculated viscous loss values show some deviation from simulated results, the overall trends are well-matched.
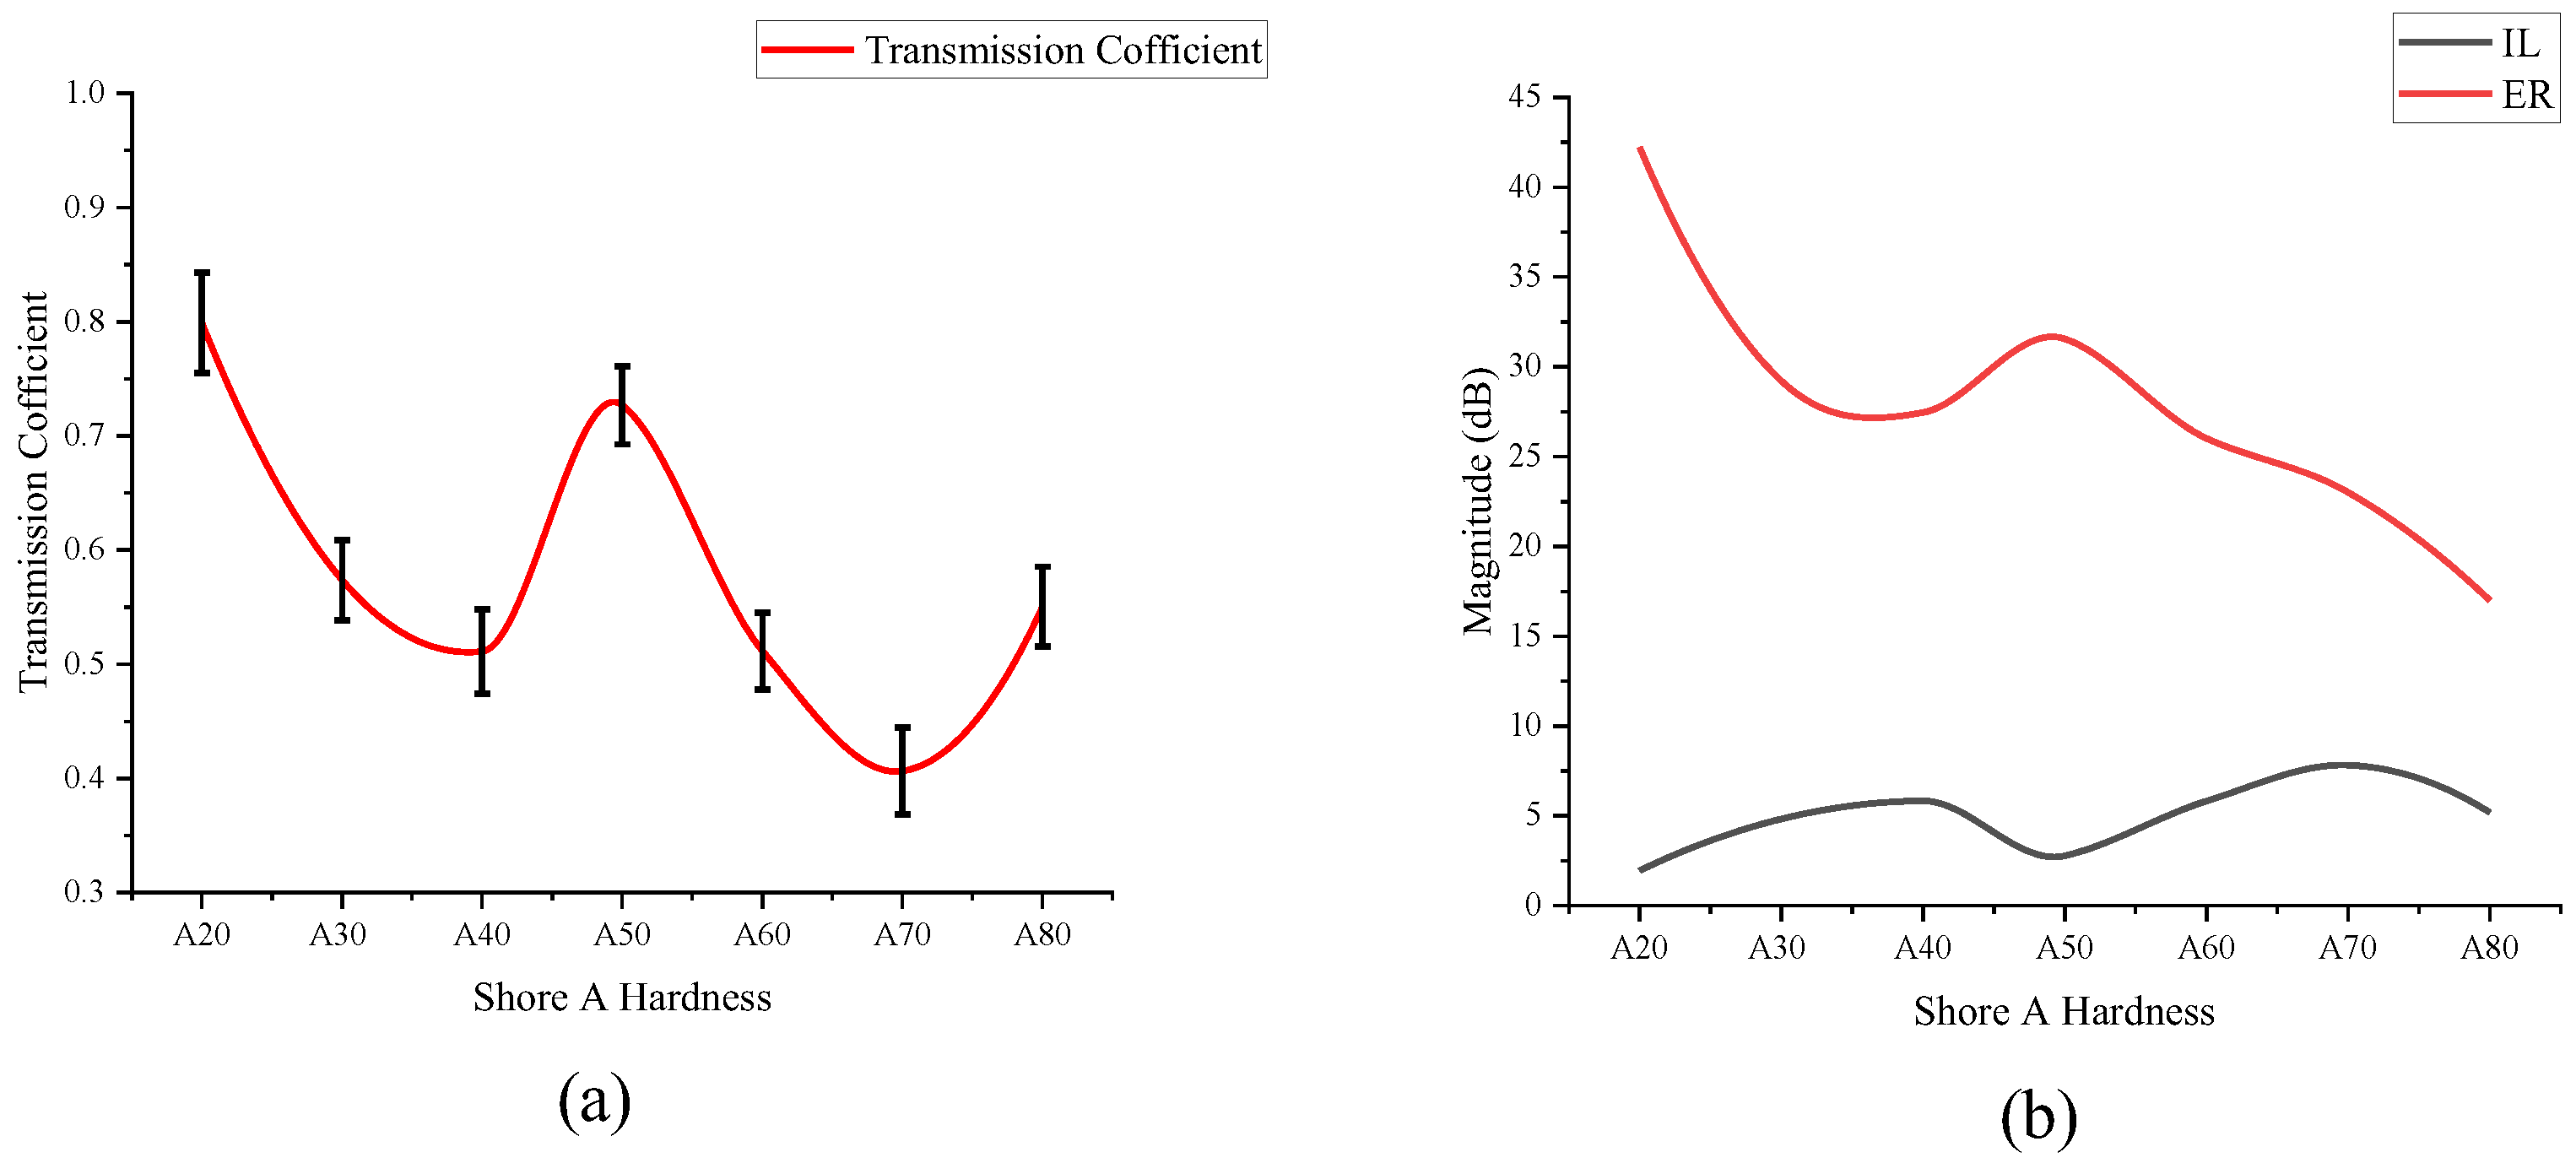
This study successfully used Shore hardness to differentiate polyurethanes, recognizing its correlation with intrinsic material characteristics like viscosity. The method can be extended to evaluate materials with well-defined mechanical properties [
28,
29] (e.g., tensile modulus, elongation at break), chemical compositions (e.g., polyether vs. polyester base), molecular weights, and crosslink densities, enabling a more comprehensive, viscosity-based material assessment. The established correlations between viscous loss and acoustic parameters like transmission coefficient and insertion loss further strengthen its potential as a robust characterization tool.

