Article

Temporal and Statistical Insights into Multivariate Time Series Forecasting of Corn Outlet Moisture in Industrial Continuous-Flow Drying Systems

Faculty of Mechanical Engineering, University of Maribor, Smetanova 17, SI-2000 Maribor, Slovenia
*
Author to whom correspondence should be addressed.
Appl. Sci. 2025, 15(16), 9187; https://doi.org/10.3390/app15169187
Submission received: 1 July 2025 / Revised: 25 July 2025 / Accepted: 20 August 2025 / Published: 21 August 2025

Abstract

Corn drying is a critical post-harvest process to ensure product quality and compliance with moisture standards. Traditional optimization approaches often overlook dynamic interactions between operational parameters and environmental factors in industrial continuous flow drying systems. This study integrates statistical analysis and deep learning to predict outlet moisture content, leveraging a dataset of 3826 observations from an operational dryer. The effects of inlet moisture, target air temperature, and material discharge interval on thermal behavior of the system were evaluated through linear regression and t-test, which provided interpretable insights into process dependencies. Three neural network architectures (LSTM, GRU, and TCN) were benchmarked for multivariate time-series forecasting of outlet corn moisture, with hyperparameters optimized using grid search to ensure fair performance comparison. Results demonstrated GRU’s superior performance in the context of absolute deviations, achieving the lowest mean absolute error (MAE = 0.304%) and competitive mean squared error (MSE = 0.304%), compared to LSTM (MAE = 0.368%, MSE = 0.291%) and TCN (MAE = 0.397%, MSE = 0.315%). While GRU excelled in average prediction accuracy, LSTM’s lower MSE highlighted its robustness against extreme deviations. The hybrid methodology bridges statistical insights for interpretability with deep learning’s dynamic predictive capabilities, offering a scalable framework for real-time process optimization. By combining traditional analytical methods (e.g., regression and t-test) with deep learning-driven forecasting, this work advances intelligent monitoring and control of industrial drying systems, enhancing process stability, ensuring compliance with moisture standards, and indirectly supporting energy efficiency by reducing over drying and enabling more consistent operation.

1. Introduction

Agriculture 5.0 represents the next frontier in agricultural innovation, building on Industry 5.0’s principles of human–machine synergy, sustainability, and resilience to transform food production systems [1]. Emerging in the mid-2020s, this paradigm leverages advanced artificial intelligence, robotics, and data-driven technologies to address pressing global challenges, including climate change, resource scarcity, and the rising demand for food security [2,3]. For corn, a vital pillar of global agriculture, Agriculture 5.0 drives optimization across the value chain, from precision farming to post-harvest processing [4].

1.1. Background and State of the Art

Drying is a cornerstone of post-harvest corn processing, essential for reducing moisture content to safe levels, which are typically under 14.5% for corn [5], 13–14% for wheat [6], 12–14% for barley [6], and 11–13% for soybeans [7], to prevent spoilage, preserve nutritional quality, and meet market standards [8]. As a critical step in ensuring product integrity and economic viability, the drying process demands precise control of operational and environmental factors to optimize efficiency and minimize energy consumption [9]. In industrial settings, continuous flow drying systems are widely employed to handle large volumes of corn, yet their performance hinges on complex interactions among process parameters, such as air temperature, air velocity and external conditions like ambient weather [10].
Traditional approaches to corn drying analysis and optimization have primarily relied on mechanistic and empirical models to describe heat and mass transfer dynamics. For instance, Wang et al. [11] investigated the impact of airflow quantity on drying characteristics, emphasizing its role in governing heat and mass transfer in corn particles. Similarly, Thompson et al. [12] developed foundational models based on heat and mass transfer equations to predict moisture migration within corn kernels, and though these models were able to capture drying dynamics, they often oversimplify real-world complexities.
Gautam et al. [13] applied response surface methodology to optimize convective fluidized bed drying, highlighting the statistical significance of temperature and airflow in determining drying efficiency. Similarly, response surface methodology was used by Majdi et al. to optimize the convective drying system for apple processing. Aranha et al. [14] further advanced statistical modeling by developing a mathematical model of intermittent drying based on experimental temperature and moisture data, enabling precise estimation of diffusivity and heat consumption. Recent work by Valencia Ceballos et al. [15] examined a hybrid photovoltaic-thermal solar dryer from a techno-economic and environmental perspective, demonstrating how integrated system design can complement traditional process optimization approaches in drying applications. These studies underscore the utility of statistical tools in identifying key process drivers but are limited by their static nature, which fails to capture the time-dependent dynamics and lagged effects inherent in continuous drying processes [16].
Recent advancements in AI, particularly neural network-based models, have opened new avenues for modeling the complex, nonlinear, and temporal relationships in corn drying [17,18,19,20]. Aji et al. [21] employed neural networks to dynamically model the drying process, demonstrating their ability to forecast moisture content based on process parameters. Building on this, Simonič et al. [22] successfully applied Long Short-Term Memory (LSTM) networks to predict outlet corn moisture, leveraging their capacity to learn from sequential data. Other architectures, such as Gated Recurrent Units (GRUs) and Temporal Convolutional Networks (TCNs), have shown promise in related agricultural applications, with studies like Zhang et al. [23] highlighting their efficiency in time-series forecasting. However, the comparative performance of these models in corn drying remains underexplored, and debates persist regarding their robustness under varying operational conditions. For example, while LSTMs excel at capturing long-term dependencies [24], TCNs may offer computational efficiency [25], and GRUs could balance complexity and performance, necessitating systematic benchmarking [26].

1.2. Advantages and Limitations of AI in Corn Drying

Corn drying optimization has traditionally employed analytical and statistical methods. Analytical approaches, using heat and mass transfer equations, are effective for batch drying but struggle with the dynamic interactions in continuous flow systems [11,16]. Statistical methods, like response surface methodology, identify key parameters but miss temporal dynamics [13,14]. In contrast, AI models, such as LSTM and GRU, excel at capturing nonlinear relationships and temporal dependencies, accurately predicting outlet moisture despite variable inlet moisture and weather fluctuations [22,23]. This supports real-time optimization and reduces energy consumption.
However, AI models require large, high-quality datasets, often limited by noisy sensor data in industrial drying systems. Their black-box nature also reduces interpretability, potentially lowering operator trust under fluctuating conditions, such as extreme humidity [27]. Analytical models, while interpretable, lack flexibility for continuous flow systems.

1.3. Objectives and Contributions

This study addresses the challenge of accurately modeling and forecasting outlet corn moisture in continuous-flow drying systems, a process characterized by complex, time-dependent interactions between multiple variables. Traditional static models fall short in capturing these temporal dynamics and delayed effects.
To overcome these limitations, we first perform a comprehensive statistical analysis using regression and t-tests to quantify the individual effects of inlet moisture, target air temperature, and material discharge interval on the system’s thermal behavior. Building on these insights, we then benchmark three deep learning architectures for multivariate time-series forecasting of outlet moisture.
While a limited number of studies have applied various deep learning techniques for corn moisture prediction, no prior work has systematically compared different architectures. In particular, there is a notable lack of studies exploring GRU or TCN models for time-series forecasting in this context. This gap motivates our comparative evaluation and hybrid approach.
This hybrid methodology enhances both interpretability (via statistical modeling) and predictive accuracy (via deep learning), aiming to support data-driven process optimization in industrial corn drying operations.
Based on prior research and observed operational dynamics, the following hypotheses were formulated for the regression and t-test analysis, aiming to quantify the influence of key process variables on internal module temperatures:
H1. 
Inlet corn moisture (MI) has a statistically significant effect on internal module temperatures in the drying system.
H2. 
Target air temperature (TA) has a statistically significant effect on internal module temperatures.
H3. 
Material discharge interval (MD) has a statistically significant effect on internal module temperatures.
H4. 
There is a statistically significant difference in internal module temperatures between drying sessions with TA ≤ 110 °C and TA > 110 °C.
The key contributions of this study are as follows:
  • Comprehensive statistical analysis of process variables using regression and hypothesis testing.
  • Comparative evaluation of LSTM, GRU, and TCN models for multivariate time-series forecasting.
  • Assessment of temporal robustness through visual inspection of sequential prediction behavior.

2. Materials and Methods

This study extends our prior work [22], which developed an LSTM model for predicting corn moisture content in a continuous drying system. The experimental setup, data collection, and dataset remain identical to those described in Simonič et al. [22]. A summary of the key methodological aspects is provided below; full details can be found in Simonič et al. [22].

2.1. Experimental Setup

Data were collected under real operational conditions in a continuous-flow convective drying system. The dryer, manufactured by Bühler Group (Uzwil, Switzerland), has been in use since 2015 at a commercial drying facility in north-eastern Slovenia¸ by the company Simtro energija d. o. o. [28]. It consists of a vertically stacked modular chamber with a total height of 13,185 mm and a square cross-section of 2750 mm × 2750 mm. A schematic of the drying tower is shown in Figure 1, while detailed system specifications, module configurations and material flow information can be found in the original publication [22].
A total of 3826 observations were manually recorded over drying seasons between September and October. Sampling was conducted at approximately 1 h intervals, to ensure temporal consistency and capture the dynamic behavior of the system. Each record included the following:
  • User-defined settings: Target air temperature and material discharge interval.
  • Process parameters: Module temperatures at three positions along the drying path (T3, T5, and T6). These parameters reflect both feedstock conditions and internal thermal states of the dryer.
  • Moisture measurements: Inlet and Outlet corn moisture content, which was measured using a Schaller portable moisture meter and cross-validated using an Infratec 1241 grain analyzer. The average measurement deviation between devices was 0.09%, ensuring high reliability [22]. Measurement traceability was verified through periodic calibration against certified standards provided by Bureau Veritas Slovenia [29].
  • Weather data: Ambient temperature, relative humidity, precipitation, and solar radiation data were acquired from two nearby meteorological stations (Radenci and Gačnik), operated by the Environmental Agency of the Republic of Slovenia [30]. These were included to account for environmental variability affecting dryer performance.
The dataset covers a broad range of seasonal and operational conditions, making it representative for modeling of the dryer behavior.
The inlet moisture content ranged from 14.0% to 36.8%, with a mean value of 25.4%, while outlet moisture ranged from 10.0% to 26.0%, averaging 13.6%. On average, the drying process removed 11.8 percentage points of moisture per pass, reflecting a wide range of drying conditions encountered during the campaign. The highest outlet moisture values (up to 26.0%) were primarily recorded during startup phases, when process parameters had not yet stabilized and full drying performance had not been achieved.

2.2. Variable Summary and Preprocesing

An overview of all variables collected during the experimental campaign is presented in Table 1. These include operator-defined settings, internal temperature parameters, inlet and outlet moisture values, and weather-related parameters. Their physical relevance, however, is supported by observed operational behavior and statistical analysis. In our previous study [22], weather variables were examined using regression analysis. While correlations with outlet moisture were generally low, some measurable effects were identified. These weak correlations are expected, as skilled operators frequently adjusted process parameters in response to changing weather conditions, partially masking the direct influence of ambient factors. For instance, solar radiation was observed to cause internal dryer temperatures to rise significantly during sunny periods, requiring manual compensation. Similarly, ambient temperature and humidity affect the drying air’s moisture-carrying capacity, while precipitation can increase the moisture content of corn stored outdoors. Including these variables enables the model to account for such real-world fluctuations, thereby improving prediction robustness under varying environmental conditions. Each variable in Table 1 is labeled with a unique code, a brief description, measurement units, and the associated data source or instrumentation.
While meteorological variables such as ambient temperature, relative humidity, precipitation, and solar radiation were included in the modeling inputs to reflect environmental variability, their individual impact on outlet moisture prediction was not analyzed in depth in the present study. These variables were already examined in detail in our previous work [22], where their statistical contribution was evaluated and temporal dependence on outlet moisture was identified. In that study, Table 1 summarizes the typical values and ranges of these environmental and process variables, providing additional context for their influence on drying behavior. Therefore, in this study, weather variables are included to preserve model generalizability across changing ambient conditions, but no further analysis is conducted.
Due to occasional sensor faults or delayed logging, some variables contained missing values. The most affected parameter was T3, with 28.94% missing entries, while other variables exhibited considerably lower missingness. The imputation procedure applied in this study is identical to the approach used in our previous work [22], where a hybrid strategy was implemented:
  • Nearest neighbor and average neighbor imputation for temperature sensors using adjacent time points;
  • Linear interpolation for continuous series such as target air temperature and inlet moisture;
  • Regression imputation for variables with strong inter-feature correlations.

2.3. Statistical Analysis Approach

To investigate the relationships between process parameters and thermal behavior within the drying system, a series of statistical tests were conducted using IBM SPSS Statistics, Version 29 [31]. The goal was to quantify the extent to which key input variables (MI, TA, MD) influenced the internal temperature profile of the dryer.

2.3.1. Regression Analysis and F-Tests

Simple linear regression models were constructed to assess the individual effects of inlet moisture (MI), target air temperature (TA), and material discharge interval (MD) on the measured module temperatures (T3, T5 and T6). For each relationship, standardized beta coefficients (β), coefficients of determination (R2) and significance levels (p-values) were calculated. To determine whether each linear model significantly explained variability in the dependent variable, F-tests were applied. A significance threshold of p < 0.05 was used for model acceptance. Models with p-values below this threshold were considered statistically significant. Table 1 provides an overview of the variable types used in the regression analysis, distinguishing between independent input variables and temperature-related output parameters.

2.3.2. Independent-Sample T-Tests

To evaluate the influence of target air temperature (TA) on thermal behavior within the drying system, a two-sample independent t-test was conducted. The TA variable was divided into two groups: Group 1 (TA ≤ 110 °C) and Group 2 (TA > 110 °C), with the threshold selected based on the dataset’s median value to ensure balanced group sizes for comparative analysis. Homogeneity of variances between the groups was assessed using Levene’s test at a significance level of α = 0.05. Statistical significance for temperature differences was predefined at p < 0.05, adhering to conventional thresholds for hypothesis testing in industrial process studies. This approach facilitated a systematic comparison of module temperature outcomes (T3, T5, T6) under distinct operational regimes.

2.4. Neural Network Modeling Approach

This section outlines the deep learning methodology employed for predicting outlet moisture content in a continuous-flow corn drying process. Three neural network architectures were developed and evaluated for this task: Long short-term memory (LSTM), Gated recurrent unit (GRU) and Temporal convolutional networks (TCN). All models followed an identical pipeline in terms of data preprocessing, hyperparameter tuning, training, and evaluation to ensure consistency and comparability across different network types.

2.4.1. Data Preparation and Normalization

Following imputation (Section 2.2), process parameters and weather variables were normalized to the [0, 1] range using the MinMaxScaler from scikit-learn, Version 1.6.1 [32]. To prevent data leakage, normalization was applied separately to the training, validation, and test subsets. Outliers in the target variable (MO) were clipped at the 99th percentile to mitigate the influence of extreme values, which resulted from dryer startup phases, brief power interruptions, or other system malfunctions. Chronological splitting was applied to partition the data into training (80%), validation (10%), and test (10%) subsets. The split was designed to capture representative seasonal conditions in each subset, while strictly preserving the sequential nature of the drying process.
For time-series modeling, feature engineering involved a sliding window approach to generate temporal input sequences. Each sample consisted of a fixed-length window of multivariate input features and a corresponding single target value, enabling the models to learn from past observations to predict future moisture content.

2.4.2. Model Architecture

The neural network model consisted of three main layers:
  • An input layer accepting multivariate time sequences with variable window sizes;
  • A single layer with recurrent block (LSTM, GRU or TCN) with 64 units, followed by dropout regularization;
  • A dense hidden layer with a tunable activation function (e.g., ReLU or Swish);
  • A final output layer producing a single regression value (outlet moisture).
The model architecture was implemented using TensorFlow and compiled with mean squared error (MSE) as the loss function, a tunable optimizer (e.g., Adam, Nadam, RMSProp) and tunable activation function in recurrent layer (relu, swish and sigmoid). Root mean squared error (RMSE) was tracked as an evaluation metric during training.

2.4.3. Hyperparameter Optimization

Given that the dataset consisted exclusively of numerical time-series data with moderate dimensionality, GPU acceleration was not essential for model training. Instead, all computations were efficiently performed on a high-performance multi-core CPU system. To accelerate the grid search process, multiprocessing was utilized to parallelize the evaluation of model configurations across all available CPU cores. This approach fully leveraged the capabilities of a 16-core (32-thread) AMD Ryzen 9 5900HX (Advanced Micro Devices, Inc., Santa Clara, CA, USA) processor, resulting in a substantial reduction in total training time without relying on CUDA-based GPU acceleration.
Model tuning was performed using GridSearchCV from scikit-learn, version 1.6.1 [33], wrapped around a KerasRegressor [34]. Grid search is a brute—force search strategy that systematically evaluates all combinations of predefined hyperparameter values to identify the best—performing configuration. While more advanced optimization strategies (e.g., random search or genetic algorithms) exist, grid search was selected for its exhaustiveness, reproducibility, and suitability for smaller hyperparameter spaces, as confirmed by comparative studies such as [35]. Given the moderate dimensionality of our parameter grid and the use of parallelized CPU computation, grid search provided a computationally feasible and robust method for identifying optimal settings in this specific application. A comprehensive hyperparameter grid was defined, varying key parameters, presented in Table 2.
As part of the hyperparameter search, several commonly used activation functions and optimizers were evaluated to improve model performance. The activation functions included the following:
  • ReLU (Rectified Linear Unit): f x = m a x ( 0 , x ) n [36].
  • Sigmoid: f x = 1 1 + e x [37].
  • Swish: f x = x · 1 1 + e x = x · s i g m o i d [38].
Swish, one of the less known activation functions has been shown to outperform ReLU in certain deep learning tasks due to its ability to retain small negative values and provide smooth gradients [38].
The optimizers considered in this study included the following:
  • Adam: Adaptive Moment Estimation combining momentum and RMSProp principles [39].
  • RMSProp: Utilizes a moving average of squared gradients to adapt learning rates [39].
  • Nadam: An Adam variant incorporating Nesterov momentum acceleration [40].
These functions were selected based on their strong performance in previous deep learning applications and their suitability for training time-series models.
TimeSeriesSplit [41] was used to preserve the sequential nature of the data across cross-validation folds, maintaining the temporal structure essential for time-series prediction. The best parameter combination was selected based on the minimum mean squared error across validation folds.

2.4.4. Model Training, Evaluation and Visualization

The final model was retrained using the best parameter configuration and evaluated on separate validation and test sets. Early stopping and model checkpointing were employed to prevent overfitting and retain the best-performing model.
Model performance was evaluated using several standard regression metrics:
  • Mean absolute error (MAE);
  • Root mean squared error (RMSE);
  • Mean absolute percentage error (MAPE);
  • Mean squared error (MSE).
Residuals were analyzed through boxplots and line plots to assess prediction bias and variance. Evaluation metrics were computed across all samples and aggregated by fold to assess consistency.
Prediction results, model metrics and top 10 hyperparameter configurations were exported to Excel for result representation and further analysis. Diagnostic plots comparing predicted and actual values, as well as residual distributions, were generated for the test set.

3. Results and Discussion

In the initial phase, an analysis to examine statistically significant effects of independent variables on process parameters (dependent variables) was performed. This analysis employed linear regression models and t-tests to uncover statistically significant relationships and serve as a physical interpretability benchmark for subsequent deep learning models. A p-value threshold of 0.05 was used to determine statistical significance throughout the analysis. For better transparency, the abbreviations for the relevant variables are presented in Table 1. In the following phase, these parameters will be analyzed as predictors of the moisture content at the exit of the drying system.

3.1. Statistical Effects of Inlet Corn Moisture (MI) on Process Parameters

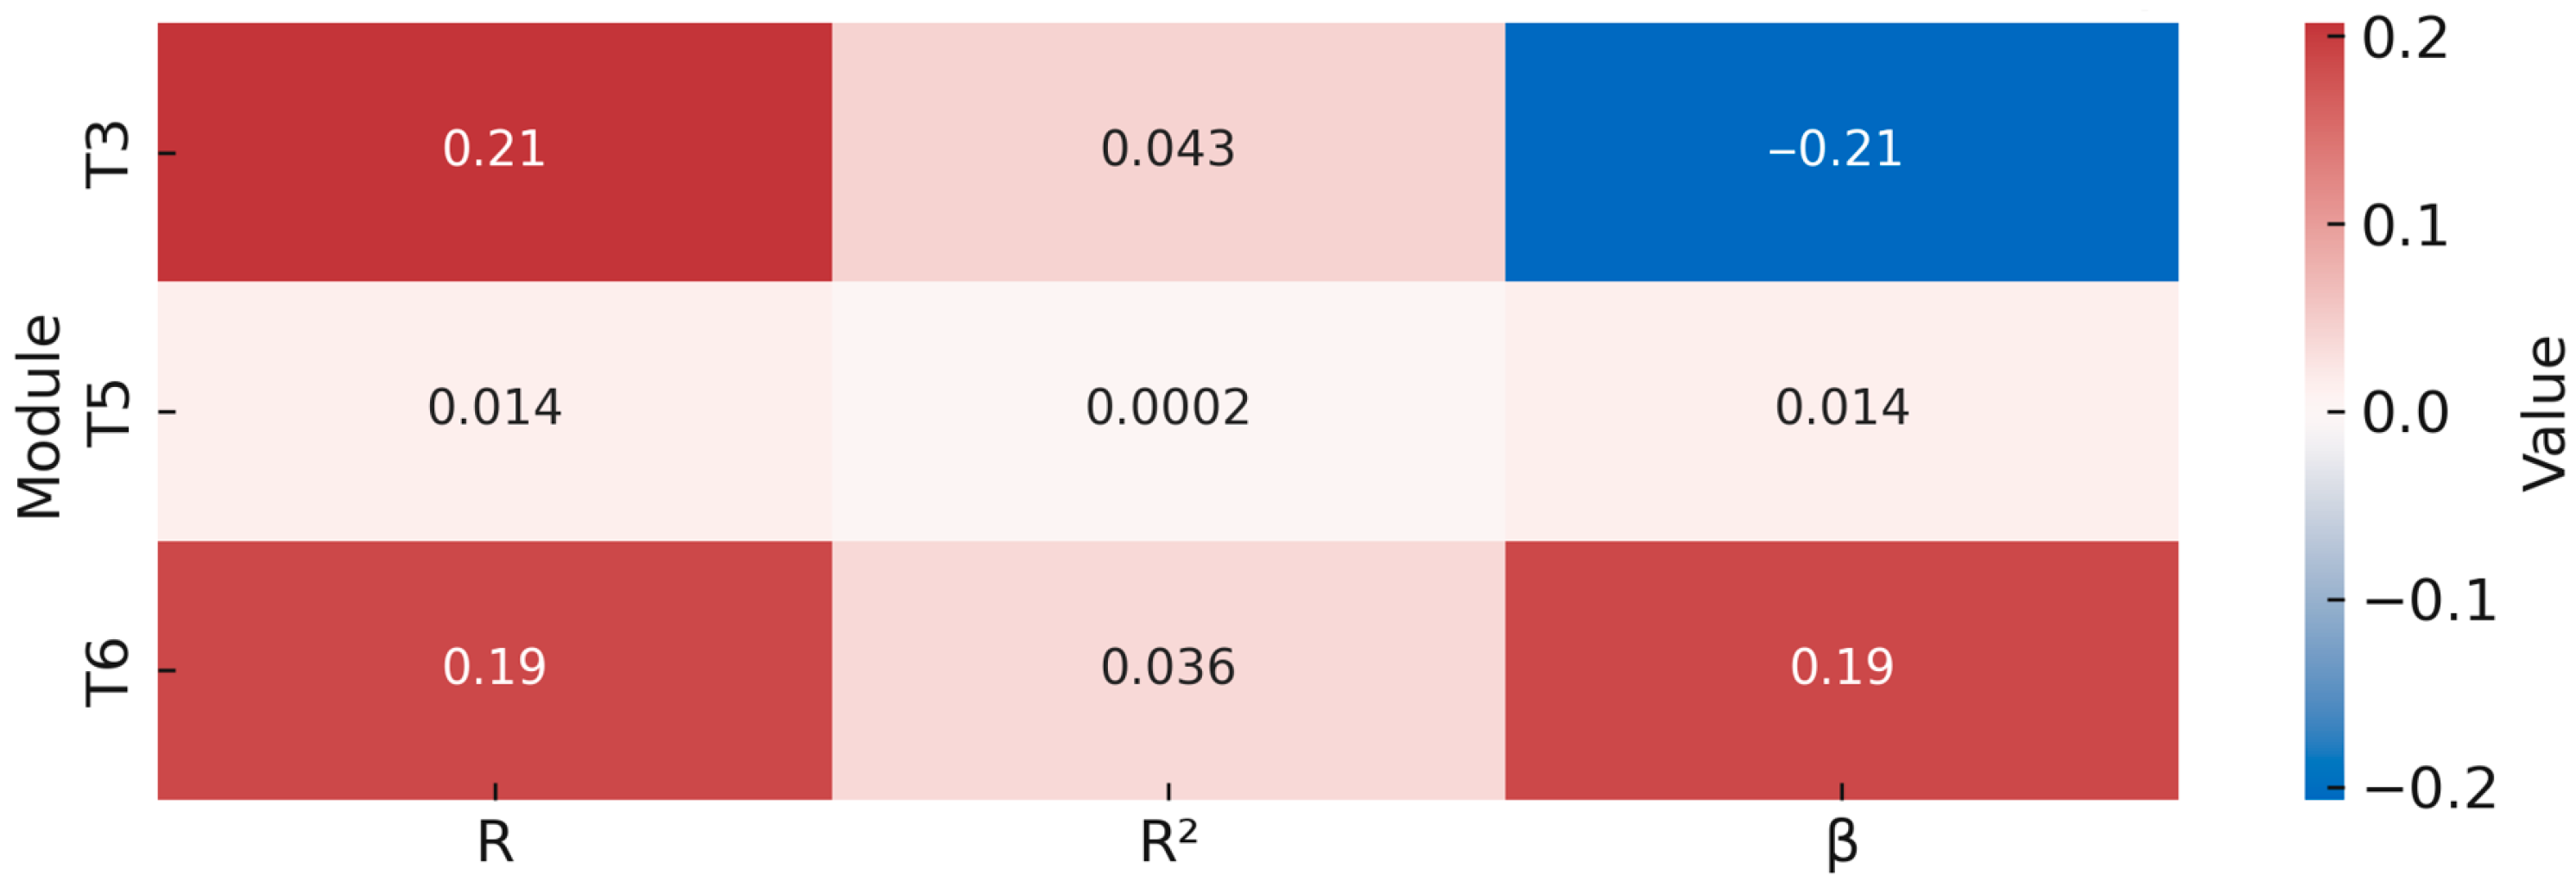
Regression analysis showed that inlet corn moisture (MI) had weak but statistically significant effects on temperatures in modules T3 (β = −0.21, R2 = 0.043, p < 0.001) and T6 (β = 0.19, R2 = 0.036, p < 0.001), explaining 4.3% and 3.6% of the variance, respectively. No significant impact was observed for T5 (β = 0.014, R2 ≈ 0.0002, p = 0.396), as the p-value exceeds the commonly accepted significance threshold. These results suggest that MI influences thermal behavior in some parts of the drying system, though the effect size is limited. Time-delayed responses or operator-controlled adjustments may explain these weak correlations. F-tests confirmed the statistical significance of the models for T3 and T6. An overview of correlation strength and regression coefficients is shown in Figure 2.
These results support Hypothesis H1, indicating that inlet moisture has a statistically significant but weak effect on specific module temperatures (T3 and T6), while no significant correlation was observed for T5.

3.2. Statistical Effects of Target Air Temperature (TA) on Process Parameters

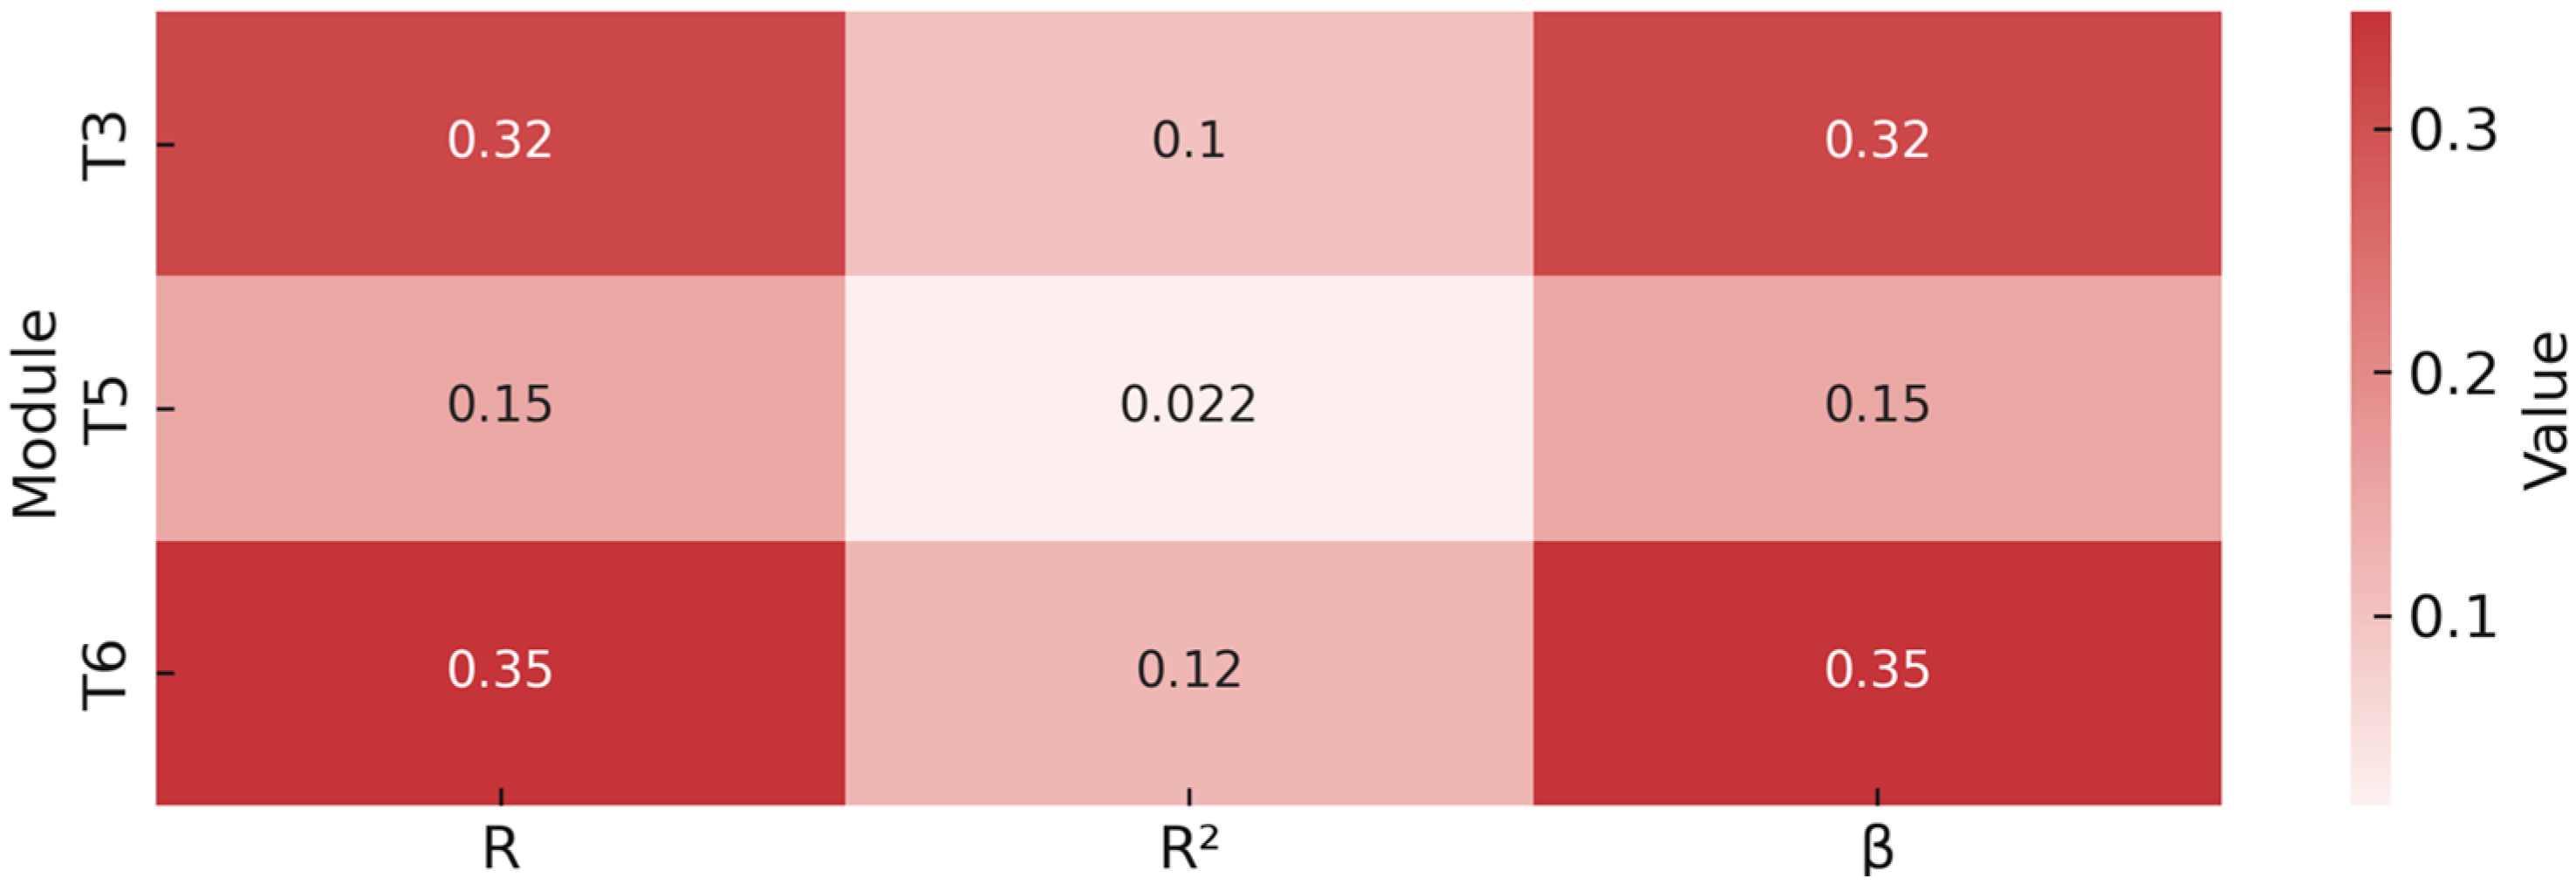
Regression analysis showed that target air temperature (TA) had moderate and statistically significant effects on temperatures in all three modules: T6 (β = 0.35, R2 = 0.12, p < 0.001), T3 (β = 0.32, R2 = 0.10, p < 0.001), and T5 (β = 0.15, R2 = 0.022, p < 0.001), explaining 12%, 10%, and 2.2% of the variance, respectively. These results suggest that TA plays a measurable role in shaping the thermal profile of the drying system, especially in later modules. The relatively strong correlations in T6 and T3 may reflect the cumulative thermal effects as the drying process progresses. All three models were statistically significant according to F-tests. An overview of correlation strength and regression coefficients is shown in Figure 3.
The analysis confirms Hypothesis H2, with target air temperature showing a statistically significant effect on all modules, particularly T6 and T3.

3.3. Statistical Effects of Material Discharge Interval (MD) on Process Parameters

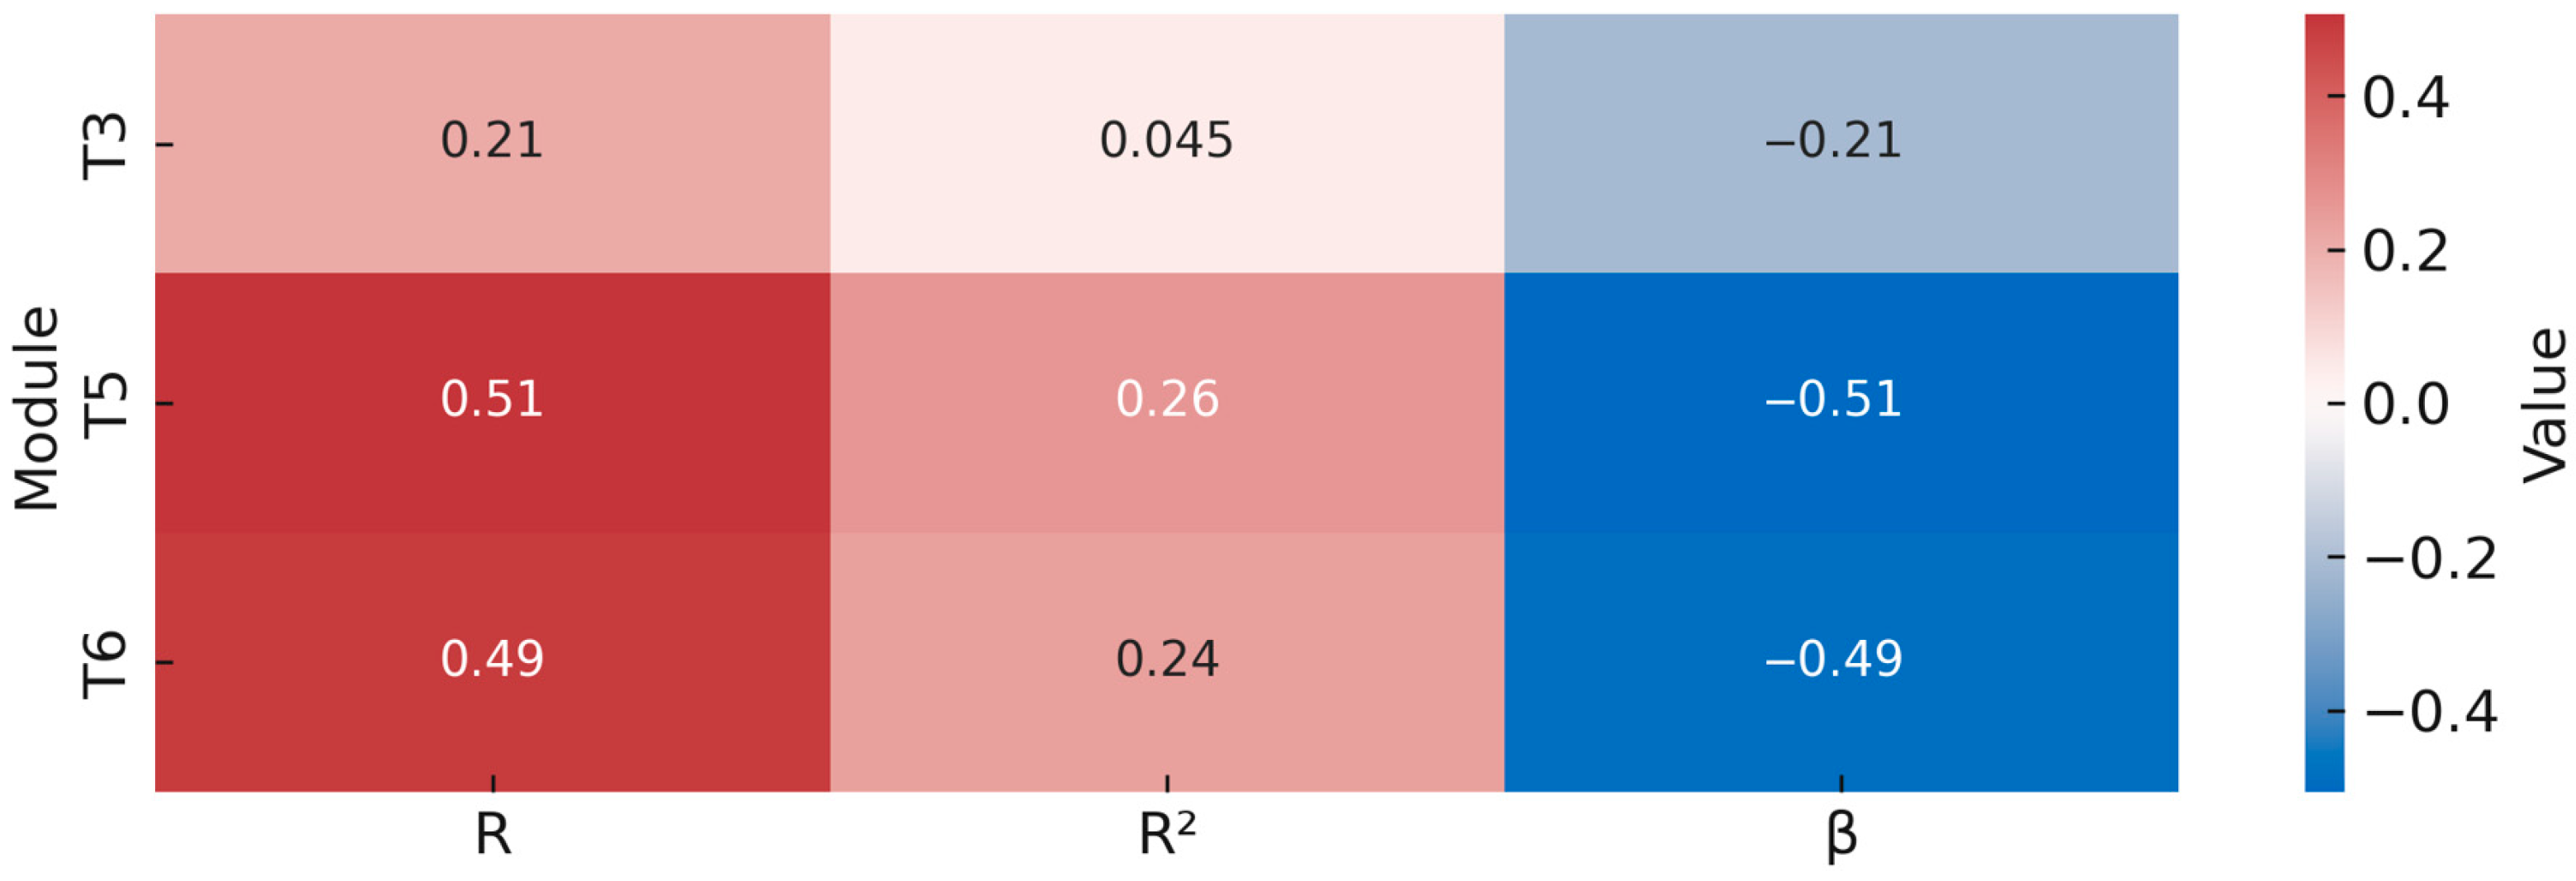
Regression analysis showed that material discharge interval (MD) had moderate and statistically significant effects on module temperatures, particularly in T5 (β = −0.506, R2 = 0.257, p < 0.001) and T6 (β = −0.487, R2 = 0.237, p < 0.001), explaining 25.7% and 23.7% of the variance, respectively. A weaker but still statistically significant effect was observed in T3 (β = −0.213, R2 = 0.045, p < 0.001), accounting for 4.5% of the variation. These results indicate that longer retention times are associated with reduced corn temperatures, likely due to prolonged exposure to cooling phases or ambient influences in the later drying stages. All regression models were confirmed as statistically significant. An overview of correlation strength and regression coefficients is presented in Figure 4.
The findings validate Hypothesis H3, as the material discharge interval significantly influences module temperatures, especially T5 and T6.

3.4. T-Test: Effects of Target Air Temperature Groups on Module Temperatures

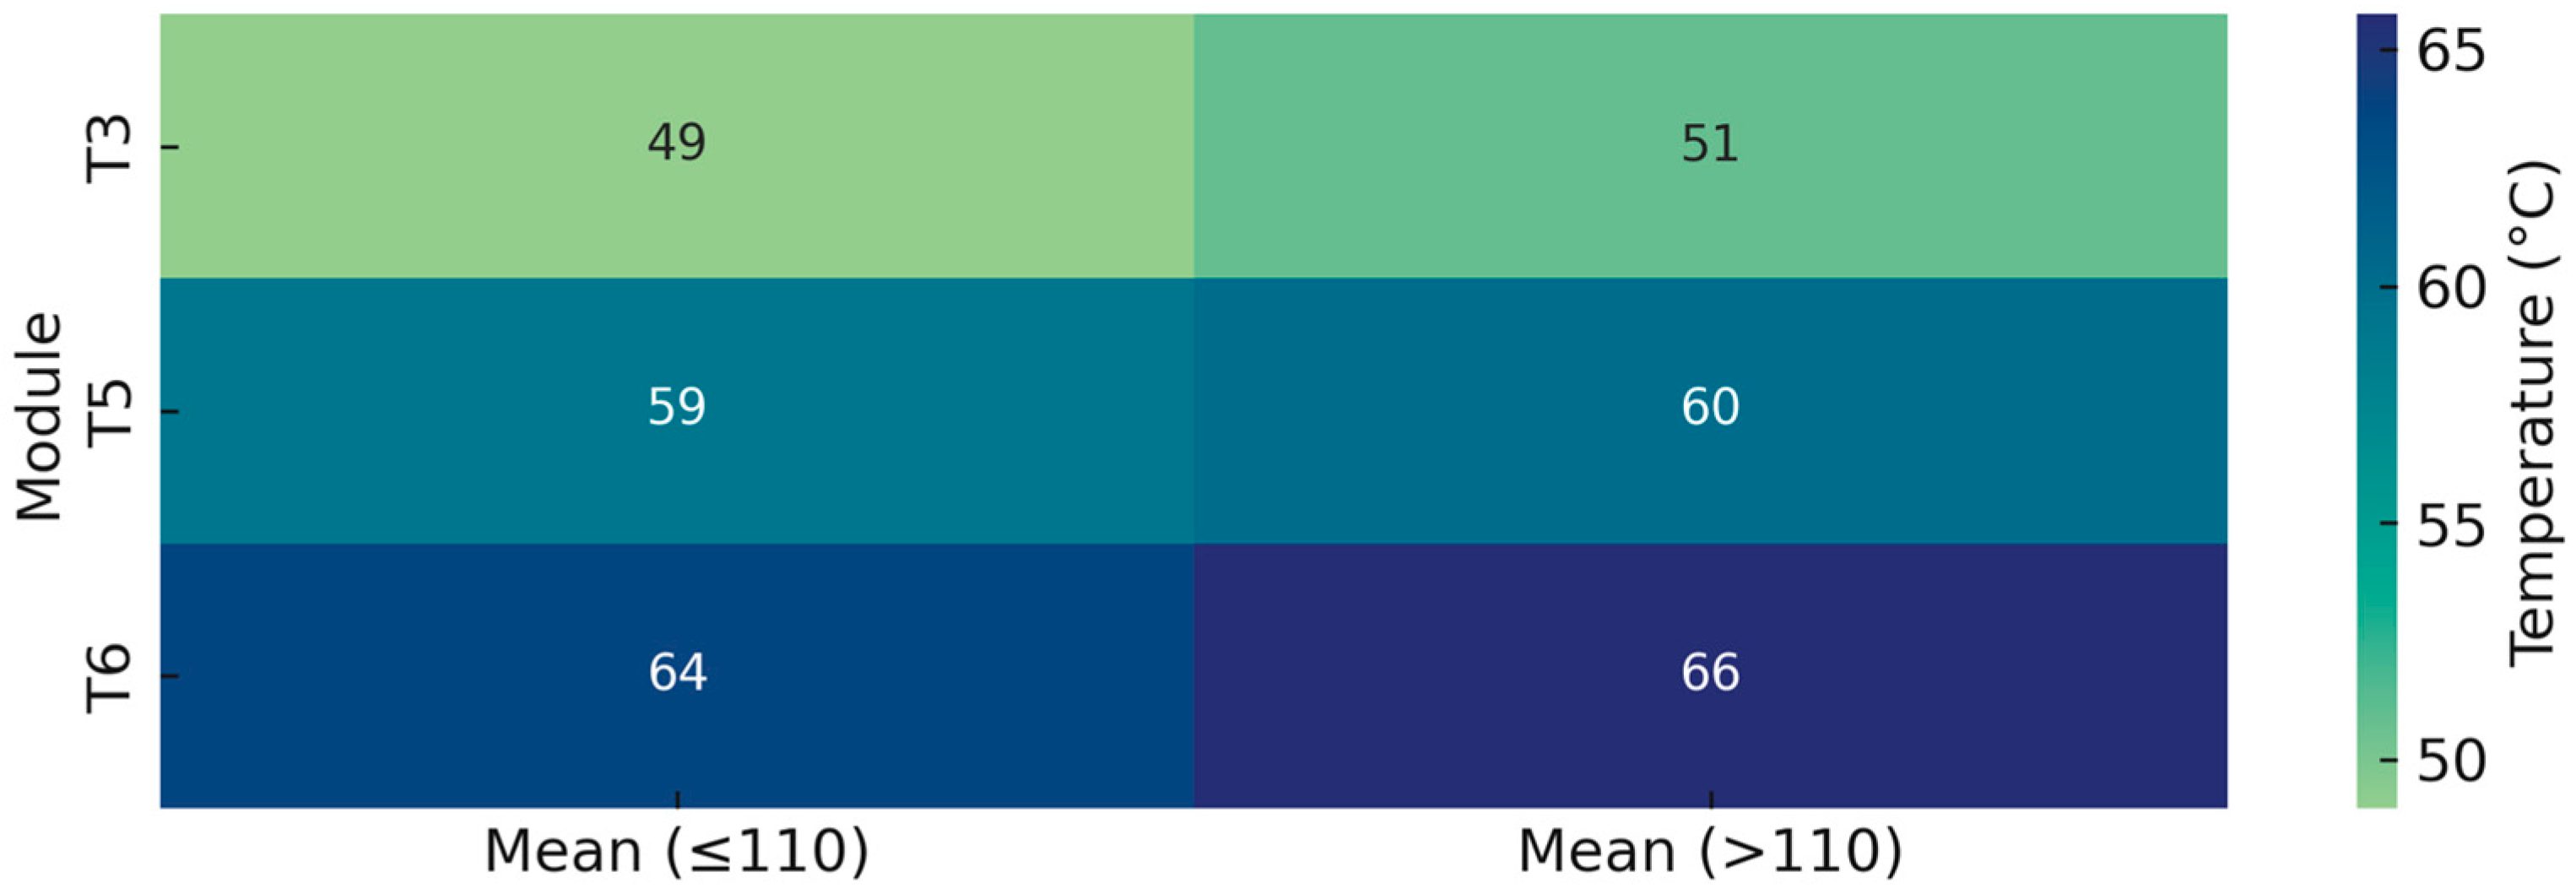
To assess whether average module temperatures differed significantly based on the target air temperature (TA), a t-test was performed between two groups: TA ≤ 110 °C and TA > 110 °C. Statistically significant differences in corn temperature were observed across all modules (T3: p < 0.001, T5: p < 0.001, T6: p < 0.001), with higher target air temperature consistently resulting in increased corn temperatures. Variance equality was assumed for T3 and not assumed for T5 and T6 based on Levene’s test. The results are visualized in Figure 5.
While TA showed a clear impact, it is important to note that other factors, such as adjustments in material discharge interval and varying ambient weather conditions may have also contributed to the observed temperature changes. These variables interact with TA in practice and may introduce variability beyond what is captured by the binary grouping. The results are visualized in Figure 5.
The results of the t-test confirm Hypothesis H4, demonstrating statistically significant temperature differences between low and high target air temperature groups across all modules.

3.5. Practical Interpretation of Statistical Models

While the coefficients of determination (R2) in several models are modest, they still offer meaningful insights into the influence of key parameters on thermal dynamics. Low R2 values can be attributed to delayed system responses, multivariate dependencies, and frequent operator interventions that obscure direct statistical relationships. Nonetheless, statistically significant effects were observed in most cases, revealing interpretable trends such as the expected positive impact of target air temperature and the unexpected yet consistent negative effect of discharge interval—likely due to overlapping changes in other process parameters or corn characteristics. These findings highlight the limitations of traditional regression and emphasize the need for more flexible modeling approaches, such as deep learning, which can capture nonlinear interactions and temporal dependencies more effectively.

3.6. Time Series Modeling of Outlet Corn Moisture

The statistical analysis in Section 3 confirmed that key independent variables, such as inlet corn moisture (MI), target air temperature (TA) and material discharge interval (MD) have measurable effects on module temperatures. However, these analyses are limited to static, linear relationships and do not account for the temporal behavior and dependencies present in the continuous process.
Importantly, the drying system under investigation is a continuous flow drying system, where corn moves progressively through different temperature zones over time. In such systems, process parameters and moisture levels evolve continuously, and the system exhibits lag effects, inter-stage dependencies and time-delayed interactions. For example, changes in target air temperature or discharge interval may only manifest in outlet moisture several time steps later, since the system needs time to adapt and effects to take place.
To accurately model the dynamics of moisture reduction in this setting, it is necessary to adopt time series approaches that can learn from sequential data. Therefore, in the following sections Long Short-Term Memory (LSTM), Gated Recurrent Units (GRU), and Temporal Convolutional Networks (TCN) are introduced to predict outlet corn moisture based on historical process data. These models can capture both short-term fluctuations and long-term dependencies in multivariate time series, providing more robust and dynamic predictions in the drying process.

3.7. Predictive Performance of Time Series Models

This section evaluates the ability of three deep learning architectures (LSTM, GRU and TCN) to predict outlet corn moisture based on historical process data. Models were trained on multivariate time series inputs using an 80/10/10 temporal split for training, validation and testing. Performance was assessed using mean absolute error (MAE), root mean square error (RMSE), mean squared error (MSE) and mean absolute percentage error (MAPE). The lowest metrics achieved by each model are shown in Table 3.
Table 3 presents the predictive performance of the three deep learning models on the test dataset. The GRU model achieved the lowest mean absolute error (MAE = 0.304), indicating the most accurate average predictions. However, its mean absolute percentage error (MAPE = 2.904%) was higher than that of the LSTM model. MAPE expresses the average prediction error as a percentage of actual values, providing a scale-independent measure of accuracy. The LSTM model achieved the lowest MAPE (2.430%), along with the lowest MSE (0.291) and RMSE (0.539), suggesting better robustness to larger deviations despite a slightly higher MAE (0.368). In contrast, the TCN model showed the highest error values across all metrics, indicating a weaker capacity to capture sequential dependencies.
Overall, GRU yielded the best performance in terms of average error, while LSTM demonstrated superior resilience to outliers and variability.
To achieve the results shown in Table 3, a comprehensive hyperparameter tuning procedure was carried out for each model using time-series cross-validation on the training and validation sets. The grid search focused on optimizing model-specific configurations such as learning rate, window size, dropout rate, and activation function. The best-performing combinations selected based on MSE validation are summarized in Table 4 and were subsequently used to train the final models evaluated on the test set.
The LSTM and TCN models achieved their best performance with window size 4, zero dropout, and the Swish activation function, paired with the Adam or nadam optimizers. Notably, the TCN required the smallest learning rate (0.0001) and the largest batch size (64), likely due to the sensitivity of convolutional layers to gradient updates and the need for stable convergence. In contrast, the GRU model performed best with a smaller window size (2), moderate batch size (32), and ReLU activation function, suggesting it could capture short-term dependencies more efficiently. These optimized configurations were used to train the final models reported in Table 3.
Since hyperparameter tuning involves training multiple model configurations across the parameter grid, it can be computationally intensive. To quantify this effort, Table 5 presents the total tuning duration for each model architecture.
Among the models, the TCN model required the longest time (7679.88 s), likely due to its convolutional structure. Despite using the same tuning procedure, epoch count, and parameter grid, the differing internal architectures led to notable differences in runtime.
The LSTM model completed tuning in the shortest time (5212.23 s), suggesting greater computational efficiency under equivalent conditions. The GRU model (6193.23 s) performed between LSTM and TCN, consistent with its intermediate architectural complexity.
These findings highlight the importance of considering computational overhead alongside predictive performance when selecting models for industrial applications, especially where real-time or resource-constrained deployment is required.

3.8. Visualization of Timeseries Models

To complement the numerical results presented earlier, this section provides visual insights into model performance and prediction behavior. While metrics like MAE and RMSE quantify overall accuracy, visualizations help identify systematic errors, outliers, and temporal patterns that may be missed in aggregate statistics. Residual boxplots are used to evaluate the distribution and consistency of prediction errors, while time-series plots of actual versus predicted values reveal how well each model captures short and long-term trends in outlet moisture. These visualizations provide a more intuitive understanding of each model’s strengths and limitations.

3.8.1. Residual Distribution

Residual distributions offer valuable insight into the consistency and stability of model predictions. Boxplots are used to visualize the spread and symmetry of residuals, which are defined as the difference between predicted and actual outlet moisture values for each model on the test set. Narrower distributions and fewer outliers indicate more reliable and stable predictive performance, while wider spreads or extreme values may signal occasional large errors or model instability under certain conditions. Moreover, the presence of high-magnitude outliers directly contributes to an increase in error metrics such as mean squared error (MSE), as these metrics are sensitive to large deviations from the true values.
As shown in Figure 6, the GRU model demonstrates the most compact and symmetric residual distribution, indicating high consistency and minimal error variation. This aligns with its lowest MAE, suggesting it delivers the most accurate predictions on average.
In contrast, the LSTM model, despite a slightly higher MAE, shows a centered distribution with fewer extreme values, supporting its lower RMSE and MSE. This implies better handling of rare but high-magnitude errors, reinforcing LSTM’s robustness in real-world settings with occasional disturbances.
The TCN model exhibits the widest spread and most extreme residuals, reflecting the highest error metrics across all categories. This suggests limitations in capturing the temporal dependencies critical to the drying process.

3.8.2. Time Series Prediction Performance

To complement the residual analysis, Figure 7, Figure 8 and Figure 9 present time-series comparisons between the predicted and actual outlet moisture values for the LSTM, GRU, and TCN models, respectively. These plots offer a visual evaluation of each model’s ability to capture temporal dynamics in the drying process and provide context for the error metrics summarized in Table 4.
The x-axis is labeled as “Sample index” rather than absolute time, as the dataset spans multiple drying seasons (September–November across 7 years) and includes manually collected data with small timing deviations (±10 min). This choice avoids misrepresentation of temporal resolution and ensures consistency across all figures.
Figure 7 illustrates the temporal prediction performance of the LSTM model for outlet moisture content. The model closely follows actual trends and captures both gradual variations and sharper transitions effectively. This consistent behavior is supported by low RMSE and MSE (shown in Table 3). While LSTM’s MAE is marginally higher than that of the GRU model, this difference is not substantial. Overall, the results confirm LSTM’s capacity to deliver stable and precise forecasts in a fluctuating process environment.
Figure 8 illustrates the temporal prediction performance of the GRU model for outlet moisture content. The model produces highly responsive forecasts that adapt quickly to short-term variations in the drying process. This is reflected in its lowest MAE among the models tested. Although GRU’s RMSE and MSE are slightly higher than those of the LSTM model, the differences are minimal. These results suggest that GRU is particularly well-suited for stable, continuous operations with limited extreme fluctuations, where maintaining average prediction accuracy is critical. In contrast, LSTM may offer advantages in scenarios involving abrupt changes or process anomalies.
Figure 9 illustrates the temporal prediction performance of the TCN model for outlet moisture content. The model generates smooth and dampened predictions that often underestimate the amplitude of rapid fluctuations. As a result, it exhibits lag and offset during sharp transitions in moisture levels. These behavioral patterns are reflected in its performance, as the TCN shows the highest MAE, MSE, RMSE, and MAPE values among the tested models (see Table 3). The comparatively lower performance may be attributed to the model’s architectural design—dilated causal convolutions may be less suited for capturing fine-grained sequential variations in continuous drying processes compared to recurrent structures like LSTM and GRU. While TCN still provides reasonably accurate predictions, its limited responsiveness to dynamic changes makes it less favorable for real-time applications requiring high adaptability.
In summary, all three deep learning models demonstrated the ability to predict outlet moisture in a continuous flow drying system, but with varying strengths. GRU achieved the lowest average prediction error (MAE), making it suitable for stable, real-time control in continuous operations with fewer abrupt changes. LSTM, while slightly less accurate on average, exhibited greater robustness to outliers, making it more appropriate in settings with occasional system fluctuations, sensor noise, or unexpected process disturbances. Its stability under variable conditions suggests that LSTM may be better suited for predicting optimal control parameters when high-moisture corn enters the system or when external influences, such as sudden weather changes, affect drying dynamics. Notably, both LSTM and GRU are recurrent neural networks designed to capture temporal dependencies in sequential data. This architectural similarity helps explain their overlapping prediction patterns and comparable strengths. In contrast, TCN showed the weakest performance across all evaluation metrics, likely due to its limited temporal flexibility and underestimation of sharp transitions. These results underscore the importance of aligning model selection with specific operational priorities, such as responsiveness, stability, and fault tolerance.

3.9. Performance Comparison with Related Studies

This study builds upon our previous work [22], where an LSTM-based model achieved an RMSE of 0.645 in predicting outlet moisture content, demonstrating the effectiveness of our chosen hyperparameters and data preprocessing techniques. In the current work, further optimization and data preprocessing reduced the RMSE to 0.539, indicating an improvement in prediction accuracy.
When compared to other recent studies, the performance of our model remains competitive. For instance, Xing et al. [18] developed a UVE-LSTM model for corn drying and reported an RMSE of 0.711. The lower RMSE achieved in our study suggests enhanced predictive accuracy, which can be attributed to tailored hyperparameter tuning and robust preprocessing steps that reduced generalization errors and improved model learning.
Li et al. [17] proposed an intelligent artificial neural network (IANN) for predicting moisture content in an industrial corn drying system and reported a mean squared error (MSE) of 0.067. While this indicates high accuracy, it is important to highlight a key distinction in data context: their model was trained on data collected under controlled experimental conditions, whereas our model was developed using real-world operational data from an industrial setting not originally intended for research purposes. This makes our findings particularly relevant for practical deployment, as they demonstrate that high model performance is achievable even under the variability and noise typical of real manufacturing environments.

4. Conclusions

This study advances the optimization of corn drying in industrial continuous-flow systems by integrating statistical analysis with deep learning, providing a robust framework for intelligent process control and aligning with Agriculture 5.0 principles

4.1. Summary of Findings

Regression analysis revealed statistically significant relationships between process parameters and internal dryer temperatures. However, the limited explanatory power of these models reflects delayed and combined effects that static methods cannot fully capture.
To address this, deep learning models (LSTM, GRU, TCN) were employed for outlet moisture prediction using multivariate time-series data. These models successfully captured temporal dependencies and nonlinear interactions. GRU achieved the lowest average prediction error, making it suitable for stable real-time use. LSTM showed stronger robustness to outliers and dynamic conditions and proved most efficient during hyperparameter tuning. TCN showed the weakest performance overall. Visualizations of predictions and residuals confirmed each model’s distinctive strengths.

4.2. Practical Implications

The results offer practical value for optimizing corn drying. Regression models highlight which parameters affect thermal behavior, while deep learning enables real-time moisture forecasting. This supports proactive adjustments by operators, improving control and system reliability.
The ANN model is not intended as a PID controller or direct substitute for analog systems (e.g., Bühler) but serves as a predictive layer for decision support. It estimates outlet moisture to help maintain target thresholds (14.5%), promoting consistent product quality. While not embedded in a closed-loop control system, it indirectly enhances thermal efficiency by reducing over-drying and stabilizing operation.
The approach is currently being piloted in an industrial environment during harvest, demonstrating practical applicability.

4.3. Limitations and Future Work

This study advances industrial corn drying optimization by integrating statistical analysis and deep learning-based forecasting. Statistical methods pinpoint critical parameters for process adjustment, while deep learning enables real-time moisture prediction, supporting informed and responsive control to enhance efficiency and consistency. The methodology is currently being piloted during harvest, demonstrating its potential. However, integration with commercial dryer systems is hindered by current software limitations, posing challenges for seamless adoption in closed-loop control environments. Future work will address these limitations by improving model accuracy and adaptability through expanded datasets incorporating additional sensor inputs (e.g., hot air speed), increased sampling frequency, and automated data collection. Advanced architectures, such as Time-Aware LSTM, models for irregular intervals, and ensemble or attention-based networks, will be explored to better capture sequential dependencies. Additionally, the impact of corn sort variety on moisture dynamics and model performance will be investigated. The ultimate goal is to transition from predictive to prescriptive control, enabling full automation of corn drying systems.

Author Contributions

Conceptualization, S.K.; Methodology, M.S.; Software, M.S.; Validation, S.K.; Formal analysis, M.S.; Data curation, M.S.; Writing—original draft, M.S.; Writing—review & editing, S.K.; Visualization, M.S.; Supervision, S.K.; Funding acquisition, S.K. All authors have read and agreed to the published version of the manuscript.

Funding

The authors acknowledge the financial support from the Slovenian Research Agency (Research Core Funding No. P2-0157).

Institutional Review Board Statement

Not applicable.

Informed Consent Statement

Not applicable.

Data Availability Statement

The data presented in this study are available on request from the corresponding author due to confidentiality agreements with the industrial partner.

Conflicts of Interest

The authors declare no conflicts of interest.

References

  1. Fountas, S.; Espejo-García, B.; Kasimati, A.; Gemtou, M.; Panoutsopoulos, H.; Anastasiou, E. Agriculture 5.0: Cutting-Edge Technologies, Trends, and Challenges. IT Prof. 2024, 26, 40–47. [Google Scholar] [CrossRef]
  2. Bissadu, K.D.; Sonko, S.; Hossain, G. Society 5.0 Enabled Agriculture: Drivers, Enabling Technologies, Architectures, Opportunities, and Challenges. Inf. Process. Agric. 2025, 12, 112–124. [Google Scholar] [CrossRef]
  3. Saiz-Rubio, V.; Rovira-Más, F. From Smart Farming towards Agriculture 5.0: A Review on Crop Data Management. Agronomy 2020, 10, 207. [Google Scholar] [CrossRef]
  4. Shiferaw, B.; Prasanna, B.M.; Hellin, J.; Bänziger, M. Crops That Feed the World 6. Past Successes and Future Challenges to the Role Played by Maize in Global Food Security. Food Sec. 2011, 3, 307–327. [Google Scholar] [CrossRef]
  5. Ziegler, V.; Paraginski, R.T.; Ferreira, C.D. Grain Storage Systems and Effects of Moisture, Temperature and Time on Grain Quality—A Review. J. Stored Prod. Res. 2021, 91, 101770. [Google Scholar] [CrossRef]
  6. Kechkin, I.A.; Ermolaev, V.A.; Ivanov, M.V.; Romanenko, A.I.; Gurkovskaya, E.A. Dependence of Fat Acidity Value on Wheat Grain Storage Conditions. BIO Web Conf. 2020, 17, 00107. [Google Scholar] [CrossRef]
  7. Martinez-Feria, R.A.; Licht, M.A.; Ordóñez, R.A.; Hatfield, J.L.; Coulter, J.A.; Archontoulis, S.V. Evaluating Maize and Soybean Grain Dry-down in the Field with Predictive Algorithms and Genotype-by-Environment Analysis. Sci. Rep. 2019, 9, 7167. [Google Scholar] [CrossRef]
  8. Odjo, S.D.P.; Malumba, P.K.; Beckers, Y.; Béra, F. Impact of Drying and Heat Treatment on the Feeding Value of Corn. A Review. Biotechnol. Agron. Soc. Environ. 2015, 19, 301–312. [Google Scholar]
  9. Jimoh, K.A.; Hashim, N.; Shamsudin, R.; Man, H.C.; Jahari, M.; Onwude, D.I. Recent Advances in the Drying Process of Grains. Food Eng. Rev 2023, 15, 548–576. [Google Scholar] [CrossRef]
  10. Grelier, A.; Zadravec, M.; Remmelgas, J.; Forgber, T.; Colacino, F.; Pilcer, G.; Stauffer, F.; Hörmann-Kincses, T. Model-Guided Development of a Semi-Continuous Drying Process. Pharm. Res. 2022, 39, 2005–2016. [Google Scholar] [CrossRef]
  11. Wang, H.; Zhang, S.; Fan, H.; Zhang, M.; Hu, N.; Yang, H. Modeling and Experimental Study on Drying Characteristics of Corn Particles with Hot Air in Downward Moving Bed. Fluids 2023, 8, 63. [Google Scholar] [CrossRef]
  12. Peart, M.; Foster, G.H. Matllematical Simulation of Corn Drying A New Model. Trans. ASAE 1968, 11, 582–586. [Google Scholar]
  13. Gautam, S.; Gautam, A.; Mahant, B. A Statistical Optimization of Convective Drying of Corn Kernels in a Fluidized Bed Dryer. J. Eng. Res. 2021, 11, 30–40. [Google Scholar] [CrossRef]
  14. Raimundini Aranha, A.C.; Lopes Ferrari, A.; Paschoal, S.M.; Sgorlon, J.G.; Sérgi Gomes, M.C.; De Matos Jorge, L.M.; Tonin, L.T.D.; Oliveira Defendi, R. Heat Consumption and Modeling of Corn Seeds Intermittent Drying. JSFA Rep. 2023, 3, 588–596. [Google Scholar] [CrossRef]
  15. Valencia Ceballos, L.A.; López-Vidaña, E.C.; Romero-Perez, C.K.; Escobedo-Bretado, J.; García-Valladares, O.; Martín Domínguez, I.R. Techno-Economic and Environmental Assessment of a Photovoltaic-Thermal (PV-T) Solar Dryer for Habanero Chili (Capsicum chinense): 4E (Energy, Economic, Embodied and Environmental) Analysis. Renew. Energy 2025, 245, 122758. [Google Scholar] [CrossRef]
  16. Shi, R.; Conrad, S.A. Correlation and Regression Analysis. Ann. Allergy Asthma Immunol. 2009, 103, S35–S41. [Google Scholar] [CrossRef] [PubMed]
  17. Li, B.; Li, C.; Huang, J.; Li, C. Application of Artificial Neural Network for Prediction of Key Indexes of Corn Industrial Drying by Considering the Ambient Conditions. Appl. Sci. 2020, 10, 5659. [Google Scholar] [CrossRef]
  18. Xing, S.; Lin, Z.; Gao, X.; Wang, D.; Liu, G.; Cao, Y.; Liu, Y. Research on Outgoing Moisture Content Prediction Models of Corn Drying Process Based on Sensitive Variables. Appl. Sci. 2024, 14, 5680. [Google Scholar] [CrossRef]
  19. Zhang, Y.; Fang, Z.; Li, C.; Li, C. Deep-Learning-Based Model Predictive Control of an Industrial-Scale Multistate Counter-Flow Paddy Drying Process. Foods 2023, 13, 43. [Google Scholar] [CrossRef]
  20. Liu, Z.; Xu, Y.; Han, F.; Zhang, Y.; Wang, G.; Wu, Z.; Wu, W. Control Method for Continuous Grain Drying Based on Equivalent Accumulated Temperature Mechanism and Artificial Intelligence. Foods 2022, 11, 834. [Google Scholar] [CrossRef]
  21. Aji, G.K.; Bachtiar, W.F.; Yuliando, H.; Suwondo, E. Dynamic Modeling of the Drying Process of Corn Grains Using Neural Networks. Agritech 2019, 39, 251. [Google Scholar] [CrossRef]
  22. Simonič, M.; Ficko, M.; Klančnik, S. Predicting Corn Moisture Content in Continuous Drying Systems Using LSTM Neural Networks. Foods 2025, 14, 1051. [Google Scholar] [CrossRef]
  23. Ahmadi, A.; Daccache, A.; Sadegh, M.; Snyder, R.L. Statistical and Deep Learning Models for Reference Evapotranspiration Time Series Forecasting: A Comparison of Accuracy, Complexity, and Data Efficiency. Comput. Electron. Agric. 2023, 215, 108424. [Google Scholar] [CrossRef]
  24. DiPietro, R.; Hager, G.D. Deep Learning: RNNs and LSTM. In Handbook of Medical Image Computing and Computer Assisted Intervention; Elsevier: Amsterdam, The Netherlands, 2020; pp. 503–519. ISBN 978-0-12-816176-0. [Google Scholar]
  25. Hewage, P.; Behera, A.; Trovati, M.; Pereira, E.; Ghahremani, M.; Palmieri, F.; Liu, Y. Temporal Convolutional Neural (TCN) Network for an Effective Weather Forecasting Using Time-Series Data from the Local Weather Station. Soft Comput. 2020, 24, 16453–16482. [Google Scholar] [CrossRef]
  26. Shiri, F.M.; Perumal, T.; Mustapha, N.; Mohamed, R. A Comprehensive Overview and Comparative Analysis on Deep Learning Models: CNN, RNN, LSTM, GRU. arXiv 2023, arXiv:2305.17473. [Google Scholar] [CrossRef]
  27. Hoque, A. Artificial Intelligence in Post-Harvest Drying Technologies: A Comprehensive Review on Optimization, Quality Enhancement, and Energy Efficiency. Int. J. Sci. Res. 2024, 13, 493–502. [Google Scholar] [CrossRef]
  28. Simtro Energija d.o.o.|Spletna Stran. Available online: https://www.simtro.si/ (accessed on 19 May 2025).
  29. Home|Bureau Veritas Slovenia. Available online: https://www.bureauveritas.si/ (accessed on 16 May 2025).
  30. ARSO Vreme. Available online: https://vreme.arso.gov.si/napoved (accessed on 16 May 2025).
  31. IBM—United States. Available online: https://www.ibm.com/us-en (accessed on 16 May 2025).
  32. MinMaxScaler. Available online: https://scikit-learn.org/stable/modules/generated/sklearn.preprocessing.MinMaxScaler.html (accessed on 16 May 2025).
  33. GridSearchCV. Available online: https://scikit-learn.org/stable/modules/generated/sklearn.model_selection.GridSearchCV.html (accessed on 16 May 2025).
  34. Scikeras.Wrappers.KerasRegressor—SciKeras 0.13.0 Documentation. Available online: https://adriangb.com/scikeras/stable/generated/scikeras.wrappers.KerasRegressor.html (accessed on 16 May 2025).
  35. Liashchynskyi, P.; Liashchynskyi, P. Grid Search, Random Search, Genetic Algorithm: A Big Comparison for NAS. arXiv 2019, arXiv:1912.06059. [Google Scholar] [CrossRef]
  36. ReLU—PyTorch 2.7 Documentation. Available online: https://docs.pytorch.org/docs/stable/generated/torch.nn.ReLU.html (accessed on 16 May 2025).
  37. Sigmoid—PyTorch 2.7 Documentation. Available online: https://docs.pytorch.org/docs/stable/generated/torch.nn.Sigmoid.html (accessed on 16 May 2025).
  38. Ramachandran, P.; Zoph, B.; Le, Q.V. Searching for Activation Functions. arXiv 2017, arXiv:1710.05941. [Google Scholar] [CrossRef]
  39. Zou, F.; Shen, L.; Jie, Z.; Zhang, W.; Liu, W. A Sufficient Condition for Convergences of Adam and RMSProp. In Proceedings of the 2019 IEEE/CVF Conference on Computer Vision and Pattern Recognition (CVPR), Long Beach, CA, USA, 15–20 June 2019; IEEE: Long Beach, CA, USA, 2019; pp. 11119–11127. [Google Scholar]
  40. Zhang, Q.; Zhang, Y.; Shao, Y.; Liu, M.; Li, J.; Yuan, J.; Wang, R. Boosting Adversarial Attacks with Nadam Optimizer. Electronics 2023, 12, 1464. [Google Scholar] [CrossRef]
  41. TimeSeriesSplit. Available online: https://scikit-learn.org/stable/modules/generated/sklearn.model_selection.TimeSeriesSplit.html (accessed on 16 May 2025).
Figure 1. Drying tower schematics.
Applsci 15 09187 g001
Figure 2. Statistical effects of inlet corn moisture (MI) on module temperatures.
Applsci 15 09187 g002
Figure 3. Statistical effects of target air temperature (TA) on process parameters.
Applsci 15 09187 g003
Figure 4. Statistical effects of material discharge interval (MD) on process parameters.
Applsci 15 09187 g004
Figure 5. Temperature differences in drying modules (T3, T5, T6) based on target air temperature.
Applsci 15 09187 g005
Figure 6. Residual distribution for models on test data LSTM (left), GRU (middle), and TCN (right).
Applsci 15 09187 g006
Figure 7. Performance of the LSTM model in tracking outlet moisture content over time on the test dataset.
Applsci 15 09187 g007
Figure 8. Performance of the GRU model in tracking outlet moisture content over time on the test dataset.
Applsci 15 09187 g008
Figure 9. Performance of the TCN model in tracking outlet moisture content over time on the test dataset.
Applsci 15 09187 g009
Table 1. Variable summary for corn drying experiment.
CodeVariableDescriptionUnitSource/NoteType
TATarget air temperatureDrying air setpoint°COperator-definedIndependent
MDDischarge intervalGate opening intervalsOperator-definedIndependent
T3TemperatureCorn temperature in drying module 3°CInternal sensorDependent
T5TemperatureCorn temperature in drying module 5°CInternal sensorDependent
T6TemperatureCorn temperature in drying module 6°CInternal sensorDependent
MIInlet MoistureCorn moisture content before drying%MeasuredIndependent
MOOutlet MoistureMoisture content after drying%Measured Dependent
ATAmbient TemperatureOutside air temperature°CWeatherstationsIndependent
RHRelative HumidityAmbient relative humidity%WeatherstationsIndependent
SRSolar RadiationIncoming solar radiationW/m2WeatherstationsIndependent
PRPrecipitationRainfallmmWeatherstationsIndependent
Table 2. Grid search parameter space for deep learning-based time series models.
ParameterValues Tested
Learning rate0.1, 0.01, 0.001, 0.0001
Dropout rate0.0, 0.2, 0.4
Input window size1, 2, 3, 4
Optimizernadam, rmsprop, adam
Activation functionrelu, swish, sigmoid
Epochs10, 20, 50
Batch size16, 32, 64
Table 3. Metrics of the model on test data.
ModelMAERMSEMSEMAPE (%)
LSTM0.3680.5390.2912.430
GRU0.3040.5510.3042.904
TCN0.3970.5610.3152.962
Table 4. Best hyperparameter combination for each model based on validation performance.
ModelLearning RateDropout RateWindow SizeOptimizerActivationEpochsBatch Size
LSTM0.00104AdamSwish5016
GRU0.0102nadamrelu2032
TCN0.000104nadamswish5064
Table 5. Computational performance of deep learning architectures (hyperparameter tuning duration).
ModelDuration (s)
LSTM5212.23
GRU6193.23
TCN7679.88
Disclaimer/Publisher’s Note: The statements, opinions and data contained in all publications are solely those of the individual author(s) and contributor(s) and not of MDPI and/or the editor(s). MDPI and/or the editor(s) disclaim responsibility for any injury to people or property resulting from any ideas, methods, instructions or products referred to in the content.