Article

Fault Detection in Power Distribution Systems Using Sensor Data and Hybrid YOLO with Adaptive Context Refinement

by
Luiza Scapinello Aquino
1,
Luis Fernando Rodrigues Agottani
2,
Laio Oriel Seman
3,*,
Viviana Cocco Mariani
2,4,
Leandro dos Santos Coelho
1,4 and
Gabriel Villarrubia González
5
1
Graduate Program in Electrical Engineering, Federal University of Parana, Curitiba 80060-000, PR, Brazil
2
Graduate Program in Mechanical Engineering, Federal University of Parana, Curitiba 80060-000, PR, Brazil
3
Department of Automation and Systems Engineering, Federal University of Santa Catarina, Florianopolis 88040-900, SC, Brazil
4
Department of Electrical Engineering, Federal University of Parana, Curitiba 80060-000, PR, Brazil
5
Expert Systems and Applications Lab, Faculty of Science, University of Salamanca, Plaza de los Caídos s/n, 37008 Salamanca, Spain
*
Author to whom correspondence should be addressed.
Appl. Sci. 2025, 15(16), 9186; https://doi.org/10.3390/app15169186
Submission received: 29 July 2025 / Revised: 17 August 2025 / Accepted: 18 August 2025 / Published: 21 August 2025

Abstract

Ensuring the reliability of power transmission systems depends on the accurate detection of defects in insulators, which are subject to environmental degradation and mechanical stress. Traditional inspection methods are time-consuming and often ineffective, particularly in complex aerial environments. This paper presents a fault detection framework that integrates the YOLOv8 object detection model with an Adaptive Context Refinement (ACR) mechanism. YOLOv8 provides real-time detection, while ACR incorporates multi-scale contextual information surrounding detected objects to improve classification and localization. The system is evaluated across 25 YOLO model variants (YOLOv8 to YOLOv12) using high-resolution UAV datasets from operational power distribution networks. Results show that ACR improves mean Average Precision (mAP) in all cases, with gains of up to 22.9% for YOLOv10n (from 0.556 to 0.684 mAP) and average improvements of 12.6% for YOLOv10, 8.6% for YOLOv12, 5.6% for YOLOv9, and 4.0% for YOLOv8. The method maintains computational efficiency and performs consistently under varied environmental and fault conditions, making it suitable for the real-time UAV-based inspection of power systems.

1. Introduction

Insulators are essential components of high-voltage transmission networks, as they provide electrical insulation between energized conductors and supporting structures, while also providing mechanical support to conductors [1]. These components are continually exposed to adverse environmental conditions that accelerate their degradation over time. Their effectiveness has a direct impact on the stability and safety of the electric grid. Insulators exposed to electrical, mechanical, and environmental stresses in outdoor applications are more likely to develop flaws, including leakage current, self-explosion, partial fractures, and pollution-induced electrical discharges [2].
These vulnerabilities pose a significant threat to transmission continuity and the integrity of the power system, with insulator faults being the primary cause of transmission-related incidents [3]. As a result, routine inspections are necessary. Traditional inspection methods, such as field patrols and manned helicopter monitoring, are resource-intensive and ineffective [4]. Although unmanned aerial vehicles (UAVs) provide greater coverage, problems remain due to the complexity of the transmission infrastructure, differences in brightness, small fault sizes, and background interference in the image [5].
Thus, conventional inspection techniques for overhead power transmission lines are largely insufficient due to the considerable height and breadth of transmission towers. Identification and examination of electrical insulators in aerial photographs with obstructed backgrounds provide significant challenges for autonomous inspections [6]. However, the reliability of the power transmission infrastructure depends on several factors, including the operational integrity of electrical insulators [7].
Equally important are the effects of voltages when power cables are placed in acidic environments Preduș et al. [8]. As power grids expand and age, the ability to accurately detect and classify insulator defects can prevent interruptions in power distribution service and also maintain distribution efficiency [9].
Recent developments in algorithms for feature extraction and data or computer vision classification have created new possibilities for automating the detection of anomalies in power grid components [10]. The most popular deep learning (DL) models are Residual Networks, Visual Geometry Group, YOLO [11], and hybrid models. Methods such as Faster Region Based Convolutional Neural Networks (Faster R-CNN) [12] also offer high accuracy but suffer from slow inference and complex training, while methods like YOLO prioritize speed, efficiency, and competitive accuracy.
As emphasized by Shuang et al. [13], the integration of a feature enhancement module in conjunction with an attention mechanism, applied within the Faster R-CNN framework, demonstrated improved representation of object regions, resulting in a mAP of 96.6%. However, that approach exhibited relatively slow computational performance. Zhou et al. [14] used the Mask R-CNN model to detect defects in insulators using infrared images, achieving an accuracy of up to 98%, and 5.75 frames per second. In [15], a Faster R-CNN was applied to accurately identify eight categories of defects in transmission lines using complex backgrounds and different illuminations.
Similarly, in Costa and Cortes [16] three versions of the YOLO-V3 were compared against the state-of-the-art CNN, with the best model reaching a precision of 98%. Moreover, Qiu et al. [17] proposed an enhanced YOLOv4-based model for insulator defect detection, achieving a detection accuracy of approximately 93.81% with an inference speed of 53 frames per second. Then, the application of image preprocessing techniques increased the accuracy to 97.26%.
Liquan et al. [18] proposed a faster insulator fault detection method based on YOLO-v5s, featuring a faster detection speed and acceptable detection accuracy. Gong et al. [19] proposed an insulator fault diagnosis method based on YOLO-v8-DCP multi-mechanism optimization by improving multi-scale feature extraction and multi-level feature fusion, indicating that the model achieves an accuracy of 97.7% in insulator fault diagnosis. Tao et al. [20] proposed a model based on YOLO-v8, achieving a mAP of 98.8% for situations with few types of defects.
He et al. [21] proposed an enhanced object detection framework, named MFI-YOLO, to accurately identify and classify multiple insulator fault types in aerial images, particularly under complex backgrounds and varying fault scales. Zhang et al. [22] proposed an improved YOLO-v9 model, achieving a mAP of 96.6% but with limitations in complex backgrounds, as it did not consider multiple types of defects in insulators and had higher computational complexity than YOLO-v9. Zhao et al. [23] proposed an improved approach to defect detection based on a lightweight neural network derived from the YOLOv11n architecture, incorporating multidimensional dynamic convolutions for feature extraction.
Adaptive Context Refinement (ACR) is a strategy designed to dynamically adjust how contextual information is selected and processed based on the specific characteristics of each scenario. This strategy is widely used in computer vision. For instance, Zhou et al. [24] used ACR to improve the accuracy of autonomous vehicle motion prediction with minimal additional computation. The work of Chen et al. [25] introduced a two-stage motion forecasting network designed to improve the safety and comfort of autonomous driving by improving the accuracy of trajectory prediction with the use of ACR. ACR is also used for the source-free unsupervised domain adaptation problem [26].
Despite these advances, detecting faults in insulators remains challenging because of the diversity of defect manifestations, the variability in installation configurations, and mainly due to the positioning, often remote or elevated, of these components. This complexity requires inspection systems capable of broad coverage and detailed analysis. Traditional object detection models like YOLO, while effective in general applications, struggle with these specific issues due to their limited use of contextual information and fixed anchor box assumptions.
The main challenge lies in distinguishing normal patterns from those indicative of deterioration or damage to insulators. Environmental factors such as lighting, weather effects, and accumulated debris make classification difficult. In addition, the structure of the insulators, which consists of multiple disc- or pin-type elements, requires detection systems to consider both the individual components and the collective arrangement [27].

Contributions

This paper presents a field-oriented framework for automated insulator fault detection, combining the efficiency of YOLO-based object detection with a purpose-built Adaptive Context Refinement (ACR) module. While YOLO-v8 provides strong real-time detection capabilities, its performance in complex aerial inspection scenarios can be limited by the insufficient exploitation of contextual cues. The proposed ACR mechanism addresses this limitation by adaptively leveraging surrounding visual context to improve both detection precision and fault classification accuracy. The integration is designed to address the challenges of aerial UAV inspection, including small-scale defects, occlusion, and cluttered backgrounds.
The main contributions of this work are as follows:
  • Integration of ACR into multi-generation YOLO architectures for insulator inspection: Enhances YOLOv8–YOLOv12 detectors with a context-aware refinement stage that adaptively exploits surrounding visual cues, improving robustness in challenging conditions.
  • Adaptive multi-scale context extraction: Introduces a size-aware strategy that dynamically adjusts the contextual region based on the relative object area, improving the detection of small, partially occluded, or low-contrast faults in high-voltage insulators.
  • Lightweight dual-attention refinement network: Employs spatial and channel attention modules to refine bounding boxes and recalibrate confidence scores with minimal computational overhead, maintaining suitability for real-time UAV-based inspection.
  • Comprehensive cross-architecture evaluation: Assesses the proposed approach across 25 YOLO model variants (YOLOv8 to YOLOv12), showing consistent mAP gains—up to 22.9% improvement for resource-constrained nano models—while preserving efficiency.
  • Validation on real-world UAV datasets: Demonstrates robustness and applicability under diverse environmental and fault conditions using high-resolution UAV imagery from actual power transmission and distribution networks.
The remainder of the paper is organized as follows: Section 2 describes the proposed methodology, followed by the computational and validation framework in Section 3. Section 4 presents the results and discussion. Finally, Section 5 provides the conclusions.

2. Methodology

Computer vision techniques, particularly deep learning-based object detection, offer promising solutions to automate insulator fault detection. Among these approaches, You Only Look Once (YOLO) has emerged as an efficient framework capable of real-time detection with competitive accuracy. In this study, an approach is proposed that enhances YOLO with ACR to improve insulator fault detection precision.

2.1. YOLO Detection Framework

YOLO operates as a single-stage detector that processes the entire image in a single forward pass of the network, enabling real-time detection capabilities (see Figure 1). Given an input image I R H × W × 3 with height H, width W, and 3 color channels, YOLO divides the image into a regular grid of S × S cells. Each cell is responsible for detecting objects whose center falls within its boundaries. This grid-based approach can be represented as G = g i , j | i 1 , 2 , , S , j 1 , 2 , , S , where g i , j represents the cell at position ( i , j ) in the grid.
The YOLO architecture consists of a backbone network (typically a convolutional neural network like DarkNet) followed by detection heads. The backbone extracts hierarchical features from the input image: F = Φ ( I ) , where Φ represents the backbone network and F denotes the extracted feature maps. These feature maps are then processed by the detection heads to predict bounding boxes, objectness scores, and class probabilities for each grid cell: P = Ψ ( F ) , where Ψ represents the detection heads and P R S × S × B × ( 5 + C ) is the prediction tensor. Here, B is the number of bounding boxes predicted per grid cell, and C is the number of classes.
For each grid cell, YOLO predicts B bounding boxes. Each bounding box prediction consists of center coordinates ( b x , b y ) relative to the grid cell, width and height ( b w , b h ) relative to the image dimensions, objectness score p o indicating the probability of an object being present, and class probabilities p c for each of the C classes [28]. The network outputs are transformed to obtain the final bounding box parameters:
b x = σ ( t x ) + g x b y = σ ( t y ) + g y b w = p w e t w b h = p h e t h
where ( t x , t y , t w , t h ) are the raw network outputs, σ is the sigmoid function that constrains the center coordinates to be within the corresponding grid cell, ( g x , g y ) are the coordinates of the top-left corner of the grid cell, and ( p w , p h ) are the width and height of predefined anchor boxes, which serve as prior information about typical object shapes [29]. The anchor boxes are determined through statistical analysis of the training dataset, typically using clustering algorithms like k-means on the dimensions of ground truth boxes:
( p w k , p h k ) k = 1 B = k - means ( ( w i g t , h i g t ) i = 1 N )
where ( w i g t , h i g t ) are the width and height of ground truth boxes, and N is the number of ground truth boxes in the training set.
The confidence score for each bounding box is computed as s = σ ( t o ) · IoU ( b , b g t ) , where t o is the raw objectness score output by the network, σ ( t o ) represents the probability of an object being present, and IoU ( b , b g t ) is the Intersection over Union between the predicted box b and the ground truth box b g t . The IoU is calculated as:
IoU ( b , b g t ) = Area ( b b g t ) Area ( b b g t )
where ∩ represents the intersection and ∪ represents the union of the two boxes.
The class prediction for each bounding box is determined by P ( c = k | Object ) = σ ( t k ) , where t k is the network output for class k, and σ ( t k ) represents the conditional probability of the object belonging to class k given that an object exists. The final class prediction is
c * = argmax k 1 , 2 , , C , σ ( t k ) .
The YOLO loss function is a multi-part objective that balances localization accuracy, confidence prediction, and classification performance:
L = L loc + L obj + L noobj + L class
The localization loss penalizes errors in bounding box coordinates and dimensions:
L loc = λ coord i = 1 S 2 j = 1 B 1 i j obj ( t x i j t ^ x i j ) 2 + ( t y i j t ^ y i j ) 2 + t w i j t ^ w i j 2 + t h i j t ^ h i j 2
where λ coord is a weighting factor that increases the importance of localization errors, 1 i j o b j is an indicator function that equals 1 if the j-th bounding box predictor in cell i is responsible for detecting an object, and 0 otherwise, and ( t x i , t y i , t w i , t h i ) and ( t ^ x i , t ^ y i , t ^ w i , t ^ h i ) are the predicted and target box parameters, respectively.
The objectness loss penalizes errors in predicting object presence:
L obj = i = 1 S 2 j = 1 B 1 i j obj σ ( t o i j ) 1 2
where σ ( t o i ) is the predicted objectness score and σ ^ ( t o i ) is the target objectness score, typically set to the IoU between the predicted and ground truth boxes.
The no-object loss penalizes false positive predictions:
L noobj = λ noobj i = 1 S 2 j = 1 B 1 i j noobj σ ( t o i j ) 2
where λ n o o b j is a weighting factor that typically reduces the influence of background regions and 1 i j n o o b j is an indicator function that equals 1 if the j-th bounding box predictor in cell i is not responsible for detecting any object, and 0 otherwise.
The classification loss penalizes errors in class prediction:
L class = i = 1 S 2 1 i obj c = 1 C p i ( c ) p ^ i ( c ) 2
where 1 i o b j is an indicator function that equals 1 if an object appears in cell i and 0 otherwise, p i ( c ) is the predicted probability of class c in cell i, and p ^ i ( c ) is the target probability (1 for the correct class, 0 for others).
After obtaining the raw predictions from the network, YOLO applies non-maximum suppression (NMS) to remove redundant detections. The NMS algorithm sorts all detections by confidence score in descending order, then for each class, selects the detection with the highest confidence score and removes all other detections of the same class that have IoU greater than a threshold θ N M S with the selected detection. This process repeats until no detections remain above the confidence threshold θ c o n f . The final set of detections after NMS is given by D ( I ) = ( b j , c j , s j ) j = 1 M , where M is the number of retained detections, b j = ( x 1 , y 1 , x 2 , y 2 ) R 4 denotes the bounding box coordinates (top-left and bottom-right corners), c j 1 , 2 , , C represents the predicted class, and s j [ 0 , 1 ] indicates the confidence score.
Despite YOLO’s effectiveness in general object detection tasks, several limitations arise when applying it to insulator fault detection. YOLO processes each grid cell relatively independently, with limited ability to incorporate broader visual context that may be important for distinguishing subtle insulator defects from normal variations. The predefined anchor boxes may not optimally capture the varying shapes and sizes of insulator components and their associated defects, particularly for elongated insulator strings with small defects.
The discretization of the image into a grid introduces inherent constraints on localization precision, which is particularly problematic for small defects on insulators that may span only a fraction of a grid cell. Environmental factors such as lighting, weathering, and partial occlusion can create visual ambiguities that standard classification approaches struggle to resolve without contextual information. Additionally, insulator defects can manifest at various scales, from microscopic cracks to large-scale damage, requiring multi-scale analysis capabilities that go beyond YOLO’s standard feature pyramid approach.
To address these limitations, it was proposed to enhance the YOLO framework with ACR, a technique that leverages surrounding visual context to improve detection precision and fault classification accuracy. The following section provides a detailed description of ACR methodology and how it integrates with the YOLO detection framework.

2.2. Adaptive Context Refinement

Let I R H × W × 3 represent an input image with height H, width W, and 3 color channels. Given a base object detector D which outputs a set of detections { ( b i , c i , s i ) } i = 1 N , goal is to refine these detections using contextual information. Each detection consists of a bounding box b i = ( x 1 , y 1 , x 2 , y 2 ) R 4 , a class label c i { 1 , 2 , , C } , and a confidence score s i [ 0 , 1 ] .
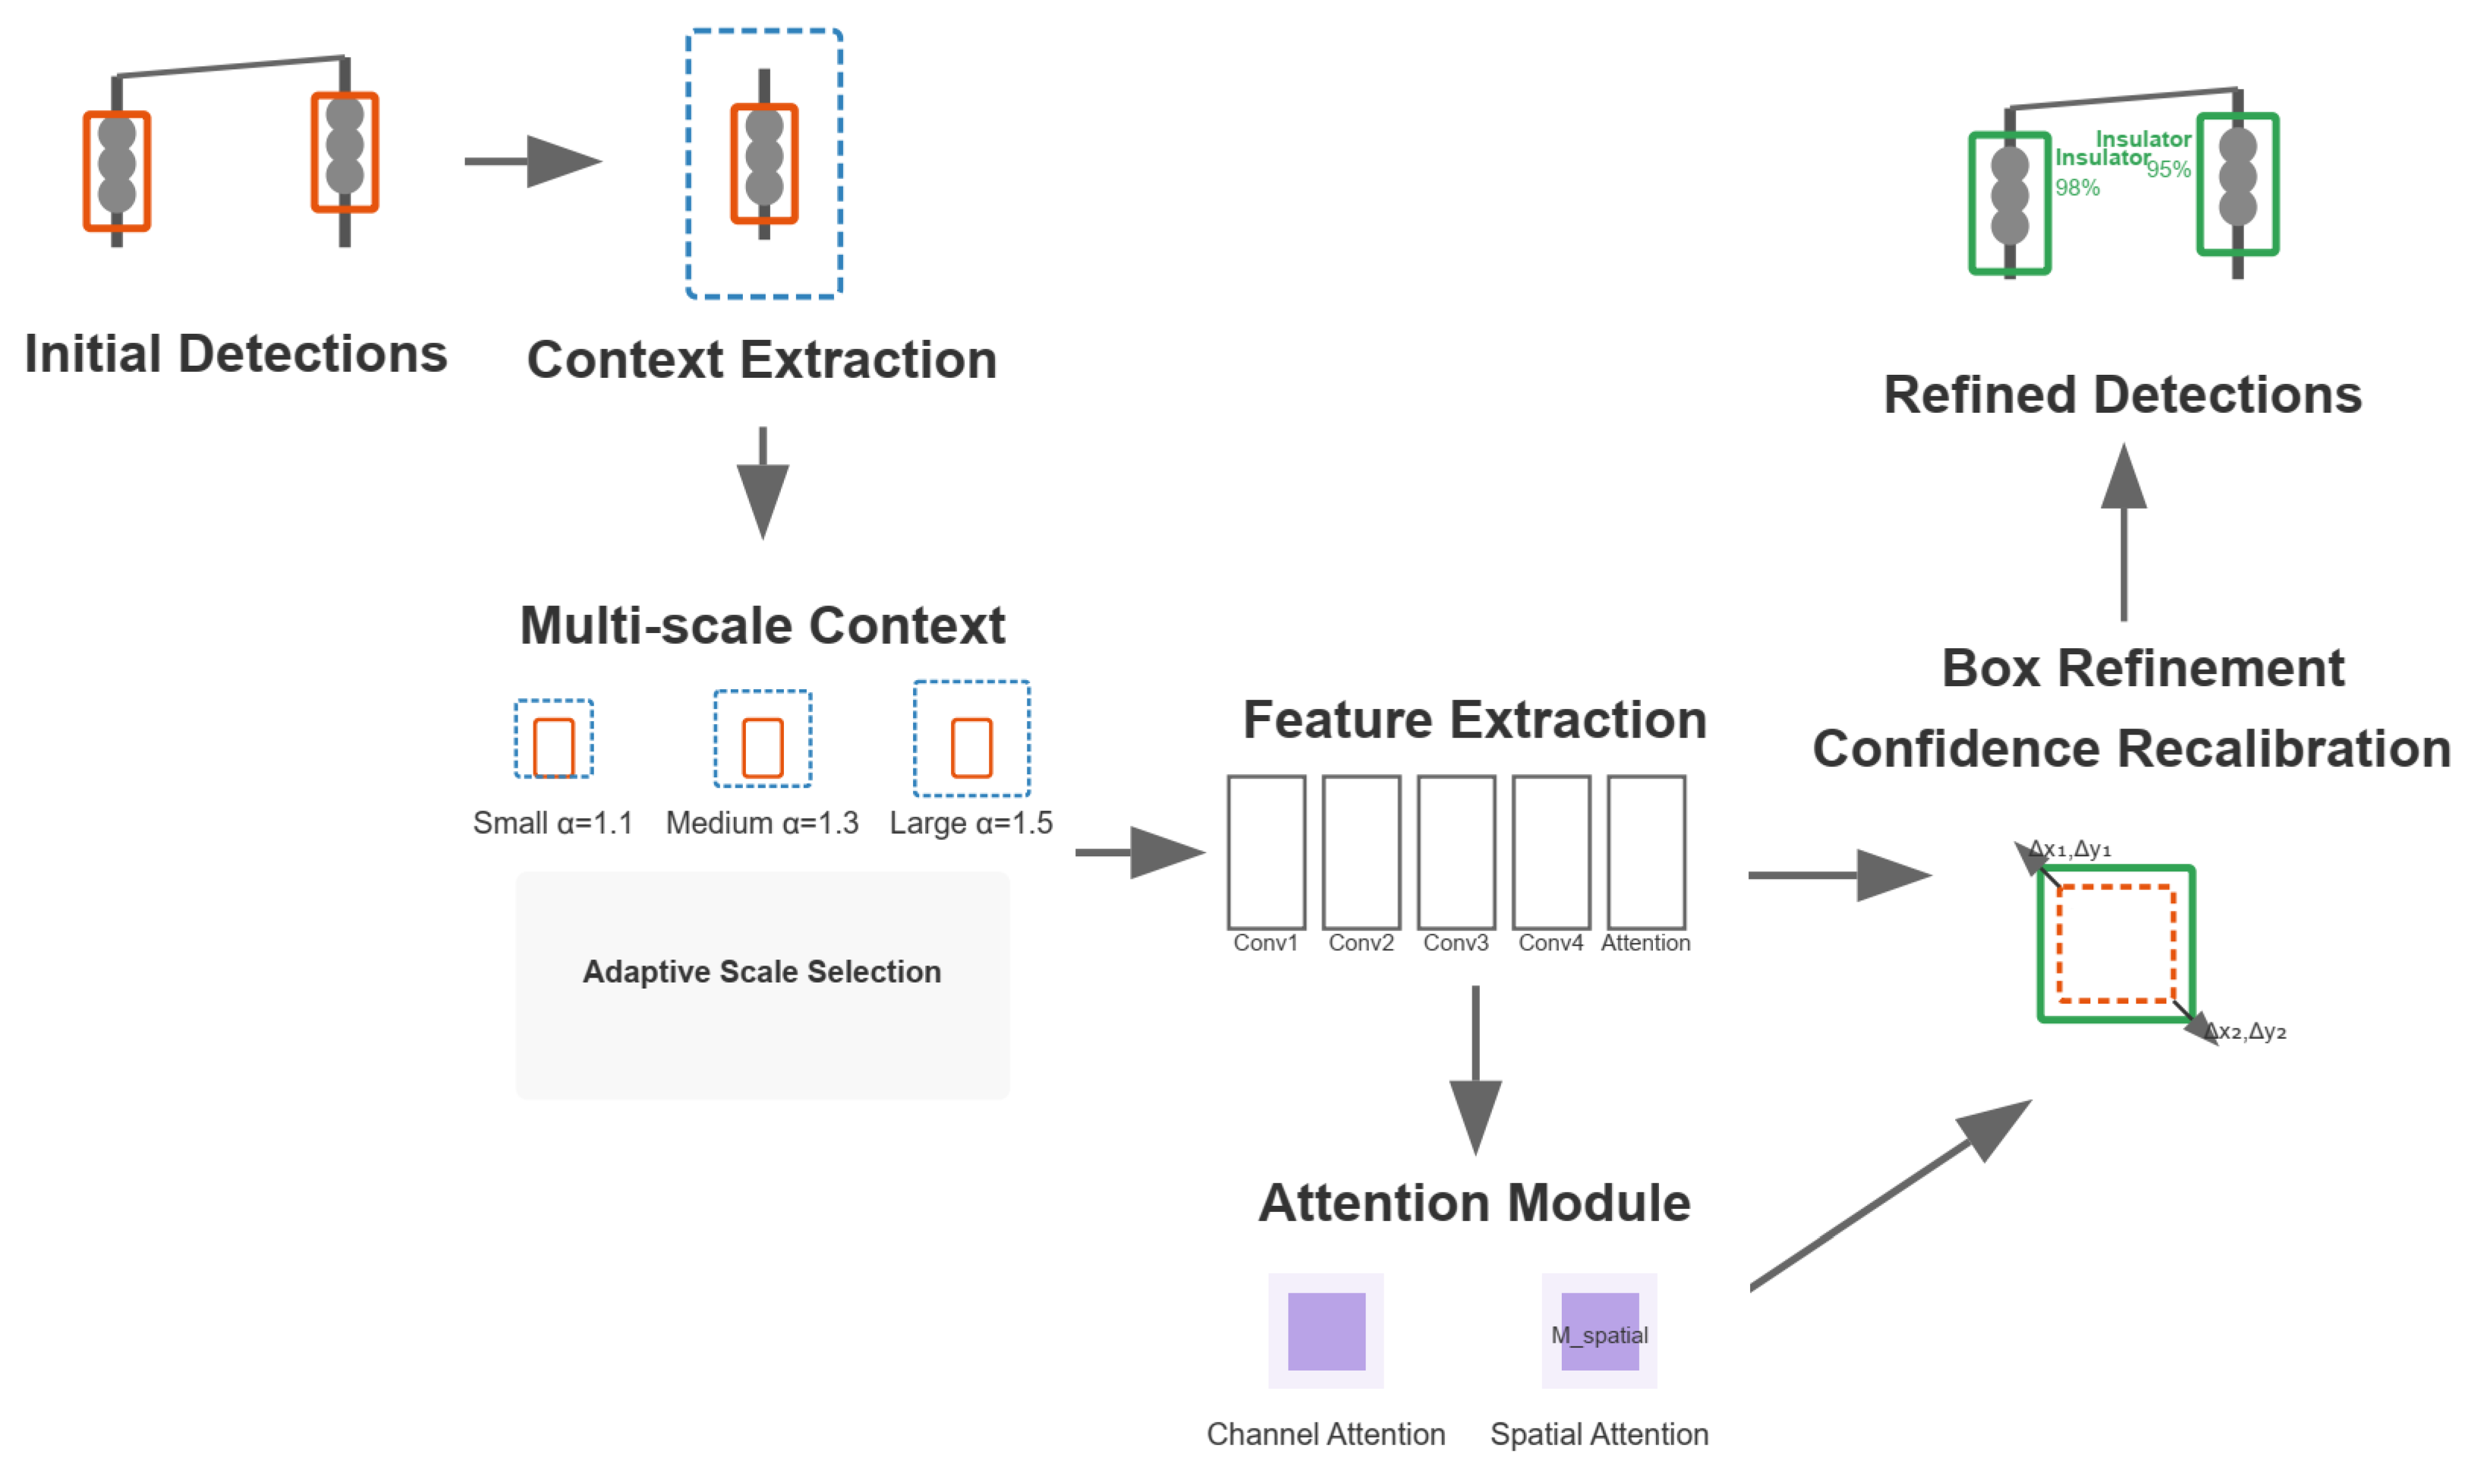
Employ Adaptive Context Refinement, in short ACR, a technique that enhances detection by incorporating contextual information from regions surrounding the initial detections (see Figure 2). The refinement process can be formulated as a function R that maps the initial detections to refined detections:
{ ( b i , c i , s i ) } i = 1 N = R ( I , { ( b i , c i , s i ) } i = 1 N )
where b i and s i represent the refined bounding box coordinates and confidence scores, respectively.

2.3. Context Extraction and Neural Architecture

For each detection with confidence exceeding a threshold τ ( s i > τ ), extract multiple context regions at varying scales. For a detection box b i , the context region at scale α is computed as:
b i α = ( c x α w 2 , c y α h 2 , c x + α w 2 , c y + α h 2 )
where the center coordinates ( c x , c y ) and dimensions ( w , h ) are derived from b i :
c x = x 1 + x 2 2 , c y = y 1 + y 2 2 , w = x 2 x 1 , h = y 2 y 1
The scale factor α is adaptively selected based on the relative size of the object:
α = α large if w h H W > σ large α medium if σ small < w h H W σ large α small if w h H W σ small
where σ small = 0.1 and σ large = 0.5 are thresholds, and α small = 1.5 , α medium = 1.3 , and α large = 1.1 are the context scales.
The convolutional feature extraction pathway consists of four layers with increasing receptive fields:
f 1 = ReLU ( BN ( Conv 3 × 3 ( I b i α resized , 16 ) ) )
f 2 = ReLU ( BN ( Conv 3 × 3 ( f 1 , 32 ) ) )
f 3 = ReLU ( BN ( Conv 3 × 3 ( f 2 , 64 ) ) )
f 4 = ReLU ( BN ( Conv 3 × 3 ( f 3 , 128 ) ) )
where Conv 3 × 3 ( X , n ) denotes a 2D convolution with n filters of size 3 × 3 and stride 2, applied to input X, and BN denotes batch normalization.

2.4. Spatial Attention and Feature Fusion

To focus on relevant spatial regions, incorporate a spatial attention mechanism:
f avg = AvgPool channel ( f 4 )
f max = MaxPool channel ( f 4 )
f concat = Concat ( f avg , f max )
M spatial = σ ( Conv 7 × 7 ( f concat , 1 ) )
f att = f 4 M spatial
where σ is the sigmoid activation function, and ⊗ denotes element-wise multiplication with channel-wise broadcasting. The spatial attention module produces an attention map M spatial that highlights important regions in the feature maps.
Global average pooling is applied to obtain a fixed-length feature vector:
f global = GlobalAvgPool ( f att ) R 128
The normalized bounding box coordinates within the context region are processed through a fully connected layer:
f box = ReLU ( FC ( b ^ i , 16 ) ) R 16
The image and box features are fused and processed to predict the refinement:
f fused = ReLU ( FC ( Concat ( f global , f box ) , 64 ) )
Δ b ^ i = tanh ( FC ( f fused , 4 ) ) · δ
where δ = 0.1 is a scaling factor to constrain the magnitude of refinements.

2.5. Box Refinement and Confidence Recalibration

The predicted refinement Δ b ^ i is denormalized to the context region coordinates and applied to the original box:
Δ b i α = Δ b ^ i [ 0 ] · w α , Δ b ^ i [ 1 ] · h α , Δ b ^ i [ 2 ] · w α , Δ b ^ i [ 3 ] · h α
b i = x 1 + Δ b i α [ 0 ] , y 1 + Δ b i α [ 1 ] , x 2 + Δ b i α [ 2 ] , y 2 + Δ b i α [ 3 ]
The final refined box is constrained to the image boundaries:
b i = max ( 0 , b i [ 0 ] ) , max ( 0 , b i [ 1 ] ) , min ( W , b i [ 2 ] ) , min ( H , b i [ 3 ] )
The confidence score is recalibrated based on the IoU between the original and refined boxes:
s i = s i · γ ( IoU ( b i , b i ) )
where γ is a piecewise function:
γ ( IoU ) = 1.05 if IoU > 0.9 1.02 if 0.7 < IoU 0.9 0.98 if 0.5 < IoU 0.7 0.90 if IoU 0.5

2.6. Training Methodology

The refinement network is trained using examples generated by matching base detector predictions with ground truth boxes. The training dataset consists of triplets ( I b i α resized , b ^ i , b ^ i gt ) , where b ^ i gt represents the normalized ground truth box coordinates in the context region. The network is trained to minimize the smooth L1 loss between the predicted refinement and the target refinement:
L = SmoothL 1 ( Δ b ^ i , b ^ i gt b ^ i )
The network is optimized using Adam with learning rate η = 5 × 10 4 , weight decay λ = 10 5 , batch size B = 32 , and trained for E = 50 epochs. A reduce-on-plateau scheduler with patience of 5 epochs and reduction factor of 0.5 is employed for learning rate adaptation.
During inference, multiple context scales are evaluated for each detection, and the refinement with the highest recalibrated confidence score is selected:
α * = arg max α { α small , α medium , α large } s i α
The final refined detection is ( b i α * , c i , s i α * ) . The computational complexity of the refinement network is O ( K · H r W r ) for K context scales. For efficiency, apply refinement only to detections with confidence above threshold τ = 0.3 . The memory footprint of approximately 2.5M parameters makes the refinement network lightweight and suitable for deployment alongside the base detection model.

3. Implementation and Validation Framework

The algorithm implementations were developed in Python 3.12. For object detection tasks, a maximum limit of 100 training epochs was set, adopting the early stopping criterion if there was no improvement in performance over 10 consecutive epochs. In the context of synthetic image generation through generative models, up to 1000 training cycles were considered. Performance evaluation was performed based on the number of epochs, with the aim of identifying the point at which the model reaches its best performance.
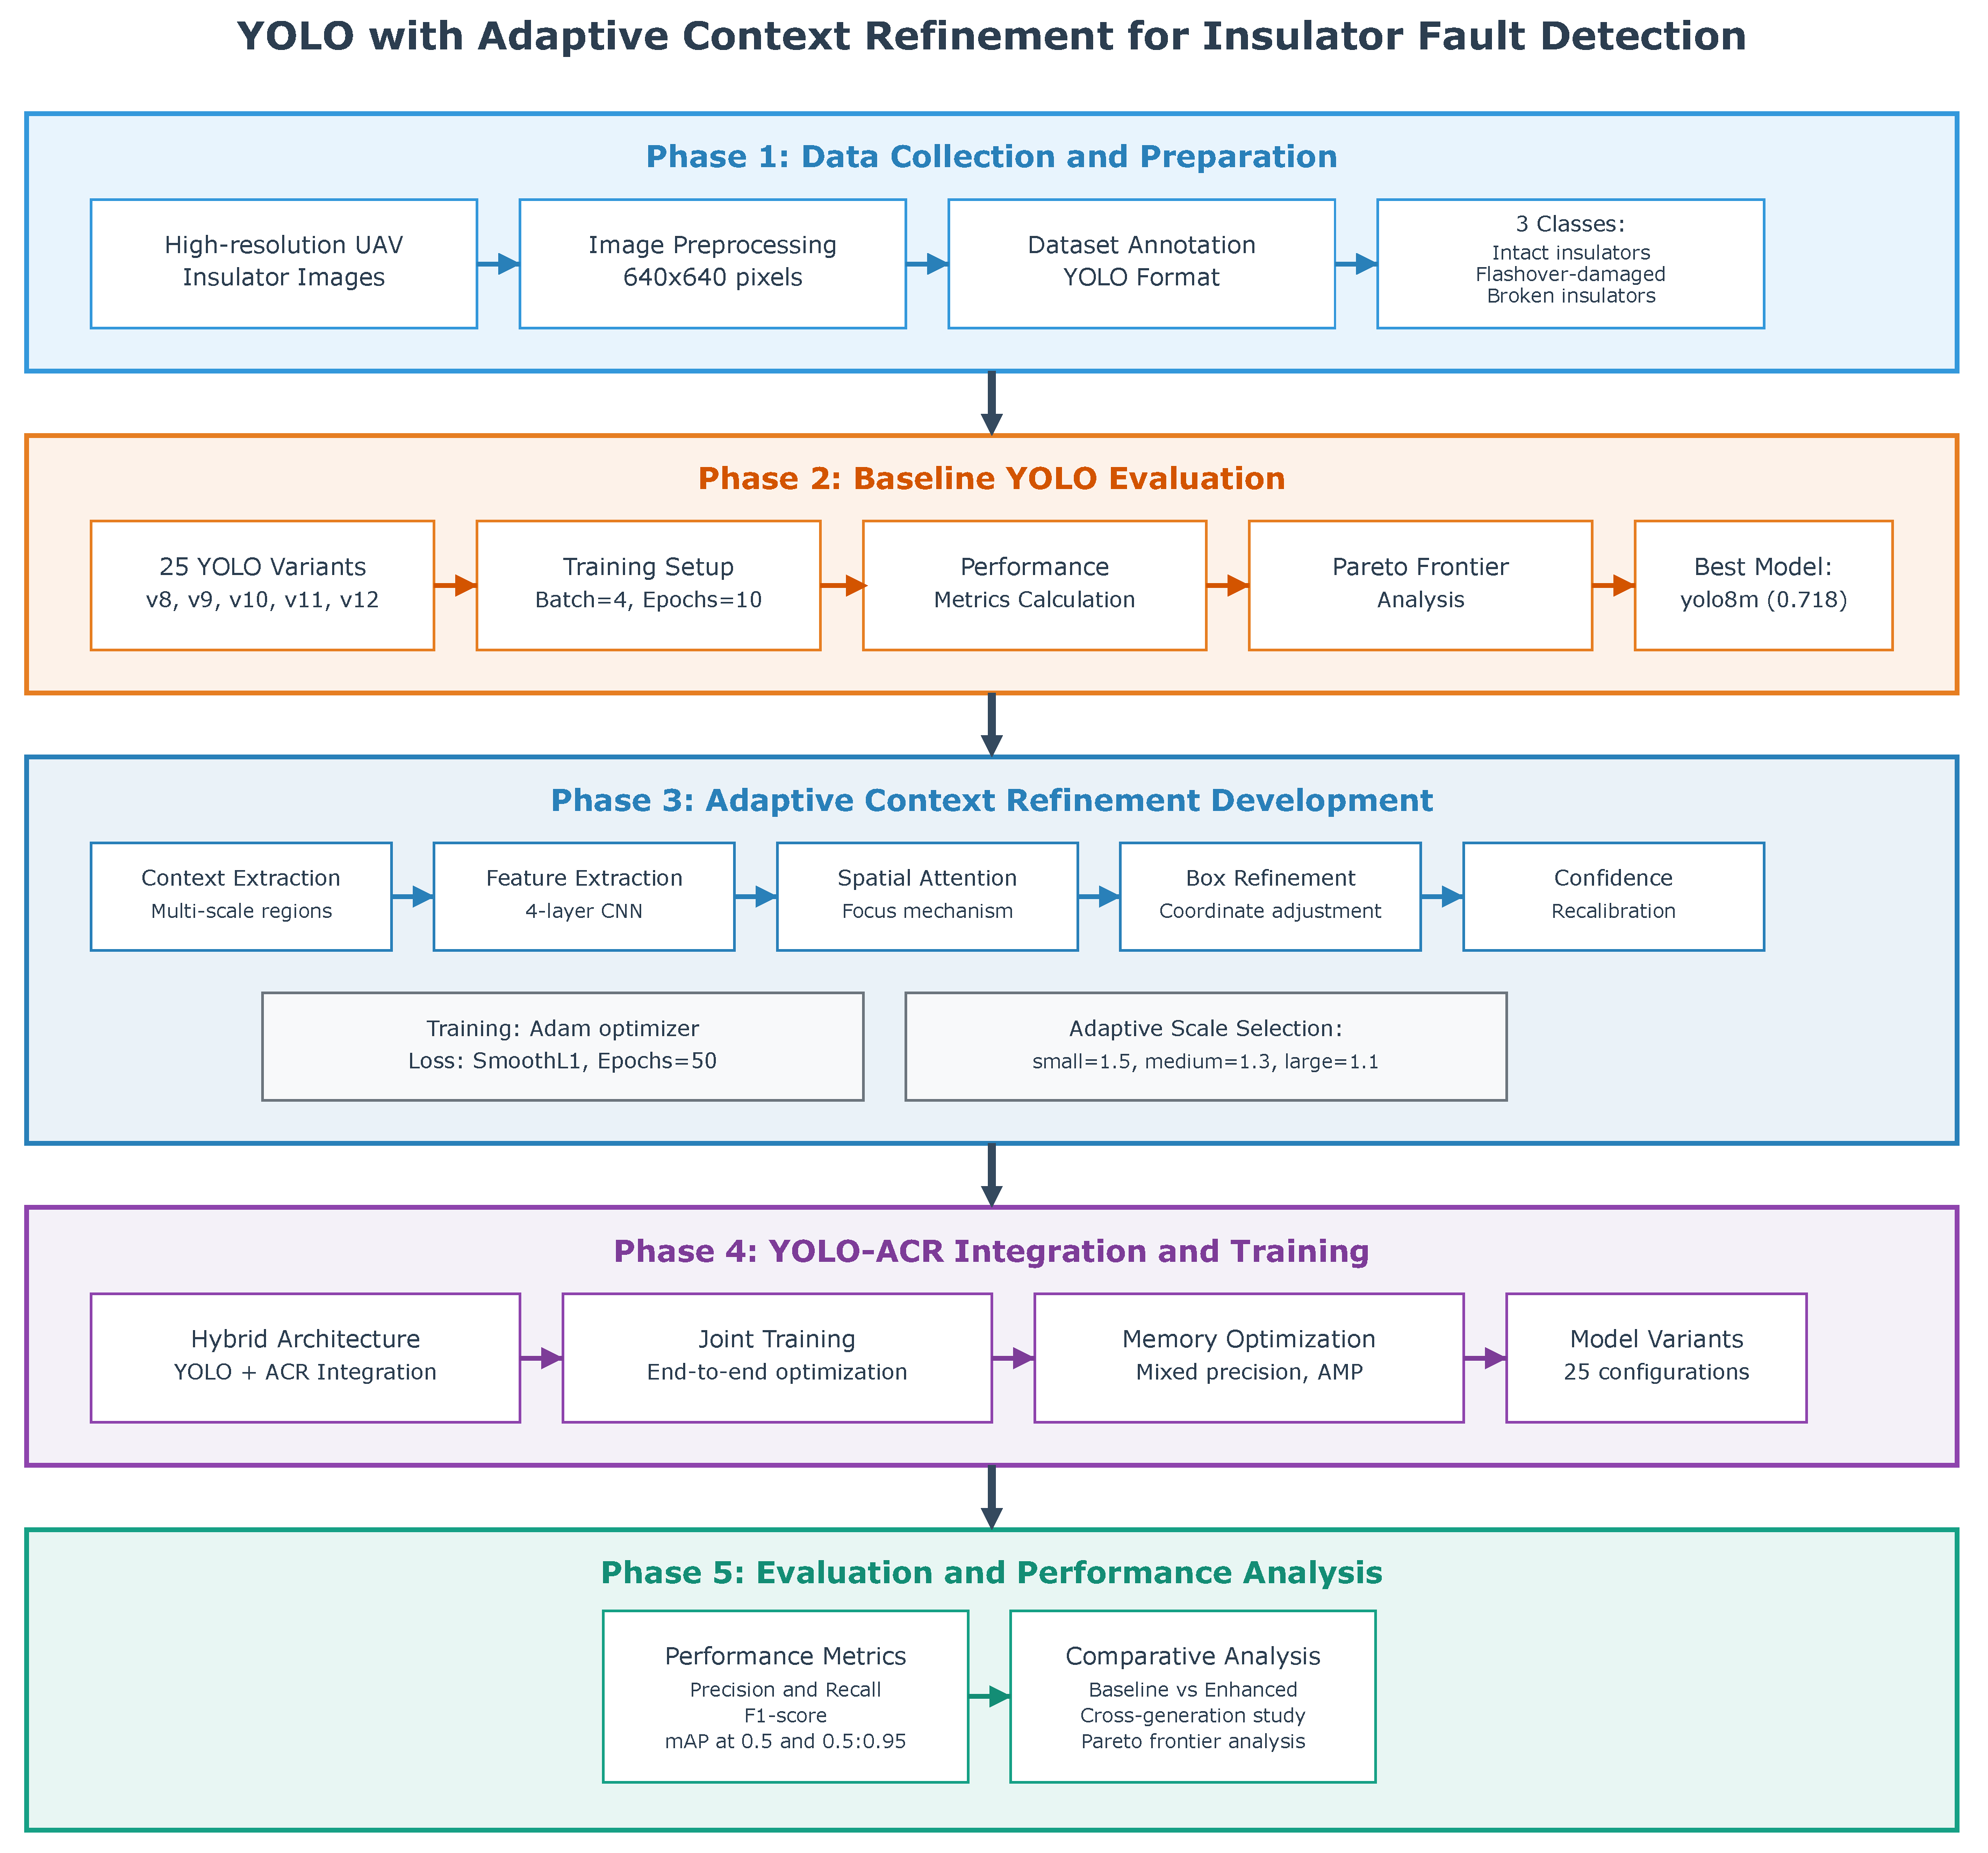
The overall methodology is presented in Figure 3.

3.1. Performance Evaluation Metrics

To evaluate model performance, the metrics of precision, recall, F1-score, and mAP were adopted [30]. For object detection tasks, two Intersection over Union (IoU) thresholds were used: a fixed threshold of 0.5 (mAP@[0.5]) and a range from 0.5 to 0.95 in increments of 0.05 (mAP@[0.5:0.95]), determined as follows:
p r e c i s i o n = t p t p + f p
r e c a l l = t p t p + f n
F 1 s c o r e = 2 × r e c a l l × p r e c i s i o n r e c a l l + p r e c i s i o n
m A P = 1 n k = 1 n η ( r e c a l l η r e c a l l η 1 ) p r e c i s i o n η k
where t p is the true positive, f p is the false positive, and f n is the false negative, η is the threshold associated with the nth level, and k is the class label corresponding to that level among the n possible classes.

3.2. Dataset

The analysis conducted in this study employed a dataset comprising high-resolution images of insulator strings, categorized into the following three sub-classes based on their condition: flashover-damaged insulator shells, broken insulator shells, and intact insulator shells. These images, originally captured during inspections of high-voltage transmission lines, are available through the repository developed by Lewis and Kulkarni [31].
The dataset includes insulator chains photographed under various conditions, including different angles and distances, insulators with visible structural damage, and surface degradation caused by flashover events. All images were acquired using high-resolution digital single-lens reflex cameras during transmission line inspections carried out under favorable weather conditions. Preprocessing steps included converting the original JSON-based annotations into YOLO-compatible files and resizing all images to 640 × 640 pixels, following the input specifications of the employed models.
Details regarding the number of annotated samples can be seen in [30]. For generalization, the proposed model is also applied to the dataset presented in [32], which contains 240 images of inspections recorded in an electrical power distribution network located in southern Brazil containing 13.8 kV. The set of images is divided into half-damaged and half-normal component conditions.
Figure 4 presents examples of insulators considered in this study. Figure 4A shows an insulator chain with insulators in different conditions (we highlighted in red a broken insulator and in green an insulator in good condition) [31]. Figure 4B shows an insulator with contamination on its surface and in the structure that supports the insulator.

4. Results and Discussion

In this section, the results and discussions related to the method proposed in this paper are presented.

4.1. Training Methodology

The experimental implementation for training the proposed hybrid YOLO with ACR utilizes a systematic approach designed to evaluate model performance across different YOLO architectures. The training framework employs YOLO versions 8 through 10, applying various model capacities for each version to analyze the impact of model scale on fault detection accuracy. The training process is implemented using a memory-efficient approach defined by the following parameters:
Batch size = 4
Input resolution = 416 × 416 pixels
Mixed precision training = Enabled
Worker threads = 0
Epochs = 10
Early stopping patience = 25
Checkpoint frequency = 5 epochs
For YOLOv9, the model sizes examined include tiny (t), small (s), medium (m), compact (c), and extended (e) configurations. For YOLOv8 and YOLOv10, the analysis encompasses nano (n), small (s), medium (m), large (l), and extra-large (x) variants. This range of model scales enables a comprehensive evaluation of the trade-off between computational efficiency and detection performance.
The dataset organization adheres to the standard YOLO format, with distinct directories for training and validation sets, each containing separate folders for images and the corresponding label annotations. The label format follows the YOLO convention with normalized bounding box coordinates and class identifiers that map to the following predefined categories of insulator conditions: intact insulators, flashover-damaged insulator shells, and broken insulator shells.

4.2. Implementation Details

The implementation leverages the Ultralytics YOLO framework with custom modifications to incorporate the ACR module. The training pipeline includes the following components:
  • Data Configuration: A custom YAML configuration generator that creates the required dataset specification with appropriate paths and class definitions.
  • Memory Management: Implementation of memory optimization techniques, including the following:
    • Dynamic garbage collection.
    • CUDA cache emptying between training runs.
    • Automatic mixed precision (AMP) to reduce memory footprint.
    • Minimal worker threads to reduce parallel processing overhead.
  • Adaptive Training: The framework includes fallback mechanisms to handle potential memory limitations as follows:
    • Automatic reduction in batch size and image resolution if out-of-memory errors occur.
    • Optional subset training on reduced dataset samples for preliminary model validation.
    • Device-agnostic implementation with CPU fallback capability.
  • Evaluation Metrics: The training process tracks multiple performance indicators, including the following:
    • Precision and recall for class-specific performance.
    • mAP at IoU thresholds of 0.5 (mAP@0.5) and 0.5:0.95 (mAP@0.5:0.95).
    • F1-score for balanced evaluation of precision and recall.
Model training is executed with consistent hyperparameters across all YOLO versions to ensure fair comparison. The base models are initialized with pre-trained weights, and they are then fine-tuned on the insulator dataset with the addition of the ACR module.

4.3. Experimental Framework

The experimental evaluation follows a structured protocol to assess the contribution of the proposed ACR enhancement as follows:
1. Baseline Evaluation: Each YOLO model variant is first trained without the ACR module to establish baseline performance metrics.
2. Enhanced Model Training: The same model architectures are then augmented with the ACR module and trained using identical datasets and hyperparameters.

4.4. Baseline Analysis with YOLO Variants

To evaluate the baseline performance of state-of-the-art YOLO models, we conducted a comparative study across 25 variants spanning the YOLOv8, YOLOv9, YOLOv10, YOLOv11, and YOLOv12 families. Each model was trained under identical settings using the ACF detection pipeline, and their final detection performance metrics are summarized in Table 1. All models were trained for five epochs each, in order to keep the comparisons fair.
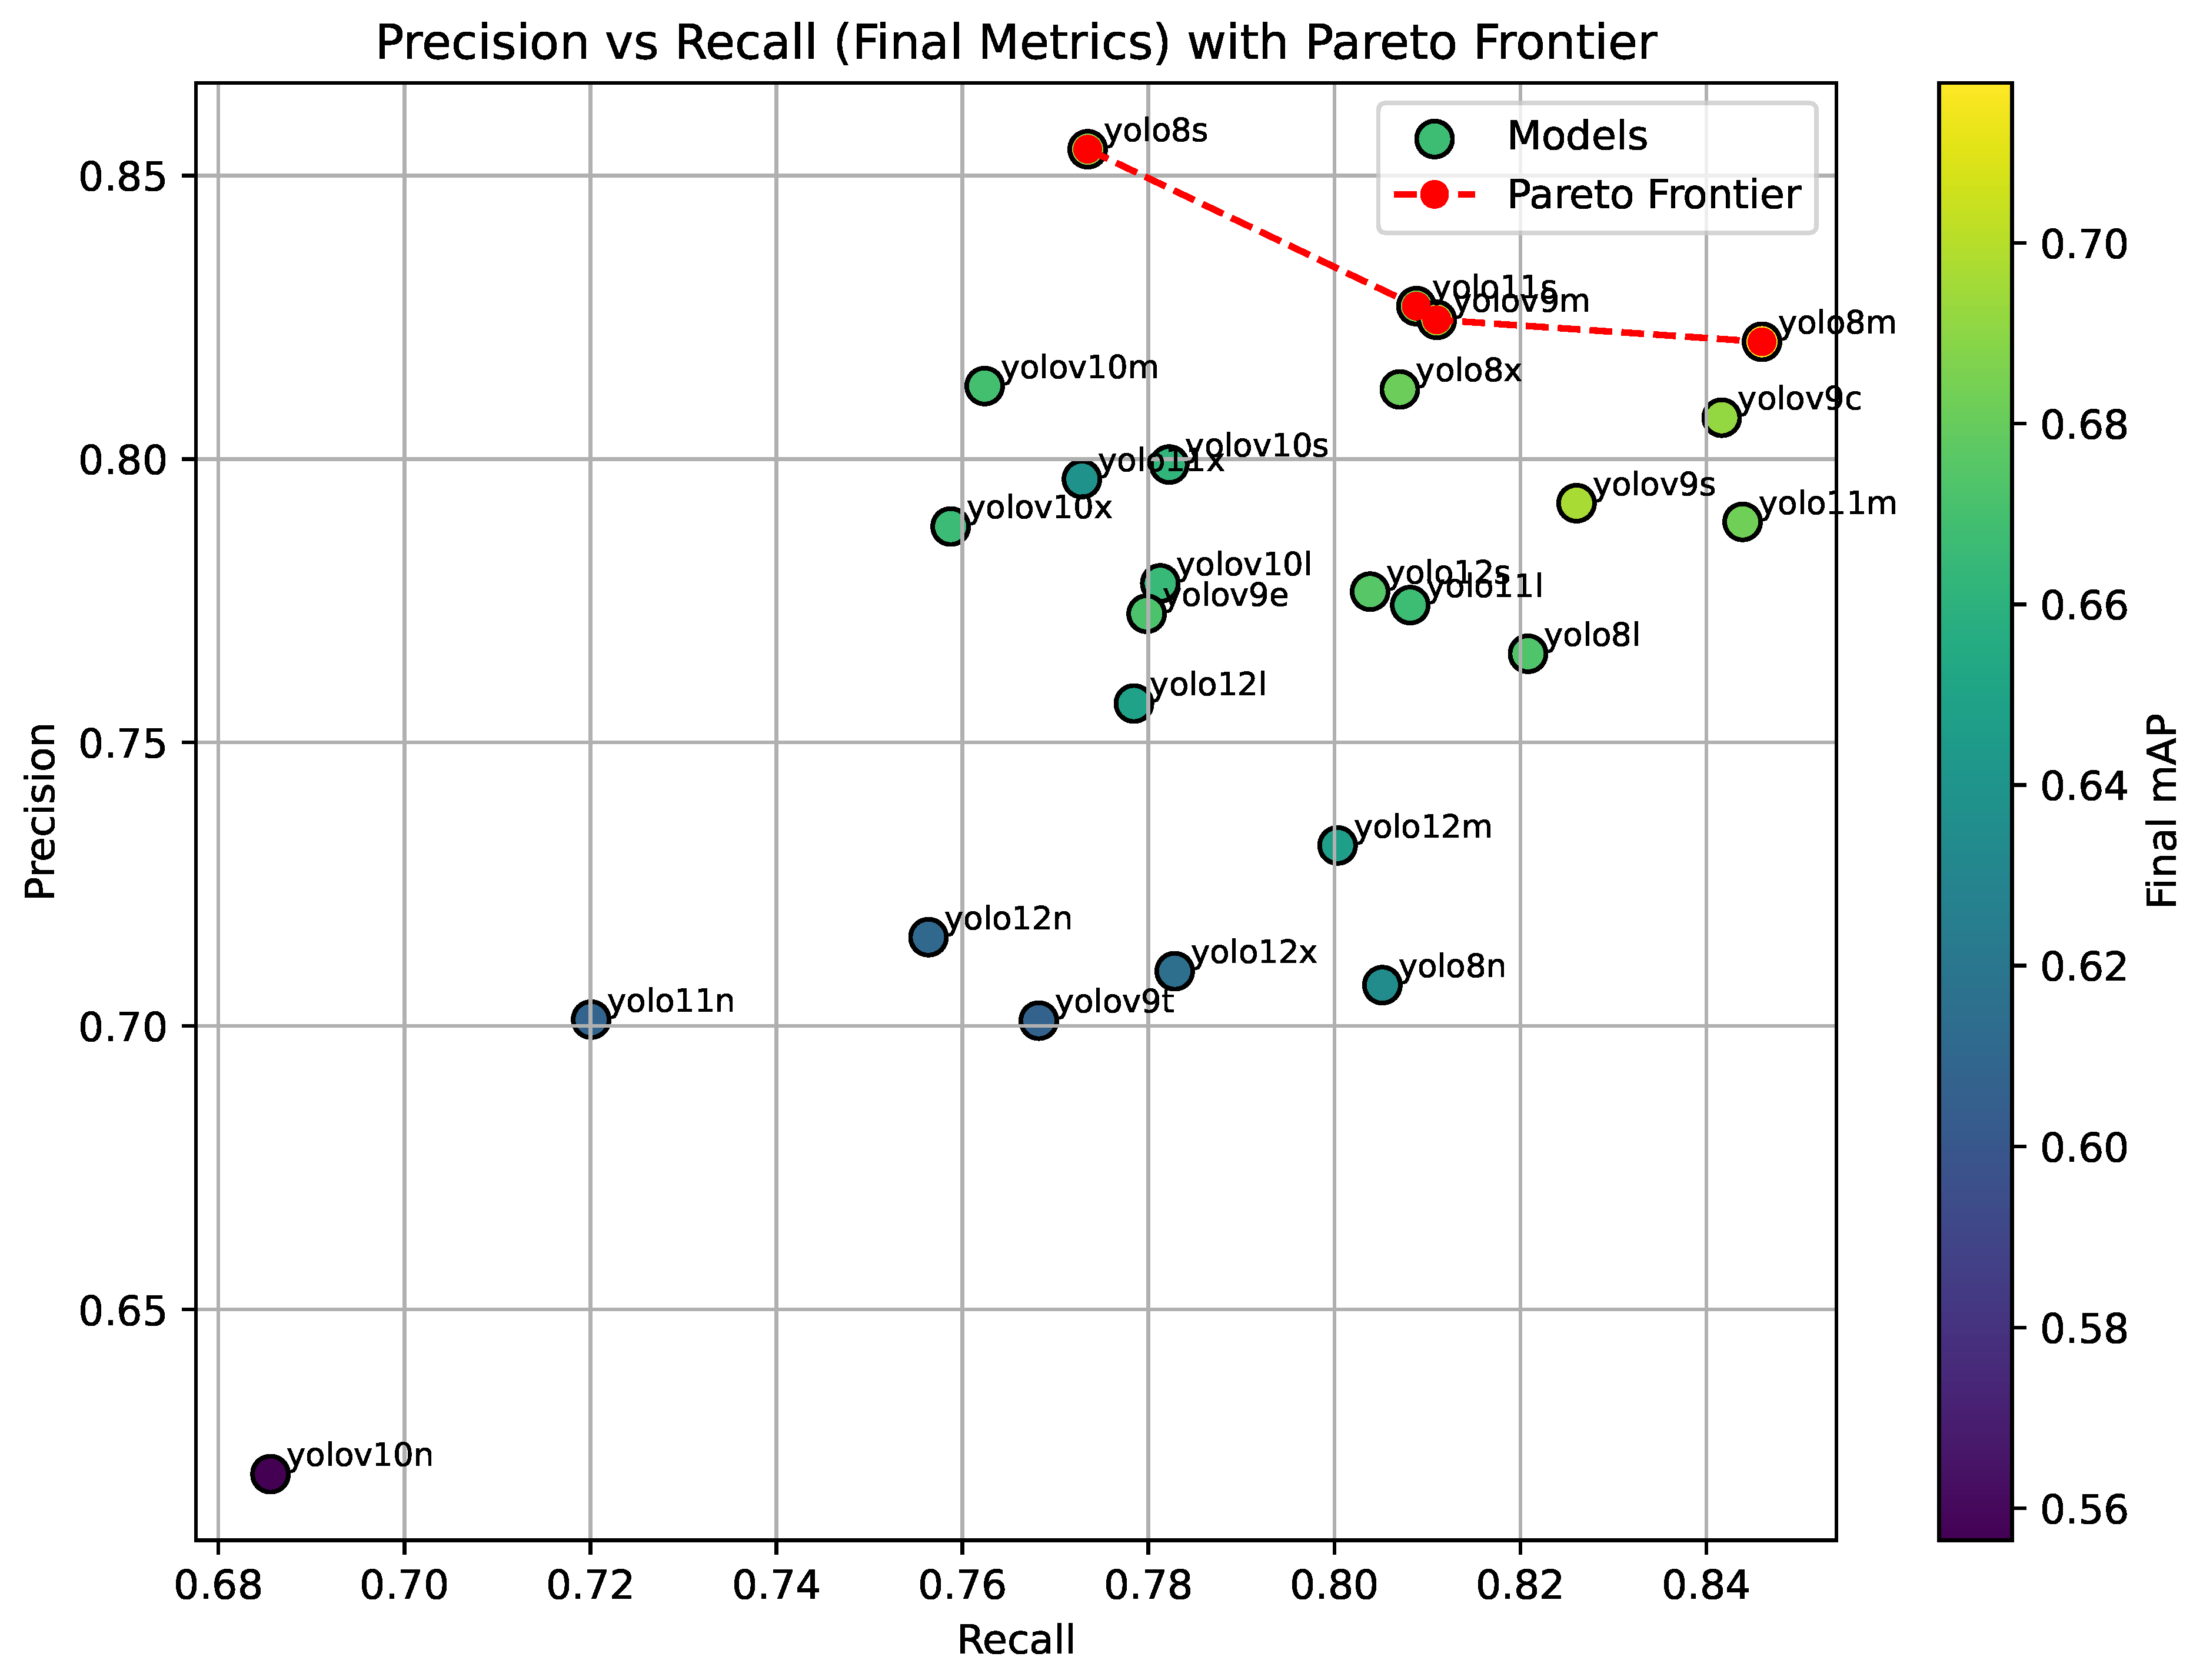
The highest mAP was achieved by yolo8m (0.718), followed closely by yolov9s and yolov9m, indicating that medium-sized models in the YOLOv8 and YOLOv9 families yield the best trade-off between capacity and generalization. Interestingly, smaller models such as yolo8s also perform competitively (0.691 mAP), demonstrating strong precision (0.855) despite slightly lower recall (0.773). This suggests that yolo8s is a conservative detector, generating fewer false positives, which is often desirable in safety-critical applications.
To further analyze the trade-offs between precision and recall across models, we plotted all configurations on a scatter diagram in Figure 5, with the mAP score represented as color intensity.
Figure 5 illustrates that only a subset of models lie on the Pareto frontier, including yolo8s, yolov9m, yolo8m, and yolov9c. These models provide the most favorable trade-offs; no other configuration simultaneously improves both precision and recall compared to them. In contrast, models such as yolov10n and yolo11n exhibit significantly lower performance in both metrics and are Pareto-dominated.

4.5. Refinement Analysis and Cross-Generation Comparison

To assess the effectiveness of our proposed refinement methodology, we applied the optimized training pipeline to all 25 YOLO variants and compared their performance against the baseline results. Table 2 presents a comprehensive comparison of original versus refined mAP and recall scores, including percentage gains for each model configuration.
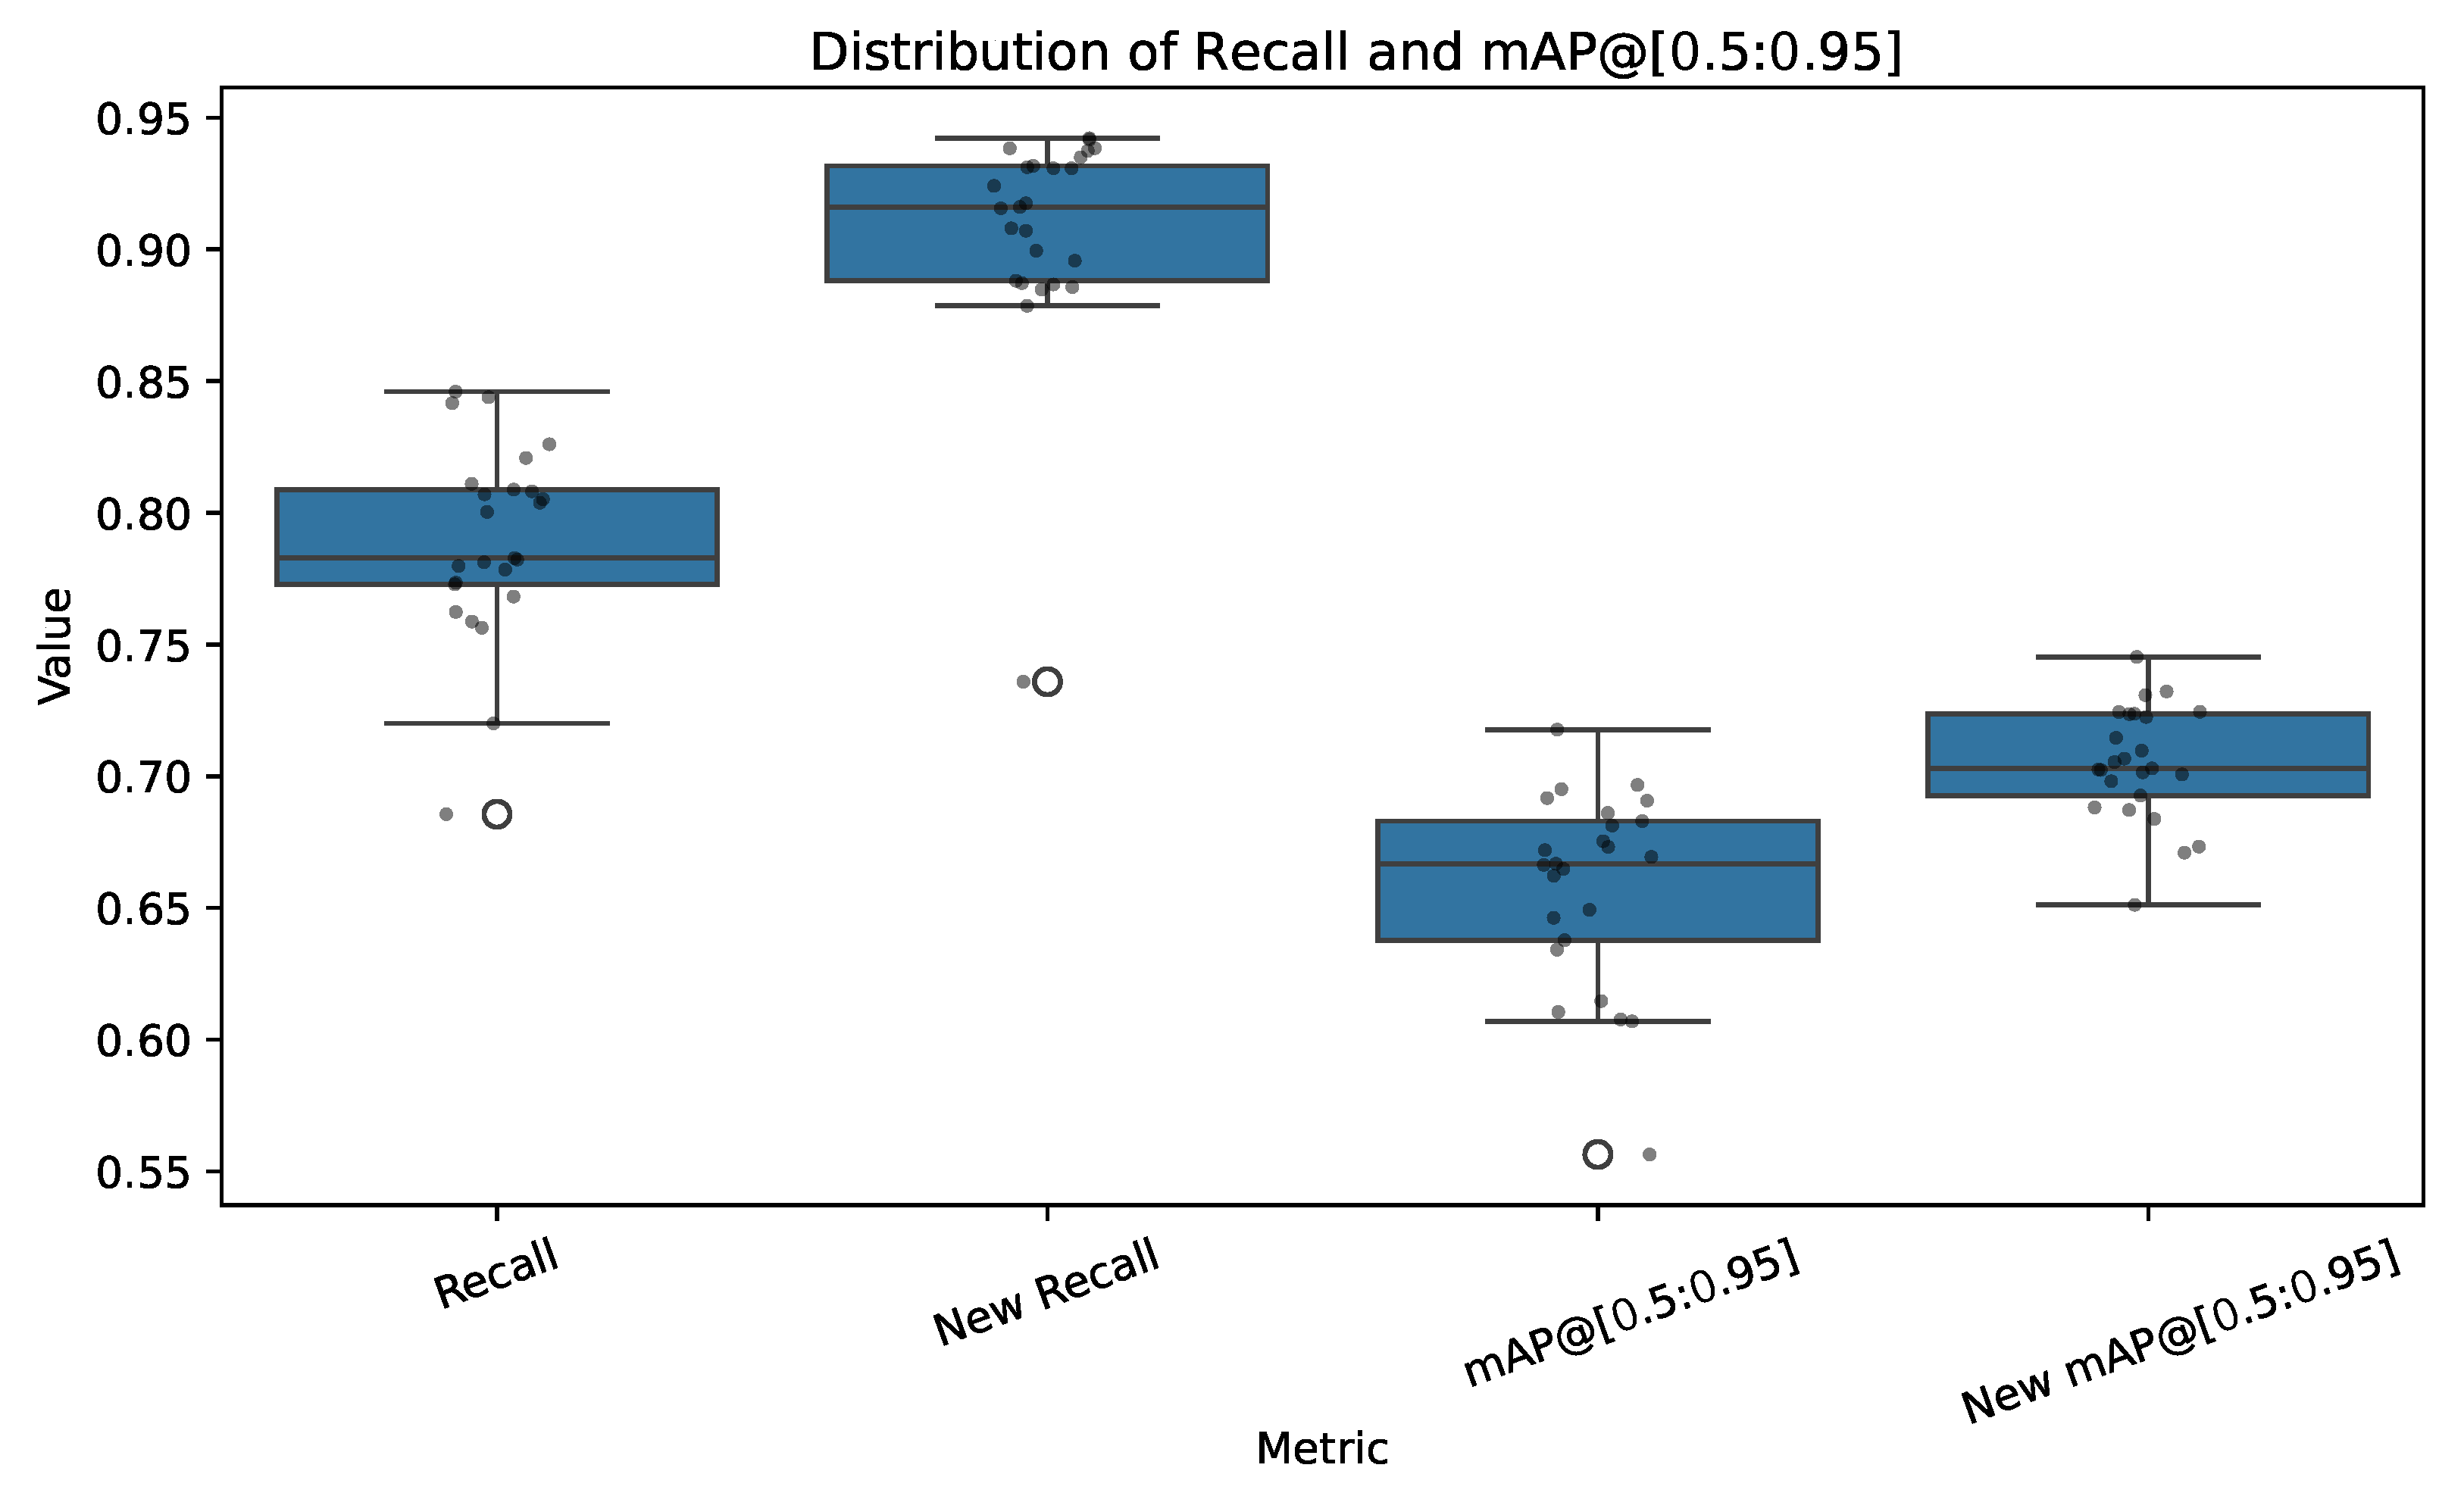
The comparison is also shown in the form of a boxplot, in order to illustrate the overall gain along the different models, as shown in Figure 6.
The refinement methodology demonstrates varying degrees of effectiveness across different YOLO generations. Notably, YOLOv10 exhibits the most substantial improvements, with an average gain of approximately 12.6% across all model sizes. The standout performer is yolov10n, which achieved a remarkable 22.9% improvement (from 0.556 to 0.684 mAP), the largest single improvement in the entire evaluation. This dramatic enhancement suggests that YOLOv10’s architecture is particularly well-suited to benefit from our proposed refinement approach, especially for resource-constrained nano variants that initially exhibited lower baseline performance.
YOLOv12 demonstrates consistent gains with an average improvement of approximately 8.6%, indicating that the newest generation also responds favorably to the refinement methodology. Notably, yolo12x achieved an 11.96% improvement, while the smaller variants (yolo12n and yolo12m) showed gains of 9.90% and 9.35%, respectively.
In contrast, YOLOv8 and YOLOv9 exhibit more modest improvements, with average gains of 4.0% and 5.6%, respectively. However, within these families, smaller models tend to benefit more significantly than their larger counterparts. For instance, yolo8n improved by 8.36%, while yolo8m, the baseline champion, gained only 0.84%. This pattern suggests that well-optimized larger models may already be operating closer to their performance ceiling, whereas smaller models have greater potential for improvement through refined training strategies.
YOLOv11 shows mixed results, with an average improvement of 5.4%. Interestingly, yolo11x achieved a substantial 9.99% gain, while yolo11s showed minimal improvement (0.97%). This variability within the YOLOv11 family indicates that the effectiveness of our refinement approach may depend on specific architectural characteristics and initial optimization states.
The results reveal an important trend—models with initially lower baseline performance tend to benefit more from refinement. This is particularly evident in the nano variants across all generations, where substantial improvements were consistently observed. Conversely, models that already achieved high baseline performance, such as yolo8m and yolo11s, showed diminishing returns from further optimization, suggesting they may have already converged to near-optimal solutions under the original training regime.

5. Conclusions

This study evaluates YOLO-based insulator fault detection systems enhanced with ACR across 25 model variants spanning YOLOv8 through YOLOv12. The baseline analysis established performance characteristics for each architecture, while the refinement methodology demonstrated varying degrees of improvement across different YOLO generations.
The baseline evaluation identified yolo8m as achieving the highest initial performance with 0.718 mAP. Pareto frontier analysis revealed four configurations (yolo8s, yolov9m, yolo8m, and yolov9c) that provide optimal precision–recall trade-offs, with no other models simultaneously improving both metrics.
The ACR methodology produced the largest improvements in YOLOv10, with an average gain of 12.6% across all model sizes. The yolov10n variant achieved the maximum individual improvement of 22.9% (from 0.556 to 0.684 mAP). YOLOv12 models showed consistent gains averaging 8.6%, while YOLOv8 and YOLOv9 exhibited more modest improvements of 4.0% and 5.6%, respectively.
The results reveal an inverse relationship between baseline performance and refinement potential; models with lower initial performance consistently achieved larger improvements through the ACR methodology. Nano variants across all generations demonstrated the highest percentage gains, while well-optimized models such as yolo8m and yolo11s showed minimal improvement, suggesting convergence to near-optimal solutions under the original training regime.
The proposed ACR-enhanced YOLO framework addresses key limitations in automated insulator inspection by incorporating contextual information to reduce false positives, improving the detection of partial defects through adjacent area analysis, and enhancing classification accuracy by considering relative anomaly positions within insulator strings. The selective refinement process maintains computational efficiency by focusing processing resources on regions of interest, enabling practical deployment in field inspection systems.
Future work should investigate the generalization of ACR across different power grid components and explore adaptive context scale selection mechanisms based on environmental conditions and defect characteristics. Additionally, real-time deployment studies are needed to validate the practical performance of ACR-enhanced models in operational inspection scenarios.

Author Contributions

Writing—original draft: L.S.A. and L.F.R.A.; writing—review and editing, software, and methodology, validation: L.O.S.; writing—review and editing—and supervision, V.C.M., L.d.S.C., and G.V.G. All authors have read and agreed to the published version of the manuscript.

Funding

This work is part of the project Self-adaptive platform based on intelligent agents for the optimization and management of operational processes in logistic warehouses (PLAUTON) PID2023-151701OB-C21, funded by MCIN/AEI/10.13039/501100011033/FEDER, EU.

Informed Consent Statement

Not applicable.

Data Availability Statement

The raw data supporting the conclusions of this article will be made available by the authors on request.

Conflicts of Interest

The authors declare no conflicts of interest.

References

  1. Ahmed, M.; Mohanta, J.; Sanyal, A. Inspection and identification of transmission line insulator breakdown based on deep learning using aerial images. Electr. Power Syst. Res. 2022, 211, 108199. [Google Scholar] [CrossRef]
  2. Arias Velásquez, R.M. Insulation failure caused by special pollution around industrial environments. Eng. Fail. Anal. 2019, 102, 123–135. [Google Scholar] [CrossRef]
  3. Seman, L.O.; Stefenon, S.F.; Mariani, V.C.; Coelho, L.S. Ensemble learning methods using the Hodrick–Prescott filter for fault forecasting in insulators of the electrical power grids. Int. J. Electr. Power Energy Syst. 2023, 152, 109269. [Google Scholar] [CrossRef]
  4. Aljalaud, F.; Kurdi, H.; Youcef-Toumi, K. Autonomous Multi-UAV Path Planning in Pipe Inspection Missions Based on Booby Behavior. Mathematics 2023, 11, 2092. [Google Scholar] [CrossRef]
  5. Gong, Y.; Zhou, W.; Wang, K.; Wang, J.; Wang, R.; Deng, H.; Liu, G. Defect detection of small cotter pins in electric power transmission system from UAV images using deep learning techniques. Electr. Eng. 2023, 105, 1251–1266. [Google Scholar] [CrossRef]
  6. Yi, J.; Mao, J.; Zhang, H.; Chen, Y.; Liu, T.; Zeng, K.; Xie, H.; Wang, Y. Balancing Accuracy and Efficiency With a Multiscale Uncertainty-Aware Knowledge-Based Network for Transmission Line Inspection. IEEE Trans. Ind. Inform. 2025, 21, 2829–2838. [Google Scholar] [CrossRef]
  7. Labrador Rivas, A.E.; Abrão, T. Faults in smart grid systems: Monitoring, detection and classification. Electr. Power Syst. Res. 2020, 189, 106602. [Google Scholar] [CrossRef]
  8. Preduș, M.F.; Popescu, C.; Răduca, E.; Hațiegan, C. Study of the Accelerated Degradation of the Insulation of Power Cables under the Action of the Acid Environment. Energies 2022, 15, 3550. [Google Scholar] [CrossRef]
  9. You, X.; Zhao, X. A insulator defect detection network based on improved YOLOv7 for UAV aerial images. Measurement 2025, 253, 117410. [Google Scholar] [CrossRef]
  10. Liao, W.; Zhu, R.; Ge, L.; Cao, D.; Yang, Z. Mitigating Class Imbalance Issues in Electricity Theft Detection via a Sample-Weighted Loss. IEEE Trans. Ind. Inform. 2025, 21, 1754–1763. [Google Scholar] [CrossRef]
  11. Li, Y.; Zhu, C.; Zhang, Q.; Zhang, J.; Wang, G. IF-YOLO: An Efficient and Accurate Detection Algorithm for Insulator Faults in Transmission Lines. IEEE Access 2024, 12, 167388–167403. [Google Scholar] [CrossRef]
  12. Zhao, W.; Xu, M.; Cheng, X.; Zhao, Z. An Insulator in Transmission Lines Recognition and Fault Detection Model Based on Improved Faster RCNN. IEEE Trans. Instrum. Meas. 2021, 70, 5016408. [Google Scholar] [CrossRef]
  13. Shuang, F.; Wei, S.; Li, Y.; Gu, X.; Lu, Z. Detail R-CNN: Insulator Detection Based on Detail Feature Enhancement and Metric Learning. IEEE Trans. Instrum. Meas. 2023, 72, 2524414. [Google Scholar] [CrossRef]
  14. Zhou, M.; Wang, J.; Li, B. ARG-Mask RCNN: An Infrared Insulator Fault-Detection Network Based on Improved Mask RCNN. Sensors 2022, 22, 4720. [Google Scholar] [CrossRef] [PubMed]
  15. Liang, H.; Zuo, C.; Wei, W. Detection and Evaluation Method of Transmission Line Defects Based on Deep Learning. IEEE Access 2020, 8, 38448–38458. [Google Scholar] [CrossRef]
  16. Costa, A.; Cortes, C.O. A Convolutional Neural Network for Detecting Faults in Power Distribution Networks along a Railway: A Case Study Using YOLO. Appl. Artif. Intell. 2021, 35, 2067–2086. [Google Scholar] [CrossRef]
  17. Qiu, Z.; Zhu, X.; Liao, C.; Shi, D.; Qu, W. Detection of Transmission Line Insulator Defects Based on an Improved Lightweight YOLOv4 Model. Appl. Sci. 2022, 12, 1207. [Google Scholar] [CrossRef]
  18. Liquan, Z.; Mengjun, Z.; Ying, C.; Yanfei, J. Fast Detection of Defective Insulator Based on Improved YOLOv5s. Comput. Intell. Neurosci. 2022, 2022, 8955292. [Google Scholar] [CrossRef]
  19. Gong, C.; Jiang, W.; Zou, D.; Weng, W.; Li, H. An Insulator Fault Diagnosis Method Based on Multi-Mechanism Optimization YOLOv8. Appl. Sci. 2024, 14, 8770. [Google Scholar] [CrossRef]
  20. Tao, Z.; He, Y.; Lin, S.; Yi, T.; Li, M. SnakeNet: An adaptive network for small object and complex background for insulator surface defect detection. Comput. Electr. Eng. 2024, 117, 109259. [Google Scholar] [CrossRef]
  21. He, M.; Qin, L.; Deng, X.; Liu, K. MFI-YOLO: Multi-Fault Insulator Detection Based on an Improved YOLOv8. IEEE Trans. Power Deliv. 2024, 39, 168–179. [Google Scholar] [CrossRef]
  22. Zhang, L.; Li, B.; Cui, Y.; Lai, Y.; Gao, J. Research on improved YOLOv8 algorithm for insulator defect detection. J. Real-Time Image Process. 2024, 21, 22. [Google Scholar] [CrossRef]
  23. Zhao, J.; Miao, S.; Kang, R.; Cao, L.; Zhang, L.; Ren, Y. Insulator Defect Detection Algorithm Based on Improved YOLOv11n. Sensors 2025, 25, 1327. [Google Scholar] [CrossRef]
  24. Zhou, Y.; Shao, H.; Wang, L.; Waslander, S.L.; Li, H.; Liu, Y. Smartrefine: A scenario-adaptive refinement framework for efficient motion prediction. In Proceedings of the IEEE/CVF Conference on Computer Vision and Pattern Recognition, Seattle, WA, USA, 16–22 June 2024; pp. 15281–15290. [Google Scholar]
  25. Chen, J.; Wang, Y.; Liu, X.; Zhou, G.; Zhou, Z. ARNet: Adaptive Refinement Network Using Context Filter for Motion Forecasting. In Proceedings of the 2024 8th CAA International Conference on Vehicular Control and Intelligence (CVCI), Chongqing, China, 25–27 October 2024; pp. 1–6. [Google Scholar]
  26. Huai, Z.; Ding, X.; Li, Y.; Li, X. Context-aware pseudo-label refinement for source-free domain adaptive fundus image segmentation. In Proceedings of the International Conference on Medical Image Computing and Computer-Assisted Intervention, Vancouver, BC, Canada, 8–12 October 2023; Springer: Cham, Switzerland; pp. 618–628. [Google Scholar]
  27. Tan, X.; Hou, S.; Yang, F.; Li, Z. Transmission Lines Insulator State Detection Method Based on Deep Learning. Appl. Sci. 2025, 15, 526. [Google Scholar] [CrossRef]
  28. Lu, G.; Li, B.; Chen, Y.; Qu, S.; Cheng, T.; Zhou, J. Precision in Aerial Surveillance: Integrating YOLOv8 With PConv and CoT for Accurate Insulator Defect Detection. IEEE Access 2025, 13, 49062–49075. [Google Scholar] [CrossRef]
  29. Panigrahy, S.; Karmakar, S. Real-Time Condition Monitoring of Transmission Line Insulators Using the YOLO Object Detection Model With a UAV. IEEE Trans. Instrum. Meas. 2024, 73, 2514109. [Google Scholar] [CrossRef]
  30. Stefenon, S.F.; Seman, L.O.; Singh, G.; Yow, K.C. Enhanced insulator fault detection using optimized ensemble of deep learning models based on weighted boxes fusion. Int. J. Electr. Power Energy Syst. 2025, 168, 110682. [Google Scholar] [CrossRef]
  31. Lewis, D.; Kulkarni, P. Insulator Defect Detection. 2021. Available online: https://ieee-dataport.org/competitions/insulator-defect-detection (accessed on 8 May 2025).
  32. Stefenon, S.F. Inspection of Electrical Power Distribution Grid. 2023. Available online: https://github.com/SFStefenon/InspectionDataSet (accessed on 8 May 2025).
Figure 1. Workflow of YOLO approach.
Applsci 15 09186 g001
Figure 2. Adaptive context refinement.
Applsci 15 09186 g002
Figure 3. Overall methodology flowchat.
Applsci 15 09186 g003
Figure 4. Insulator image samples: (A) insulator chain with insulators in different conditions; (B) contaminated insulator.
Applsci 15 09186 g004
Figure 5. Precision vs. Recall across YOLO variants. Each point is colored by the final mAP.
Applsci 15 09186 g005
Figure 6. Distribution of recall and mAP@[0.5:0.95] values for all evaluated models before and after refinement. Box plots indicate the median and interquartile ranges, while overlaid points show individual model results, allowing for a visual comparison of performance improvements.
Applsci 15 09186 g006
Table 1. Final YOLO-ACF metrics.
ModelFinal mAPFinal PrecisionFinal Recall
yolo8l0.6731600.7656510.820825
yolo8m0.7177060.8206850.845983
yolo8n0.6341580.7071930.805160
yolo8s0.6907420.8546540.773468
yolo8x0.6812750.8122790.807037
yolov9c0.6917400.8072880.841653
yolov9e0.6719420.7727080.779811
yolov9m0.6951130.8245480.811013
yolov9s0.6967100.7922080.826039
yolov9t0.6069630.7009280.768216
yolov10l0.6648700.7780650.781277
yolov10m0.6693790.8128740.762396
yolov10n0.5564480.6210340.685595
yolov10s0.6622230.7990260.782245
yolov10x0.6663660.7880950.758736
yolo11l0.6667930.7742350.808157
yolo11m0.6829980.7889110.843897
yolo11n0.6076710.7011130.720074
yolo11s0.6860710.8269780.808819
yolo11x0.6377850.7964590.772851
yolo12l0.6493140.7568680.778446
yolo12m0.6462900.7318340.800345
yolo12n0.6105530.7156520.756351
yolo12s0.6753530.7766100.803838
yolo12x0.6146610.7096470.782829
Table 2. Comparison of original vs. refined YOLO-ACF performance.
ModelRecallNew Recall% Gain RecallmAP@[0.5:0.95]New mAP@[0.5:0.95]% Gain mAP@[0.5:0.95]
yolo8l0.8210.93113.3980.6730.7034.433
yolo8m0.8460.93810.9240.7180.7240.835
yolo8n0.8050.89611.2450.6340.6878.364
yolo8s0.7730.93120.3930.6910.7153.454
yolo8x0.8070.93716.1530.6810.7033.130
yolov9c0.8420.93511.0910.6920.7254.736
yolov9e0.7800.92418.5030.6720.7024.533
yolov9m0.8110.93815.7070.6950.7244.213
yolov9s0.8260.93212.7910.6970.7233.702
yolov9t0.7680.88515.1760.6070.67310.929
yolov10l0.7810.88713.5580.6650.74512.097
yolov10m0.7620.88616.1730.6690.7248.100
yolov10n0.6860.7367.3370.5560.68422.887
yolov10s0.7820.87912.3180.6620.73110.356
yolov10x0.7590.88716.8650.6660.7329.880
yolo11l0.8080.93115.1760.6670.7106.435
yolo11m0.8440.94211.6490.6830.7012.592
yolo11n0.7200.88823.3340.6080.6517.163
yolo11s0.8090.94216.4290.6860.6930.966
yolo11x0.7730.91618.5350.6380.7029.990
yolo12l0.7780.90816.6430.6490.6987.513
yolo12m0.8000.91614.4010.6460.7079.347
yolo12n0.7560.90719.9310.6110.6719.900
yolo12s0.8040.91714.1400.6750.7054.449
yolo12x0.7830.89914.9040.6150.68811.964
Disclaimer/Publisher’s Note: The statements, opinions and data contained in all publications are solely those of the individual author(s) and contributor(s) and not of MDPI and/or the editor(s). MDPI and/or the editor(s) disclaim responsibility for any injury to people or property resulting from any ideas, methods, instructions or products referred to in the content.