Article

Assessing Geomorphological Changes and Oil Extraction Impacts in Abandoned Yellow River Estuarine Tidal Flats Using Cloud Coverage in Region of Interest (CCROI) and WDM

1
National Marine Environmental Monitoring Center, Dalian 116023, China
2
State Environmental Protection Key Laboratory of Marine Ecosystem Restoration, Dalian 116023, China
*
Author to whom correspondence should be addressed.
Appl. Sci. 2025, 15(16), 9097; https://doi.org/10.3390/app15169097
Submission received: 7 July 2025 / Revised: 1 August 2025 / Accepted: 14 August 2025 / Published: 18 August 2025
(This article belongs to the Special Issue New Technologies for Observation and Assessment of Coastal Zones)

Abstract

Waterline extraction is a key step in applying the Waterline Detection Method (WDM) to Digital Elevation Model (DEM) generation. Cloud interference remains a major challenge for achieving high-quality extraction of waterlines. This study developed an image filtering method termed “Cloud Coverage in Region of Interest” (CCROI). By integrating the CCROI method with the Otsu algorithm and noise smoothing techniques, this study enabled high-quality batch and automated extraction of waterlines within the Google Earth Engine (GEE) platform. Using the WDM, DEMs were established to evaluate recent geomorphological changes in the estuarine tidal flats of the abandoned Diaokou Course (ETFADC). The results confirm that the erosional trend of the ETFADC has persisted throughout nearly 50 years of natural adjustment. In areas distant from oil extraction zones, erosion dominates the high-tide zone, while accretion prevails in the low-tide zone, indicating a slope-flattening process. However, in areas near the oil extraction zone, tree-shaped embankments have acted to inhibit erosion rather than exacerbate it, with strong accretion even occurring in wave-sheltered areas. By enhancing the quality of the selected images and reducing the waterline false detection rate, the CCROI method demonstrates significant potential for time-series studies of small regions.

1. Introduction

Traditional survey techniques, such as levelling, total station, and Real-Time Kinematic builds on Global Navigation Satellite System (RTK-GNSS), have long been the primary methodologies employed in coastal change studies due to their ability to provide precise topographic elevations [1]. However, field-based measurements require physical presence, which is inherently time-consuming, labor-intensive, and inefficient. Environmental challenges, including periodic flooding, dense vegetation, and muddy terrain further complicate implementation [1]. These operational limitations present significant obstacles for traditional methods in acquiring topographic data from large-scale tidal flats [2]. In addition, long-term changes in terrain require continuous tracking measurements over extended periods and rely on the accumulation of historical measurement data. As a result, traditional measurement methods face challenges in analyzing long-term coastal changes.
Over recent decades, remote sensing technologies have advanced rapidly. The waterline detection method (WDM) [3], inundation frequency–orthometric height model [4], and satellite-derived bathymetry (SDB) [5] are important methods for tidal flat topographic monitoring. Among them, WDM based on multispectral imagery is the most widely used method. By extracting waterlines and assigning water levels to the waterlines, a Digital Elevation Model (DEM) can be generated. WDM has been widely applied in tidal flat geomorphological research [6,7,8,9]. Waterline extraction is a key step of WDM. Conventional approaches for waterline extraction encompass edge detection, threshold-based segmentation, and region-growing algorithms. While contemporary alternatives encompass deep learning and supervised classification [10,11]. The Otsu algorithm is a nonparametric, automatic method for determining the optimal threshold for binary image classification [12] and performs well in waterline extraction [13,14,15].
Clouds significantly affect waterline extraction. Effective processing of cloud-covered images remains a key challenge in realizing high-quality extraction of waterlines. Therefore, filtering out high-quality images is a top priority. Conventional cloud filtering typically employs whole-image cloud coverage thresholds [9] (e.g., <20%). However, if the region of interest (ROI) is a sub-region of the whole image, conventional cloud filtering methods may exclude images with high cloud coverage in the whole image but low in the ROI, while retaining those with low coverage in the whole image but high in the ROI. Therefore, more effective image screening methods are needed in the study of regions smaller than the whole image.
Traditional waterline extraction frameworks, which rely on localized image processing, struggle to support high-workload coast evolution analyses. Google Earth Engine (GEE), a cloud-based remote sensing platform, integrates massive satellite imagery (e.g., Landsat, Sentinel) and distributed computing capabilities, offering an efficient solution for large-scale, long-term topographic inversion. GEE has been used to identify the boundary between water and land [15,16], and to reconstruct intertidal zone topography using the tidal flat exposure frequency [17,18] or waterline method [19].
In this study, an image collection filtering method termed “Cloud Coverage in Region of Interest” (CCROI) was developed. By combining this method with the Otsu algorithm and noise smoothing techniques, we achieved high-quality batch and automatic extraction of waterlines in Google Earth Engine (GEE). Using WDM method, the Digital Elevation Models (DEMs) were established to evaluate the recent geomorphological changes of the ETFADC. The primary objective of this study is to enhance the quality and automation of waterline extraction through CCROI method, which is demonstrated and validated using a case study in the Yellow River Delta. The findings are expected to provide a scientific basis for the protection of coast and sustainable coastal zone development in the Yellow River Delta.

2. Materials and Methods

2.1. Study Area

The Yellow River Delta (Figure 1), located at the estuary of the Yellow River in China (37°35′ N–38°12′ N, 118°33′ E–119°20′ E), is one of the most representative young wetland ecosystems in the world. It has a warm temperate continental monsoon climate with an annual average temperature of 12–13 °C and annual precipitation of 550–600 mm (concentrated from July to September). Wind waves dominate the study area. During the summer half-year, it is mainly influenced by southeast winds, with common wave directions of NE and SE, with frequencies of 16.6% and 15.6%, respectively, and small wave heights. During the winter half-year, it is mainly influenced by northwest winds, with common wave directions of NE and NW, with frequencies of 33.1% and 13.0%, respectively, and high wave heights [20].
As one of the most sediment-laden rivers in the world, the Yellow River has shaped vast alluvial plains and deltas in eastern China. Since 1855, the estuary of the Yellow River has shifted from the South Yellow Sea to the Bohai Sea [21,22]. In 1976, the main channel of the Yellow River was artificially diverted from the Diaokou Course to the Qingshuigou Course. Following the abrupt termination of water-sediment supply through the Diaokou Course, the estuarine tidal flats transitioned from rapid progradation to intense retrogradation [23,24,25]. The rate of coastline regression in the estuary of the abandoned Diaokou Course (EADC) peaked at 764.6 m/a during 1976–1981, subsequently decreasing to 13.7–17.7 m/a during 2006–2016 [26].
Having undergone nearly five decades of natural evolution since the diversion, the EADC may have reached sedimentary equilibrium, and the erosion trend may have changed. However, a systematic assessment of the recent sediment dynamics of the abandoned estuary remains conspicuously absent. In addition, tidal flats are widely developed in the Yellow River Delta, which is suitable for experimental research on automatic waterline extraction and terrain reconstruction.

2.2. Materials

2.2.1. Satellite Images

Sentinel 2 imagery from the European Space Agency (ESA) is suitable for constructing tidal flat DEMs due to its 10m spatial resolution (applicable to B2, B3, B4, and B8 bands), 5-day revisit cycle, and free access. The Sentinel 2 Level-1C orthorectified Top-of-Atmosphere Reflectance Dataset was accessed via GEE. The number of Sentinel 2 images used in this study is shown in Table 1.

2.2.2. Tidal Level

A tidal level measurement station was established in the central part of the study area (Figure 1). Tidal level measurements were conducted from June to September 2024. The tidal level data were adjusted to the 1985 National Elevation Datum. The tidal level observations of multiple stations would be beneficial to improve the accuracy of this study, but the location of the measurement stations in the study area is limited, and only one tide gauge is suitable for setting up.

2.2.3. Profile Elevation

The elevation of a tidal flat profile (Figure 1) located in the middle of the study area was measured in June 2024. The elevation data were adjusted to the 1985 National Elevation Datum. Tidal flat profile elevation data were subsequently used for verifying the accuracy of the model.

2.3. Methods

2.3.1. Waterline Detection Method (WDM)

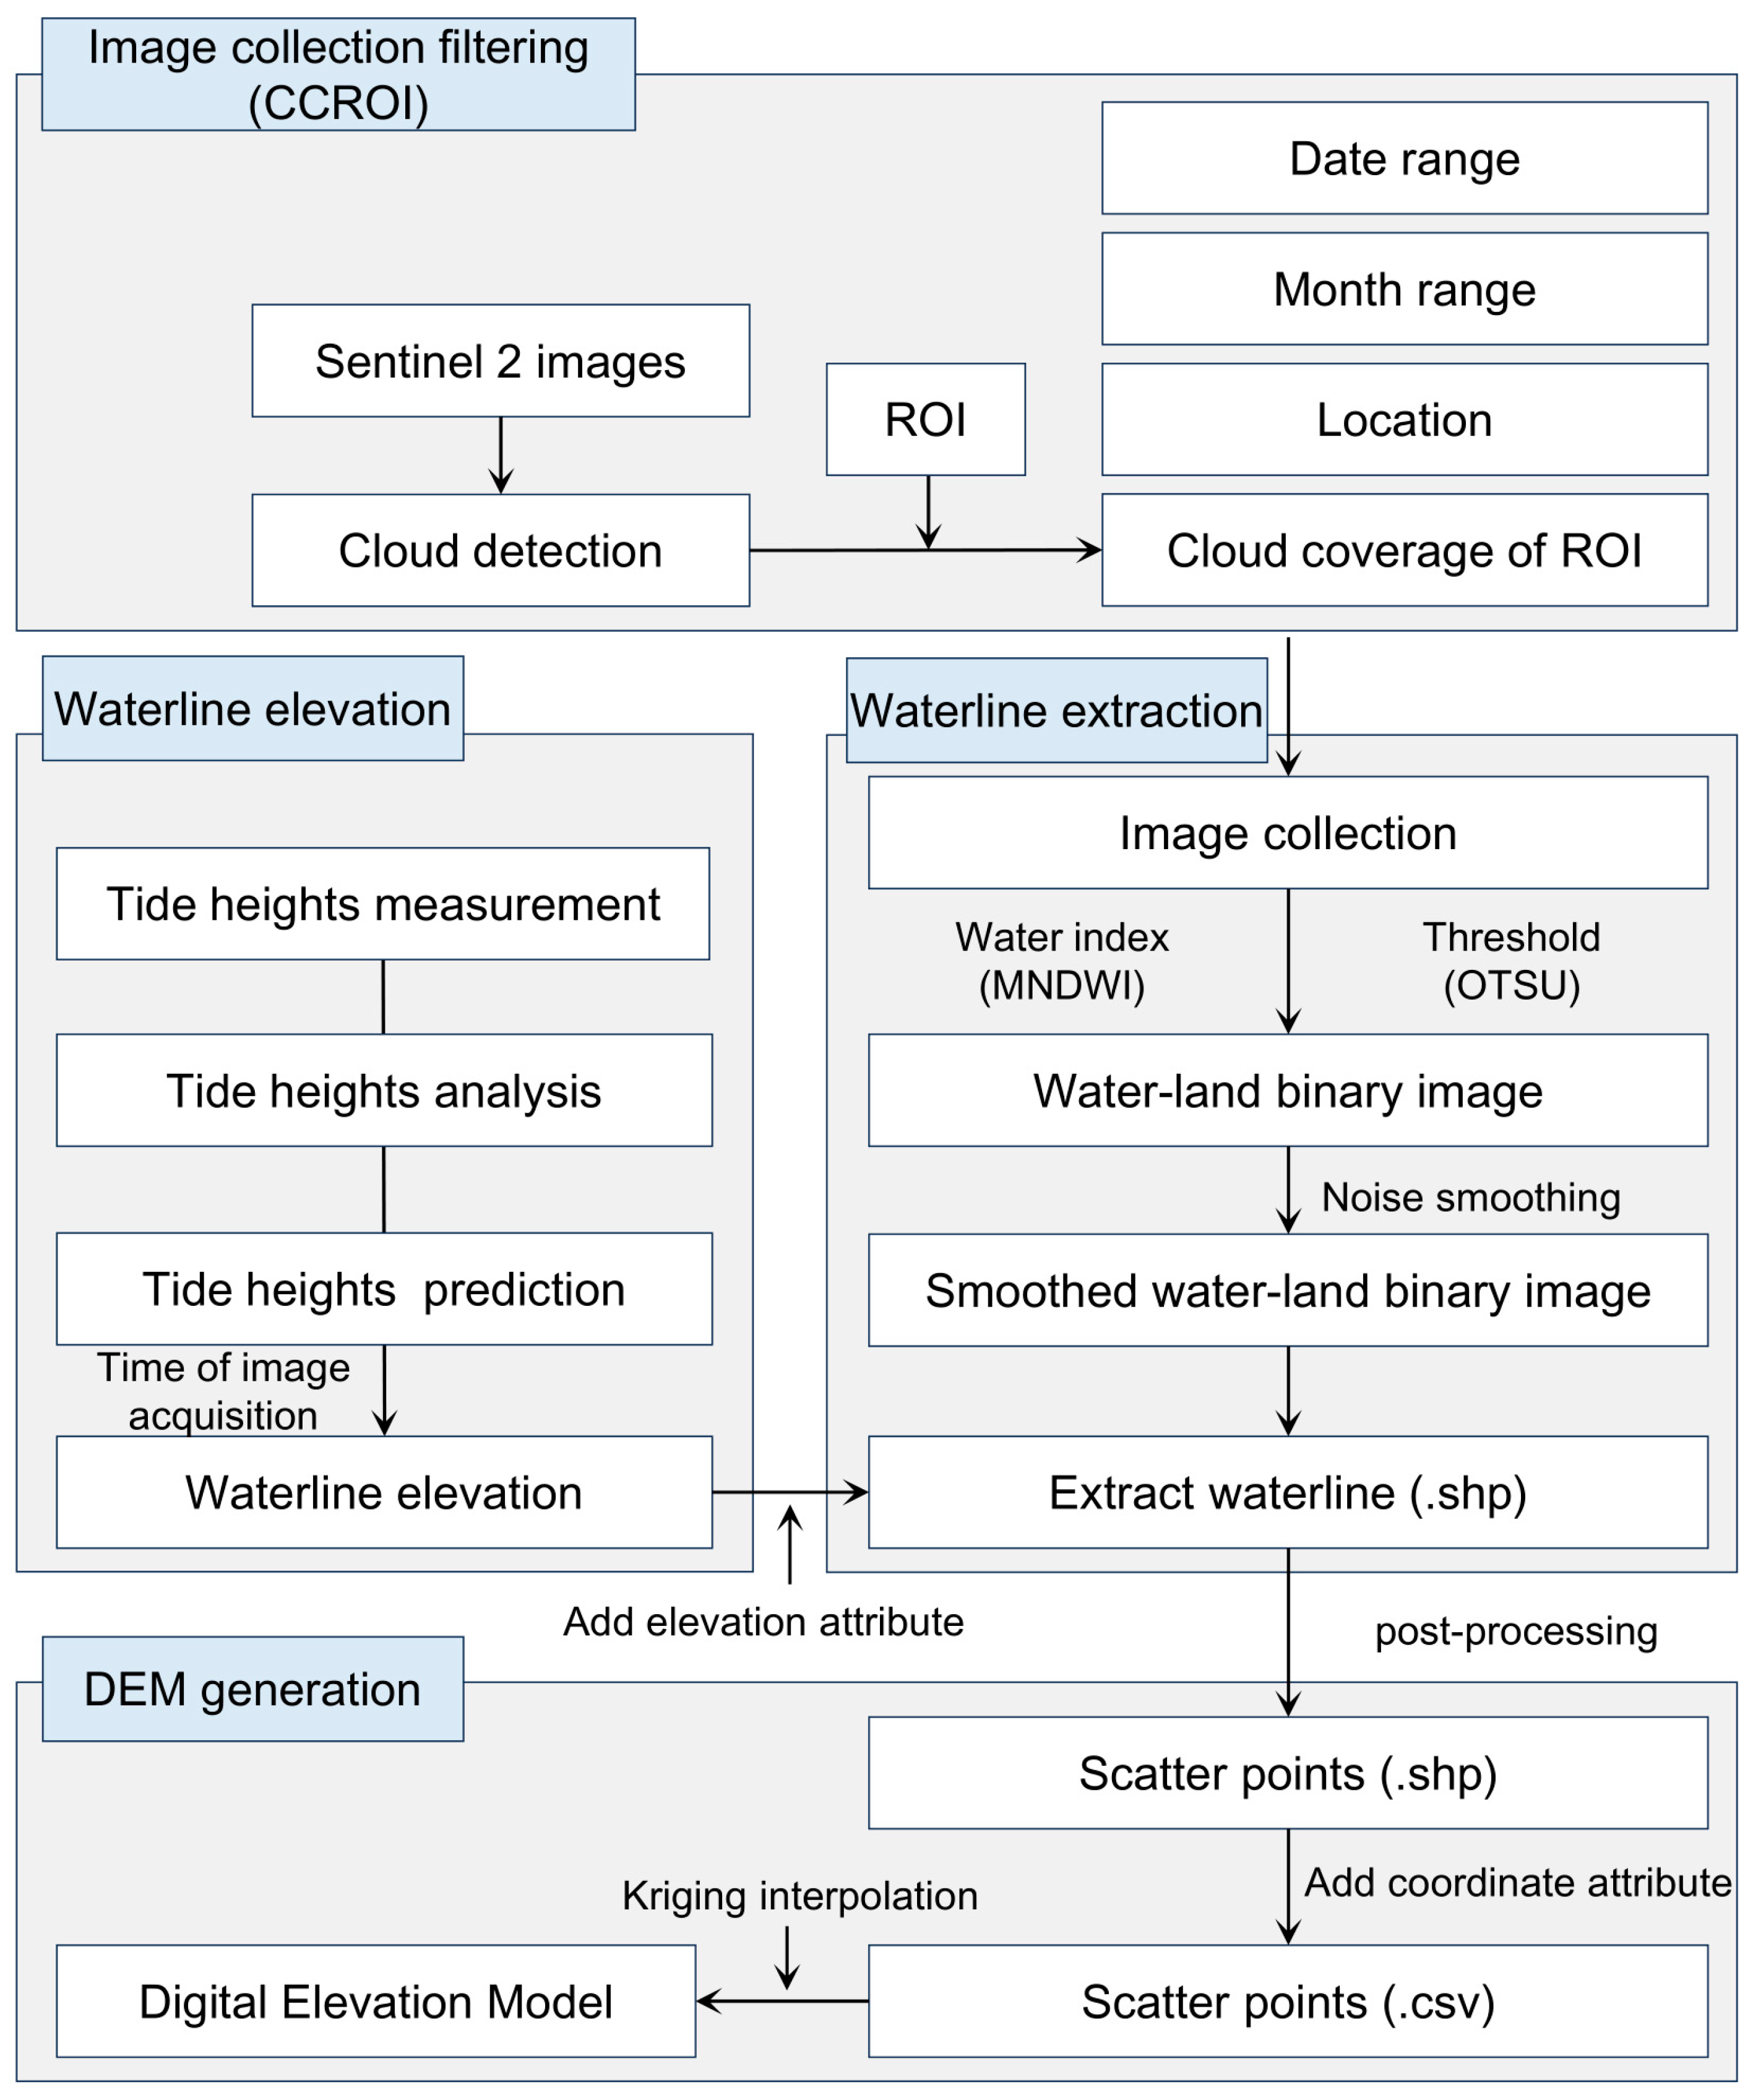
The WDM based on multispectral imagery has been widely applied to map intertidal zone topography [6,7,8,9]. The main steps are as follows: (1) filtering images to form an image collection; (2) detecting the boundary line (i.e., waterline) between submerged and exposed intertidal zone in images; (3) assigning an elevation (i.e., tidal level during image acquisition) to each waterline; (4) interpolating a series of waterlines with elevation to generate a DEM. Tidal levels can be obtained from local tide gauges [6,27], ocean tide models [2], or numerical simulations [28,29]. Figure 2 shows the technical process of this study.

2.3.2. Waterline Extraction Platform

The waterline extraction workflow was implemented using the GEE Code Editor (JavaScript). It offers rich APIs and library functions that enable users to develop custom algorithms and scripts, whereas its built-in visualization tools allow interactive map-based presentation of analytical results.

2.3.3. Image Collection Filtering with CCROI

The more images used, the more precise the DEM will be. The satellite revisit cycle is fixed, meaning that the number of images captured within a fixed period is also fixed. The simplest way to increase the number of images is to extend the time span. However, an overly long date span would reduce the sensitivity and timeliness.
Sea ice can cover tidal flats, thereby reducing the accuracy of waterline extraction. The study area is influenced by sea ice in winter, so images from December, January, and February were excluded.
Cloud cover negatively impacts the quality of optical remote sensing imagery and compromises the accuracy of waterline extraction. A new image collection filtering method called “Cloud Coverage in Region of Interest” (CCROI) was implemented comprising three phases: (1) cloud detection to generate binary cloud mask; (2) quantification of ROI cloud coverage; (3) applying ROI cloud coverage as a threshold filtering parameter. The CCROI method retains images with high cloud coverage in the whole image but low in the ROI, while excluding images with low cloud coverage in the whole image but high in the ROI. Finally, images with ROI cloud coverage of < 2% were selected. Any small area of the cloud was removed manually in the post-processing quality control. If cloud covers the coast too much in an individual image, the whole image is excluded.
Cloud mask was produced using a simple cloud scoring method that combines brightness and NDSI. Cloud mask can also use the Fmask algorithm [30], the Cloud Score+ [31] dataset, or the Cloud Probability (based on the s2cloudless algorithm [32]) dataset provided by GEE. However, these products of latest methods are still in production, and were not used in this study.
A GEE function implementing the CCROI method was developed, accepting eight input parameters: ROI, position point, start date, end date, start month, end month, whole-image cloud coverage, and ROI cloud coverage, with the output being an image collection. To use CCROI, the parameter “ROI cloud coverage” should be specified as a number between 0 and 100 (which can be a decimal). In order to quickly switch between normal filtering and CCROI filtering, we added a condition to the CCROI function. Setting the parameter “ROI cloud coverage” to a negative value can disable the CCROI method. CCROI can be called very easily with few lines of code:
var S2 = require(“users/yourFunctionPath:/Sentinel2”);
var dataset = S2.S2TOA(start date, end date, start month, end month, position point, ROI, whole-image cloud coverage, ROI cloud coverage);
An example to filter out image collections acquired between March and November 2024, encompassing the position point, with cloud coverage less than 2% within the ROI, is as follows:
var dataset = S2.S2TOA(‘2024-01-01’, ‘2024-12-31’, 3, 11, position point, ROI, 100, 2);
CCROI filtering can be switched to normal filtering like:
var dataset = S2.S2TOA(‘2024-01-01’, ‘2024-12-31’, 3, 11, position point, ROI, 20, −1);

2.3.4. Water–Land Binary Image

The Modified Normalized Difference Water Index (MNDWI) is used to distinguish water from non-water areas owing to its high sensitivity and accuracy [33]. This method has good recognition effects in water bodies with high suspended sediment concentration [34,35] and is suitable for the Yellow River Estuary. The formula for calculating the index is as follows:
MNDWI = (RGreen − RSWIR1)/(RGreen + RSWIR1),
where, RGreen and RSWIR1 represent the remote sensing reflectance of the B3 and B11 bands of Sentinel 2, respectively.
Determining the threshold is a key step in shoreline extraction. To minimize human intervention and enhance automation, the Otsu algorithm [12] was employed to automatically calculate the optimal threshold. The MNDWI index, combined with the Otsu method’s capability for automatic threshold selection, demonstrates high accuracy and robustness in waterline extraction under complex scenarios [13,14].

2.3.5. Noise Smoothing of Binary Image

After applying the threshold value to the MNDWI diagram, a land–water binary image was obtained. In general, there were fragments in the binary image. Because of small clouds, small water bodies on land, and ships in the sea, these will affect the position of the water edge line and the accuracy of the elevation model. A noise smoothing operation was implemented via the “focal_mode” function and “connectedpixelcount” algorithm in GEE, which has been successfully applied to smooth small patches [36,37]. A sliding window is used to calculate the mode to smooth the image, and then the patch with less than 100 pixels is replaced by the smoothed type.

2.3.6. Waterline Extraction

In the GEE Code Editor platform, the built-in function “reduceToVectors” was used to export the waterline as a Shapefile (.shp), with an attribute table containing a field for the image acquisition time. It should be noted that the GEE platform currently supports only the export of vector polygon data. What is commonly referred to as a “waterline” is not extracted as a linear feature in GEE, but rather as a polygon area formed by the boundaries of the water body and the outer boundaries of the study area. In the subsequent processing, the original boundaries of the study area were clipped and removed.

2.3.7. Waterline Elevation

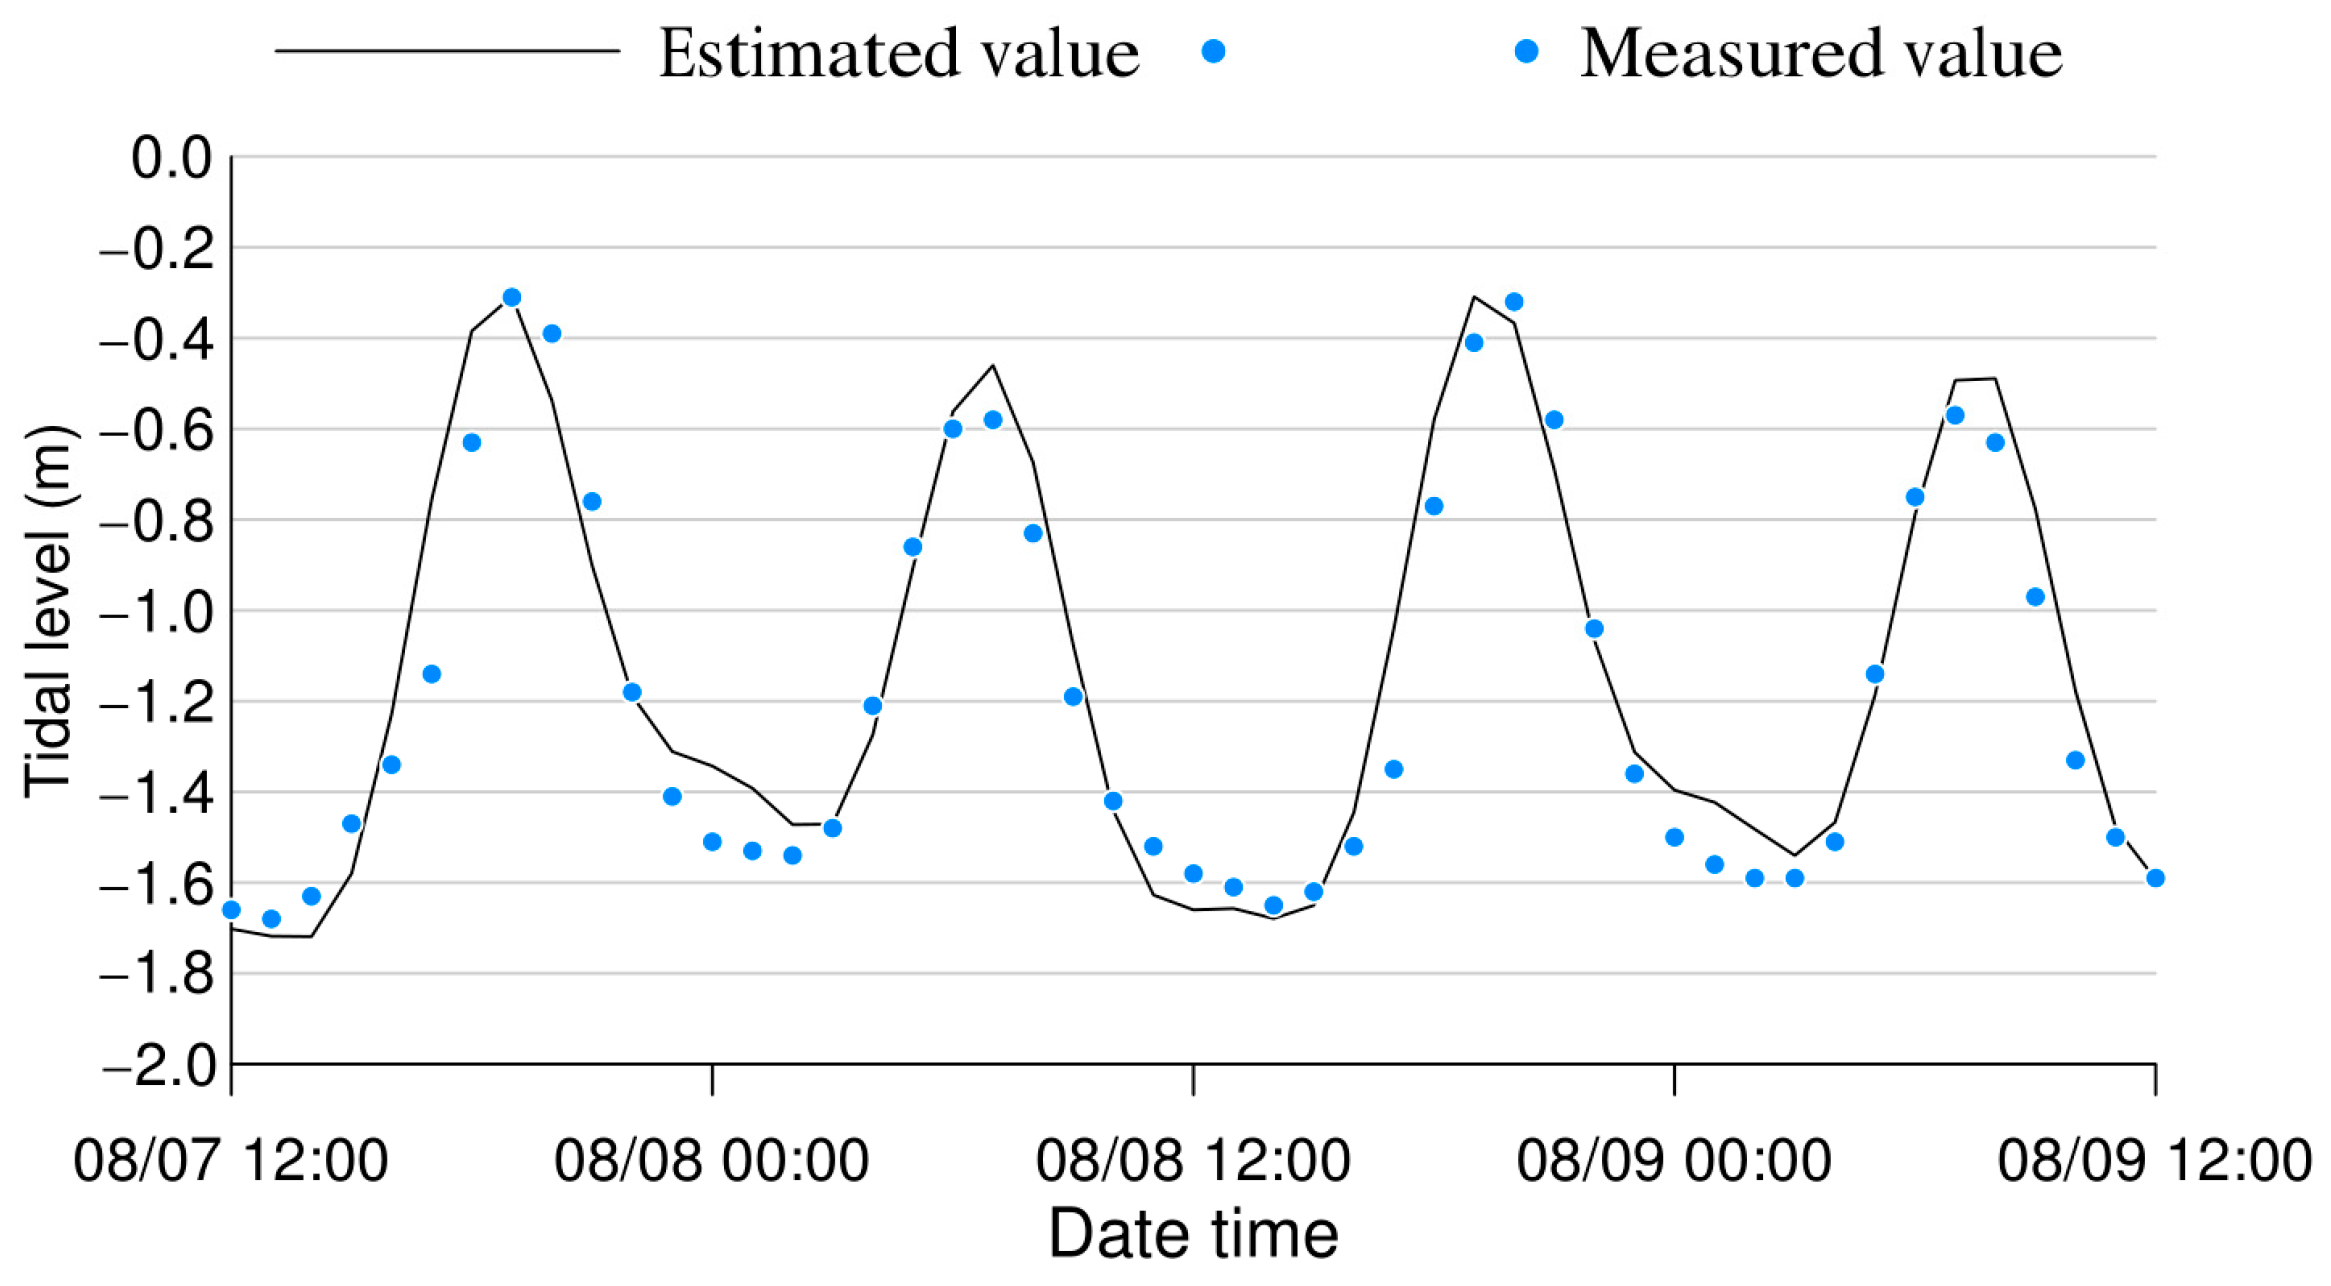
Using the “Tide Analysis of Heights” tool in the Mike 21 (DHI, Hørsholm, Denmark) toolbox, an astronomical tidal harmonic analysis was conducted on the measured tidal levels to calculate the amplitudes and phases of the principal tidal constituents (O1, K1, M2, S2, M4, MS4, and Z0). Based on tidal constants, the “Tide Prediction of Heights” tool was used to estimate the tidal levels at the time of remote sensing image acquisition. To validate the accuracy, the measured tidal levels from continuous observations (Figure 1) on 7–9 August 2024 were compared with the estimated values (Figure 3). The validation results showed that the coefficient of determination (R2) was 0.94, and the mean absolute error (MAE) was 0.04 m, indicating that the model can effectively reproduce the actual tidal level fluctuations.

2.3.8. Waterline Post-Processing and DEM Generation

The post-processing of the waterline vectors was conducted in ArcGIS (Esri, Redlands, CA, USA), with the following main steps: (1) adding elevation attributes to the waterline vectors, assigning elevation values as estimated tidal levels; (2) using the “Feature Vertices to Points” tool from the ArcGIS toolbox to convert the waterline into scatter points with elevation; (3) inspecting and modifying the data to avoid interference from cloud boundary points; (4) clipping the data to remove study area boundary points; (5) adding longitude and latitude field to the remaining scatter points; (6) exporting the scatter points as a table (.csv) containing coordinates and elevation.
The scattered points are interpolated by the Kriging method to generate the DEM. DEM generation and visualization were performed using the Surfer 29 (Golden Software LLC, Golden, CO, USA) software.

3. Results

3.1. Digital Elevation Model Products

Digital Elevation Models (DEMs) of the ETFADC for 2024 (Figure 4A) and 2018 (Figure 4B) were generated using Sentinel 2 imagery (Table 1). The trend observed in the models, where the elevation gradually decreases from the shore to the sea (Figure 4), aligns with general coastal patterns.

3.2. Accuracy Verification of DEM

The accuracy of the contemporaneous DEM was validated using the elevation data from 205 points on a tidal flat profile (Figure 1) measured in 2024. The following error metrics were used to assess the precision: Root Mean Square Error (RMSE), Maximum Absolute Error (MAXE), Relative Error (RE), and Coefficient of Determination (R2).
RE indicates the difference between the model-estimated elevation and the measured elevation, with negative (positive) RE values indicating that the model-estimated elevation is lower (higher). RE ranges from −0.35 m to 0.38 m (Figure 5). Other error metrics include an RMSE of 0.19 m, MAXE of 0.38 m, and R2 = 0.83.

3.3. Recent Changes of the ETFADC

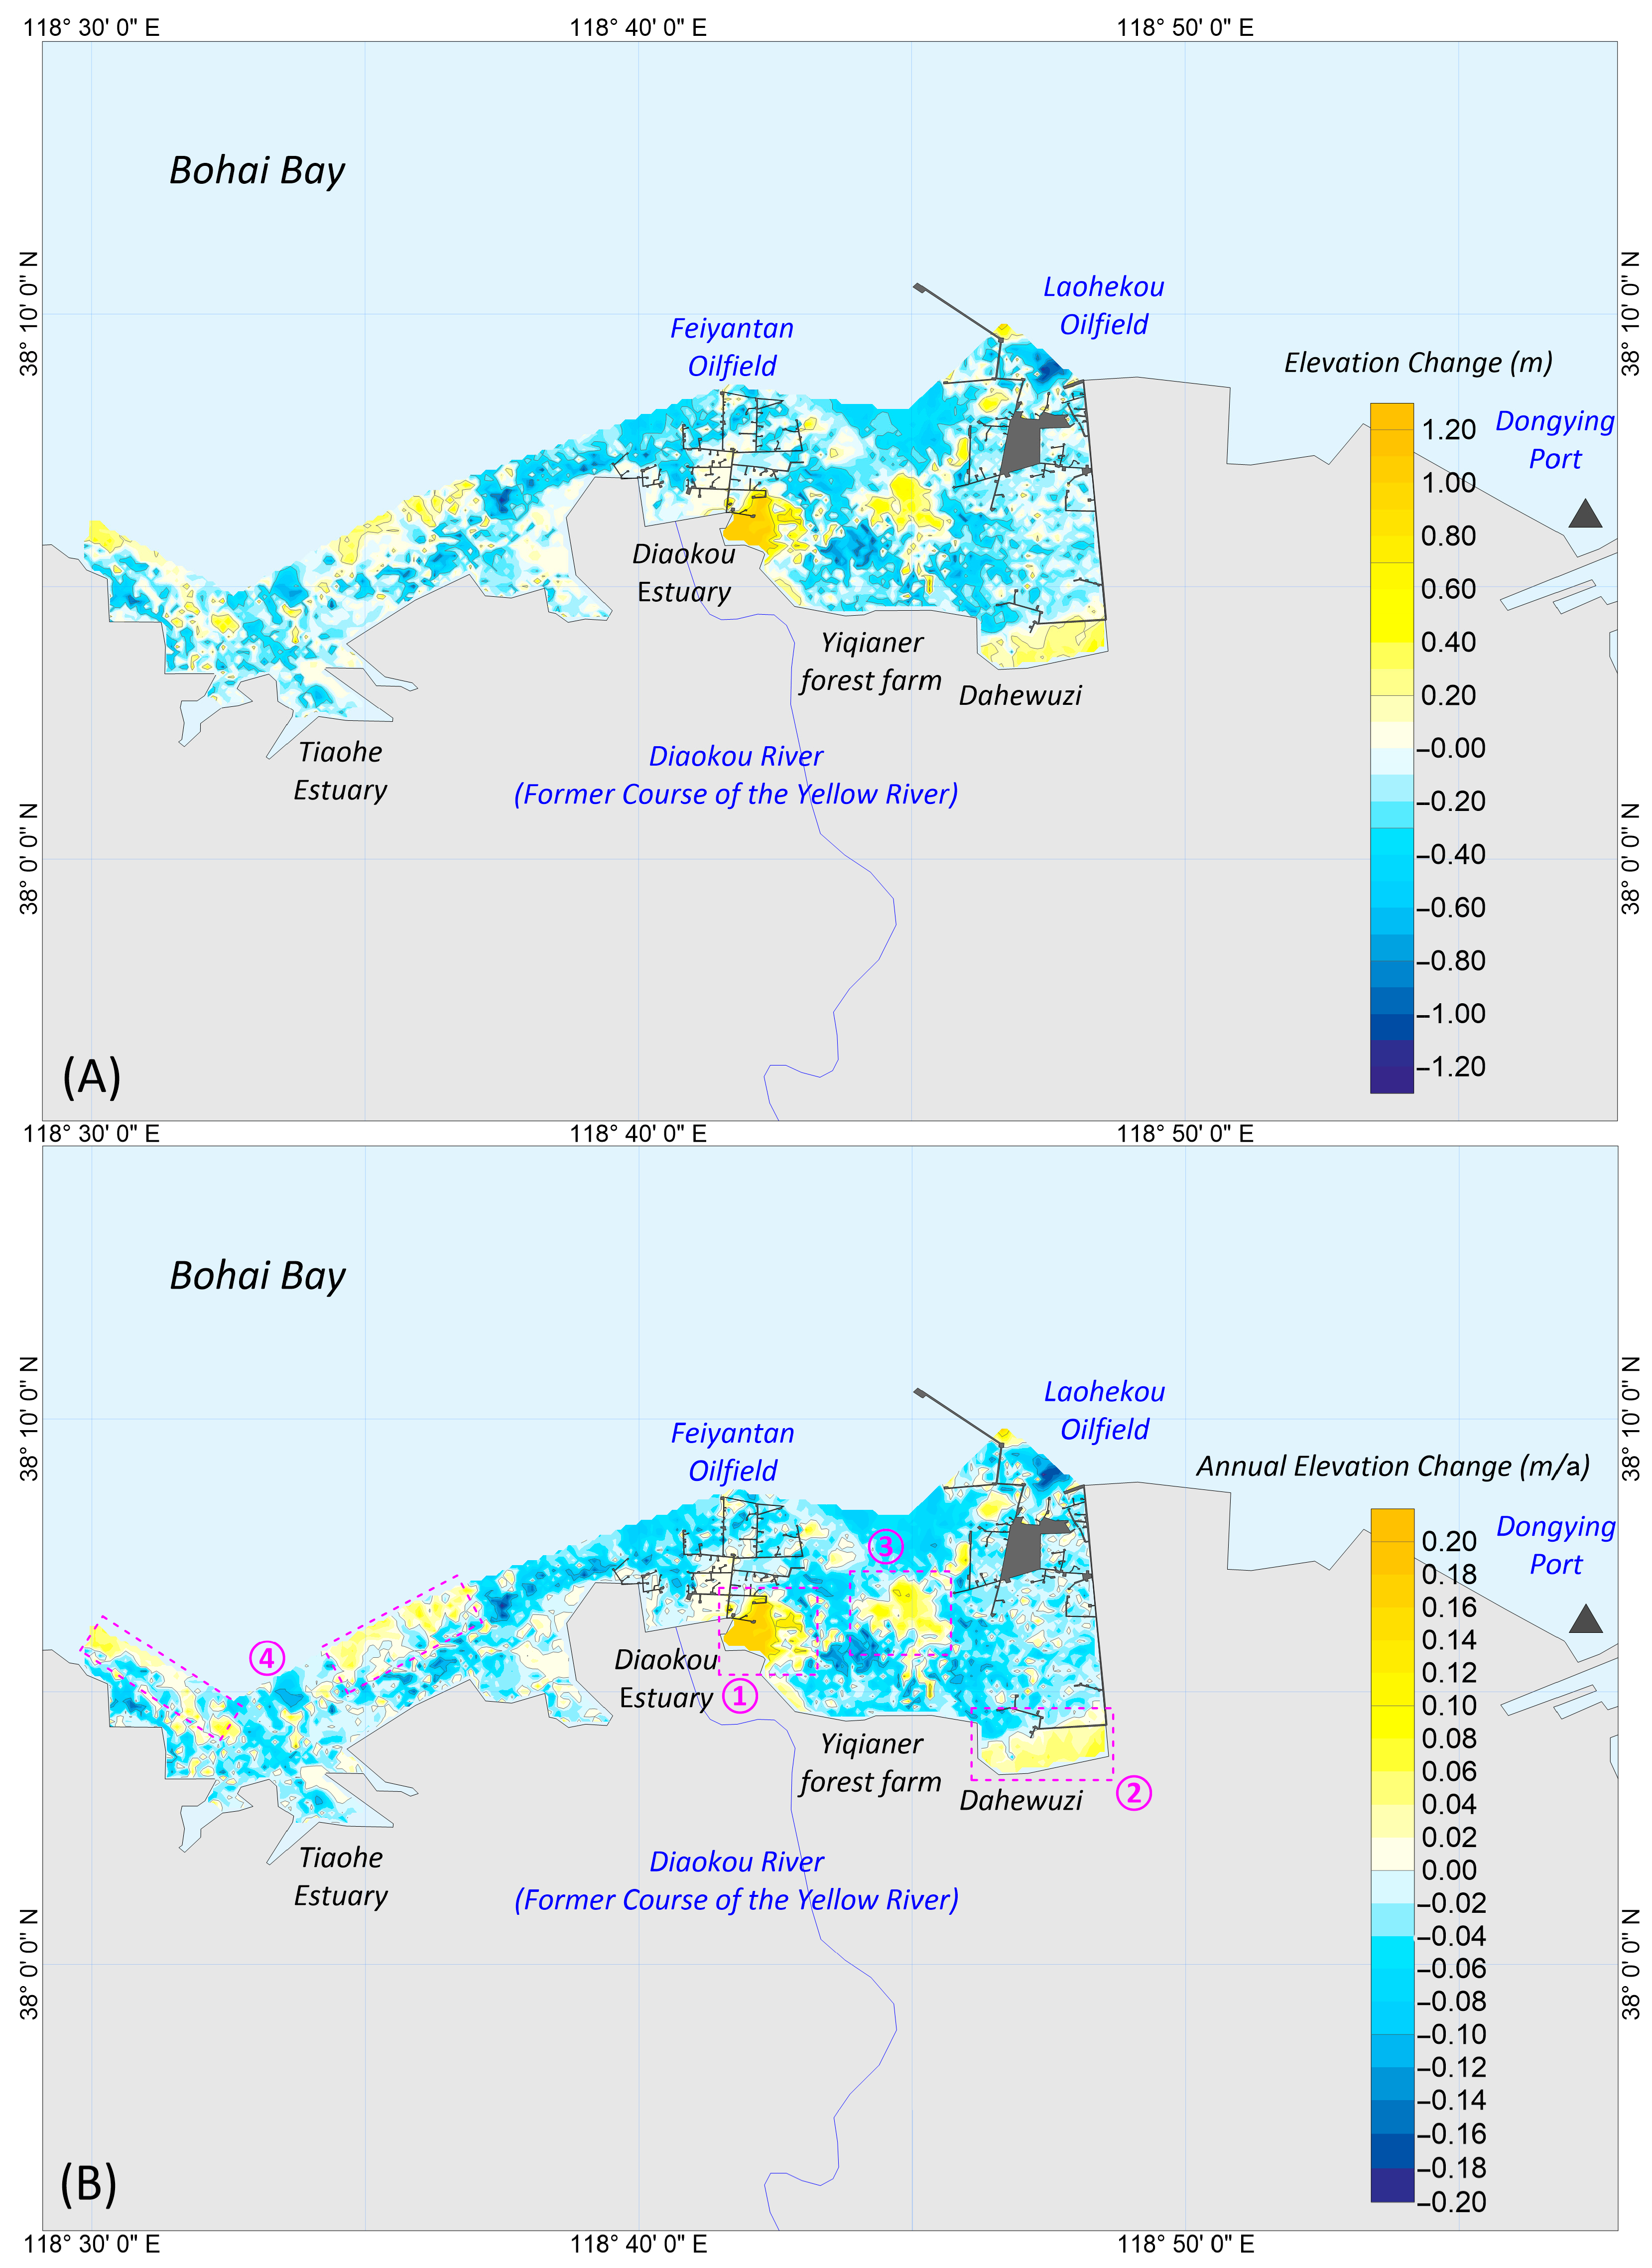
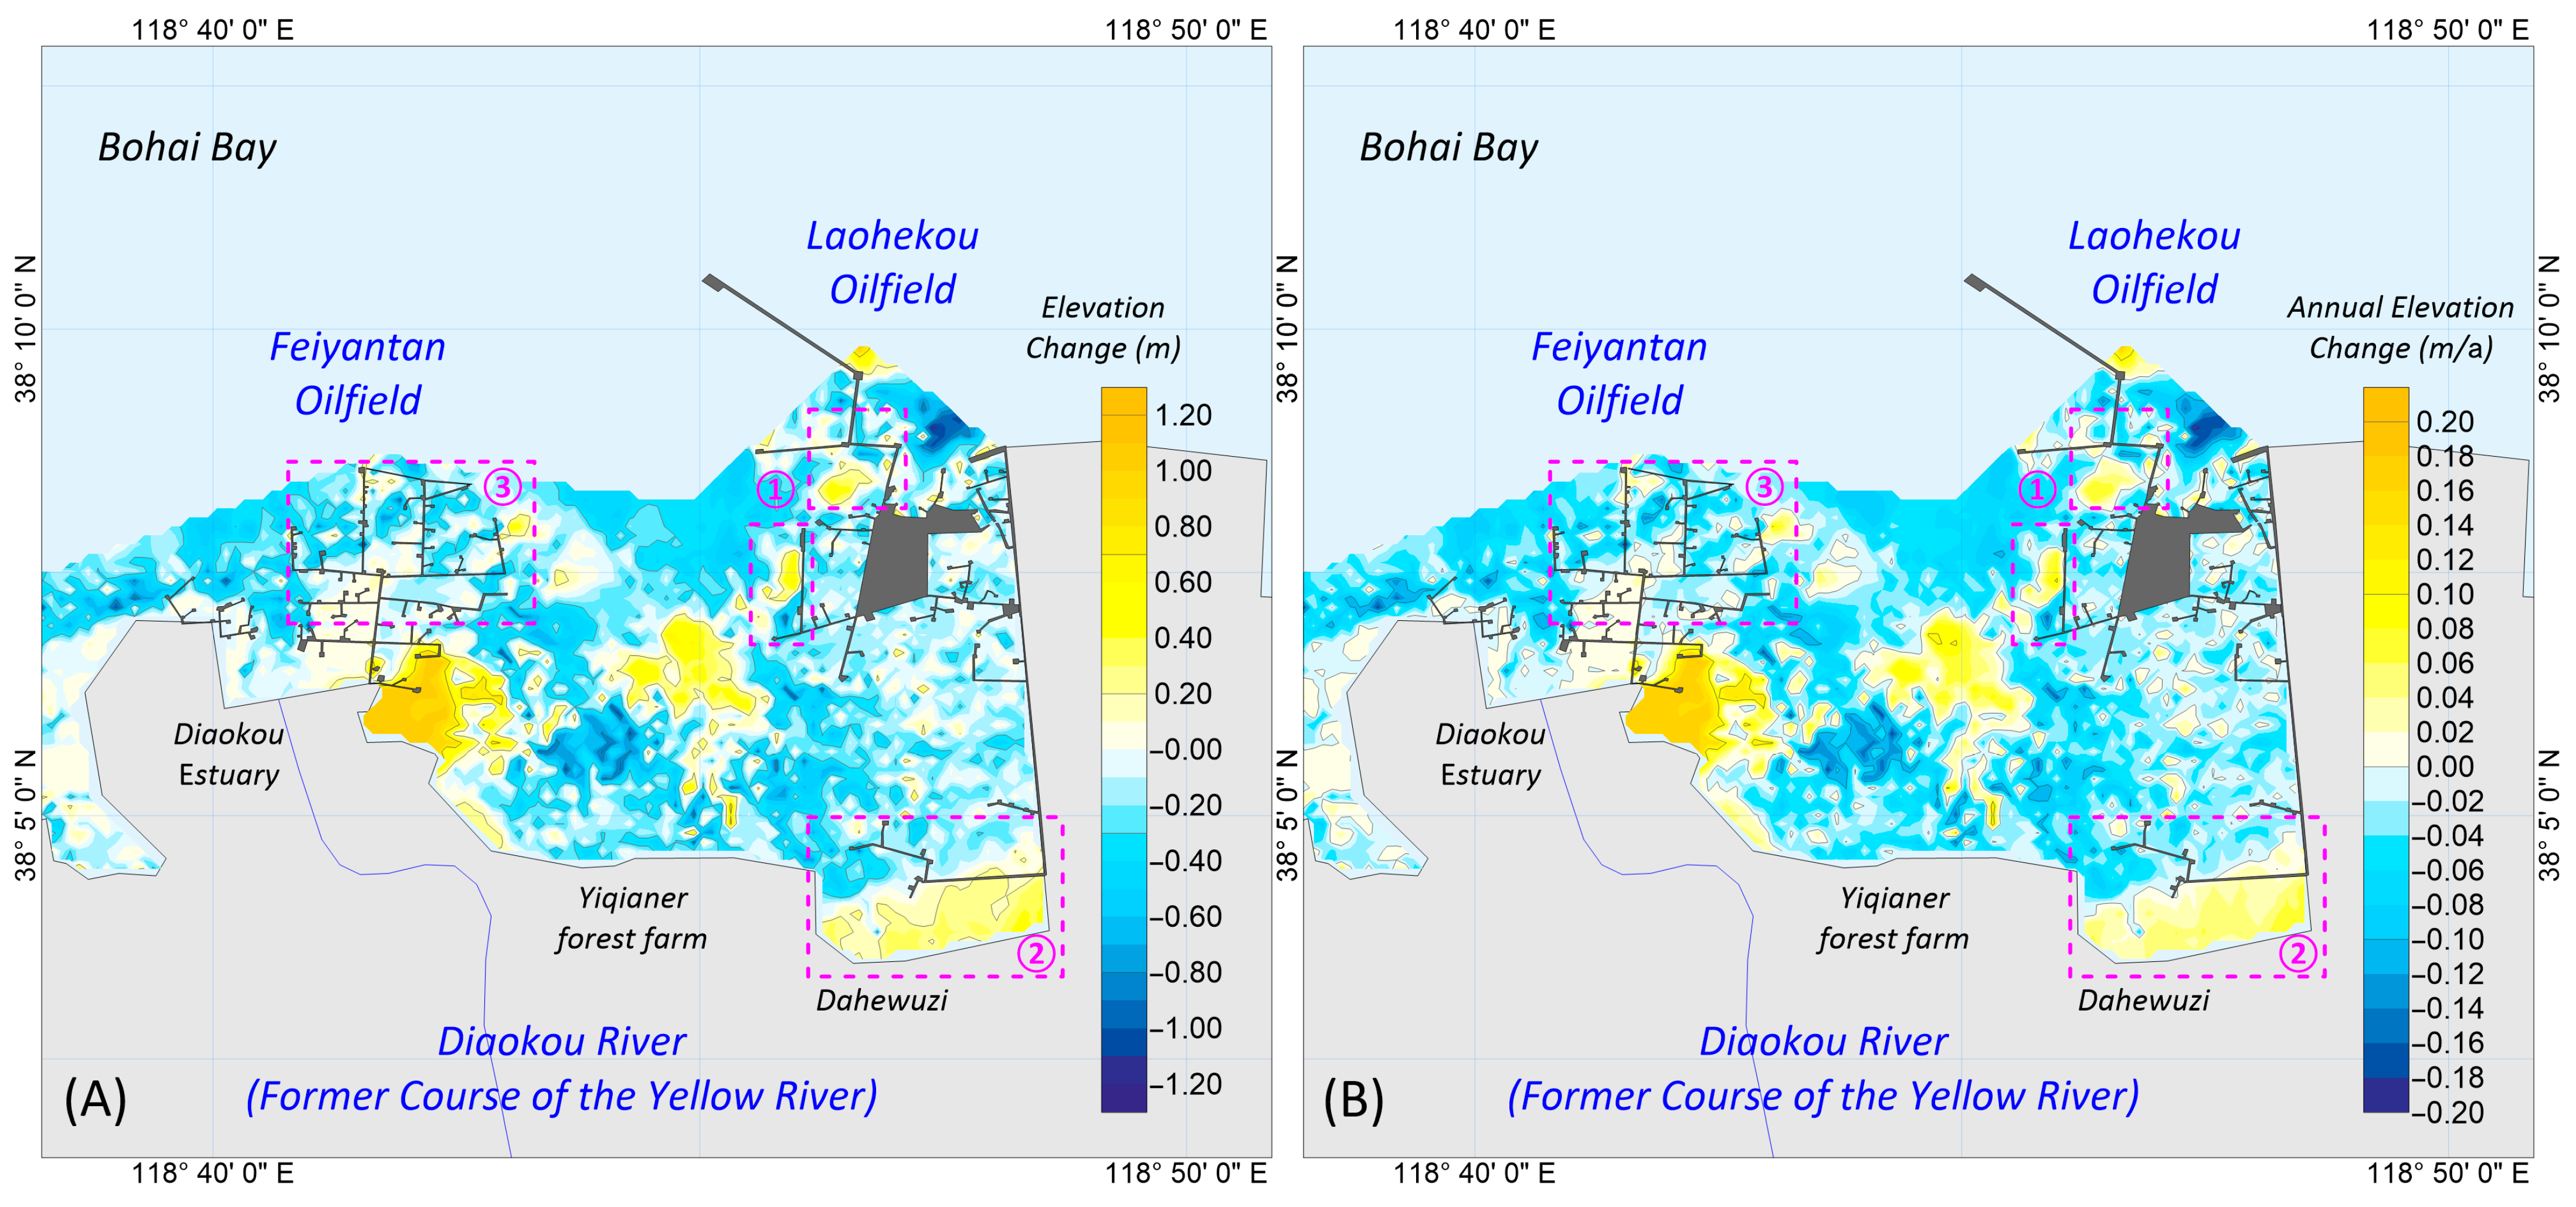
The amount (elevation change, Figure 6A) and intensity (annual elevation change, Figure 6B) of accretion/erosion of the ETFADC were quantitatively evaluated according to the DEM changes from 2018 to 2024. Positive values indicate accretion, while negative values indicate erosion.

4. Discussion

4.1. Filtration Effects and Application Prospects of the CCROI Method

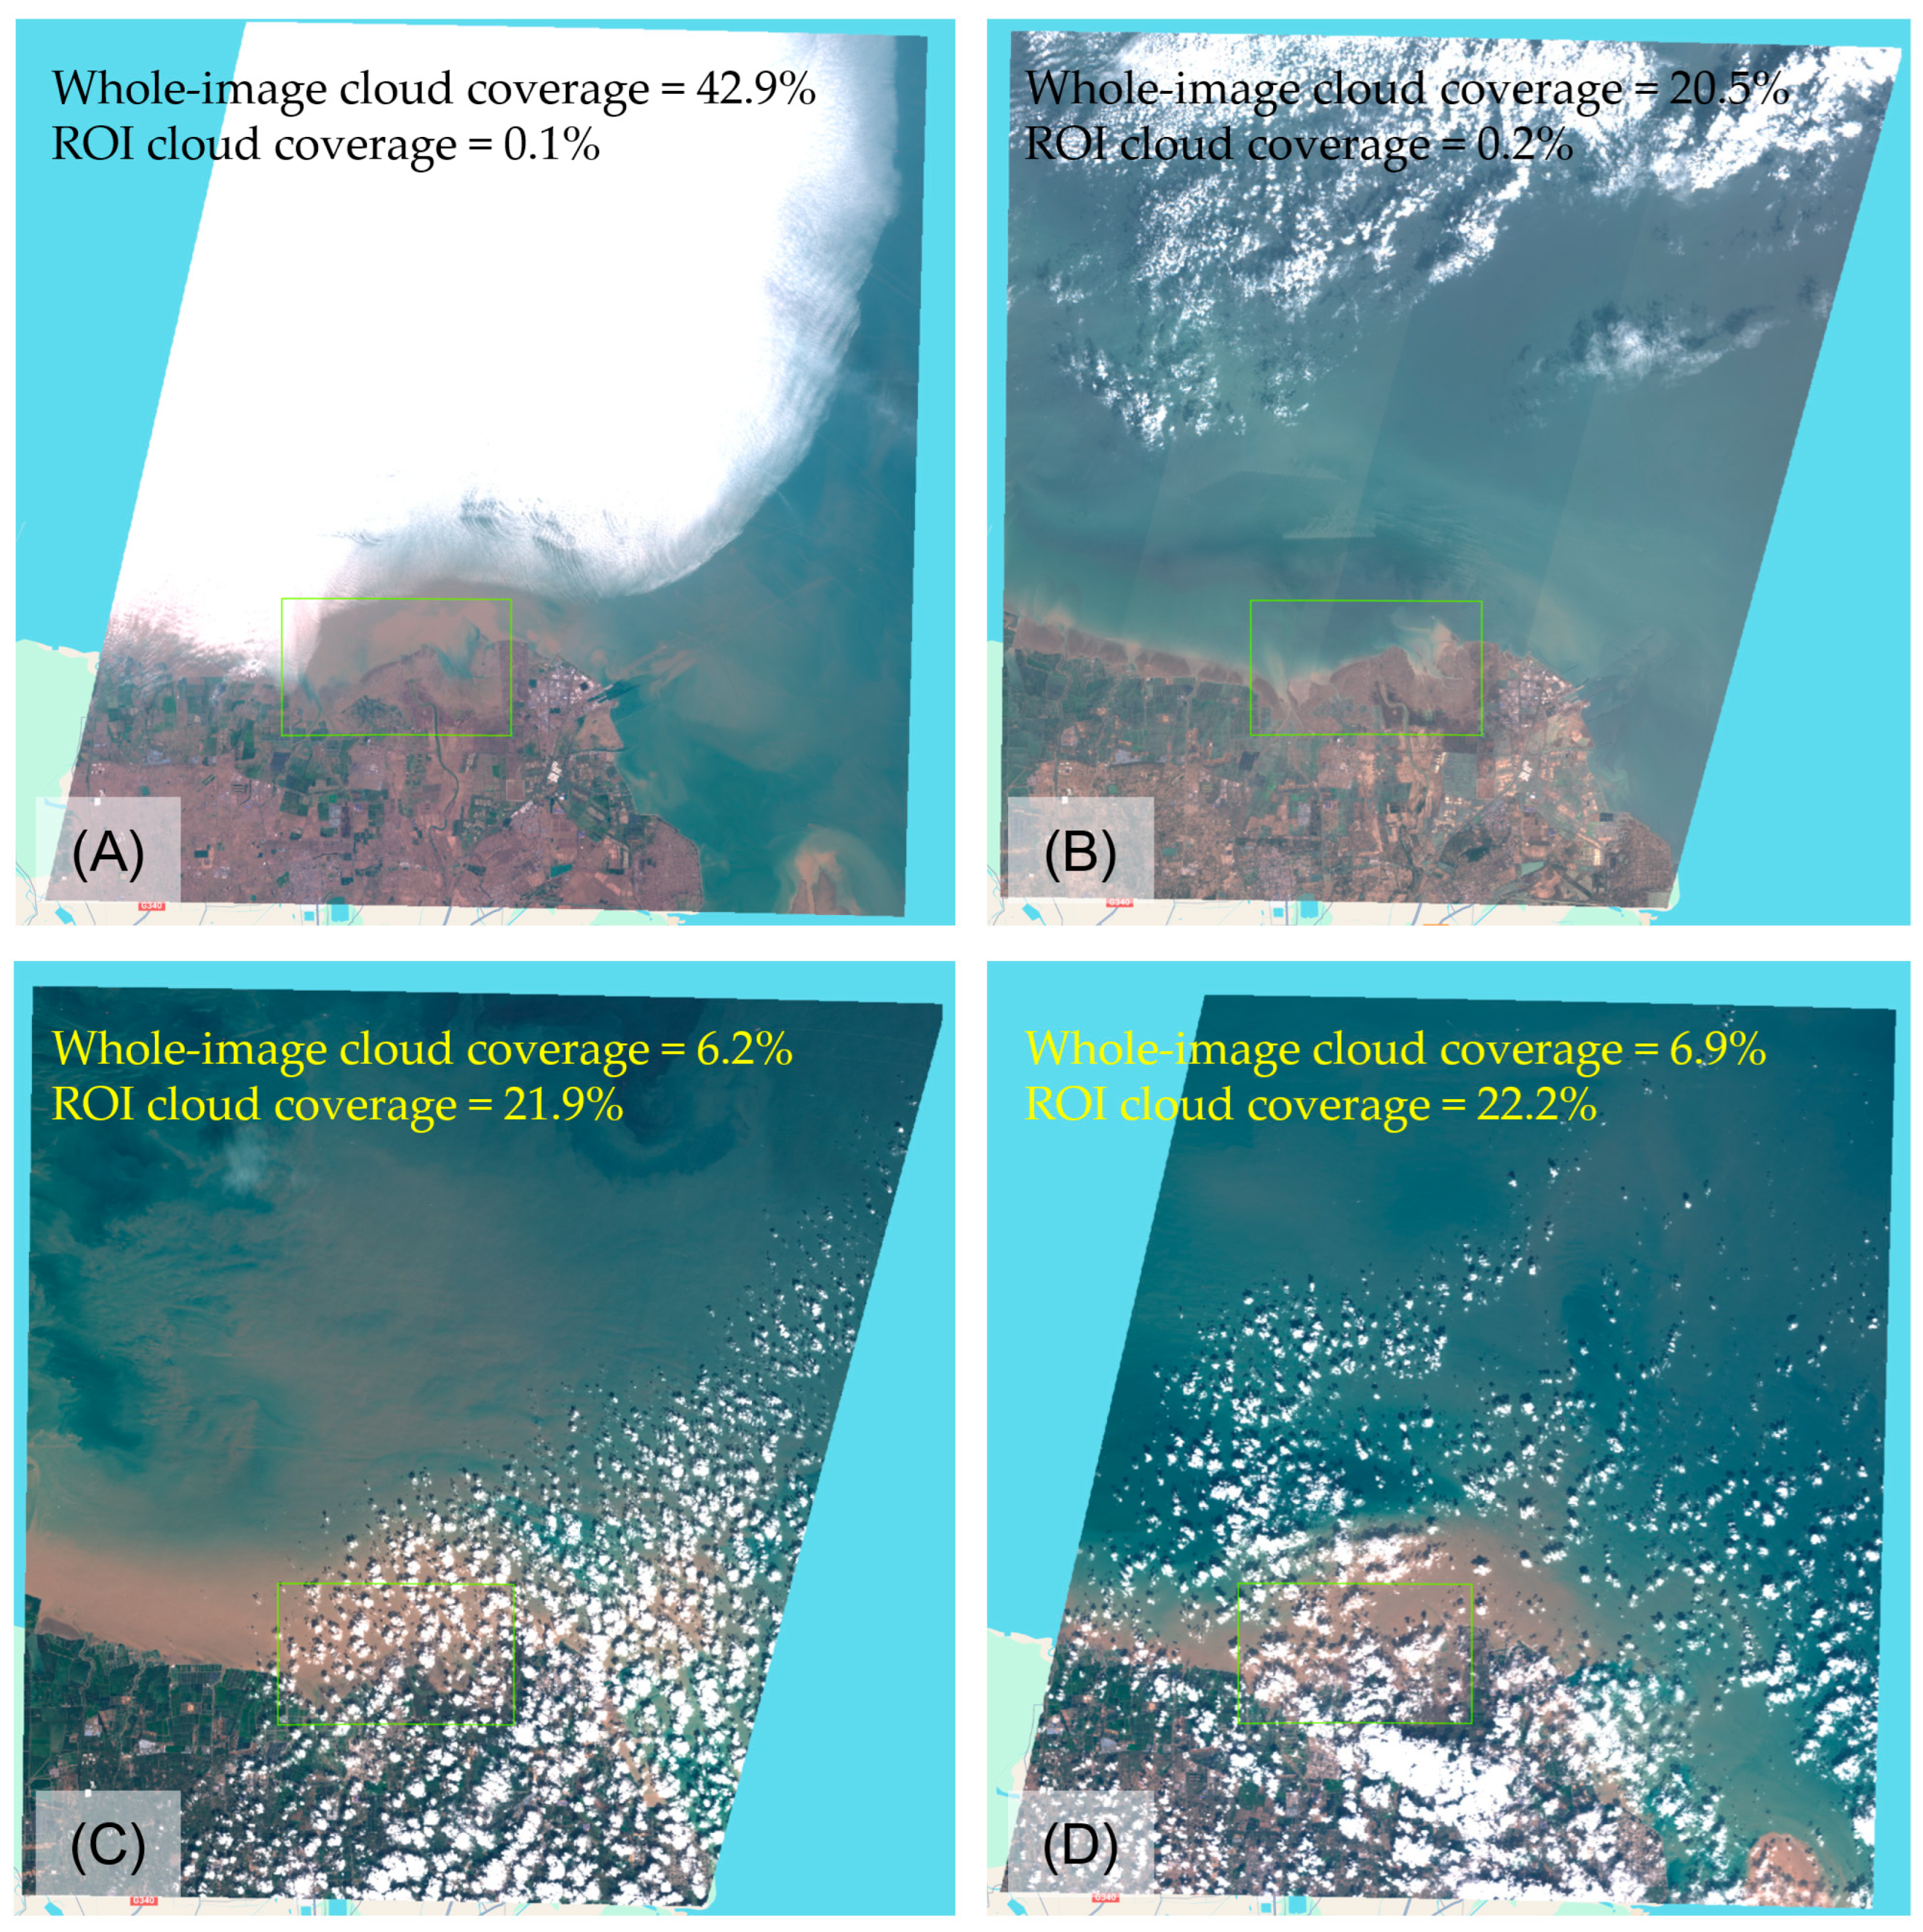
In this study, the CCROI method was applied to filter the available image collection. After using the CCROI method, the number of available images for the 2024 DEM increased by 34%, while for the 2018 DEM the number decreased by 15% (Table 1). The CCROI method retains images with high cloud coverage in the whole image but low in the ROI (Figure 7A,B), while excluding images with low cloud coverage in the whole image but high in the ROI (Figure 7C,D).
Current cloud-masking strategies are widely applied in studies involving areal features but are unsuitable for the extraction of linear features. Clouds spanning the land–water boundary pose the primary challenge for shoreline extraction, as the position of the boundary obscured by cloud cover is unknown. Although researchers prevalently filter images based on whole-image cloud coverage [9], the resulting waterline extraction contains cloud edges, requiring extensive manual editing to remove erroneous boundaries. The technical advantage of the CCROI method lies in its ability to assess image quality within a specific study area by establishing a localized cloud coverage index, thereby enabling the precise selection of high-quality images and laying the groundwork for automated extraction. The CCROI method not only increased the quality of the image being selected but also reduced the false detection rate of the waterline. Together with automated extraction, the CCROI method significantly reduced the workload of manual checking and error correction.

4.2. Influencing Factors of the ETFADC’s Recent Geomorphological Evolution

DEM change analysis based on remote sensing (Figure 6) indicates that the geomorphological evolution of the ETFADC between 2018 and 2024 can be summarized as overall erosion with localized accretion.
Erosion is the dominant characteristic of the study area, widely occurring at the both sides of the Tiaohe Estuary, the western side of the Diaokou Course Estuary, both sides of the Feiyantan Oilfield, the northern side of the Yiqianer Forest Farm, and the outer areas of the Laohekou Oilfield (Figure 6). From 2018 to 2024, the average erosion depth in the eroded zones listed above ranged from 0 to 1.2 m, with an erosion rate of 0–20 cm/a (Figure 6). The estuarine tidal flats underwent significant retrogradation after the abandonment of the Diaokou Course, which has been extensively documented in previous studies [23,24,25]. Although long-term natural evolution may lead to a balance between the geomorphology and dynamic environment, this study reveals that the erosion trend of the ETFADC has not changed. Reduced sediment supply is a key factor contributing to tidal flat erosion. Since the artificial diversion of the Yellow River in 1976, the Diaokou Course has lost its original sediment input, and the scarcity of sediment sources has rendered the tidal flat system unable to maintain sedimentary balance. Moreover, the northern side of the EADC directly faces the Bohai Bay, where strong wave action during winter and spring easily mobilizes and suspends tidal flat sediments, which are subsequently transported away by tidal currents [25]. Previous studies have demonstrated that in EADC, wave breaking frequencies are exceptionally high: 87.2% at water depths of 0–2 m, 12.3% at 2–6.5 m, and below 0.5% at exceeding 6.6 m [38]. The intense wave energy is identified as the primary dynamic driver of tidal flat erosion.
Notably contrasting with the severe erosion phenomena widely reported in the historical literature, localized accretion patterns were identified in this study.
On the eastern side of the Diaokou Course dike, the high-tide zone (Area ①, Figure 6) exhibited substantial accretion of 1.2 m over six years (20 cm/a). Although no longer serving as the Yellow River’s main channel, the Diaokou Course remains a short-source river system. In this system, seasonal runoff and sediment can accumulate at its estuary.
The western ETFADC comprises open coastal waters. The low-tide zone (Area ④, Figure 6) showed accretion of 0.3–0.4 m over six years (4–6 cm/a), while the high-tide zone showed erosion of 0.1–0.6 m (2–10 cm/a). This accretion-erosion difference between high-tide zone and low-tide zone indicates ongoing gentle slope adjustment of the tidal flat profile.
The eastern ETFADC presents a distinctive geospatial configuration of two oilfields flanking an embayment. The tidal flats north of Dahewuzi (Area ②, Figure 6) showed accretion of 0.4–0.6 m (6–10 cm/a). These flats are sheltered by oilfield dikes and primarily influenced by low-energy environments in wave shadow zones. A 0.4–0.5 m (6–8 cm/a) progradation was observed in the middle embayment (Area ③, Figure 6), potentially associated with flow attenuation caused by sudden channel widening in the trumpet-shaped waters between the two oil production zones.
This reveals that despite nearly five decades of geomorphological adjustment, the ETFADC remains in a non-equilibrium evolutionary phase. This persistent erosion regime correlates closely with regional sediment budget imbalances and sustained high-energy hydrodynamic conditions, whereas localized accretion highlights significant anthropogenic interventions through river management and human activities that alter natural processes.

4.3. Impact of Oil Extraction on the ETFADC

The amount and intensity of accretion-erosion of the tidal flats near the oil extraction areas were specifically analyzed for 2018–2024 (Figure 8). Two oil extraction areas are distributed in the ETFADC, namely, the Feiyantan Oilfield and Laohekou Oilfield. Both oilfields consist of multiple oil extraction platforms and tree-fork-shaped road dikes connected to land by main roads. Road dikes have been suggested to exacerbate tidal flat erosion [39], however, this study shows different results. The erosion intensity in the oil extraction area was significantly weaker than that in the other sea areas, and some areas showed a greater intensity of accretion. Among them, the accretion intensity near the road dike in the Laohekou Oilfield was as high as 0.06–0.08 m/a (Area ①, Figure 8), and the accretion intensity near the road dike in the Feiyantan Oilfield was about −0.04–0.04 m/a (Area ③, Figure 8). Facing the sea on its northern side, the oil extraction areas typically receive north-to-south propagating waves. The tree-shaped oil extraction embankment obstructs wave propagation paths, triggering wave breaking and subsequent energy attenuation. Under long-term low-energy marine conditions, the dominance of sedimentation prevails, resulting in weak erosion or even accretion. The location of the strong accretion (Area ②, Figure 8) fits perfectly with the cover of the oil extraction dike on the north side, which verifies the credibility of the study.

4.4. Uncertainties and Limitations

The WDM is well suited for DEM production in small tidal flat areas. In large-scale tidal flats, the waterline is no longer equidistant, and a more accurate method is to spatially interpolate based on multi-station tidal level measurements to calculate elevations for each fold of the waterline. Due to the widespread tidal flats in the study area, few locations remain where water level sensors can be guaranteed to remain submerged during low tides, rendering suitable sites for tide measurement scarce. Additionally, given the study area’s east–west span of only 20 km, only one tidal level measurement station was established centrally within the region. As the distance from the station increases, errors in tidal level predictions escalate, compromising the accuracy of the DEM.
A higher waterline density (i.e., smaller spatial sampling intervals) enhances the spatial resolution of Digital Elevation Models but reduces temporal sensitivity. Since the satellite revisit cycle is fixed, achieving a balance between the spatial resolution and temporal sensitivity is challenging, necessitating a trade-off [40]. The time span of the images used in this study was more than 1 year, which may have reduced the time sensitivity of the DEM. The DEM generated by the WDM is essentially the average elevation surface in the time window. The short-term erosion/accretion signal is diluted when the time window spans a seasonal event (e.g., the wet season of the Yellow River). Actually, the accretion/erosion intensity of most tidal flats tends not to be very large (e.g., a few cm per year), and the elevation errors modeled by the WDM method are not small (typically > 10 cm). Therefore, we suggest that the practice of collecting more imagery to enhance modeling accuracy by increasing the time span should be cautiously criticized, especially in studies where mildly changing tidal flats are studied on time scales of several years to epochs.
Although the DEM validation metrics indicate reliable overall precision, minor erosion/accretion signals (<0.4 m) observed in localized areas approach the magnitude of vertical error (RMSE = 0.19 m). Credibly, these areas exhibit lower erosion/accretion rates. However, these signals cannot be attributed to genuine geomorphic processes rather than noise, incurring significant interpretational uncertainty. This suggests that precise quantification of small geomorphological changes using WDM methods remains challenging.

4.5. Application Scenario

This framework enables efficient waterline extraction and DEM generation, supports fundamental research components such as coastal sediment budget estimation [41] and coastal evolution model validation [42], while directly enabling management applications spanning coastal erosion monitoring [43], habitat assessment [44], and disaster impact assessment [45].

5. Conclusions

As a critical step in applying the Waterline Detection Method (WDM) to Digital Elevation Model (DEM) generation, waterline extraction remains significantly challenged by cloud interference. This study developed an image filtering method termed “Cloud Coverage in Region of Interest” (CCROI). By integrating the CCROI method with the Otsu algorithm and noise smoothing techniques, this study enabled high-quality batch and automated extraction of waterlines within the Google Earth Engine (GEE) platform. Using the WDM, DEMs were established to evaluate recent geomorphological changes in the ETFADC. The results confirm that the erosional trend of the ETFADC has persisted throughout nearly 50 years of natural adjustment. In areas distant from oil extraction zones, erosion dominates the high-tide zone, while accretion prevails in the low-tide zone, indicating a slope-flattening process. However, in areas near the oil extraction zone, tree-shaped embankments have acted to inhibit erosion rather than exacerbate it, with strong accretion even occurring in wave-sheltered areas.
Remote sensing cloud platforms represented by Google Earth Engine are expected to become the preferred tool for waterline extraction in the future due to their significant advantages in efficiency, automation, and anti-interference. By enhancing the quality of the selected images and reducing the waterline false detection rate, the CCROI method demonstrates significant potential for time-series studies of small regions.
CCROI provides coastal managers with a cost-effective tool for regularly monitoring of erosion-accretion dynamics, directly supporting adaptive engineering interventions and ecological restoration in vulnerable coastal sectors. Future research will focus on integrating CCROI with multi-station tidal level observation to enhance monitoring robustness, and combining CCROI with inundation frequency-based topographic reconstruction methods for comprehensive coastal geomorphological analysis.

Author Contributions

Conceptualization, L.Z.; Data curation, X.L.; Formal analysis, J.Y.; Funding acquisition, L.Z.; Investigation, L.Z., P.Z. and B.Z.; Methodology, L.Z.; Project administration, Q.W.; Resources, L.Z.; Software, L.Z. and J.Y.; Supervision, X.L.; Validation, P.Z.; Visualization, J.Y.; Writing—original draft, L.Z. and J.Y.; Writing—review and editing, P.Z. and Q.W. All authors have read and agreed to the published version of the manuscript.

Funding

This research was funded by National Key R & D Program of China, grant number 2022YFC3106103.

Institutional Review Board Statement

Not applicable.

Informed Consent Statement

Not applicable.

Data Availability Statement

Sentinel images were processed at https://developers.google.cn/earth-engine/ (accessed on 30 November 2024). The code is open source at GitHub: https://github.com/JET-NMEMC/Waterline-Extraction (accessed on 8 May 2025). The raw data supporting the conclusions of this article will be made available by the authors on request.

Acknowledgments

The authors would like to thank Yukun Wang for his help during the field investigation in 2024. The authors would like to thank the anonymous reviewers for their valuable feedback and constructive comments, which have significantly contributed to improving this work.

Conflicts of Interest

The authors declare no conflicts of interest.

References

  1. Mason, D.C.; Gurney, C.; Kennett, M. Beach Topography Mapping: A Comparison of Techniques. J. Coast. Conserv. 2000, 6, 113–124. [Google Scholar] [CrossRef]
  2. Gao, W.; Shen, F.; Tan, K.; Zhang, W.; Liu, Q.; Lam, N.S.N.; Ge, J. Monitoring terrain elevation of intertidal wetlands by utilising the spatial-temporal fusion of multi-source satellite data: A case study in the Yangtze (Changjiang) Estuary. Geomorphology 2021, 383, 107683. [Google Scholar] [CrossRef]
  3. Mason, D.C.; Davenport, I.J.; Robinson, G.J.; Flather, R.A.; McCartney, B.S. Construction of an inter-tidal digital elevation model by the ‘Water-Line’ Method. Geophys. Res. Lett. 1995, 22, 3187–3190. [Google Scholar] [CrossRef]
  4. Xu, N.; Ma, Y.; Yang, J.; Wang, X.H.; Wang, Y.; Xu, R. Deriving Tidal Flat Topography Using ICESat-2 Laser Altimetry and Sentinel-2 Imagery. Geophys. Res. Lett. 2022, 49, e2021G–e96813G. [Google Scholar] [CrossRef]
  5. Pacheco, A.; Horta, J.; Loureiro, C.; Ferreira, Ó. Retrieval of nearshore bathymetry from Landsat 8 images: A tool for coastal monitoring in shallow waters. Remote Sens. Environ. 2015, 159, 102–116. [Google Scholar] [CrossRef]
  6. Salameh, E.; Frappart, F.; Turki, I.; Laignel, B. Intertidal topography mapping using the waterline method from Sentinel-1 & -2 images: The examples of Arcachon and Veys Bays in France. ISPRS-J. Photogramm. Remote Sens. 2020, 163, 98–120. [Google Scholar]
  7. Shih, S.; Hsu, W.; Hsu, Y. Waterline digital elevation model development to quantify inundation duration and coastal protection of tidal wetlands. Sci. Total Environ. 2023, 874, 162519. [Google Scholar] [CrossRef]
  8. Cao, J.; Liu, Q.; Yu, C.; Chen, Z.; Dong, X.; Xu, M.; Zhao, Y. Extracting waterline and inverting tidal flats topography based on Sentinel-2 remote sensing images: A case study of the northern part of the North Jiangsu radial sand ridges. Geomorphology 2024, 461, 109323. [Google Scholar] [CrossRef]
  9. Lee, J.; Kim, K.; Kwak, G.; Baek, W.; Jang, Y.; Ryu, J. Optimization of a multi-sensor satellite-based waterline method for rapid and extensive tidal flat topography mapping. Estuar. Coast. Shelf Sci. 2025, 318, 109235. [Google Scholar] [CrossRef]
  10. McAllister, E.; Payo, A.; Novellino, A.; Dolphin, T.; Medina-Lopez, E. Multispectral satellite imagery and machine learning for the extraction of shoreline indicators. Coast. Eng. 2022, 174, 104102. [Google Scholar] [CrossRef]
  11. Scala, P.; Manno, G.; Ciraolo, G. Semantic segmentation of coastal aerial/satellite images using deep learning techniques: An application to coastline detection. Comput. Geosci. 2024, 192, 105704. [Google Scholar] [CrossRef]
  12. Otsu, N. A Threshold Selection Method from Gray-Level Histograms. IEEE Trans. Syst. Man Cybern. 1979, 9, 62–66. [Google Scholar] [CrossRef]
  13. Jia, M.; Wang, Z.; Mao, D.; Ren, C.; Wang, C.; Wang, Y. Rapid, robust, and automated mapping of tidal flats in China using time series Sentinel-2 images and Google Earth Engine. Remote Sens. Environ. 2021, 255, 112285. [Google Scholar] [CrossRef]
  14. Zhao, B.; Liu, Y.; Wang, L.; Liu, Y.; Sun, C.; Fagherazzi, S. Stability evaluation of tidal flats based on time-series satellite images: A case study of the Jiangsu central coast, China. Estuar. Coast. Shelf Sci. 2022, 264, 107697. [Google Scholar] [CrossRef]
  15. Chen, Y.; Wang, S. LogiTide2DEM: A method for reconstructing intertidal topography in complex tidal flats using logistic regression with multi-temporal Sentinel-2 and Landsat imagery. Int. J. Appl. Earth Obs. Geoinf. 2025, 139, 104561. [Google Scholar] [CrossRef]
  16. Chen, C.; Sun, W.; Yang, Z.; Yang, G.; Jia, M.; Zhang, Z.; Liang, J.; Chen, Y.; Ren, T.; Hu, X.; et al. Tracking dynamics characteristics of tidal flats using landsat time series and Google Earth Engine cloud platform. Resour. Conserv. Recycl. 2024, 209, 107751. [Google Scholar] [CrossRef]
  17. Zheng, X.; Zhou, B.; Lei, H.; Jin, Y.; Su, Q. Mapping tidal flat topography using time-series Sentinel-2 images and ICESat-2 data: A case study in Cixi City. Ocean Coast. Manag. 2024, 256, 107278. [Google Scholar] [CrossRef]
  18. Chen, C.; Zhang, C.; Tian, B.; Wu, W.; Zhou, Y. Tide2Topo: A new method for mapping intertidal topography accurately in complex estuaries and bays with time-series Sentinel-2 images. ISPRS-J. Photogramm. Remote Sens. 2023, 200, 55–72. [Google Scholar] [CrossRef]
  19. Pool, L.; Mascagni, M.L.; Klein, A.H.F.; Carvalho, J.L.B.; Lima, L.G.; Costa, W.L.L.; Gonçalves, R.Q.; Fiorini, L.P. Revealing intertidal topography with public satellite imagery: Adaptations of the waterline method. Environ. Modell. Softw. 2025, 193, 106600. [Google Scholar] [CrossRef]
  20. Wang, H.; Yuan, X.; Wang, Y.; Yang, Z. Evolution of the abandoned Shenxiangou-Diaokou delta lobe: Processes and mechanism. J. Sediment Res. 2010, 51–60. [Google Scholar] [CrossRef]
  21. Xue, C. Historical changes in the Yellow River delta, China. Mar. Geol. 1993, 113, 321–329. [Google Scholar] [CrossRef]
  22. Xue, C.; Yang, Y.; Han, X.; Wang, Y.P.; Chen, Y.; Xia, X.; Jia, J. Delayed response of the coastal sedimentary record to the southward shift of the Huanghe (Yellow River) course during AD1128–1855. Mar. Geol. 2025, 480, 107439. [Google Scholar] [CrossRef]
  23. Chu, Z.X.; Sun, X.G.; Zhai, S.K.; Xu, K.H. Changing pattern of accretion/erosion of the modern Yellow River (Huanghe) subaerial delta, China: Based on remote sensing images. Mar. Geol. 2006, 227, 13–30. [Google Scholar] [CrossRef]
  24. Li, G.; Zhuang, K.; Wei, H. Sedimentation in the Yellow River delta; Part III, Seabed erosion and diapirism in the abandoned subaqueous delta lobe. Mar. Geol. 2000, 168, 129–144. [Google Scholar] [CrossRef]
  25. Zhang, S.; Zhang, Y.; Xu, J.; Guo, L.; Li, G.; Jia, Y.; Qiao, L.; Wu, J.; Wen, M.; Zhu, C. In situ observations of hydro-sediment dynamics on the abandoned Diaokou lobe of the Yellow River Delta: Erosion mechanism and rate. Estuar. Coast. Shelf Sci. 2022, 277, 108065. [Google Scholar] [CrossRef]
  26. Wu, X.; Fan, Y.; Wang, H.; Bi, N.; Xu, C.; Zhang, Y.; Liu, J.; Lu, T. Evolution of abandoned deltaic river channel−A case from the Diaokou channel of the Yellow River. Mar. Geol. Quat. Geol. 2021, 41, 22–29. [Google Scholar]
  27. Mason, D.C.; Davenport, I.J. Accurate and efficient determination of the shoreline in ERS-1 SAR images. IEEE Trans. Geosci. Remote Sens. 1996, 34, 1243–1253. [Google Scholar] [CrossRef]
  28. Kang, Y.; Ding, X.; Xu, F.; Zhang, C.; Ge, X. Topographic mapping on large-scale tidal flats with an iterative approach on the waterline method. Estuar. Coast. Shelf Sci. 2017, 190, 11–22. [Google Scholar] [CrossRef]
  29. Khan, M.J.U.; Ansary, M.N.; Durand, F.; Testut, L.; Ishaque, M.; Calmant, S.; Krien, Y.; Islam, A.K.M.S.; Papa, F. High-Resolution Intertidal Topography from Sentinel-2 Multi-Spectral Imagery: Synergy between Remote Sensing and Numerical Modeling. Remote Sens. 2019, 11, 2888. [Google Scholar] [CrossRef]
  30. Zhu, Z.; Woodcock, C.E. Object-based cloud and cloud shadow detection in Landsat imagery. Remote Sens. Environ. 2012, 118, 83–94. [Google Scholar] [CrossRef]
  31. Pasquarella, V.J.; Brown, C.F.; Czerwinski, W.; Rucklidge, W.J. Comprehensive quality assessment of optical satellite imagery using weakly supervised video learning. In Proceedings of the 2023 IEEE/CVF Conference on Computer Vision and Pattern Recognition Workshops (CVPRW), Vancouver, BC, Canada, 17–24 June 2023; pp. 2125–2135. [Google Scholar]
  32. Zupanc, A. Improving Cloud Detection with Machine Learning. 2017. Available online: https://medium.com/sentinel-hub/improving-cloud-detection-with-machine-learning-c09dc5d7cf13 (accessed on 30 July 2025).
  33. Xu, H. Modification of normalised difference water index (NDWI) to enhance open water features in remotely sensed imagery. Int. J. Remote Sens. 2006, 27, 3025–3033. [Google Scholar] [CrossRef]
  34. Feyisa, G.L.; Meilby, H.; Fensholt, R.; Proud, S.R. Automated Water Extraction Index: A new technique for surface water mapping using Landsat imagery. Remote Sens. Environ. 2014, 140, 23–35. [Google Scholar] [CrossRef]
  35. Buma, W.G.; Lee, S.; Seo, J.Y. Recent Surface Water Extent of Lake Chad from Multispectral Sensors and GRACE. Sensors 2018, 18, 2082. [Google Scholar] [CrossRef] [PubMed]
  36. Lan, L.; Wang, X. Large-scale flood mapping using Sentinel-1 and Sentinel-2 imagery: Spatio-temporal analysis of the 23·7 Haihe basin-wide extreme flood. J. Hydrol. 2025, 653, 132777. [Google Scholar] [CrossRef]
  37. Liang, J.; Xie, Y.; Sha, Z.; Zhou, A. Modeling urban growth sustainability in the cloud by augmenting Google Earth Engine (GEE). Comput. Environ. Urban Syst. 2020, 84, 101542. [Google Scholar] [CrossRef]
  38. Bo, H. Spatial-Temporal Evolution of Erosion Process and Protective Countermeasures Research for Diaokou River Coastline in Yellow River Delta; Beijing Forestry University: Beijing, China, 2015. [Google Scholar]
  39. Jia, Y.; Zheng, J.; Yue, Z.; Liu, X.; Shan, H. Tidal flat erosion of the Huanghe River Delta due to local changes in hydrodynamic conditions. Acta Oceanol. Sin. 2014, 33, 116–124. [Google Scholar] [CrossRef]
  40. Chen, C.; Zhang, C.; Tian, B.; Wu, W.; Zhou, Y. Mapping intertidal topographic changes in a highly turbid estuary using dense Sentinel-2 time series with deep learning. ISPRS J. Photogramm. Remote Sens. 2023, 205, 1–16. [Google Scholar] [CrossRef]
  41. Deng, J.; Zhang, W.; Harff, J.; Schneider, R.; Dudzinska-Nowak, J.; Terefenko, P.; Giza, A.; Furmanczyk, K. A numerical approach for approximating the historical morphology of wave-dominated coasts—A case study of the Pomeranian Bight, southern Baltic Sea. Geomorphology 2014, 204, 425–443. [Google Scholar] [CrossRef]
  42. Zhang, Q.; Fan, D.; Feng, T.; Tu, J.; Guo, X. Impacts of land reclamation projects on hydrodynamics and morphodynamics in the highly altered North Branch of the Changjiang Estuary. Anthr. Coasts 2022, 5, 6. [Google Scholar] [CrossRef]
  43. Khan, S.; Bartley, R.; Kinsey-Henderson, A.; Hawdon, A. Assessing gully erosion and rehabilitation using multi temporal LiDAR DEMs: Case study from the Great Barrier Reef catchments, Australia. Int. Soil Water Conserv. Res. 2024, 12, 184–199. [Google Scholar] [CrossRef]
  44. Liston, G.E.; Gura, K.B.; Crawford, J.A.; Polasek, L.; Perham, C.J.; Quakenbush, L.; Reinking, A.K.; Lund, J.; Chinn, S.M.; Shideler, R.T.; et al. Modeling polar bear (Ursus maritimus) snowdrift den habitat on Alaska’s Beaufort Sea coast using SnowDens-3D and ArcticDEM data. Ecol. Model. 2025, 501, 110939. [Google Scholar] [CrossRef]
  45. Song, J.; Goda, K. Influence of Elevation Data Resolution on Tsunami Loss Estimation and Insurance Rate-Making. Front. Earth Sci. 2019, 7, 246. [Google Scholar] [CrossRef]
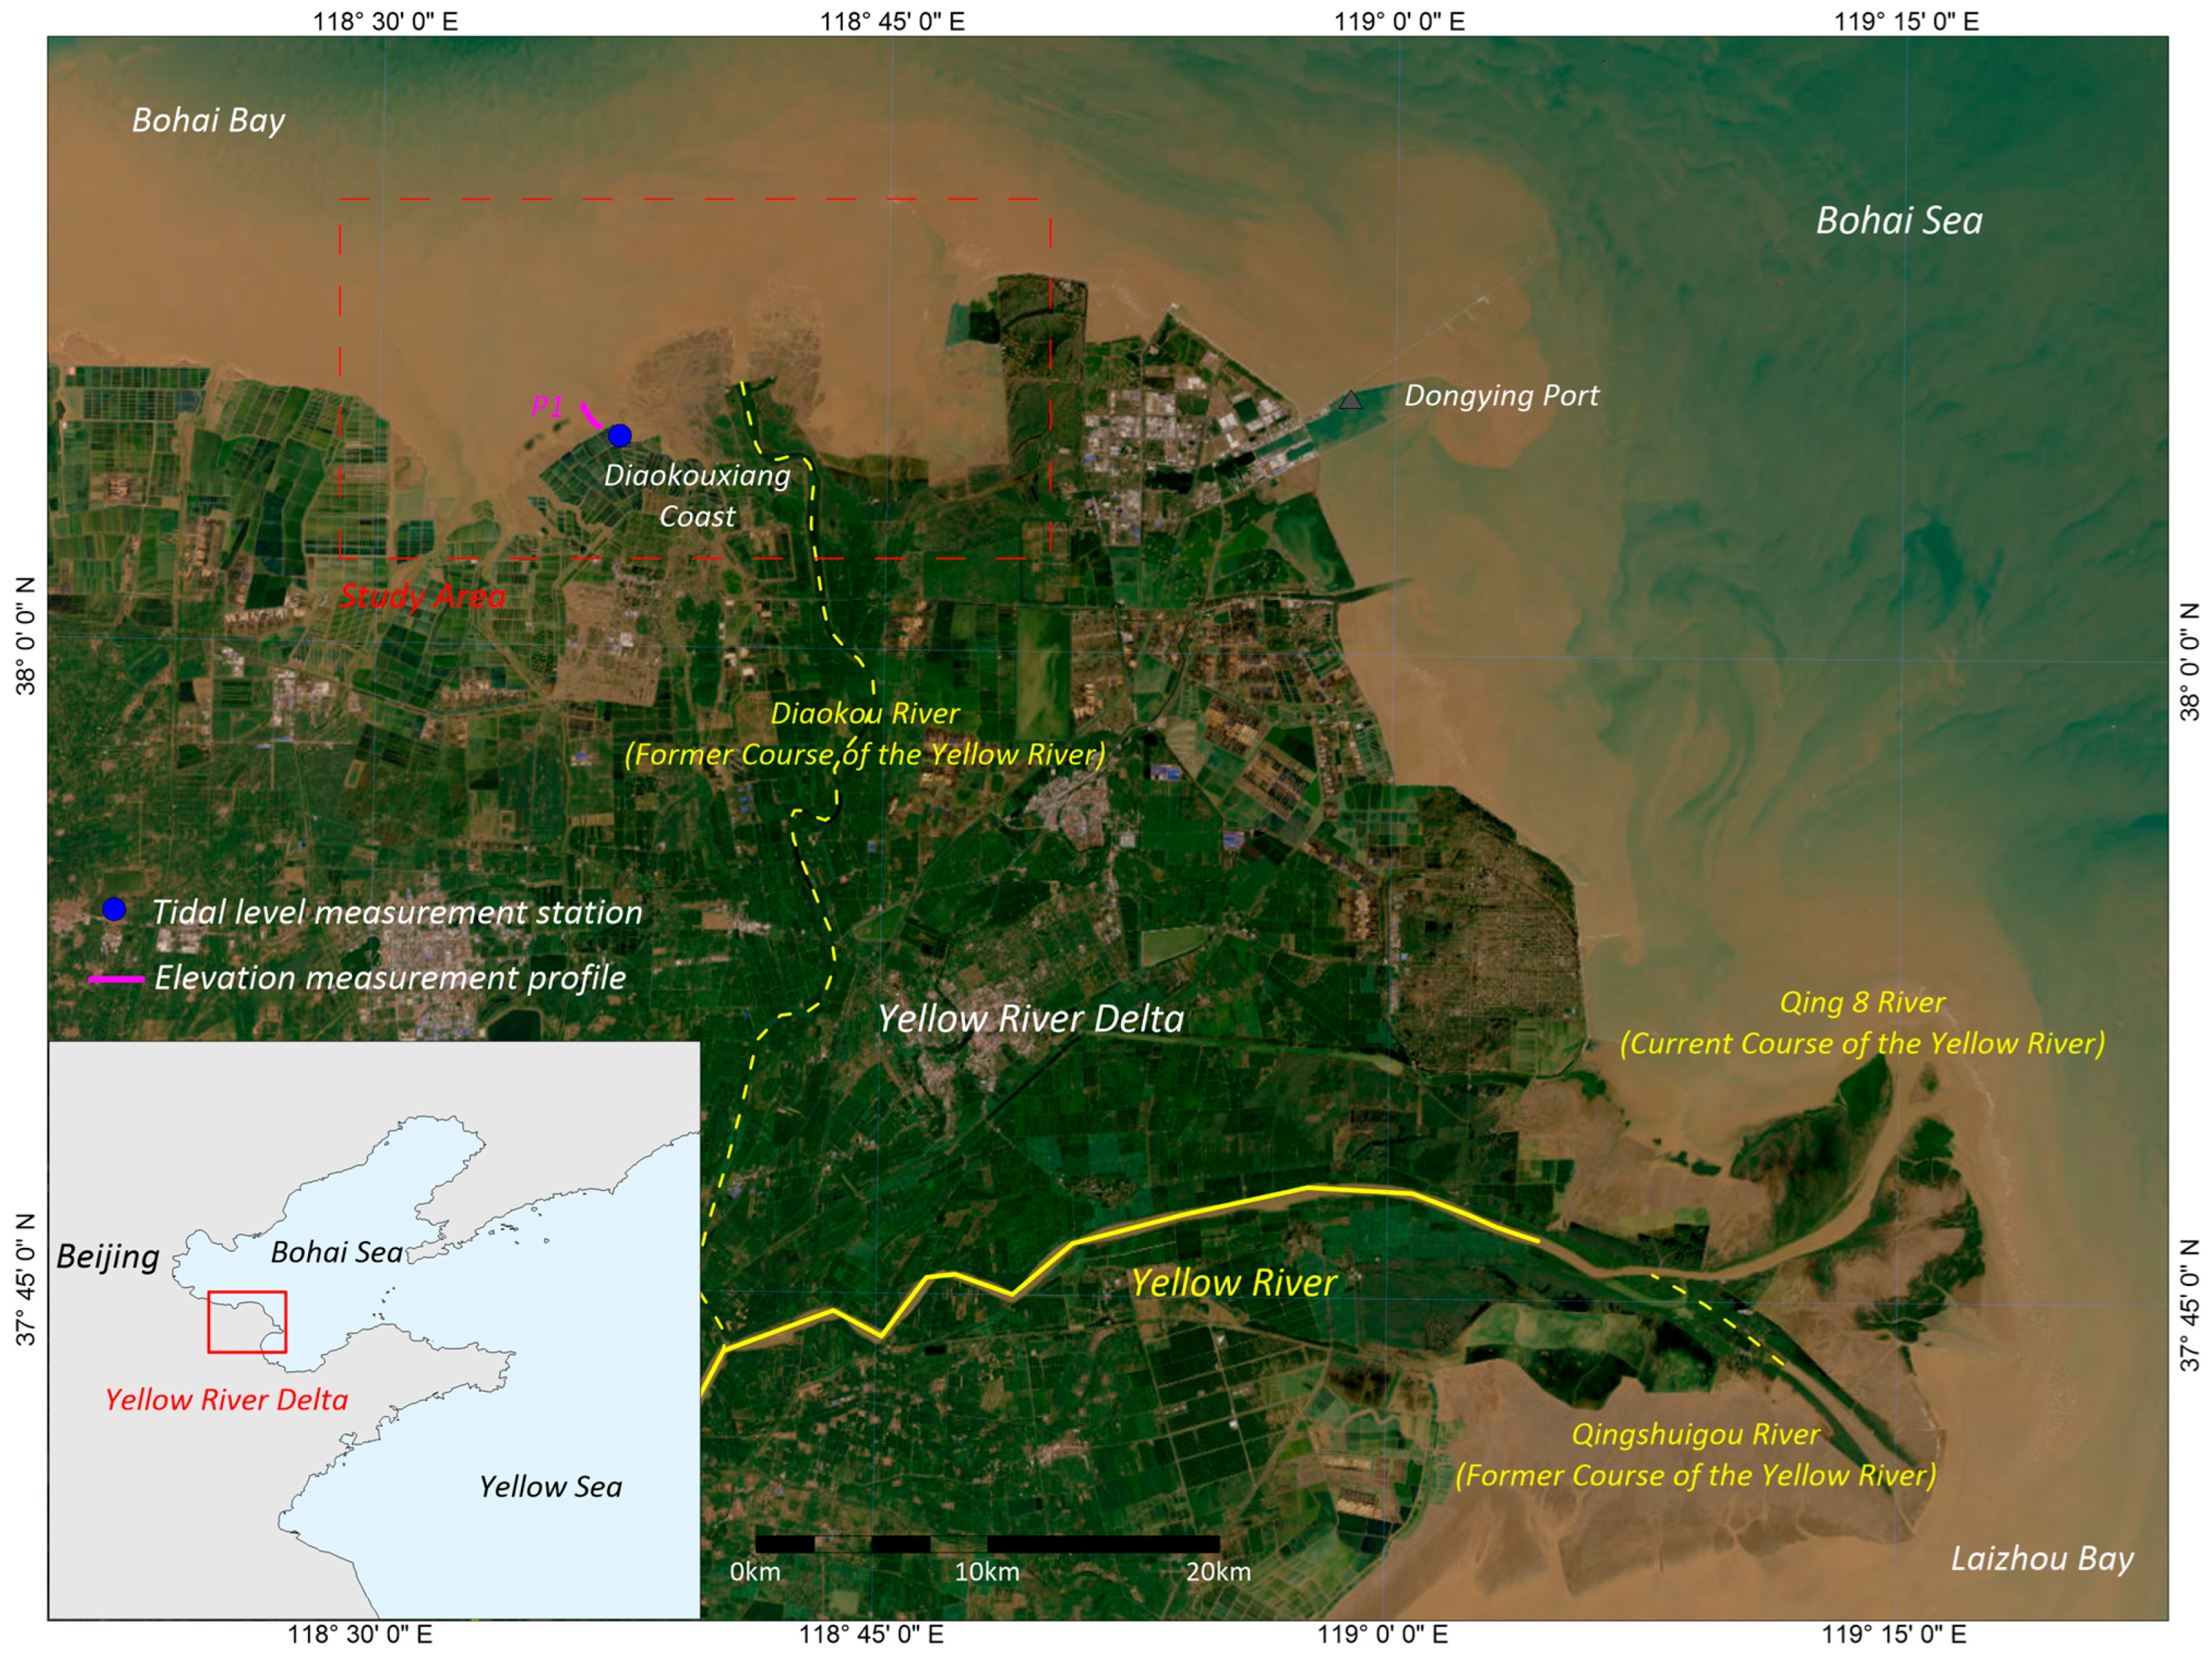
Figure 1. Location of the study area, tidal level measurement station, and elevation measurement profile. The satellite image is from ESRI.
Applsci 15 09097 g001
Figure 2. Technical process of this study.
Applsci 15 09097 g002
Figure 3. Comparison between measured and estimated tidal levels.
Applsci 15 09097 g003
Figure 4. Digital elevation models of the estuarine tidal flats of the abandoned Diaokou Course. (A) 2024; (B) 2018.
Applsci 15 09097 g004
Figure 5. Observed elevations, estimated elevations, and their relative errors (RE) at the estuarine tidal flats of the abandoned Diaokou Course.
Applsci 15 09097 g005
Figure 6. Amount (A) and intensity (B) of the accretion/erosion of the estuarine tidal flats of the abandoned Diaokou Course from 2018 to 2024. The areas outlined by the pink dotted lines and numbered by the pink numbers indicate greater intensity of accretion.
Applsci 15 09097 g006
Figure 7. Filtering effect of the CCROI method. (A,B) Examples of images that were retained, with cloud coverage high in the whole image but low in ROI; (C,D) examples of images that were excluded, with cloud coverage low in the whole image but high in ROI.
Applsci 15 09097 g007
Figure 8. Amount (A) and intensity (B) of accretion/erosion of the tidal flats in oil extraction areas from 2018 to 2024. The areas outlined by the pink dotted lines and numbered by the pink numbers indicate impact of oil extraction.
Applsci 15 09097 g008
Table 1. Sentinel 2 images used in this study.
Base Year of DEMDate Range of ImagesNumber of Images
OriginalWhole-Image Cloud Coverage < 2%ROI Cloud
Coverage < 2%
Finally Used
2024June 2023~
November 2024
174537150
2018November 2017~
November 2018
103463939
Disclaimer/Publisher’s Note: The statements, opinions and data contained in all publications are solely those of the individual author(s) and contributor(s) and not of MDPI and/or the editor(s). MDPI and/or the editor(s) disclaim responsibility for any injury to people or property resulting from any ideas, methods, instructions or products referred to in the content.