Article

Performance-Based Seismic Evaluation of Local Staggered RC Frames with Steel Tube-Reinforced Concrete Columns Under Multi-Angle Earthquakes

1
School of Architecture and Civil Engineering, Xi’an University of Science and Technology, Xi’an 710054, China
2
Shaanxi Modern Architectural Design and Research Institute Co., Ltd., Xi’an 710021, China
*
Author to whom correspondence should be addressed.
Appl. Sci. 2025, 15(16), 9092; https://doi.org/10.3390/app15169092
Submission received: 15 July 2025 / Revised: 13 August 2025 / Accepted: 15 August 2025 / Published: 18 August 2025

Abstract

Staggered floor frame structures with good spatial adaptability are widely used in large-space civil buildings such as conference halls and terminal buildings. However, the short columns formed by staggered floor slabs significantly affect load transfer, which is unfavorable to the seismic performance of the structure. To address this issue, based on a practical project, this paper establishes a finite element analysis model, sets up steel-tube-reinforced concrete (ST-RC) columns at staggered floors to improve the insufficient ductility of short columns, and adopts the dynamic time–history analysis method combined with performance-based evaluation methods to study the effects of different seismic input angles (0°, 30°, 60°, 90°) on the seismic performance of local staggered floor frame structures at both the overall and member levels. The research results show that at the overall level, the fourth floor of the staggered floor frame structure is the weak floor, and the most unfavorable seismic input angle is 60°; additionally, at the member level, the damage of each member meets the performance objectives. Frame beams are more severely damaged under 0° and 90° seismic input, frame columns are more severely damaged under 30° and 60° seismic input, and the damage degree of ST-RC columns is similar in the four directions. As energy-dissipating members, frame beams have a significantly higher proportion of nonlinear strain energy than frame columns and ST-RC columns, which can effectively consume a large amount of seismic energy and enable the structure to retain more safety reserves. Therefore, for irregular buildings such as staggered floor frame structures that are prone to damage due to insufficient ductility of short columns, setting ST-RC columns at staggered floors can effectively reduce structural damage. The adoption of evaluation methods at both the overall structural and member levels enables a comprehensive understanding of the damage status of staggered floor structures.

1. Introduction

With the continuous development of the construction industry, the demand for diverse architectural forms has been increasing. Staggered floor structures are gaining wider application due to their flexible spatial layouts and hierarchical design [1]. In such structures, the configuration where staggered beams share a common column is referred to as a staggered floor structure [2]. This form is commonly used in civil buildings requiring large spaces, such as conference rooms and exhibition halls. However, the staggered floor slabs significantly affect load transfer, and the staggered floor regions are prone to forming short columns, which adversely impact seismic performance [3,4,5,6]. Therefore, enhancing the seismic performance of staggered floors essentially involves improving the ductility of short columns. Currently, the common practice is to install ST-RC columns at staggered floors. Among relevant studies, Heidari et al. [7] conducted nonlinear analyses on structures with ST-RC columns and steel box columns to investigate their seismic performance. They extracted seismic responses through IDA analyses, evaluated and calculated damage and elasticity indices under different earthquake intensities, and made comparisons. The research results showed that ST-RC columns have better ductility and superior seismic performance under most earthquake risk levels. Kim et al. [8] conducted nonlinear time–history analyses on a three-dimensional office frame, in which hollow steel sections and ST-RC column sections were used in the simulation. The research results showed that under strong earthquakes, hollow steel sections have lower ductility and a higher damage degree than ST-RC column sections. Mata et al. [9] evaluated the seismic capacity of frames with ST-RC columns. They adopted finite element modeling to analyze the three-dimensional nonlinear behavior of two office buildings. The research results showed that ST-RC columns still exhibit good ductility even under large inter-story drift angles. Judd et al. [10] proposed a dual lateral resistance system consisting of a primary lateral resistance system and secondary ST-RC columns placed in the gravity frame. The concept of the dual ST-RC system relies on the primary lateral resistance system to provide the main lateral strength, while the ST-RC columns offer additional lateral strength and robustness. To explore the feasibility of this concept, seismic analyses were conducted. The research results showed that compared with traditional buildings, the buildings adopting the dual ST-RC system reduced the impact of seismic collapse by 20–83%, which is mainly attributed to the good ductility of the ST-RC columns.
The concept of performance was defined in the 1980s as the manifestation of a product’s intended use, gaining widespread recognition and subsequently driving the development of performance-based approaches in architecture. Gibson [11] provided the following fundamental definition of this methodology: “It represents a goal-oriented rather than means-oriented mode of thinking and working, focusing on what a building should achieve rather than how it should be constructed.” As this approach became integrated into architectural design processes, the notion of performance-based architectural design naturally emerged.
The final report of the PeBBu thematic network provides the following definition for performance-based design: “Performance-based design is an architectural design approach founded on a set of specific performance requirements, which can be evaluated through measurable performance indicators.” Furthermore, the report defines the performance-based design process as “The procedure of translating and integrating performance requirements into architectural design [12].”
Performance-based architectural design hinges on the accurate identification of requirements, necessitating a broad perspective to establish priorities [13]. Zeng et al. [14] classified the performance levels of ST-RC frame-core tube structures based on threshold values corresponding to different damage limit states, including minor damage, moderate damage, and severe damage. Zhai et al. [15] improved the performance-based plastic design method, demonstrating its successful application in a 20-story frame structure. AbdelMalek et al. [16] addressed the shortcomings of the Egyptian Code (ECP-201) for high-rise building design by conducting performance-based optimization on three tall buildings. Their findings confirmed that performance-based design and evaluation can significantly enhance the structural performance of high-rise buildings. Yang et al. [17] implemented performance-based seismic design and evaluation on a practical project in Nanjing, Jiangsu Province, China. The study focused on a torsionally irregular structure with local staggered floors. Nonlinear dynamic analysis revealed that performance-based seismic design effectively maintained the structure’s overall seismic performance within acceptable limits, with key members meeting code requirements. Peng et al. [18] modeled five experimentally tested reinforced concrete frames and employed pushover analysis to assess their seismic deficiencies. The results underscored the irreplaceable value of performance-based evaluation methods in predicting seismic response, safety, and failure modes of frame structures.
Furthermore, in seismic response analysis of structures, ground motions are typically input along the principal axes of buildings. However, the actual direction of seismic action exhibits significant uncertainty due to both the randomness of seismic wave propagation and the indeterminacy of building orientations [19,20]. Therefore, multi-directional seismic input is essential for comprehensive seismic performance evaluation. Pavlidou et al. [21] and Bugueño et al. [22] demonstrated that critical seismic incidence angles often deviate from a structure’s principal axes. Du [23], Tondini [24], Magliulo [25], and others investigated structural responses under multi-directional seismic inputs, emphasizing that considering seismic incidence angles better captures dynamic structural characteristics. Alam et al. [26] revealed that stiffness-eccentric structures exhibit greater sensitivity to off-axis seismic inputs compared to principal-axis excitations. Zhang et al. [27] found that the relationship between torsional responses and irregularity coefficients in RC frame structures becomes highly uncertain when seismic incidence angles vary. Liang et al. [28] identified seismic incidence angles and structural irregularities as key contributors to torsional failures, with 60° being the most critical incidence angle. Ren et al. [29] analyzed multi-angle seismic inputs and demonstrated that elastoplastic analysis under such conditions effectively reveals structural vulnerabilities.
Investigations reveal that traditional structural seismic performance evaluation methods do not involve evaluation at the member level. Moreover, due to the difference in member arrangement from regular frame structures, staggered floor structures require full consideration of the contribution of short columns when conducting performance-based seismic evaluation. In addition, existing studies have carried out certain discussions on the impact of seismic wave input angles on building structures, but there remains room for expansion in research on staggered floor frame structures with both vertical and horizontal irregularities. Staggered floor structures, due to the uneven distribution of mass centers and stiffness centers, significantly intensify structural torsional effects, making them more prone to torsional failure under earthquake action. Therefore, it is necessary to study the influence of seismic wave incidence angles on the seismic performance of staggered floor structures, determine the most unfavorable seismic incidence direction, and set ST-RC columns at staggered floors to improve the ductility of short columns, thereby enhancing the seismic performance of staggered floor structures, and achieving the objectives of seismic performance evaluation.
Based on this, the study aims to conduct performance-based research to evaluate the seismic performance of local staggered RC frame structures under different seismic input angles (0°, 30°, 60°, and 90°), in order to comprehensively understand the failure characteristics of this type of irregular structure. The research process is as follows: first, a finite element model is established based on a practical engineering project, with ST-RC columns installed at the staggered floors to meet the ductility requirements of short columns and prevent shear failure. Second, appropriate ground motion records are selected to perform elastic–plastic time–history analysis of the structure under the specified seismic input angles. Finally, performance design objectives are defined for both the overall structure and its members, and performance statistics and evaluation are conducted based on the calculation results. The research findings can provide theoretical guidance and technical references for practical engineering applications.

2. Finite Element Model

2.1. Structural Design Overview

The research objective was an experimental center featuring a reinforced concrete frame structure with a staggered floor design for a multi-room science and technology lecture theatre [30]. The building’s structural design is primarily based on the Code for Design of Concrete Structures [31] and the Code for Seismic Design of Buildings [32]. The building measured 97.8 m in length, 48.6 m in width, and 29.4 m in height, with six floors. It was classified as category 2, with a design service life of 50 years. The frame seismic grade was one, the structural safety grade was two, and the seismic defense classification was category C. The seismic fortification intensity was eight degrees, with a design basic seismic acceleration of 0.20 g. The site category was category two, and the classification of the seismic design was the first group.
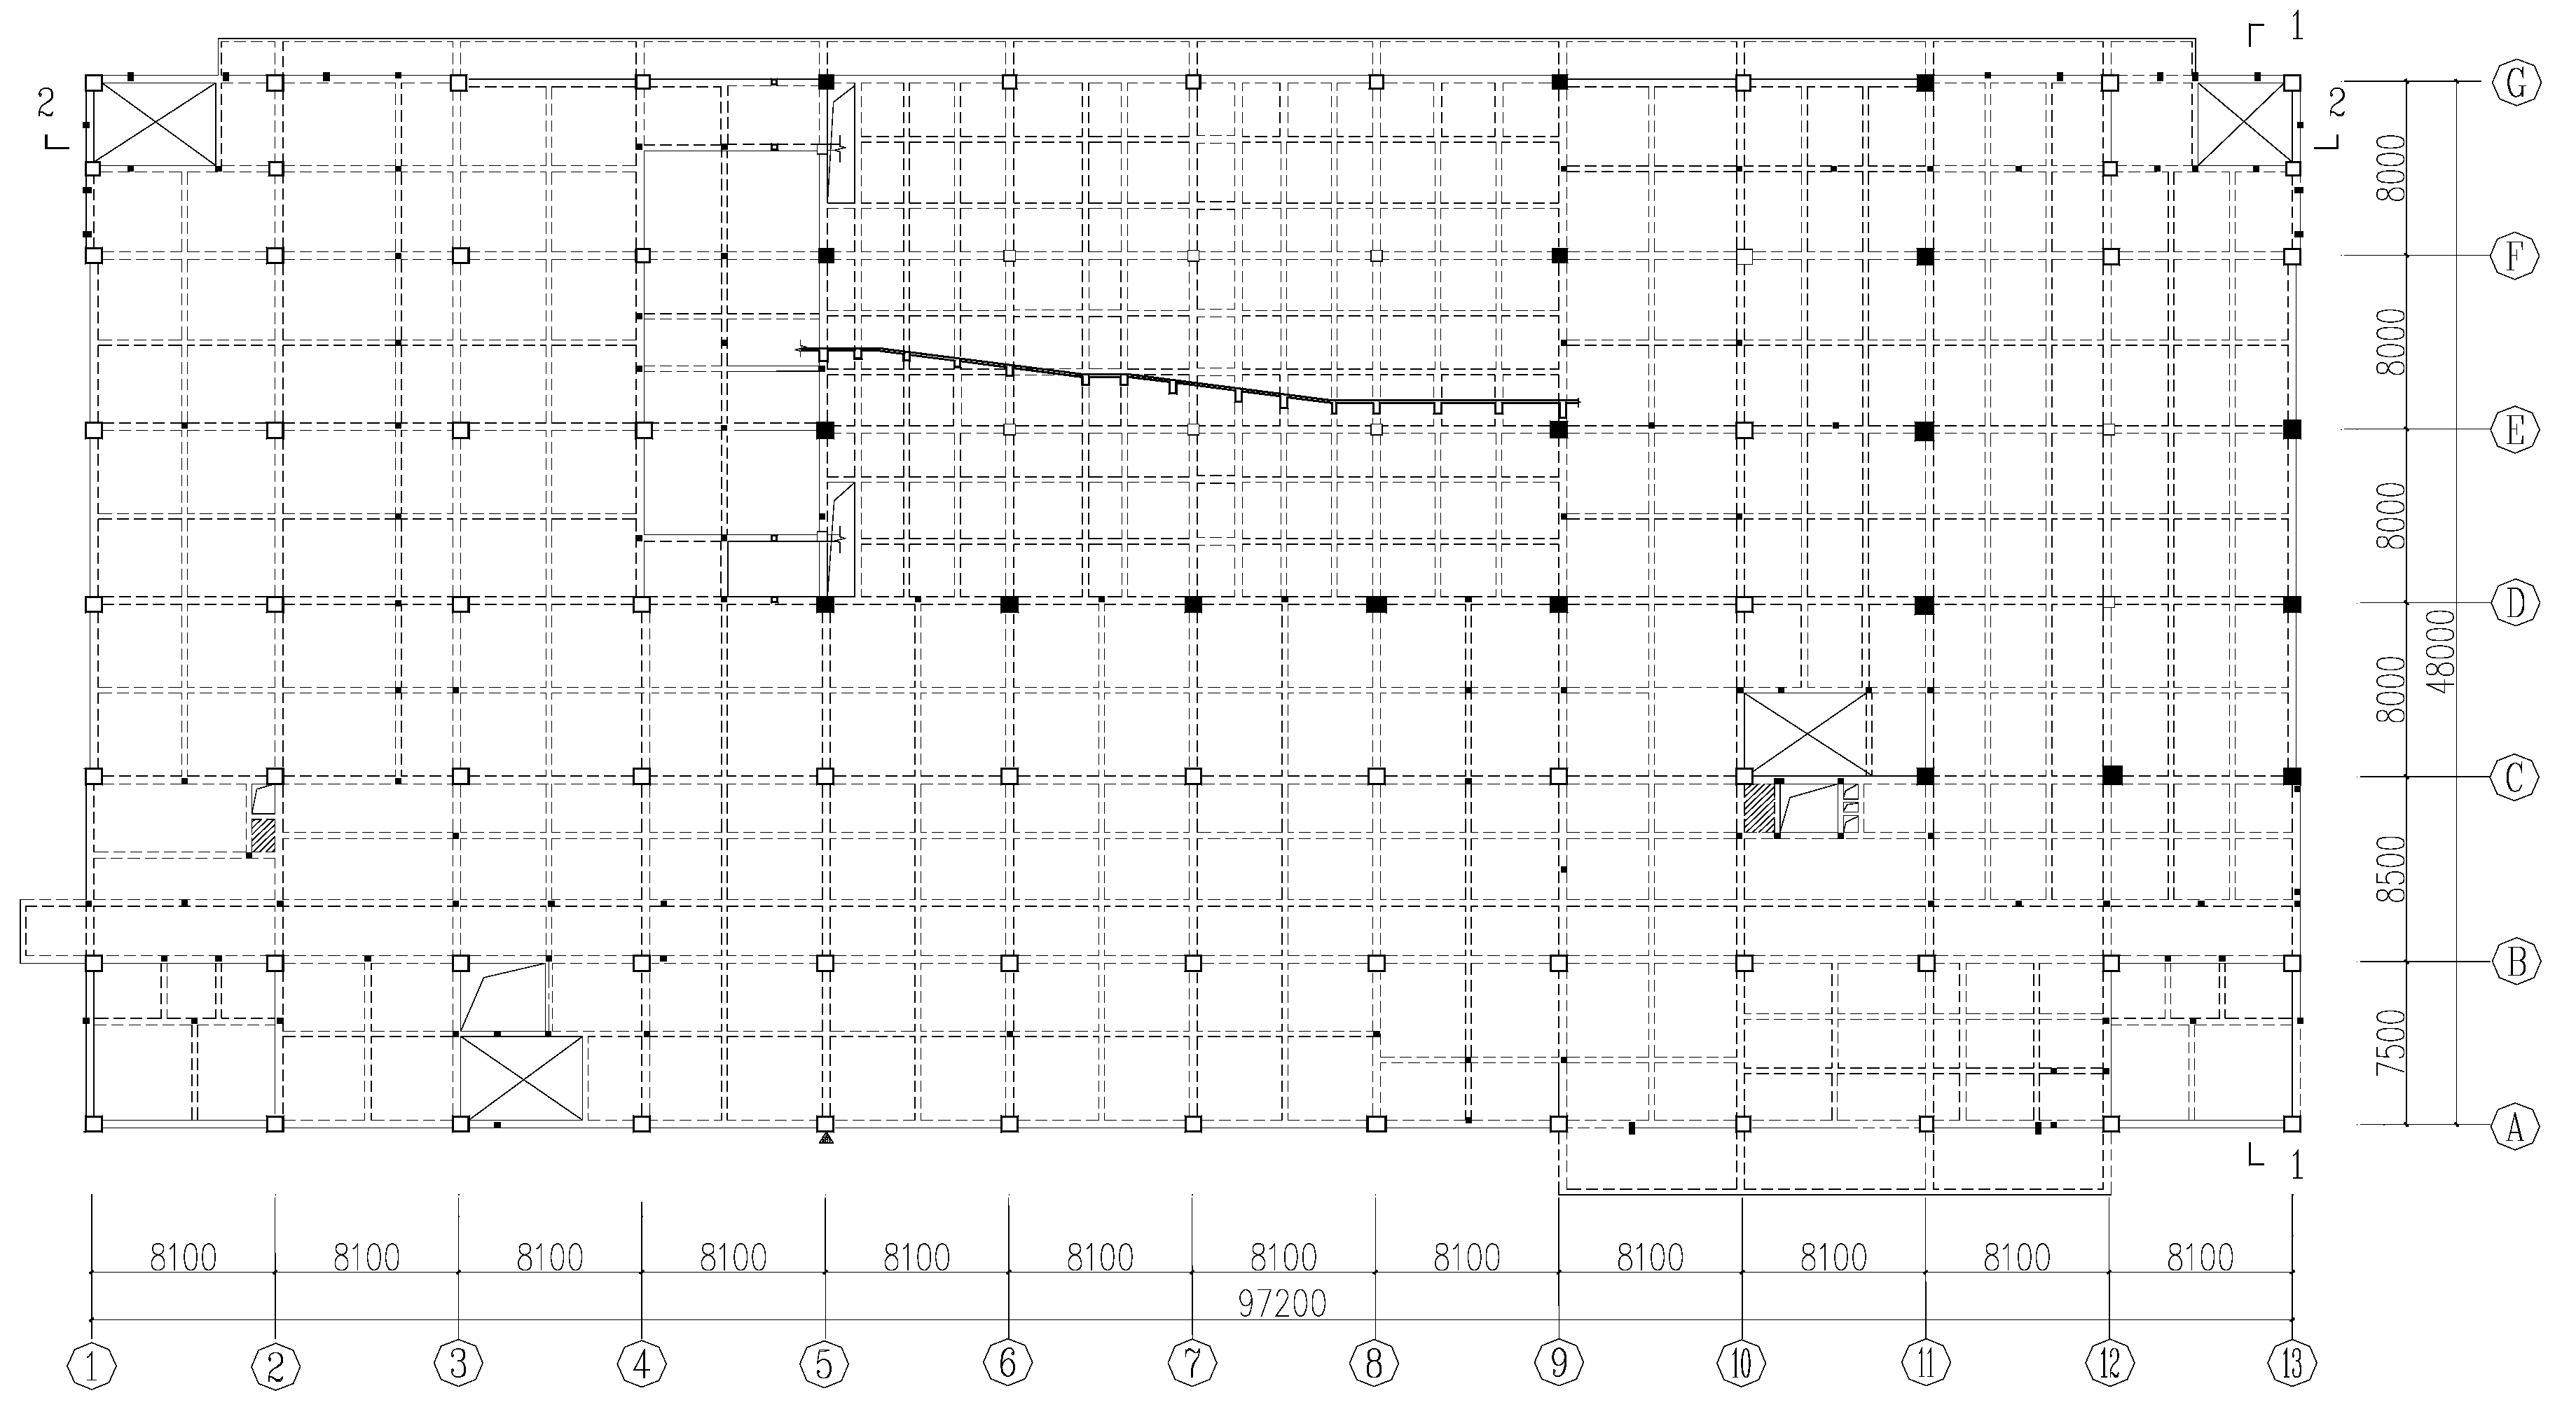
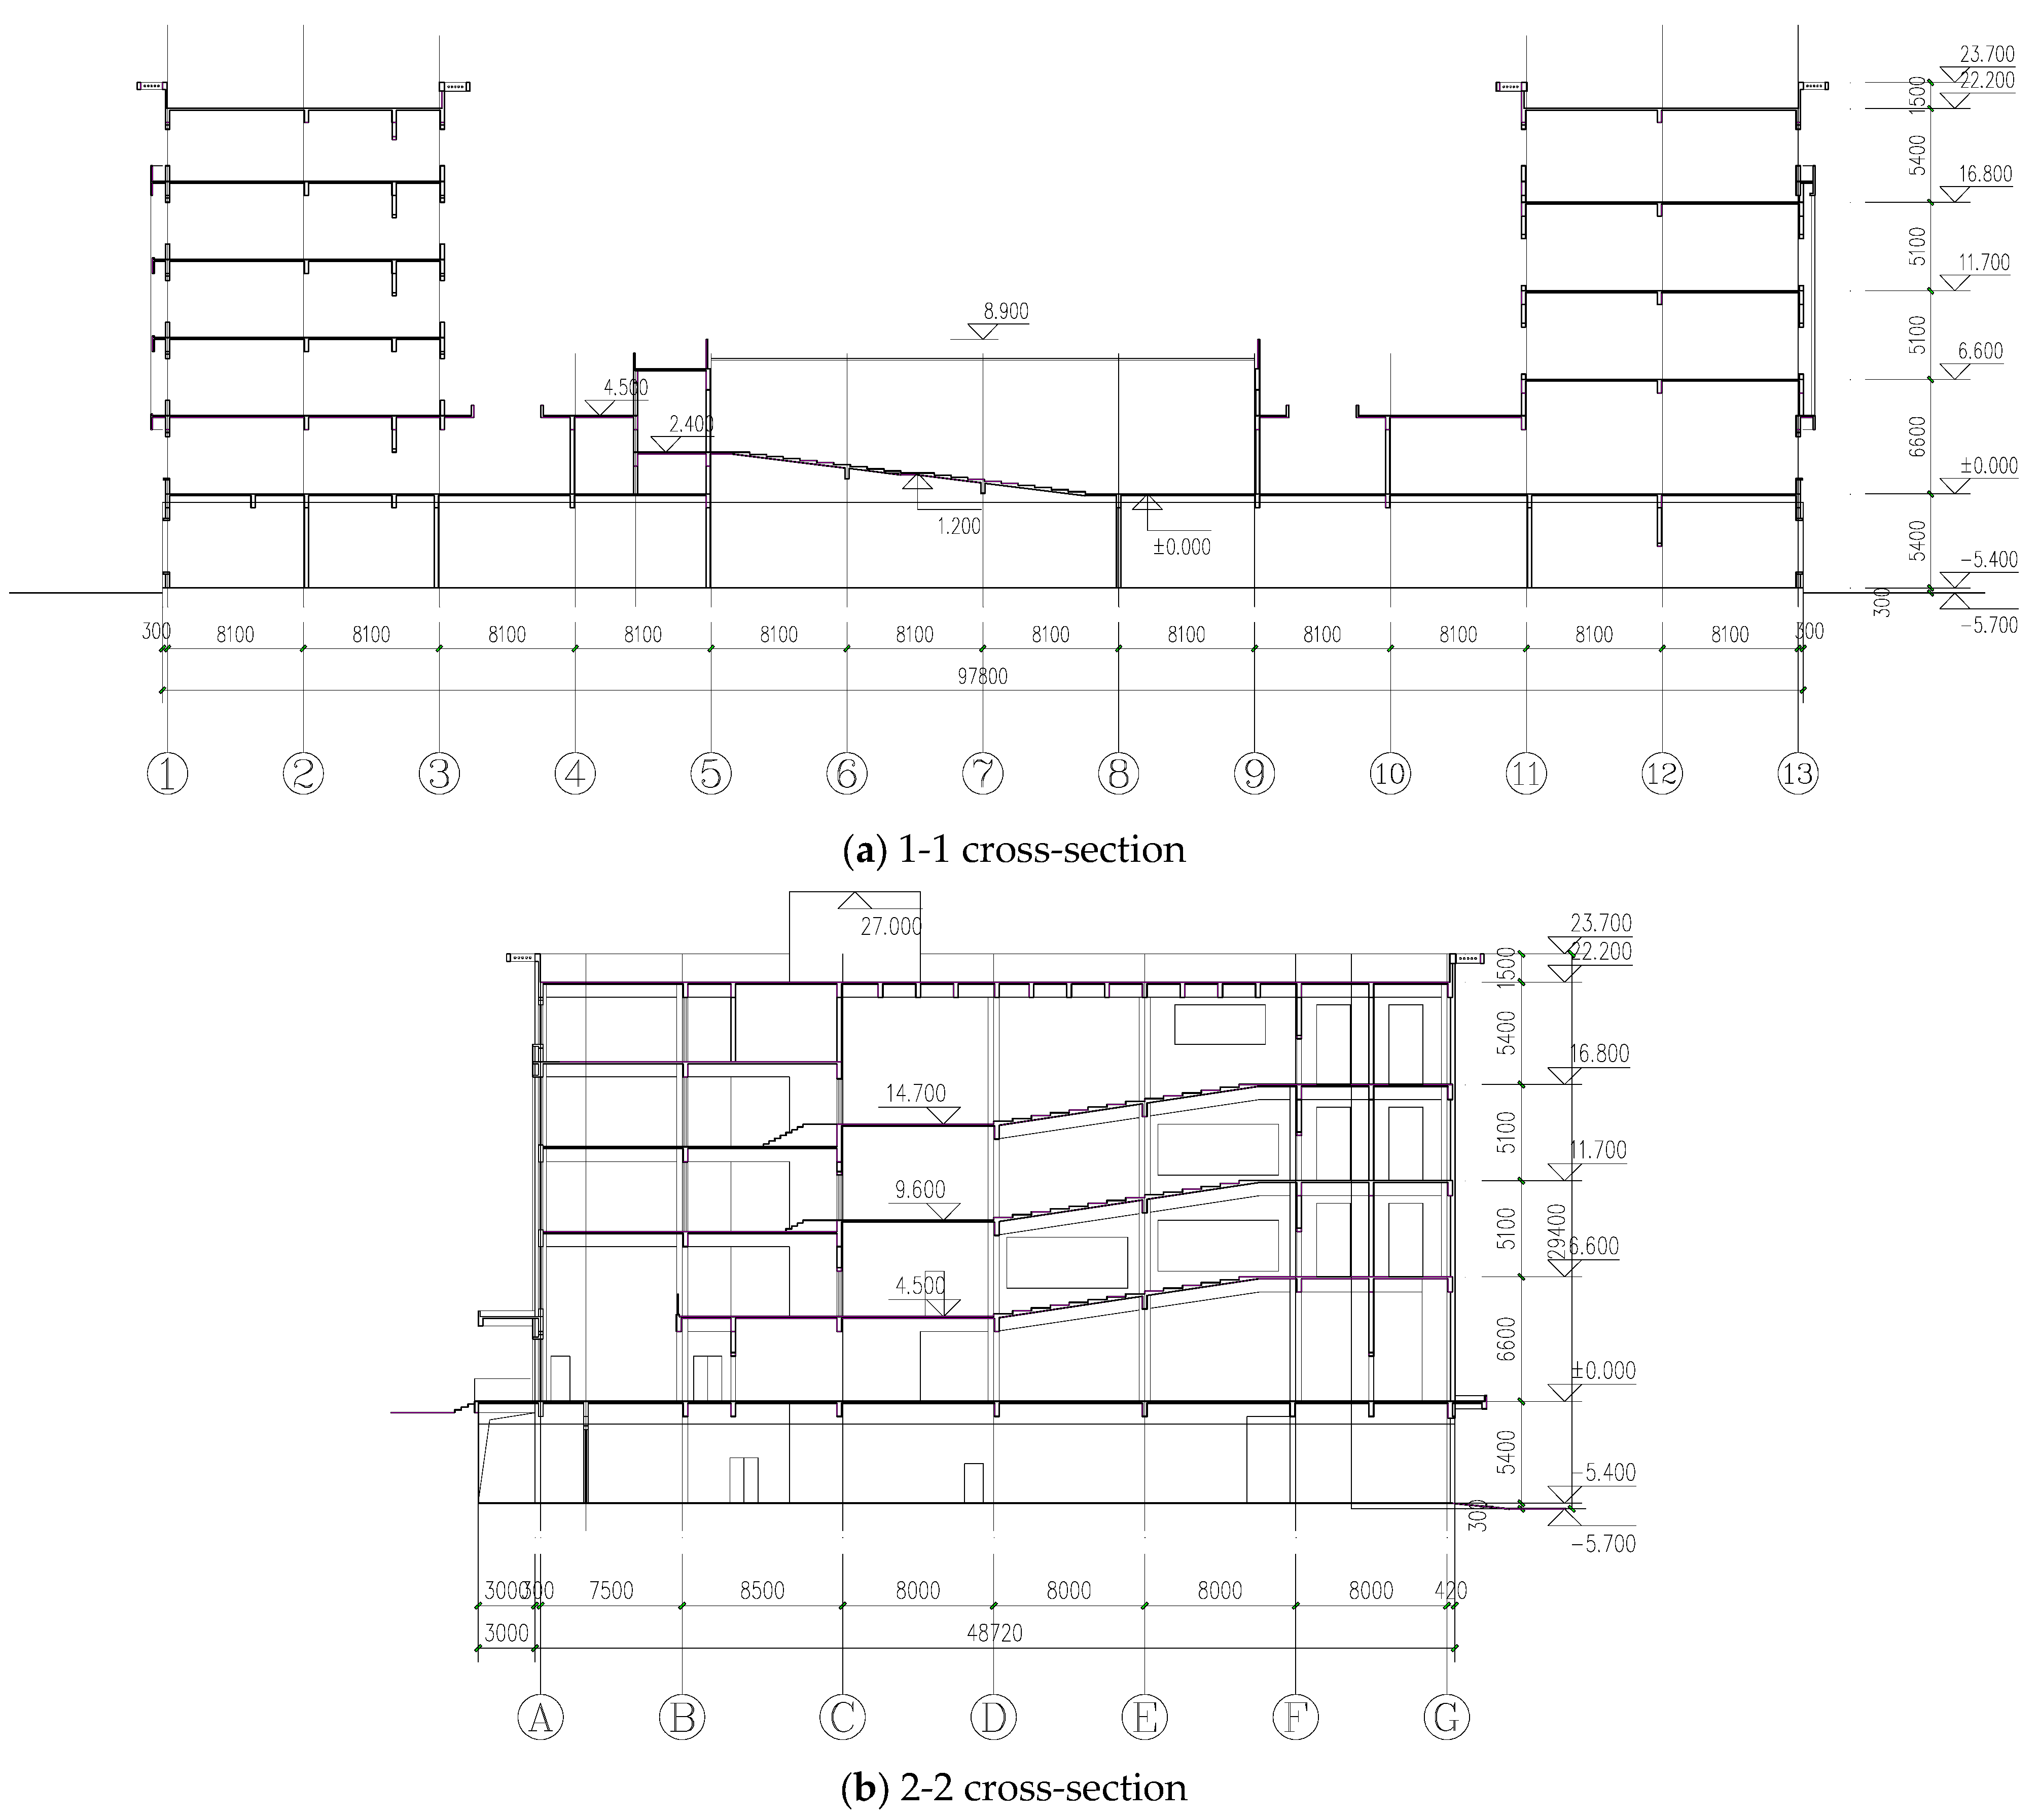
Figure 1 depicts the first-floor plan of the structure, and the shaded columns are ST-RC columns. The units in the Figure 1 are millimeters. Figure 2a,b illustrate the profiles of the staggered floors, where elevation is in meters and axis spacing is in millimeters. The second-floor staggered section in the 1-1 cross-section shows an elevation difference of 2.1 m between the staggered floors (Axis 5, Axis 9, and Axis 11). In the 2-2 cross-section, the third and fourth floors are staggered, with the third floor staggered by 0.6 m and the fourth by 1.2 m (Axis C, Axis D, and Axis E). To address the issue of local short columns with low ductility, ST-RC columns are installed on staggered floors.
The concrete strength class is detailed in Table 1, indicating the standard value of concrete cubic compressive strength (MPa), and the steel pipe specification was Q345. The section design parameters for the beam and column members are listed in Table 2, Table 3 and Table 4 and C is the symbol for HPB400 grade steel reinforcement. The thickness of the concrete protective layer for beams and columns is 25 mm and 30 mm, respectively.

2.2. Model Building

2.2.1. Material Constitutive Determination

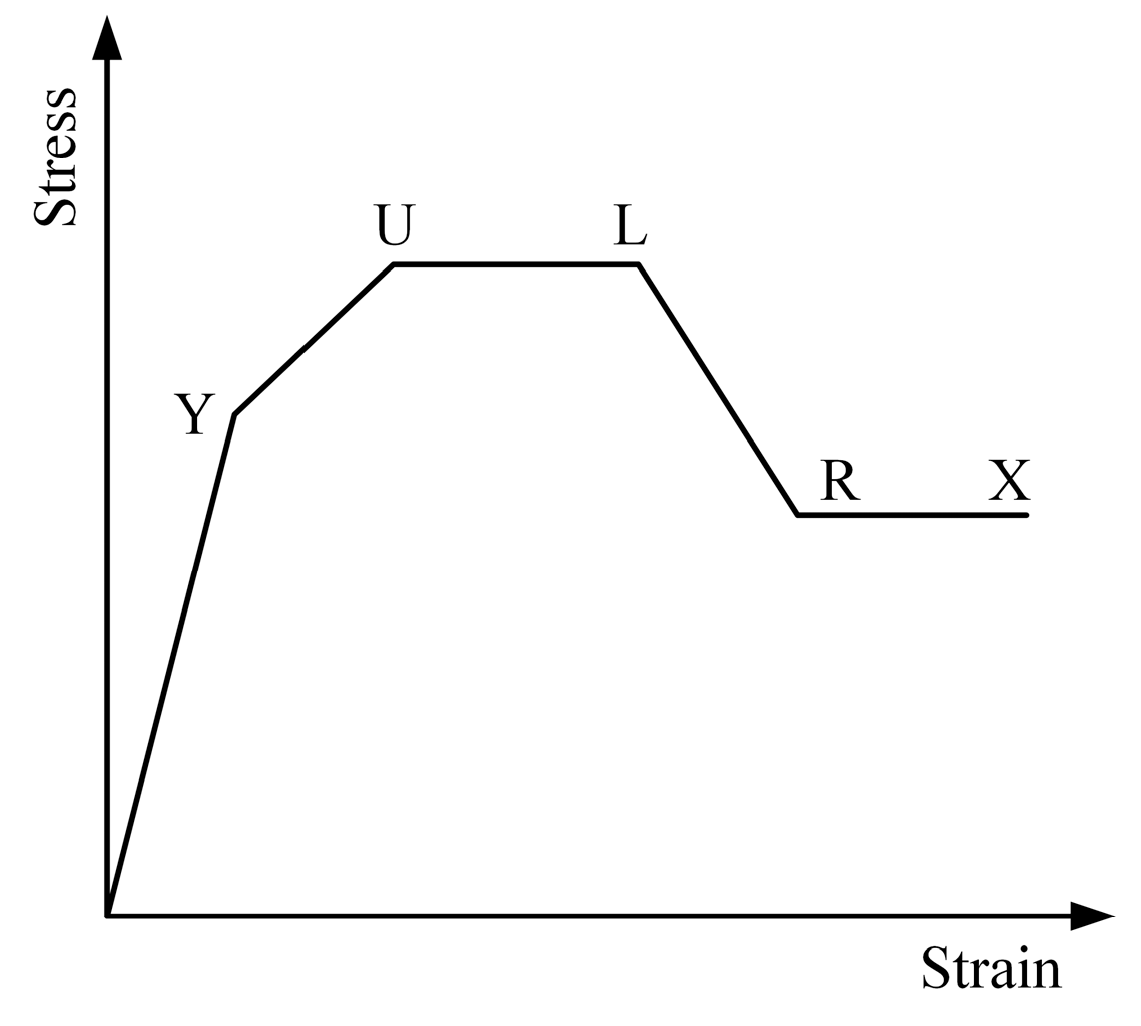
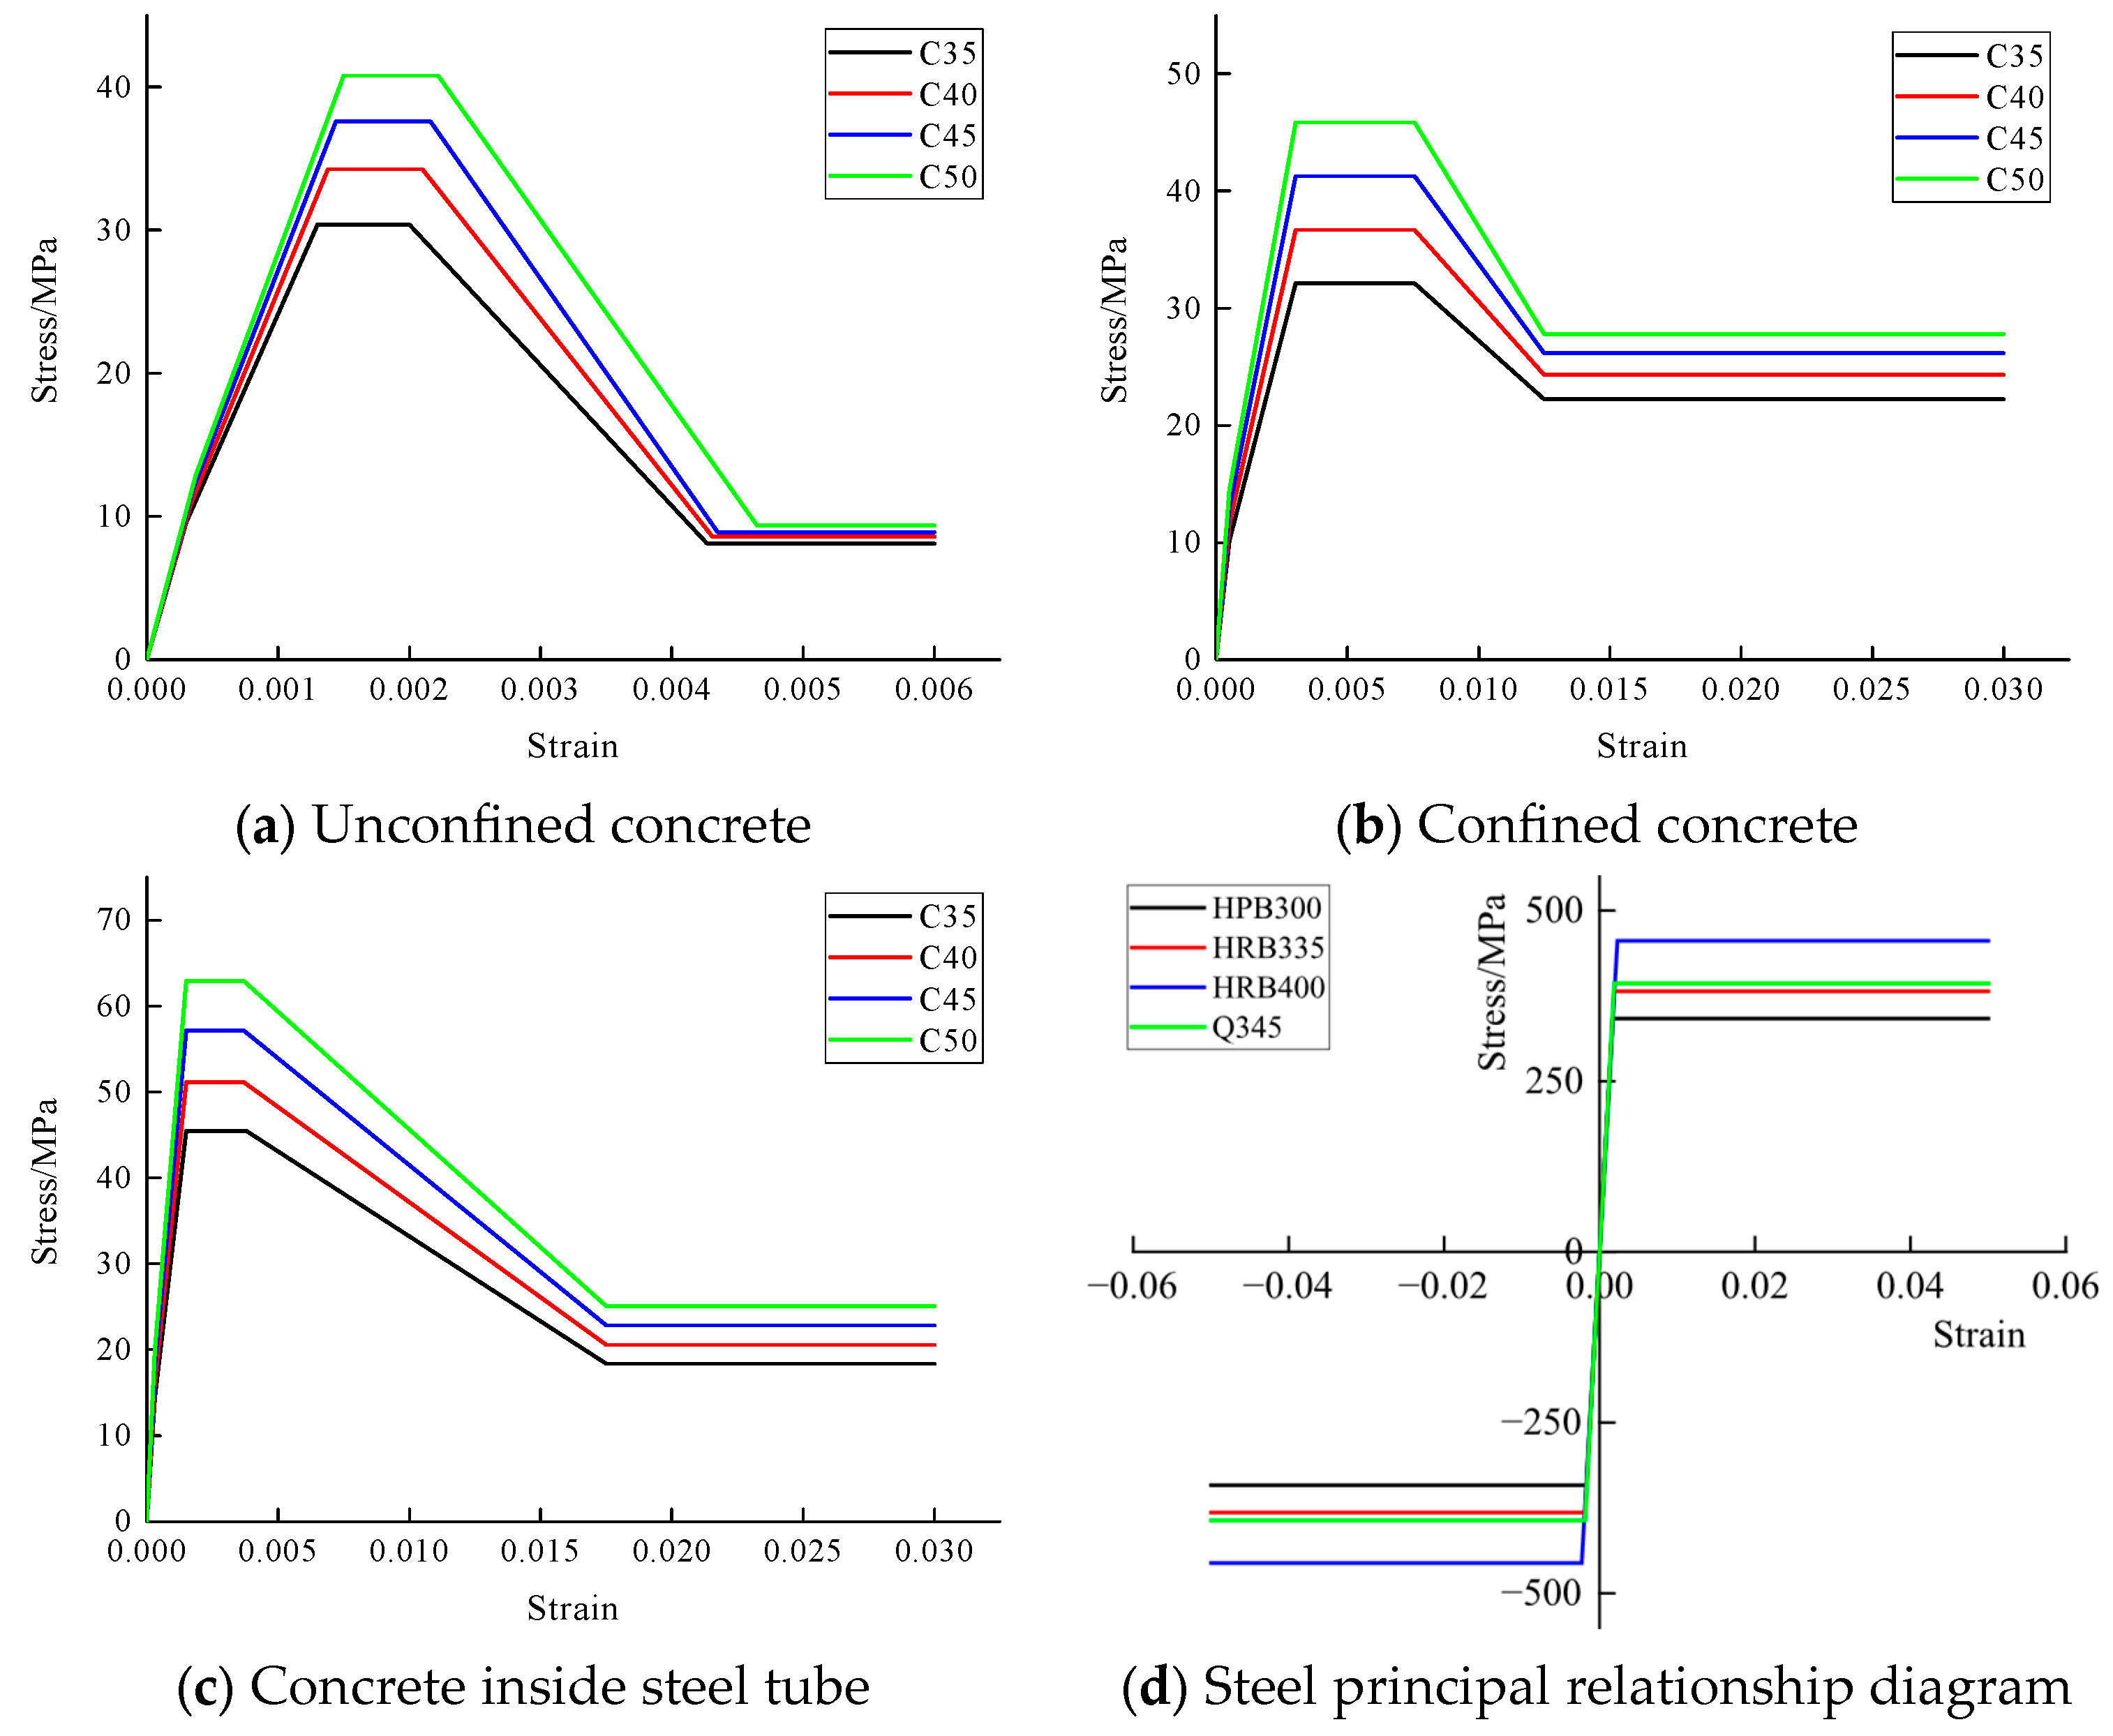
For staggered floor structures incorporating ST-RC columns, the constitutive model for concrete is defined as follows: unconfined concrete outside the stirrup, confined concrete inside the stirrup, and concrete inside the steel tube were based on the Simple model [31], Mander model [33], and the uniaxial compression constitutive model for circular steel pipe concrete proposed by Han [34]. Because the PERFORM-3D 8.0 software provides only generalized material constitutive skeleton curves, three kinds of concrete constitutive curves for four different strength classes require fitting. The selected curves consider strength loss without tension consideration, and the skeleton curve is shown in Figure 3, where point Y is the yield point of the concrete, and the concrete strength enters into the plateau stage starting from point U. Point L indicates the end of the plateau stage, and thereafter the concrete strength enters into the degradation stage. Point X is the failure point of the material, which is also the point at which the program stops calculating, and R is the starting point of residual bearing capacity. The fitted concrete constitutive curves are shown in Figure 4a–c. The steel constitutive skeleton curve was selected from the “Elastic-Perfectly Plastic” model without considering strength loss, as depicted in Figure 4d.
Considering that significant inelastic deformation of materials can lead to performance degradation and strength loss, the hysteretic characteristics of materials still need to be considered in the defined stress–strain relationships of steel and concrete. Based on the material constitutive models, PERFORM-3D accounts for the stress–strain hysteretic characteristics by defining a cyclic energy degradation factor “e” (Energy Factor), which can reflect the energy dissipation capacity of the hysteretic loop under cyclic loading. Generally, as the earthquake action continues, the deformation of members increases accordingly, resulting in more severe stiffness degradation. Moreover, with the continuous action of reciprocating loads, the damage degree of members gradually accumulates, and thus their plastic energy dissipation capacity will gradually weaken. Therefore, as the strain of materials increases, the energy degradation factor decreases correspondingly.
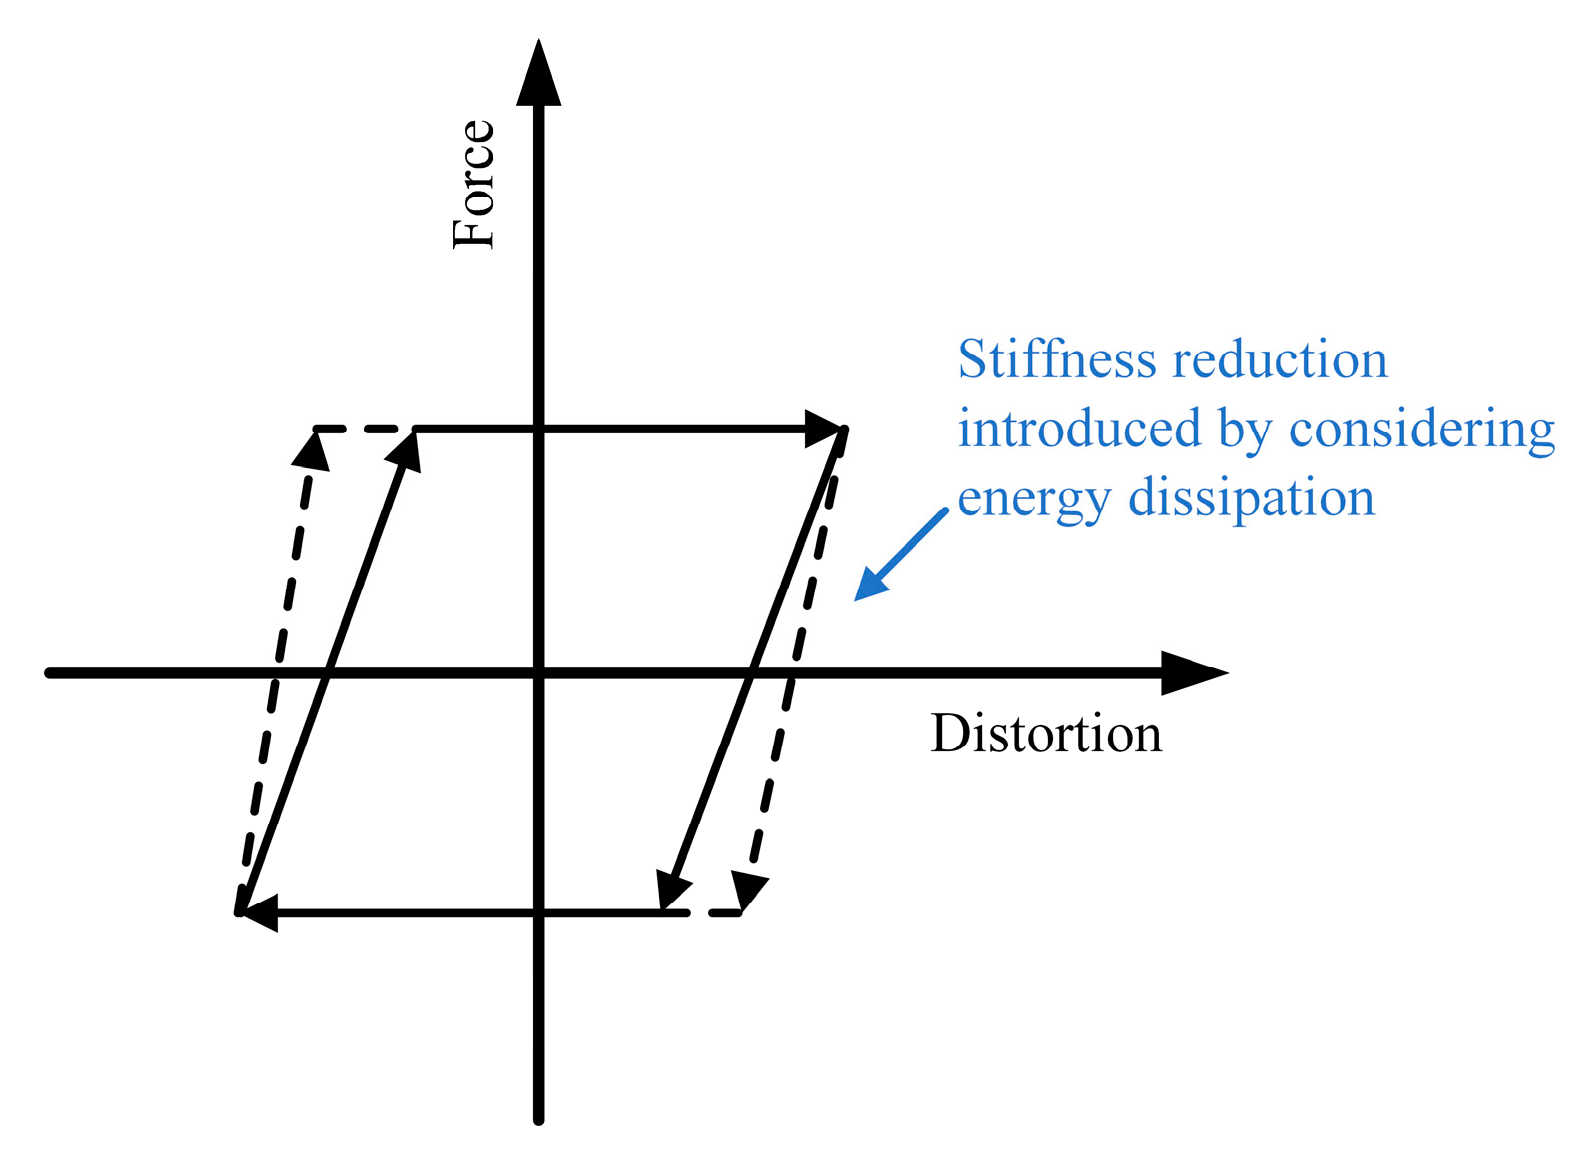
Concrete has weak energy dissipation capacity, and the schematic diagram of its compressive hysteretic model is shown in Figure 5. When the factor “e” is 0, there is no energy dissipation. Different scholars have significant differences in the value of the energy degradation factor. This paper refers to the values in Reference [34]: for confined concrete and concrete inside steel tubes, the values at points Y, U, L, R, and X are 1.0, 0.8, 0.4, 0.1, and 0.05, respectively; for unconfined concrete, considering its low hysteretic energy dissipation capacity, the value at point Y is 1.0, and the value after point Y is 0.05.
Steel has a strong energy dissipation capacity, so its hysteretic loops is full in shape. Figure 6 shows the ideal elastic–plastic hysteretic model with stiffness degradation, i.e., when the “EPP” model is adopted for steel. Given that the “EPP” model is used for the steel constitutive relation in this paper, with reference to Reference [35], the energy degradation factor “e” for steel reinforcement and steel tubes is set to 1.0 at the yield point and 0.85 at the maximum strain point. Three additional points are determined by linear interpolation between these two points, with their energy degradation factors “e” defined as 1.0, 0.95, and 0.9, respectively.

2.2.2. Fiber Elements Setting

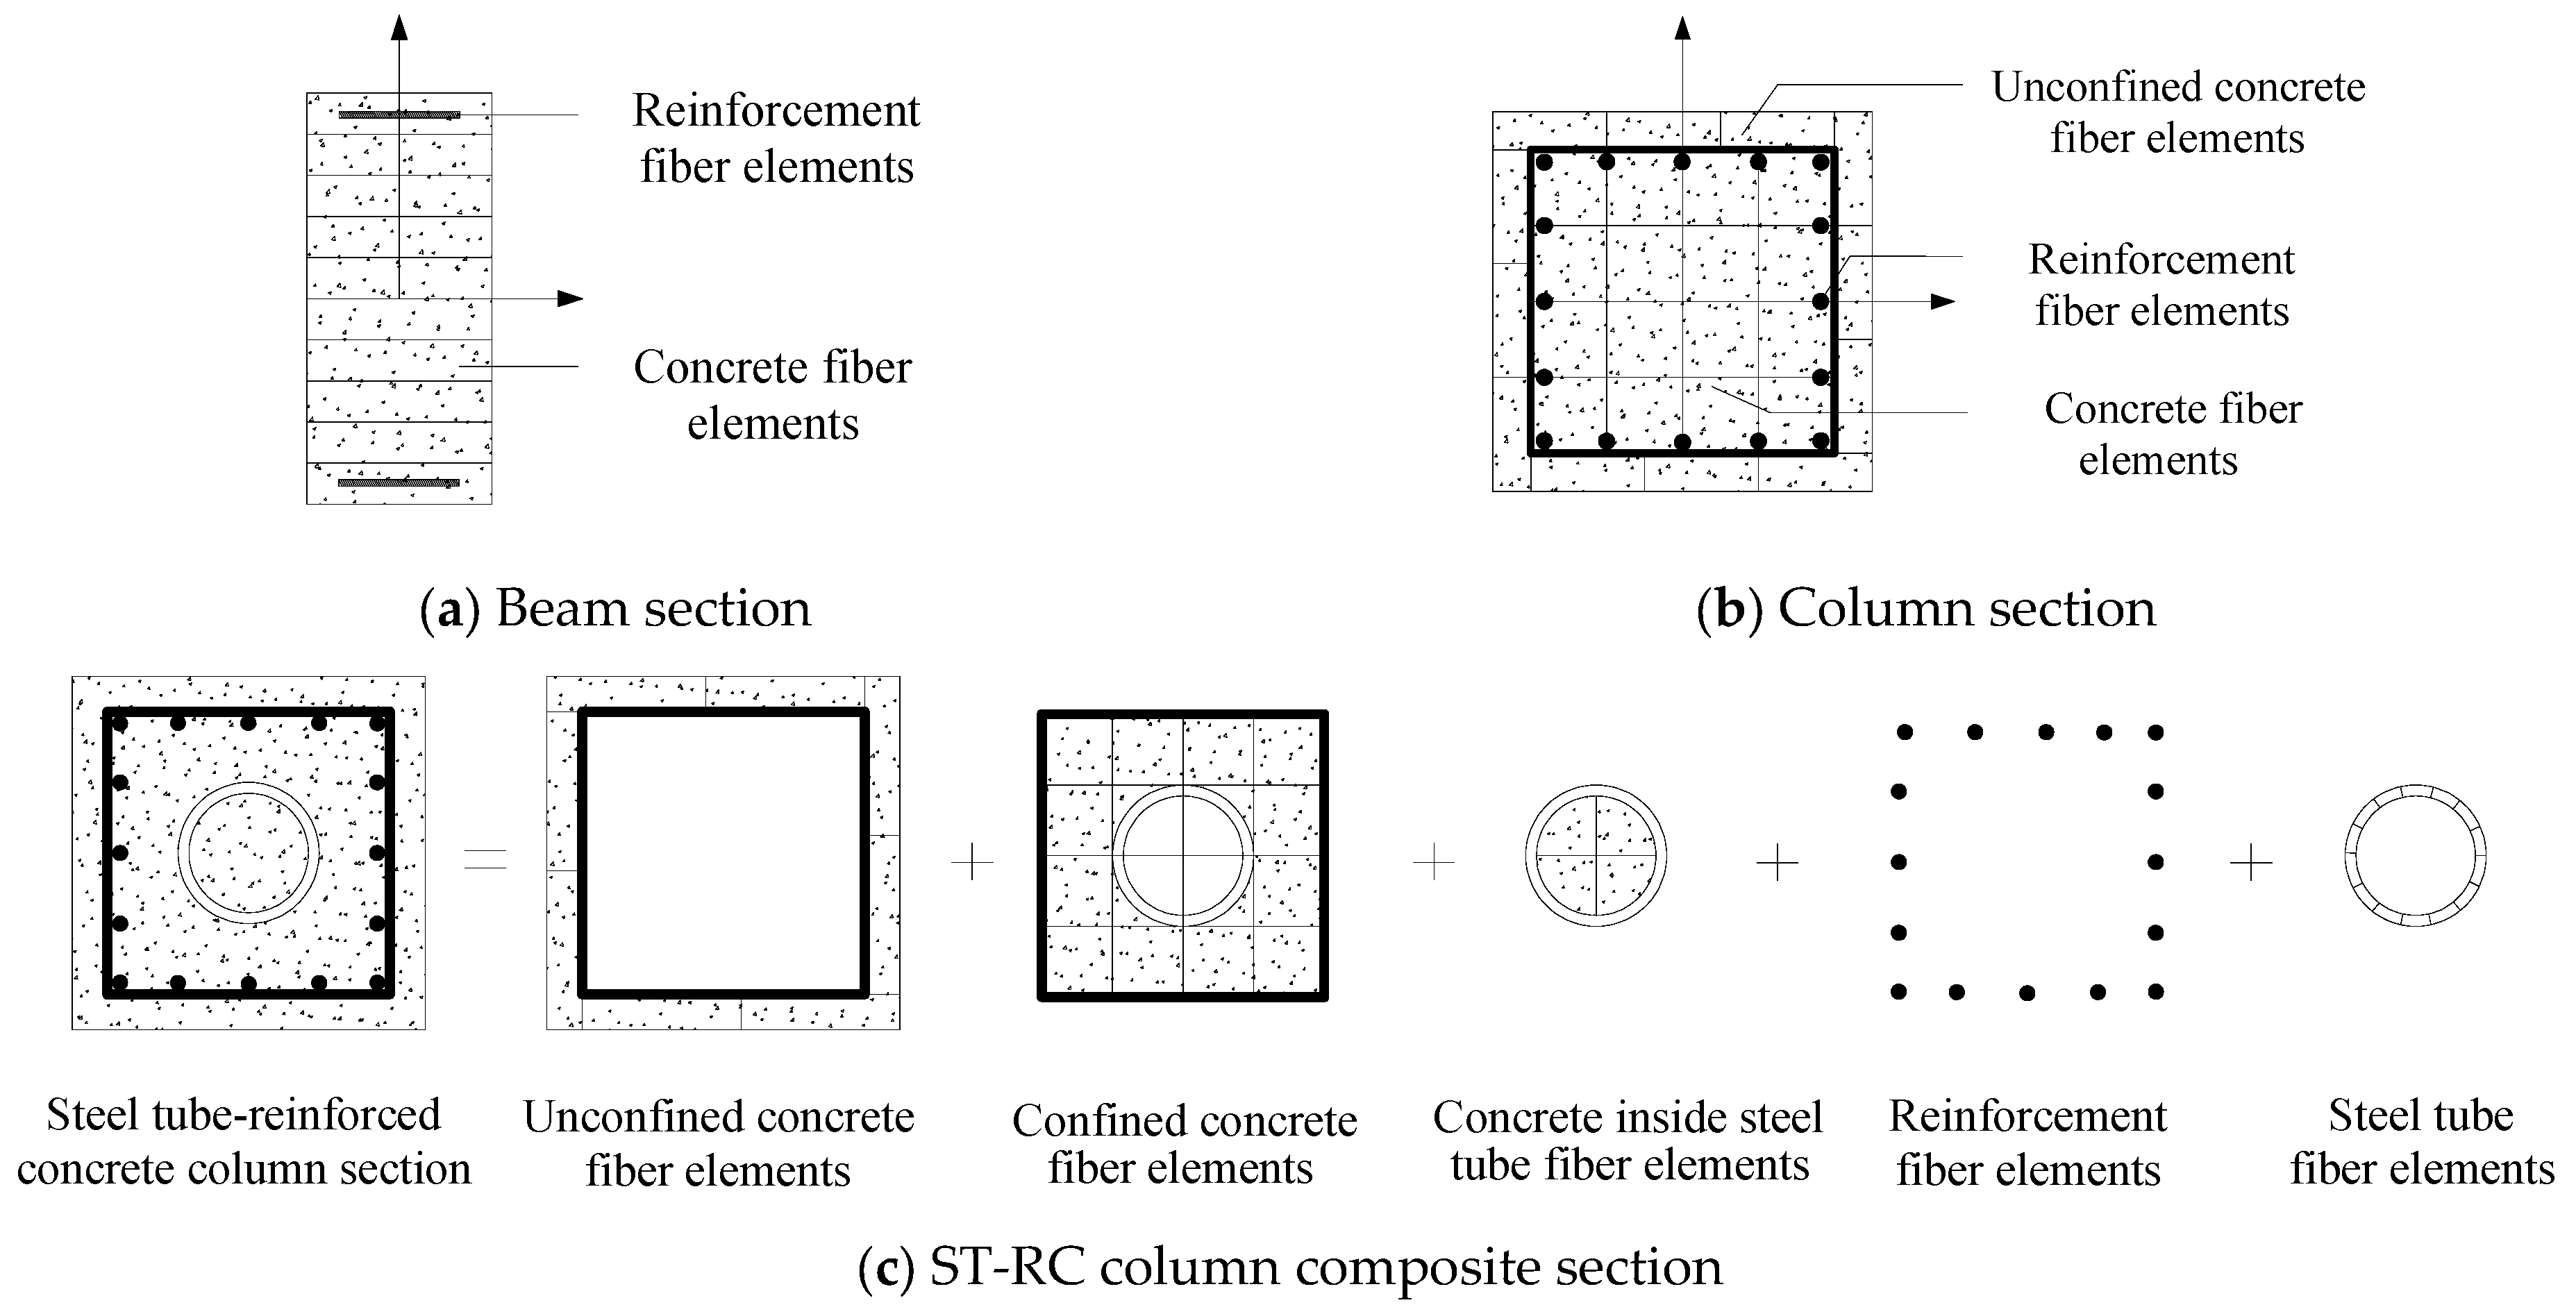
The distributed plastic hinge model based on fiber elements is suitable for high-precision analysis, simulation of complex members, or performance evaluation of key members. In this study, the fiber element model that can better consider nonlinear properties is adopted, which can significantly improve the analysis accuracy compared with the plastic hinge element. The beam member only considers the unidirectional P-M effect and was divided into 12 fibers along its longitudinal section—one reinforcement fiber at the top and one at the bottom, with 10 concrete fibers longitudinally in the middle, as depicted in Figure 7a. The division of the column member considers the P-M-M effect in two directions; therefore, two-dimensional fiber elements are used. The unconfined concrete outside the stirrup was divided into three fibers on each side. The concrete in the core area inside the stirrup was divided into sixteen fibers, with five reinforcement fibers at the top and bottom and three on each side of the waist, totaling sixteen reinforcement fibers. The schematic diagram of the column section division is shown in Figure 7b.
The ST-RC column section was divided into eight fibers for unconfined concrete, sixteen fibers for confined concrete, four fibers for concrete inside steel tube, sixteen fibers for longitudinal reinforcement, and fourteen fibers for the steel tube. Notably, the area of the steel tube fibers was greater than that of the longitudinal reinforcement fibers. The fiber division diagram is shown in Figure 7c.

2.3. Validation of the Effectiveness Model for ST-RC Columns

2.3.1. Overview of the Test

In this study, two specimens, CSTRC2 and CSTRC5, from the axial compressive performance tests of ST-RC columns conducted by Jia et al. [35] and Liu et al. [36] from Huaqiao University, were selected for validation of finite element analysis. The specimens had a section size of 400 mm × 400 mm and a height of 1200 mm. The longitudinal reinforcement comprised 12 HRB335 grade steel bars with a diameter of 16 mm, and the stirrup adopted octagonal composite stirrups with a diameter of 8 mm of HPB300 grade, spaced at 100 mm. A hot-rolled seamless steel tube was used for the steel tube. The test loading device had a fixed end with a 50 mm × 50 mm steel mesh and a loading end with a 6 mm thick steel plate. The geometric dimensions of the specimens and reinforcement diagram of the ST-RC column [35,36] are shown in Figure 8.

2.3.2. Analysis of Model Validation Results

Following the method outlined in Section 2.2 for defining the concrete constitutive relationship in different parts of the ST-RC columns, the constitutive curves were plotted and fitted for the unconfined concrete, confined concrete, and concrete inside the steel tubes of specimens CSTRC2 and CSTRC5. The ST-RC column section was divided into fibers, and the elastic–plastic model of the ST-RC column was established using the material property values obtained from the tests. The parameters of specimen and steel are detailed in Table 5 and Table 6.
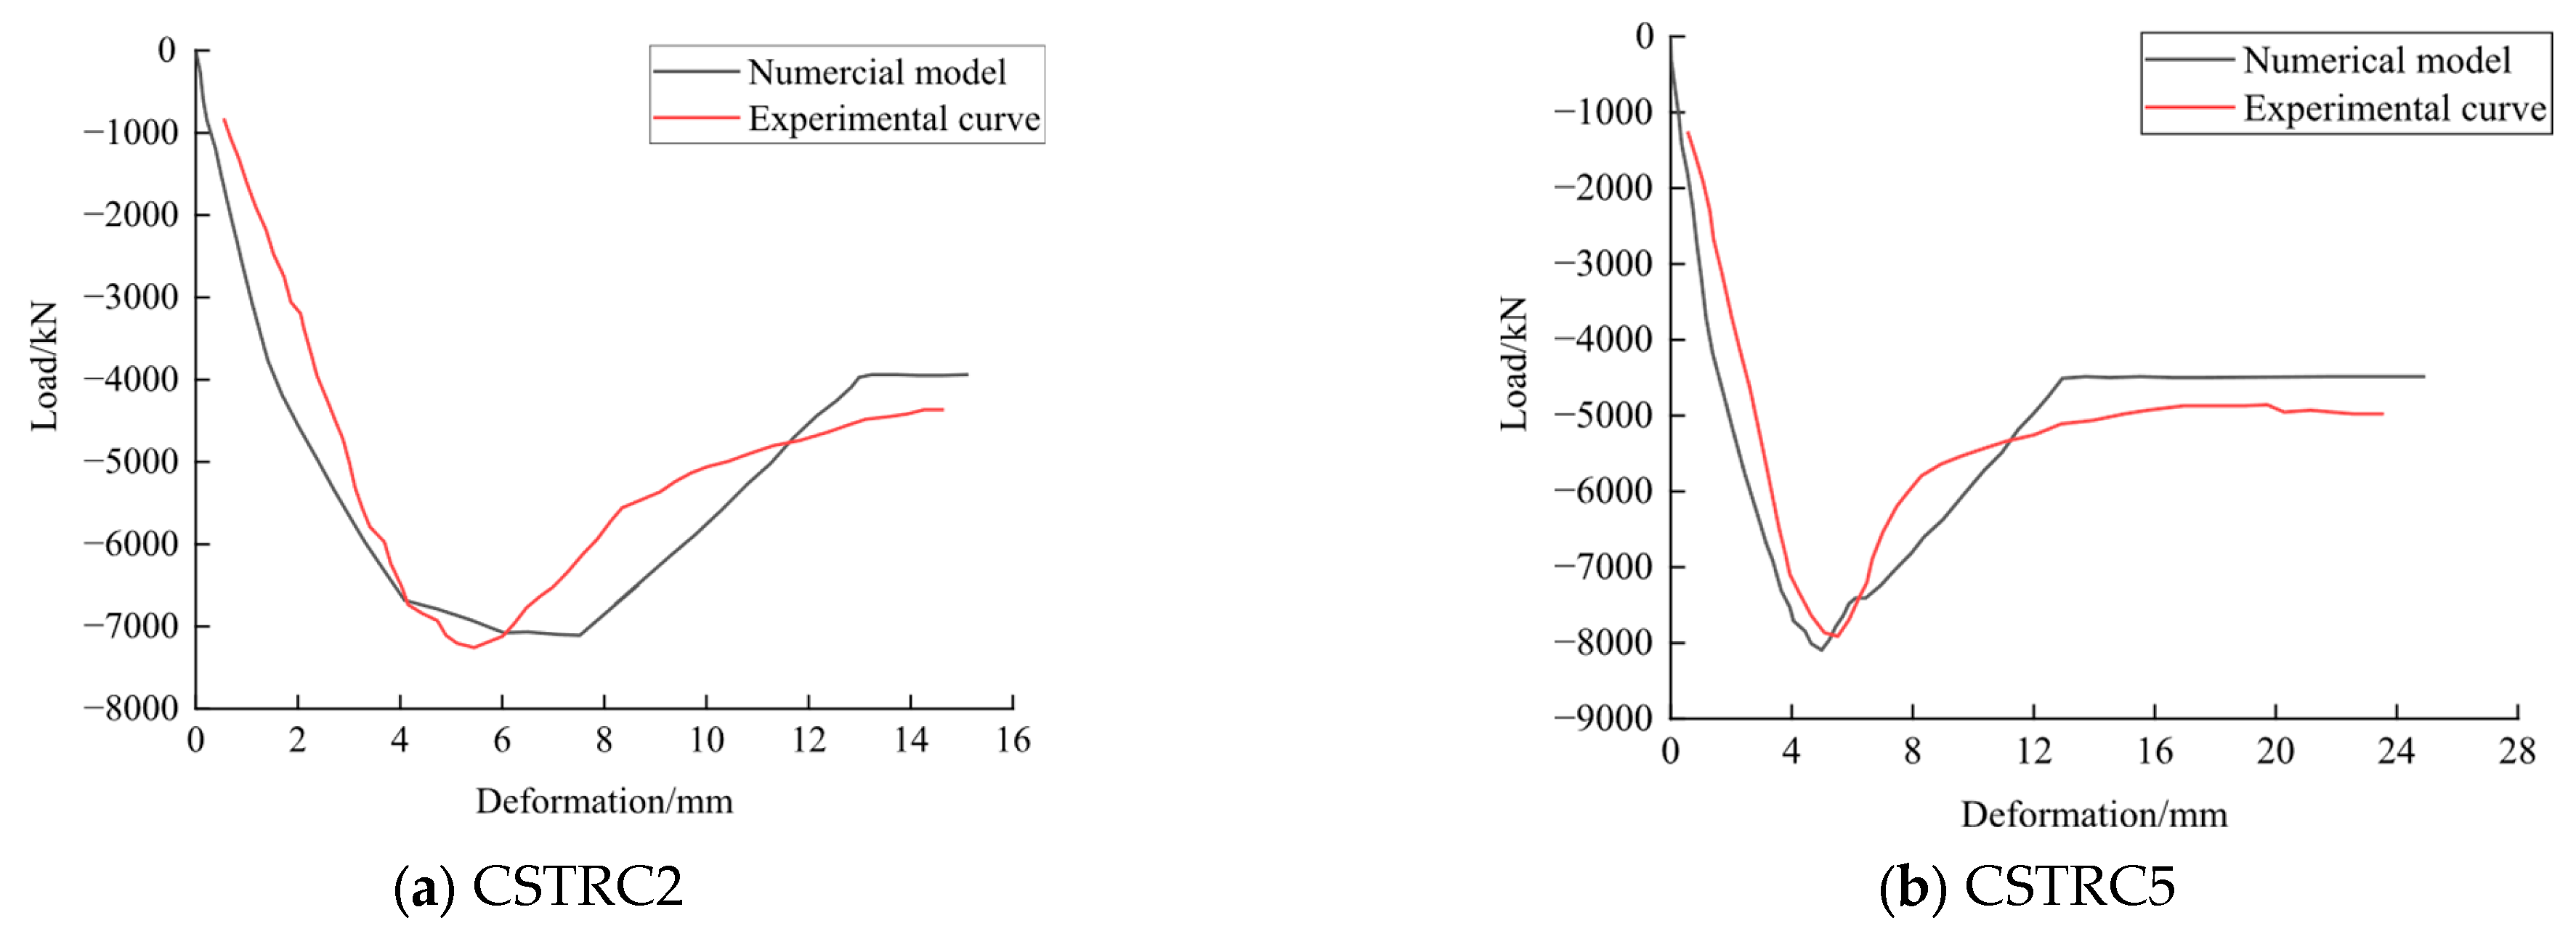
The displacement loading method was employed to simulate the test loading, and the comparison of the load–deformation curves is shown in Figure 9, illustrating an excellent fitting between the curves. Table 7 presents the peak load Nu from the test and the peak load Ncu from the finite element simulation, indicating a close alignment between the simulated and tested peak loads. Overall, the simulation results exhibited a small error, indicating the reasonableness and effectiveness of the material principal structure selection as well as the fiber division of the section.

2.4. Structural Modal Analysis

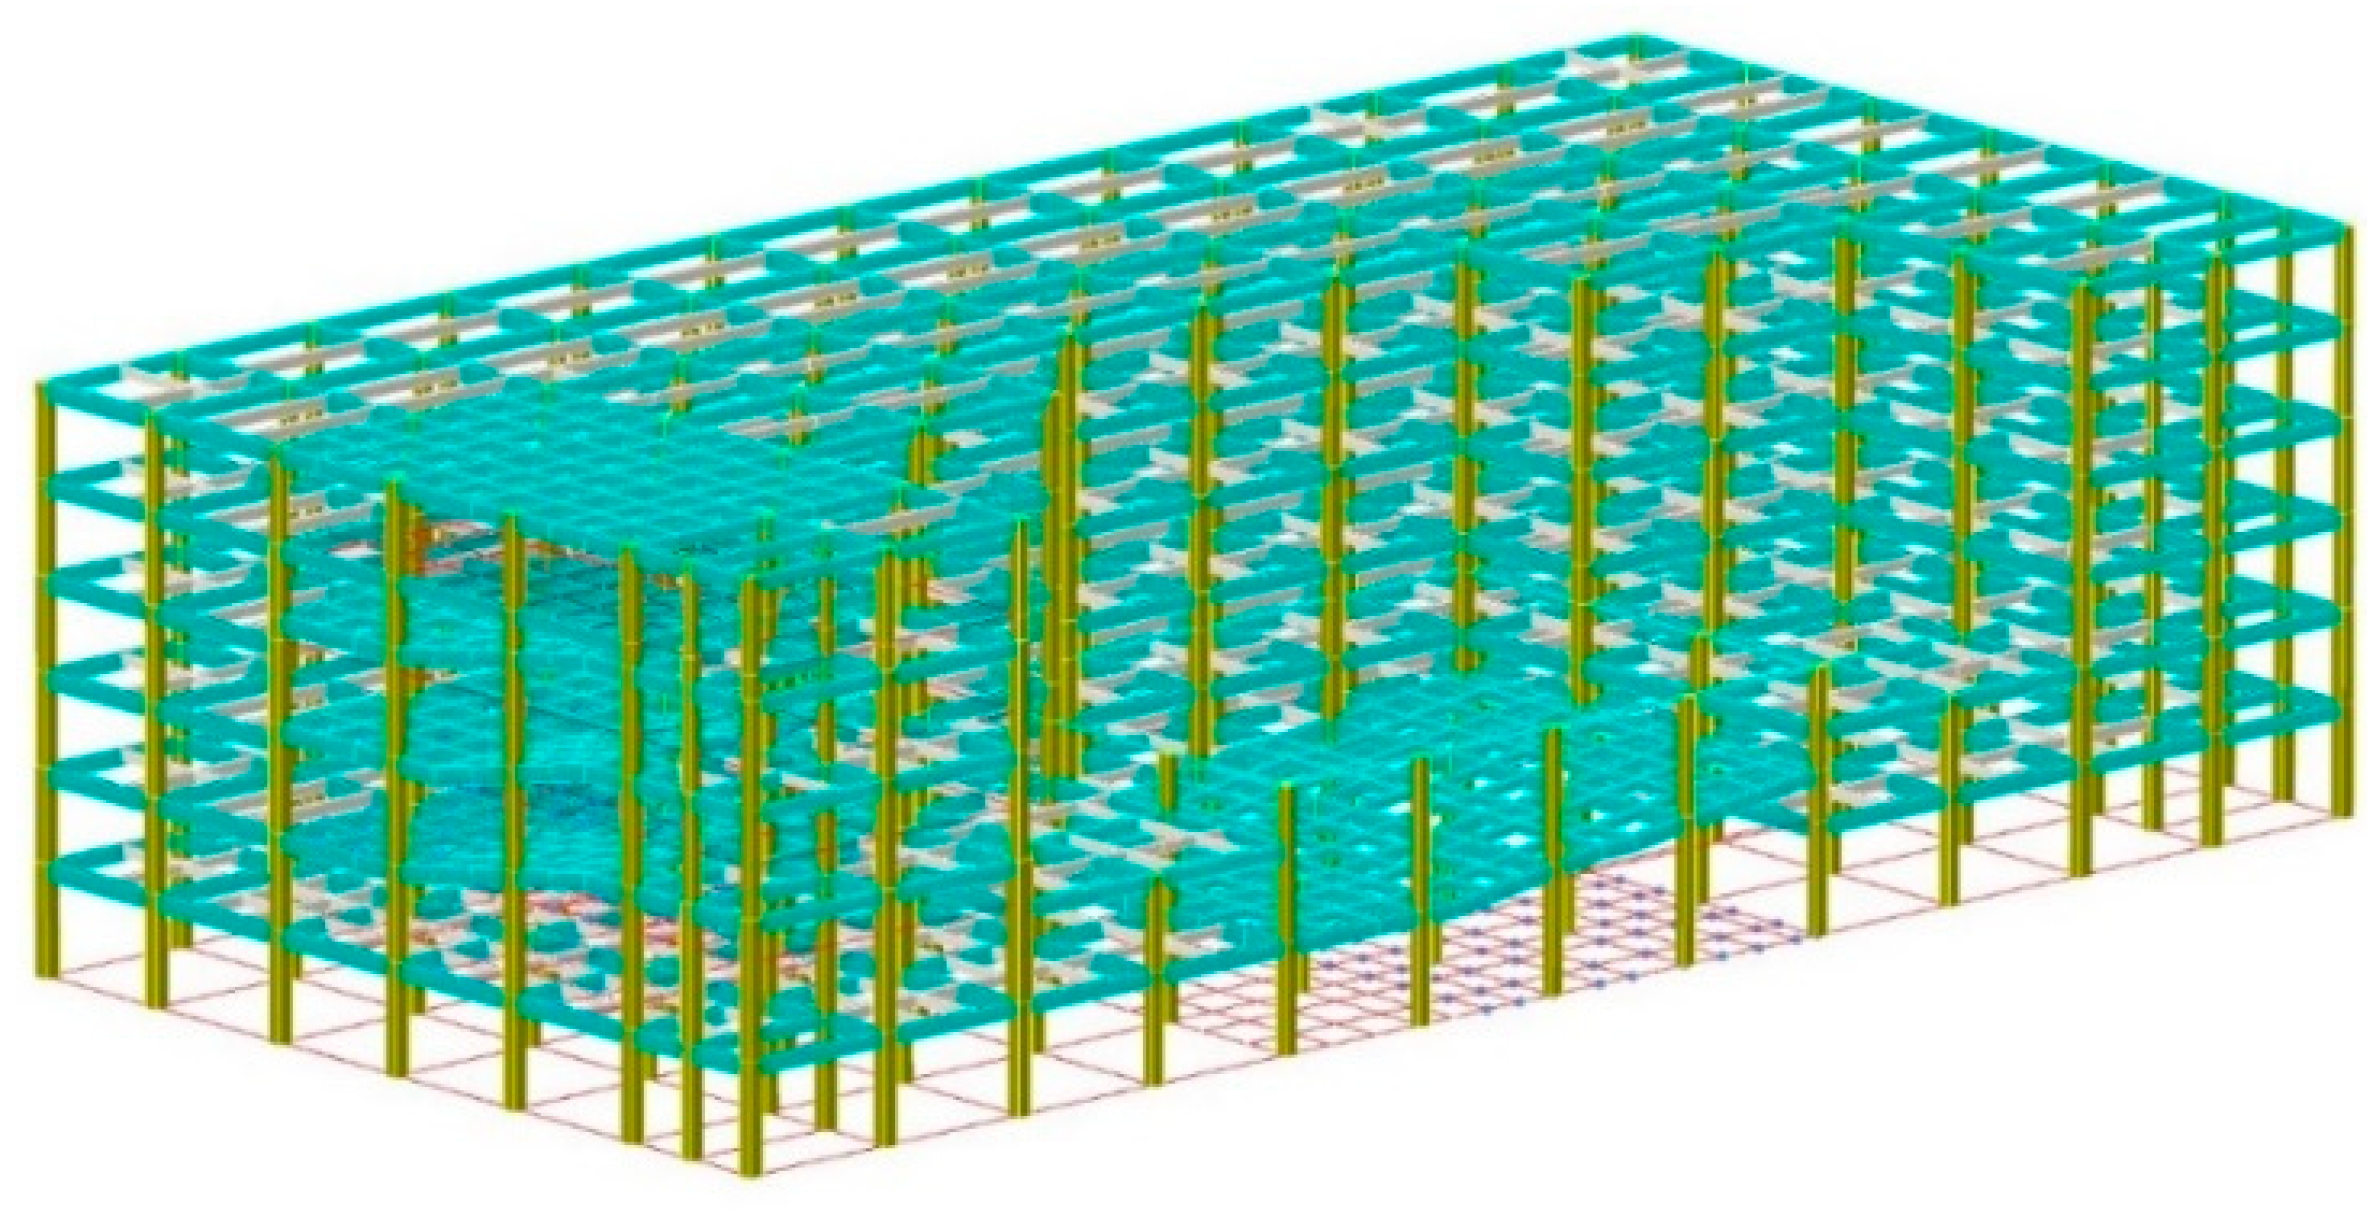
Based on the previous descriptions of material properties and modeling methods, finite element modeling was performed using Perform-3D software. Beam and Column Components were selected for beams and columns, with load parameters detailed in Table 8. In the entire study, the P-Delta effect was considered while large displacements were not, and gravity loads were applied prior to dynamic time–history analysis. The modal analysis of the structure was conducted using PERFORM-3D, and the established elastic–plastic analysis model is depicted in Figure 10 [37]. To validate the model’s effectiveness, the modal analysis results from the YJK V6 finite element software were compared, and the period difference was calculated as (|YJK-PERFORM-3D|/YJK) × 100%. The calculation results are presented in Table 9.
Based on the calculation results in Table 9, the first two orders of the structure represent the X- and Y- direction translations, respectively, and the third order corresponds to torsional vibration. For instance, the ratio of the first torsional period to the first translation period, as calculated by PERFORM-3D, was 0.83, meeting the requirements of the “Technical Specification for Concrete Structures of Tall Building” [38]. The maximum period difference between the first three vibration orders was 5.7%, indicating a small discrepancy between the modal period calculations of PERFORM-3D and the YJK model, confirming the correct establishment of the model.

3. Ground Motion Input

In this paper, seismic analysis is conducted using both natural ground motions and artificially synthesized ground motions, where the artificial waves are synthesized by simulating the response spectra specified in the code. For elastic–plastic analysis, the number of actual ground motions should not be less than two-thirds of the total number [32]. Therefore, based on the seismic information of the engineering overview in this paper, five sets of natural waves are selected from the PEER database and two sets of artificial waves are generated by GM-Tools.
Only by adopting appropriate seismic waves can the reference-worthy responses of structures under real earthquake actions be calculated. Therefore, selecting reasonable seismic waves requires considering their spectral characteristics, duration, and amplitude. The spectral characteristics of ground motions are generally represented by acceleration response spectra. Using GM-Tools V9 software, seismic waves whose spectral characteristics best match the code-specified response spectra are selected based on the first three natural periods of the structure. Modal analysis shows that the first natural vibration period of the structure is 1.252 s, and five times that is 6.26 s. After truncating the wavelength of the original seismic waves, the total duration of the seismic waves ranges from 16 s to 49 s, and the effective duration ranges from 15 s to 48 s, which meet the requirements. The maximum acceleration is usually used as the index to describe the amplitude of ground motions. To make the selected natural waves consistent with the peak value corresponding to the fortification intensity, it is necessary to adjust the maximum acceleration of the natural waves using GM-Tools software.
According to the above principles, the basic information of the original seismic waves is shown in Table 10. A comparison of the multi-wave response spectrum with the canonical response spectrum is shown in Figure 11, from which it can be seen that the multi-wave response spectrum matches the code response spectrum curve to a high degree [39]. Table 11 displays the deviation statistics for the spectral values of the ground motion response spectrum and the canonical response spectrum at key structural periodic points. The average seismic response spectrum curves of the seven seismic waves compared with the canonical response spectrum of the first three vibration modes showed differences of less than 0.2. This indicated the statistical consistency and confirmed the suitability of the selected seismic waves.
The structural seismic response varies significantly due to the incidence angle of seismic waves. The principal axes of the structure, designated as 0° and 90°, serve as fundamental reference directions for seismic response analysis. However, it should be noted that actual seismic wave propagation during earthquakes exhibits complex directional characteristics that rarely coincide precisely with the structural principal axes. The angle between the line connecting the center of mass and the center of rigidity of the staggered floor structure relative to the X-axis direction of the structure is calculated using YJK software, and the calculated angle is 30°. Thus, the seismic wave incidence is the positive angle of the connecting line, i.e., 60° with the structure. Therefore, in the “Earthquake Direction in Plan” section of Perform-3D software, the seismic waves are input in directions with angles of 0°, 30°, 60°, and 90° relative to the H1 direction of the structure, respectively. Through systematic analysis of structural seismic performance at these specified angles, critical vulnerabilities under multidirectional seismic excitation can be identified, thereby enabling a more comprehensive evaluation of the structure’s overall seismic capacity. The structure was designed for a typical seismic intensity of 8 degrees. Considering rare earthquakes, a bidirectional horizontal ground motion input was adopted. The seismic wave in the secondary direction was the same as in the main direction but at a 90° angle, with a peak acceleration of 0.85 times that in the main direction. The peak acceleration of the seismic wave in the main direction was adjusted to 400 cm/s2, and in the secondary direction, it was adjusted to 340 cm/s2 [32].

4. Seismic Performance Evaluation Considering Ground Motion Input Angles

For a long time, the seismic design philosophy of “three-level fortification and two-stage design” has been widely adopted. This approach primarily focuses on ensuring life safety when structures are subjected to seismic actions. With societal progress, buildings no longer merely serve as shelters, and higher expectations have been placed on their seismic performance. This paper investigates deformation and failure mechanisms at both structural and member levels through a performance-based seismic evaluation. By establishing quantitative performance indicators for buildings under seismic actions, the proposed methodology ensures structural compliance with phase-specific performance requirements. Compared with conventional capacity-based design approaches, this evaluation method enables more effective utilization of structural performance potential.

4.1. Evaluation of the Overall Structure

4.1.1. Principles for Evaluating the Performance of the Overall Structure

(1)
Inter-story displacement angle
The inter-story drift ratio refers to the ratio of the maximum displacement between floors of a structure to the floor height, which reflects the stiffness of the structure and the overall elastoplastic deformation performance. Controlling the inter-story drift ratio can ensure that the stability of the structure meets the requirements. The structure to be studied in this paper is a frame structure, and its inter-story drift ratio limit is 1/50 [32].
(2)
Overall structural energy dissipation
Under earthquake action, the performance of a building undergoes a continuous degradation process, and the inter-story drift ratio, as an envelope value of seismic indicators [40], cannot measure the changes in this process. However, the proportion of overall nonlinear energy dissipation of the structure can reflect the degree of nonlinear response of the structure. Analyzing the proportion of energy values in the structure allows for the study of changes in structural performance, which is of great significance for the seismic performance evaluation of the structure.
According to the law of conservation of energy, the total energy of an isolated system is constant. Within this system, energy can be transferred or transformed but will not disappear. Therefore, the total energy input into the structure by the earthquake at each moment is equal to the energy dissipated by the structure. This dissipated energy includes the mass kinetic energy and elastic strain energy converted from the structural motion and elastic deformation, the nonlinear strain energy consumed by plastic deformation, and the damping energy dissipation through various dampers (such as modal damping, mass damping, stiffness damping, and viscous damping), as shown in Equation (1) [41],
E = E k + E f + E d
where,
  • E—total energy input into the structure by the earthquake;
  • Ek—kinetic energy;
  • Ef—deformation energy;
  • Ed—damping energy dissipation.
In Equation (1):
E = 0 t x · T [ M ] x g · · d t
E k = 0 t x · T M x · · d t
E f = 0 t x · T · F t d t
E D = 0 t x · T [ C ] x · d t
where,
  • [M]—mass matrix;
  • x ,   x ˙ ,   x ¨ ,   x ¨ g —structural relative displacement, velocity, acceleration, and ground motion acceleration;
  • [C]—damping matrix;
  • F t —structural restoring force;
  • Ef—includes elastic strain energy Ee and inelastic strain energy Eh, that is, E f = E e + E h .

4.1.2. Evaluation of the Seismic Performance of the Overall Structure

(1)
Inter-story displacement angle
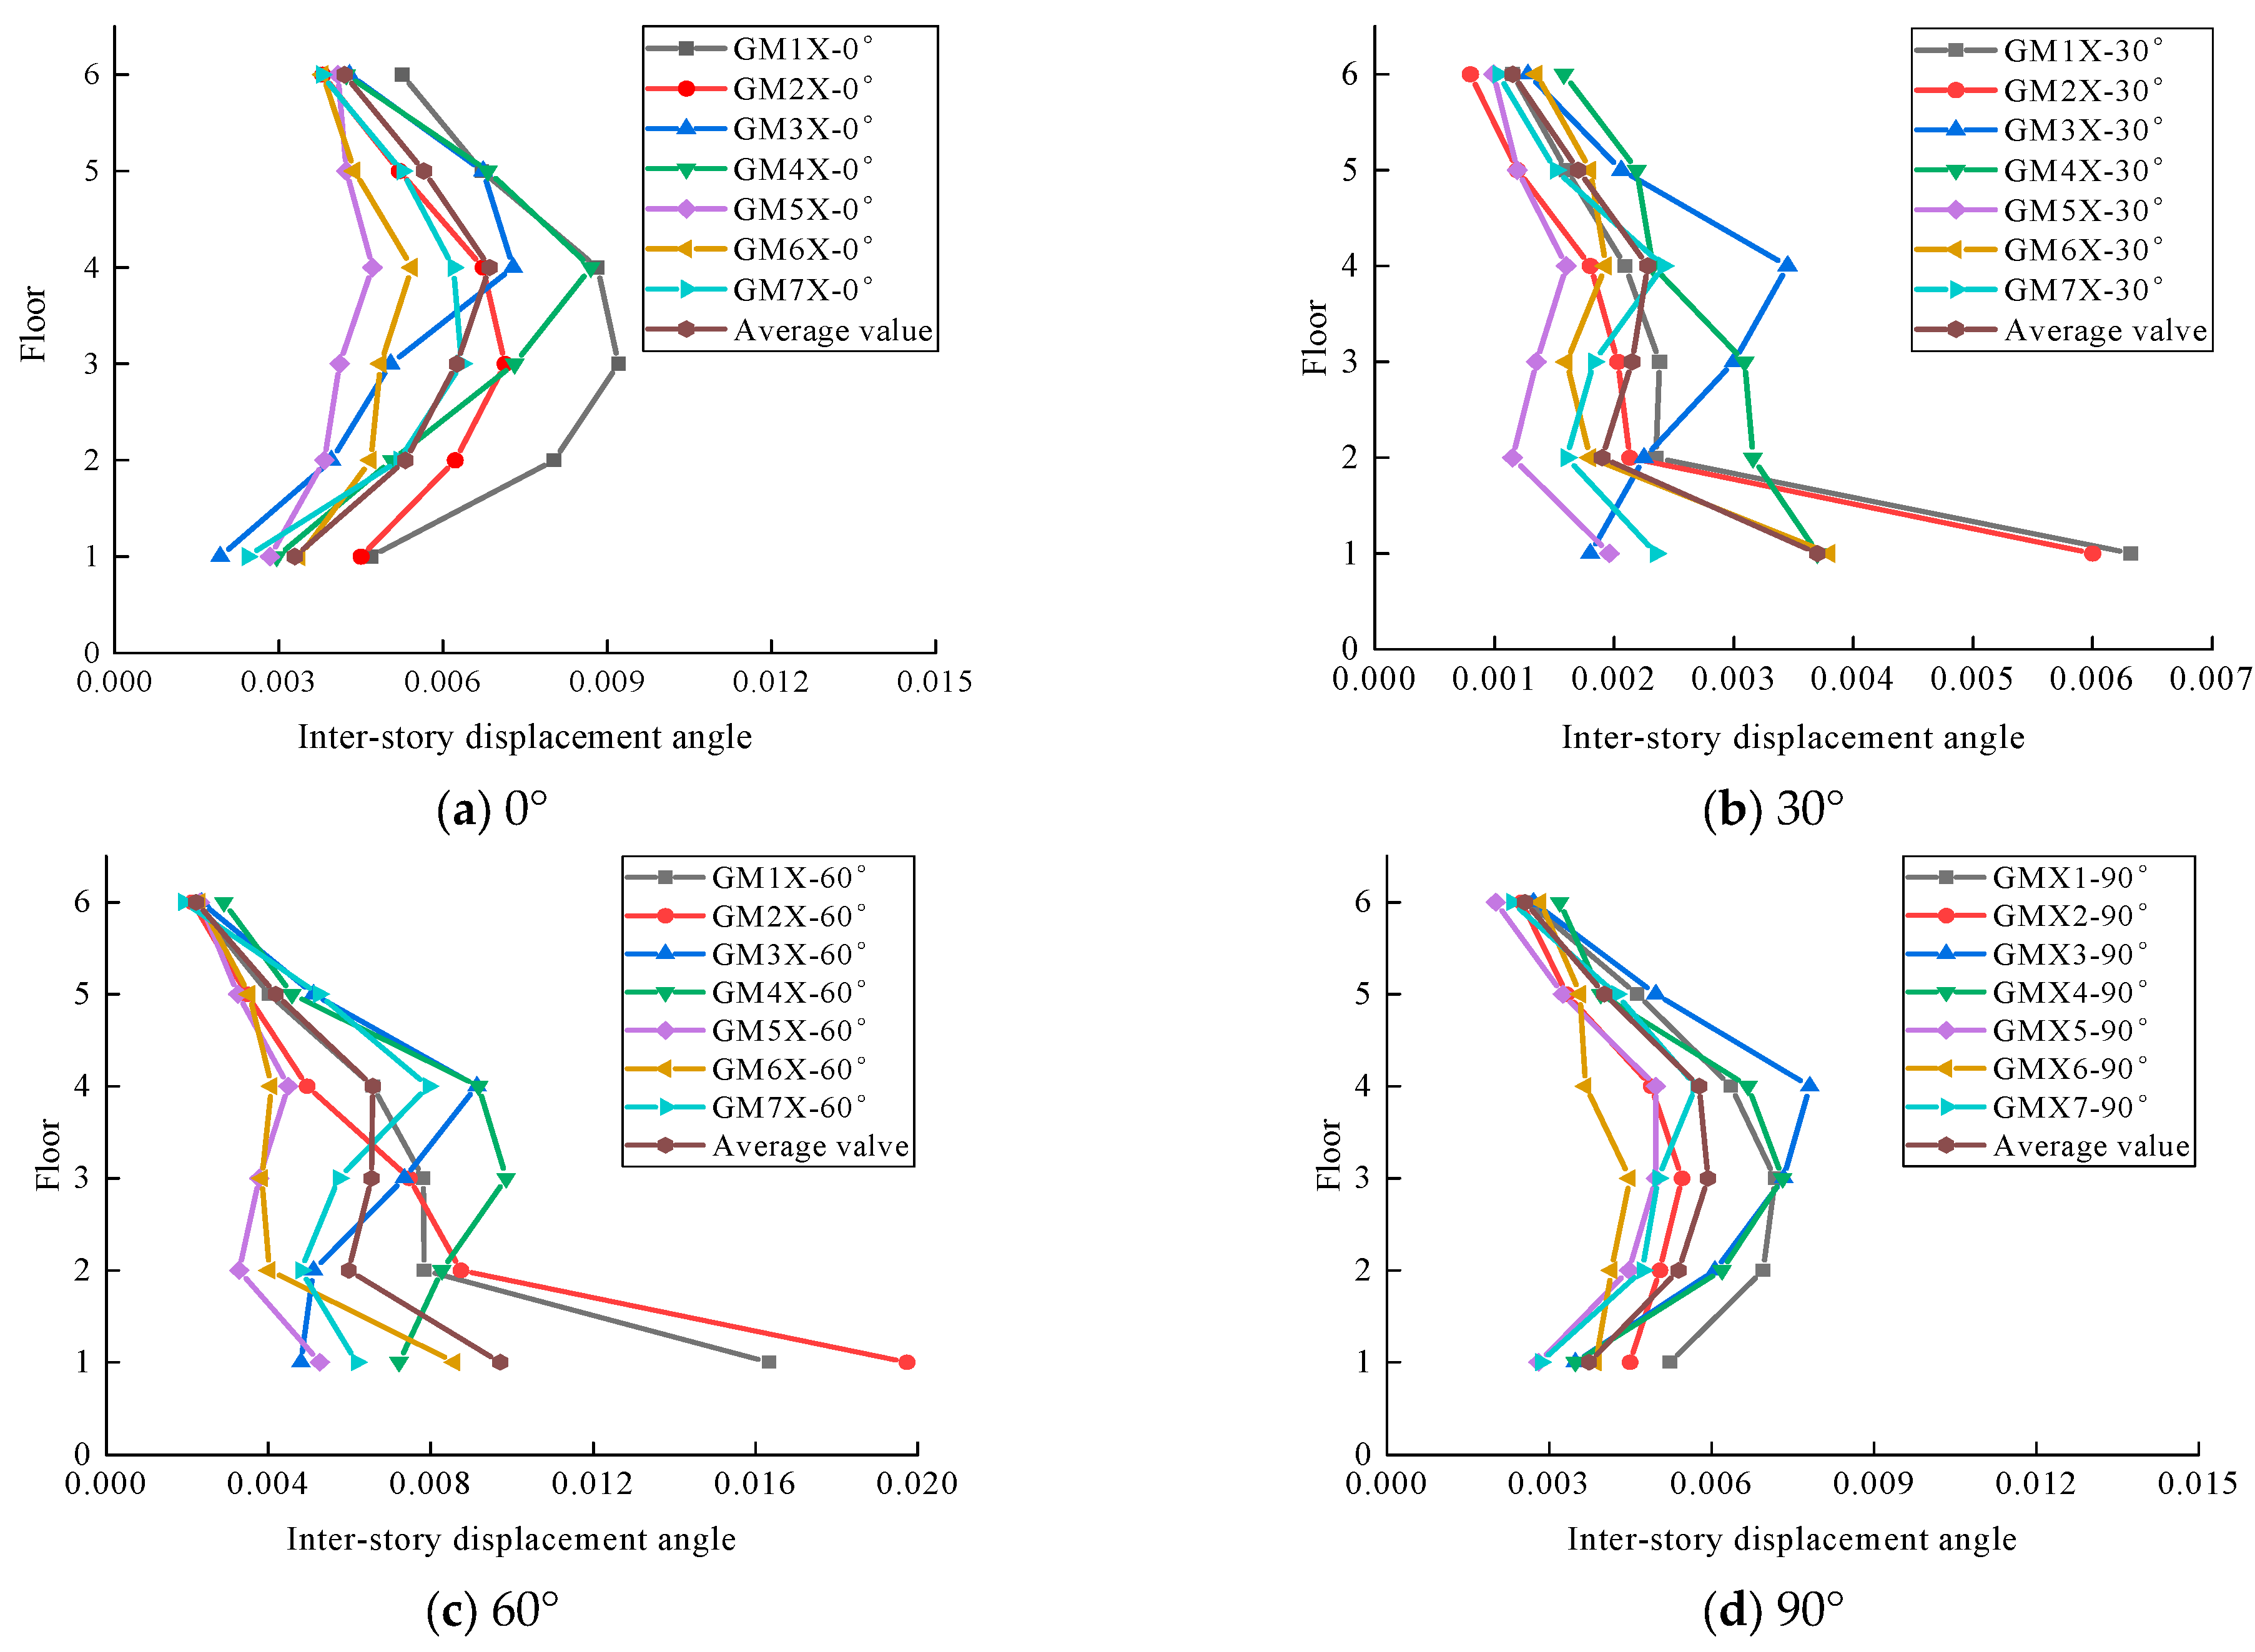
The structure was a RC frame structure with an inter-story displacement angle limit of 1/50. Figure 12 illustrates the inter-story displacement angles for the seven working conditions under four horizontal ground motion directions. The largest inter-story displacement angle occurred on the third and fourth floors, with the second, third, and fourth floors serving as inflection points in the curve owing to staggered floors and changes in vertical stiffness. From Figure 12, the maximum inter-story displacement angles for the seven seismic conditions at ground motion input directions of 0°, 30°, 60°, and 90° were below 1/50. This indicated that the structure performed well under these conditions. The structures exhibited similar trends in the inter-story displacement angle curves for ground motions at 0° and 90°, with slightly different trends at 30° and 60°. However, the overall characteristics of these trends remained consistent.
Combining the data from all angles, the fourth floor typically exhibited the largest inter-story displacement angle, and except for individual working conditions, the first and the third floor showed greater displacement. This made the fourth floor structurally weaker. The average maximum inter-story displacement angles of the structure in the 0°, 30°, 60°, and 90° directions were 1/143, 1/255, 1/91, and 1/163, respectively. In comparison, the average maximum inter-story displacement angles in the 30°, 60°, and 90° directions were 0.56, 1.57, and 0.88 times those in the 0° direction. When ground motion was input in the 60° direction, the average structural inter-story displacement angle was significantly larger than that in the 0° direction, indicating that seismic waves in the 60° direction pose greater challenges to the structure.
(2)
Overall structural energy dissipation
During an earthquake, the energy within the structure transforms into various formed as it deforms, including kinetic, elastic strain, nonlinear strain, and damping dissipation energies. The onset of nonlinear strain energy indicated that the structure enters an elastic–plastic state [42]. Table 12 lists the ratios of the overall nonlinear strain energy to the total energy dissipation of the structure during rare earthquakes for seven seismic conditions at four ground motion input angles. The average proportion of nonlinear strain energy was similar between the 0° and 90° directions, as well as between the 30° and 60° directions. The smallest proportion was in the 0° direction, whereas the largest was in the 30° direction. Overall, the proportion of nonlinear strain energy in the 30° and 60° directions was approximately 24% higher than that in the 0° and 90° directions.
Figure 13 illustrates the energy dissipation of the structure under the four input angles of the GM1 ground motion. Despite the variations in the specific proportion of each energy dissipation under different input angles, the modal damping energy dissipation and nonlinear energy dissipation dominate. The modal damping initiated the energy dissipation once seismic action commenced. As the seismic action progressed, the structure began to exhibit nonlinear deformation, and the proportion of nonlinear energy dissipation also increased gradually. This indicated the gradual onset of plastic deformation and deepening of the deformation levels, eventually stabilizing. The proportions of energy in the overall energy dissipation diagram of the structure were similar at 0° and 90°, as well as at 30° and 60°, suggesting similar structural performance changes under earthquake action in these two directions.

4.2. Performance Evaluation of the Structural Members

4.2.1. Principles for Evaluating the Performance of the Structural Members

When evaluating the seismic performance of a structure from the member level, the first step is to determine its seismic performance objectives. Seismic performance objectives are related to earthquake levels and performance levels. There are four grades of structural seismic performance objectives (from high to low: A, B, C, D), which correspond to the minimum performance levels (from high to low: 1, 2, 3, 4, 5) under three earthquake levels, as detailed in Table 13 [43].

4.2.2. Evaluating the Seismic Performance of the Structural Members

The research object of this paper is a Class C building with a seismic performance objective of Grade C, and its seismic performance level under a rare earthquake is Level 4. When the seismic performance level is Level 4, key members are slightly damaged; ordinary vertical members (frame columns and ST-RC columns) and important horizontal members are partially moderately damaged, while energy-dissipating members (frame beams) are moderately damaged or partially severely damaged [43].
(1)
Classification of members failure modes
According to [43], the failure modes of reinforced concrete beams and columns are classified into three types: flexure-controlled, flexure-shear-controlled, and shear-controlled. The specific classification criteria are shown in Table 14 and Table 15, respectively.
(2)
Evaluation of members with flexure-controlled or flexure–shear-controlled failure.
Failures of members controlled by flexure or flexure–shear are ductile failures. When evaluating such reinforced concrete members, their performance states are usually classified. The performance level of a member [44] refers to the bearing capacity and deformation capacity that the member should possess under a given seismic action. By correlating the damage degree of members under seismic action with the repair cost, the safety and economic loss of the building can be controlled. Reference [32] provides four levels of performance requirements, and at the same time, six levels of performance states are given in accordance with the “Specification for Seismic Performance Design of Concrete Structures in Construction Engineering” for the purpose of quantification. The finite element program used in this paper adopts the American standard [45], which also relies on these six levels of performance states.
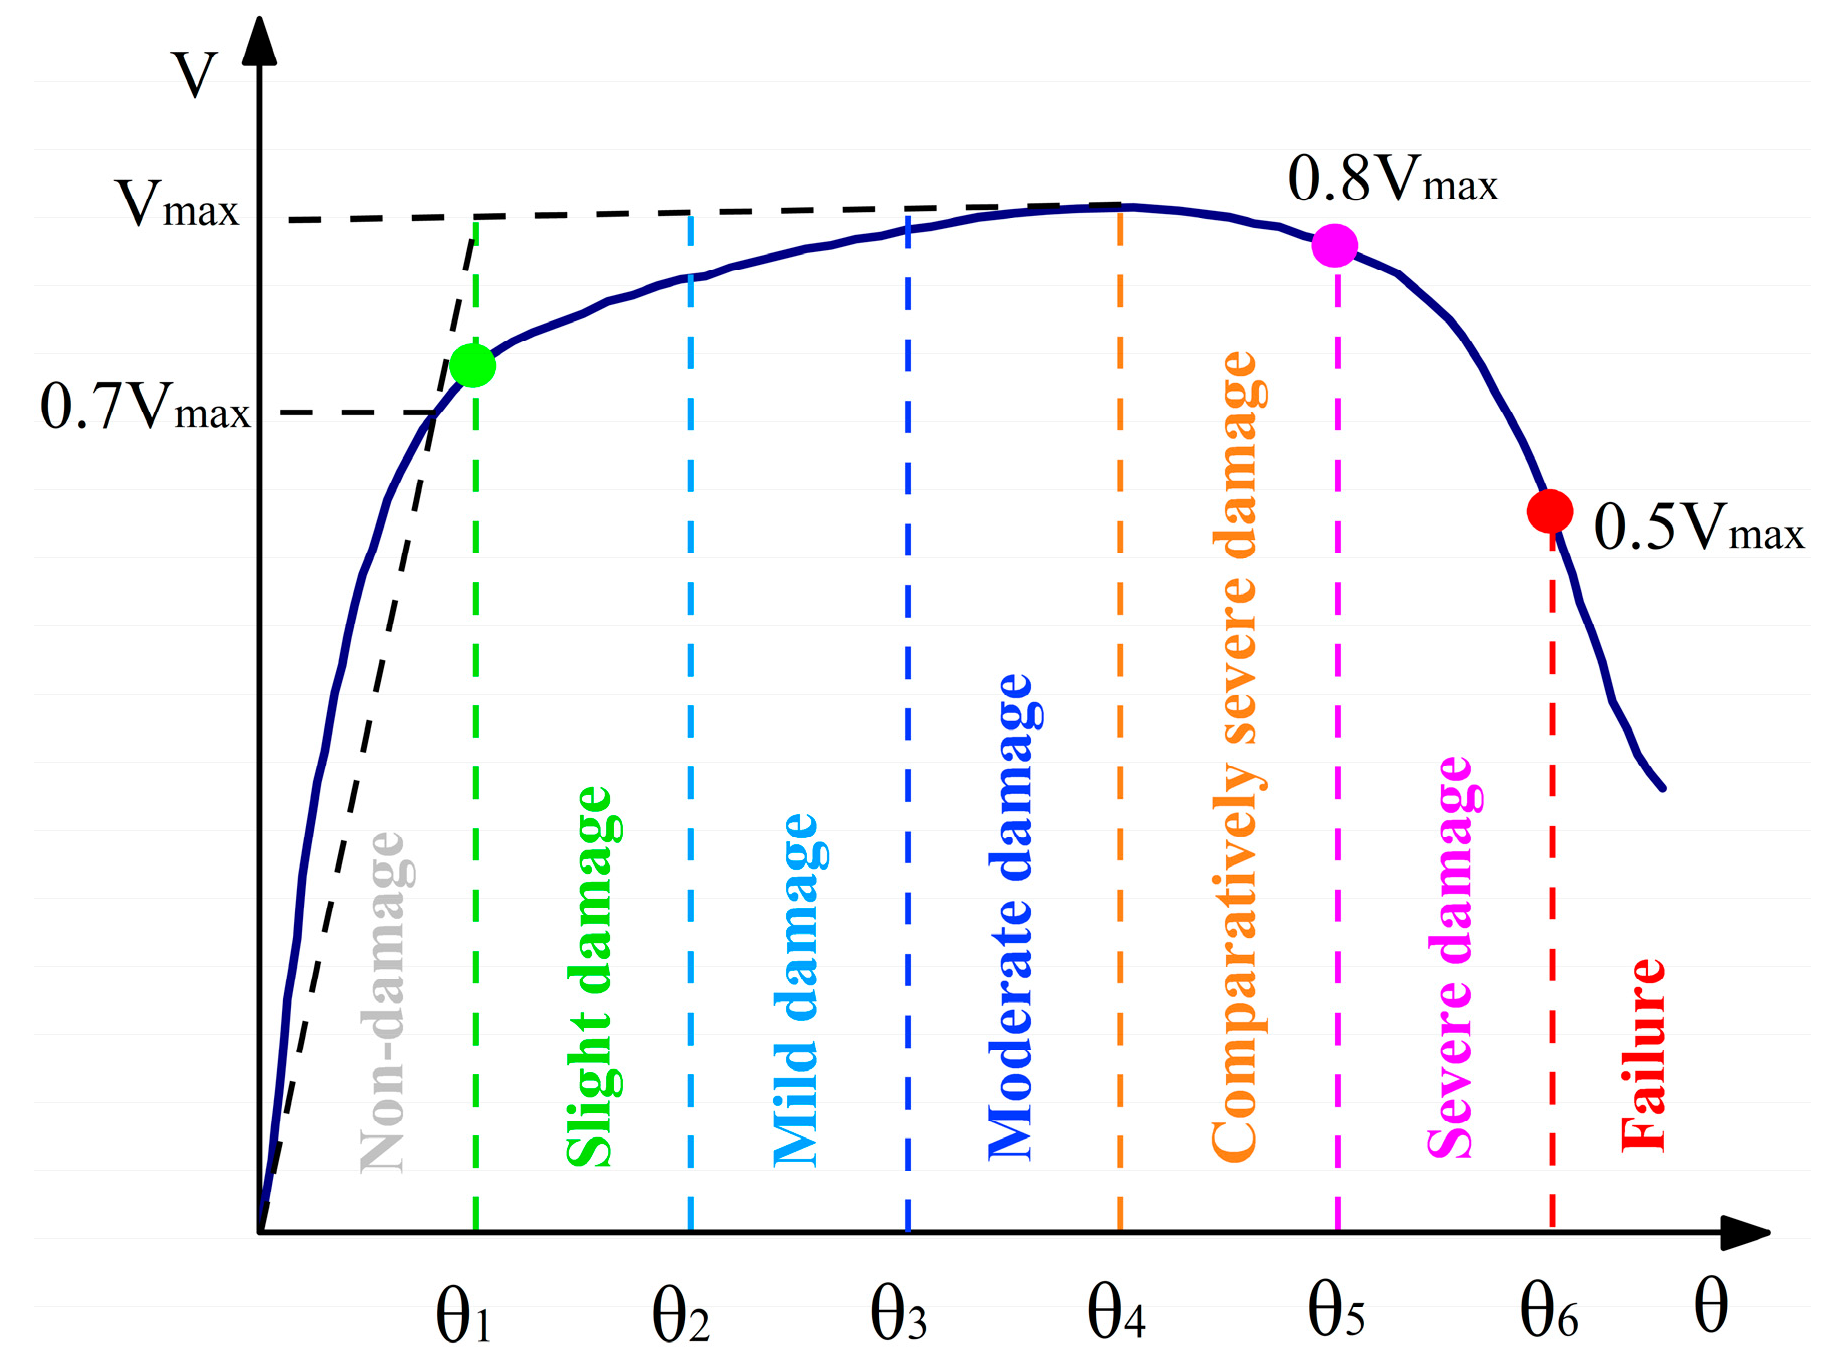
The plastic rotation angle [46] can well reflect the damage degree of members. Therefore, these six performance states are determined through the force-rotation angle skeleton curve (V-θ curve). Figure 14 shows the performance states of reinforced concrete members and the limit curve of plastic rotation angles, where Vmax in the figure represents the ultimate bearing capacity of the member.
Based on the curve in Figure 14, the deformation index limits for beams and columns can be obtained [41], which provide quantitative standards for performance evaluation based on member deformation, as shown in Table 16 and Table 17, respectively.
(3)
Evaluation of members with shear-controlled failure
Members with shear-controlled failure exhibit brittle damage, and their performance states are governed by the bearing capacity of the members. The performance verification method adopted is presented in Table 18.
In Table 18, the formulas for the non-yield check and minimum section check are shown in Equations (6)–(8).
Non-yield check:
S GE + S EK R k
In the formula,
  • S GE —representative value of gravity load effect;
  • S EK —standard value of seismic action effect;
  • R k —standard value of member bearing capacity.
Minimum section check:
V GE + V EK 0.15 f ck b h 0
V GE + V EK 0.5 ( f ak A a + f spk A sp ) 0.15 f ck b h 0
In the formula,
  • V GE —shear force of the member under gravity load;
  • V EK —shear force of the member under the standard value of seismic action;
  • f ck —standard value of concrete axial compressive strength;
  • f ak —standard value of strength of section steel;
  • A a —cross-sectional area of section steel in the shear direction;
  • f spk —standard value of strength of steel plate in shear wall;
  • A sp —cross-sectional area of steel plate in shear wall.
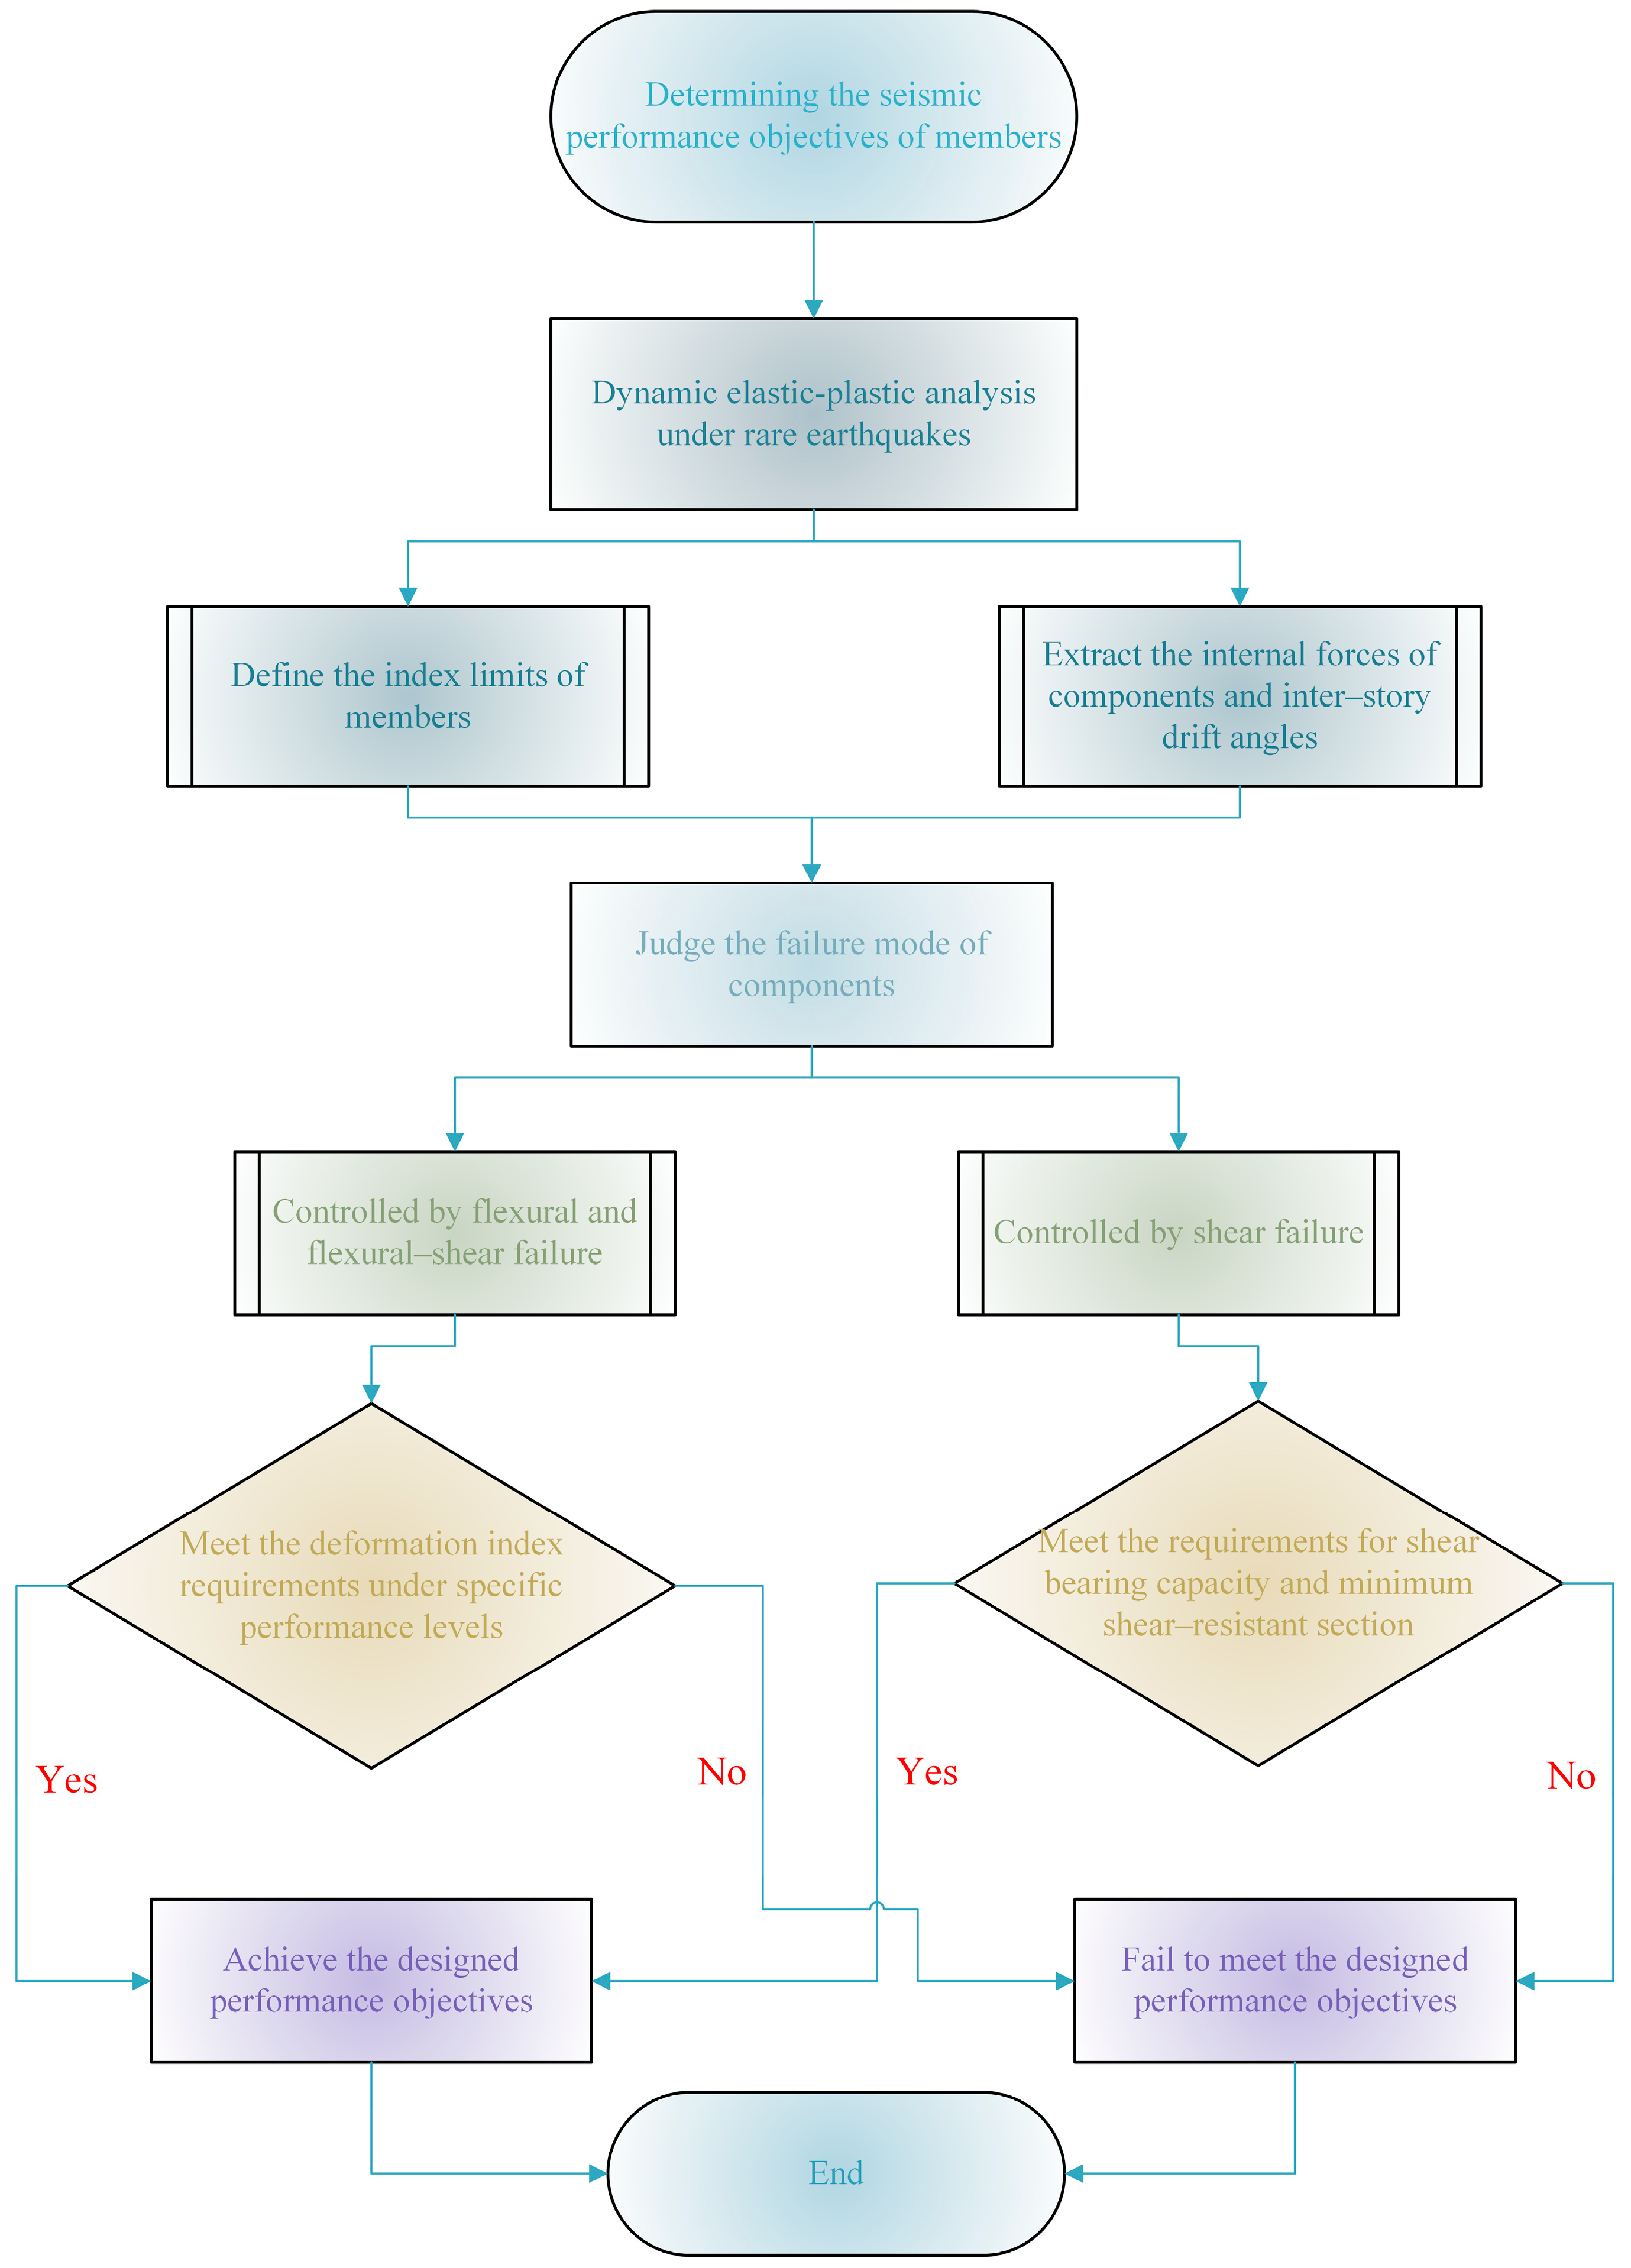
Based on the above theory, the flow chart for seismic performance evaluation based on member deformation is shown in Figure 15.

4.2.3. Frame Beam Performance

(1)
Performance evaluation of frame beams in the positive section
In accordance with the requirements of performance level 4, reinforced concrete frame beams shall satisfy the condition that the positive section deformation does not exceed moderate damage. Details are specified in Table 16 regarding the limit values of flexure-controlled elastic–plastic drift angles for beam members, which are as follows: when the bending–shear ratio of the beam is ≤0.2 and the area stirrup ratio is ≥0.012, the moderate damage limit value of the beam is 0.031; when the bending–shear ratio of the beam is ≥0.8 and the area stirrup ratio is ≥0.012, the moderate damage limit value of the beam is 0.039; when the bending–shear ratio of the beam is ≤0.2 and the area stirrup ratio is ≤0.001, the moderate damage limit value of the beam is 0.013; and when the bending–shear ratio of the beam is ≥0.8 and the area stirrup ratio is ≤0.001, the moderate damage limit value of the beam is 0.016.
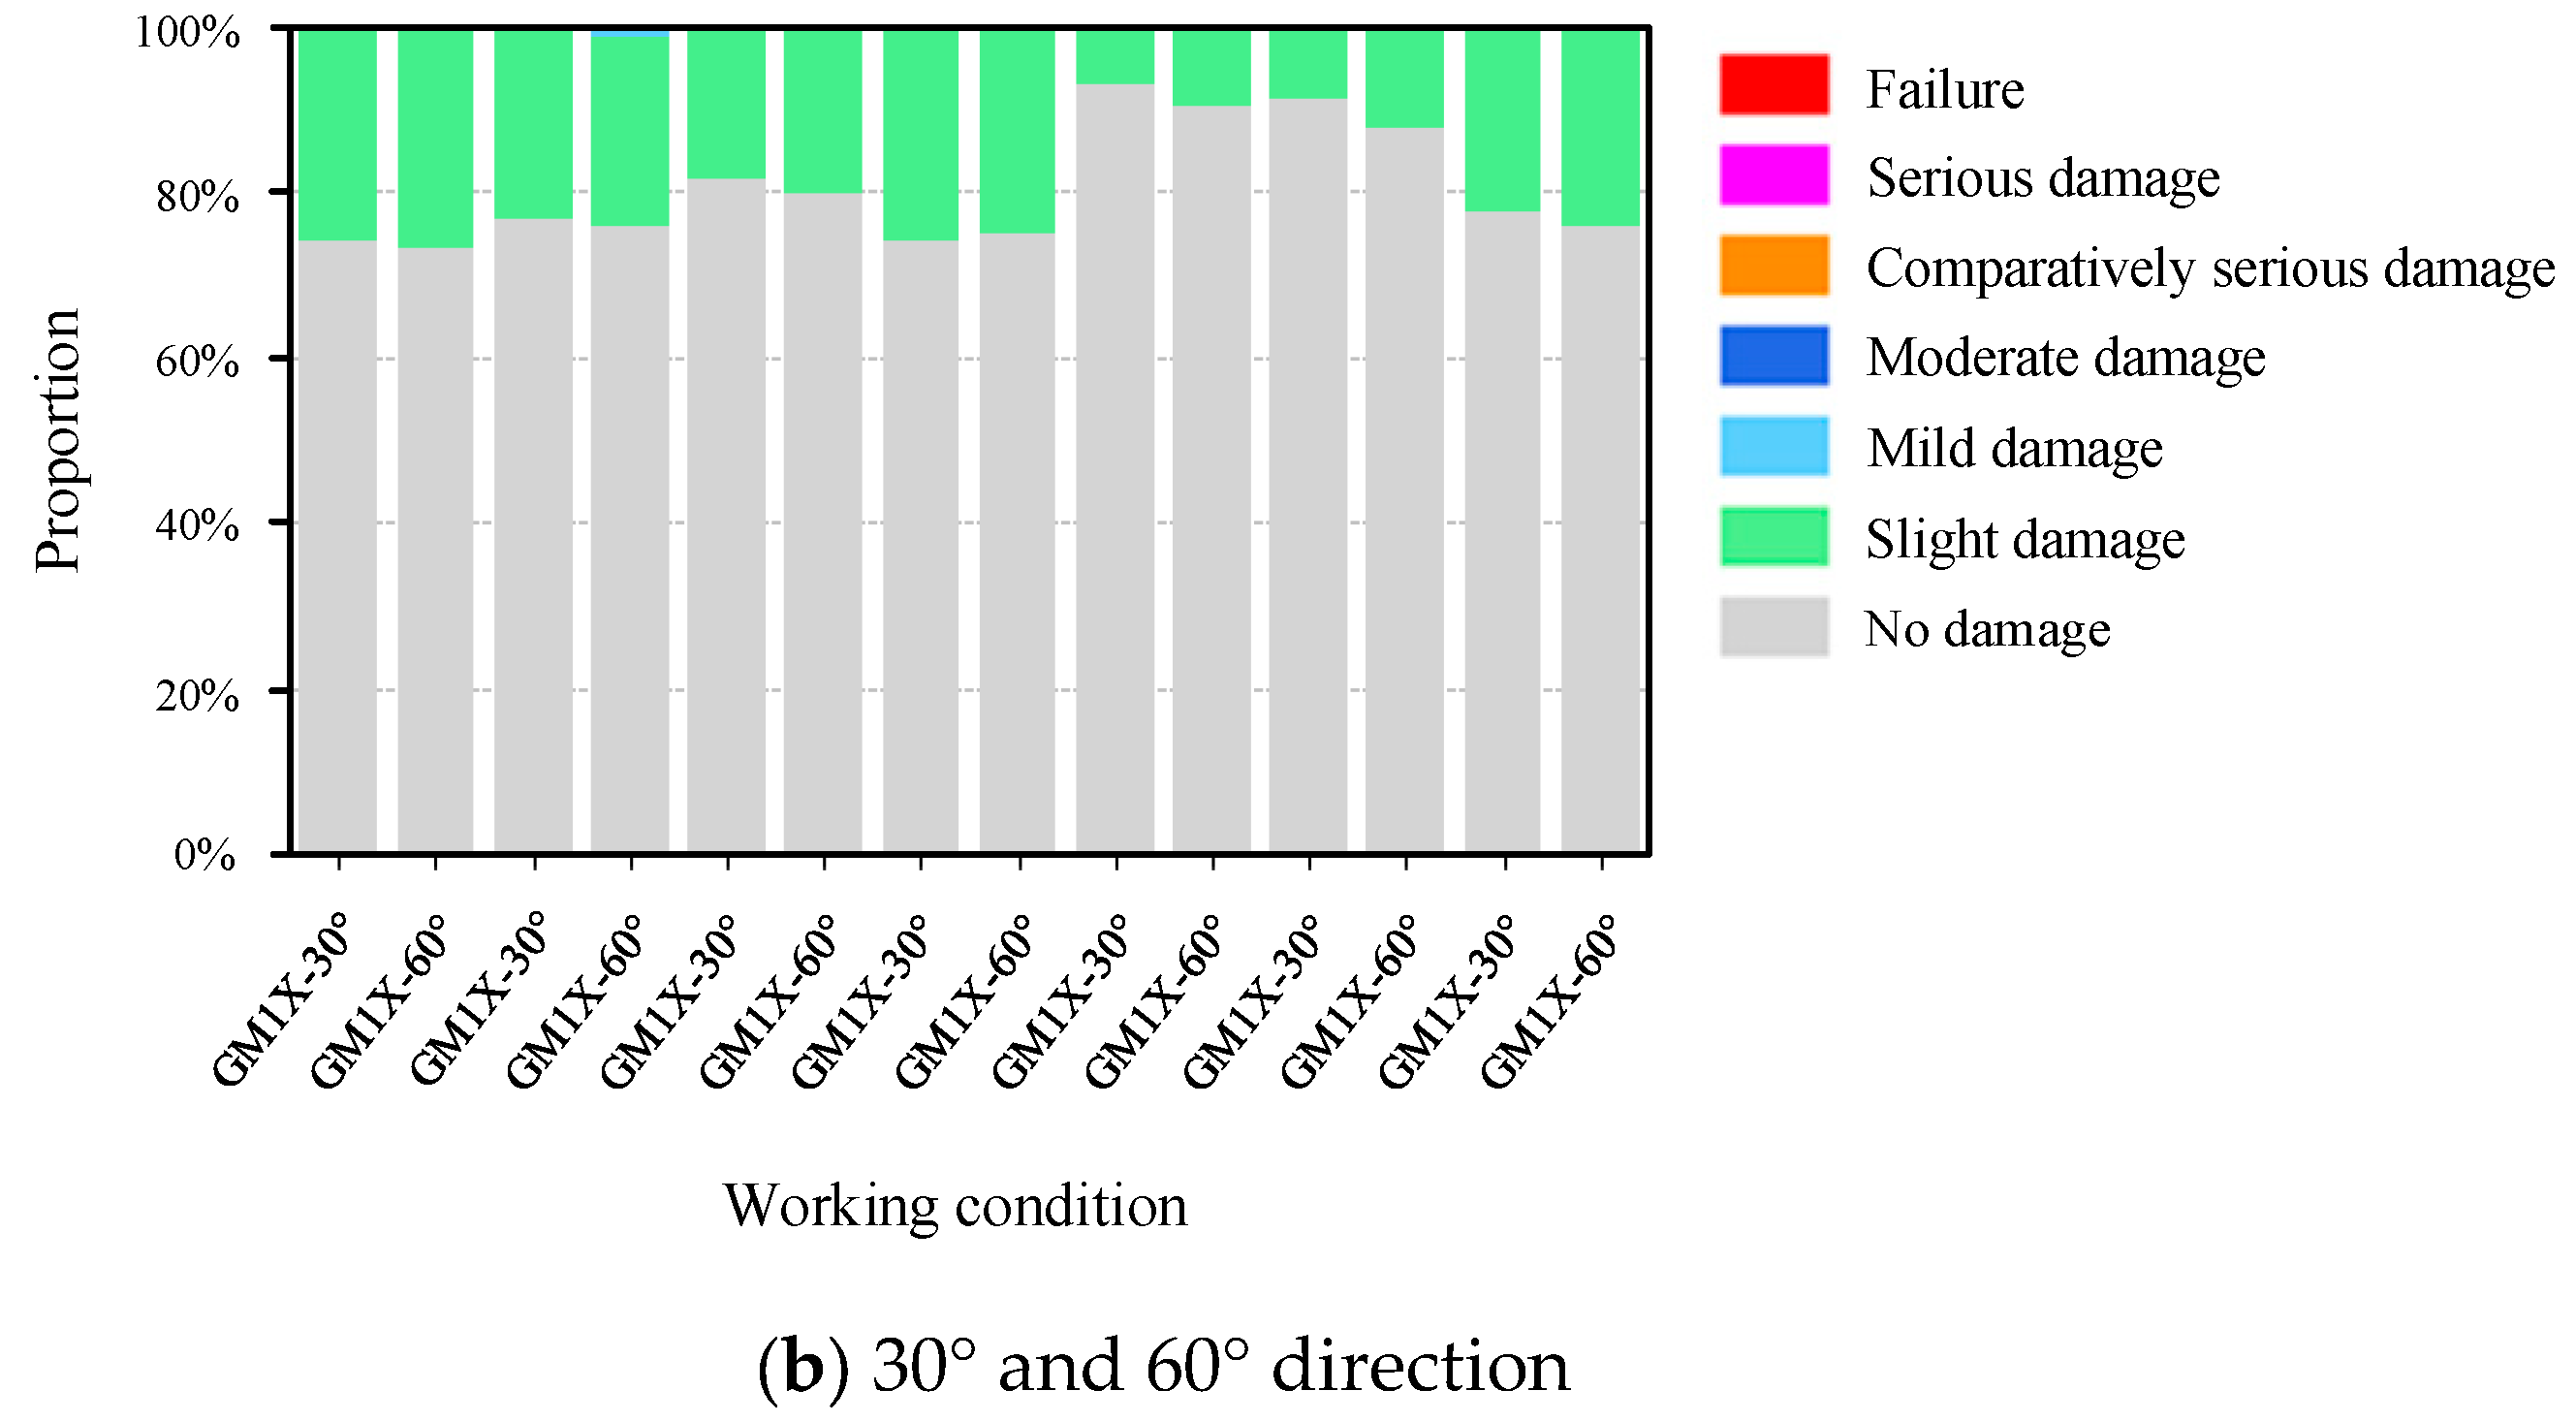
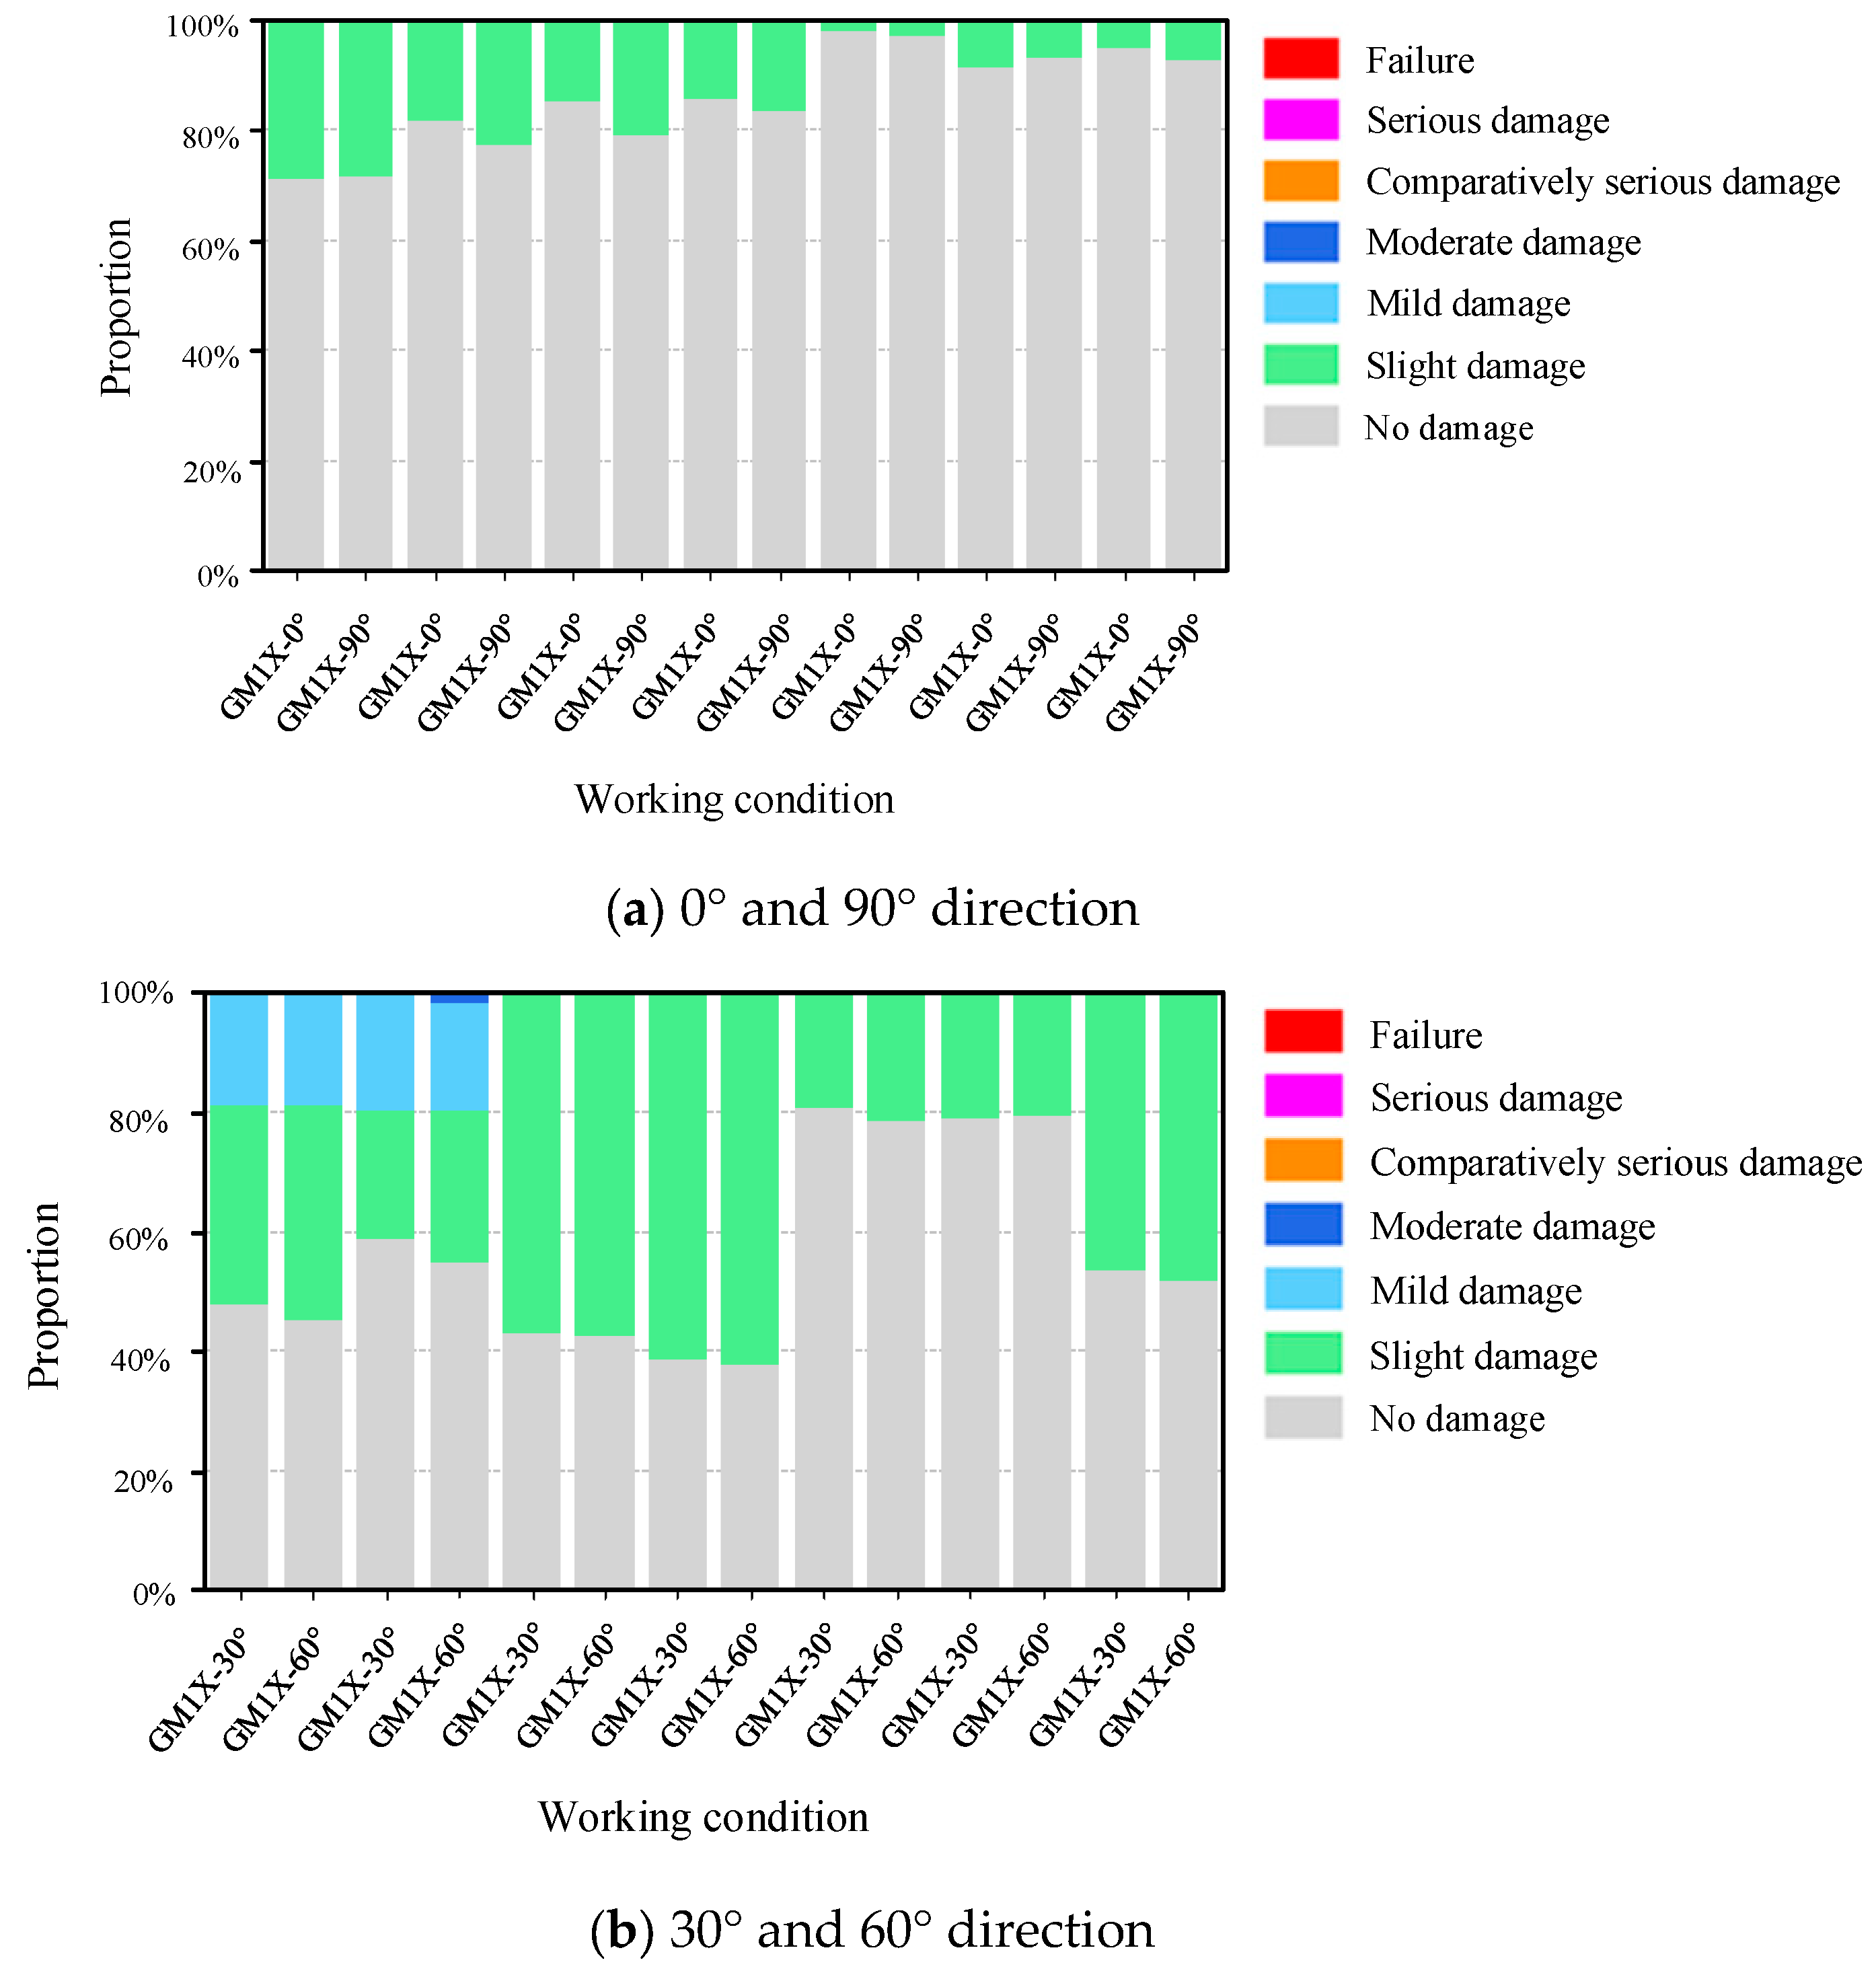
Figure 16a,b show the performance state statistics of the frame beams under seismic conditions of 0°, 90°, 30°, and 60°. In each condition, the proportion of the non-damaged state was the highest in the positive section of the frame beams. Under certain operating conditions, some frame beams exhibited slight damage. However, the proportion of beams in a state of moderate damage or higher was 0, indicating that the frame beams performed well, and the overall damage met the requirements of performance level 4. Table 19 lists the average performance–state values for each angle. The table indicates that the non-damaged states of the positive sections of the frame beams were 38.63%, 81.11%, 79.60%, and 37.48% for the 0°, 30°, 60°, and 90° directions, respectively. Comparing these values, the non-damaged state in the 30° and 60° directions was 2.10 and 2.06 times higher, respectively, than in the 0° direction, while the degree of damage in the 90° direction was similar to that in the 0° direction. Overall, the damage to the frame beams was more severe in the 0° and 90° directions than in the 30° and 60° directions, with a higher proportion of slight and mild damage. The moderate damage was observed in the 0° direction under GM1X-0° and GM4X-0° conditions. In the 0° and 90° directions, seismic excitation primarily induces translational motion with minimal torsional effects. Frame beams are subjected to larger bending moments and shear forces and are more prone to plastic deformation, which leads to damage. Conversely, in the 30° and 60° directions, the torsional effect of the staggered floor structure is significant due to the eccentricity between the center of mass and center of stiffness, with the frame columns carrying more torsional loads and the frame beams suffering relatively less damage.
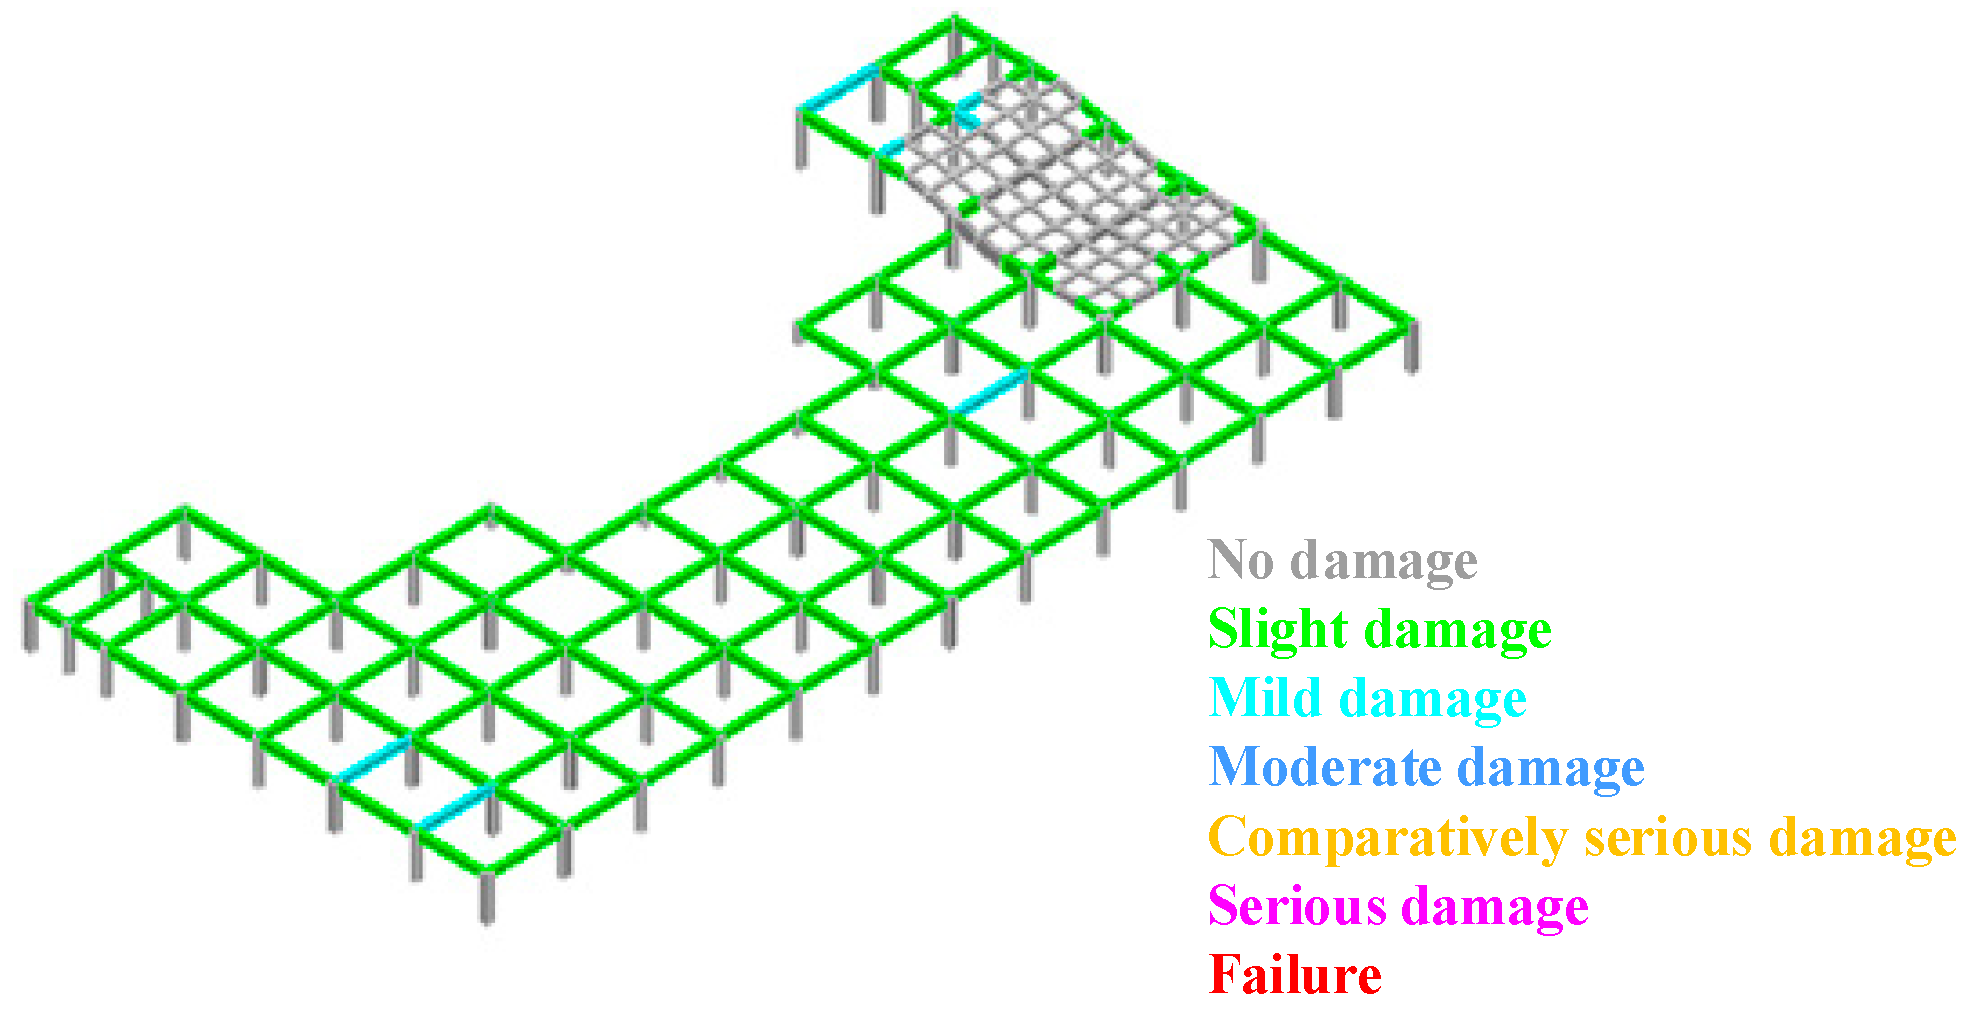
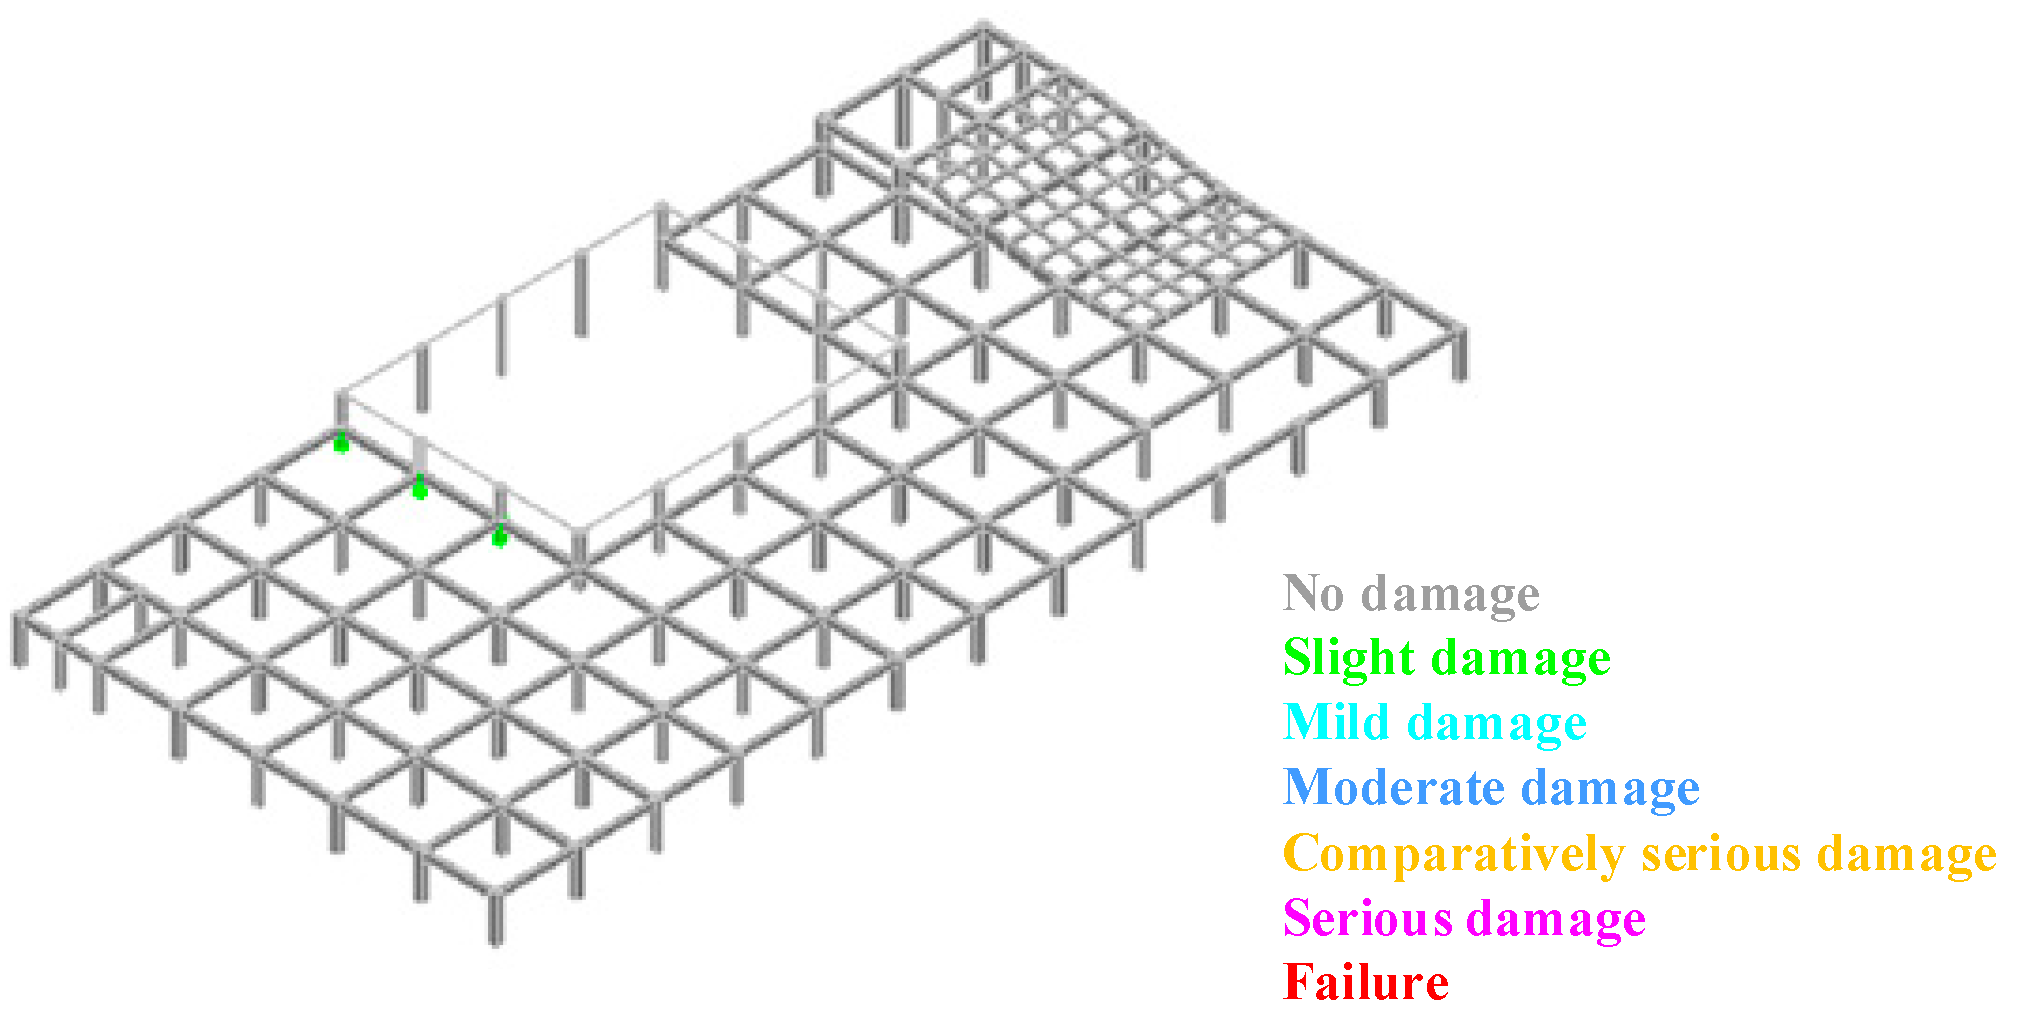
Figure 17 shows the performance state diagram of the frame beams on the third floor, where the damage degree is the most severe; specifically, 5.00% of the beams on this floor have suffered mild damage.
(2)
Performance evaluation of frame beams in the oblique section
In accordance with the requirements of performance level 4, reinforced concrete frame beams shall satisfy the condition that the oblique section bearing capacity does not exceed the minimum cross-section requirement; details are specified in Table 16 regarding the limit values of flexure–shear controlled elastic–plastic drift angles for beam members, which are as follows: when the bending–shear ratio of the beam is ≤0.5 and the area stirrup ratio is ≥0.008, the moderate damage limit value of the beam is 0.019; when the bending–shear ratio of the beam is ≥2.5 and the area stirrup ratio is ≥0.008, the moderate damage limit value of the beam is 0.012; when the bending–shear ratio of the beam is ≤0.5 and the area stirrup ratio is ≤0.0005, the moderate damage limit value of the beam is 0.012; and when the bending–shear ratio of the beam is ≥2.5 and the area stirrup ratio is ≤0.0005, the moderate damage limit value of the beam is 0.008.
Table 20 presents the specific statistics on the average performance state of the oblique section of the frame beams under seven seismic conditions at input directions of 0°, 30°, 60°, and 90°. In the 0° and 90° directions, the shear elasticity comprises over 99% of the total, with few instances of shear unyielding states. Meanwhile, the shear elasticity accounted for 100% of the total elasticity in the 30° and 60° directions. These findings indicated a low degree of damage in the oblique section of the frame beam, which met the performance requirements with a significant safety margin.

4.2.4. Frame Column Performance

(1)
Performance evaluation of frame columns in the positive section
In accordance with the requirements of performance level 4, reinforced concrete columns shall satisfy the condition that the positive section deformation does not exceed moderate damage; details are specified in Table 17 regarding the limit values of flexure-controlled elastic–plastic drift angles for column members, which are as follows: when the axial compression ratio of the column is ≤0.1 and the volumetric stirrup ratio is ≥0.021, the moderate damage limit value of the column is 0.037; when the axial compression ratio of the column is =0.6 and the volumetric stirrup ratio is ≥0.021, the moderate damage limit value of the column is 0.022; when the axial compression ratio of the column is ≤0.1 and the volumetric stirrup ratio is ≤0.001, the moderate damage limit value of the column is 0.029; and when the axial compression ratio of the column is =0.6 and the volumetric stirrup ratio is ≤0.001, the moderate damage limit value of the column is 0.012.
Figure 18a,b display the performance statistics of the positive sections of the frame columns under seven seismic conditions in the 0°, 90°, 30°, and 60° directions. These figures illustrate that in each condition, the majority of columns present no damage or slight damage, with a relatively small proportion exhibiting mild damage. This indicated that the frame columns experienced slight damage and maintained a significant safety margin. Table 21 lists the average performance state values for each angle. This revealed that the average non-damaged states of the frame beam’s positive section under each condition in the 0°, 30°, 60°, and 90° directions were 86.71%, 57.21%, 55.64%, and 84.72%, respectively. In the 0° and 90° directions, the non-damaged state of the frame column was 1.56 and 1.52 times higher, respectively, than that in the 60° direction, with the 30° direction being similar to the 60° direction. Mild damage occurred in the 30° and 60° directions, accounting for 5.56% and 5.33%, respectively, indicating more severe damage to the frame column in these directions than in the 0° and 90° directions. The staggered floor structure exhibits enhanced torsional effects in the 30° and 60° directions, which are primarily resisted by the frame columns. The frame beams work in concert, mainly for load transfer and distribution, and the overall torsional effect is weaker than that of the frame columns. Consequently, the frame columns were more severely damaged in 30° and 60° ground motion inputs. Under a ground motion of 60°, the most severe structural damage occurred in the GM2Y-60° condition, with moderate damage accounting for 1.63%. However, this still satisfied the requirement that ordinary vertical members (frame columns and ST-RC columns) with performance level 4 were partially moderately damaged. Figure 19 presents the diagram of the positive section performance state of frame columns on the first floor, where the frame columns on this floor suffer the most severe damage.
(2)
Performance evaluation of frame columns in the oblique section
In accordance with the requirements of performance level 4, reinforced concrete columns shall satisfy the condition that the oblique section bearing capacity does not exceed the minimum section requirement; details are specified in Table 17 regarding the limit values of flexure–shear controlled elastic–plastic drift angles for column members, which are as follows: when the axial compression ratio of the column is ≤0.1 and the bending-shear ratio is ≤0.6, the moderate damage limit value of the column is 0.026; when the axial compression ratio of the column is =0.6 and the bending–shear ratio is ≤0.6, the moderate damage limit value of the column is 0.014; when the axial compression ratio of the column is ≤0.1 and the bending–shear ratio is ≥1.0, the moderate damage limit value of the column is 0.021; and when the axial compression ratio of the column is =0.6 and the bending–shear ratio is ≥1.0, the moderate damage limit value of the column is 0.011.
Table 22 displays the average performance state statistics of the oblique section of the frame columns under seven seismic conditions for ground motion input directions of 0°, 30°, 60°, and 90°. The table indicates that the frame columns exhibit shear elasticity in the oblique section for all input directions, signifying compliance with the shear elasticity requirements, absence of damage, and a high level of safety.

4.2.5. ST-RC Columns Performance

(1)
Performance evaluation of ST-RC columns in the positive section
In accordance with the requirements of performance level 4, ST-RC columns shall satisfy the condition that the positive section deformation does not exceed moderate damage; the specific limit values of flexure-controlled elastic–plastic drift angles for such members are the same as those for reinforced concrete columns.
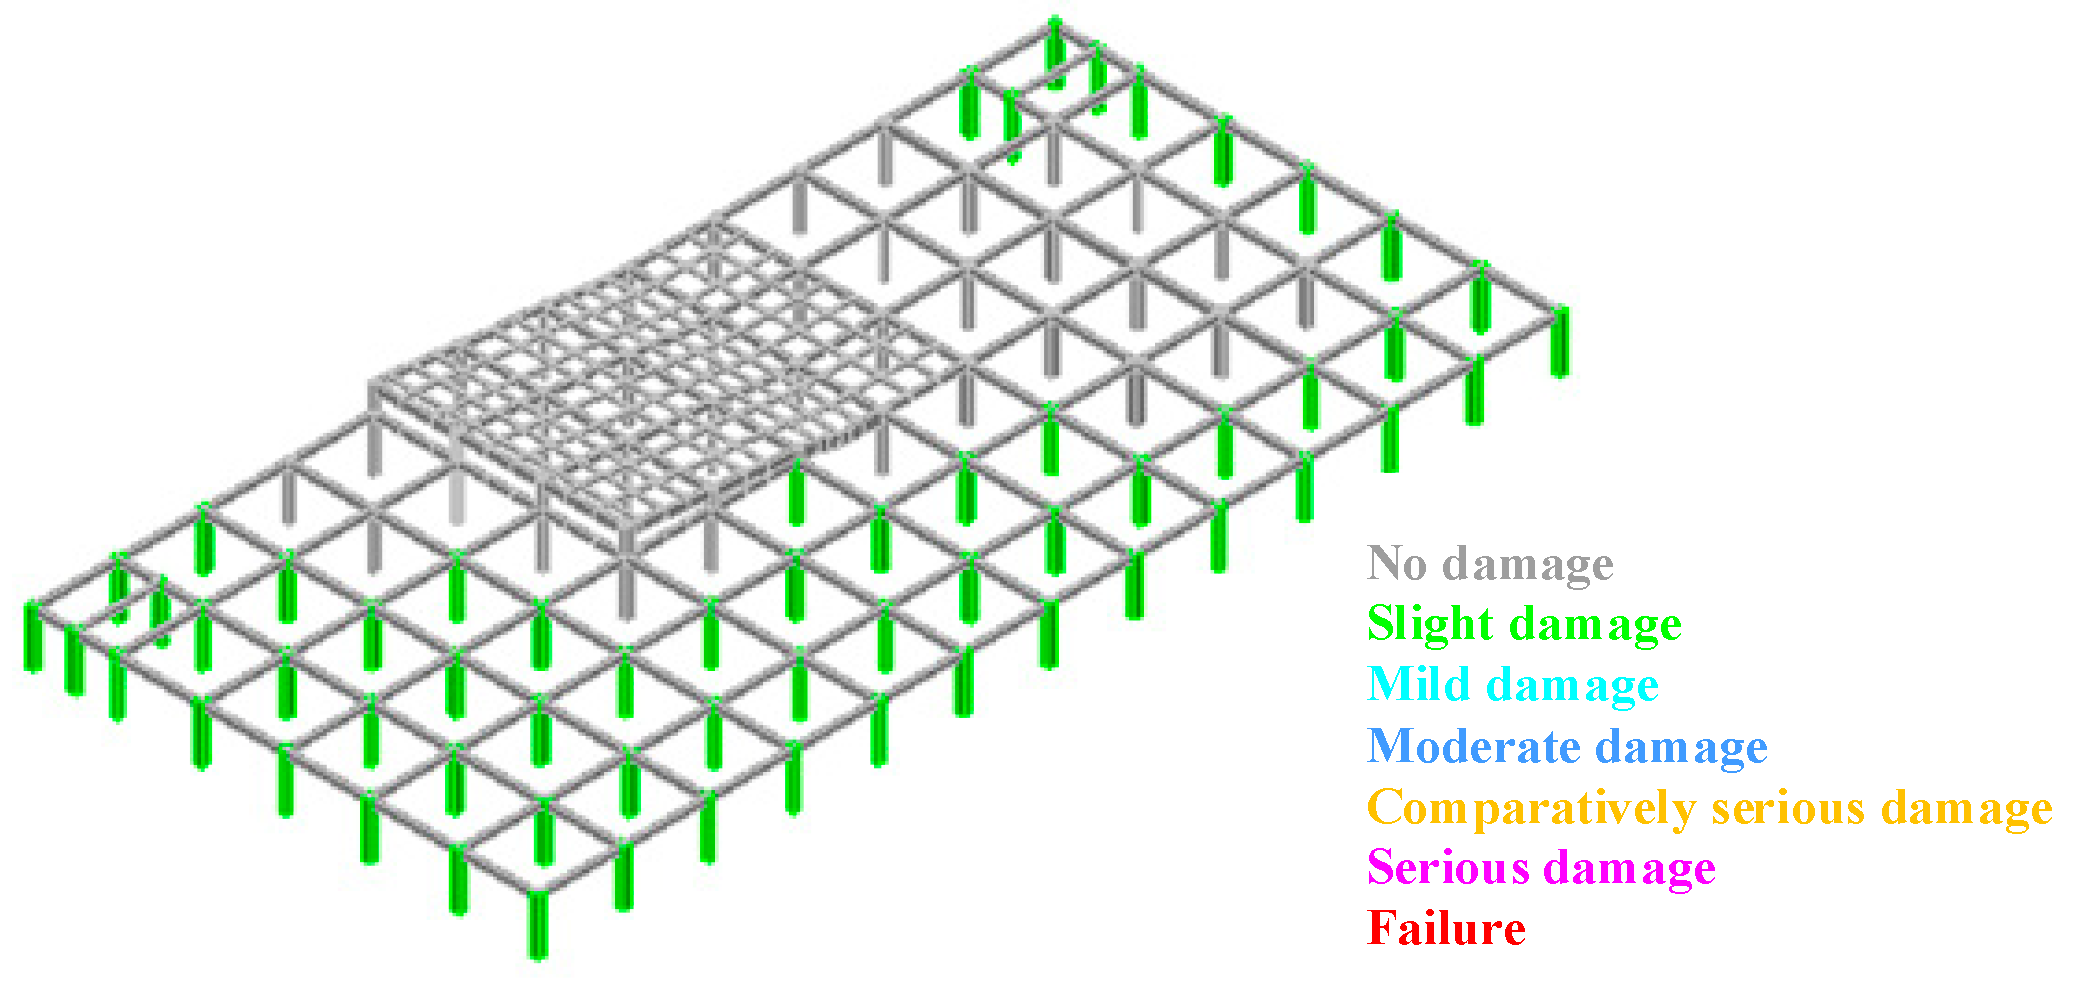
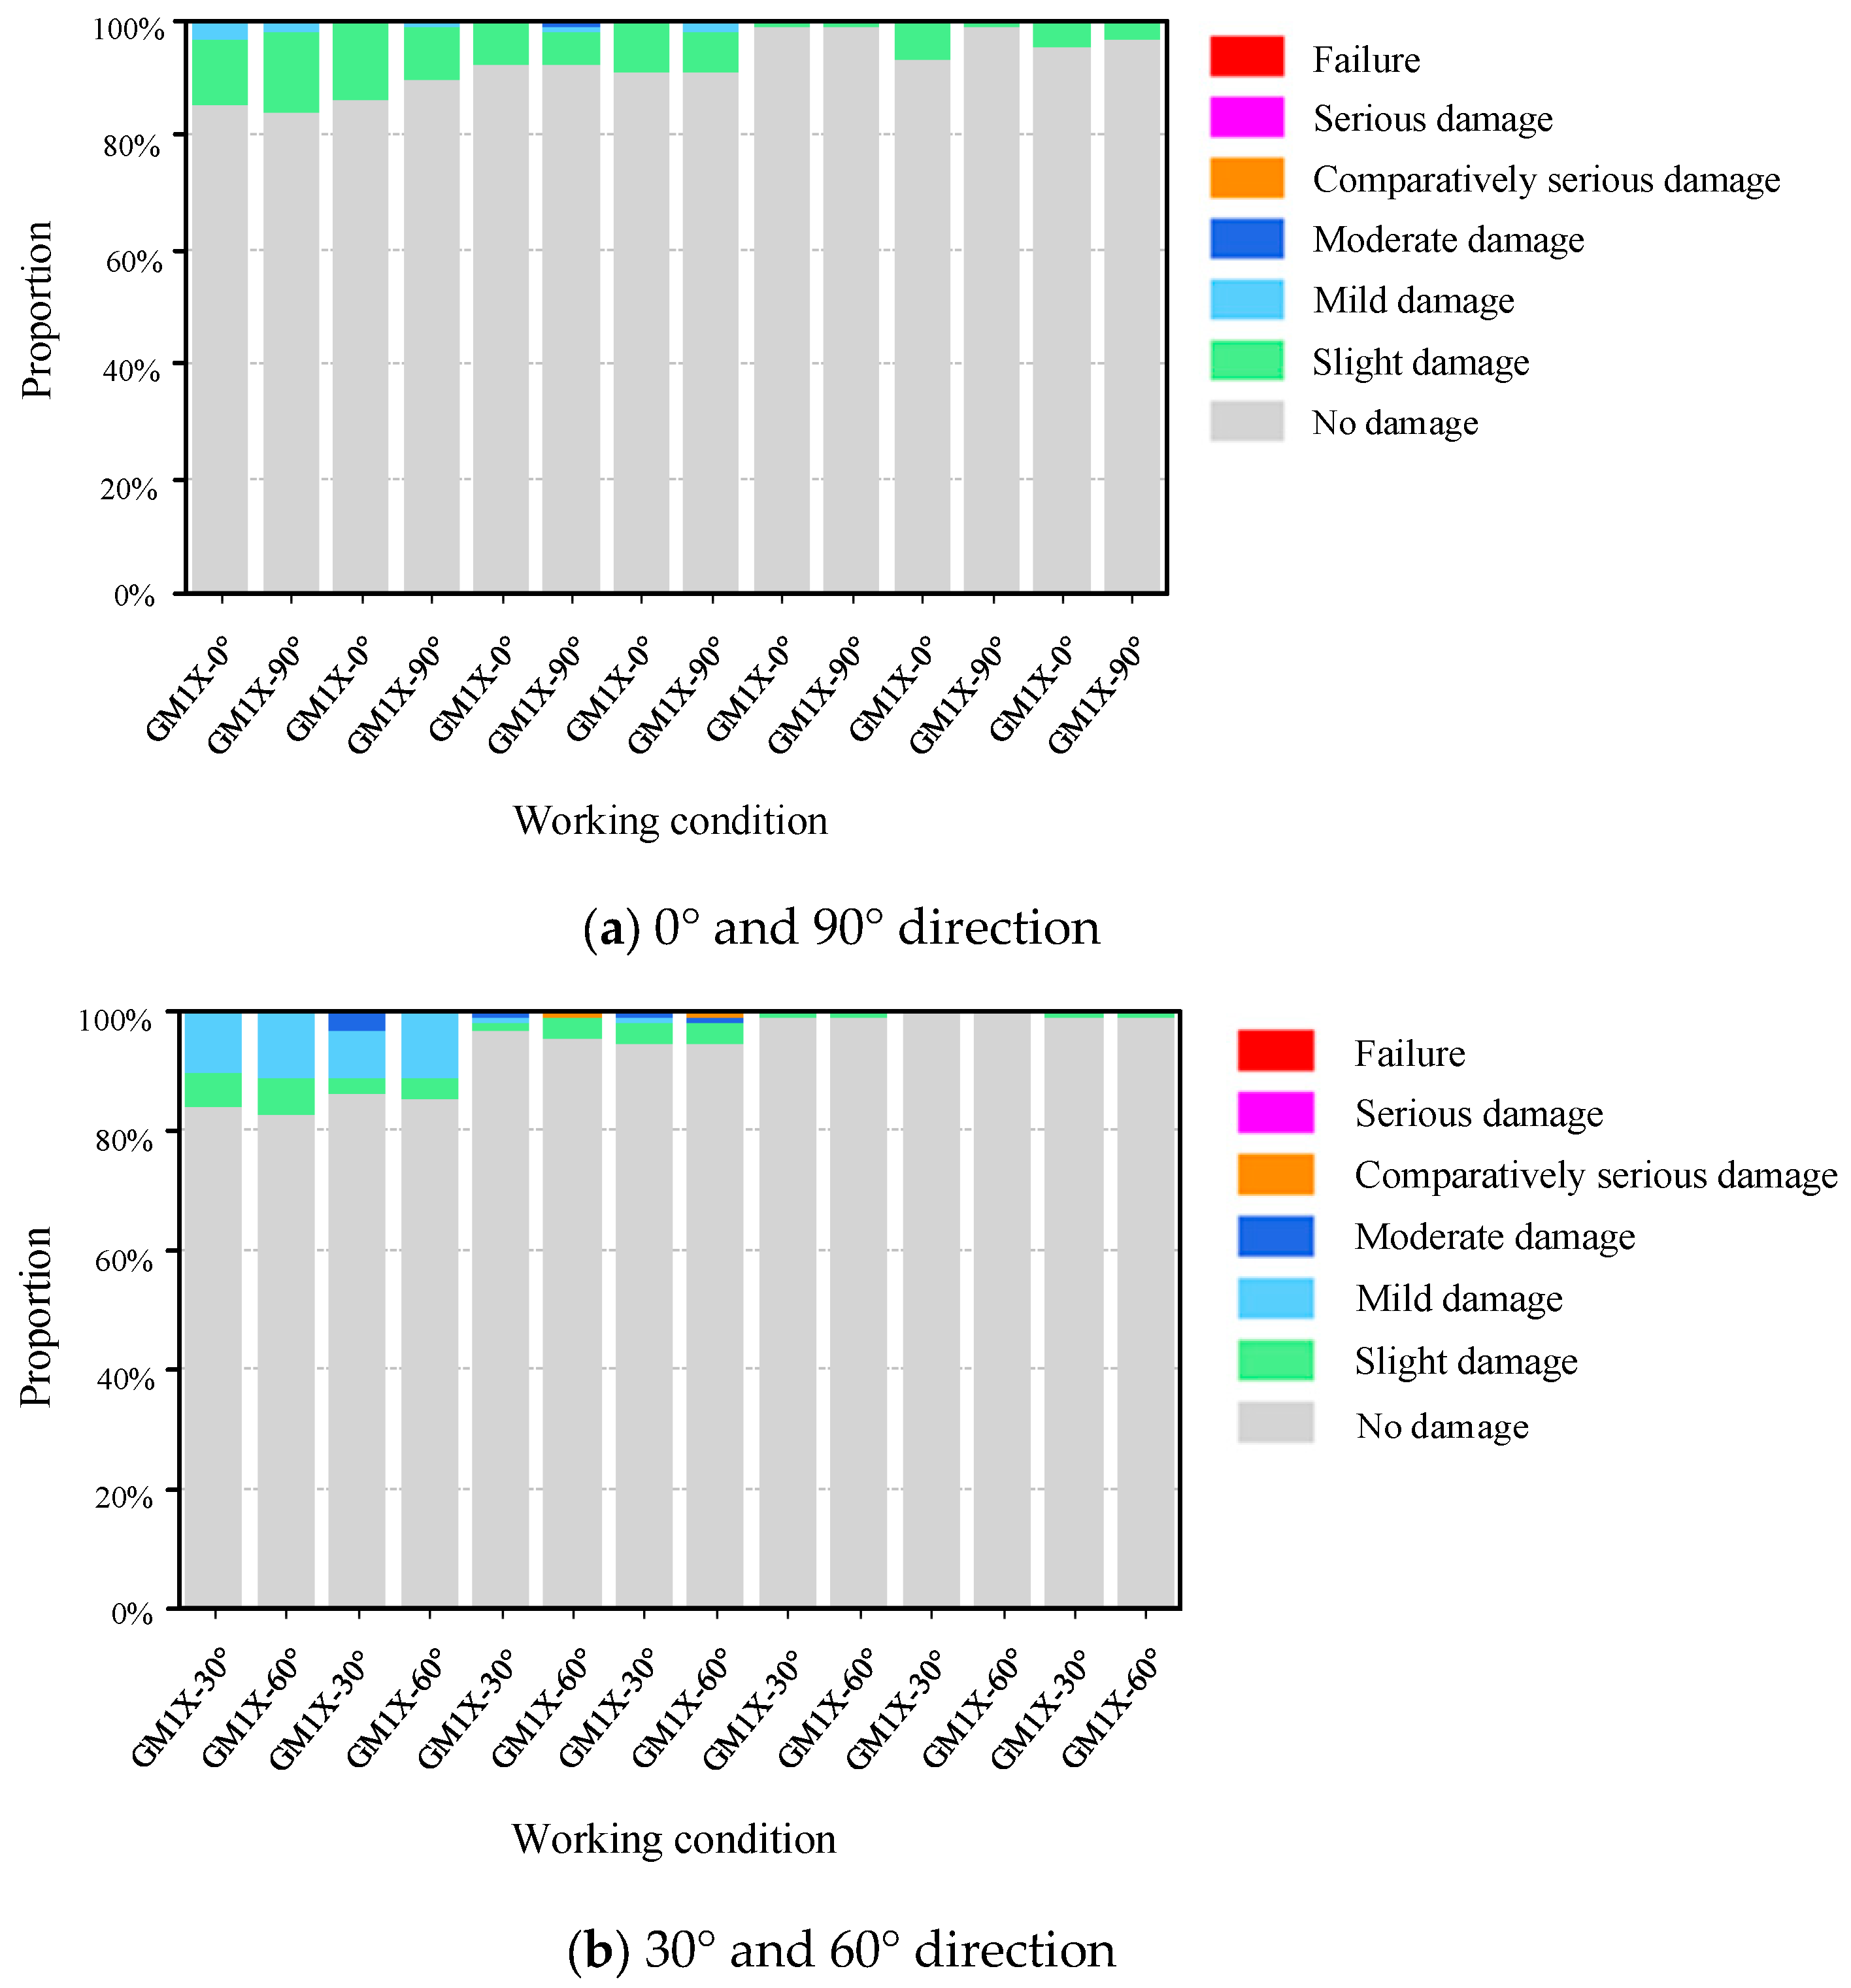
The statistical results for the performance states of ST-RC columns under different seismic conditions (0°, 30°, 60°, and 90° directions) are depicted in Figure 20a,b, with the average values summarized in Table 23. The damage degrees in the 0°, 30°, 60°, and 90° directions were similar, as shown in Table 23. This is because the ST-RC columns were positioned at the internal staggered floor rather than at the structural boundary. Their load-carrying capacity primarily depended on the concrete inside the steel tube, which was designed to be circular with axisymmetric characteristics, reducing the effect of seismic directionality to a certain extent. The ST-RC columns were primarily undamaged, with an average undamaged state of 93% across all four directions, which is significantly better compared to conventional frame columns. This is attributed to the presence of the steel tube, which confines the concrete inside, enhancing the axial load-bearing capacity and ductility. Additionally, the reinforced concrete outside the steel tube provides a certain degree of confinement to the internal steel tube. However, under the GM3Y-60° and GM4Y-60° conditions, comparatively severe damage was observed, reaching 1.16%. In light of the discrete nature of seismic waves, the deformation of ST-RC columns remained satisfactory under most working conditions, satisfying the requirements for performance level 4. The results demonstrated that the seismic performance of ST-RC columns designed according to current codes was robust even under an eight-degree rare earthquake. Figure 21 shows the diagram of the positive section performance state of ST-RC columns on the second floor under the envelope values of earthquake conditions. Among all floors, the ST-RC columns on the second floor are in the most severely damaged state, with the proportion of slight damage being 10.00%.
(2)
Performance evaluation of ST-RC columns in the oblique section
In accordance with the requirements of performance level 4, ST-RC columns shall satisfy the condition that the oblique section bearing capacity does not exceed the minimum section requirement; the specific limit values of flexure-controlled elastic–plastic drift angles for such members are the same as those for reinforced concrete columns.
Table 24 displays the average performance state statistics of the oblique section of the ST-RC columns under seven seismic conditions with ground motion input directions of 0°, 30°, 60°, and 90°. The table indicates that the columns meet the performance objectives, satisfying the minimum cross-section requirements for all directions of the ground motion input.

4.2.6. Energy Dissipation of Structural Members

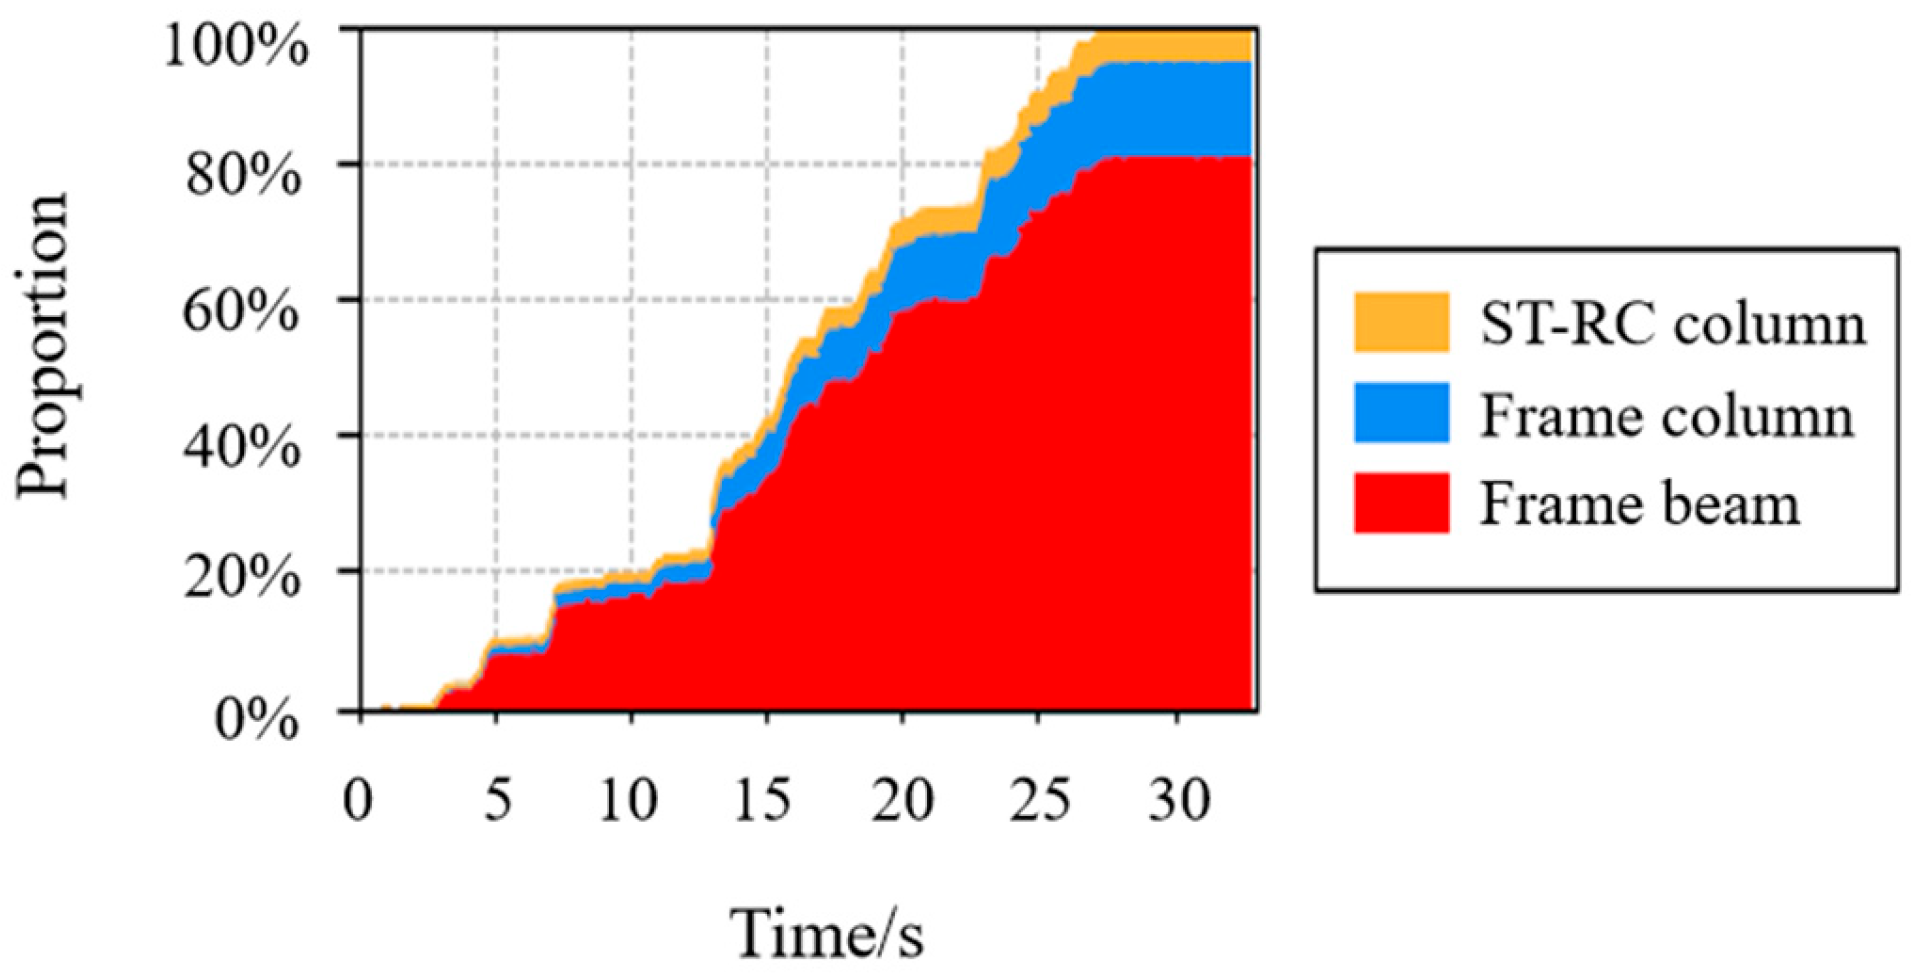
Table 25 presents the average nonlinear strain energy shares of the three member types under seismic conditions in the 0°, 30°, 60°, and 90° directions. The frame beams known for their energy dissipation exhibited the highest proportion of nonlinear strain energy, reaching a maximum of 83.52% at 0° and a minimum of 66.64% at 60°. The nonlinear strain energy share in the reinforced concrete frame columns exceeded that of the ST-RC columns. The frame beams in the 0° and 90° directions accounted for more strain energy than those at 30° and 60°, aligning with the more severe damage observed in Section 4.2.3., under 0° and 90° ground motion input. In contrast, the frame columns and ST-RC columns consumed more nonlinear strain energy in the 30° and 60° directions, suggesting that these directions were less favorable for plastic energy dissipation. However, the energy dissipation percentage of the frame beams significantly exceeded that of the frame columns and ST-RC columns. This demonstrated the role of the frame beam as a significant energy-dissipating member, ensuring the overall safety of the structure.
Using the GM1X-0° case as an example, the energy-dissipation diagram in Figure 22 illustrates that the frame beam, as an energy-consuming member, initially absorbed seismic effects. The frame and ST-RC columns began to absorb a small amount of energy nearly simultaneously at approximately 2 s. Although there was a slight increase in the energy dissipation ratio of these column types at 3 s, the frame beam still exhibited the highest dissipation ratio and rate of increase. By 4.6 s, the energy dissipation ratios for the frame beam and frame column were 6.99%, 1.21%, and 0.39% for the ST-RC column, respectively. At this point, the frame column’s energy dissipation ratio exceeded 1% for the first time, indicating that it surpassed that of the ST-RC column in terms of the energy dissipation ratio. The ST-RC column surpassed the 1% energy dissipation ratio at 12.9 s. Following the trend of framed beams exhibiting the fastest increase in energy dissipation percentage, at 32.9 s, the frame beams consumed 81.34% of the energy, frame columns consume 14.21%, and ST-RC columns consume 4.45%. Therefore, during an earthquake, the energy dissipation sequence was initiated by the frame beams, followed by two types of columns. The frame beam consistently maintained the highest energy–dissipation rate, followed by the frame column.

5. Discussion

(1)
The results of this study confirm that inputting ground motions from multiple angles to the staggered floor frame structure can identify the most unfavorable angle for seismic performance. If ground motions are input only along the principal axes (0° and 90°) of the structure, the impact on seismic performance may be underestimated. However, there are certain limitations in the selection of ground motion angles. More angles should be set to achieve a more comprehensive evaluation of the staggered floor frame structure.
(2)
In addition, in the validation test of the effectiveness of ST-RC columns, although the fiber element method considered the coupling effect of axial force and bending moment, the coupling effect of shear force was not taken into account. The error between the test and simulation may be caused by the lack of shear coupling.
(3)
It is worth noting that the installation of ST-RC at staggered floors can enhance the ductility of short columns. In addition, compared with traditional evaluation methods, the evaluation method applied in this study can comprehensively capture the damage status of both the whole structure and its members in irregular structures such as staggered floor frames, with more detailed division of performance objectives. However, this evaluation method has not been applied to more other members such as shear walls, and its applicability needs to be further verified.

6. Conclusions

Based on the seismic performance evaluation method considering both the overall structure and its members, this paper evaluates the seismic performance of a partially staggered RC frame structure under ground motion input angles of 0°, 30°, 60°, and 90°. The main conclusions are as follows:
(1)
From the analysis of the overall structure, the inter-story drift angle of the fourth floor is the largest under most working conditions; therefore, the fourth floor is the weak story of the structure. The average inter-story drift angle in the 60° direction is the largest, which is 1.57 times that in the 0° direction, indicating that the 60° direction is the most unfavorable ground motion input angle for the structure. Under ground motions in the 0° and 90° directions, and under those in the 30° and 60° directions, the structural performance changes are similar. Compared with the 0° and 90° directions, the proportion of nonlinear strain energy in the 30° and 60° directions increases by approximately 24%. This confirms that the most unfavorable angle for staggered frame structures under seismic action is neither 0° nor 90°.
(2)
From the analysis of structural members, the section deformations of frame beams, frame columns, and ST-RC columns under seven seismic working conditions with four angular seismic waves all meet the requirements of performance level 4. Frame beams and columns are more severely damaged under ground motion input in the 30° and 60° directions, while the damage degree of ST-RC columns in the four directions is similar, with the average value of the undamaged state in the four directions being 93%. It can be seen that ST-RC columns used in partially staggered stories have good seismic performance and can enhance the ductility of short columns.
(3)
The proportion of nonlinear strain energy of frame beams in the 0° and 90° directions is larger than that in the 30° and 60° directions, while frame columns and ST-RC composite columns consume more nonlinear strain energy in the 30° and 60° directions compared with the 0° and 90° directions. The 30° and 60° directions represent more unfavorable plastic energy dissipation modes, which also indicates that the most unfavorable angle of the structure is neither 0° nor 90°.
(4)
The proportion of nonlinear strain energy of frame beams as energy-dissipating members is significantly higher than that of frame columns and ST-RC, and the proportion of nonlinear strain energy of frame columns is larger than that of ST-RC columns. From the perspective of member energy dissipation, the structure has a high safety reserve. The order of energy dissipation is that frame beams start to dissipate energy first, followed by frame columns and ST-RC columns. Moreover, the energy dissipation rate of frame beams remains the fastest, followed by frame columns, and ST-RC columns have the slowest energy dissipation rate. This indicates that the application of ST-RC columns can improve ductility.
(5)
In future research, the ST-RC columns can be validated through more comprehensive axial–bending–shear coupling tests. Meanwhile, more ground motion angles should be considered, and the evaluation method should be applied to more members to verify its practicality.

Author Contributions

Conceptualization, S.Z. and E.W.; data curation, L.G. (Lihua Ge); formal analysis, E.W.; funding acquisition, S.Z. and J.T.; investigation, L.G. (Long Guo) and J.T.; methodology, S.Z. and J.T.; project administration, S.Z.; resources, L.G. (Lihua Ge); software, L.G. (Lihua Ge); supervision, S.Z. and J.T.; validation, L.G. (Long Guo), E.W. and J.T.; visualization, L.G. (Long Guo); writing—original draft, E.W.; writing—review and editing, L.G. (Long Guo). All authors have read and agreed to the published version of the manuscript.

Funding

This research was supported by Open Fund of School–Enterprise Joint Research Center of Underground Structure Earthquake Resistance, Shaanxi Province “Four Main Bodies and One Joint” (Grant No. KY2024-ZD01).

Institutional Review Board Statement

Not applicable.

Informed Consent Statement

Not applicable.

Data Availability Statement

The data presented in the study are available on request from the corresponding author. The data are not publicly available due to privacy.

Acknowledgments

We appreciate Junfu Tong’s fund support for this research.

Conflicts of Interest

Author Junfu Tong was employed by Shaanxi Modern Architectural Design and Research Institute Co., Ltd. The remaining authors declare that the research was conducted in the absence of any commercial or financial relationships that could be construed as a potential conflict of interest.

References

  1. Cao, H. Seismic Performance Analysis of RC Frame Structure with Staggered Floor. Master’s Thesis, Nanchang Hangkong University, Nanchang, China, 2019. [Google Scholar]
  2. Liu, P.; Xu, K.C. Influence of staggered floor on loading performance of the structure and the analysis of design points. Sci.-Technol. Info. Dev. Econ. 2004, 12, 209–210. [Google Scholar] [CrossRef]
  3. Long, J.T.; Chen, Y.; Wang, H.; Li, L.H. Seismic Performance Analysis of Staggered Floors in Frame Structures. Struct. Eng. 2018, 34, 58–65. [Google Scholar] [CrossRef]
  4. Meng, F.Q.; Li, J. Seismic design of a high-rise office building with staggered floor structure. Urban Archit. 2016, 8, 51–70. [Google Scholar] [CrossRef]
  5. Wu, D.J.; Zhao, X.F.; Zhou, J. Seismic performance study on a high-rise out-of-code shear wall structure with top indentation and bottom staggered floors. Build. Struct. 2020, 50, 81–85. [Google Scholar] [CrossRef]
  6. Xu, W.; Liang, S.T. Experimental study on the seismic performance of staggered slab-column joints. J. Southeast Univ. 2021, 37, 408–412. [Google Scholar] [CrossRef]
  7. Heidari, A.; Tafakori, E. Seismic Performance and Resilience Assessments of Concrete Filled Tube (CFT) Composite Column Buildings. J. Struct. Constr. Eng. 2024, 11, 18–38. [Google Scholar] [CrossRef]
  8. Kim, Y.-c.; Shahriyer, H.; Hu, J.-w. Seismic Performance Evaluation According to HSS and ST-RC Columns of 3D Frame Buildings with Rubber Friction Bearing (RFB). Materials 2022, 15, 1281. [Google Scholar] [CrossRef]
  9. Mata, R.; Nuñez, E.; Forcellini, D. Seismic Resilience of Composite Moment Frames buildings with Slender Built-up Columns. J. Build. Eng. 2025, 111, 113532. [Google Scholar] [CrossRef]
  10. Judd, J.P.; Pakwan, N. Seismic performance of steel moment frame office buildings with square concrete-filled steel tube gravity columns. Eng. Struct. 2018, 172, 41–54. [Google Scholar] [CrossRef]
  11. Gibson, E.J. Working with the Performance Approach to Building; CIB Report No. 64; International Council for Building Research Studies and Documentation: Rotterdam, The Netherlands, 1982. [Google Scholar]
  12. Spekkink, D. Performance Based Design of Buildings; PeBBu Domain 3 Final Report; International Council for Building Research Studies and Documentation: Rotterdam, The Netherlands, 2005. [Google Scholar]
  13. Sayın, S.; Çelebi, G. A practical approach to performance-based building design in architectural project. Build. Res. Inf. 2020, 48, 446–468. [Google Scholar] [CrossRef]
  14. Zeng, F.L.; Huang, Y.S.; Zhou, J.; Bu, G.B. Seismic fragility analysis and index evaluation of concrete-filled steel tube column frame-core tube structures. J. Asian. Archit. Build. Eng. 2022, 21, 2371–2387. [Google Scholar] [CrossRef]
  15. Zhai, Z.P.; Guo, W.; Li, Y.Z.; Yu, Z.W.; Cao, H.P.; Bu, D. An improved performance-based plastic design method for seismic resilient fused high-rise buildings. Eng. Struct. 2019, 199, 109650. [Google Scholar] [CrossRef]
  16. AbdelMalek, H.; Hassan, T.K.; Moustafa, A. Nonlinear time history analysis evaluation of optimized design for medium to high rise buildings using performance-based design. Ain Shams Eng. J. 2023, 14, 102081. [Google Scholar] [CrossRef]
  17. Yang, Q.; Zhang, Y.J.; Yu, S.L.; Zhang, Q.L.; Chen, X.X. Performance-Based seismic design and evaluation of out-of-code structure on Nanjing Financial City. Structures 2023, 48, 1102–1117. [Google Scholar] [CrossRef]
  18. Peng, C.; Guner, S. Direct displacement-based seismic assessment of concrete frames. Comput. Concr. 2018, 21, 355–365. [Google Scholar] [CrossRef]
  19. Vargas, A.Y.F.; Pujades, B.L.G.; Barbat, A.H.; Hurtado, G.J.E.; Diaz, A.S.A.; Hidalgo, L.D.A. Probabilistic seismic damage assessment of reinforced concrete buildings considering directionality effects. Struct. Infrast. Eng. 2018, 14, 817–829. [Google Scholar] [CrossRef]
  20. Gong, J.; Zhi, X.D.; Shao, Y.B.; Luo, Y.H. Progress in the study of seismic incidence directionality effects on civil engineering structures. Eng. Mech. 2023, in press. [Google Scholar]
  21. Pavlidou, C.; Komodromos, P. Peak seismic response of a symmetric base-isolated steel building: Near vs. far fault excitations and varying incident angle. Earthq. Struct. 2020, 18, 349–365. [Google Scholar] [CrossRef]
  22. Bugueño, I.; Carvallo, J.; Vielma, J.C. Influence of directionality on the seismic response of typical RC buildings. Appl. Sci. 2022, 12, 1534. [Google Scholar] [CrossRef]
  23. Du, J.W.; Pan, W.; Liu, J.; Feng, C.L.; Jin, Y.C. Seismic analysis of irregular structure considering seismic input angle. Earthq. Resist. Eng. Retrofit. 2022, 44, 113–120. [Google Scholar] [CrossRef]
  24. Tondini, N.; Zanon, G.; Pucinotti, R.; Filippo, R.D.; Bursi, O.S. Seismic performance and fragility functions of a 3D steel-concrete composite structure made of high-strength steel. Eng. Struct. 2018, 174, 373–383. [Google Scholar] [CrossRef]
  25. Magliulo, G.; Maddaloni, G.; Petrone, C. Influence of earthquake direction on the seismic response of irregular plan RC frame buildings. Earthq. Eng. Eng. Vibr. 2014, 13, 243–256. [Google Scholar] [CrossRef]
  26. Alam, Z.; Sun, L.; Zhang, C.; Samali, B. Influence of seismic orientation on the statistical distribution of nonlinear seismic response of the stiffness-eccentric structure. Structures 2022, 39, 387–404. [Google Scholar] [CrossRef]
  27. Zhang, C.; Alam, Z.; Samali, B. Evaluating contradictory relationship between floor rotation and torsional irregularity coefficient under varying orientations of ground motion. Earthq. Struct. 2016, 11, 1027–1041. [Google Scholar] [CrossRef]
  28. Liang, W.; Xia, L.; Zhu, Z.; Mou, S.; Zou, Z.; Yuan, S. Torsional effect of the single-bay masonry building considering seismic wave incident angle. Structures 2022, 44, 1232–1246. [Google Scholar] [CrossRef]
  29. Ren, C.C.; Liu, J.J.; Xu, Z.G.; Hao, W. Effect of multi-angle inputs on seismic performance of supertall buildings. In Proceedings of the 22nd Annual Conference of the Beijing Mechanics Society, Beijing, China, 9 January 2016. [Google Scholar]
  30. Zhang, S.Y.; Liu, J.B.; Dai, H.J.; Wang, L.; Gao, X.Y. Seismic vulnerability analysis of partially staggered RC frame structures with laminated columns. China Sci. Technol. Pap. 2024, 19, 275–283. [Google Scholar] [CrossRef]
  31. GB 50010-2010; Code for Design of Concrete Structures. China Architecture & Building Press: Beijing, China, 2015.
  32. GB 50011-2010; Code for Seismic Design of Buildings. China Architecture & Building Press: Beijing, China, 2016.
  33. Zhao, J.G.; Du, B.; Zhan, Y.L. Applicability of Mander model in OpenSees for simulation of hysteretic behavior of reinforced concrete column. J. Lanzhou Univ. Technol. 2017, 43, 127–133. [Google Scholar] [CrossRef]
  34. Han, L.H. Concrete Filled Steel Tubular Structures: Theory and Practice, 2nd ed.; Science Press: Beijing, China, 2007. [Google Scholar]
  35. Jia, L.P.; Guo, Z.X.; Liu, Y.; Liu, Y.; Gao, Y.C. Study on axial compression mechanism and design method of core steel tubular reinforced concrete short columns. Earthq. Eng. Eng. Vibr. 2015, 35, 79–85. [Google Scholar] [CrossRef]
  36. Liu, Y.; Guo, Z.X.; Jia, L.P.; Chen, Q.M. Experimental study on axial compression performance and design method of core steel tube reinforced concrete short columns. J. Build. Struct. 2015, 36, 135–142. [Google Scholar] [CrossRef]
  37. Wang, E. Seismic Performance Analysis of Local RC Staggered Frame Structure Based on Fiber Model. Master’s Thesis, Xi’an University of Science and Technology, Xi’an, China, 2022. [Google Scholar] [CrossRef]
  38. JGJ 3-2010; Technical Specification for Concrete Structures of Tall Building. China Building Industry Press: Beijing, China, 2010.
  39. Lin, J.C.; Han, X.L.; Wu, Z.N.; Dong, Y.; Ji, J.; Liu, J.C. Development and application of out-of-plane deformable X-shaped brace for energy dissipation and thermal stress mitigation: An experimental and numerical study. Thin-Walled. Struct. 2024, 203, 112186. [Google Scholar] [CrossRef]
  40. Dan, K. Study on Elastic-Plastic Behavior of Frame-Core Wall Hybrid Structure Under Bi-Directional Horizontal Earthquakes. Master’s Thesis, Xi’an University of Architecture and Technology, Xi’an, China, 2014. [Google Scholar]
  41. Miu, Z.W.; Ye, L.P. Study on distribution of cumulative hysteretic energy in reinforced concrete frame-coupled shear wall. Eng. Mech. 2010, 27, 130–141. [Google Scholar]
  42. Li, A.Q. Research on the Drift Limits of Frame-Supported Shear Wall Structure Under Seismic Load. Master’s Thesis, South China University of Technology, Guangzhou, China, 2020. [Google Scholar] [CrossRef]
  43. DBJ/T15-151-2019; Specification for Performance-Based Seismic Design of Reinforced Concrete Building Structure. Guangdong Provincial Department of Housing and Urban-Rural Development: Guangzhou, China, 2019.
  44. Han, X.L.; Ji, J. Performance-Based Seismic Design of Reinforced Concrete Structures: Theoretical Research, Experimental Studies, Design Methodologies, and Engineering Applications; China Architecture & Building Press: Beijing, China, 2019. [Google Scholar]
  45. ASCE/SEI 41-13; Seismic Evaluation of Civil and Retrofit of Existing Building. America Society of Civil Engineers: Reston, VA, USA, 2014.
  46. Cui, J.D.; Han, X.L.; Ji, J. Experimental study on deformation limits of RC beams. J. Harbin Inst. Technol. 2018, 50, 169–176. [Google Scholar]
Figure 1. First floor structural layout plan.
Applsci 15 09092 g001
Figure 2. Structural staggered section.
Applsci 15 09092 g002
Figure 3. Concrete constitutive skeleton curve.
Applsci 15 09092 g003
Figure 4. Material constitutive relations.
Applsci 15 09092 g004
Figure 5. Schematic diagram of concrete compressive hysteretic model.
Applsci 15 09092 g005
Figure 6. Schematic diagram of steel hysteretic model.
Applsci 15 09092 g006
Figure 7. Schematic diagram of fiber division of beam and column members.
Applsci 15 09092 g007
Figure 8. Schematic diagram of test loading and reinforcement of ST-RC columns.
Applsci 15 09092 g008
Figure 9. Comparison of load–deformation curves.
Applsci 15 09092 g009
Figure 10. Structural elastic–plastic analysis model.
Applsci 15 09092 g010
Figure 11. Comparison between multi-wave response spectrum with canonical response spectrum.
Applsci 15 09092 g011
Figure 12. Inter-story displacement angle curves.
Applsci 15 09092 g012
Figure 13. GM1 structural energy dissipation diagram under the action of ground motion.
Applsci 15 09092 g013
Figure 14. Performance states and displacement angle limits of members.
Applsci 15 09092 g014
Figure 15. Flow chart for seismic performance evaluation based on member deformation.
Applsci 15 09092 g015
Figure 16. Statistical diagram of performance states of frame beams in the positive section.
Applsci 15 09092 g016aApplsci 15 09092 g016b
Figure 17. Diagram of the positive section performance state of frame beams on the third floor under the envelope values of earthquake conditions.
Applsci 15 09092 g017
Figure 18. Statistical diagram of performance states of frame columns in the positive section.
Applsci 15 09092 g018
Figure 19. Diagram of the positive section performance state of reinforced concrete columns on the first floor under the envelope values of earthquake conditions.
Applsci 15 09092 g019
Figure 20. Statistical diagram of performance states of ST-RC columns in the positive section.
Applsci 15 09092 g020
Figure 21. Diagram of the positive section performance state of ST-RC columns on the second floor under the envelope values of earthquake conditions.
Applsci 15 09092 g021
Figure 22. Energy dissipation diagram of members at GM1X-0°.
Applsci 15 09092 g022
Table 1. Concrete strength grade.
Structural MembersFrame ColumnBeam and Floor Slab
Number of floorsBelow two floors2–4 floors4–6 floorsBelow two floorsAbove three floors
Strength gradeC50C45C40C40C35
Table 2. Section parameters of the first-floor beam members.
Reinforcement TypeSize (mm)Upper ReinforcementLower ReinforcementStirrup
Main beam (horizontal)350 × 7002C25 + (2C12)2C22/4C25C10@100/200 (4)
Main beam (longitudinal)350 × 8002C25 + (2C12)2C25 + 3C22C10@100/200 (4)
Secondary beam250 × 5002C222C20C8@200 (2)
Table 3. Section parameters of the column members.
Number of FloorsSize (mm)B-Side ReinforcementH-Side ReinforcementCorner ReinforcementStirrup
First and second floors700 × 7005C254C254C28C10@100/200
Third and fourth floors650 × 6503C253C254C25C10@100/200
Fifth and sixth floors600 × 6003C253C254C25C10@100/200
Table 4. Section parameters of the ST-RC columns.
Size (mm)Steel Pipe Size (mm)B-Side ReinforcementH-Side ReinforcementCorner ReinforcementStirrup
700 × 700325 × 143C283C254C28C12@100
377 × 145C283C284C28C12@100
800 × 800377 × 145C323C284C28C12@100
Table 5. The parameters of specimen.
Specimenfcu (MPa)fcu,c (MPa)D (mm)ξρa (%)
CSTRC24451.31401.331.6
CSTRC54451.31681.522.5
Note: fcu is the compressive strength of the concrete cube; fcu,c is the compressive strength of the concrete cube in the steel tube; D is the outer diameter of steel tube; ξ is the constraint coefficient of the steel tube; ρa is the reinforcement ratio.
Table 6. The parameters of steel.
TypeD (t)/(mm)fy (MPa)fu (MPa)E (×105 N/mm2)
Steel reinforcement8340.0471.72.24
16356.7500.02.04
Steel tube6347.5507.52.65
8351.7528.32.28
Note: D is the diameter of steel reinforcement, t is the wall thickness of steel tube; fy is the yield strength of steel; fu is the tensile strength of steel; E is the elastic modulus of steel.
Table 7. Comparison between test peak load and simulated peak load.
Test SpecimenNu
(MN)
Ncu
(MN)
Nu/Ncu
CSTRC27.227.101.02
CSTRC57.908.040.98
Note: Nu is the peak load capacity of the test specimen, and Ncu is the peak load capacity of the specimen obtained from the finite element simulation.
Table 8. Uniformly distributed live loads on the structure. (kN/m2).
LocationLoad
Accessible roof2.0
Inaccessible roof0.5
Training classrooms, public classrooms2.5
Offices, meeting rooms2.0
Lecture hall3.0
Corridors, staircases, foyers2.5
Restrooms2.5
Rock sample repository10.0
Artwork exhibition area, science and technology exhibition hall4.0
Comprehensive geological experiment and training room15.0
Elevator machine room7.0
Table 9. Structural dynamic characteristic parameters.
ModeVibration PatternPeriod (s)Period Difference
PERFORM-3DYJK
1X-direction translation1.2651.2922.1%
2Y-direction translation1.1041.1453.6%
3Torsion1.0501.1145.7%
Table 10. Basic information of seismic waves.
EventsNaming in This PaperStylePGA (g)MagnitudeStationDate
AR5_2019_2GM1Artificial wave----
AR5_2019_5GM2Artificial wave----
NOCH516212GM3Natural wave0.135.5NODA2016
NOFK401230GM4Natural wave0.235.9HIRONO2012
NOIW725035GM5Natural wave0.066.3KITAKAMI2011
NOSI180758GM6Natural wave0.106.1OHTSU2018
NOTC319185GM7Natural wave0.266.1IMAICHI2011
Table 11. Statistical results of relative error between seismic wave response spectrum and canonical response spectrum.
PeriodGM1GM2GM3GM4GM5GM6GM7Mean Error Value
First period−4.34%10.09%1.27%2.79%−1.20%−3.98%9.23%2.46%
Second period−2.67%−2.39%−3.15%0.15%1.45%−2.72%3.84%−0.30%
Third period1.37%−6.95%−2.26%2.26%2.46%−5.96%12.38%0.66%
Table 12. Ratio of nonlinear strain energy to total energy dissipation.
Input AngleSeismic WaveAverage Value
GM1GM2GM3GM4GM5GM6GM7
43.57%37.36%23.54%46.32%17.81%34.01%30.03%33.23%
30°56.83%51.89%28.79%51.09%21.30%42.70%38.36%41.57%
60°57.31%52.08%27.64%50.83%21.01%41.96%38.37%41.31%
90°42.80%37.16%24.44%46.38%18.50%34.48%29.41%33.31%
Table 13. Seismic performance objectives and their corresponding performance levels.
Performance ObjectiveABCD
Earthquake Level
Frequent earthquake1111
Design basis earthquake1234
Rare earthquake2345
Table 14. Classification of failure modes for beam members.
Failure ModeShear–Span RatioFlexure–Shear Ratio
Flexure-controlledλ ≥ 2.0m ≤ 1.0
Flexure–shear controlled1.0 ≤ λ < 2.0m ≤ 0.5λ
λ ≥ 2.01.0 < m ≤ 0.5λ
Shear-controlledOthers
Table 15. Classification of failure modes for column members.
Failure ModeShear–Span RatioFlexure–Shear Ratio
Flexure-controlledλ ≥ 2.0m ≤ 0.6
Flexure–shear controlledλ ≥ 2.00.6 < m ≤ 1.0
2.0 > λ ≥ 1.4m ≤ 1.0
Shear-controlledOthers
Table 16. Elastic–plastic rotation angle limits for beam members.
Member ParametersPerformance Level
No DamageSlight DamageMild DamageModerate DamageComparative DamageSevere Damage
Flexure-controlled
m ≤ 0.2 ρ v ≥ 0.0120.0040.0160.0240.0310.0390.044
m ≥ 0.8 ρ v ≥ 0.0120.0040.0180.0290.0390.0490.054
m ≤ 0.2 ρ v ≤ 0.0010.0040.010.0110.0130.0140.017
m ≥ 0.8 ρ v ≤ 0.0010.0040.0120.0160.020.0240.029
Flexure–shear controlled
m ≤ 0.5 ρ sv ≥ 0.0080.0040.0090.0140.0190.0240.026
m ≥ 2.5 ρ sv ≥ 0.0080.0040.0070.0090.0120.0140.016
m ≤ 0.5 ρ sv ≤ 0.00050.0040.0070.0090.0120.0140.016
m ≥ 2.5 ρ sv ≤ 0.00050.0040.0050.0070.0080.0090.012
In the table, m represents the flexure–shear ratio, ρ v denotes the volume stirrup ratio, and ρ sv stands for the area stirrup ratio.
Table 17. Elastic–plastic rotation angle limits for column members.
Member ParametersPerformance Level
No DamageSlight DamageMild DamageModerate DamageComparative DamageSevere Damage
Flexure-controlled
n ¯ ≤ 0.1 ρ v ≥ 0.0210.0040.0180.0270.0370.0460.056
n ¯ = 0.6 ρ v ≥ 0.0210.0040.0130.0180.0220.0270.03
n ¯ ≤ 0.1 ρ v ≤ 0.0010.0040.0150.0220.0290.0360.042
n ¯ = 0.6 ρ v ≤ 0.0010.0040.0090.0110.0120.0130.014
Flexure–shear controlled
n ¯ ≤ 0.1m ≤ 0.60.0030.0130.020.0260.0330.040
n ¯ = 0.6m ≤ 0.60.0030.0090.0110.0140.0160.018
n ¯ ≤ 0.1m ≥ 1.00.0030.0110.0160.0210.0260.028
n ¯ = 0.6m ≥ 1.00.0030.0080.0090.0110.0120.014
In the table, n ¯ is the axial compression ratio, m is the flexure–shear ratio, and ρ v is the volume stirrup ratio.
Table 18. Performance verification method for shear-controlled members under performance level 4.
Performance Level 4Key MembersOrdinary Vertical MembersEnergy-Dissipating Members
Positive sectionNon-yielding check or deformation not exceeding slight damageNon-yielding check or deformation not exceeding slight damageDeformation not exceeding severe damage
Inclined sectionNon-yielding checkMinimum cross-section checkMinimum cross-section check
Table 19. Average performance state statistics of frame beams in the positive section.
Input AngleNo DamageSlight DamageMild DamageModerate DamageComparatively Severe damageSevere DamageFailure
38.63%58.67%2.60%0.10%0.00%0.00%0.00%
30°81.11%18.81%0.08%0.00%0.00%0.00%0.00%
60°79.60%20.16%0.24%0.00%0.00%0.00%0.00%
90°37.48%59.37%3.15%0.00%0.00%0.00%0.00%
Table 20. Average performance state statistics of frame beam in the oblique section.
Input AngleShear ElasticityShear UnyieldingShear LimitSatisfying the Minimum Cross-SectionCross-Section Exceedance
99.76%0.24%0.00%0.00%0.00%
30°100%0%0.00%0.00%0.00%
60°100%0%0.00%0.00%0.00%
90°99.59%0.41%0.00%0.00%0.00%
Table 21. Average performance state statistics of frame columns in the positive section.
Input AngleNo DamageSlight DamageMild DamageModerate DamageComparatively Severe damageSevere DamageFailure
86.71%13.29%0.00%0.00%0.00%0.00%0.00%
30°57.21%37.23%5.56%0.00%0.00%0.00%0.00%
60°55.64%38.80%5.33%0.23%0.00%0.00%0.00%
90°84.72%15.28%0.00%0.00%0.00%0.00%0.00%
Table 22. Average performance state statistics of frame column in the oblique section.
Input AngleShear ElasticityShear UnyieldingShear LimitSatisfying the Minimum Cross-SectionCross-Section Exceedance
100%0%0.00%0.00%0.00%
30°100%0%0.00%0.00%0.00%
60°100%0%0.00%0.00%0.00%
90°100%0%0.00%0.00%0.00%
Table 23. Average performance state statistics of the ST-RC column in the positive section.
Input AngleNo DamageSlight DamageMild DamageModerate DamageComparatively Severe damageSevere DamageFailure
91.54%7.96%0.50%0.00%0.00%0.00%0.00%
30°94.02%2.16%2.99%0.83%0.00%0.00%0.00%
60°93.53%2.66%3.32%0.16%0.33%0.00%0.00%
90°92.86%5.98%1.00%0.16%0.00%0.00%0.00%
Table 24. Average performance state statistics of the ST-RC column in the oblique section.
Input AngleShear ElasticityShear UnyieldingShear LimitSatisfying the Minimum Cross-SectionCross-Section Exceedance
97.84%1.33%0.83%0.00%0.00%
30°100%0%0.00%0.00%0.00%
60°100%0%0.00%0.00%0.00%
90°97.84%1.83%0.33%0.00%0.00%
Table 25. Average value of nonlinear strain energy in total nonlinear strain energy of unit group.
Input AngleFrame BeamsFrame ColumnsST-RC Columns
83.52%12.72%3.76%
30°70.76%20.85%8.32%
60°66.64%25.44%7.85%
90°82.23%13.71%4.06%
Disclaimer/Publisher’s Note: The statements, opinions and data contained in all publications are solely those of the individual author(s) and contributor(s) and not of MDPI and/or the editor(s). MDPI and/or the editor(s) disclaim responsibility for any injury to people or property resulting from any ideas, methods, instructions or products referred to in the content.