Abstract
The development of modern communication technologies and smart mobile devices has driven the evolution of mobile crowdsensing (MCS). Optimizing the task assignment process under constrained resources to maximize utility is a key challenge in MCS. However, most existing studies presuppose a sufficient pool of available workers during the task assignment process, overlooking the impact of temporal fluctuations in worker numbers under online scenarios. Additionally, existing studies commonly publish sensing tasks to the MCS platform for immediate assignment upon their arrival. However, the uncertainty in the number of available workers in online scenarios may fail to meet task demands. To address these challenges, this paper proposes a two-stage online task assignment scheme. The first stage introduces an adaptive task pre-assignment strategy based on worker quantity prediction, which determines task acceptance and assigns tasks to suitable subareas. The second stage employs a dynamic online recruitment method to select workers for the assigned tasks, aiming to maximize platform utility. Finally, the simulation experiments conducted on two real-world datasets demonstrate that the proposed methods effectively solve the challenges of online task assignment in MCS.
1. Introduction
Mobile crowdsensing uses portable sensing devices, such as wearable devices and micro-sensors, to perform urban sensing at a low cost. It can achieve large-scale urban sensing [1] and has garnered attention in various fields, such as environmental monitoring [2], indoor localization [3], emergency reporting [4], and public infrastructure maintenance [5]. The MCS workflow includes task publication and assignment. Requesters publish sensing tasks on the MCS platform, which then assigns tasks based on optimization goals such as quality or profit. Workers complete the tasks and transmit the sensing data to the platform via a wireless network, after which the platform processes the data and returns the results to the requesters [6].
As a critical component of MCS, task assignment significantly impacts platform utility and sensing quality. Therefore, maximizing the optimization objectives of task assignment under limited resources has become a key challenge in MCS. Task assignment in MCS can generally be divided into two operational scenarios: offline assignment and online assignment. In offline scenarios, participants are typically participatory workers who complete tasks at designated locations and times as instructed by the platform. In contrast, the online mode is more commonly observed in real-world scenarios, where participants are primarily opportunistic workers. The uncertain arrival times and availability of participants across different time slots make the online task assignment problem more challenging.
This paper primarily focuses on the problem of online task assignment. In such problems, many studies [7,8,9] divide the sensing area into multiple subareas and assign sensing tasks to workers arriving in these subareas. Unlike participatory workers who actively travel to designated locations to perform tasks, opportunistic workers engage in sensing activities passively. Therefore, MCS platforms need to analyze the historical data of opportunistic workers to formulate appropriate task assignment strategies. To address these uncertainties, some studies [10] have analyzed the historical mobility data of opportunistic workers to predict the probability of their availability in specific subareas, thereby recruiting suitable workers for the tasks.
However, these studies primarily focus on optimizing the process of assigning tasks to workers, while overlooking the impact of the sensing platform’s task-handling capacity and the number of available workers on the assignment outcomes. Sensing tasks often come with spatial and temporal requirements (e.g., capturing photos of specific buildings or monitoring temperature and humidity at a certain time). Due to the uncertainty in the number and location of opportunistic workers across different sensing time slots, there may be insufficient workers available at the required time or location, making it difficult to effectively complete the sensing tasks. Therefore, if the sensing platform disregards its task-handling capacity and accepts tasks indiscriminately, it could result in a low task completion rate. Additionally, in online task assignment, the sensing platform must decide whether to recruit newly arriving workers quickly without knowledge of future arrivals. Most studies focus on selecting an appropriate set of workers based on current information, but they do not consider that the continuous arrival of new tasks will increase the MCS platform’s workload, thereby impacting the task completion rate.
The above issues are caused by the lack of information about opportunistic workers, particularly the uncertainty about the number of available workers in each sensing cycle, making it difficult to decide whether to accept tasks and develop appropriate worker selection strategies. We assume that workers who have participated in sensing tasks leave records in the historical database, which is consistent with the typical operational model of Internet companies. Therefore, we can utilize this historical data to predict the number of available workers during different time slots. Based on these considerations, this paper proposes a two-stage real-time task assignment model. Specifically, the main contributions of this paper can be summarized as follows:
- We study an online task assignment scenario where workers and tasks both arrive at random time slots. Under the constraint of the sensing cost budget, we propose a real-time task assignment model with the goal of maximizing task sensing quality. Based on this, we design a two-stage task assignment scheme.
- We introduce a proactive task pre-assignment mechanism that, for the first time, equips the MCS platform with the ability to decide whether to accept an incoming task based on a prediction of future worker supply. To achieve this, we devise a novel subarea task load indicator, which dynamically quantifies the balance between task demand and the predicted availability of workers in a subarea. This prevents the platform from accepting tasks that are unlikely to be completed, directly addressing the low completion rate problem in uncertain online environments.
- We design a dynamic worker recruitment algorithm whose novelty lies in its adaptive selection quantity. Unlike conventional algorithms that select a fixed number of candidates or use a static threshold, our method dynamically adjusts the number of workers to recruit based on the real-time subarea task load, which enables the platform to adjust its selection strategy according to task demand.
- Finally, we test the proposed method using real-world datasets. Experimental results demonstrate that the proposed method effectively addresses the real-time assignment challenges in MCS.
2. Related Work
Existing research on mobile crowdsensing categorizes task assignment models into online and offline modes. We will introduce some related work from these two aspects.
2.1. Offline Task Assignment
Offline task assignment assumes complete access to worker information, such as their location, working hours, and load capacity. Therefore, research on offline task assignment focuses on exploring the global optimal solution under various constraints. For instance, Ji et al. [11] constructed a dynamic MCS task assignment model considering worker availability and task variability and proposed a new hyper-heuristic evolutionary algorithm based on Q-learning to handle the task assignment problem in a self-learning manner. Wu et al. [12] aimed to maximize social welfare in the task assignment process and established a sweep coverage model different from traditional point of interest (PoI)-based models, proposing a participant incentive model for platform sustainability. Research [13] considered various unpredictable disruptions in practical task implementation and proactively created a robust offline task assignment scheme. However, the task disruption scenarios considered in this study are not applicable to online environments.
These studies focus on improving algorithm performance and optimizing worker task assignment efficiency. Compared to online task assignment, the offline task assignment methods do not consider the incomplete information in online scenarios and have relatively high time complexity, which may not be suitable for the real-time requirements of online task assignment.
2.2. Online Task Assignment
The biggest difference between online and offline task assignment lies in the types of workers performing sensing tasks. Workers in the online mode are opportunistic participants who usually collect data automatically during their daily activities, without active participation. The challenge with this mode is to effectively coordinate the spatial and temporal nature of workers and sensing tasks during assignment.
Research in this mode focuses on exploring the spatiotemporal patterns of worker participation in sensing tasks and using this information for task assignment. Yang et al. [14] proposed a point-of-interest-based mobility prediction model to estimate the probability of users completing tasks, modeling the problem as a submodular k-secretary problem, and developed an online algorithm to decide whether to select real-time arriving users. Zeng et al. [15] proposed a subarea evaluation method based on deep reinforcement learning for online urban sensing. Liu et al. [16], building on Yang’s work, considered the cooperation willingness among users and addressed a task assignment problem under time and budget constraints, proposing an online dynamic segmented recruitment strategy to select real-time arriving workers. Yucel et al. [17] established the preference-aware goals for workers in online mode and proposed polynomial-time online algorithms for two different cases: workers with capacity constraints and workers without capacity constraints. Peng et al. [18] considered that each user in the online scenario has a specific time window for task participation and used bipartite graph matching to match workers with tasks.
The above studies have thoroughly examined the possible situations in online task assignment, but they did not consider the impact of the number of online workers on the task assignment process and the final task completion rate. Most studies [14,16,17] on task assignment or worker selection are based on the assumption that the number of available workers greatly exceeds the number of tasks, particularly in [14], where the prophet secretary method used struggles to achieve ideal results when the number of workers is limited. In other words, these studies only consider the worker selection process without accounting for the influence of increased worker demand due to real-time arriving tasks on the task assignment process. Furthermore, another advanced perspective for solving online task assignment problems involves the use of an interruptible task handling mechanism. For instance, the work by Duque et al. [19] demonstrates that in other online combinatorial problems, allowing the system to re-evaluate or even revoke previously accepted tasks in response to real-time changes can significantly improve performance under uncertainty. While this represents a promising avenue, its application is not yet widespread in the mobile crowdsensing literature, which also highlights a valuable direction for our future research.
While many studies focus on the crucial problem of selecting the best workers from an online stream, they often presuppose that the number of available workers is sufficient. Our work fundamentally differs by first questioning this assumption. We argue that in truly opportunistic scenarios, the platform’s primary challenge is managing the fluctuating capacity caused by uncertain worker arrivals.
Based on the above discussion, we use a deep learning approach to predict the number of available workers in different subareas during different sensing cycles and propose a metric we term “subarea task load”. To ensure a high task completion rate, we decide whether to accept real-time arriving tasks based on the task load of different subareas. In the worker selection phase, we adjust the worker selection strategy based on changes in task load.
3. Preliminary
The workflow of the proposed real-time task assignment model is illustrated in Figure 1, highlighting the two-stage process. The model consists of two stages: task pre-assignment and worker recruitment. The task pre-assignment stage handles different types of real-time arriving sensing tasks. It determines whether to take on a task. If a new task is accepted, the MCS platform will assign it to a subarea based on the task requirements. The worker recruitment stage handles real-time arriving opportunistic sensing workers, selecting suitable workers to execute the sensing tasks. These two stages operate in parallel, with worker recruitment starting as soon as there are tasks in the subarea task queue. In this section, we provide a detailed introduction to the proposed real-time task assignment model and its optimization objectives.
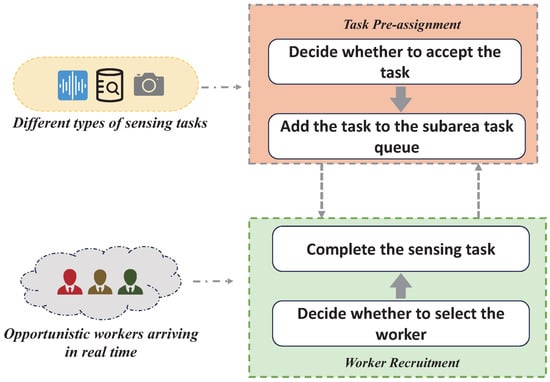
Figure 1.
The workflow of the real-time task assignment model.
3.1. System Model
This paper addresses a real-time task assignment problem in MCS. A typical MCS system consists of workers, tasks (task requesters), and the MCS platform. Similarly to [10], we divide the target sensing area into several equal-sized subareas, denoted as . In real-time task assignment, workers arrive dynamically and randomly at the MCS platform. To refine the process, the system divides the entire sensing procedure into several equal-length sensing cycles, represented as . This paper focuses on recruiting opportunistic workers who will execute tasks in the subareas they arrive at. We denote the sequence of workers arriving at subarea during sensing cycle s as . Similarly to the study in [20], the sensing platform does not need to decide immediately whether to select a worker upon their arrival. By setting a maximum waiting time (a short duration), denoted as , the platform can determine within this period whether to recruit the worker. The platform’s sensing cost primarily arises from worker recruitment, and the recruitment cost for worker can be represented as , where is the base cost constant and represents the cost incurred by worker for collecting and transmitting sensing data. Additionally, we assume that each worker can only accept one task at a time.
Unlike other studies, this paper considers the real-time arrival of tasks. Similarly to workers, tasks also arrive at the sensing platform at random times. The task sequence for each sensing cycle is represented as . The arrival of a new task will increase the total budget, which is represented as , where denotes the budget brought by task . If there are no sensing tasks in the platform, the budget is zero. Different tasks may require different numbers of workers, and the number of workers required for task is denoted as . Generally, tasks that require more workers have a relatively higher budget. Therefore, the cost of task can be calculated as , where is the unit budget corresponding to each worker. We classify sensing tasks into two categories: tasks with location requirements for data collection and tasks without such requirements. We denote the former as and the latter as .
3.2. Sensing Quality
The sensing ability of each worker determines the quality of task completion. In this paper, we describe a worker’s sensing ability as the probability of successfully completing a task (i.e., transmitting data that meets the task requirements). The MCS platform records the performance of each worker in completing a task. We use to represent the number of times worker has successfully completed tasks and to represent the total number of tasks the worker has accepted. Based on this, we define the sensing ability of worker as follows:
When the total historical sensing count of worker exceeds a constant value set by the system, we represent their sensing ability as . If their historical sensing count is less than , we consider the sample size to be insufficient to reflect the true ability of the worker. Therefore, we use a constant to represent their sensing ability instead. To encourage these workers with fewer sensing activities to actively participate in tasks, we set to be slightly greater than the average sensing ability of workers in the database.
3.3. Problem Formulation
The objective of real-time task assignment is to allocate suitable workers to real-time arriving tasks under a limited cost budget. Maximizing the overall sensing quality of tasks is the main optimization goal of this paper. We define the sensing quality of task as follows:
where is a decision variable that indicates whether task is assigned to worker . Our goal is to maximize the total sensing quality of all tasks. Thus, the real-time task assignment problem can be formulated as follows:
subject to:
The constraint of Equation (4) represents the cost constraint for recruiting workers, and Equation (5) ensures that each worker can be assigned to at most one task. Equation (6) specifies the requirement for the number of workers that need to be recruited for each task. Additionally, decisions must be made within the maximum waiting time after a worker arrives.
4. Two-Stage Real-Time Task Assignment
To address the task assignment problem in this paper, we designed a two-stage real-time task assignment system to separately handle real-time arriving tasks and workers. In Section 4.1, we propose a task pre-assignment strategy based on predicting the number of available workers, which decides in advance whether to accept a task before assigning it to a worker and allocating it to a specific subarea. In Section 4.2, we adjust the recruitment strategy based on the task acceptance outcomes from Section 4.1 and the proposed subarea load conditions, thereby designing a real-time worker recruitment method. The method proposed in Section 4.1 only deals with sensing tasks within the current sensing cycle. Since we divide the entire process into multiple sensing cycles, the sensing platform assigns tasks with time-specific sensing requirements to the corresponding sensing cycle. Therefore, this method is also suitable for tasks with specific time requirements.
4.1. Task Pre-Assignment Strategy Based on Worker Quantity Prediction
As shown in the map in Figure 2, similarly to many previous studies, we divide the global map into several subareas. The sensing platform assigns sensing tasks with specific location requirements to designated subareas, and these tasks are executed by workers who arrive in the corresponding subareas.
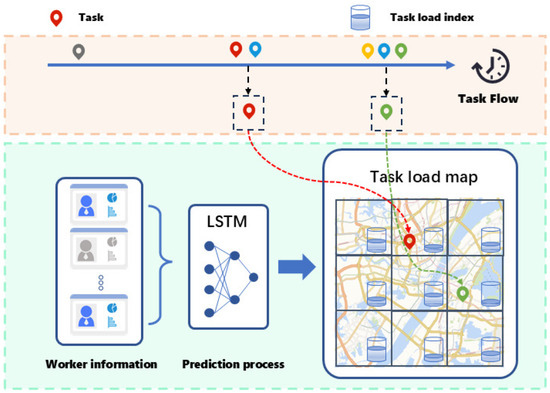
Figure 2.
Illustration of the task pre-assignment strategy.
In online task assignment, fluctuations and uncertainties in the number of workers may cause the available workforce to be smaller than the demand. Additionally, since workers have different sensing capabilities, a shortage of available workers relative to task demand may result in selecting workers with lower average sensing capabilities. To address the aforementioned issues, we attempt to predict the number of workers in different subareas during various sensing cycles. The prediction results reflect the real-time task load for each subarea, which we can use to decide whether to accept sensing tasks and assign them to appropriate subareas.
First, we attempt to predict the number of workers in different subareas during different sensing cycles. We assume that the participation of each worker in sensing activities (including recruitment and task completion) is fully recorded by the sensing platform, which is consistent with the regular operation of the sensing platform. Therefore, we can use historical data to obtain the number of workers who participated in recruitment in different subareas at various past times. Based on this, we draw upon research on forecasting future crowd numbers from time series data [21] and use the LSTM model for these time series predictions. LSTM (Long Short-Term Memory) is a variant of Recurrent Neural Networks (RNNs) that can effectively capture and remember long-term dependencies in sequential data, making it suitable for time series forecasting. The learning process of LSTM for time series data can be defined by the following equations:
, , and are the three gating units, while and represent the candidate cell state and the updated cell state, respectively. is the output gate. , , , and are weight matrices, and , , , and are their corresponding biases.
We treat the worker quantity prediction as an independent process. The worker quantity for subarea over the past A continuous time steps, denoted as , is normalized and input into the LSTM model to obtain the prediction data for the next B continuous time steps, represented as . Based on the LSTM model, we can predict the number of workers in different subareas for several future sensing cycles using historical sensing data. The predicted quantity of workers for subarea in the target sensing cycle is denoted as .
To effectively bridge the predicted future worker supply with the current task assignment demand, based on the worker number prediction, we define the “task load” metric as a real-time indicator of a subarea’s capacity to handle new tasks, which is expressed as follows:
where is the set of tasks assigned to subarea . represents the set of workers recruited in subarea during the current phase. represents the set of workers that have arrived in subarea from the start of the current sensing cycle to the current moment. is the maximum error ratio of the prediction model, included to ensure the denominator is always greater than zero by considering the error margin. reflects the task load condition of subarea within the current sensing cycle, and its value dynamically changes as workers and tasks arrive. A higher value indicates a higher task load already undertaken by subarea , while a lower value indicates a lighter load.
After defining the task load for each subarea, we set a “task load limit” that acts as a threshold to determine how many tasks can be accepted by each subarea. Based on the task load conditions of each subarea, we pre-assign real-time arriving tasks. This process is divided into two parts: first, deciding whether to accept a sensing task based on the task load and then assigning the task to an appropriate subarea and updating that subarea’s task load.
The basic process is as follows: First, the platform sets a task load limit. Then, for each arriving sensing task, the platform finds the subarea with the lowest task load from the set of appropriate subareas based on the task requirements (e.g., whether it needs to be assigned to a specific subarea). If the task load of this subarea does not exceed the load limit, the task can be assigned to that subarea; otherwise, the task is not accepted. The detailed procedure of the algorithm is presented in Algorithm 1.
| Algorithm 1 Adaptive task pre-assignment strategy. |
|
4.2. Real-Time Worker Recruitment
In the previous section, we used a real-time task scheduling strategy to assign real-time arriving tasks to subareas with lower task loads, based on their sensing location requirements. This strategy prevents excessive task load in most subareas and enhances the sensing quality of selected workers. After this stage, the other stage of the real-time task assignment system focuses on recruiting high-quality workers within each subarea as they dynamically arrive. It is important to note that these two stages do not happen sequentially but occur simultaneously.
The online recruitment algorithm needs to generate the recruitment results within a short period of time, which imposes strict requirements on time complexity. Therefore, commonly used optimization algorithms with high time complexity, such as genetic algorithms or bipartite graph algorithms, may not be suitable for this application scenario. To balance optimization effectiveness and the speed of generating a solution, we designed a real-time worker recruitment method. The process of worker recruitment is shown in Figure 3. As described in the system model in Section 3.1, this paper does not assign workers immediately upon arrival. According to this character, this method will select workers in the following two scenarios, as shown in Figure 3.
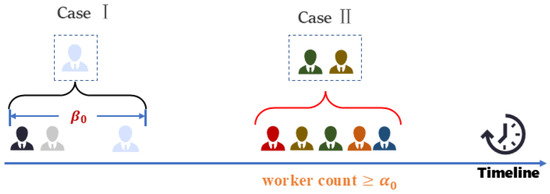
Figure 3.
The workflow of work recruitment.
Scenario I: When the number of arriving workers reaches a certain threshold, the sensing platform selects from the set of arrived workers. We denote this threshold as .
Scenario II: When a sensing task is pre-assigned to a target subarea, if a worker’s waiting time reaches his/her maximum waiting time , the platform will start the selection operation from the arrived workers during this period. This method prevents workers from losing the opportunity to be selected when the number of arriving workers is low at certain times.
Therefore, the worker selection method proposed in this paper is essentially a multi-stage selection approach. Due to the irregular arrival times and quality distribution of workers, using the prophet secretary algorithm as in [10,14] for online worker recruitment may not be effective. High-quality workers might appear during the observation phase, making it difficult for workers in subsequent selection phases to be chosen for an extended period. Additionally, their method is inefficient when the number of available workers is limited, which may lead to an inability to recruit enough workers to meet task requirements.
To address the above problems, we adopt a dynamic recruitment method that considers both sensing cost and sensing ability, selecting the top workers with the highest “sensing ability-to-cost ratio”. When worker quality shows a significant downward trend, the selection ratio is gradually reduced, while it is increased when worker quality improves. The “sensing ability-to-cost ratio” for worker , denoted as , is defined as follows:
At the beginning of each sensing cycle, we set an initial selection ratio based on the task load defined in Section 4.1. In short, when the task load in a subarea increases, we increase the number of selected workers by expanding the selection ratio in each selection phase. Conversely, when the task load decreases, we reduce the selection ratio to improve the sensing quality of the workers. This strategy dynamically adjusts the number of workers according to the task load in each subarea, ensuring task completion while improving overall sensing quality. The number of workers selected in each selection phase is defined as follows:
represents the number of available workers in subarea , and its value may vary in each selection round. is an adjustment coefficient, initially set to 0. When the sensing ability of selected workers shows a downward trend, takes a negative value; when the ability shows an upward trend, takes a positive value. The trend in the z-th selection phase, denoted as , is defined as follows:
and are the average sensing capabilities of the workers selected in phases and , respectively. The adjustment coefficient is defined as follows:
We set as a small constant. This method dynamically adjusts the selection ratio by fine-tuning the trend across different phases, adapting to changes in worker arrivals.
We present the specific process of this method in Algorithm 2. Lines 2–12 describe the dynamic selection process. In Line 2, s represents a specific time slot. Line 10 describes entering the selection phase when the workers on the platform meet the two conditions and the function calculates the maximum waiting time of the workers in the set . Lines 11–12 calculate the selection ratio based on the trend. Line 14 describes the budget constraint check for the selected workers, and Line 18 updates the parameters. In this algorithm, the worker selection process in Lines 10–19 has a maximum time complexity of , where is a threshold constant.
| Algorithm 2 Dynamic worker selection algorithm. |
|
5. Performance Evaluation
5.1. Evaluation of Worker Quantity Prediction
Our simulation experiments are conducted on two widely used real-world Location-Based Social Network (LBSN) datasets: Gowalla and Foursquare. The first dataset, Gowalla [22], is a well-known check-in dataset that records users’ check-in times, locations, and corresponding user IDs. The second dataset, Foursquare [23], contains long-term check-in data spanning approximately 10 months (from 12 April 2012 to 16 February 2013) collected in New York City and Tokyo. Both datasets exhibit common real-world challenges such as the sparsity of user activities and the temporal discontinuity of user data in some areas. To address this and ensure the accuracy of our worker count prediction, we applied a consistent preprocessing methodology. We partitioned the geographical coordinate data from each dataset into multiple subareas with the same size.
In the prediction process, we first evaluated our model on the four selected subareas from the Gowalla dataset. For the test set, we used the subsequent 216 time steps, where each time step represents one hour, to evaluate the model’s performance. Regarding the model parameters, the LSTM model consists of two LSTM layers and one fully connected layer to output the results. We use the Adam optimizer with the learning rate set to 0.001. The hours of the day and the day of the week were used as relevant features, and the model was trained for 100 epochs on the training set.
To validate our choice of the LSTM model, we also benchmarked it against two classical time series forecasting baselines: Simple Moving Average (SMA) and Autoregressive Integrated Moving Average (ARIMA). The LSTM model consistently outperformed both baselines in predictive accuracy. The prediction results on the Gowalla dataset, as shown in Figure 4, illustrate the close fit between our model’s predictions and the actual data.
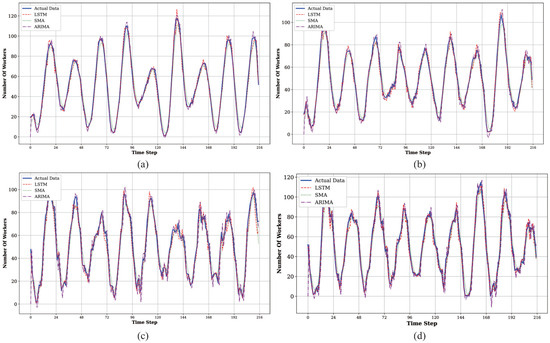
Figure 4.
Prediction results for worker quantity on Gowalla dataset. (a) Subarea 1. (b) Subarea 2. (c) Subarea 3. (d) Subarea 4.
To further test the generalizability of our prediction model, we conducted a similar set of experiments on four selected subareas from the Foursquare dataset. The experimental settings, including the one-hour time step and the benchmarking against SMA and ARIMA, remained consistent with those used for the Gowalla dataset. The results are shown in Figure 5.
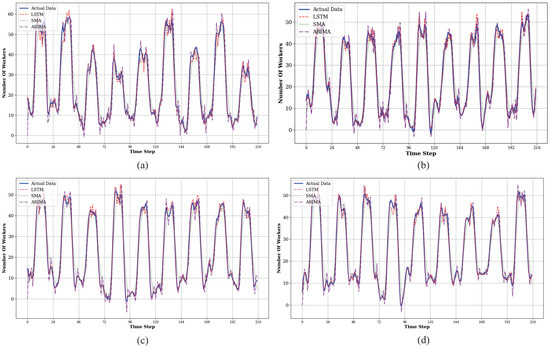
Figure 5.
Prediction results for worker quantity on Foursquare dataset. (a) Subarea 5. (b) Subarea 6. (c) Subarea 7. (d) Subarea 8.
To provide a more direct and quantitative comparison of the prediction models’ performance, we summarize the results in Table 1 and Table 2. The tables present the Mean Absolute Percentage Error (MAPE) and Root Mean Square Error (RMSE) for our LSTM model alongside the SMA and ARIMA baselines on both datasets. in the tables represent the subarea. The first four subareas are from the Gowalla dataset and the last two are from the Foursquare dataset.

Table 1.
Comparison of MAPE for prediction models (%).

Table 2.
Comparison of RMSE for prediction models.
The numerical results clearly show that the LSTM model achieves the lowest error values in all cases. As shown in Table 1, the LSTM model achieves an average MAPE of only 9.25%, which is substantially lower than the 20.68% from ARIMA and 33.95% from SMA. While traditional models like ARIMA may perform competitively in specific subareas, the LSTM model demonstrates greater overall robustness. A similar conclusion can be drawn from the RMSE results in Table 2. The LSTM model’s average RMSE of 3.09 is markedly better than ARIMA’s 4.21 and SMA’s 4.83. This consistent outperformance across both error metrics solidifies our choice of the LSTM model as the most accurate and reliable predictor for the subsequent stages of our task assignment framework.
5.2. Comparative Analysis of Task Assignment Strategies
In opportunity sensing, the arrival time of each worker is random. Therefore, for each worker, we randomly generate the arrival time for each sensing cycle. The total historical number of tasks accepted by worker , denoted as , is uniformly distributed within the interval [0, 20]. The number of tasks completed by worker , denoted as , is uniformly generated within the interval [0, ]. The sensing ability constant is set to 5, and the worker’s base sensing ability is set to 0.4. The base cost is set to 1, and the additional cost for worker is randomly generated within the interval [0, 2]. The number of workers required for task , denoted as , is uniformly distributed within the interval [3, 6], and each worker’s unit budget is 2. The overall predicted MAPE value obtained from the experiment is . Therefore, the prediction error coefficient in Equation (8) is set to 0.1 to ensure that the value of the formula remains positive. To ensure that adjustments to the selection quantity are gradual and stable throughout the multi-stage recruitment process, we set the adjustment coefficient to a small constant value of 0.1.
To determine an appropriate value for the task load threshold and to investigate its impact on system performance, we conducted a parameter sensitivity analysis. In this experiment, we varied the task load threshold, , from 0.4 to 1.0 while keeping all other parameters constant. We then observed the resulting changes in total platform utility, task completion rate, and the number of accepted tasks. The results of this analysis under two different instances are presented in Figure 6a,b. Both figures indicate that as increases, the platform adopts a more lenient task acceptance policy, leading to a rise in both the number of accepted tasks and the total platform utility. However, this strategy comes at the cost of a significant decline in the task completion rate, as a higher threshold causes the platform to accept more tasks than it can reliably handle.
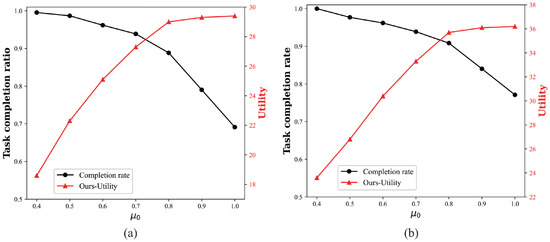
Figure 6.
Sensitivity analysis of the task load threshold. (a) Instance 1. (b) Instance 2.
The analysis indicates that when c is set to 0.8, the platform achieves near-maximum utility while still maintaining a very high task completion rate. Increasing further to 0.9 or 1.0 yields only limited marginal gains in utility while causing the task completion rate to deteriorate sharply. Therefore, we conclude that is an optimal choice that effectively balances platform efficiency with system reliability.
We selected several subareas from the regions divided in the dataset to test the effectiveness of the proposed task pre-allocation strategy. As shown in Figure 7, under the same worker recruitment method, we compared the task completion rate in two cases: one using the task pre-allocation strategy and the other without (where tasks are randomly assigned to a subarea). The task completion rate is calculated as the number of tasks that meet the worker requirements divided by the total number of tasks. Furthermore, since the proposed task scheduling strategy does not accept tasks exceeding the capacity limit of all subareas, the actual task completion rate under this strategy is represented by the red curve, i.e., the number of tasks that meet the worker requirements divided by the actual number of tasks undertaken. As the number of tasks increases, the task completion rate for both methods shows a declining trend. When the number of tasks is small, the task completion rate using the proposed task pre-allocation strategy is significantly higher than that without the strategy. However, as the number of tasks increases, the task completion rates for both methods gradually converge. It is worth noting that the actual task completion rate under the proposed task scheduling strategy is not significantly affected by the number of tasks and remains at a high level.
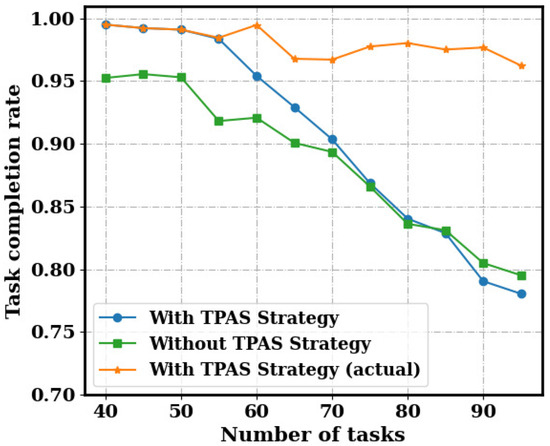
Figure 7.
Task completion rate testing for pre-assignment strategy.
Additionally, we compare the utility in both cases, as shown in Figure 8. It can be observed that the proposed TPAS strategy significantly improves the overall quality of the selected workers by balancing the task load across subareas, especially when the number of tasks is small, outperforming the case without the strategy. As the number of tasks increases, the task pre-assignment strategy no longer accepts sensing tasks that exceed the load capacity of the sensing platform, causing its utility value to stabilize and cease increasing. In contrast, without the strategy, sensing tasks continue to be accepted, resulting in a utility value that gradually exceeds that of the strategy. However, as shown in Figure 7, the task completion rate in this scenario has already dropped to a low level.
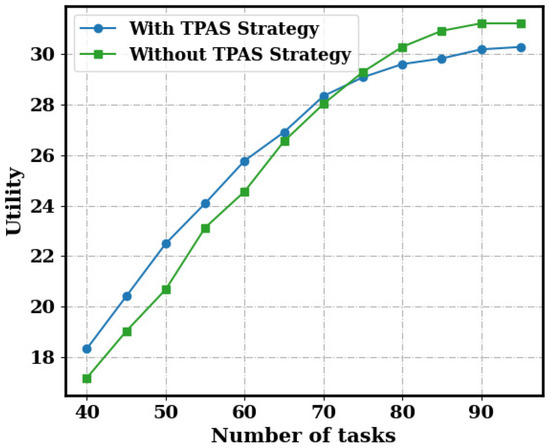
Figure 8.
Utility testing for pre-assignment strategy.
To comprehensively evaluate the performance of our proposed algorithm (denoted as Ours), we benchmark it against several methods in a two-part evaluation based on the problem scale. For small-scale instances, we first compare our method against the theoretical optimal solution, which is obtained by formulating the problem as a Mixed-Integer Programming (MIP) model and solving it with the CPLEX solver. This optimal solution serves as an upper bound to quantify the performance gap of our algorithm. In this small-scale setting, we also benchmark against three heuristic algorithms. The first is the prophet secretary method (Secretary), which extends the classic secretary problem by using an observation phase to set a dynamic recruitment threshold. The second is Fixed Threshold Recruitment (Fixed), which uses the historical average sensing ability of workers as a static selection threshold. The final heuristic is Random Selection (Rand), where workers are recruited randomly from the available pool at each phase to evaluate the contribution of our intelligent selection criteria. Due to the computational intractability of solving the MIP to optimality for larger problems, our second set of experiments on large-scale instances compares our algorithm against these three heuristic algorithms only.
The performance comparison on the first small-scale instance is presented in Figure 9. As shown in Figure 9a, our proposed algorithm (Ours) consistently achieves the highest utility across all tested task quantities, demonstrating its superior ability to select high-quality workers. While the utility for all methods generally increases with more tasks, our approach maintains a significant performance margin over the Secretary, Fixed, and Rand baselines. Furthermore, Figure 9b illustrates the task completion rate, a critical metric for platform reliability. Our algorithm again shows dominant performance, maintaining the highest completion rate even as the system load increases from 10 to 40 tasks. This highlights the robustness of our two-stage framework, as its performance degrades more gracefully compared to the other heuristic algorithms. The notably poor performance of the Rand baseline in both metrics confirms that an intelligent, quality-aware selection strategy is essential for achieving desirable outcomes. Collectively, these results validate that our task load-aware approach is highly effective in maximizing platform utility while ensuring high task completion reliability.
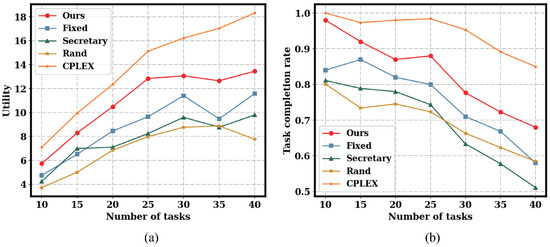
Figure 9.
Performance comparison on the first small-scale instance. (a) Utility comparison. (b) Task completion rate comparison.
To further validate our approach and quantify its optimality gap, Figure 10 presents the results from a second small-scale instance, which includes the performance of the optimal CPLEX solver. The performance hierarchy among the heuristic algorithms is consistent with the findings from the first instance (Figure 9). Our proposed algorithm (Ours) significantly outperforms the Secretary, Fixed, and Rand baselines in both platform utility and task completion rate. Crucially, the comparison with the CPLEX solver demonstrates that our approach achieves near-optimal utility, confirming the high quality of our heuristic solution.
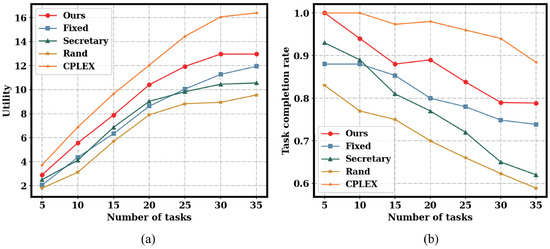
Figure 10.
Performance comparison on the second small-scale instance. (a) Utility comparison. (b) Task completion rate comparison.
The experimental results show that our proposed online heuristic consistently achieves near-optimal utility across different instances. When benchmarked against the optimal solutions obtained by CPLEX, our algorithm reaches over of the optimal performance on most test points, with a peak performance of 86%, validating its efficiency and practical value.
To evaluate the scalability of our framework, we conducted further comparisons on a large-scale instance, with the results presented in Figure 11. The performance trends in this scenario are consistent with the findings from our small-scale experiments. As shown in both Figure 11a,b, our proposed algorithm (Ours) continues to significantly outperform all other heuristic baseline algorithms across both platform utility and task completion rate. This result demonstrates the strong scalability and robustness of our two-stage approach, confirming its effectiveness in handling a larger volume of tasks without a disproportionate drop in performance.
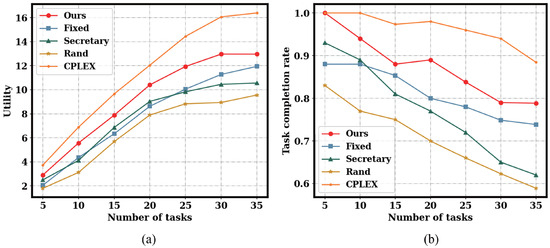
Figure 11.
Performance comparison on the large-scale instance. (a) Utility comparison. (b) Task completion rate comparison.
The 32 h long-term evaluation, presented in Figure 12, confirms the sustained effectiveness of our framework. Throughout the simulation, our proposed algorithm (Ours) maintained a leading position, achieving the highest platform utility and task completion rate at most 4 h checkpoints. While the performance of all methods fluctuated according to natural worker activity cycles, our approach demonstrated remarkable stability, with a task completion rate that remained high and generally above 0.89. This leading performance and high degree of stability validate the framework’s robustness and reliability for continuous, long-running operations in dynamic environments.
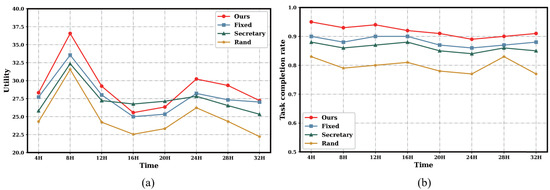
Figure 12.
Performance comparison over a continuous simulation period. (a) Utility comparison. (b) Task completion rate comparison.
Figure 13 presents the scalability performance of the algorithms as the number of operational subareas is increased from 4 to 16. The metrics shown in Figure 13a for utility and Figure 13b for task completion rate are the average values calculated across all participating subareas. The results demonstrate that our proposed algorithm (Ours) consistently achieves both the highest average utility and the highest average task completion rate at every tested scale. While the average utility increases with a larger number of subareas, the task completion rate for our method remains stable and high, confirming its effectiveness in larger environments.
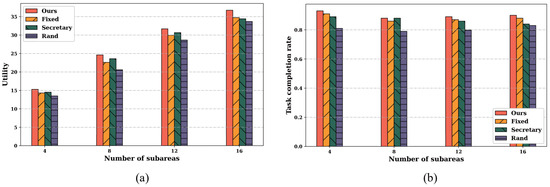
Figure 13.
Performance comparison under different subareas. (a) Utility comparison. (b) Task completion rate comparison.
6. Conclusions and Future Work
We propose a two-stage framework to handle real-time task assignment in dynamic scenarios. In the task pre-assignment stage, the number of workers in different subareas is predicted to obtain real-time task load information for each subarea. Based on the task load information, sensing tasks are pre-assigned to subareas in advance, and task load is used as an important reference for the sensing platform to decide whether to accept new tasks. In the worker recruitment stage, we design a dynamic real-time recruitment method that prioritizes workers with higher sensing abilities within a limited cost budget by dynamically adjusting the selection ratio at each selection phase. Experimental results on real-world datasets demonstrate that the proposed task scheduling strategy and dynamic recruitment method significantly outperform comparative heuristic algorithms and achieve near-optimal performance.
Nevertheless, we recognize that the efficacy of our prediction-based framework hinges on the availability of adequate historical data and the existence of identifiable worker behavioral patterns. These assumptions may not hold in highly dynamic or data-scarce environments, thereby limiting the model’s generalizability in such contexts.
Our future research will therefore focus on enhancing the framework’s adaptability, robustness, and scalability. To mitigate the dependency on historical data, we plan to investigate hybrid models that integrate our predictive approach with reactive, non-predictive strategies and explore techniques such as transfer learning to leverage models from data-rich subareas to bootstrap those with limited records. A parallel and primary direction will be the introduction of interruptible task handling, allowing the platform to defer, reassign, or cancel previously accepted tasks to better adapt to real-time conditions and mitigate the risks of early commitment. Additionally, to address the challenge of relying on stable historical performance for worker selection, future work could incorporate more dynamic reputation systems instead of static ability estimates. Such systems could use online learning to adapt to changes in worker behavior and include mechanisms to manage new or inconsistent workers, thus enhancing real-world robustness. Furthermore, to strengthen the decision-making process, we will explore more advanced machine learning models for predicting task success likelihood and investigate hybrid optimization strategies. Finally, to provide deeper insights into our algorithm’s performance, future evaluations will include benchmarking against more sophisticated semi-clairvoyant policies, and these avenues will form a comprehensive roadmap toward a more powerful and practical task assignment system in MCS.
Author Contributions
Conceptualization and methodology, H.Z.; investigation, Y.X.; resources, J.S.; project administration and funding acquisition, Y.X. All authors have read and agreed to the published version of the manuscript.
Funding
This work was financially supported by the National Natural Science Foundation of China under research project number 61873249.
Institutional Review Board Statement
Not applicable.
Informed Consent Statement
Not applicable.
Data Availability Statement
The raw data supporting the conclusions of this article will be made available by the authors upon request.
Conflicts of Interest
All the authors declare that the research was conducted in the absence of any commercial or financial relationships that could be construed as a potential conflict of interest.
References
- Marchang, N.; Tripathi, R. KNN-ST: Exploiting spatio-temporal correlation for missing data inference in environmental crowd sensing. IEEE Sens. J. 2020, 21, 3429–3436. [Google Scholar] [CrossRef]
- Liu, T.; Zhu, Y.; Yang, Y.; Ye, F. ALC2: When active learning meets compressive crowdsensing for urban air pollution monitoring. IEEE Internet Things J. 2019, 6, 9427–9438. [Google Scholar] [CrossRef]
- Lashkari, B.; Rezazadeh, J.; Farahbakhsh, R.; Sandrasegaran, K. Crowdsourcing and sensing for indoor localization in IoT: A review. IEEE Sens. J. 2019, 19, 2408–2434. [Google Scholar] [CrossRef]
- Mathew, S.S.; El Barachi, M.; Kuhail, M.A. CrowdPower: A novel crowdsensing-as-a-service platform for real-time incident reporting. Appl. Sci. 2022, 12, 11156. [Google Scholar] [CrossRef]
- Zhu, H.; Shou, T.; Guo, R.; Jiang, Z.; Wang, Z.; Wang, Z.; Yu, Z.; Zhang, W.; Wang, C.; Chen, L. RedPacketBike: A graph-based demand modeling and crowd-driven station rebalancing framework for bike sharing systems. IEEE Trans. Mob. Comput. 2022, 22, 4236–4252. [Google Scholar] [CrossRef]
- Hettiachchi, D.; Kostakos, V.; Goncalves, J. A survey on task assignment in crowdsourcing. ACM Comput. Surv. (CSUR) 2022, 55, 1–35. [Google Scholar] [CrossRef]
- Yang, G.; Guo, D.; Wang, B.; He, X.; Wang, J.; Wang, G. Participant-Quantity-Aware Online Task Allocation in Mobile Crowd Sensing. IEEE Internet Things J. 2023, 10, 22650–22663. [Google Scholar] [CrossRef]
- Liu, W.; Wang, E.; Yang, Y.; Wu, J. Worker selection towards data completion for online sparse crowdsensing. In Proceedings of the IEEE INFOCOM 2022-IEEE Conference on Computer Communications, London, UK, 2–5 May 2022; IEEE: New York, NY, USA, 2022; pp. 1509–1518. [Google Scholar]
- Guo, X.; Tu, C.; Hao, Y.; Yu, Z.; Huang, F.; Wang, L. Online User Recruitment with Adaptive Budget Segmentation in Sparse Mobile Crowdsensing. IEEE Internet Things J. 2023, 11, 8526–8538. [Google Scholar] [CrossRef]
- Liu, W.; Yang, Y.; Wang, E.; Wu, J. User recruitment for enhancing data inference accuracy in sparse mobile crowdsensing. IEEE Internet Things J. 2019, 7, 1802–1814. [Google Scholar] [CrossRef]
- Ji, J.J.; Guo, Y.N.; Gao, X.Z.; Gong, D.W.; Wang, Y.P. Q-learning-based hyperheuristic evolutionary algorithm for dynamic task allocation of crowdsensing. IEEE Trans. Cybern. 2021, 53, 2211–2224. [Google Scholar] [CrossRef]
- Wu, L.; Xiong, Y.; Wu, M.; He, Y.; She, J. A task assignment method for sweep coverage optimization based on crowdsensing. IEEE Internet Things J. 2019, 6, 10686–10699. [Google Scholar] [CrossRef]
- Wang, L.; Yu, Z.; Wu, K.; Yang, D.; Wang, E.; Wang, T.; Mei, Y.; Guo, B. Towards robust task assignment in mobile crowdsensing systems. IEEE Trans. Mob. Comput. 2022, 22, 4297–4313. [Google Scholar] [CrossRef]
- Yang, Y.; Liu, W.; Wang, E.; Wu, J. A prediction-based user selection framework for heterogeneous mobile crowdsensing. IEEE Trans. Mob. Comput. 2018, 18, 2460–2473. [Google Scholar] [CrossRef]
- Zeng, H.; Xiong, Y.; She, J.; Yu, A. A Task Assignment Scheme Designed for Online Urban Sensing Based on Sparse Mobile Crowdsensing. IEEE Internet Things J. 2025, 12, 17791–17806. [Google Scholar] [CrossRef]
- Liu, W.; Yang, Y.; Wang, E.; Wang, H.; Wang, Z.; Wu, J. Dynamic online user recruitment with (non-) submodular utility in mobile crowdsensing. IEEE/ACM Trans. Netw. 2021, 29, 2156–2169. [Google Scholar] [CrossRef]
- Yucel, F.; Bulut, E. Online stable task assignment in opportunistic mobile crowdsensing with uncertain trajectories. IEEE Internet Things J. 2021, 9, 9086–9101. [Google Scholar] [CrossRef]
- Peng, S.; Liu, K.; Wang, S.; Xiang, Y.; Zhang, B.; Li, C. Time window-based online task assignment in mobile crowdsensing: Problems and algorithms. Peer-to-Peer Netw. Appl. 2023, 16, 1069–1087. [Google Scholar] [CrossRef]
- Duque, R.; Arbelaez, A.; Díaz, J.F. Online over time processing of combinatorial problems. Constraints 2018, 23, 310–334. [Google Scholar] [CrossRef]
- Gao, H.; Liu, C.H.; Tang, J.; Yang, D.; Hui, P.; Wang, W. Online quality-aware incentive mechanism for mobile crowd sensing with extra bonus. IEEE Trans. Mob. Comput. 2018, 18, 2589–2603. [Google Scholar] [CrossRef]
- Singh, U.; Determe, J.F.; Horlin, F.; De Doncker, P. Crowd forecasting based on wifi sensors and lstm neural networks. IEEE Trans. Instrum. Meas. 2020, 69, 6121–6131. [Google Scholar] [CrossRef]
- Cho, E.; Myers, S.A.; Leskovec, J. Friendship and mobility: User movement in location-based social networks. In Proceedings of the 17th ACM SIGKDD International Conference on Knowledge Discovery and Data Mining, San Diego, CA, USA, 21–24 August 2011; pp. 1082–1090. [Google Scholar]
- Yang, D.; Zhang, D.; Zheng, V.W.; Yu, Z. Modeling user activity preference by leveraging user spatial temporal characteristics in LBSNs. IEEE Trans. Syst. Man, Cybern. Syst. 2014, 45, 129–142. [Google Scholar] [CrossRef]
Disclaimer/Publisher’s Note: The statements, opinions and data contained in all publications are solely those of the individual author(s) and contributor(s) and not of MDPI and/or the editor(s). MDPI and/or the editor(s) disclaim responsibility for any injury to people or property resulting from any ideas, methods, instructions or products referred to in the content. |
© 2025 by the authors. Licensee MDPI, Basel, Switzerland. This article is an open access article distributed under the terms and conditions of the Creative Commons Attribution (CC BY) license (https://creativecommons.org/licenses/by/4.0/).