2.1. Image Processing Related Methods
Color clustering algorithms in image processing, especially those based on K-means and its variants, have experienced a long period of development and evolution, and play a key role in the fields of image segmentation, color quantization, and target recognition.
K-means as a distance-based clustering algorithm has been rapidly introduced for color clustering due to its simplicity and efficiency. Songul Albayrak et al. improved the K-means algorithm for color quantization. The method determines the center of each color cluster by calculating a weighted average using histogram values and employs an average distortion optimization strategy to improve the perceptual quality of the quantized image. This study also conducted experiments in two color spaces, RGB and CIELAB, to investigate the effect of color space on clustering effects [
16]. A real-time color image segmentation method based on K-means clustering was proposed and implemented by Takashi Saegusa and Tsutomu Maruyama [
17]. They recognized the computationally intensive and time-consuming problem of K-means in processing large images and a large number of clusters and worked to improve its performance by optimizing the distance computation for real-time processing on FPGAs. Y-C Hu and B-H Su also addressed the computational cost of the K-means algorithm for palette design by proposing two test conditions to accelerate the K-means algorithm [
18]. The experimental results show that the method significantly reduces the computational effort. Md. Rakib Hassan and Romana Rahman Ema explored image segmentation using automated K-means clustering in RGB and HSV color spaces [
19]. They pointed out that despite the plethora of image segmentation algorithms, evaluating their accuracy remains challenging. Sangeeta Yadav and Mantosh Biswas proposed an improved color-based K-means algorithm for clustering of satellite images [
20]. The method is carried out in two phases, where initial clustering centers are first selected and computed through an interactive selection process, and then clustering is performed on this basis, aiming to improve the recognition accuracy of image clustering.
One of the main drawbacks of the K-means algorithm is that it is highly sensitive to the location of the initial clustering centers, which may cause the algorithm to converge to a local optimum solution [
21]. In order to solve the problem of uncertainty in the number of clusters, Abd Rasid Mamat et al. investigated the application of K-means algorithm in three color models (RGB, HSV, and CIELAB) for determining the optimal number of clusters for an image with different color models, and evaluated the clustering effect by using the Silhouette index [
22]. Ting Tu et al. proposed a K-means clustering algorithm based on multi-color space, which solves the problem that the parameters and initial centers of K-means need to be input manually in color image segmentation. Their study found that HSV and CIELAB color spaces perform better in color segmentation [
23].
In recent years, with the development of deep learning, it has also been attempted to combine the traditional K-means clustering with deep learning. Sadia Basar et al. proposed a new adaptive initialization method for initializing the K-means clustering of RGB histograms to determine the number of clusters and find the initial centroids, which further optimizes the application of K-means in unsupervised color image segmentation [
24]. Curtis Klein et al. proposed a method for automated UAV labeling of training data for online differentiation between water and land. The method consists of converting images to HSV color space, followed by image segmentation using K-means clustering, and a combination of morphological operations and contour analysis to select key points [
25]. Maxamillian A. N. Moss et al. conducted a comparative study of clustering techniques such as K-means, hierarchical clustering algorithm (HCA), and GenieClust, and explored the integration of an auto-encoder (AE) [
26]. It was found that K-means and HCA show good agreement in terms of cluster profile and size, proving their effectiveness in distinguishing particle types.
Edge detection remains a cornerstone technique in cultural heritage image processing. Feng et al. developed an automated generation method for mural line drawings by integrating edge enhancement, neural edge detection, and denoising techniques [
27]. Similarly, Li et al. demonstrated the efficacy of edge detection combined with semantically driven segmentation for extracting architectural features in historical urban contexts [
28]. The core objective is to suppress noise interference while maximizing edge detail and ensuring precise positioning of edges.
The Roberts operator is one of the simplest and fastest gradient-based edge detection operators. It uses a pair of 2 × 2 convolution kernels to compute a gradient approximation of the image intensities, and is mainly used for detecting diagonally oriented edges [
29]. The advantage is that it is computationally inexpensive, but it may not work well with noisy images and the detected edges are usually thin [
30]. The Prewitt algorithm, similar to the Sobel algorithm, is a gradient-based method that uses a pair of 3 × 3 convolutional kernels to compute the horizontal and vertical gradients. The Prewitt algorithm strikes a balance between edge detection performance and computational complexity [
31]. It is effective at highlighting boundaries in an image, but its edge detection results can be coarser than more accurate algorithms such as the Canny algorithm. The Sobel algorithm is one of the most commonly used edge detection operators, and it detects edges by calculating a gradient approximation to the image intensity function. Similar to the Prewitt operator, the Sobel operator uses a 3 × 3 convolutional kernel, but it assigns a greater weight to the center pixel, making it relatively more effective at suppressing noise. However, the traditional Sobel algorithm has low edge localization accuracy and a limited ability to handle noise and edge continuity. To address these problems, some studies have proposed image fusion algorithms based on improved Sobel algorithms, combining Canny and LoG algorithms to optimize the edge detection results. Yuan et al. proposed a high-precision edge detection algorithm based on improved Sobel algorithm-assisted HED (ISAHED) [
32], The detection performance is improved by increasing the gradient direction. Zhou et al. also proposed an improved Sobel operator edge detection method based on FPGAs, which utilizes the parallel processing capability of FPGAs to improve efficiency [
33]. The LoG operator is a second-order derivative operator that first smooths the image using a Gaussian filter to reduce noise and then applies the Laplace operator to find zero crossings, which correspond to the edges of the image. The LoG operator is sensitive to rapid changes in the image intensity, and is able to detect fine edge details, but is very sensitive to noise. Therefore, Gaussian smoothing is usually required first.
The Canny edge detection algorithm plays a pivotal role in the field of image processing. The success of the Canny algorithm lies in the fact that it takes into account the three major criteria of detection (identifying as many real edges as possible), localization (determining the edge position precisely), and suppressing false response (reducing false edges due to noise). The Canny algorithm has become one of the most popular edge detection tools in image processing due to its excellent performance. It achieves this by employing a multi-stage process that includes noise reduction, gradient finding, non-maximum suppression, and hysteresis thresholding to reliably detect a wide range of edges. However, with the complexity of image application scenarios and higher requirements for real-time and robustness, researchers have continuously improved and extended the Canny algorithm. CaiXia Zhang et al. proposed an improved Canny algorithm, which combines adaptive median filtering to enhance the noise reduction ability of the image, and utilizes local adaptive thresholding for edge detection to solve the problem in the traditional Canny algorithm of the salt-and-pepper noise and the poor resistance and poor adaptability of threshold [
34]. In their study, Yibo Li and Bailu Liu also proposed an improved algorithm for the effect of salt-and-pepper noise on the Canny algorithm, which designs a novel filter to replace the Gaussian filter in the traditional algorithm, aiming at removing the salt-and-pepper noise and extracting the edge information of the region of interest [
35]. Shigang Wang et al. proposed an algorithm that fuses the improved Canny operator and morphological edge detection to efficiently deal with noise in images through hybrid filters [
36]. Ruiyuan Liu and Jian Mao suggested using a statistical algorithm for denoising and combined it with genetic algorithm to determine the optimal high and low thresholds to solve the problem of poor noise robustness and possible false edges or edge loss in the traditional Canny algorithm [
37].
In addition to the improvement in noise removal, researchers have also optimized Canny itself for adaptive thresholding. Jun Kong et al. proposed an adaptive edge detection model based on an improved Canny algorithm, replacing Gaussian smoothing in the standard Canny algorithm with a morphological approach to highlight edge information and reduce noise [
38]. In addition, they utilized fractional order differential theory to compute the gradient values. Ziqi Xu et al. improved the Canny operator by Otsu’s algorithm and the double threshold detection approach [
39], enhancing its capability in medical image edge detection. Baoju Zhang et al. proposed an improved Canny algorithm for the drawbacks of the traditional Canny operator that require manual intervention in Gaussian filter variance [
40]. The algorithm performs a hybrid enhancement operation after Gaussian filtering of multispectral images, aiming to avoid losing edge details while denoising.
2.2. Key Technologies
2.2.1. Swatch Clustering Based on K-Means++
The RGB color space commonly used in computers is not “perceptually homogeneous”, and the same mathematical distance is not equivalent to the same color difference in human vision. To overcome this shortcoming, the CIELAB color space is introduced in this study. Its components l, a, and b represent luminance, green–red, and blue–yellow, respectively. The biggest advantage of this space is that the Euclidean distance between two color points can be highly approximated by the “color difference” perceived by the human visual system, which provides a mathematical basis for machine learning algorithms to make judgments more in line with artistic intuition.
Determining the appropriate number of clusters, K, is crucial before performing a clustering operation. In this study, an introduction and a comparison of the following three commonly used evaluation methods are provided.
Elbow method;
Contour coefficient;
CH index.
The elbow method is evaluated by calculating the within-cluster sum of squares (
WCSS) for different values of
K. The
WCSS measures the sum of the squares of the distances of all points within each cluster to its center of mass. Its calculation formula is as follows:
where
is the number of clusters;
is the first clustering;
is the sample point in the cluster; and
is the center of the first cluster. Theoretically, as the
K value increases, the
WCSS value decreases. By plotting the
WCSS versus
K value, the “inflection point” (i.e., the “elbow point”) where the slope of the curve changes dramatically is determined to be the recommended optimal
K value.
The contour coefficient combines the cohesion and separation of the clusters. For a single sample point
, The profile factor
is calculated as follows:
where
is the average distance between the point and all other points in the cluster to which it belongs (this is a measure of cohesion) and
is the average distance between the point and all other points in the cluster to which it is closest (this is a measure of separateness).
has a value in the range of [−1, 1], and the closer the value is to 1, the better the clustering is. The average profile coefficient is calculated for all samples, with the value of
K yielding the highest score being selected as the optimal choice.
The Calinski-Harabasz (
CH) index, also known as the variance ratio criterion, assesses the quality of clustering by calculating the ratio of inter-cluster scatter to intra-cluster scatter. Its score is defined as follows:
The total number of samples, the number of clusters, the trace of the inter-cluster scatter matrix (which indicates the degree of separation between clusters), and the trace of the intra-cluster scatter matrix (which indicates the degree of closeness within clusters) are related concepts. A higher score on the CH index implies that the clusters themselves are more tightly grouped, and that the clusters are further apart, and the clustering will be more effective.
The specific procedure of K-means++ is as follows: first, a sample point from the dataset is randomly selected as the first clustering center. Next, for each sample point in the dataset, the shortest distance from that point to the most recently selected clustering center is calculated:
The shortest distance
is calculated, where
denotes the Euclidean distance between sample point
and cluster center
, as defined in Formula (5):
Based on the distance calculated above, the probability of selecting the next clustering center is proportional to the square of the distance:
The formula suggests that the further a point is from an already selected cluster center, the higher the probability that it will be selected as the next cluster center. With this strategy, newly selected clustering centers are moved away from the already existing centers, thus increasing the dispersion of clustering centers throughout the data space.
2.2.2. Canny Edge Detection Technology
In order to accurately extract the contours of individual color blocks from the K-means++ clustering processed layered image of the TWNY Prints (referred to as
here), we apply the Canny edge detection algorithm. The algorithm is widely used because it seeks to achieve the best balance between the three core goals of accurately labeling the true edges, precisely locating the edge positions, and ensuring that the edges are single-pixel thin lines through a series of rigorous mathematical steps. The resulting edge image
, which is the key input for the subsequent optimization steps, can be summarized as follows:
The whole Canny algorithm process begins with Gaussian filtering. After the color clustering on
of the TWNY Prints, although distinct color blocks are formed at the macro level, there may still be a small amount of noise or unsmooth areas on the micro level. To prevent these imperfections from being misclassified as edges, the algorithm first smooths the image. This step is accomplished by convolving the image with a 2D Gaussian kernel with the core formula:
Here
(standard deviation) controls the strength of the smoothing and choosing the right
value can strike a balance between effective noise suppression and preservation of the original details of the print. The smoothed image
is obtained by convolving the original layered image with a Gaussian kernel:
Next, the algorithm enters the gradient computation phase, which aims to locate the boundaries between the different color blocks in the TWNY Prints image. The nature of the edges is a dramatic change in the intensity of the image, and the gradient is a mathematical tool to measure this change. The algorithm usually employs the Sobel operator, which approximates the intensity changes and of the smoothed image in the horizontal and vertical directions by means of convolution kernels in both directions. Subsequently, based on these two gradient components, the gradient intensity and gradient direction can be computed for each pixel.
The gradient strength is calculated by the following formula:
The value reflects the “strength” of the edge. In the TWNY Prints, this means that the greater the difference in color between the two blocks, the higher the value.
The gradient direction is given by the following:
However, a gradient intensity map alone is not enough, as the edges thus produced are blurred and have width. In order to distill these rough boundaries into clear single-pixel lines, the algorithm performs non-maximal value suppression. This step examines the gradient direction of each pixel and compares the gradient intensity of that pixel with the two neighboring pixels before and after it along this direction. A pixel is retained only if its gradient strength is a local maximum in the neighborhood of its gradient direction; otherwise, the pixel is suppressed. This process is like fine-tuning the blurred color block boundaries of a print, eliminating all non-centered pixels to produce clear, slim candidate edge lines.
The final step is dual thresholding with hysteresis linking, which is a key decision-making process to determine which candidate edge lines end up as definitive edges. The algorithm sets a high threshold, , and a low threshold, . Pixels with gradient strengths higher than are considered strong edges, which are reliable building blocks for the main contours of the TWNY Prints. Pixels with gradient strength lower than are considered as noise and are rejected, and pixels with gradient strengths in between are defined as weak edges. Then, the algorithm finds and connects all the weak edge pixels connected to it along the path from all the strong edge pixels through a lagged connection strategy. Eventually, only the weak edges that can connect to the strong edges are retained to form a complete contour line. This mechanism allows the algorithm to preserve continuous but varying strength lines in the prints (e.g., folds in clothing), while effectively filtering out isolated false edges caused by subtle textures, thus providing high-quality edge maps “E” for subsequent contour optimization.
2.2.3. U-Net Model and Cyclic U-Net Model
U-Net is an encoder–decoder architecture for image segmentation, named for its symmetrical U-shaped structure. U-Net was proposed by Olaf Ronneberger, Philipp Fischer, and Thomas Brox in 2015 [
41]. It is mainly designed to address the problem of scarce training data and the need for accurate pixel-level localization in biomedical image segmentation. The encoder (left path) consists of multiple convolutional and pooling layers that are progressively downsampled to capture the global contextual information of the image; the decoder (right path) progressively recovers the spatial resolution by upsampling (e.g., transposed convolution) and fuses the feature maps of the same layer with the encoder through jump connections to preserve the detail information. The jump connection combines shallow high-resolution features with deep semantic features to resolve the conflict between localization accuracy and semantic understanding in segmentation tasks. The output layer is convolved to generate pixel-level segmentation masks. U-Net and its variants have demonstrated excellent performance in medical image segmentation, and have become one of the most mainstream deep learning architectures in this field [
42], These variants further optimize feature fusion through dense jump connections and nested structures, and improve segmentation accuracy for complex textures (e.g., gradients; halos). The high accuracy makes U-Net suitable for the needs of processing hierarchical works such as TWNY Prints. The encoder part uses a multi-stage downsampling module, each stage contains two convolutional layers (with ReLU activation function) and a maximum pooling layer, whose mathematical expression is.
In this, the deep semantic features of the image are gradually extracted by stacking convolutional kernels, while the pooling operation compresses the spatial dimensions to enhance the generalization ability of the model. The decoder part implements up-sampling by transposed convolution with the kernel formula:
Here, the transposed convolution (step size) learns the spatial extension of the feature map by backpropagation, and the computation in the equation relies on the reconstruction of the input features by the convolution kernel. The hopping connection between the encoder and decoder fuses the shallow high-resolution details with the deeper semantic information through channel splicing (concatenation), by which the problems of edge blurring and detail loss are effectively mitigated. The output layer uses convolution to map the final features of the decoder to a pixel-level categorization space and combines them with
Softmax functions to generate a multiclass segmentation mask:
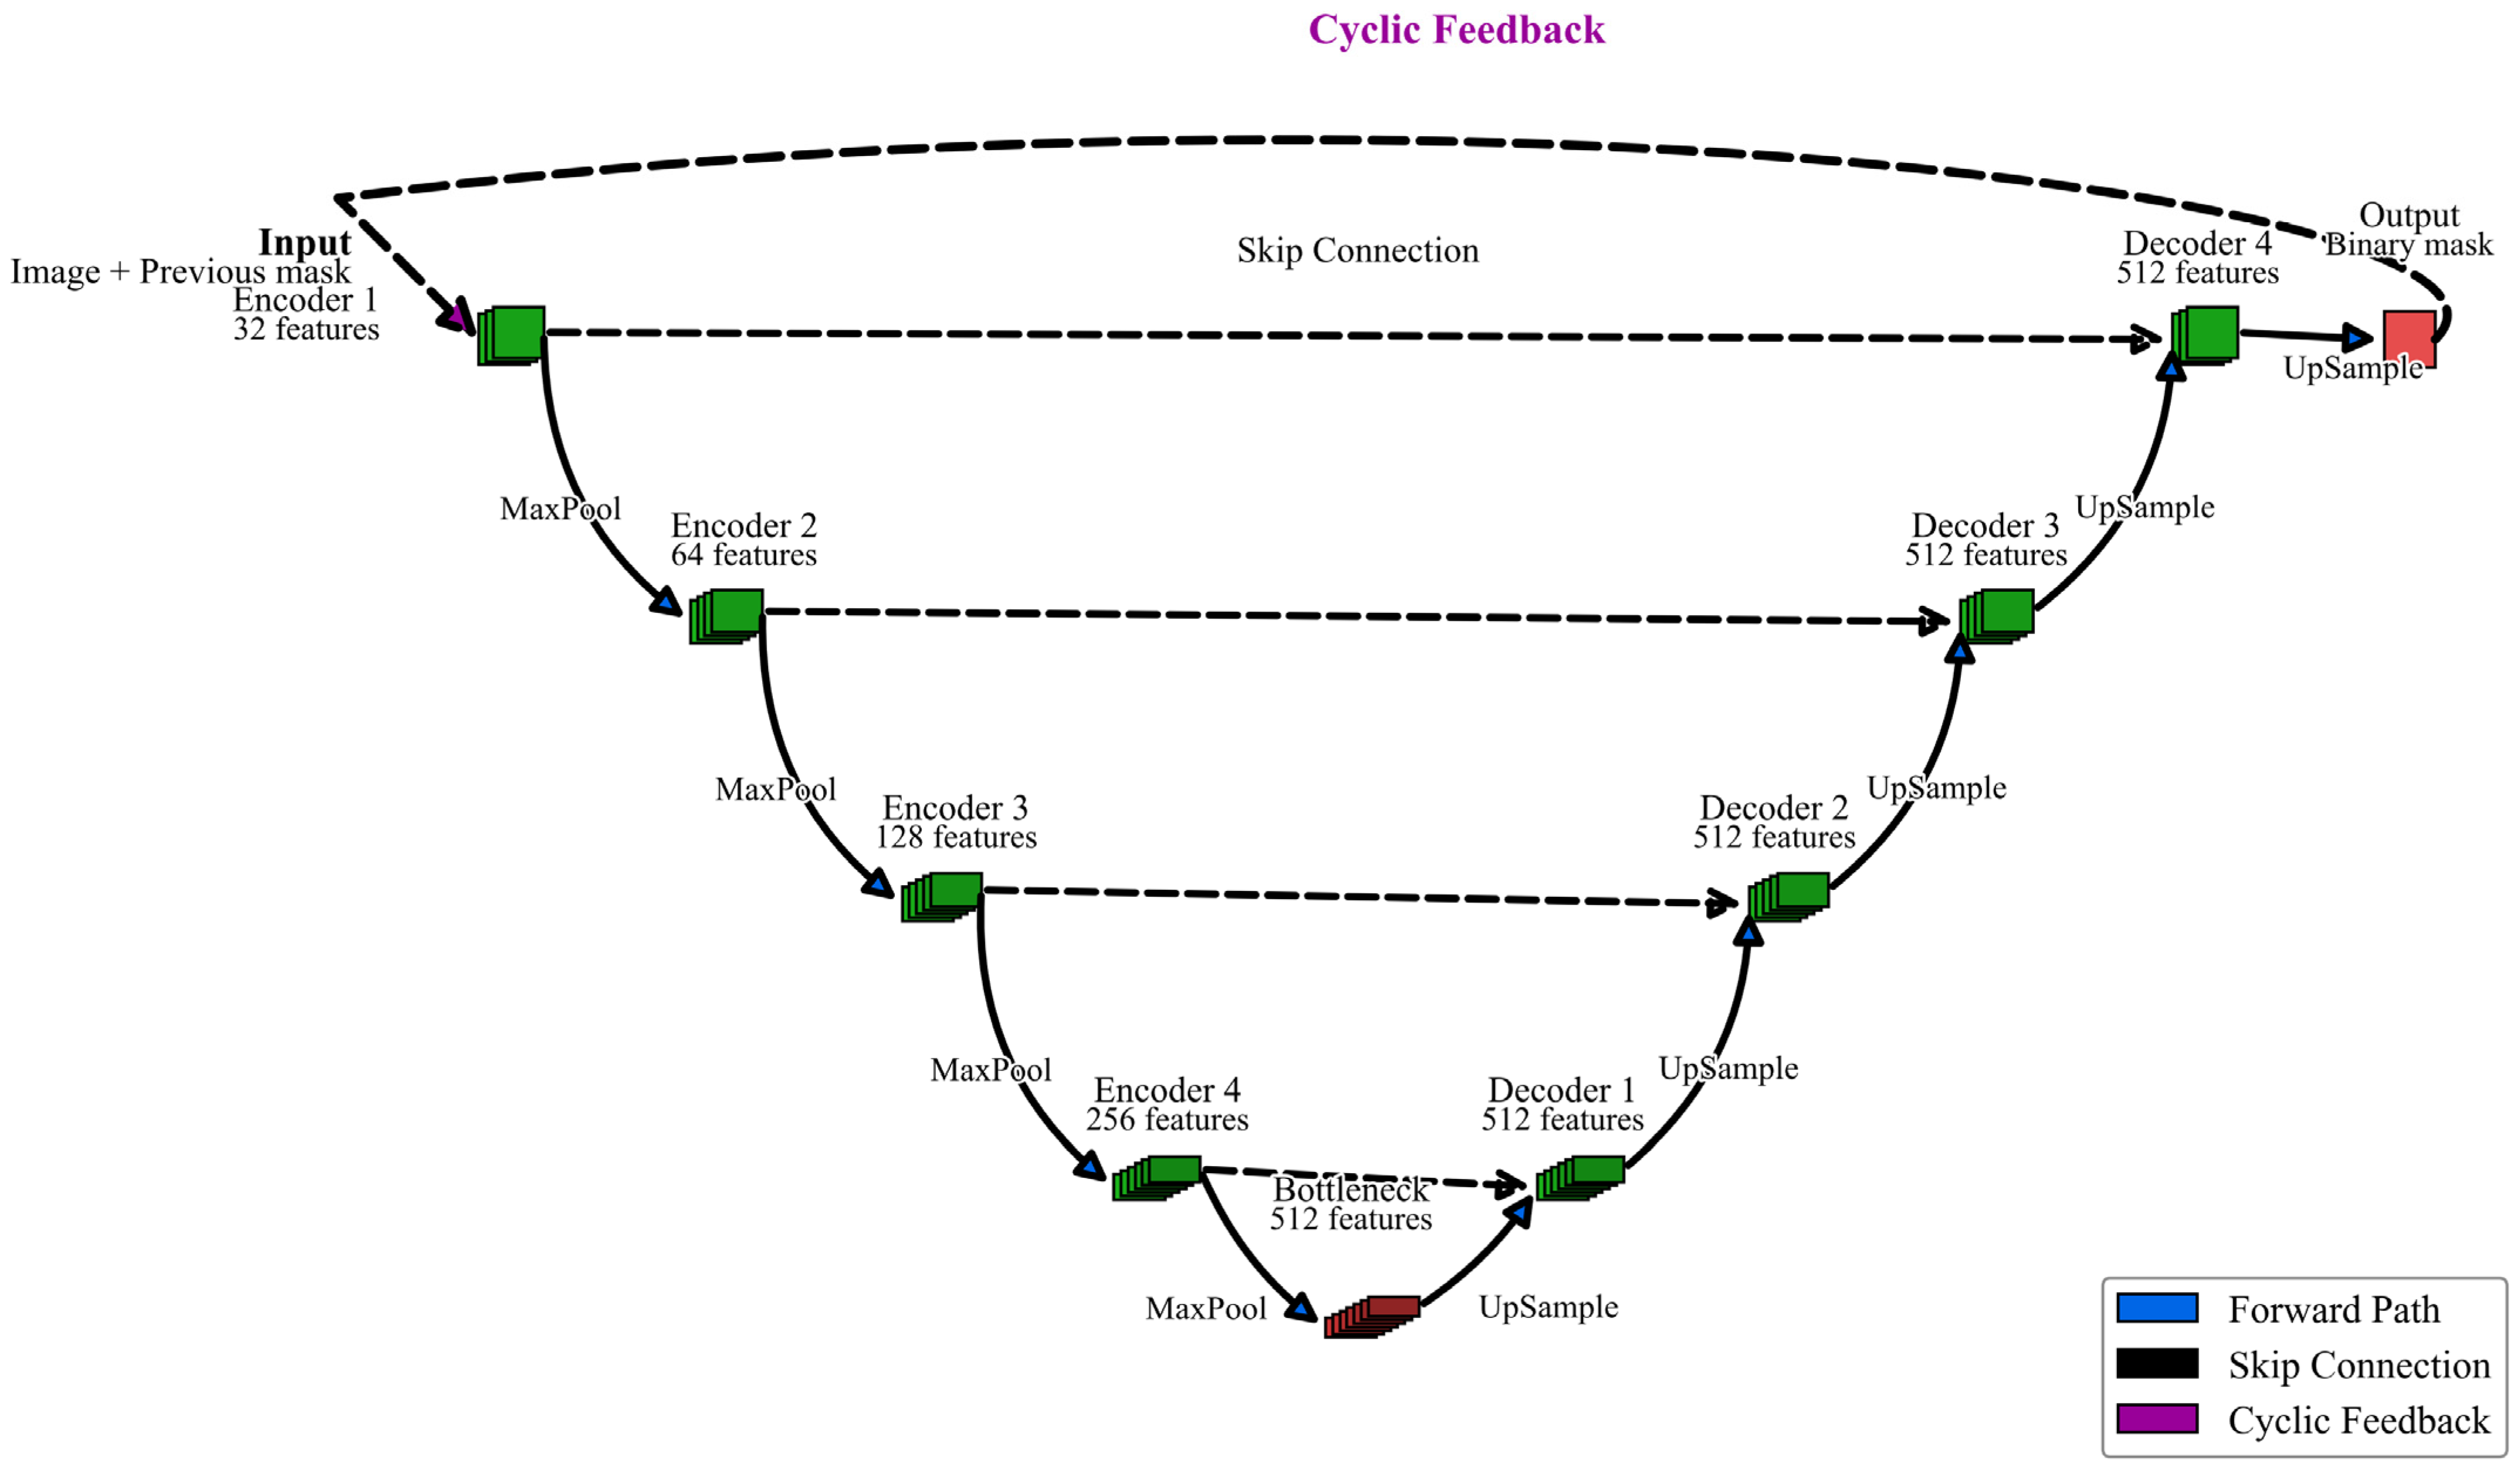
This project proposes the Cyclic U-Net architecture, an innovative model designed for hierarchical image segmentation, as shown in
Figure 1, to address the unique characteristics of TWNY Prints.
While traditional U-Net extracts all target categories in a single forward propagation, Cyclic U-Net adopts a recursive processing strategy to extract different color palette layers in the image layer by layer through multiple iterations, which is more suitable for processing TWNY prints with a clear hierarchical structure. Different from traditional U-Net, Cyclic U-Net introduces a recursive processing mechanism. The input of the model includes not only the original image, but also the cumulative mask of the previously extracted layers, which can be expressed as follows:
where
is the original image and
is the combination of all layer masks extracted in the previous
iterations. This design allows the model to “remember” what has been extracted and focus on finding new layers that have not yet been extracted. Cyclic U-Net introduces an adaptive stopping mechanism based on the area ratio and layer overlap, which automatically stops the iteration when the area of the newly extracted layer is smaller than a preset threshold or the overlap with the extracted layer exceeds a threshold:
2.3. Research Route
In this study, 200 TWNY Prints were selected from the
Complete Collection of Chinese Woodblock New Year Prints as the sample set [
43]. Since the dataset consists of scanned images from books, the overall colors tend to be dull and grayish, with extraneous background tones. To address this, batch preprocessing was performed using computer-based image enhancement techniques to restore the original color fidelity of the images and remove the unnecessary background. No dedicated ICC color correction profile was applied due to the dataset being derived from published book scans; instead, a consistent preprocessing pipeline was applied to all samples to maintain relative color fidelity across the dataset.
To ensure accurate input data for subsequent processing, all TWNY Print images first undergo preprocessing to restore color fidelity and remove extraneous background tones. This step involves white balance correction, contrast enhancement, mild saturation adjustment, background normalization, and light edge sharpening, effectively compensating for the dull, grayish tones and color deviations introduced during book scanning.
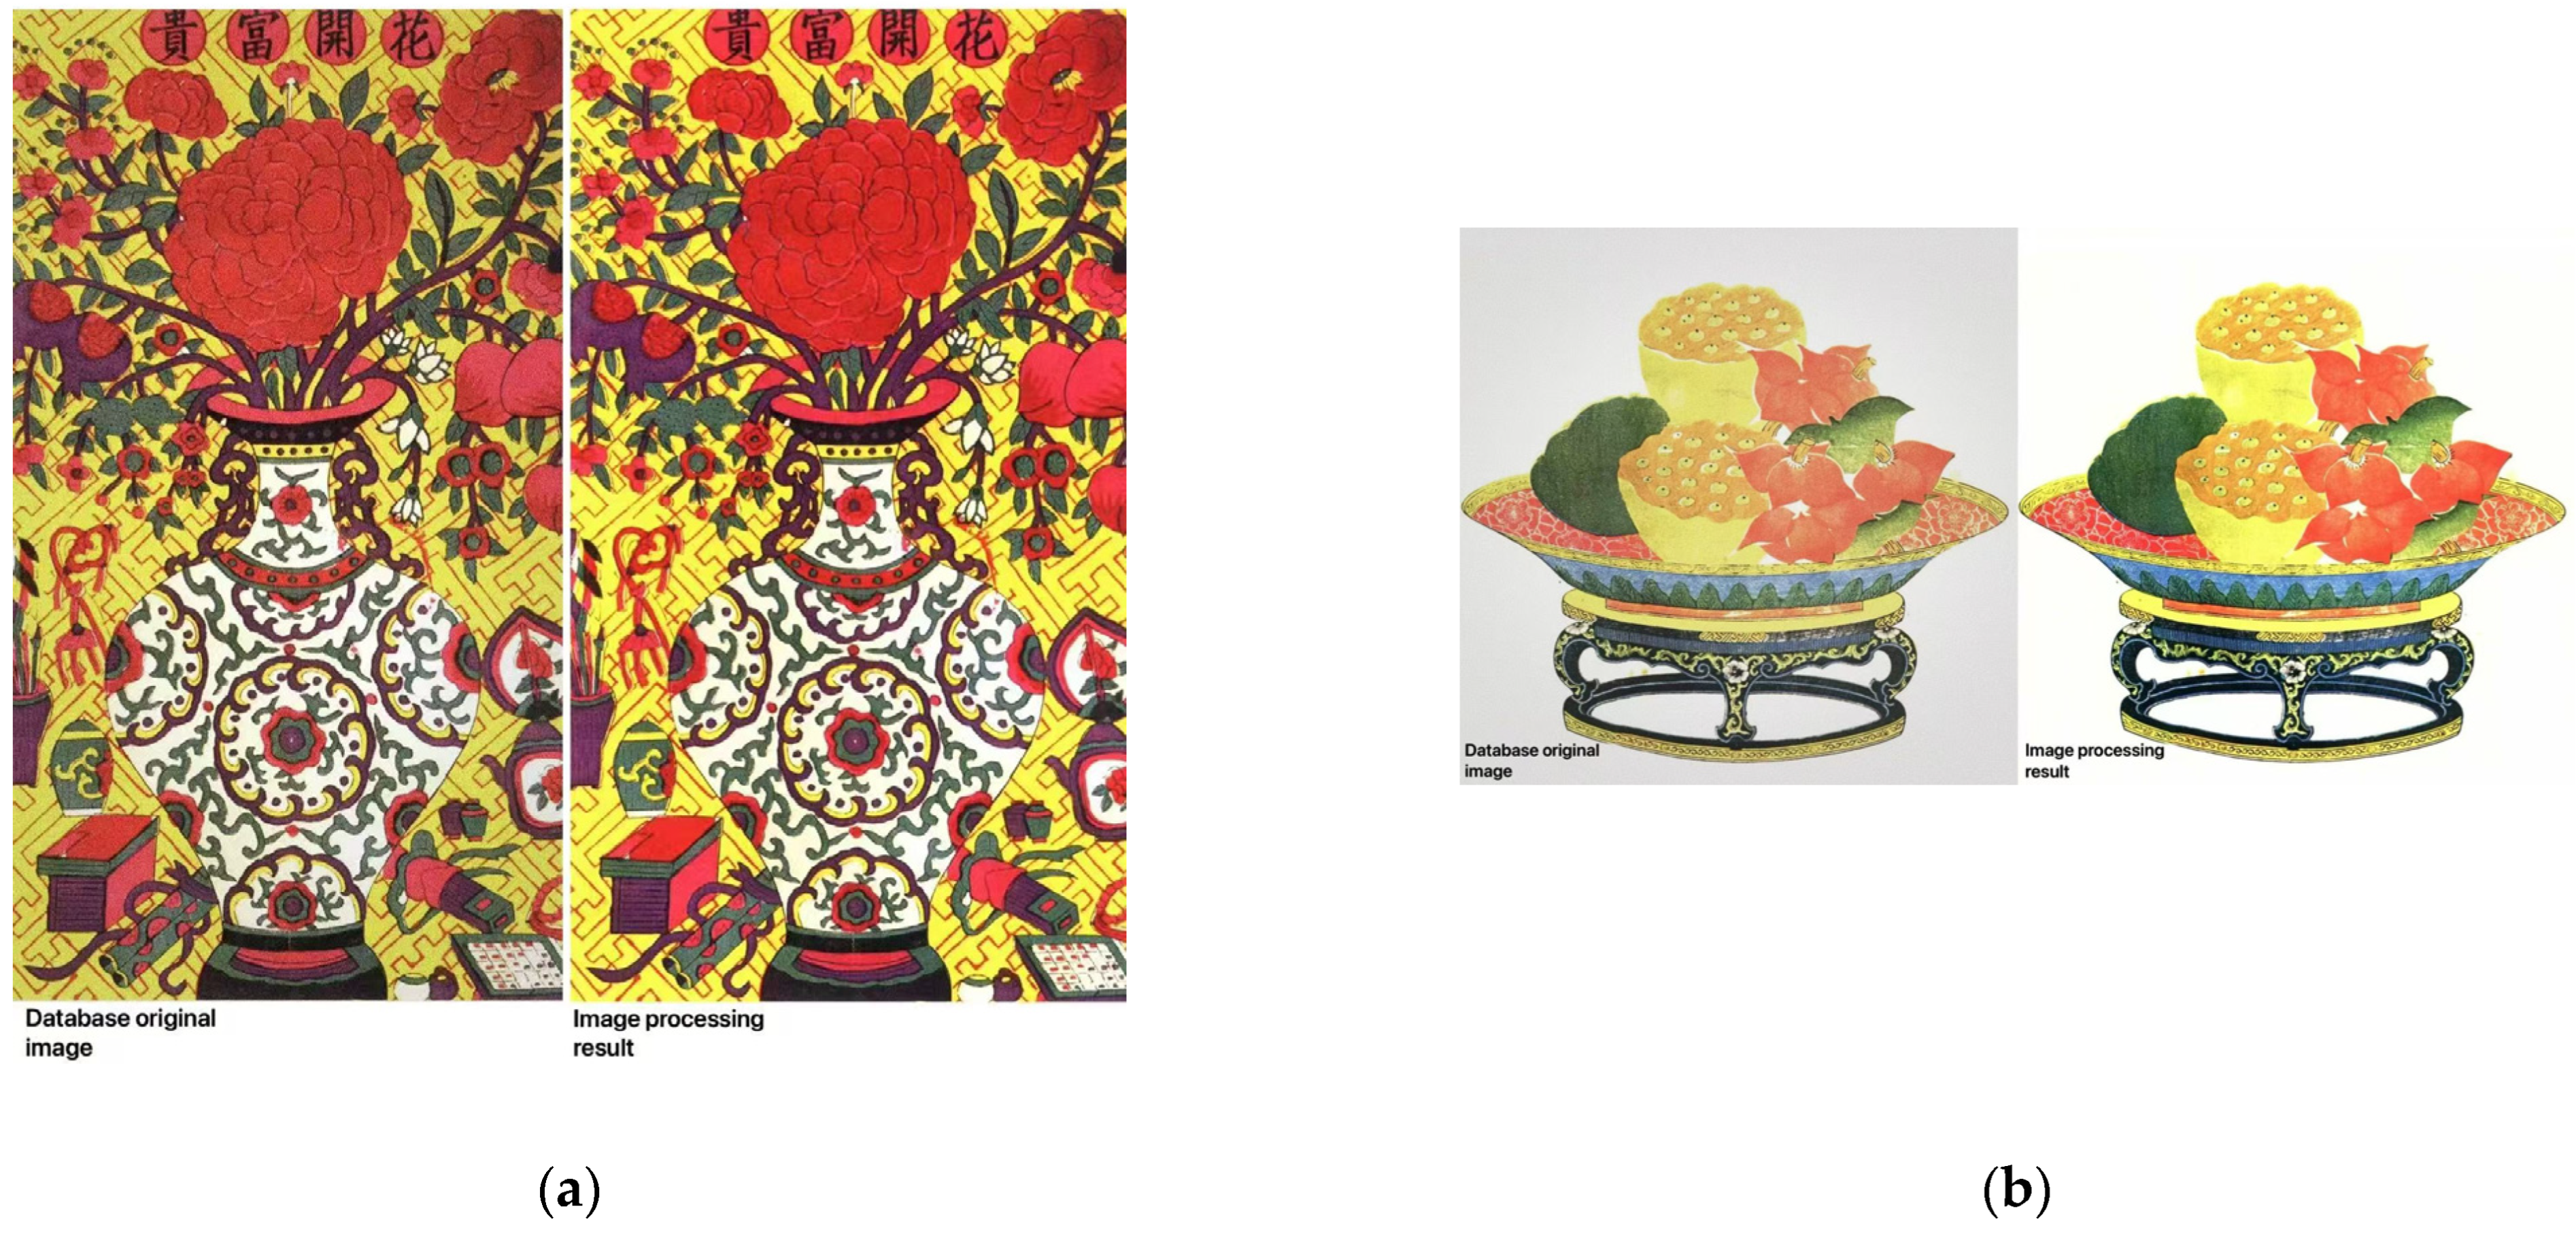
Following this, the proposed technical framework—comprising four core stages—is applied to achieve precise digital layer separation and standardized color reconstruction. The method automatically determines the necessary number of color layers and performs color clustering within a perceptual color space aligned with human visual perception, ultimately generating pure, discrete color layers suitable for standardized digital production. To illustrate the preprocessing stage of this study, two representative images of TWNY Prints, shown in
Figure 2a,b, were selected from the sample set to present a side-by-side comparison of the original scanned images and the results after color restoration and background removal.
In addition, a Cyclic U-Net model is introduced to improve the efficiency of layer separation for TWNY Prints. This model is designed to learn the interrelationships between different layers, enabling direct output of the separated color layers.
2.3.1. Contour Extraction Using the Canny Operator
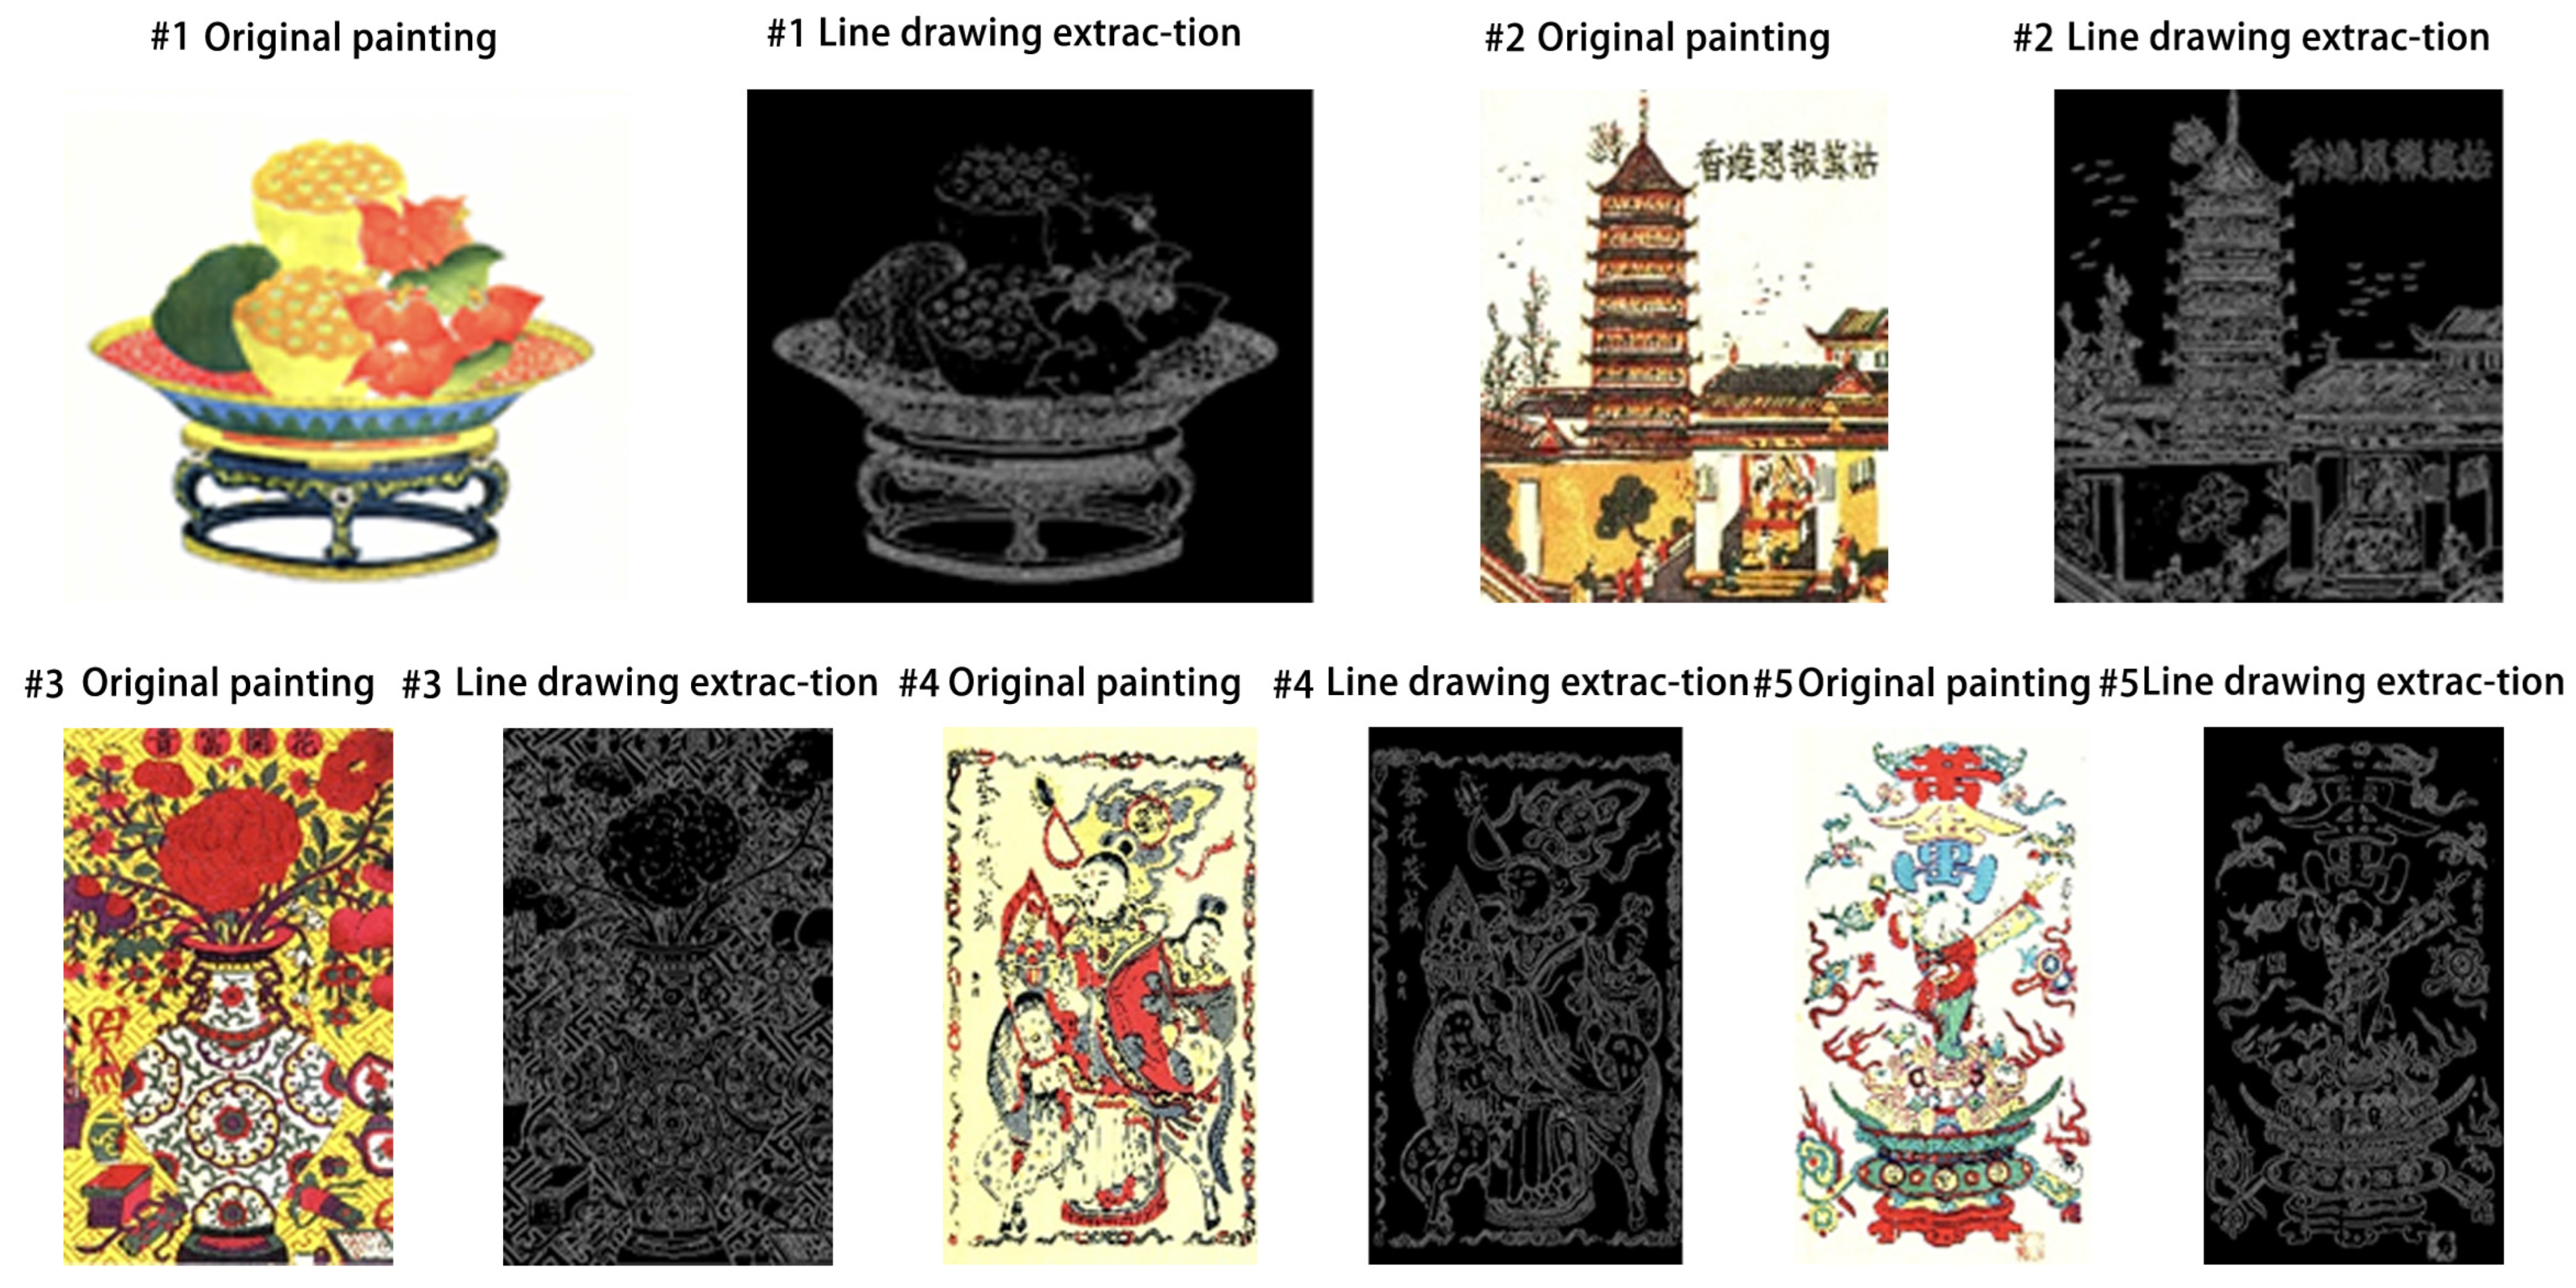
Given the artistic characteristics of TWNY Prints, which feature clear black ink outlines as the structural framework, preprocessing of the input images was first performed using the Canny edge detection algorithm. The purpose of this step is to extract the “black outline layer,” which serves as the foundation for the print composition. This approach not only aligns with the traditional “one block, one color” overprinting process but also provides precise layer boundaries for the subsequent extraction of pure color plates, thereby improving the accuracy of color segmentation.
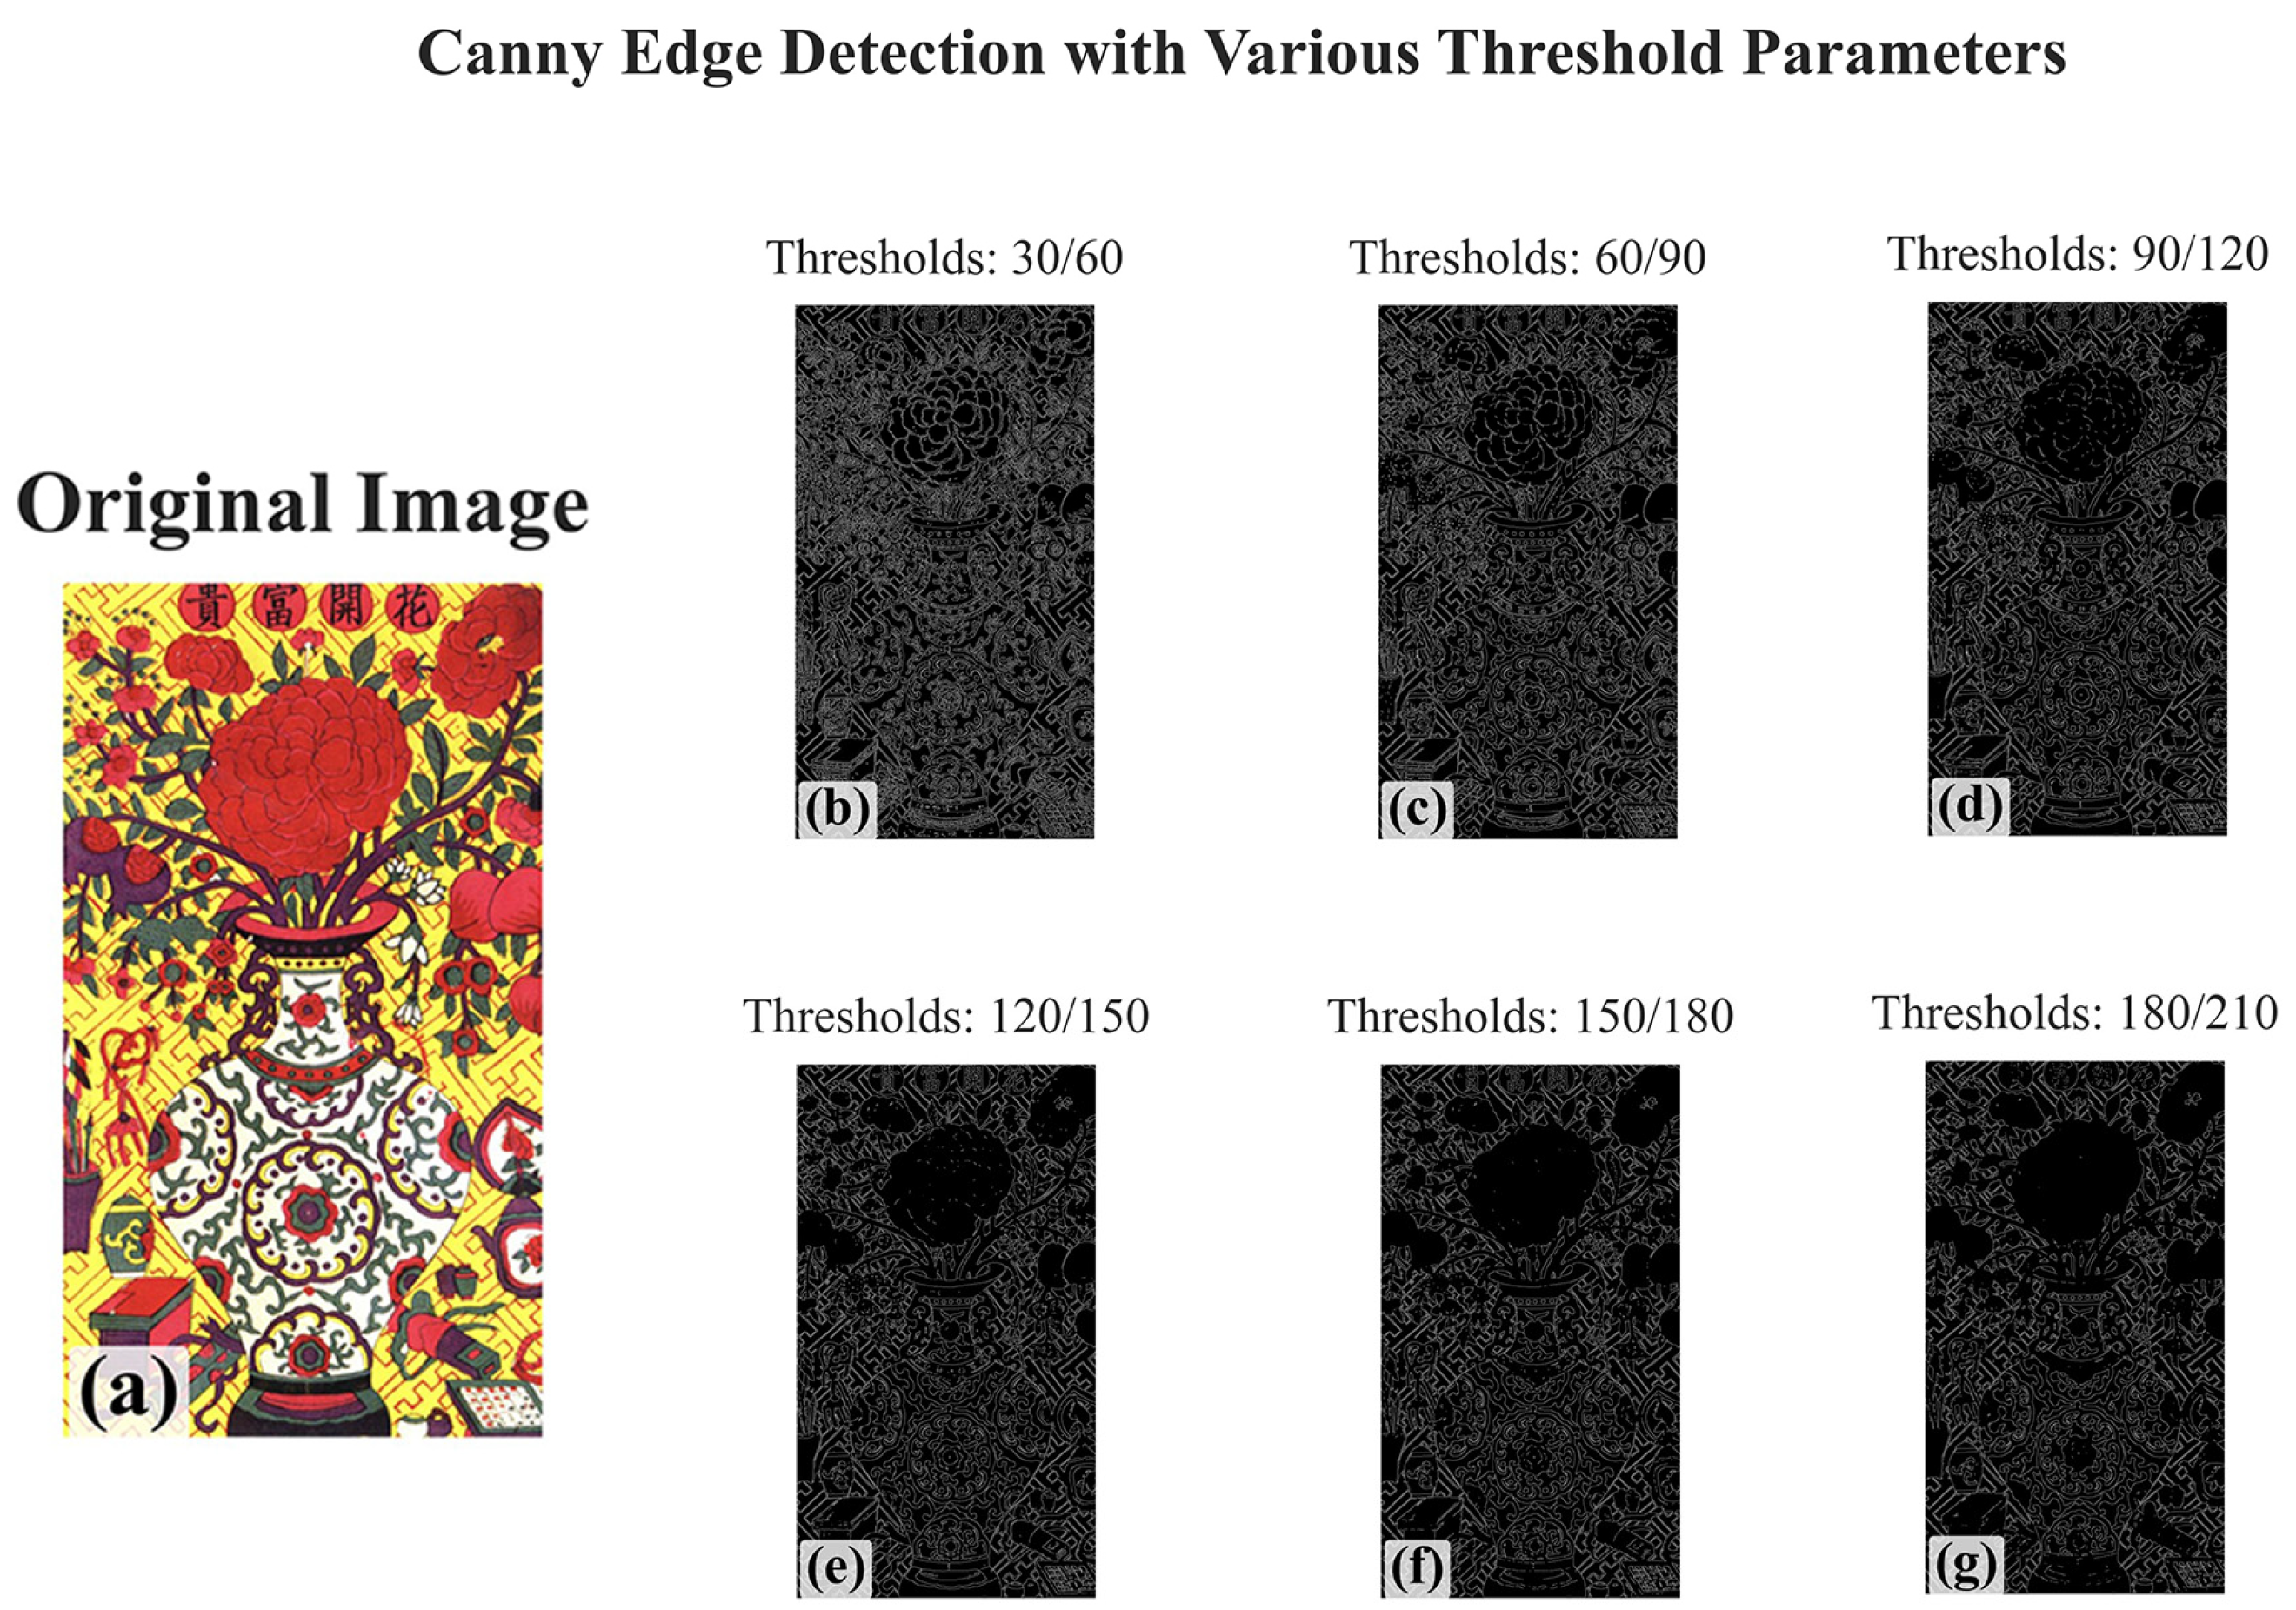
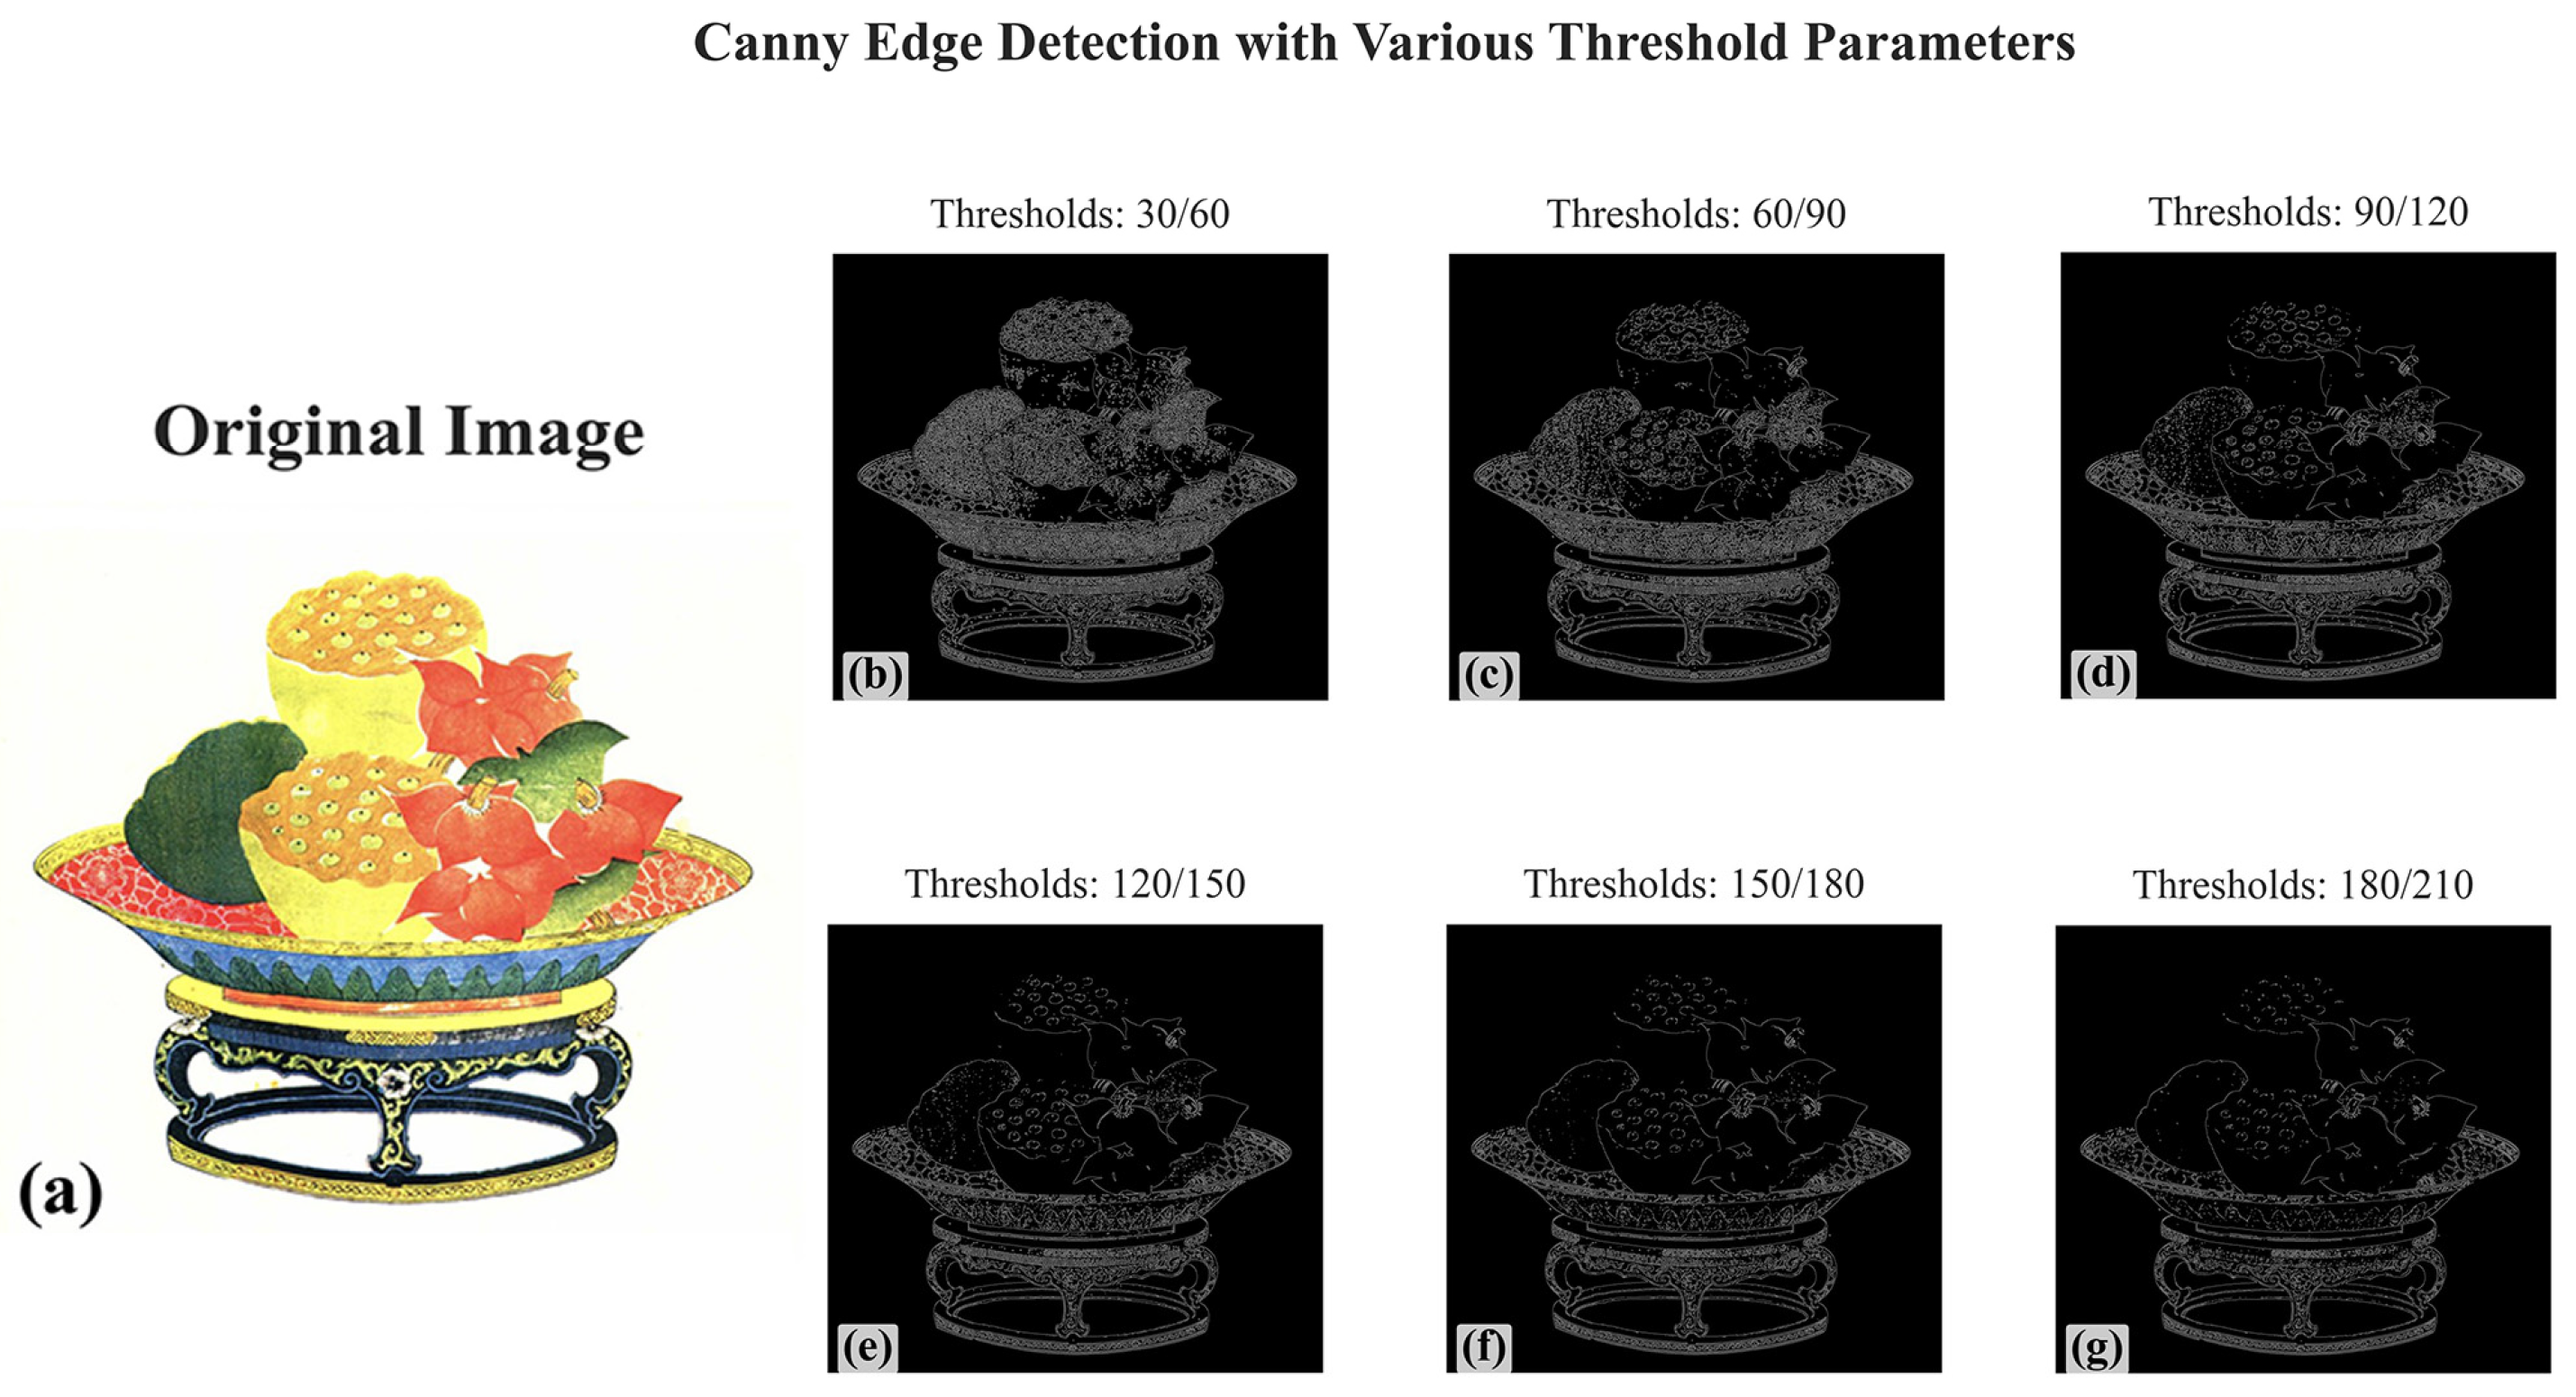
To optimize the performance of the Canny edge detection algorithm, systematic comparative experiments were conducted, focusing on two key parameters: the low threshold and high threshold. The Canny algorithm uses a dual-threshold strategy for edge detection, where the high threshold identifies strong edges, while the low threshold helps connect these edges to form complete and continuous contours.
Figure 3 and
Figure 4 present the Canny edge detection results for selected representative images of TWNY Prints.
Testing successive threshold intervals of 30–60–90–120–150–180–210 showed that the combination of a low threshold set to 90 and a high threshold set to 120, as shown in
Figure 3d and
Figure 4d, most accurately captures the ink line characteristics of the TWNY Prints. The advantage of this parameter combination lies in the fact that the lower low threshold (60) can capture enough potential edge information to avoid line breakage, while the moderate high threshold (90) effectively filters out the false edge generated by the color transition region and texture details, preserving the integrity and continuity of the ink lines. Excessively high threshold combinations (e.g., 150–180 or 180–210) result in the loss of fine ink lines, while excessively low threshold combinations (e.g., 30–60) introduce too much noise and non-ink line structures that interfere with subsequent color clustering.
2.3.2. Minimum Number of Clusters (K_min) Based on Color Dominance Analysis
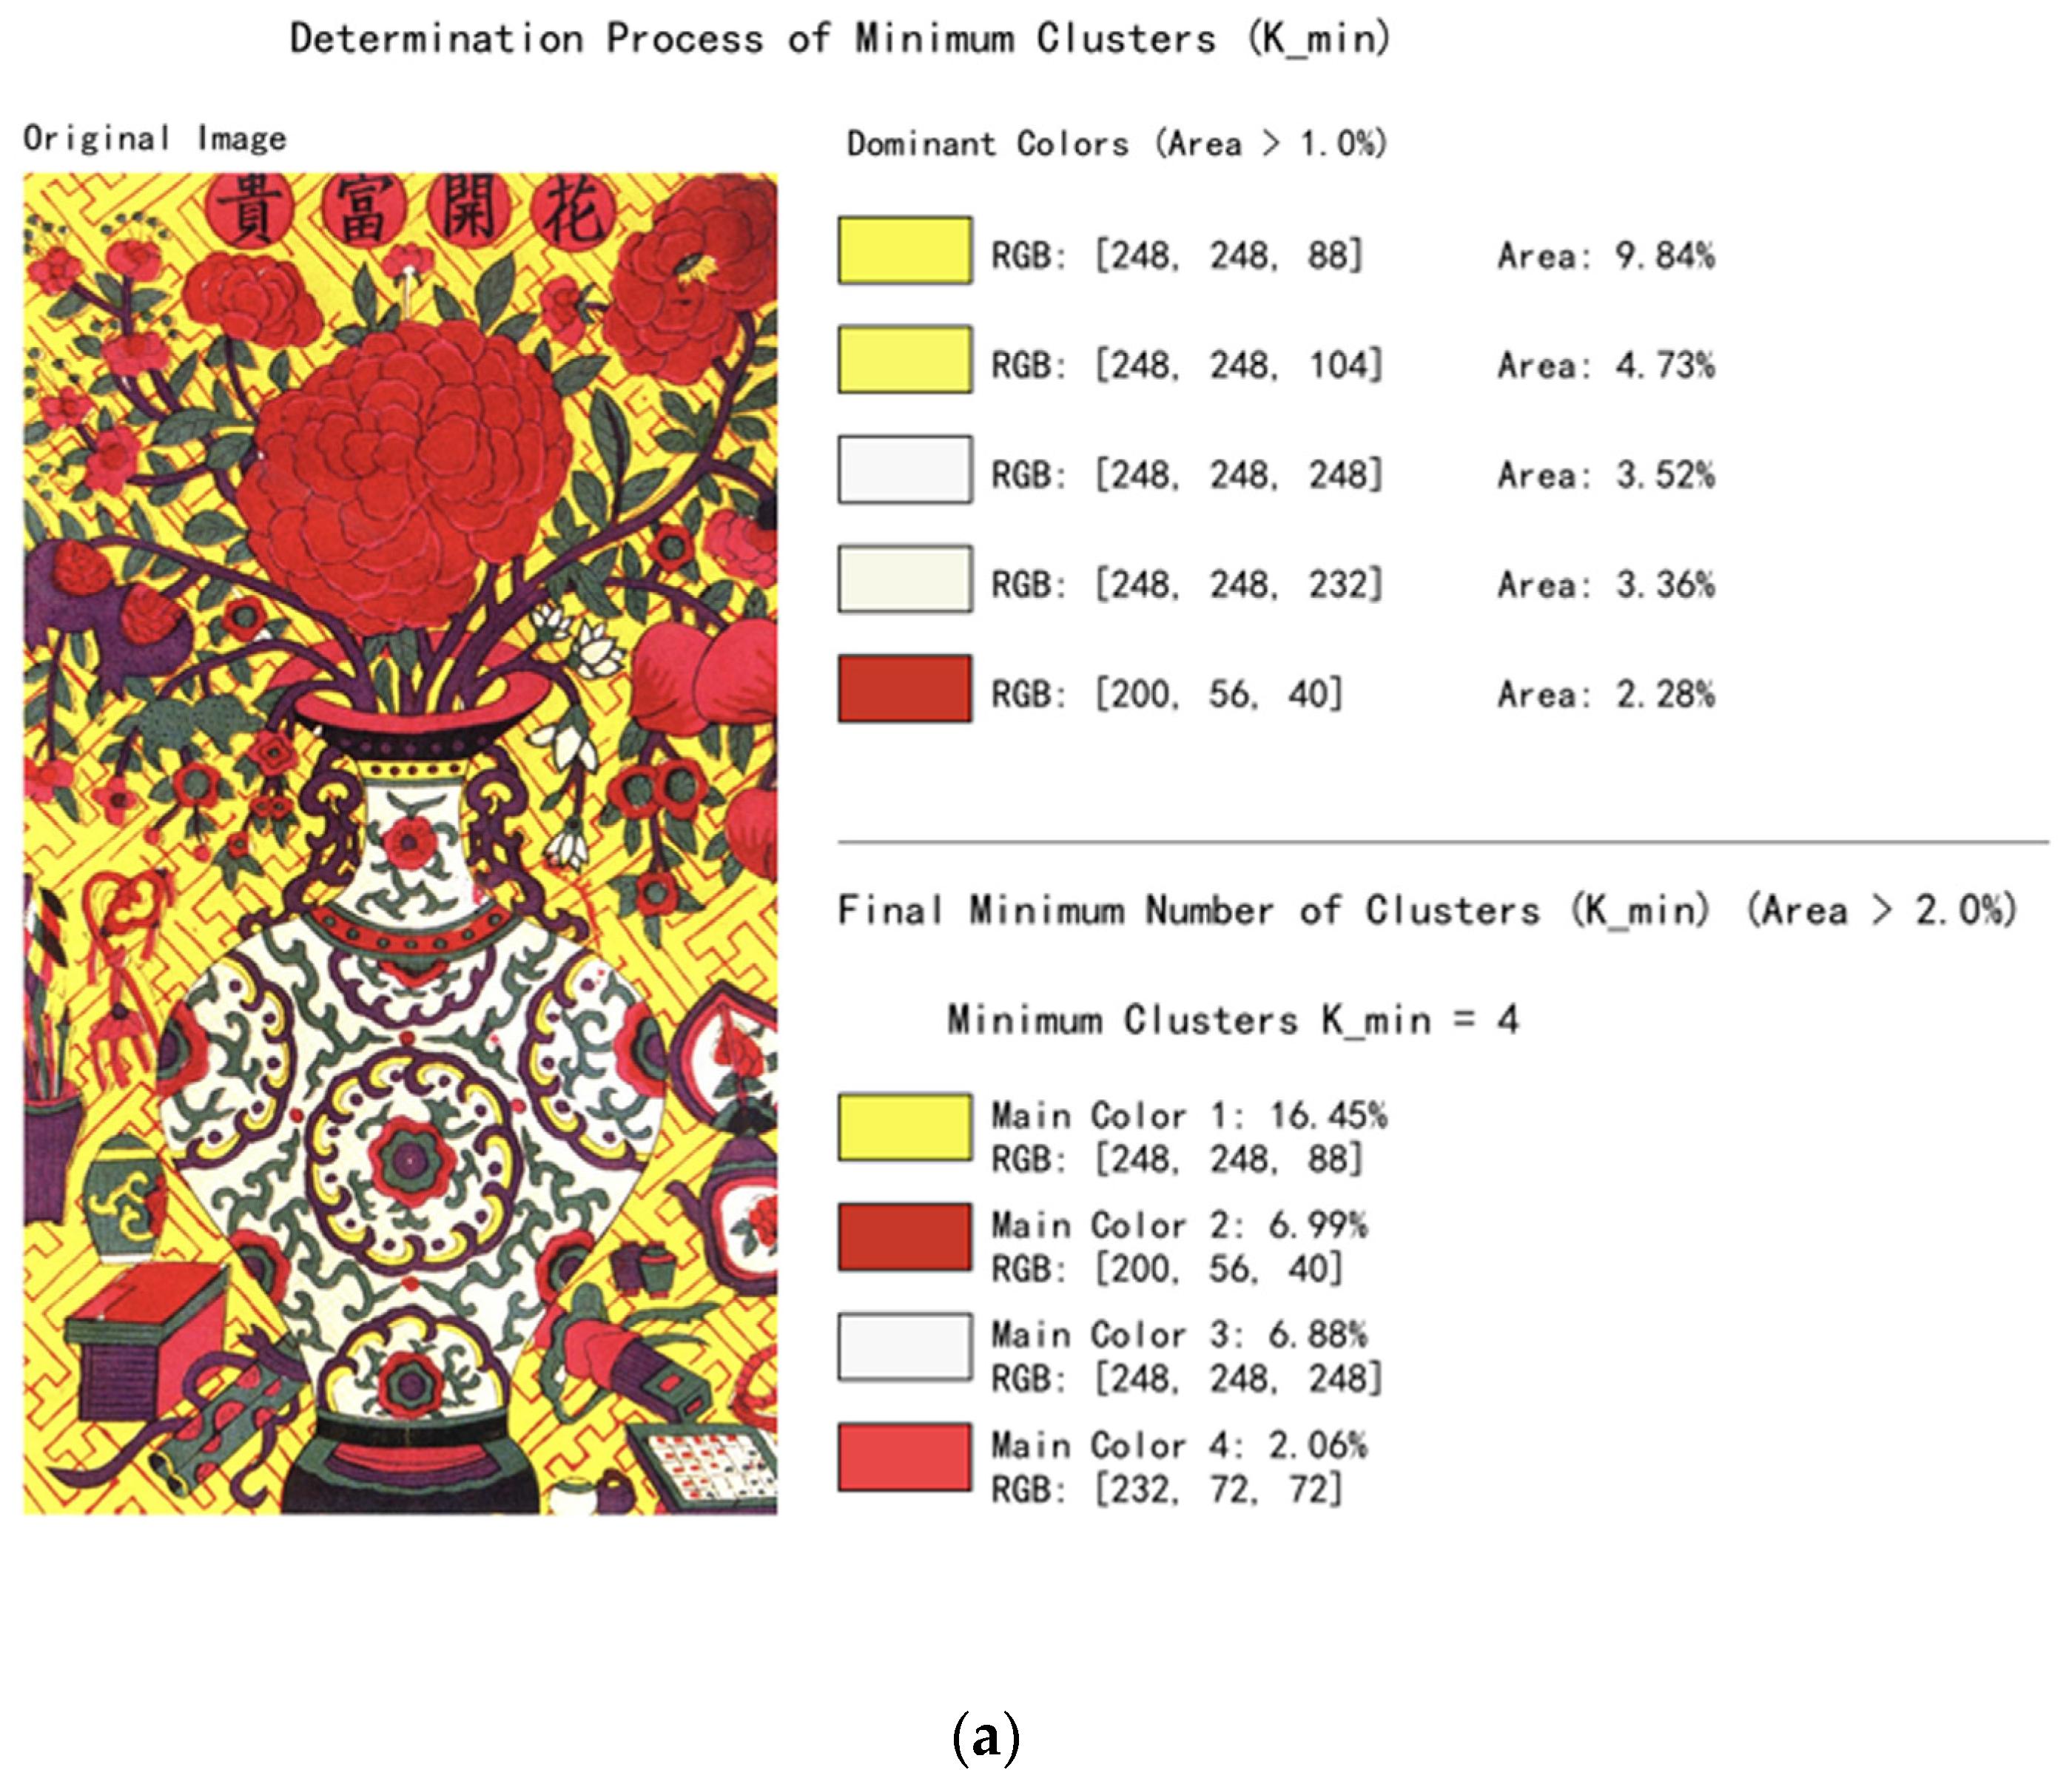
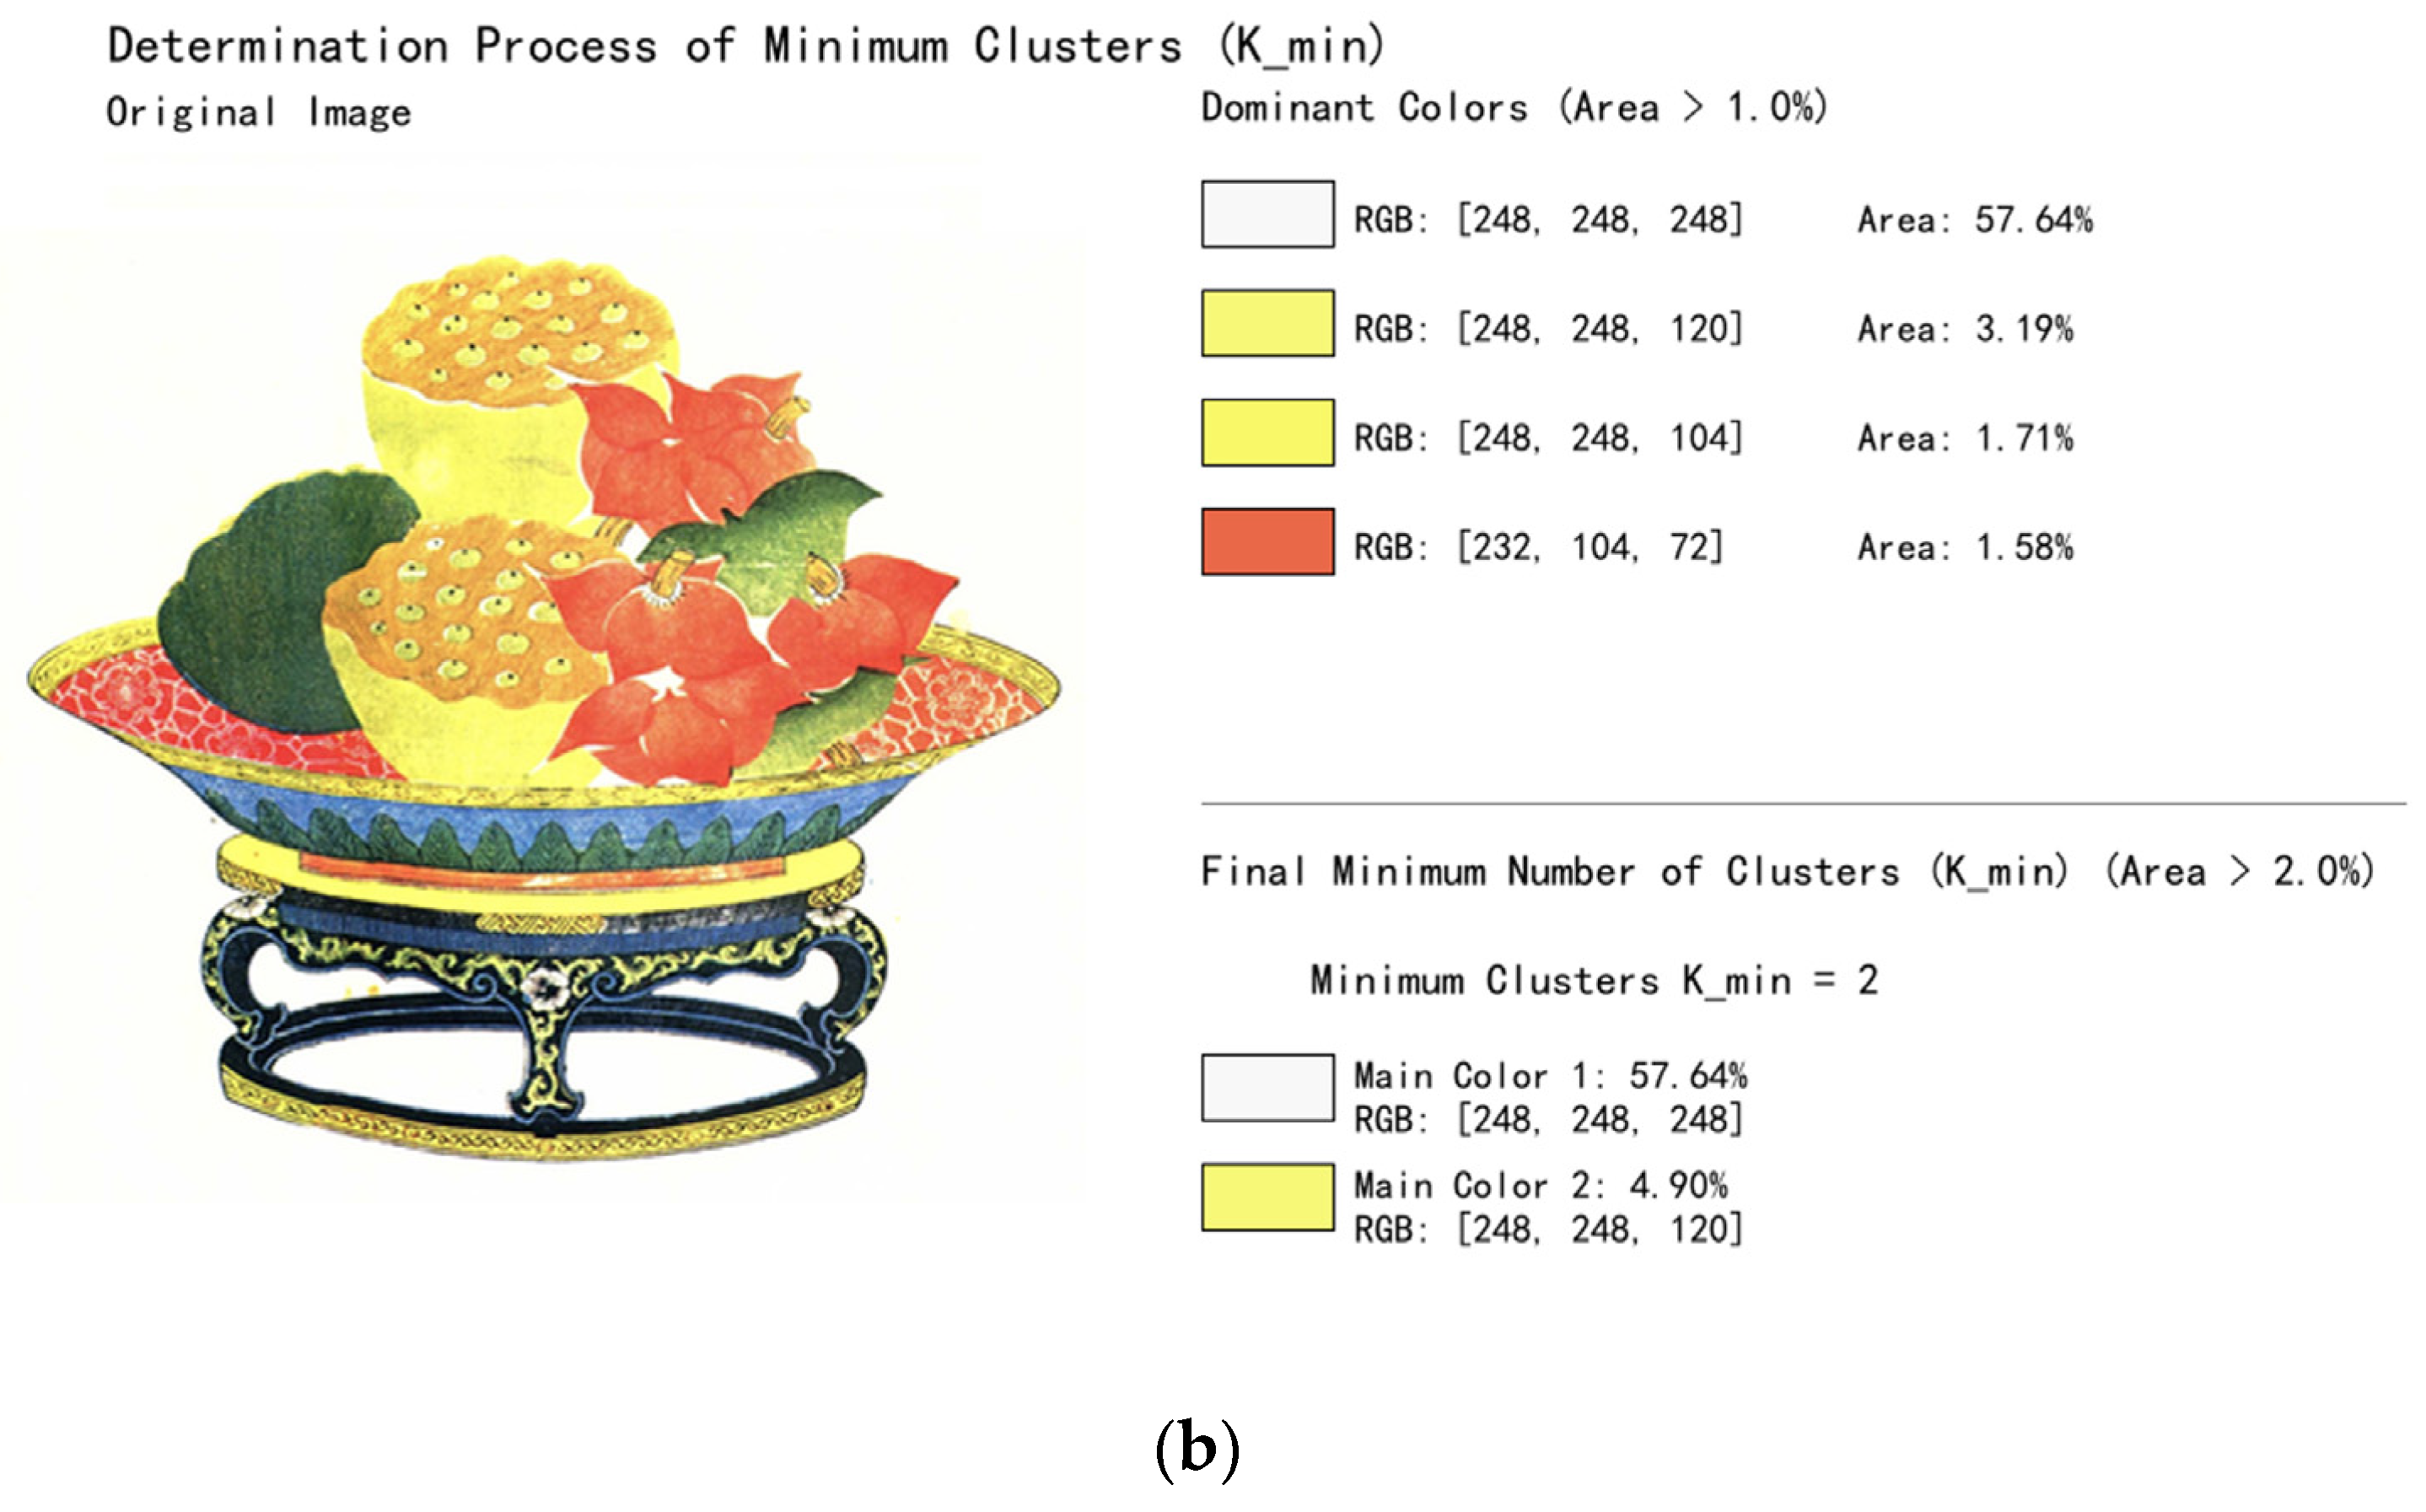
To enhance the specificity of clustering analysis and prevent the omission of key dominant colors, the design of a preprocessing mechanism was implemented to determine the minimum number of clusters (K_min) based on color dominance analysis. This mechanism adaptively identifies K_min by performing statistical analysis of the image’s color space and detecting visually significant colors.
First, a color histogram is constructed in the RGB color space by discretizing the color value range into a 16 × 16 × 16 three-dimensional grid, with each dimension corresponding to the R, G, and B channels. This partitioning preserves sufficient color detail while avoiding excessive subdivision that could lead to increased computational cost. The color area distribution is then derived by calculating the percentage of pixels in each non-empty grid cell relative to the total number of pixels.
Next, an area threshold of 1% (during color extraction) is applied to filter out all colors whose area ratio exceeds this value, defining them as “dominant colors.” These colors play a key role in visual perception and must be retained during clustering, with their pairwise Euclidean distances subsequently computed. If the distance between two colors is below a predefined merging threshold (set to 20.0), they are considered visually similar and are merged into a single dominant color. During merging, smaller area colors are absorbed by larger area colors to ensure that the resulting colors accurately reflect the visual characteristics of the original image.
After the merging process, the remaining colors are re-ranked by area size, and a second area threshold (2% during color extraction) is applied to finalize the dominant color set. The number of remaining dominant colors is defined as K_min, representing the minimum number of clusters required to capture the primary color information in the image.
K_min serves as the lower bound for subsequent cluster number determination using methods such as the elbow method, silhouette coefficient, and Calinski-Harabasz (CH) index, with the search range set as [K_min, K_max]. In our experiments, K_max is set to 12, considering the typical color characteristics of TWNY Prints and balancing computational precision and efficiency.
The core advantage of this preprocessing mechanism lies in its adaptability to dynamically adjust clustering parameters according to the image’s inherent color complexity. This approach prevents both under-clustering, which could result in the loss of key dominant colors, and over-clustering, which increases computational burden and introduces noise. Experimental results demonstrate that this mechanism is particularly effective for images with distinct color hierarchies, such as TWNY Prints, accurately capturing essential color layers and providing a reliable foundation for subsequent digital restoration and color reconstruction.
Figure 5 illustrates the color merging process applied to representative sample images.
2.3.3. Optimal Number of Clusters (K) and Method Selection Based on Multi-Indicator Assessment
To ensure that color difference calculations align more closely with human visual perception, the conversion of image color data from the RGB color space to the CIELAB color space was performed. The perceptual uniformity of the CIELAB space provides a more reliable mathematical foundation for subsequent clustering evaluations. During preprocessing, standardization was applied, and a weighted strategy was introduced across different channels: the a* and b* channels in the CIELAB space, which carry the chromatic information, were assigned a weight factor of 1.5 to enhance color distinction capability.
To balance local color block integrity with global color consistency, the feature construction process incorporated spatial coordinate information, assigning a weight ratio of 5.0 to color information and 0.3 to spatial positioning. This design enables the clustering algorithm to effectively distinguish color differences while maintaining spatial continuity.
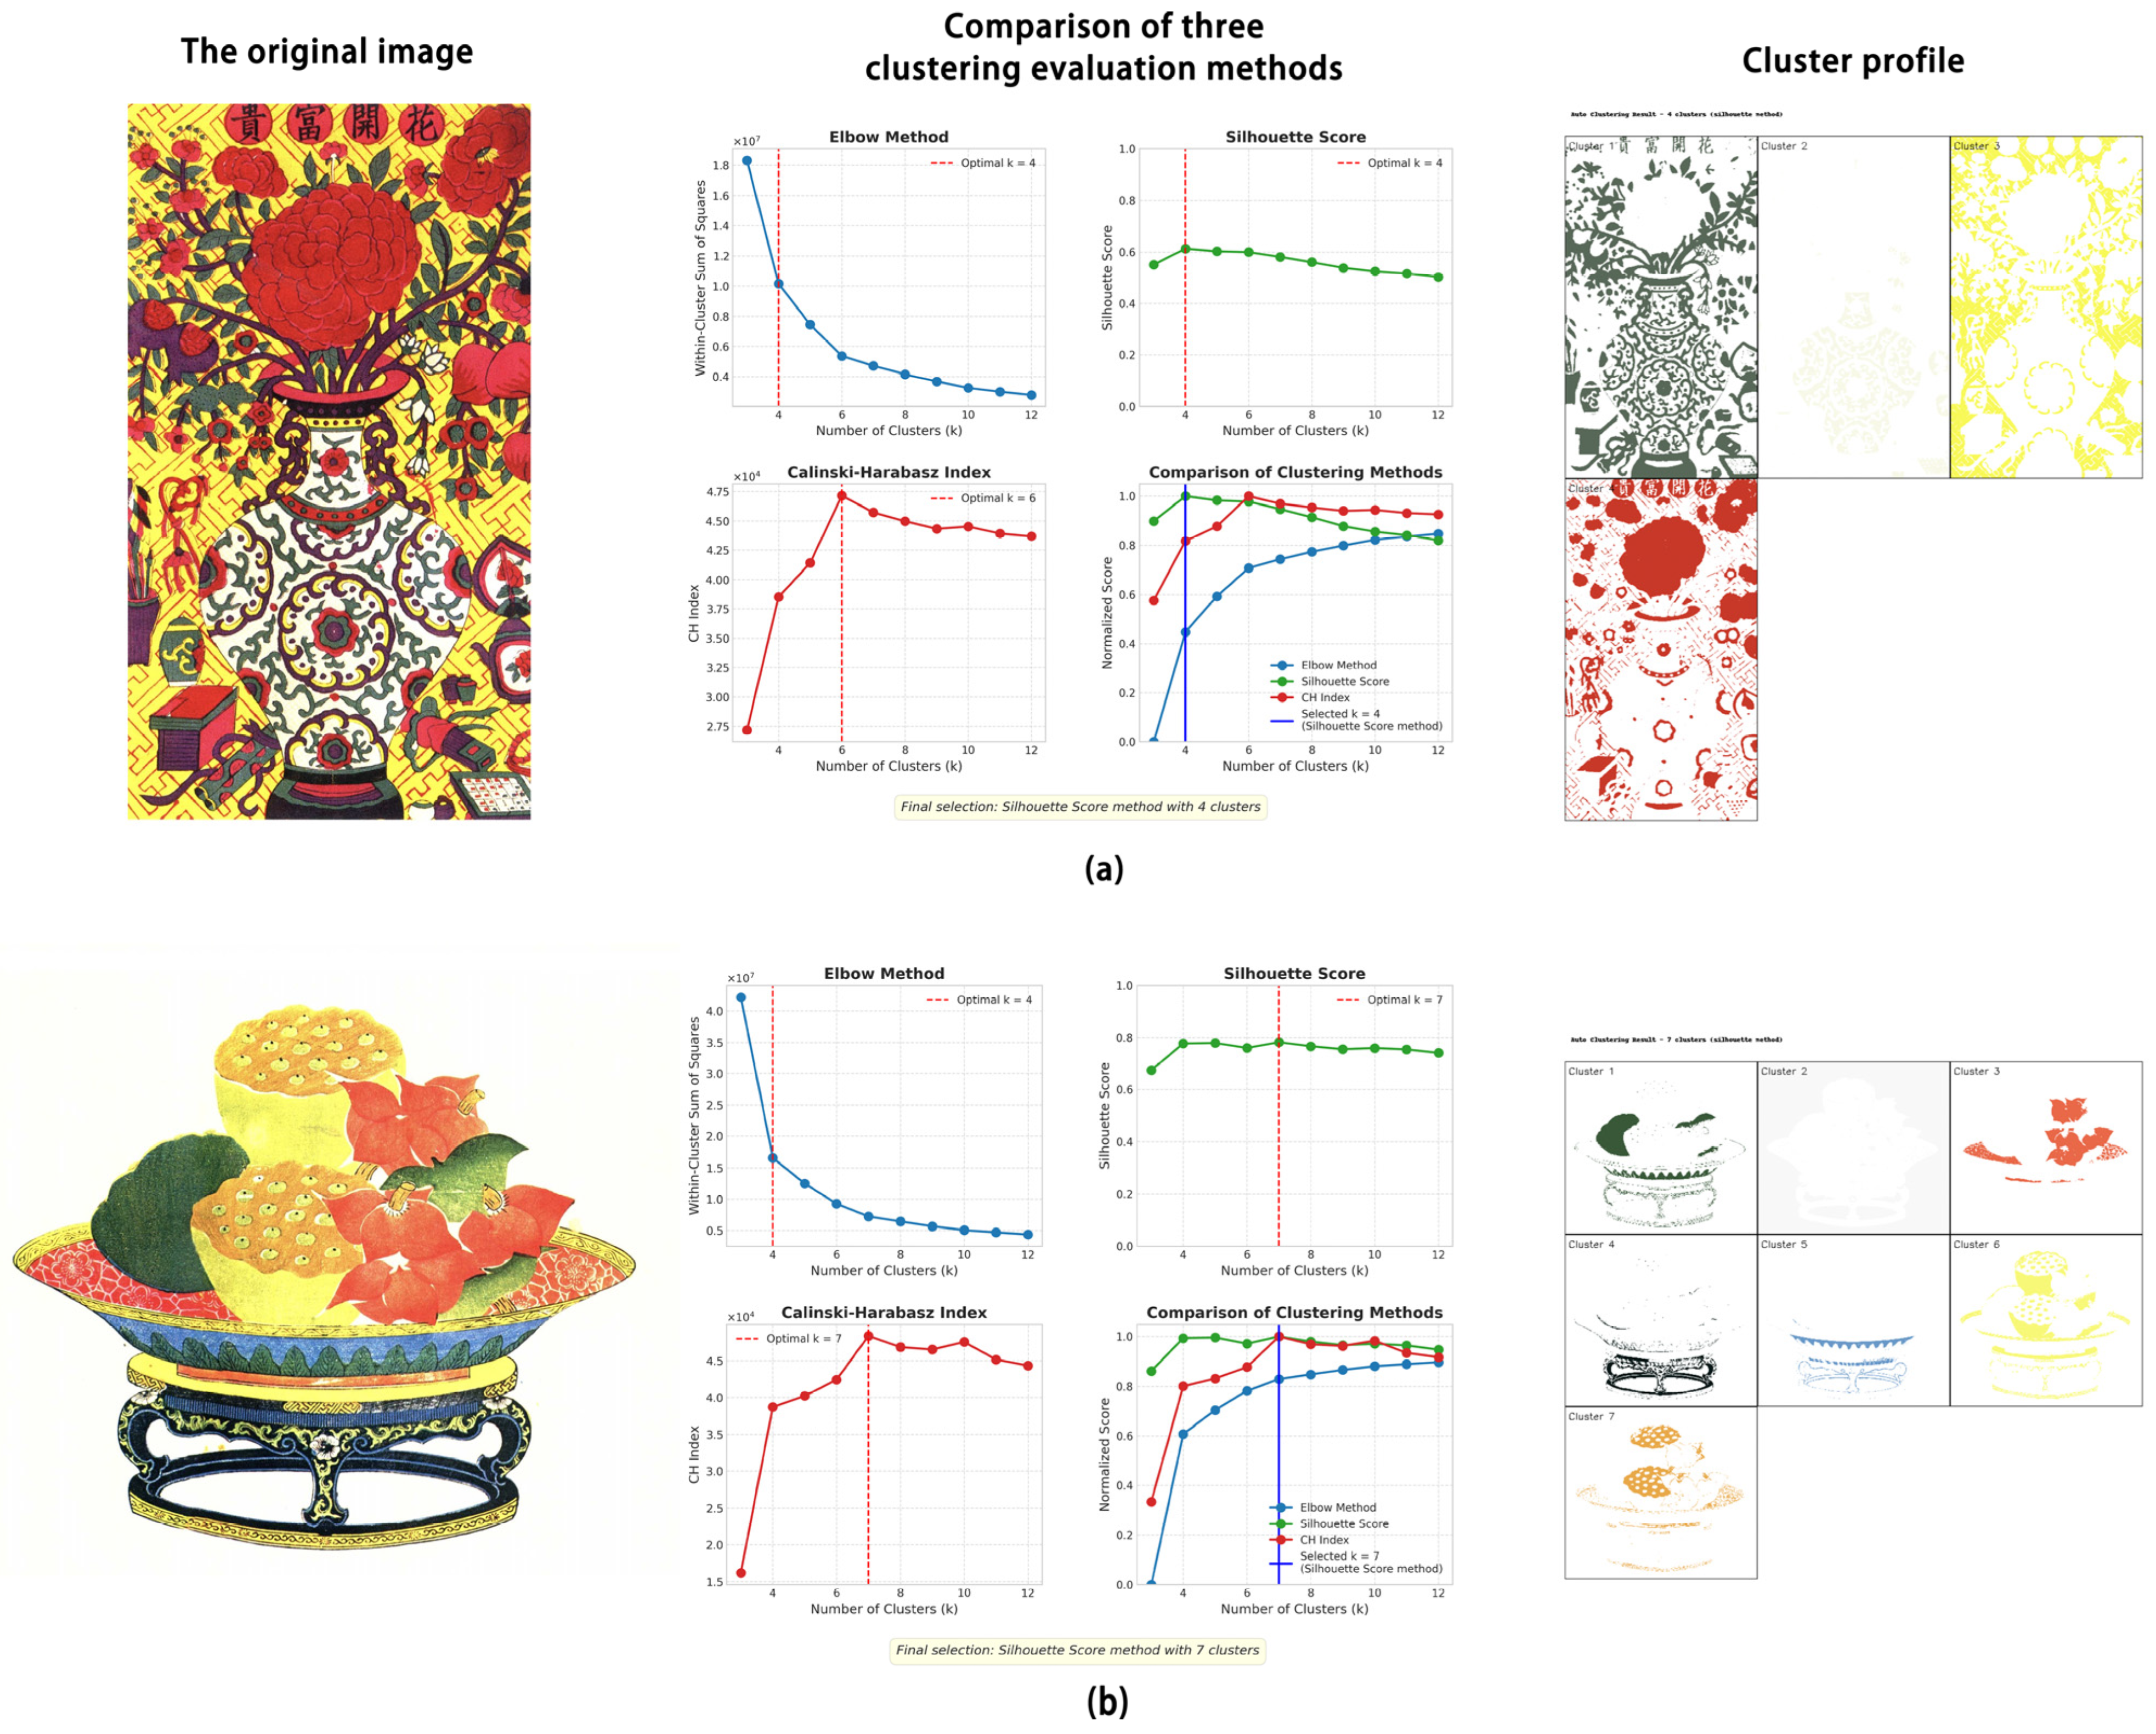
Within a search range not lower than the initial minimum cluster number K_min (as determined by the dominant color area analysis described previously), the determination of the optimal number of clusters K was performed through a comprehensive evaluation combining three classic clustering validation methods:
Elbow Method: This method analyzes the within-cluster sum of squares (WSSs) curve with respect to varying K values, identifying the point of maximum curvature as the optimal K. The implementation of an improved algorithm based on second-order difference and slope change analysis, with the introduction of a positional weighting factor, was carried out to avoid the selection of excessively high cluster numbers.
Silhouette Score: This metric evaluates the compactness and separation of clusters, with values ranging from −1 to 1, where scores closer to 1 indicate higher clustering quality. To balance computational efficiency with accuracy for large datasets, the adoption of a random sampling strategy was combined with silhouette score calculation based on 20,000 sampled pixels.
Calinski-Harabasz Index (CH-Index): This index assesses the clustering performance based on the ratio of between-cluster dispersion to within-cluster cohesion, with higher values indicating better clustering quality. The CH-Index is particularly sensitive to data distribution characteristics and performs well on TWNY prints with clearly separated color regions.
A weighted majority voting decision mechanism was developed; when two or more evaluation methods recommend the same number of clusters, that value is adopted as the final K. In cases where all three methods yield inconsistent results, priority is given to the value suggested by the silhouette score. Any recommended K values below the minimum acceptable threshold (typically set to 3) are automatically adjusted to the minimum to ensure sufficient color detail is preserved.
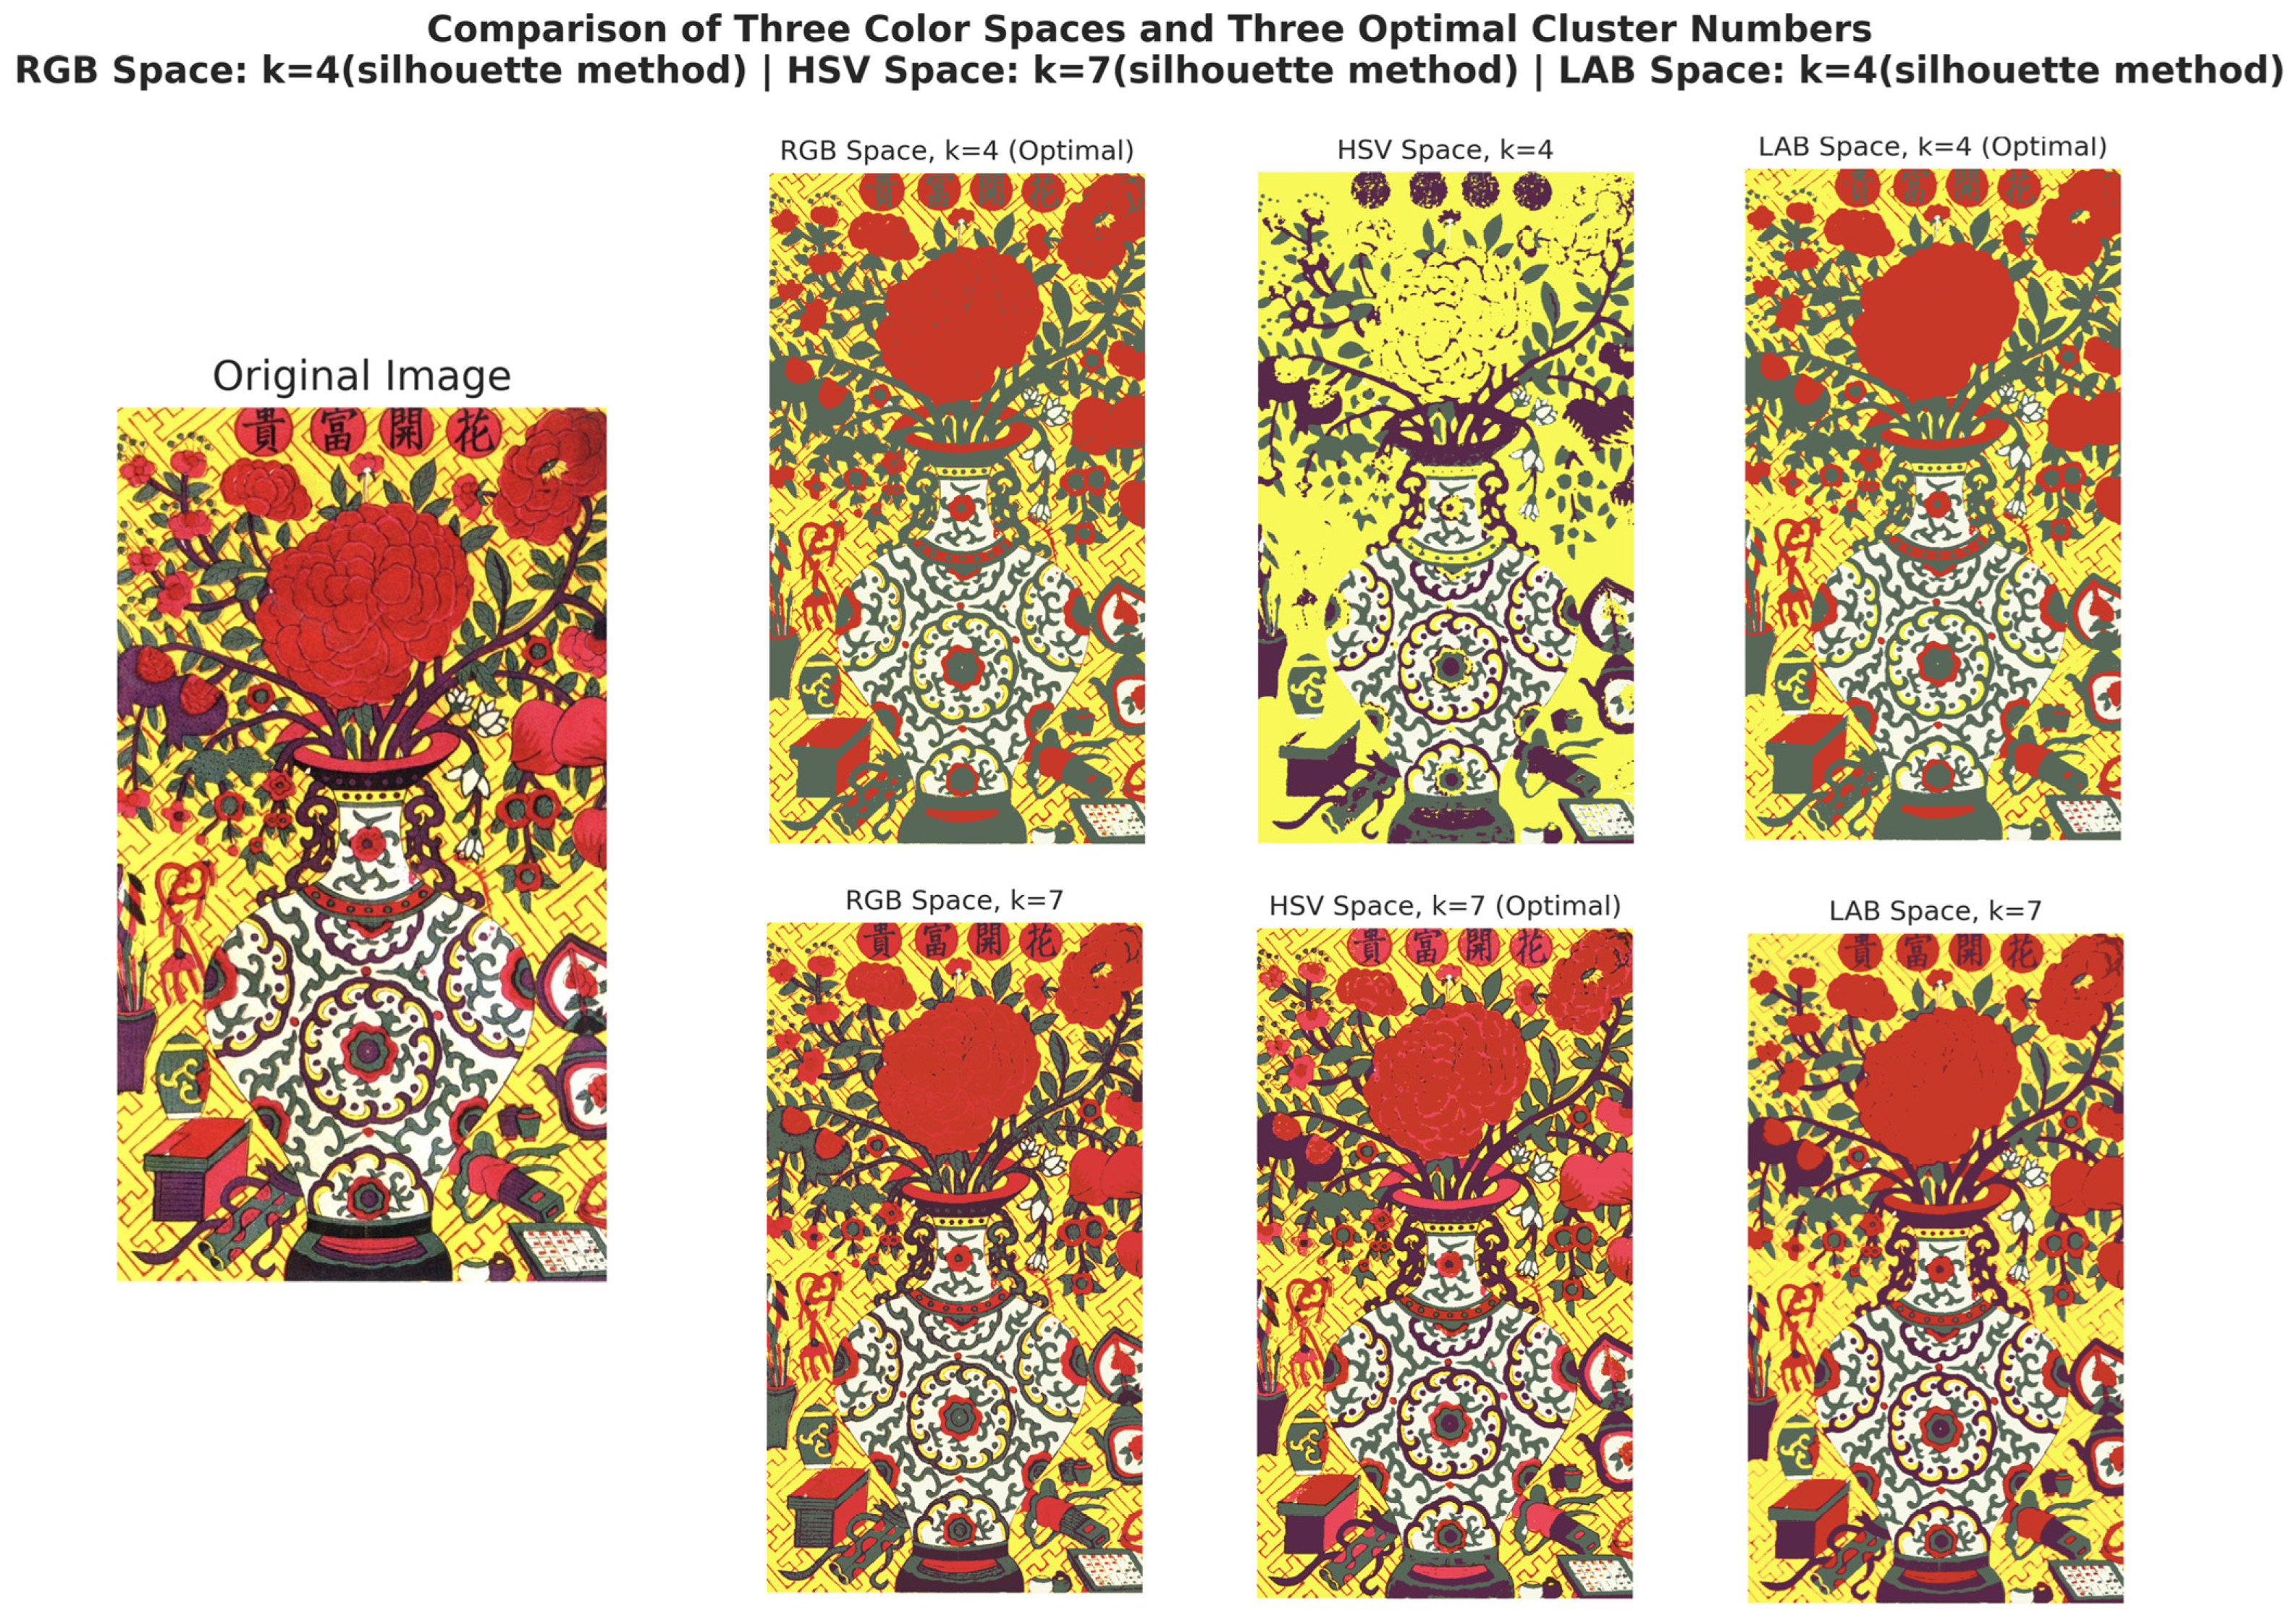
The layer separation results of representative sample images obtained using this method are shown in
Figure 6.
In practical applications, the clustering performance of three color spaces (RGB, HSV, and CIELAB) was compared through simultaneous experiments, and the results were used to determine the entire technical process.
2.3.4. Image Segmentation of TWNY Prints Based on the Cyclic U-Net Model
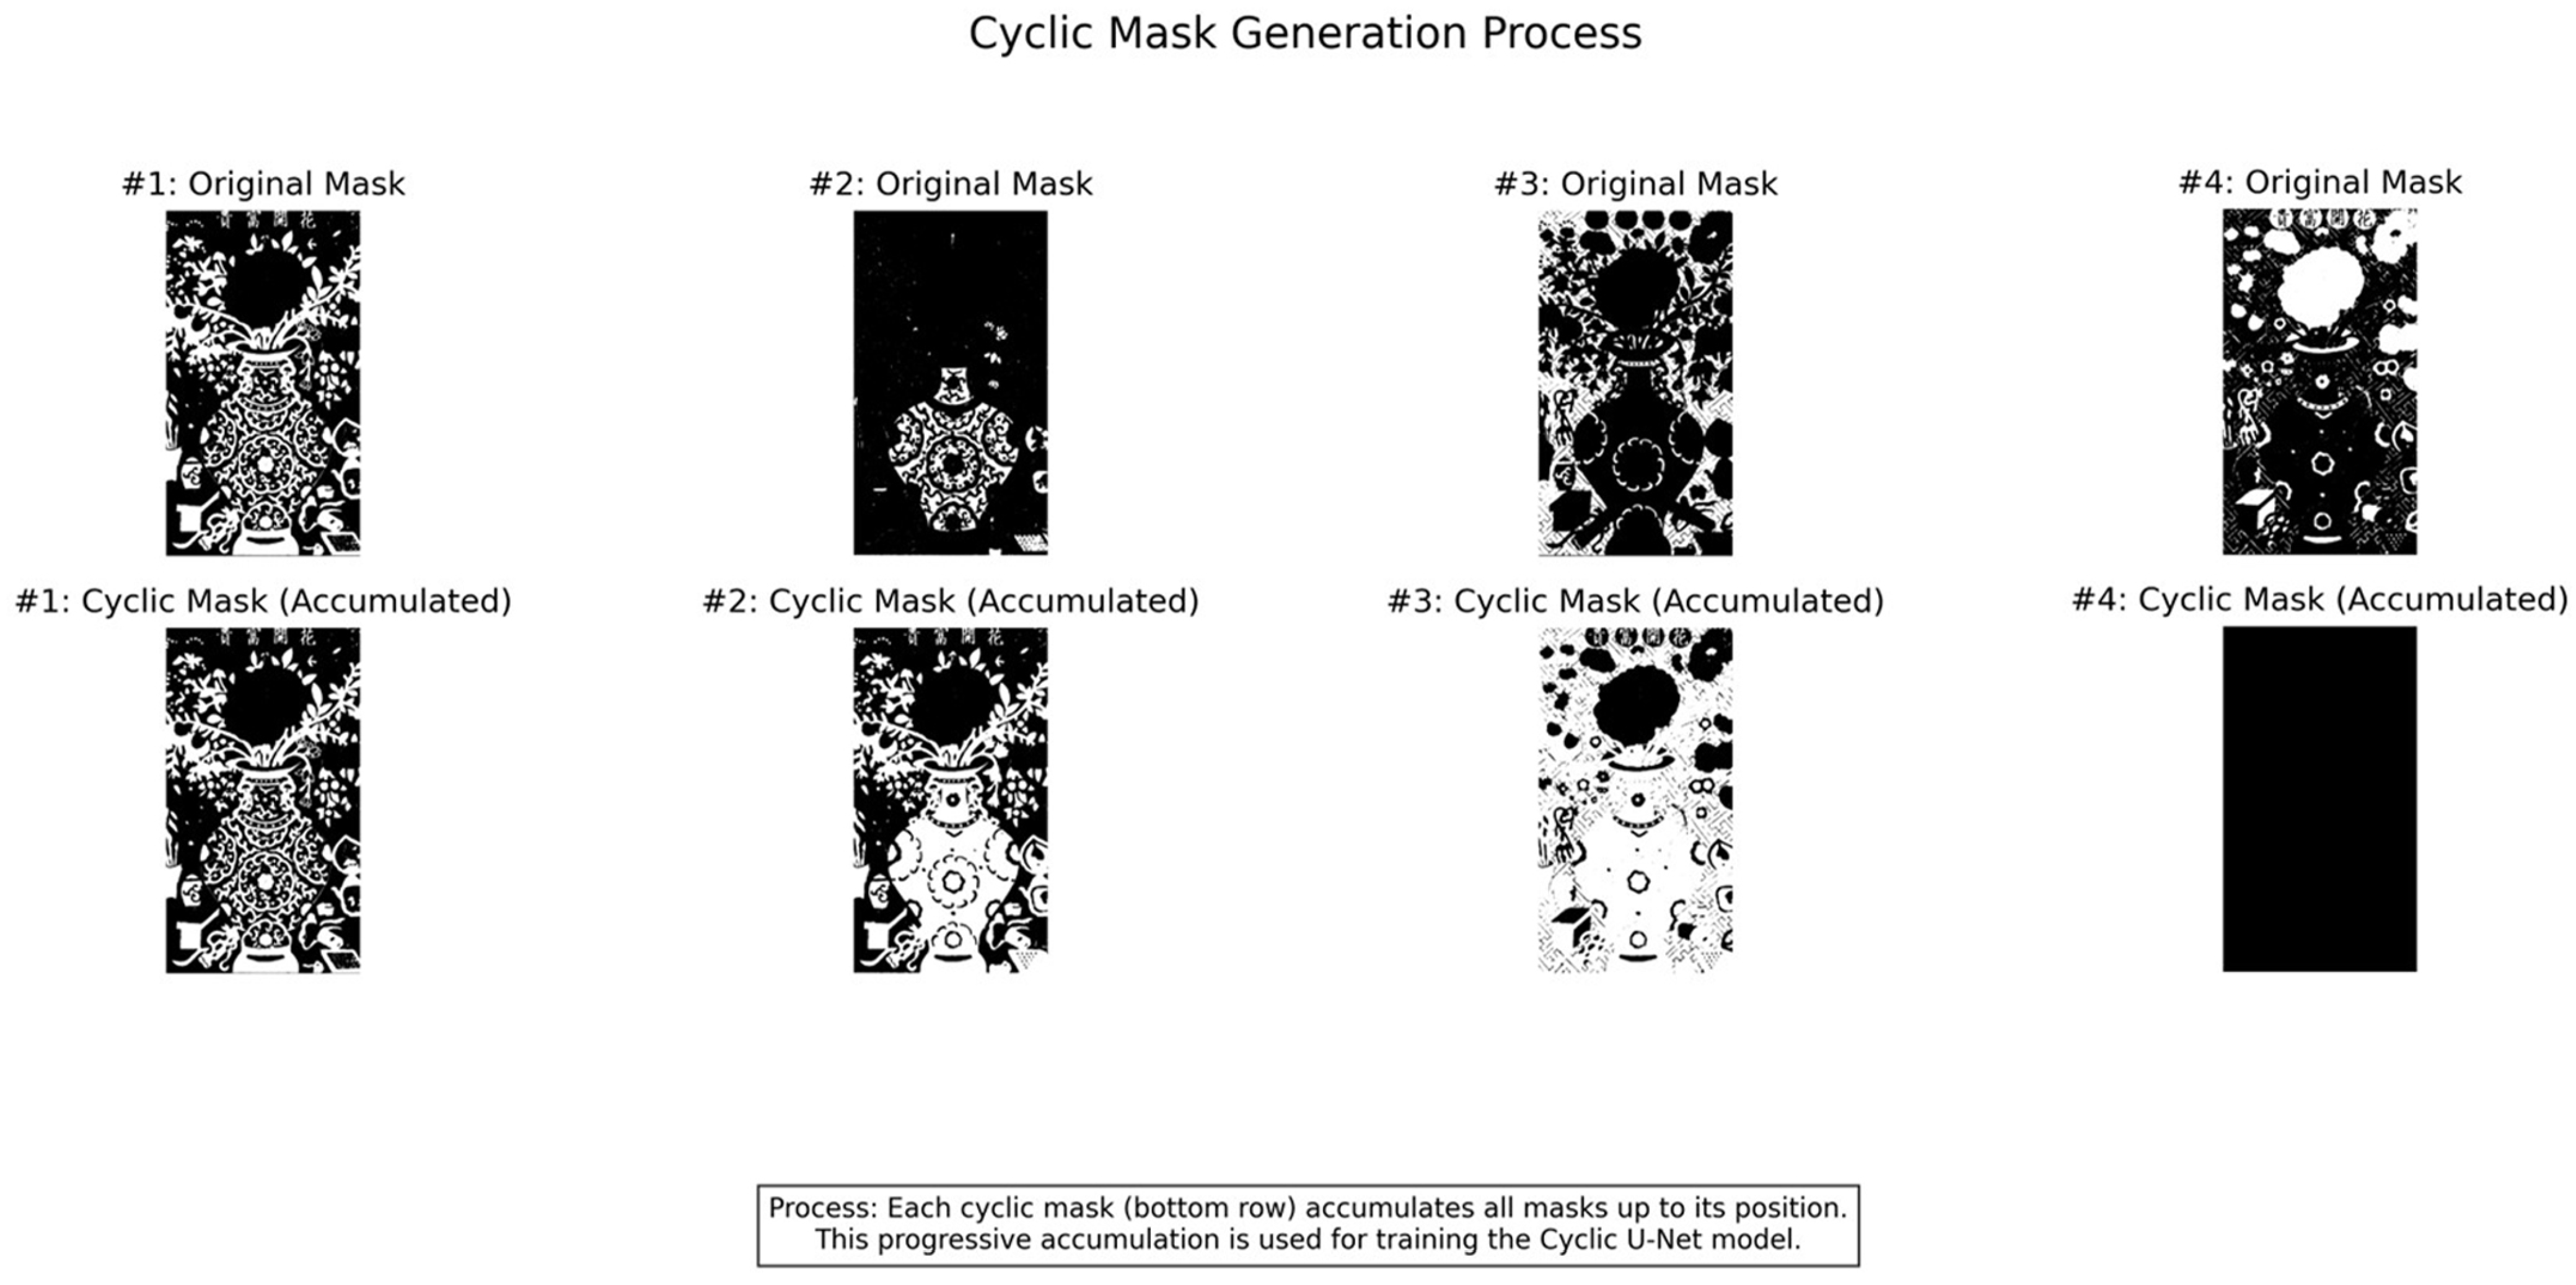
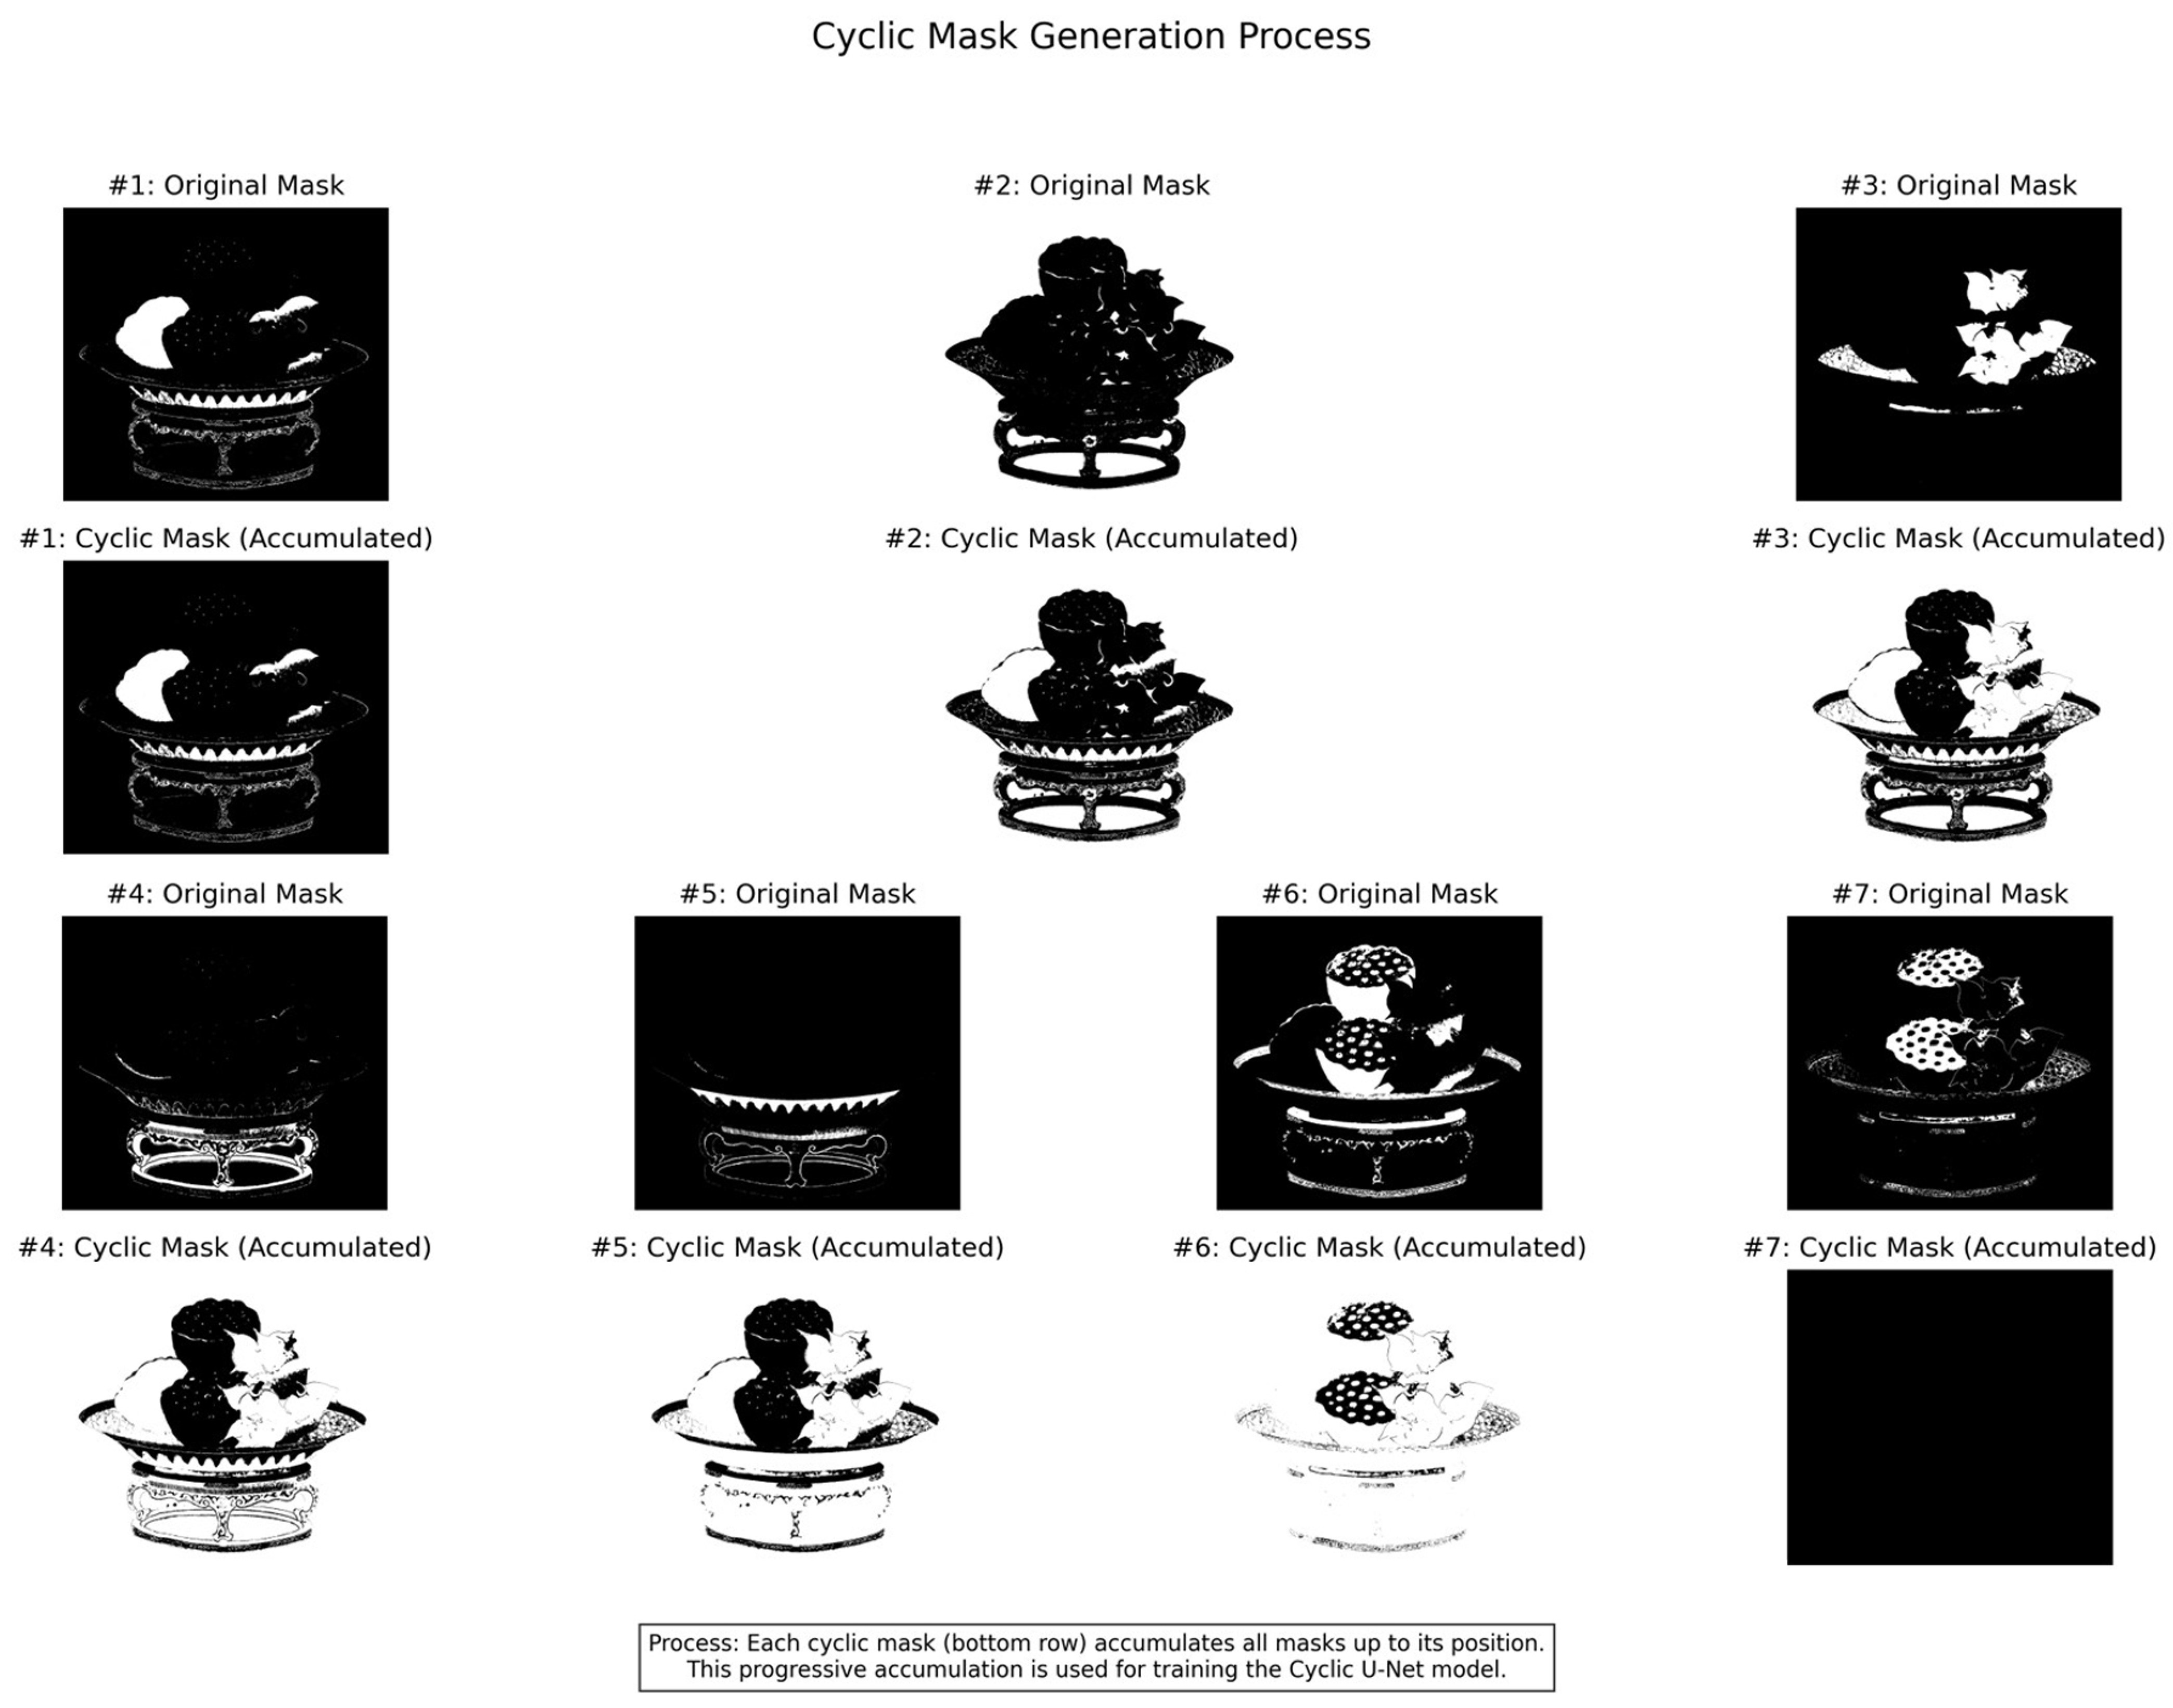
To simplify the overall workflow and reduce the time required for layer separation, training of a Cyclic U-Net model was conducted to perform automated layer extraction for TWNY Prints. The process begins with systematic mask segmentation of the prints, where binary masks are generated for each individual color layer within every print. Subsequently, these layer-wise masks are sequentially merged to create an accumulated mask dataset tailored for Cyclic U-Net training.
The Cyclic U-Net model adopts the classical U-Net architecture but is specifically designed for progressive, layer-by-layer color plate extraction. The input to the network consists of a four-channel dataset (RGB image plus the cumulative extracted layer mask), while the output is a single-channel binary mask representing the next layer to be extracted.
Structurally, the model comprises an encoder–decoder framework. The encoder contains four downsampling stages, each consisting of two 3 × 3 convolutional layers followed by max-pooling, progressively increasing the number of feature channels (64 → 128 → 256 → 512) while halving the spatial resolution. The decoder uses transposed convolutions for upsampling and integrates skip connections from corresponding encoder stages to preserve spatial details. Each convolutional block is equipped with batch normalization and ReLU activation functions, with dropout layers applied in deeper stages to mitigate overfitting.
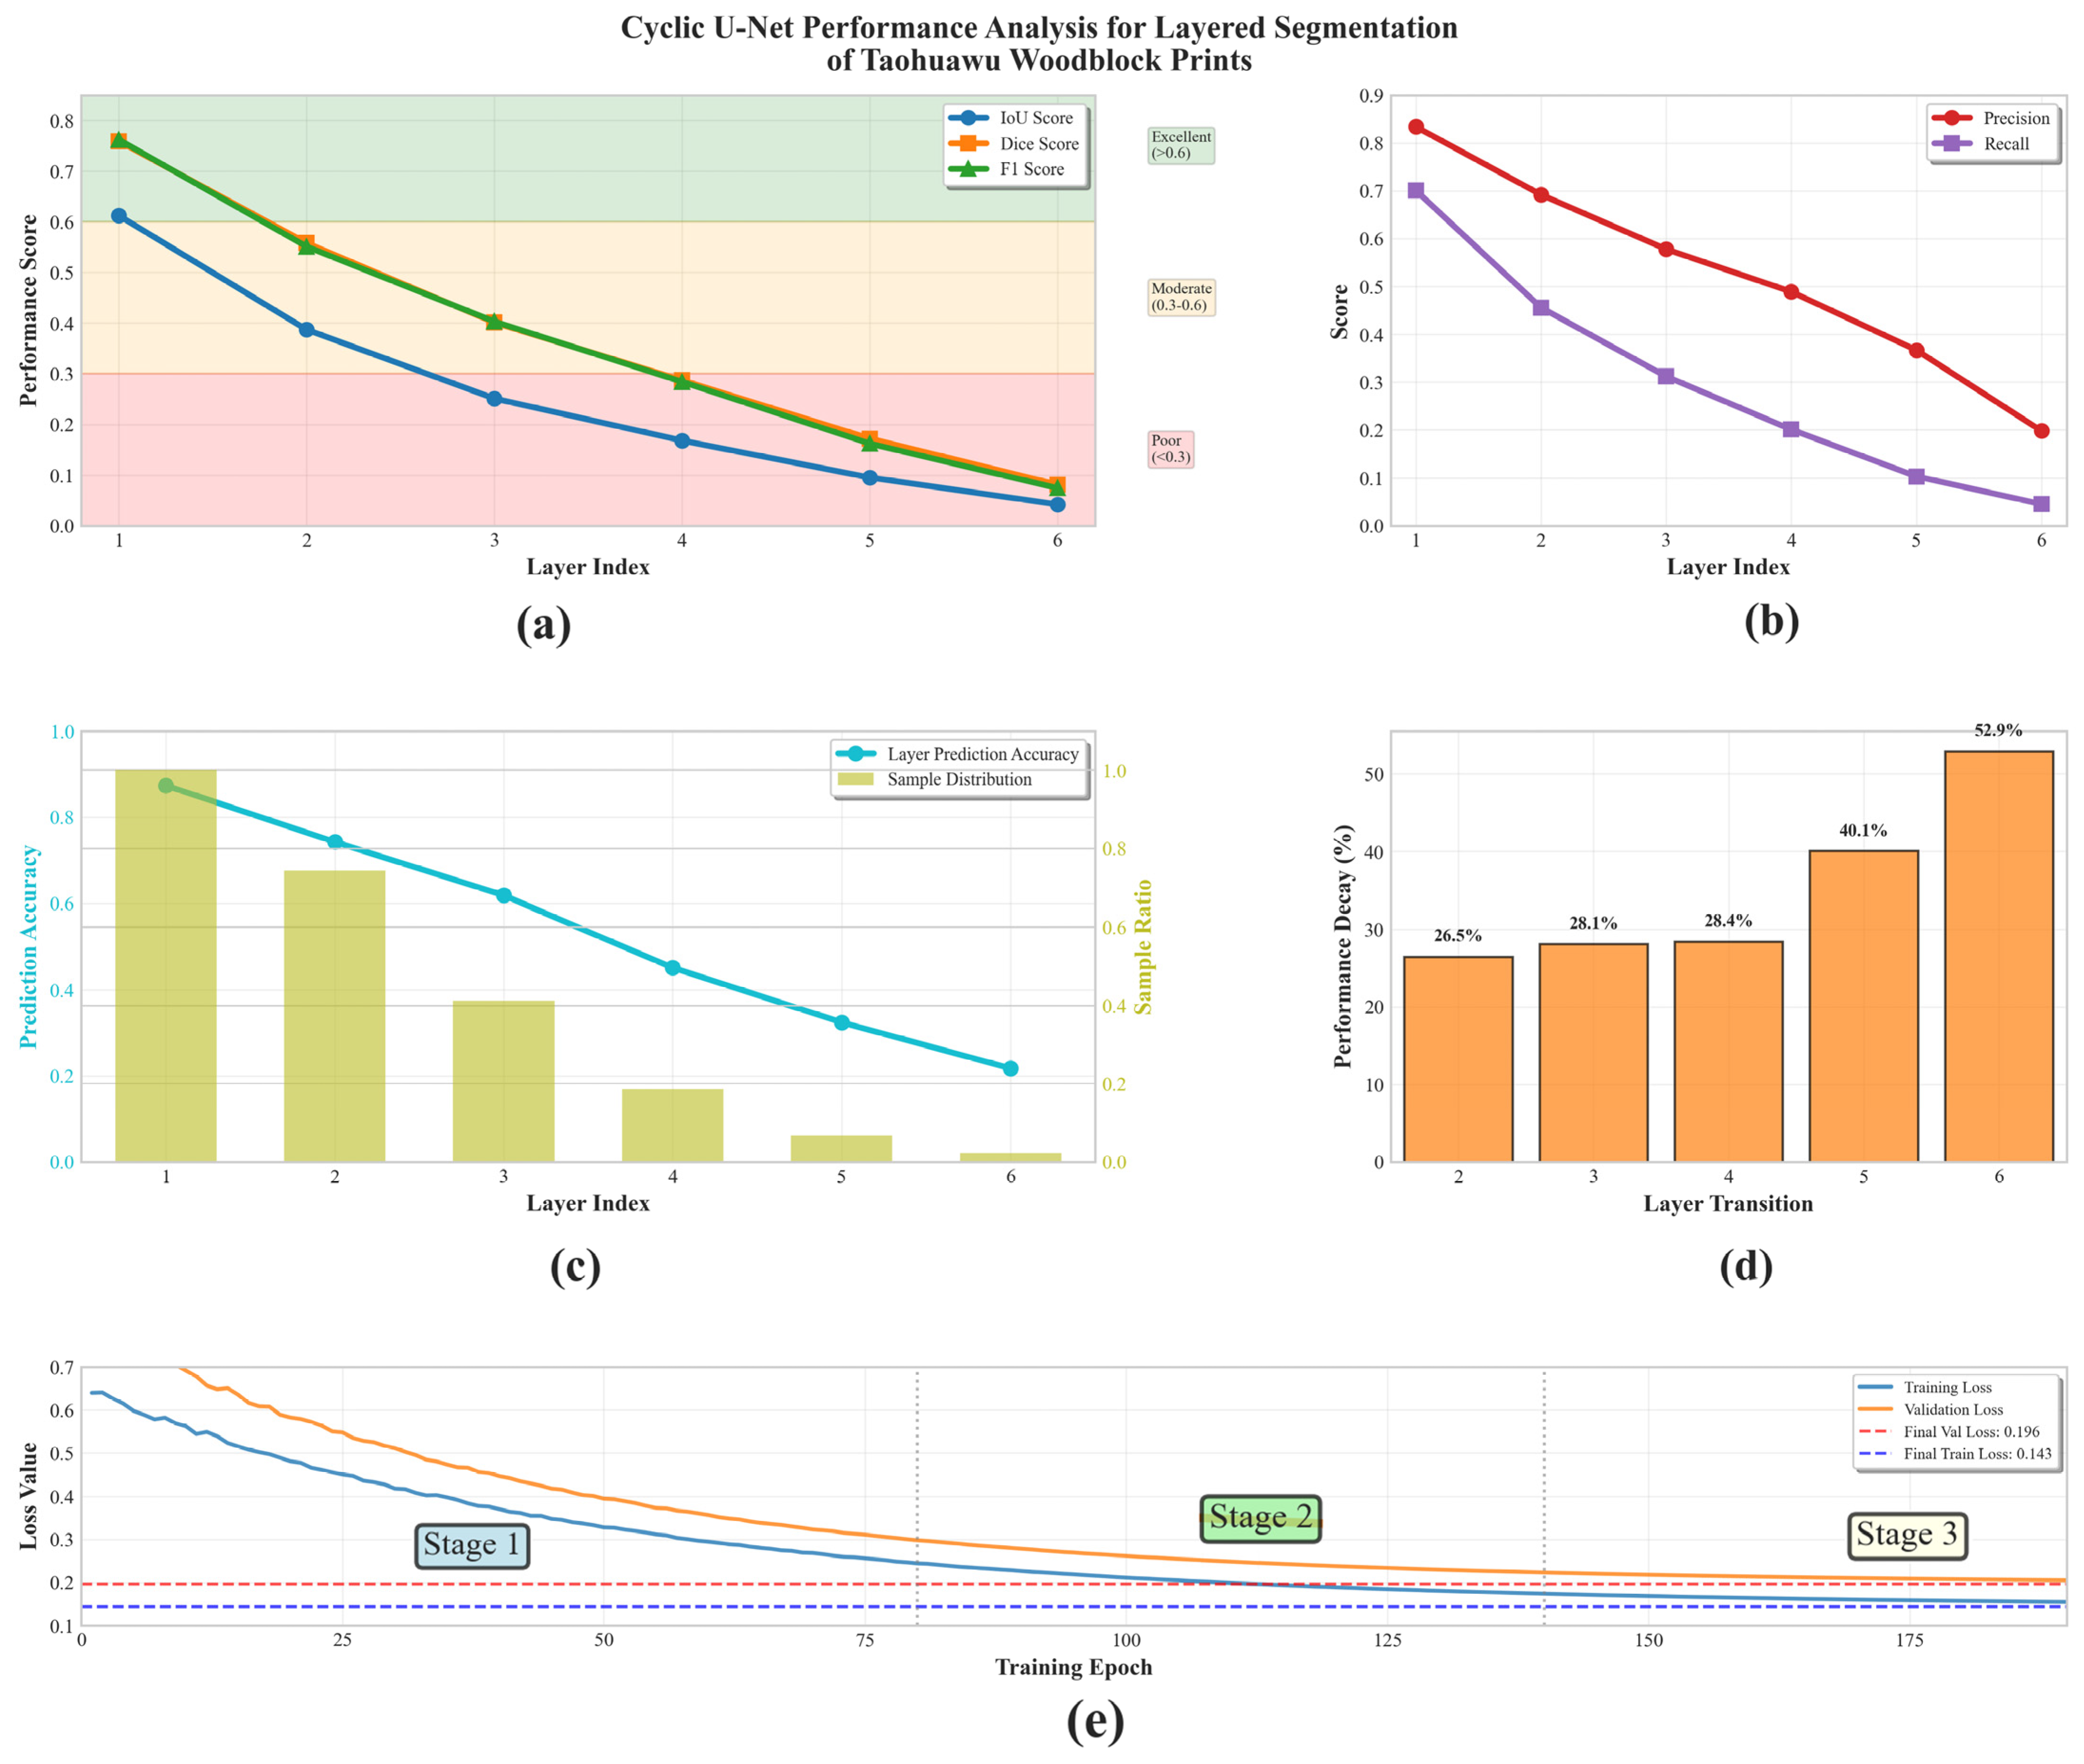
To ensure the reproducibility of our experimental setup, the Cyclic U-Net was trained using a progressive training strategy. The network employed an encoder depth of five layers with decoder channel configuration [512, 256, 128, 64, 32], with attention mechanisms enabled and a dropout rate of 0.3. The AdamW optimizer was used with a weight decay of 1 × 10⁻⁵, and the learning rate was gradually reduced from 1 × 10⁻³ to 1 × 10⁻⁴ during progressive training, dynamically adjusted via a CosineAnnealingWarmRestarts scheduler. A decreasing batch size strategy was adopted, starting from 4 in the initial stage and reducing to 1 in the final stage, over a total of 190 training epochs (split into three phases: 80 + 60 + 50).
Data augmentation was customized for TWNY Prints, including ±15° rotation, translation and scaling within a 0.1 range, brightness adjustment in the range [0.8, 1.2], horizontal flipping, Gaussian noise with a strength of 0.02, and elastic deformation. Vertical flipping was disabled to preserve the directional characteristics of the prints. Gradient clipping (maximum norm = 1.0) and early stopping were applied to ensure training stability and prevent overfitting.
The Cyclic U-Net operates in a recursive extraction manner: the initial input consists of the original image combined with an empty mask, yielding the binary mask for the first color layer. In subsequent iterations, the input is updated by combining the original image with the accumulated extracted masks, allowing the model to predict the next color layer.
To ensure the quality and continuity of the extracted color layers, multiple validation mechanisms are incorporated, including confidence thresholding, area proportion filtering, and clustering-based evaluation. This recursive design enables a single model to handle the extraction of an arbitrary number of color layers, significantly simplifying the traditional layer separation process, which often requires repeated manual parameter tuning and training of multiple models.
Further improvements are achieved through clustering optimization in the CIELAB color space and morphological post-processing, including edge contour preservation and connected region merging, which enhance mask precision and ensure accurate boundary separation between different printing color plates.
This end-to-end automated layer separation approach greatly improves the efficiency and accuracy of the digital processing workflow for TWNY Prints.
Figure 7 and
Figure 8 demonstrate the iterative mask extraction process applied to representative sample images.
2.4. Computational Resources and Runtime Efficiency
This study’s computational resource and runtime efficiency tests were conducted in the following hardware environment: a single NVIDIA RTX 4090 GPU (24 GB VRAM), a 12-core Intel Xeon Platinum 8352V processor (2.10 GHz), 90 GB system memory, running Ubuntu 20.04, with PyTorch 2.0.0 and CUDA 11.8 acceleration.
Performance testing under this hardware configuration showed that the K-means++ algorithm processed 512 × 512 resolution images in an average of 1.8 ± 0.3 ms, whereas the full Cyclic U-Net pipeline required 127 ± 15 ms end-to-end. K-means++ was thus approximately 67 times faster than Cyclic U-Net. Specifically, the Cyclic U-Net’s processing time was distributed as follows: encoder forward pass–23 ms, six-stage cyclic decoding–89 ms, and output generation–15 ms, with peak GPU memory usage of 19.2 GB. In contrast, K-means++ clustering optimization required only 0.8 GB VRAM, achieving a throughput of 526 images/s over a 1000-image test set, compared to 7.8 images/s for Cyclic U-Net.
Despite the speed advantage of K-means++, when used jointly with Cyclic U-Net in practical applications, the extra time cost of K-means++ accounted for only 1.4% of the overall pipeline, exerting minimal impact on total runtime while significantly improving segmentation boundary precision and continuity. This demonstrates that the hybrid architecture achieves superior segmentation quality without sacrificing computational efficiency.
