Abstract
The emergence of the Internet of Things (IoT) has brought about a significant technological shift, coupled with the rise of intelligent computing. IoT integrates various digital and analogue devices with the Internet, enabling advanced communication between devices and humans.The pervasive adoption of IoT has transformed urban infrastructures into interconnected smart cities. Here, we propose a framework that mathematically models and automates power consumption management for IoT devices in smart city environments ranging from residential buildings to healthcare settings. The proposed framework utilises set theoretic association-rule mining and combines unsupervised preprocessing with frequent-item set mining and iterative numerical optimisation to reduce non-critical energy consumption. Readings are first converted into binary transaction matrices; then a modified Apriori algorithm is applied to extract high-confidence usage patterns and association rules. Dimensionality reduction techniques compress these transaction profiles, while the Gauss–Seidel method computes control set points that balance energy efficiency. The resulting rule set is deployed through a web portal that provides real-time device status, remote actuation, and automated billing. These associative rules generate predictive control functions, optimise the response of the framework, and prepare the framework for future events. A web portal is introduced that enables remote control of IoT devices and facilitates power usage monitoring, as well as automated billing.
1. Introduction
The Internet of Things (IoT) has evolved from a collection of networked gadgets into a pervasive cyber-physical fabric that underpins today’s smart city infrastructures [1,2]. IoT is defined as the integration of diverse digital and analogue devices with the Internet, such as smartphones, personal digital assistants, computers, and tablets. This integration enables advanced modes of communication among devices and between devices and humans [3]. The fundamental goal of IoT is the efficient and intelligent connectivity and monitoring of physical devices or objects in our environment [4,5]. By extending Internet Protocol (IP) connectivity to sensors, actuators, and embedded controllers, IoT enables continuous machine–to-machine and machine-to-human communication across domains as diverse as transport, industry, and public health [6,7,8,9,10,11].
In high-density urban centres, however, the very scale of connected devices introduces new challenges—most notably, the need to manage aggregate power demand without compromising service quality. This issue is particularly acute in hospitals, where life-critical equipment must remain fully operational even as administrators seek to curtail non-essential energy use [10,12,13,14]. The concept of smart cities underscores this potential and has been attracting interest from diverse socioeconomic groups globally [13,15]. The research community is focused on enhancing IoT technology to improve its effectiveness and reliability [2,9,12,16,17,18,19]. Intelligent algorithms play a crucial role in efficiently managing IoT-based devices and improving their effectiveness and reliability [15,20,21,22]. Existing work on smart hospital energy management typically falls into two streams. The first focuses on device-level metering and manual scheduling, offering fine-grained insights but limited automation [23,24]. The second employs machine learning classifiers for demand prediction, yet often requires labelled data and overlooks the combinatorial patterns that arise when devices operate in concert [25,26]. These gaps motivate a data-driven approach that operates in an unsupervised manner and captures frequent multi-device usage patterns. To address these requirements, this study proposes a framework based on set theory to optimise the power consumption of healthcare-related devices in a smart city, aiming to enhance both efficiency and reliability in managing and supervising energy use. This study introduces a set theoretic framework that unifies four methodological pillars: (1) Unsupervised preprocessing by using raw sensor streams from IoT devices is discretised into a binary transaction profile, enabling downstream pattern discovery without prior labelling. (2) Frequent-item-set mining by using a modified Apriori algorithm extracts high-confidence usage patterns and association rules that characterise typical device co-activation scenarios. (3) Iterative numerical optimisation using a Gauss–Seidel scheme refines control set points to reconcile energy efficiency objectives with clinical constraints. (4) Dimensionality reduction techniques such as Principal Component Analysis (PCA) and Independent Component Analysis (ICA) further compress transaction profiles.
The primary objective of this framework is to enhance the efficiency and reliability of health data collection and supervision. Furthermore, a web portal has been developed based on the proposed framework to facilitate reliable remote supervision and management of IoT-embedded devices at sites from any worldwide location. The portal accurately tracks and optimises power consumption, enabling automatic billings. Furthermore, it allows the classification of frequently used IoT devices at the site based on their usage period.
The rest of the paper is organised as follows: The Section 2 explores the most recent state-of-the-art literature in the optimisation of IoT device usage and the background of the algorithms employed in the proposed framework. Section 3 and Section 4 describe the methodology of this study, the architecture and functionality of the proposed framework, and Section 5 and Section 6 discuss the application of the proposed framework in a healthcare setting with evaluated results. Finally, Section 7 concludes the paper.
2. Background
2.1. Related Work
The authors of a recent article [27] proposed an energy-efficient autonomous smart home application that integrates the power of big data and cloud computing to provide comprehensive monitoring for seniors. This innovative multimedia-based supervisor empowers elderly individuals to oversee a range of energy-efficient systems, control smart home devices through gestures, receive timely alerts about device status changes, and share multimedia information with a specific group. Additionally, an autonomous switch-on/off management device has been developed, utilising speech or gestures to conserve energy. The successful recognition and utilisation of speech-based keywords as control signals highlight the potential for widespread adoption of this architecture, as demonstrated by empirical results.
Recent research [28] studied the latest sustainable energy management practices and thermal processes. It explores AI techniques for improving energy efficiency in smart building settings by analysing various AI models to gain insight into energy consumption patterns. It also discussed the challenges and benefits of integrating these technologies with advanced AI methods in energy management systems. A recent paper [29] explored data-driven building management systems focusing on energy management practices. It studied and demonstrated that the integration of IoT and AI technologies for monitoring and controlling smart buildings supports and improves the efficiency of energy management systems, especially in reducing energy consumption. The paper briefly discussed the use of modern technologies, such as blockchain, to further enhance the efficiency of smart building management systems.
The work in [30] introduced a smart home health monitoring system designed to analyse patients’ blood pressure and glucose readings within the comfort of their homes, promptly notifying healthcare providers when any anomalies are detected. The approach combined conditional decision-making and machine learning techniques to predict the status of hypertension and diabetes separately. The primary objective is to forecast hypertension and diabetes statuses by leveraging patients’ glucose and blood pressure readings. Employing supervised machine learning classification algorithms, the system is trained to predict a patient’s diabetes and hypertension statuses accurately.
A recent study [31] proposed a smart home method with moderate security and minimal development costs in the context of the Internet of Things. This procedure, on the other hand, only examines a sequential approach, which is incapable of handling congestion caused by a high number of devices. Another study [32] examined power usage and conservation in homes, combining IoT devices into a single line. They used an image processing method to detect human functions in this breakthrough. Image processing, on the other hand, takes longer to pick the desired devices. Another study, based on Wi-Fi and GSM technologies, is being conducted simultaneously. The goal of this project is to gather data from sensors and operate equipment based on that data [33]. Despite the fact that various types of studies are being conducted elsewhere, there is still room for development in the home automation system utilising IoT.
The authors of [34] place a greater focus on customer-centric techniques to make the system more scalable and have provided an architecture for an IoT-based last-meter smart grid based on this method. Their design offers four significant benefits, the first of which is seamless integration with smart home apps via a smart grid connection. Second, communication protocols are used to gather and analyse the detected data. Furthermore, only authorised individuals have access to the system. The technology also enables mapping sensors and actuators to the layer of abstraction, which simplifies interaction with non-technical users. The experiment is based on a ZigBee network that connects to an IoT server and communicates with it via a gateway that converts packets from ZigBee to IP gateway. On the other hand, the work in [35] addressed the resource allocation problem for edge computing in healthcare systems that handle large datasets.
Traditional patient data within the healthcare sector were conventionally archived in paper format, incurring substantial expenses and operational inefficiencies. Embracing big data technology presents a superior approach for collecting, preserving, and scrutinising patient information in a digital format. This transformation holds the potential to curtail expenses and enhance the overall effectiveness of healthcare delivery [36]. Recent advancements in the healthcare sector consistently demonstrate that integrating various technologies holds the promise of strengthening healthcare services and aiding healthcare professionals in the effective and efficient delivery of healthcare solutions [37].
A latest study [38] provides a comprehensive review of intelligent IoT-based embedded healthcare systems, exploring the benefits for physicians and patients. It suggests research directions and emphasises the importance of modern safety infrastructure for IoT in healthcare, benefiting governments, health experts, and clinicians. Accordingly, a recent publication [39] developed a framework using multimodal data to classify Alzheimer’s disease, employing graph neural networks for knowledge graph creation and region-based convolutional neural networks for image-to-knowledge graph generation. A study [40] addressed the need for visual representations and efficient navigation of scholarly articles to visualise unstructured data and facilitate insight into dementia risk factors. The model enabled automated knowledge extraction, storage, and visual exploration, showcasing promising results for knowledge discovery in dementia research. Additionally, another study [41] discussed Poland’s healthcare digital transformation and emphasised patient engagement through digital social innovation solutions based on Big Data Analytics (BDA). It identifies BDA’s potential role in developing social innovations in healthcare, providing insights into future research and practical implications for health policy and wearable device manufacturers.
This proposed framework integrates an advanced algorithm for remote monitoring of IoT devices in a healthcare setting by analysing different health parameters, which represents a significant advancement in IoT-based healthcare services. Existing studies focus on energy efficiency, gesture-based control, or monitoring of other health conditions; this proposed framework offers a solution for real-time event management or emergency preparation through systematic data organisation of healthcare IoT devices. Additionally, the combination of our framework and the web portal we have developed for remote supervision, power consumption tracking, and automated billing presents a unique blend of healthcare monitoring and operational efficiency. The Apriori algorithm is based on mathematical set theory and a well-established mathematical method for learning and generating association rules from massive datasets. Association rules are IF–THE statements that aid in the discovery of links between unrelated data in relational databases, as well as other types of data and characteristics. The Apriori method is a relatively advanced preference selection strategy that focuses on frequently occurring item sets and is subsequently combined with association rules. The different types of data items with their preferred properties or attributes are correlated here using the association rules [42].
In mathematical terms, let represent a collection of binary characteristics known as the item set, and a set of transactions known as the dataset. T includes a subset of items from B, and each transaction has its own transaction ID. As a result, a rule is defined as an implication of the type , where and . The antecedent and consequent of the rules are the sets of objects X and Y, respectively. A simple mathematical notation may be used to specify an association rule, which can be defined mathematically as
where X and Y are two distinct item sets, S is the support, and C is the confidence. The support count refers to the frequency of rules within the data categorisation, where X and Y are two separate item sets, S represents support, and C represents confidence. Support is counted at several data levels, such as high and low values. A high number implies that the rule has the most influence on the dataset. At the same time, a low value suggests that the rule is of lesser relevance in the creation of association rules and can be represented as
The variable C, which represents confidence, is used for the percentage of transactions in the rule generation and is executed in Algorithm 1. Algorithm 1 is augmented with explanatory comments to illustrate its application in this study, specifically for the minimum support algorithm. Confidence is mathematically given as
These support and confidence equations guide the decision-making process for generating association rules and controlling IoT devices. The thresholds for applying the rule are analysed by the mathematical attributes of the Apriori algorithm.
| Algorithm 1 Apriori Algorithm for Minimum Support |
procedure Input: : Candidate item set of size k //set of electronic device. Output: : frequent item set of size k //electronic device in candidate item set. Initialise: • ; // initialise set of frequencies items • REPEAT • //generates a new candidate REPEAT • // transaction in T, database subgroups of electronic device • do begin // this function generates candidates in transaction // for all candidates • do begin //determine support • end // new set • end UNTIL , UNTIL , OUTPUT END end procedure |
2.2. Principal Component Analysis for Smart Digital Devices
The Principal Component Analysis (PCA) algorithm is a linear algebra-based method used to reduce the complexity of a dataset. This is achieved by performing covariance matrix analysis on the different variables of the dataset. It is intended to address large multidimensional datasets on string sequences [1,2,3] and to identify mapping and formatting digital devices. It constructs linear combinations of the digital devices [4]. The PCA extracts do not change the number of extracted data points from the observed one, but instead reduce the dimensionality of the matrix. For example, measuring 1000 IoT devices for 100 rooms will require a matrix of measurements as depicted in Figure 1. This will be an matrix that can be formulated as follows:
where P defines the combination of digital against every room in our study.
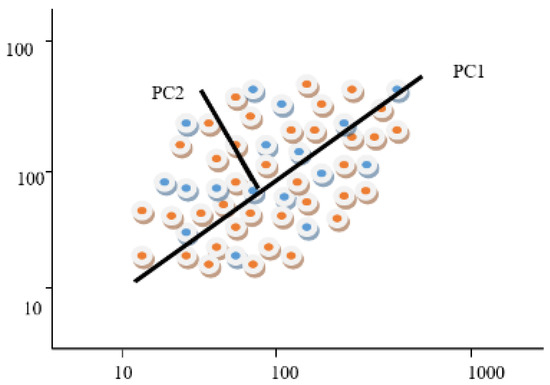
Figure 1.
Mapping of 100 × 1000 measurements PCs in the two-dimensional space.
The eigenvectors represent the repeated factors in the case of a multidimensional dataset, which are called the principal components and eigenvalues, which are calculated as follows:
where are the eigenvectors with the corresponding eigenvalues . According to PCA, digital devices can be represented by Gaussian signals. Singular value decomposition (SVD) is a mathematical technique closely related to PCA, which factorises a matrix into smaller matrices. It can be applied alternatively to the data of digital devices. Assume a matrix A of p rows and q columns; thus, the SVD for the large string digital data is as follows:
where M is an matrix that contains left singular vector elements and is an matrix that contains correct singular vector elements. P is a nonzero value on the diagonal and is called a singular value.
2.3. Independent Component Analysis
A statistical and computational method named Independent Component Analysis (ICA) finds statistically ‘independent’ and ‘non-Gaussian’ components of the multivariate data to separate a multivariate signal into additive, independent components. Information theory is primarily used for data reduction, noise reduction, and pattern recognition. Finding new components that are mutually independent and minimise the dependence between the elements is the primary goal of ICA. This entropy theory-based method is used to obtain a linear representation of non-Gaussian data to obtain independent components.
ICA finds a linear that is a linear transformation [43]. If m random variables are observed, they can be represented as linear combinations by the following mathematical equation:
where is a vector of m random variables that are observed; represents n random variables, where every is a set of independent components (ICs); and finally, is the unknown coefficients. Using the matrix form, Equation (4) can be written as below:
where a and s are the sets of their transpose and P is the matrix for . The observations can be modelled using the independent component matrix S as
MacKay [44] proposed an ensemble learning ICA approach for easier decomposition, as follows:
where i refers to an input given as original variables, m is the enumerating samples, K represents the Gaussian noise, and t is the latent variable. Here, K provides the reconstruction error for any particular E and F, which is given by the following equation:
According to the reconstruction error, the data power of latent variables is given by the following equation:
Generally, the digital devices’ sequences represent a room of the total rooms of the hospital as a mixture of independent analytical processes. Every process forms a vector that shows the proper shapes of the devices. Mathematically, it represents a linear combination of n digital devices, as given by Equation (4), which is represented in matrix form in Equation (5) above. Thus, Equation (5) for our proposed framework can be written as
It can be observed that all digital devices are represented as , where a cell is governed by n independent device processes , where each of the vectors represents k device levels. ICA works with a vast amount of data, along with reducing facilities, but Pushdown Automata (PDA) bring a new advantage by freeing memory space. It builds as a stack performing push-pop function.
2.4. Pushdown Automaton
Pushdown Automata (PDA) combine formal language theory and automata theory with a stack-based computational model to free frequently used memory space. There are three main components in PDA, namely, the input tape, the control unit, and the infinite size of the stacks [45]. After completing the control unit process, in the case of matching into the anchor, the count unit’s activity appears. It counts the matches of the anchor with the input dataset and remembers the number of matches it returns as the value of the seeds. However, if a mismatch occurs, then it has nothing to count and does not return any seed value. Thus, the control unit removes the symbol from the dataset using finite state control, thereby freeing memory.
2.5. Gauss–Seidel
The Gauss–Seidel method is a numerical method applied to a matrix with nonzero elements to solve a linear system with n equations and unknown variables. It is also known as a successive approximation method as it uses iterative techniques of numerical linear algebra. Other comparable methods to the Gauss–Seidel method that can iteratively adjust model parameters, such as Bayesian inference techniques and Markov chain Monte Carlo (MCMC) methods. Both techniques progressively improve their estimates and align with observed data. However, this study utilises the Gauss–Seidel method because it provides a straightforward, efficient approach for solving linear systems without the need for complex and computationally intensive sampling techniques [46]. Following the application of the Gauss–Seidel method, the current study employs the Apriori algorithm to ascertain frequent item sets within the transaction dataset. This algorithm, as shown in Algorithm 2, systematically structures and identifies frequent items by mining the dataset individually. The presentation of Algorithm 2 is enhanced by mapping each step to our proposed framework, elucidating the relevance of the algorithm to this study.
| Algorithm 2 Algorithm for mining the dataset |
procedure Input: : Candidate set items m of size n, and initial guess Output: g: // REPEAT • // transaction in T, database subgroups of electronic device • // transaction in T, database subgroups of electronic device • // transaction in T, database subgroups of electronic device •if then // • endif // new set • endfor • endfor UNTIL , OUTPUT g END end procedure |
3. Methodology
In this study, the case study utilised the cases of digital devices in Square Hospital, a renowned institution for its exceptional healthcare services in Bangladesh, as an example of IoT devices in a healthcare setting. Five datasets were collected from the hospital for this study. Only data about the device in each room were used in this study, and no patient data were included. Our research methodology involves applying the proposed framework across five datasets, labelled D0, D1, D2, D3, and D4. We will assume that there are several rooms (R1, R2, …, Rn) with several digital devices, such as an Air Conditioner (A), a Light (L), a Fan (F), and a Television (T). If the digital elements are presented in the sample, then we map them to 1; otherwise, 0. This will convert the attributes into binary flags. Table 1 shows a possible configuration.

Table 1.
Device sequence and mapping in four hospital rooms.
Figure 2 [47] is based on the taxonomy of the IT-related parts of the healthcare system. This taxonomy will help understand and simplify the complexity of the healthcare system design, implementation, maintenance, and use. It depicts a detailed, hierarchical structure for data management for staff and patient services, infrastructure or business management, and branches extending to various categories, such as data management or warehouse, application integration, security, and analysis, representing specific processes. The proposed framework is based on this taxonomy.
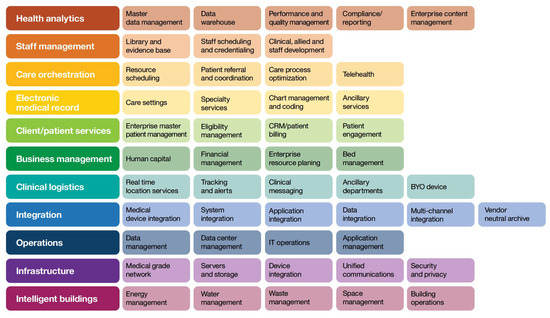
Figure 2.
Taxonomy of the IT-related components of the healthcare system [47].
4. Proposed Framework for Power Optimisation in Healthcare Devices
Based on a comprehensive understanding of IT devices within healthcare systems, we introduce a robust supervisory framework designed to streamline data mining processes. Leveraging the recursive Gauss–Seidel method, our framework integrates the mathematical set theory-based Apriori algorithm to identify frequent device sets within the transactional dataset systematically. This algorithm meticulously extracts frequent items from datasets, enabling users to manage digital devices flexibly in healthcare settings. It facilitates remote oversight and control of multiple smart devices, offering real-time updates on equipment status.
Our framework encapsulates a meticulous data mining process tailored to pinpoint frequent device sets and generate association rules from datasets. Our proposed framework is visually represented in Figure 3, providing a comprehensive illustration of its functionality and workflow.
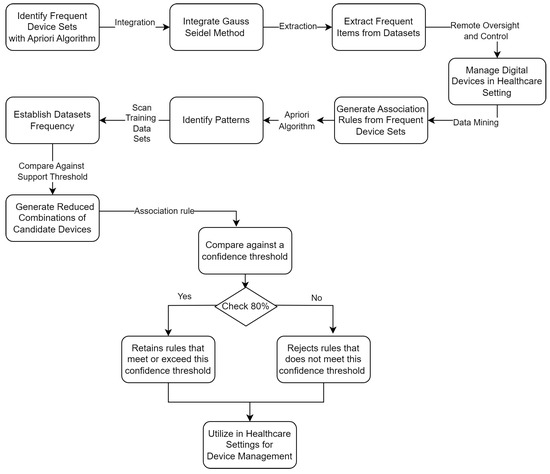
Figure 3.
Proposed framework for power optimisation in healthcare devices.
Primarily associated with the Apriori algorithm, this process is pivotal for identifying patterns within extensive datasets efficiently. Initially, the framework scans the training dataset (D) to tally occurrences of each candidate device, thereby establishing their frequency. Subsequently, it compares the support count (SC) of each device against a predefined threshold, termed the minimum support, to identify ‘frequent’ devices.
Following this initial scan, the framework derives an initial set of candidate devices (C) and a set of frequent device sets (L) based on this comparison against the minimum support threshold. Utilising the frequent device sets from L, the framework generates reduced combinations or pairs of candidate devices, subsequently scanning the dataset (D) to determine their support counts. This process results in modified frequent device sets, now representing pairs or combinations of items. Iteration of this process continues until no new frequent device sets can be generated. Figure 4 illustrates the graphical formation of PCA for digital device formation for every 10 devices’ formation.
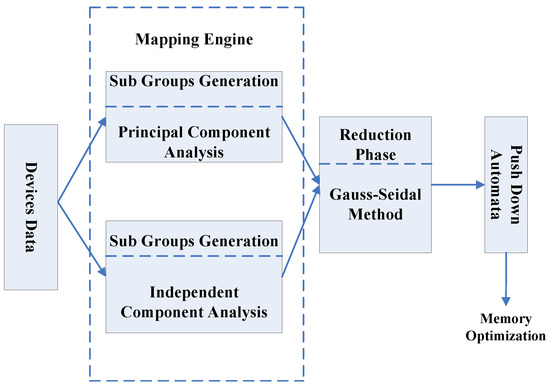
Figure 4.
Principal Component Analysis for digital device formatting.
Once frequent device sets (e.g., in L3) are identified, the framework proceeds to generate association rules. These rules are derived from device sets by evaluating all nonempty subsets against a confidence threshold, typically set at 80%. The PCA for digital device formatting to generate association rules is shown in Figure 5. Mainly, there are two stacks: the input tape and the stack. The required dataset from the digital devices is stored on the stack table. The control unit assesses whether a match is taking place and subsequently dispatches the symbols that correspond to either a game or a mismatch. This method conserves memory by creating available memory space, as illustrated in Figure 5.
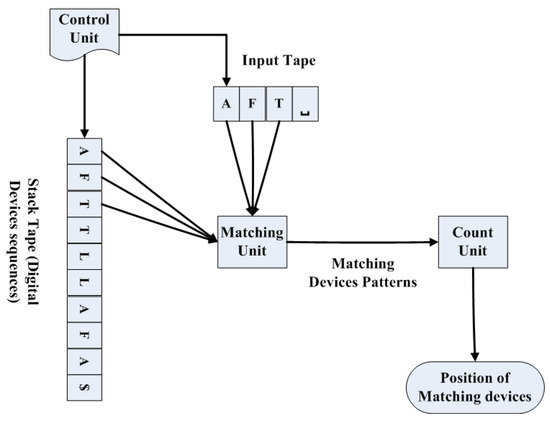
Figure 5.
Digital device readings to generate association rules.
The framework selectively retains rules that meet or exceed this confidence threshold while rejecting others. This innovative framework demonstrates how specific device combinations undergo rigorous evaluation based on support count and subsequent rule generation, assessed according to confidence levels. The application of this framework is exemplified through a real-world case study in hospital data, demonstrating its practical utility and effectiveness in healthcare settings, which is detailed in the next section.
5. Case Study: IoT-Based Power Optimisation in Healthcare
This section presents a comprehensive application of the proposed framework, accompanied by a detailed case study tailored to a healthcare setting. This application demonstrates the effectiveness and versatility, highlighting the potential benefits of the proposed framework.
5.1. Proposed Framework for Dataset D0
In the first step, we scan the dataset D0 to count each candidate, and then perform a comparison between the support count (SC) and the minimum possible support. Thus, and are generated as shown in Figure 6. From , two frequent patterns of devices, , are generated. Then, scan the dataset D to obtain the support count, . After obtaining and , generate ; then classify the different digital device classes. indicates a classification group that satisfies our considerable support count. Now, apply the association rule considering the desired confidence value.
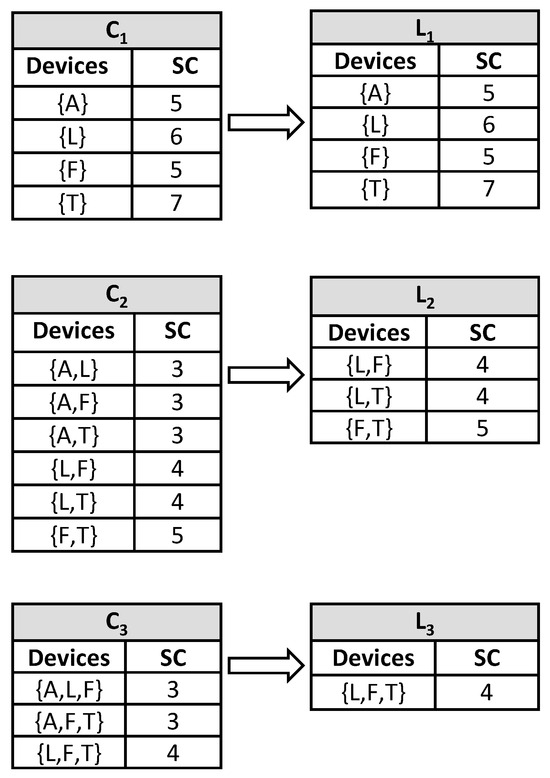
Figure 6.
Reducing set of items using support count and minimum support for dataset D0.
Next, we generate the association rules for frequent item sets from . For every item set of , all nonempty subsets of frequent item sets are generated. Consider ; then its all nonempty subsets are . Consider that the minimum confidence threshold is 80%. The resulting association rules are as follows in Table 2:

Table 2.
Successive iterations for Dataset D0 (where bold entries indicate rules meeting the 80% minimum confidence threshold and thus selected).
As a result, the flags of dataset D0 are presented in Table 1, which in turn can be modelled using the following set of equations:
which can be simplified into
Next, we applied the Gauss–Seidel method on the above set of equations to obtain the following successive iterations, as illustrated in the following Table 3:

Table 3.
Association rules confidence for D0.
5.2. Proposed Framework for Dataset D1
For dataset D1 with segmented data, the following samples will be generated, as shown in Table 4:

Table 4.
Devices sequence and mapping for dataset D1.
In the next step, we scan the dataset D1 to count each candidate and then compare. Thus, and are generated. From , two frequent patterns of sequence, , are generated. Then scan the dataset, D1, to obtain the support count, . After obtaining and , the minimum support is generated, and then the different digital device classes are classified. indicates a classification group that satisfies our considerable support count. Now, apply the association rule considering the desirable confidence value. Figure 7 shows these steps.
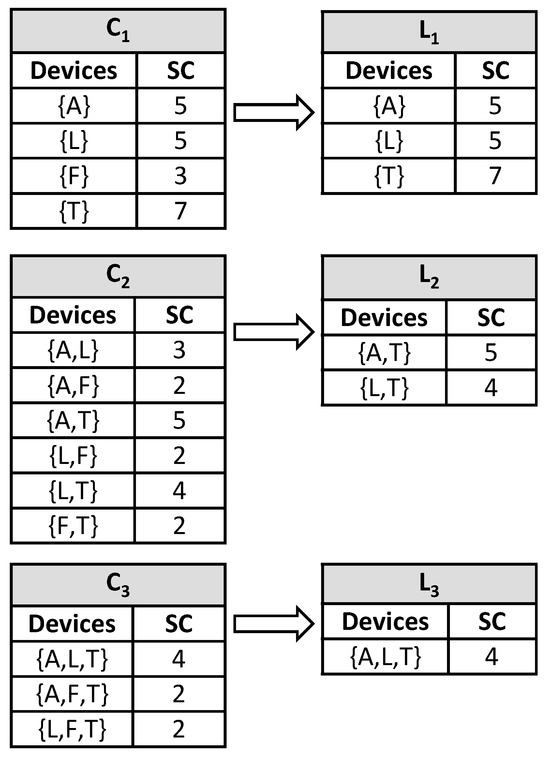
Figure 7.
Reducing set of items using support count and minimum support for D1.
indicates one classification group that satisfies our considerable support count. Next, we apply the association rule considering the desired confidence value. The association rules are generated for frequent item sets from . For every item set of , all nonempty subsets of frequent item sets are generated. Consider N = A, L, T; then all its nonempty subsets are {A}, {L}, {T}, {A,L}, {L,T}, {A,T}. Consider that the minimum confidence threshold is 80%. The resulting association rules are shown in the following Table 5:

Table 5.
Successive iterations for D1 (where bold entries indicate rules meeting the 80% minimum confidence threshold and thus selected).
As a result, the flags of dataset D1, which are presented in Table 4, can be modelled using the following set of equations:
which can be simplified into
Next, the Gauss–Seidel method is applied to the above set of equations to obtain the following successive iterations, as illustrated in the following Table 6:

Table 6.
Association rules confidence for D1.
5.3. Proposed Framework for Dataset D2
For dataset D2, the segmented data are generated in a manner similar to that in Table 7. Support count is also generated using the same method above, as demonstrated in Figure 8 below:

Table 7.
Devices sequence and mapping for dataset D2.
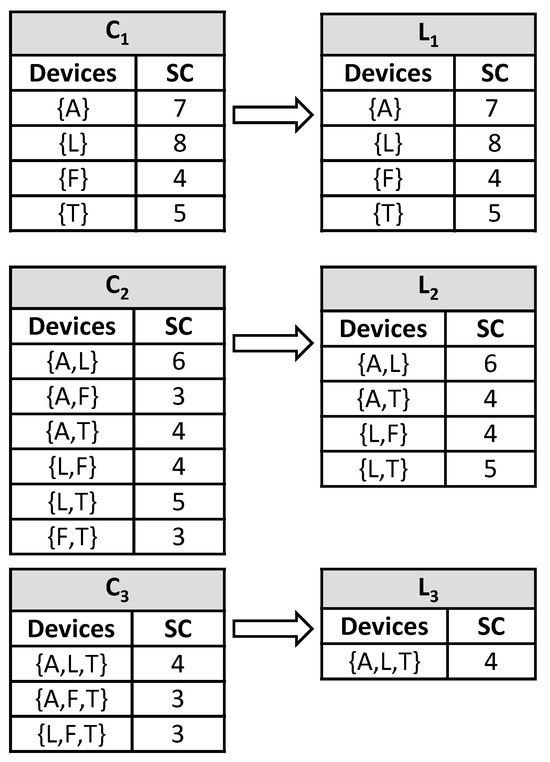
Figure 8.
Reducing the set of items using support count and minimum support for D2.
Then, an association rule is applied on the nonempty subsets—{A}, {L}, {T}, {A,L}, {L,T}, {A,T}—considering a minimum confidence threshold of 80%, which results in the association rules shown in Table 8 below:

Table 8.
Successive iterations for D2 (where bold entries indicate rules meeting the 80% minimum confidence threshold and thus selected).
The flags of dataset D2, which are presented in Table 7, can be modelled similarly using the following set of equations:
which can be simplified into
Next, the Gauss–Seidel method is applied to the above set of equations to obtain the following successive iterations, as illustrated in the following Table 9:

Table 9.
Association rules confidence for D2.
5.4. Proposed Framework for Dataset D3
For dataset D3, the segmented data are generated similarly to those in Table 10. The support count is also generated using the same method as above, as demonstrated in Figure 9 below. The association rule is applied on the nonempty subsets— {A}, {L}, {F}, {T}, {A,L}, {A,F}, {L,T}, {L,F}, {A,T}, {A,L,F}, {A,F,T}, {L,F,T}, {A,L,T}—considering a minimum confidence threshold of 80%, which results in the association rules shown in Table 11.

Table 10.
Devices sequence and mapping for dataset D3.
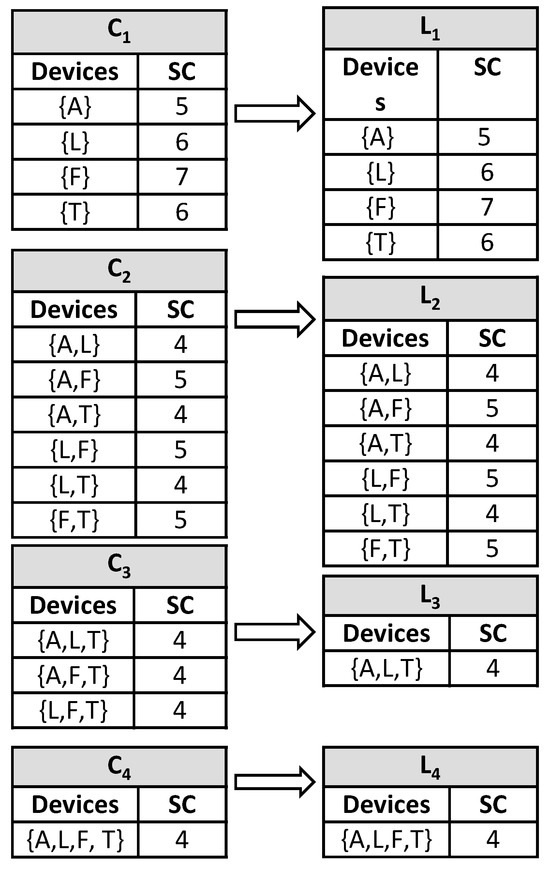
Figure 9.
Reducing the set of items using support count and minimum support for D3.

Table 11.
Successive iterations for D3 (where bold entries indicate rules meeting the 80% minimum confidence threshold and thus selected).
Next, the Gauss–Seidel method is applied to the above set of equations to obtain the successive iterations, as illustrated in Table 12.
which can be simplified into

Table 12.
Association rules confidence for D3.
5.5. Proposed Framework for Dataset D4
For dataset D4, the segmented data are generated similarly to those in Table 13. The support count is also generated using the same method as above, as demonstrated in Figure 10 below. The association rules are applied with a minimum confidence threshold of 80%, which results in the association rules shown in Table 14 below.
which can be simplified into
Next, the Gauss–Seidel method is applied to the above set of equations in order to obtain the successive iterations, as illustrated in the following Table 15:

Table 13.
Devices sequence and mapping for dataset D4.
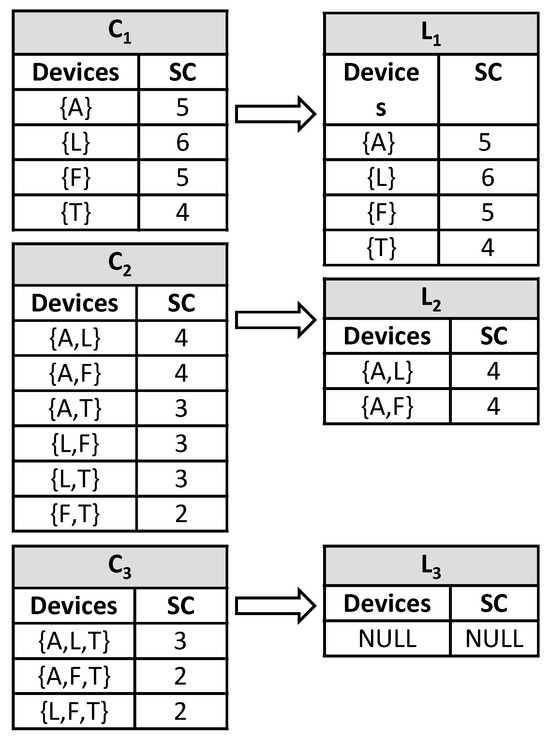
Figure 10.
Reducing set of items using support count and minimum support for D4.

Table 14.
Successive iterations for D4 (where bold entries indicate rules meeting the 80% minimum confidence threshold and thus selected).

Table 15.
Association rules confidence for D4.
6. Result and Discussion
Based on the previous findings, it is evident that the Gauss–Seidel method iteratively simulates the datasets of digital devices utilised in Square Hospital, enabling the identification of common segments. These device sequences represent the most prevalent device patterns. The iterative simulation using Gauss–Seidel on training digital data ensures the acquisition of the desired device sequences. The utilisation of association rules facilitates the automation of data handling in both new testing and training datasets. These rules are generated to address future datasets and issues. PCA and ICA play a crucial role in mapping the entire digital device segments. According to the analysis conducted, ICA demonstrates superior performance compared with PCA. For evaluating results, unsupervised learning has been considered for handling a large number of digital devices in the hospital, and the evaluation criterion is time in nanoseconds. Table 16 shows the results of the PCA and ICA before and after using PDA. The first column of the table reflects the data size of random digital devices for the system. Datasets have been collected from a modernly equipped large hospital (Square Hospital, Bangladesh), and all the devices used are correctly addressed. Moreover, our proposed framework can handle a random number of datasets. The first table depicts the impact before the application of the PDA approach.

Table 16.
Time comparisons between PCA and ICA before applying PDA.
Table 16 shows that, before applying PDA to the data samples, the data take 1276 ns using PCA, whereas it takes 734 ns using ICA. Consequently, ICA needs less time than PCA to generate the result for these data. Similarly, ICA takes 899 ns, which is 475 ns less than PCA for the second data size. The third data point in Table 3 shows a difference of 656 ns. Moreover, the differences of PCA and ICA for the exact data sizes are 961, 1689, 2198, 2922, 3500, 6423, 8277, 10,150, and so on. When checking for large datasets, the differences are increasing. PCA consumes more time than ICA.
According to Table 17, the first data take 598 ns for PCA, whereas ICA takes 545 ns after attaching the PDA. Hence, ICA requires around 9% less time than PCA. Similarly, for the second dataset, ICA requires around 8% less time than PCA. The differences in execution time between the two algorithms indicate that ICA is more efficient.

Table 17.
Time comparisons between PCA and ICA after applying PDA.
The proposed framework boasts several notable advantages. First, it offers a user-friendly interface centred around a dataset that simplifies the task of turning home automation devices on or off. With a straightforward click, users can easily control various devices, ensuring convenience and ease of use. Additionally, the system is highly scalable, thanks to the use of a scale-based indicator that can accommodate a range of devices, including the regulation of fan speeds. This adaptability ensures that the system can effectively cater to the diverse needs of users.
In addition, the proposed framework can provide necessary data acquisition tools to collect, aggregate, and analyse relevant information. Users can access monitored devices based on the data received and analysed, empowering them to make informed choices to handle and respond to critical situations. Moreover, the framework’s performance leverages the enhanced association rules generated by the Apriori algorithm. These rules enable the system to adapt effectively to various scenarios and environments, ensuring optimal functionality. In addition to its core functionalities, the proposed framework is practically adaptable to support emergencies, particularly in small cities where healthcare infrastructure may be limited and power infrastructure less resilient. By extending the rule-based prioritisation, the proposed framework can continuously monitor the power consumption patterns of critical medical devices or equipment for any anomalies, such as ventilators or emergency lights. The framework can trigger an alert or invoke predefined emergency protocols, which may include prioritising the power delivery if a deviation from regular use is identified. The incoming critical health device data streams are converted into binary vectors and reduced using PCA/ICA; support values from association rules assign priority weights, and an event-driven controller recomputes Gauss–Seidel power balancing under emergency constraints to shed non-essential loads while prioritising supply to life-critical device circuits. The modular nature of the framework enables the continuous operation of crucial support devices while shedding non-essential loads, providing a resource-efficient solution for small municipalities with restricted infrastructure resources.
Hence, the proposed supervisory smart hospital system presents a reliable solution for collecting and analysing big data in the health domain, with several features that provide users with an easy-to-use system while maintaining control over data. Figure 11 is a snapshot of the prototype of the web portal dashboard, which demonstrates how aggregate energy consumption can be monitored and individual IoT-enabled devices can be controlled directly within a room. The central panel displays the total energy usage for a room, while the device control card lists each device, such as the Air Conditioner, Light, Fan, and Television, with on/off toggles. This demonstrates that our proposed framework not only tracks power consumption in real-time but also enables users to remotely control medical and support equipment.
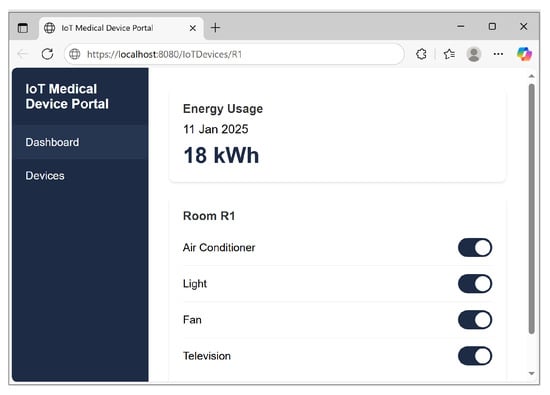
Figure 11.
Snapshot of web portal.
7. Conclusions and Future Work
In conclusion, this paper presents a comprehensive framework for exploring mathematical methods to automate and monitor power consumption optimisation and health data collection from electronic devices in a healthcare setting. Using mathematical algorithms such as the Apriori algorithm, PCA, ICA, and the Gauss–Seidel method, the proposed framework efficiently organises sensor data from devices to perform dynamic analysis and predictions, thereby enhancing the efficiency and reliability of supervising and managing health data. The proposed framework enables the collection, aggregation, and analysis of data for users within different hospital settings, utilising a combination of mathematical theory-based algorithms. This framework provides accessible features to enable monitoring various health parameters, generating necessary health alerts, and storing and sharing health data when necessary. For example, in healthcare settings of a small city, the adaptive framework and the rule-based controls can be configured to prioritise critical medical equipment during emergencies.
In the future, our research will focus on several key areas to further enhance the capabilities of IoT-enabled healthcare systems. First, we plan to conduct an extended evaluation of the framework’s performance through a comprehensive simulation model that considers a broader range of parameters. This will provide deeper insights into the framework’s efficiency and areas for improvement. In parallel, we plan to extend the framework to include advanced emergency management capabilities. For example, we will explore the integration of machine learning (ML) algorithms with real-time data analysis to enhance the accuracy of decision-making processes. ML techniques offer the potential to identify hidden patterns and gain data insights, enabling more precise predictions of healthcare events and emergency preparations. Lastly, we aim to explore and integrate additional algorithms based on modern mathematical theory into the framework further to enhance the processing and optimisation of data records. It will improve the performance of the proposed framework in monitoring and responding to health-related issues in smart healthcare settings. Therefore, the framework will contribute to the development of more intelligent, efficient, and reliable healthcare IoT devices.
Author Contributions
Conceptualization, S.P.; Methodology, K.F.; Writing—original draft, S.P.; Writing—review & editing, K.F. All authors have read and agreed to the published version of the manuscript.
Funding
This research received no external funding.
Institutional Review Board Statement
Not applicable.
Informed Consent Statement
Not applicable.
Data Availability Statement
The original contributions presented in this study are included in the article. Further inquiries can be directed to the corresponding author.
Acknowledgments
The authors express their sincere gratitude to Amjad Gawanmeh for his insightful contributions and support, which significantly improved the quality of this research.
Conflicts of Interest
The authors declare no conflicts of interest.
References
- Zeadally, S.; Siddiqui, F.; Baig, Z.; Ibrahim, A. Smart healthcare: Challenges and potential solutions using internet of things (IoT) and big data analytics. PSU Res. Rev. 2020, 4, 149–168. [Google Scholar] [CrossRef]
- Banerjee, A.; Chakraborty, C.; Kumar, A.; Biswas, D. Emerging trends in IoT and big data analytics for biomedical and health care technologies. In Handbook of Data Science Approaches for Biomedical Engineering; Academic Press: Cambridge, MA, USA, 2020; pp. 121–152. [Google Scholar]
- Yar, H.; Imran, A.S.; Khan, Z.A.; Sajjad, M.; Kastrati, Z. Towards smart home automation using IoT-enabled edge-computing paradigm. Sensors 2021, 21, 4932. [Google Scholar] [CrossRef] [PubMed]
- Kopetz, H.; Steiner, W. Internet of things. In Real-Time Systems: Design Principles for Distributed Embedded Applications; Springer: Berlin/Heidelberg, Germany, 2022; pp. 325–341. [Google Scholar]
- Ciampi, M.; Sicuranza, M.; Silvestri, S. A privacy-preserving and standard-based architecture for secondary use of clinical data. Information 2022, 13, 87. [Google Scholar] [CrossRef]
- Al-Fuqaha, A.; Guizani, M.; Mohammadi, M.; Aledhari, M.; Ayyash, M. Internet of things: A survey on enabling technologies, protocols, and applications. IEEE Commun. Surv. Tutor. 2015, 17, 2347–2376. [Google Scholar] [CrossRef]
- Silva, B.M.; Rodrigues, J.J.; de la Torre Díez, I.; López-Coronado, M.; Saleem, K. Mobile-health: A review of current state in 2015. J. Biomed. Inform. 2015, 56, 265–272. [Google Scholar] [CrossRef]
- Kelly, J.T.; Campbell, K.L.; Gong, E.; Scuffham, P. The Internet of Things: Impact and implications for health care delivery. J. Med. Internet Res. 2020, 22, e20135. [Google Scholar] [CrossRef]
- Philip, N.Y.; Rodrigues, J.J.; Wang, H.; Fong, S.J.; Chen, J. Internet of Things for in-home health monitoring systems: Current advances, challenges and future directions. IEEE J. Sel. Areas Commun. 2021, 39, 300–310. [Google Scholar] [CrossRef]
- Qadri, Y.A.; Nauman, A.; Zikria, Y.B.; Vasilakos, A.V.; Kim, S.W. The future of healthcare internet of things: A survey of emerging technologies. IEEE Commun. Surv. Tutor. 2020, 22, 1121–1167. [Google Scholar] [CrossRef]
- Pivoto, D.G.; de Almeida, L.F.; da Rosa Righi, R.; Rodrigues, J.J.; Lugli, A.B.; Alberti, A.M. Cyber-physical systems architectures for industrial internet of things applications in Industry 4.0: A literature review. J. Manuf. Syst. 2021, 58, 176–192. [Google Scholar] [CrossRef]
- Alshehri, F.; Muhammad, G. A comprehensive survey of the Internet of Things (IoT) and AI-based smart healthcare. IEEE Access 2020, 9, 3660–3678. [Google Scholar] [CrossRef]
- Saleem, K.; Shahzad, B.; Orgun, M.A.; Al-Muhtadi, J.; Rodrigues, J.J.; Zakariah, M. Design and deployment challenges in immersive and wearable technologies. Behav. Inf. Technol. 2017, 36, 687–698. [Google Scholar] [CrossRef]
- Ford, E.; Tyler, R.; Johnston, N.; Spencer-Hughes, V.; Evans, G.; Elsom, J.; Madzvamuse, A.; Clay, J.; Gilchrist, K.; Rees-Roberts, M. Challenges Encountered and Lessons Learned When Using a Novel Anonymised Linked Dataset of Health and Social Care Records for Public Health Intelligence: The Sussex Integrated Dataset. Information 2023, 14, 106. [Google Scholar] [CrossRef]
- Stojkoska, B.L.R.; Trivodaliev, K.V. A review of Internet of Things for smart home: Challenges and solutions. J. Clean. Prod. 2017, 140, 1454–1464. [Google Scholar] [CrossRef]
- Dian, F.J.; Vahidnia, R.; Rahmati, A. Wearables and the Internet of Things (IoT), applications, opportunities, and challenges: A Survey. IEEE Access 2020, 8, 69200–69211. [Google Scholar] [CrossRef]
- Li, H.-T.; Kong, C.-H.; Muthu, B.; Sivaparthipan, C.B. Big data and ambient intelligence in IoT-based wireless student health monitoring system. In Aggression and Violent Behavior; Elsevier: Amsterdam, The Netherlands, 2021; p. 101601. [Google Scholar]
- Agrawal, R.; Imieliński, T.; Swami, A. Mining association rules between sets of items in large databases. ACM Sigmod Rec. 1993, 22, 207–216. [Google Scholar] [CrossRef]
- Agrawal, R.; Srikant, R. Fast algorithms for mining association rules. In Proceedings of the 20th International Conference on Very Large Data Bases (VLDB), San Francisco, CA, USA, 12–15 September 1994; Volume 1215, pp. 487–499. [Google Scholar]
- Choi, W.; Kim, J.; Lee, S.; Park, E. Smart home and internet of things: A bibliometric study. J. Clean. Prod. 2021, 301, 126908. [Google Scholar] [CrossRef]
- Malik, P.K.; Sharma, R.; Singh, R.; Gehlot, A.; Satapathy, S.C.; Alnumay, W.S.; Pelusi, D.; Ghosh, U.; Nayak, J. Industrial Internet of Things and its applications in industry 4.0: State of the art. Comput. Commun. 2021, 166, 125–139. [Google Scholar] [CrossRef]
- Zheng, G.; Shankaran, R.; Orgun, M.; Qiao, L.; Saleem, K. Ideas and Challenges for Securing Wireless Implantable Medical Devices: A Review. IEEE Sens. J. 2016, 17, 562–576. [Google Scholar] [CrossRef]
- Christiansen, N.; Kaltschmitt, M.; Dzukowski, F. Electrical energy consumption and utilization time analysis of hospital departments and large scale medical equipment. Energy Build. 2016, 131, 172–183. [Google Scholar] [CrossRef]
- Morgenstern, P.; Li, M.; Raslan, R.; Ruyssevelt, P.; Wright, A. Benchmarking acute hospitals: Composite electricity targets based on departmental consumption intensities? Energy Build. 2016, 118, 277–290. [Google Scholar] [CrossRef]
- FatehiJananloo, M.; Stopps, H.; McArthur, J.J. Exploring Artificial Intelligence Methods for Energy Prediction in Healthcare Facilities: An In-Depth Extended Systematic Review. arXiv 2023, arXiv:2311.15807. [Google Scholar] [CrossRef]
- Abdul Kareem, S.; Quazi, F. Optimizing Energy Usage in Hospitals and Medical Centers with AI/ML: Ensuring Continuous Critical Operations while Reducing Costs and Carbon Footprint. Int. J. Glob. Innov. Solut. (IJGIS) 2024. [Google Scholar] [CrossRef]
- Manikandan, N.; Tadiboina, S.N.; Khan, M.S.; Singh, R.; Gupta, K.K. Automation of Smart Home for the Wellbeing of Elders Using Empirical Big Data Analysis. In Proceedings of the 2023 3rd International Conference on Advance Computing and Innovative Technologies in Engineering (ICACITE), Greater Noida, India, 12–13 May 2023; IEEE: Piscataway, NJ, USA, 2023; pp. 1164–1168. [Google Scholar]
- Akram, A.; Abbas, S.; Khan, M.; Athar, A. Smart energy management system using machine learning. Comput. Mater. Contin. 2024, 78, 959–973. [Google Scholar] [CrossRef]
- Taboada-Orozco, A.; Yetongnon, K. Smart buildings: A comprehensive systematic literature review on data-driven building management systems. Sensors 2024, 24, 4405. [Google Scholar] [CrossRef]
- Chatrati, S.P.; Hossain, G.; Goyal, A.; Bhan, A.; Bhattacharya, S.; Gaurav, D.; Tiwari, S.M. Smart home health monitoring system for predicting type 2 diabetes and hypertension. J. King Saud Univ.-Comput. Inf. Sci. 2022, 34, 862–870. [Google Scholar] [CrossRef]
- Hussain, S.H.; Geetha, S.; AmuthaPrabhakar, M. Design and Implementation of an adaptive model for sustainable home automation using internet of things (IoT). Int. J. Adv. Eng. Technol. 2016, 827, 829. [Google Scholar]
- Singh, N.; Bharti, S.S.; Singh, R.; Singh, D.K. Remotely controlled home automation system. In Proceedings of the 2014 International Conference on Advances in Engineering & Technology Research (ICAETR-2014), Unnao, India, 1–2 August 2014; IEEE: Piscataway, NJ, USA, 2014; pp. 1–5. [Google Scholar]
- David, N.; Chima, A.; Ugochukwu, A.; Obinna, E. Design of a Home Automation System Using Arduino. Int. J. Sci. Eng. Res. 2015, 6, 795–801. [Google Scholar]
- Spanò, E.; Niccolini, L.; Di Pascoli, S.; Iannacconeluca, G. Last-meter smart grid embedded in an Internet-of-Things platform. IEEE Trans. Smart Grid 2015, 6, 468–476. [Google Scholar] [CrossRef]
- Sharif, Z.; Jung, L.T.; Ayaz, M.; Yahya, M.; Pitafi, S. Priority-based task scheduling and resource allocation in edge computing for health monitoring system. J. King Saud Univ.-Comput. Inf. Sci. 2023, 35, 544–559. [Google Scholar] [CrossRef]
- Keikhosrokiani, P.; Kamaruddin, N.S.A.B. IoT-Based in-hospital-in-home heart disease remote monitoring system with machine learning features for decision making. In Connected e-Health: Integrated IoT and Cloud Computing; Springer: Berlin/Heidelberg, Germany, 2022; pp. 349–369. [Google Scholar]
- Mani, V.; Manickam, P.; Alotaibi, Y.; Alghamdi, S.; Khalaf, O.I. Hyperledger healthchain: Patient-centric IPFS-based storage of health records. Electronics 2021, 10, 3003. [Google Scholar] [CrossRef]
- Bovenizer, W.; Chetthamrongchai, P. A comprehensive systematic and bibliometric review of the IoT-based healthcare systems. Clust. Comput. 2023, 26, 3291–3317. [Google Scholar] [CrossRef]
- Parvin, S.; Nimmy, S.; Kamal, M. Convolutional neural network based data interpretable framework for Alzheimer’s treatment planning. Vis. Comput. Ind. Biomed. Art 2024, 7, 3. [Google Scholar] [CrossRef]
- Fahd, K.; Venkatraman, S. Visualizing risk factors of dementia from scholarly literature using knowledge maps and next-generation data models. Vis. Comput. Ind. Biomed. Art 2021, 4, 19. [Google Scholar] [CrossRef]
- Batko, K. Digital social innovation based on Big Data Analytics for health and well-being of society. J. Big Data 2023, 10, 171. [Google Scholar] [CrossRef]
- Atzori, L.; Iera, A.; Morabito, G. The internet of things: A survey. Comput. Netw. 2010, 54, 2787–2805. [Google Scholar] [CrossRef]
- Hyvärinen, A.; Oja, E. Independent component analysis: Algorithms and applications. Neural Netw. 2000, 13, 411–430. [Google Scholar] [CrossRef]
- Ahmed, E.; Yaqoob, I.; Gani, A.; Imran, M.; Guizani, M. Internet-of-things-based smart environments: State of the art, taxonomy, and open research challenges. IEEE Wirel. Commun. 2016, 23, 10–16. [Google Scholar] [CrossRef]
- Sun, G.Z.; Giles, C.L.; Chen, H.H.; Lee, Y.C. The neural network pushdown automaton: Model, stack and learning simulations. arXiv 2017, arXiv:1711.05738. [Google Scholar] [CrossRef]
- Chatterjee, S.; Mandal, S. A novel comparison of gauss-seidel and newton-raphson methods for load flow analysis. In Proceedings of the 2017 International Conference on Power and Embedded Drive Control (ICPEDC), Chennai, India, 16–18 March 2017; IEEE: Piscataway, NJ, USA, 2017; pp. 1–7. [Google Scholar] [CrossRef]
- Blog Post. The Digital Hospital Evolution: Creating a Framework for the Healthcare System of the Future. 2017. Available online: https://infosystems.mu/the-digital-hospital-evolution-creating-a-framework-for-the-healthcare-system-of-the-future (accessed on 10 August 2025).
Disclaimer/Publisher’s Note: The statements, opinions and data contained in all publications are solely those of the individual author(s) and contributor(s) and not of MDPI and/or the editor(s). MDPI and/or the editor(s) disclaim responsibility for any injury to people or property resulting from any ideas, methods, instructions or products referred to in the content. |
© 2025 by the authors. Licensee MDPI, Basel, Switzerland. This article is an open access article distributed under the terms and conditions of the Creative Commons Attribution (CC BY) license (https://creativecommons.org/licenses/by/4.0/).