Article

Validation of Acoustic Emission Tomography Using Lagrange Interpolation in a Defective Concrete Specimen

Department of Civil Engineering, College of Science and Technology, Nihon University, Tokyo 101-8308, Japan
*
Author to whom correspondence should be addressed.
Appl. Sci. 2025, 15(16), 8965; https://doi.org/10.3390/app15168965
Submission received: 1 July 2025 / Revised: 10 August 2025 / Accepted: 12 August 2025 / Published: 14 August 2025
(This article belongs to the Special Issue Advances in Structural Health Monitoring in Civil Engineering)

Abstract

Acoustic Emission tomography (AET) has the potential to visualize damage in existing structures, contributing to structural health monitoring. Further, AET requires only the arrival times of elastic waves at sensors to identify velocity distributions, as source localization based on ray-tracing is integrated into its algorithm. Thus, AET offers the advantage of easy acquisition of measurement data. However, accurate source localization requires a large number of elastic wave source candidate points, and increasing these candidates significantly raises the computational resource demand. Lagrange Interpolation has the potential to reduce the number of candidate points, optimizing computational resources, and this potential has been validated numerically. In this study, AET incorporating Lagrange Interpolation is applied to identify the velocity distribution in a defective concrete plate, validating its effectiveness using measured wave data. The validation results show that the defect location in the concrete plate is successfully identified using only 36 source candidates, compared to the 121 candidates required in conventional AET. Furthermore, when using 36 source candidates, the percentage error in applying Lagrange Interpolation is 8.4%, which is significantly more accurate than the 25% error observed in conventional AET. Therefore, it is confirmed that AET with Lagrange Interpolation has the potential to identify velocity distributions in existing structures using optimized resources, thereby contributing to the structural health monitoring of concrete infrastructure.

1. Introduction

In the field of structural health monitoring of concrete structures, applications of non-destructive testing (NDT) based on measured elastic waves have been widely studied to evaluate the stability of target structures [1,2,3]. For instance, elastic wave tomography (EWT) has been used to identify heterogeneous elastic wave velocity distributions in concrete structures [4,5]. In the EWT algorithm, velocity distributions are identified based on inverse analysis using measured travel times of elastic waves from elastic wave sources to sensors installed in the target structure [6,7]. These elastic wave sources are artificially generated to measure travel times. Hence, it is noteworthy that EWT can be applied to various materials if generated elastic waves can propagate to installed sensors. Furthermore, if tomography techniques are continuously applied to health monitoring, it is expected that the initial defects can be detected, allowing for the development of a practical reconditioning schedule.
Acoustic emission tomography (AET) [8] is another tomography technique based on measured elastic waves, and its applicability to monitoring the integrity of concrete structures has been explored in several studies [9,10]. In addition, Schubert [8] presented that AET has the potential to identify damage in materials exhibiting defects at multiple locations. Moreover, Okude et al. [11] have applied AET to evaluate the cracks and repaired regions in an RC slab. Furthermore, Cheng et al. [12] investigated the stress conditions of rock specimens using velocity distributions identified by AET. Hence, AET has the potential to be applied to real-world structures.
Acoustic emission (AE) is an elastic wave generated by micro-defects and/or friction. Further, the locations of AE sources have been used for visualizing micro-cracks, and the method is called source localization [13]. Source localizations have been applied to monitor failures occurring in existing structures and concrete specimens [14,15]. Source localization is applied to the AET algorithm and can be used to obtain locations of the sources and emission times of the waves. Owing to the application of the source localization, AET does not require measuring the source locations and emission times to determine the travel times. Moreover, once the source locations and emission times are obtained, the velocity distribution can be identified using the same procedure as in EWT. Therefore, AET is expected to identify voids within existing structures, similar to those identified by EWT [16].
In the initial concept of AET, AE is used for the identification of the velocity distribution. In order to obtain an accurate velocity distribution, sufficient AE sources are required since the identification is conducted by an inverse analysis, and the number of sources contributes to the number of equations. Although a large number of AE events are generated during crack growth [1,17,18,19], the velocity distribution is considered to change under loading. Tomography techniques typically assume that the velocity distribution remains constant during elastic wave measurements. Furthermore, according to the AET algorithm, AE sources should be homogeneously distributed in an analysis area to obtain accurate velocity distributions. However, the homogeneity of AE sources is not guaranteed. To overcome the above problems, Kobayashi et al. [10] have considered applying artificial elastic waves to AET.
The advantages of AET over EWT, when applied to artificially generated elastic waves, are presented. Since EWT relies on inverse analysis, it requires a large amount of measurement data to obtain accurate velocity distribution. Therefore, if EWT is applied to health monitoring of large-scale structures, a large number of sources, and the emission times are required. However, because installing the sources is time-consuming, it is challenging to measure such large quantities. On the other hand, the AET algorithm includes source localization, and sources can be randomly generated in the structures. Therefore, it is expected that AET will easily obtain sufficient sources in comparison with EWT, which contributes to the accurate identification of velocity distributions.
In AET, source localization selects sources from candidate points specified in the analysis model. Since the accuracy of the localized sources affects the accuracy of the identification, the localization errors should be minimized. Further, in order to improve the accuracy of the localized sources, the interval between the source candidates should be reduced. It should be noted that reducing the interval contributes to the improvement in velocity distribution, as validated by a previous study [10]. Although increasing the number of candidates indefinitely would allow AET to identify a highly accurate elastic wave velocity distribution, this is impractical due to limitations in random access memory (RAM) capacity. According to the AET algorithm, a large number of ray-paths have to be computed in a dense candidate grid, and ray-paths should be stored for a practical computational time. Thus, increasing these candidates significantly raises the computational resource demand.
In order to optimize the computational resources, Lagrange interpolation has been applied to the source localization used in AET to localize sources between the candidates. If the source is localized between the candidates, the number of candidates is decreased since the wide interval of the candidates can be used in the analysis model. Moreover, the performance of Lagrange interpolation in AET has been validated through a numerical test aimed at identifying internal damage in a concrete plate [20]. However, the application of Lagrange interpolation in AET has only been confirmed in the aforementioned study and has not yet been validated through model tests. Although sensors are modeled as points in the analysis model, sensing surfaces of sensors are generally circular. Further, arrival times of elastic waves are measurement data used in AET, and the arrival times are generally detected using algorithms. Thus, the detected arrival times are not the original times. It is necessary to clarify whether the residual difference between the measured and computed data does not contribute to the inaccuracy of the identified velocity distribution. In this study, AET implementing Lagrange interpolation is applied to a defective concrete plate, and the performance of Lagrange interpolation in AET is validated through the model test. Moreover, the conventional AET is also applied to the concrete plate, and the obtained results are compared with those obtained using Lagrange interpolation.

2. Identification of the Velocity Distributions Based on AET

2.1. Conventional AET

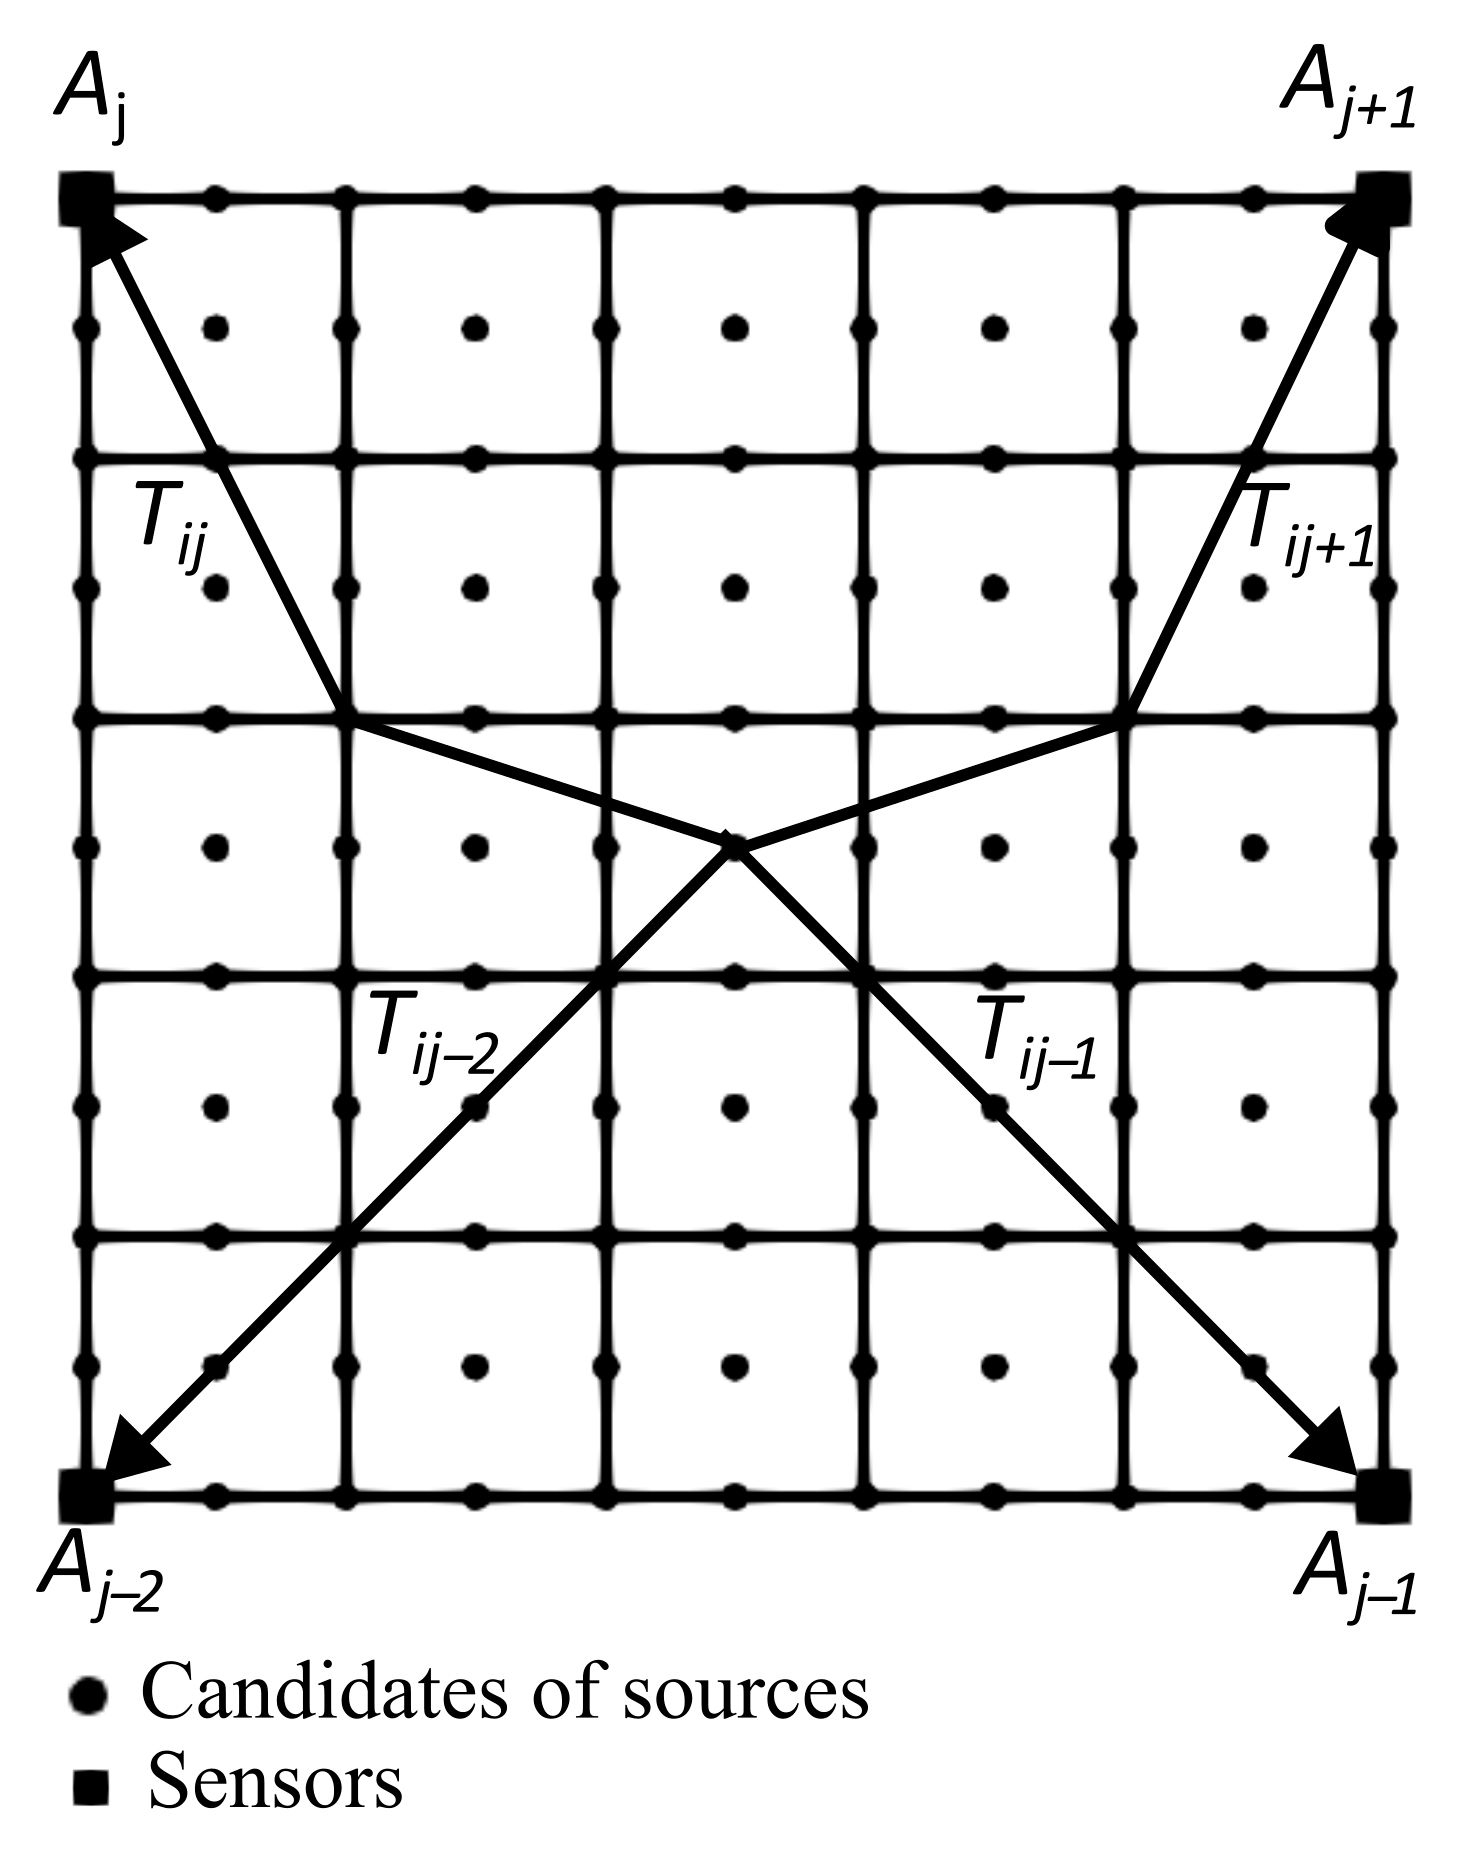
Figure 1 illustrates an analysis model used in AET, which consists of discrete cells. Further, slowness is the reciprocal of the velocity and is assigned to these cells. The identified velocity distributions are approximated using the cells in the model, and the process is the same as that used in EWT [6,7] if emission times and source locations are obtained.
AET employs source localization to compute emission times and source locations. It is the difference between AET and EWT since EWT uses measured emission times and source locations. Furthermore, AET employs a particular source localization for applying to a heterogeneous velocity distribution. Generally, source localization assumes a homogeneous elastic wave velocity distribution in a target material, and elastic waves propagate as straight lines. However, AET is conducted in heterogeneous materials. Thus, AET requires source localization considering the refractions and diffractions. In the source localization used in AET, ray-tracing [21] is employed to consider refraction and diffraction and compute ray-paths from sensors to sources. Ray-tracing has been applied to EWT to consider diffraction and refraction occurring in the heterogeneous velocity distributions. It should be noted that conventional AET refers to AET using ray-tracing proposed by Kobayashi et al. [9] in this study. Using computed ray-paths, estimated emission times are obtained, and the variance of the estimated emission times is used for candidate selection. The candidate is a black dot illustrated in Figure 1. Moreover, the ray-path is defined as a polyline connecting candidates used for relay points. In the ray-trace algorithm, all possible polyline patterns are first computed. One of the polylines is then selected based on the minimum computed travel time.
Building on a ray-tracing-based approach, the following equations formalize the computation of travel time and emission time used in AET. The computed travel time T i j is defined as:
T i j = k S k l i j k ,
where S k is the slowness allocated in the cell k , l i j k is the part of the length of the ray-path from candidate i to sensor j in the cell k . The slowness has been used in EWT for the parameter. Furthermore, the slowness is also used in AET. If T i j , which is from the localized source to the sensor, is subtracted from an arrival time of a measured wave, and the emission time is obtained. The estimated emission time P i j is defined as:
P i j = A j T i j ,
where A j is the arrival time at sensor j . Further, A j and T i j are illustrated in Figure 2. A j is the measurement data generally used in source localization [13] and has also been applied to AET. According to Figure 2, the number of P i j is the same as the number of the installed sensors in each candidate. If the location of the candidate is the location of the original source, all of the estimated emission times show equality. However, it is challenging that the location of the candidate is set in the location of the original sources. Thus, the variance of the estimated emission times is computed for each candidate, and the candidate allocated the minimum variance is selected as the localized source. Further, the emission time is defined as the average of the estimated emission times obtained at the localized source. In the computation of AET, subtracting A j from the emission time is used instead of the measured travel times used in EWT. Therefore, the identification of the velocity distribution using AET is conducted by the minimization of the error T i j , and T i j is defined as:
T i j = A j P i ¯ T i j ,
where P i ¯ is the emission time at the candidate i . If Equation (3) is minimized by inverse analysis, the identified velocity distribution is approximated to the original distribution. Moreover, the simultaneous iterative reconstruction technique (SIRT) is applied to Equation (3) in this study because SIRT has been applied to EWT. It should be noted that the homogeneous velocity distribution is applied to the source localization in the first step of AET.
According to Equation (3), T i j and P i ¯ are used to approximate the original values with the minimization of T i j to compute S k . The accuracy of T i j and P i ¯ depends on the accuracy of the localized source because T i j is computed using the localized source. Therefore, the reduced accuracy of T i j and P i ¯ suggests that the source localization plays a crucial role in the accuracy of AET. If the measurement of elastic waves is conducted ideally, the source localization error occurs due to the difference between the candidate and original sources. Although the interval between candidates should be reduced to minimize the difference between the candidate and the original source, the number of candidates is increased. In addition, the number of polyline patterns increases as more straight paths are generated between candidates, which in turn raises the ray-tracing computation time. If all polyline patterns are stored in RAM, computation time can be minimized, as they do not need to be recalculated multiple times during the analysis. However, due to this effect, increasing the number of candidates contributes to increasing the computational resources used in AET. Therefore, it is suggested that sources located between candidates should be localized to optimize the computational resources.

2.2. Application of Lagrange Interpolation

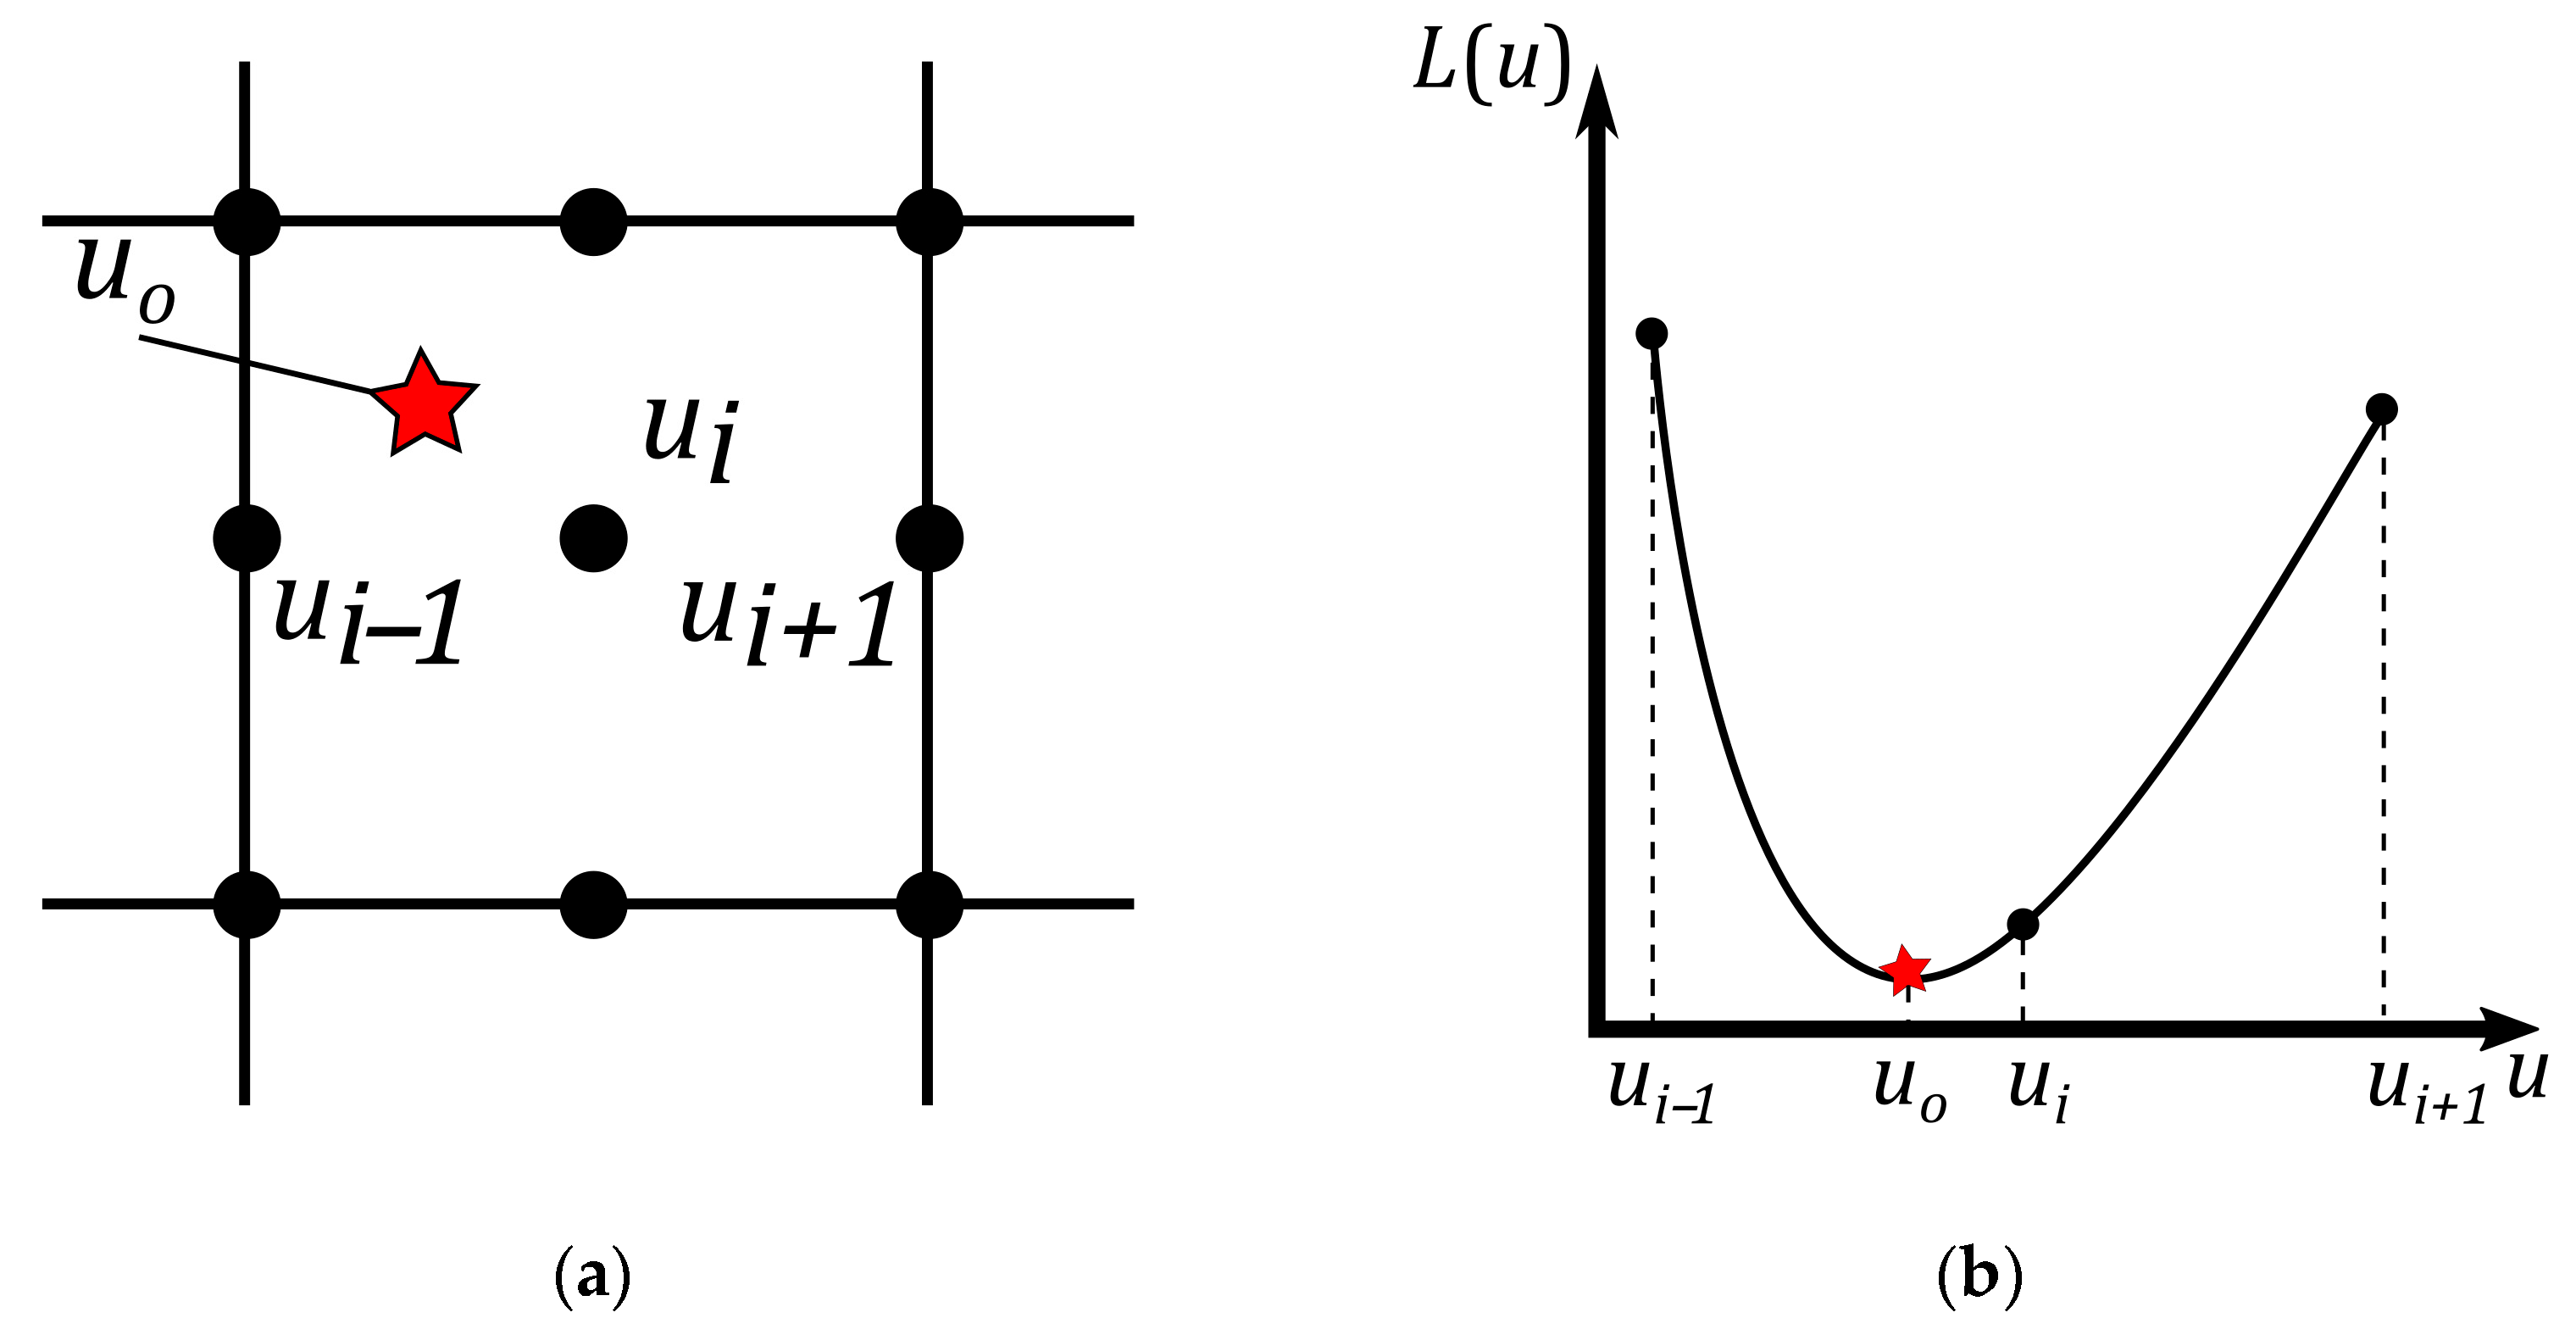
In the AET algorithm, the minimum variance of the estimated emission times is used as a criterion for the source localization based on ray-tracing. In the application of Lagrange interpolation, the variance at a location between candidates is estimated to localize the source more closely to the original source. The source localization based on Lagrange interpolation is illustrated in Figure 3. Here, u o denotes the coordinate of the localized source o . Therefore, Figure 3 serves as a conceptual diagram showing how to localize u o . In Figure 3a, three of the candidates are selected for the application of Lagrange interpolation. Figure 3b illustrates how the variances of the estimated emission times are interpolated at each candidate. It should be noted that the example of the selected candidates shown in Figure 3b is used to compute the coordinate of the source on the horizontal axis. If the coordinate on the vertical axis is required to be computed, the candidates aligned vertically should be used for Lagrange interpolation.
Lagrange interpolation L u used in the source localization is defined as:
L u = i m σ i 2 j i j m u u j u i u j ,
where m is the number of the selected candidates, u is the coordinate of the source, u i and u j are the coordinates of the candidate i and j , σ i 2 is the variance of the estimated emission time obtained at the candidate i . According to the algorithm of the source localization, the variance of the estimated emission time can be computed at each candidate. Since σ i 2 is applied to Equation (4), the output of the L u is the variance, and L u estimates the variance at sources between candidates. Furthermore, if m , which is equal to three, is applied to L u , L u is defined as the quadratic function. Hence, the vertex of L u is the criterion of the coordinate of the source, and the vertex is obtained using Equation (5).
L u = 0 ,
Equation (5) is a linear function in which the variable is u and can be solved for u to localize the source.
In order to detail the application of Lagrange interpolation in AET, the flow of AET is illustrated in Figure 4. In Figure 4, Lagrange interpolation is applied after the phase of the source localization. The identification of the velocity distribution based on the tomography requires the computed travel times. However, Lagrange interpolation does not provide computed travel times from the localized source to sensors. To obtain travel times, ray-tracing is conducted to compute the ray-paths from the localized source to sensors. Moreover, the obtained ray-paths are applied to Equation (1) to compute travel times. Lagrange interpolation is used to estimate the variance, and the estimated variance is not expected to be equal to the variance computed from the computed travel times. Using the computed travel times, the variance σ 0 2 at the localized source o is obtained. If σ 0 2 is larger than σ i 2 , the selected candidate i is used as localized sources. In inverse analysis for the identification, SIRT is conducted using the travel times from localized sources to the sensors. After the computation of SIRT, the slowness correction ratio is computed. The slowness correction ratio is defined as:
ε k = S k S k ,
where S k is the slowness correction factor in the cell k . If ε k is smaller than the criterion ε a , the iteration of AET is terminated in this study. It should be noted that ε k is 0.01 in this model test. ε k notes the slowness correction progress because it is reduced with iteration increments. Considering elastic wave measurement errors, ε is assumed to progress to 0.01.

3. Experimental Setup

3.1. Elastic Wave Measurement Condition

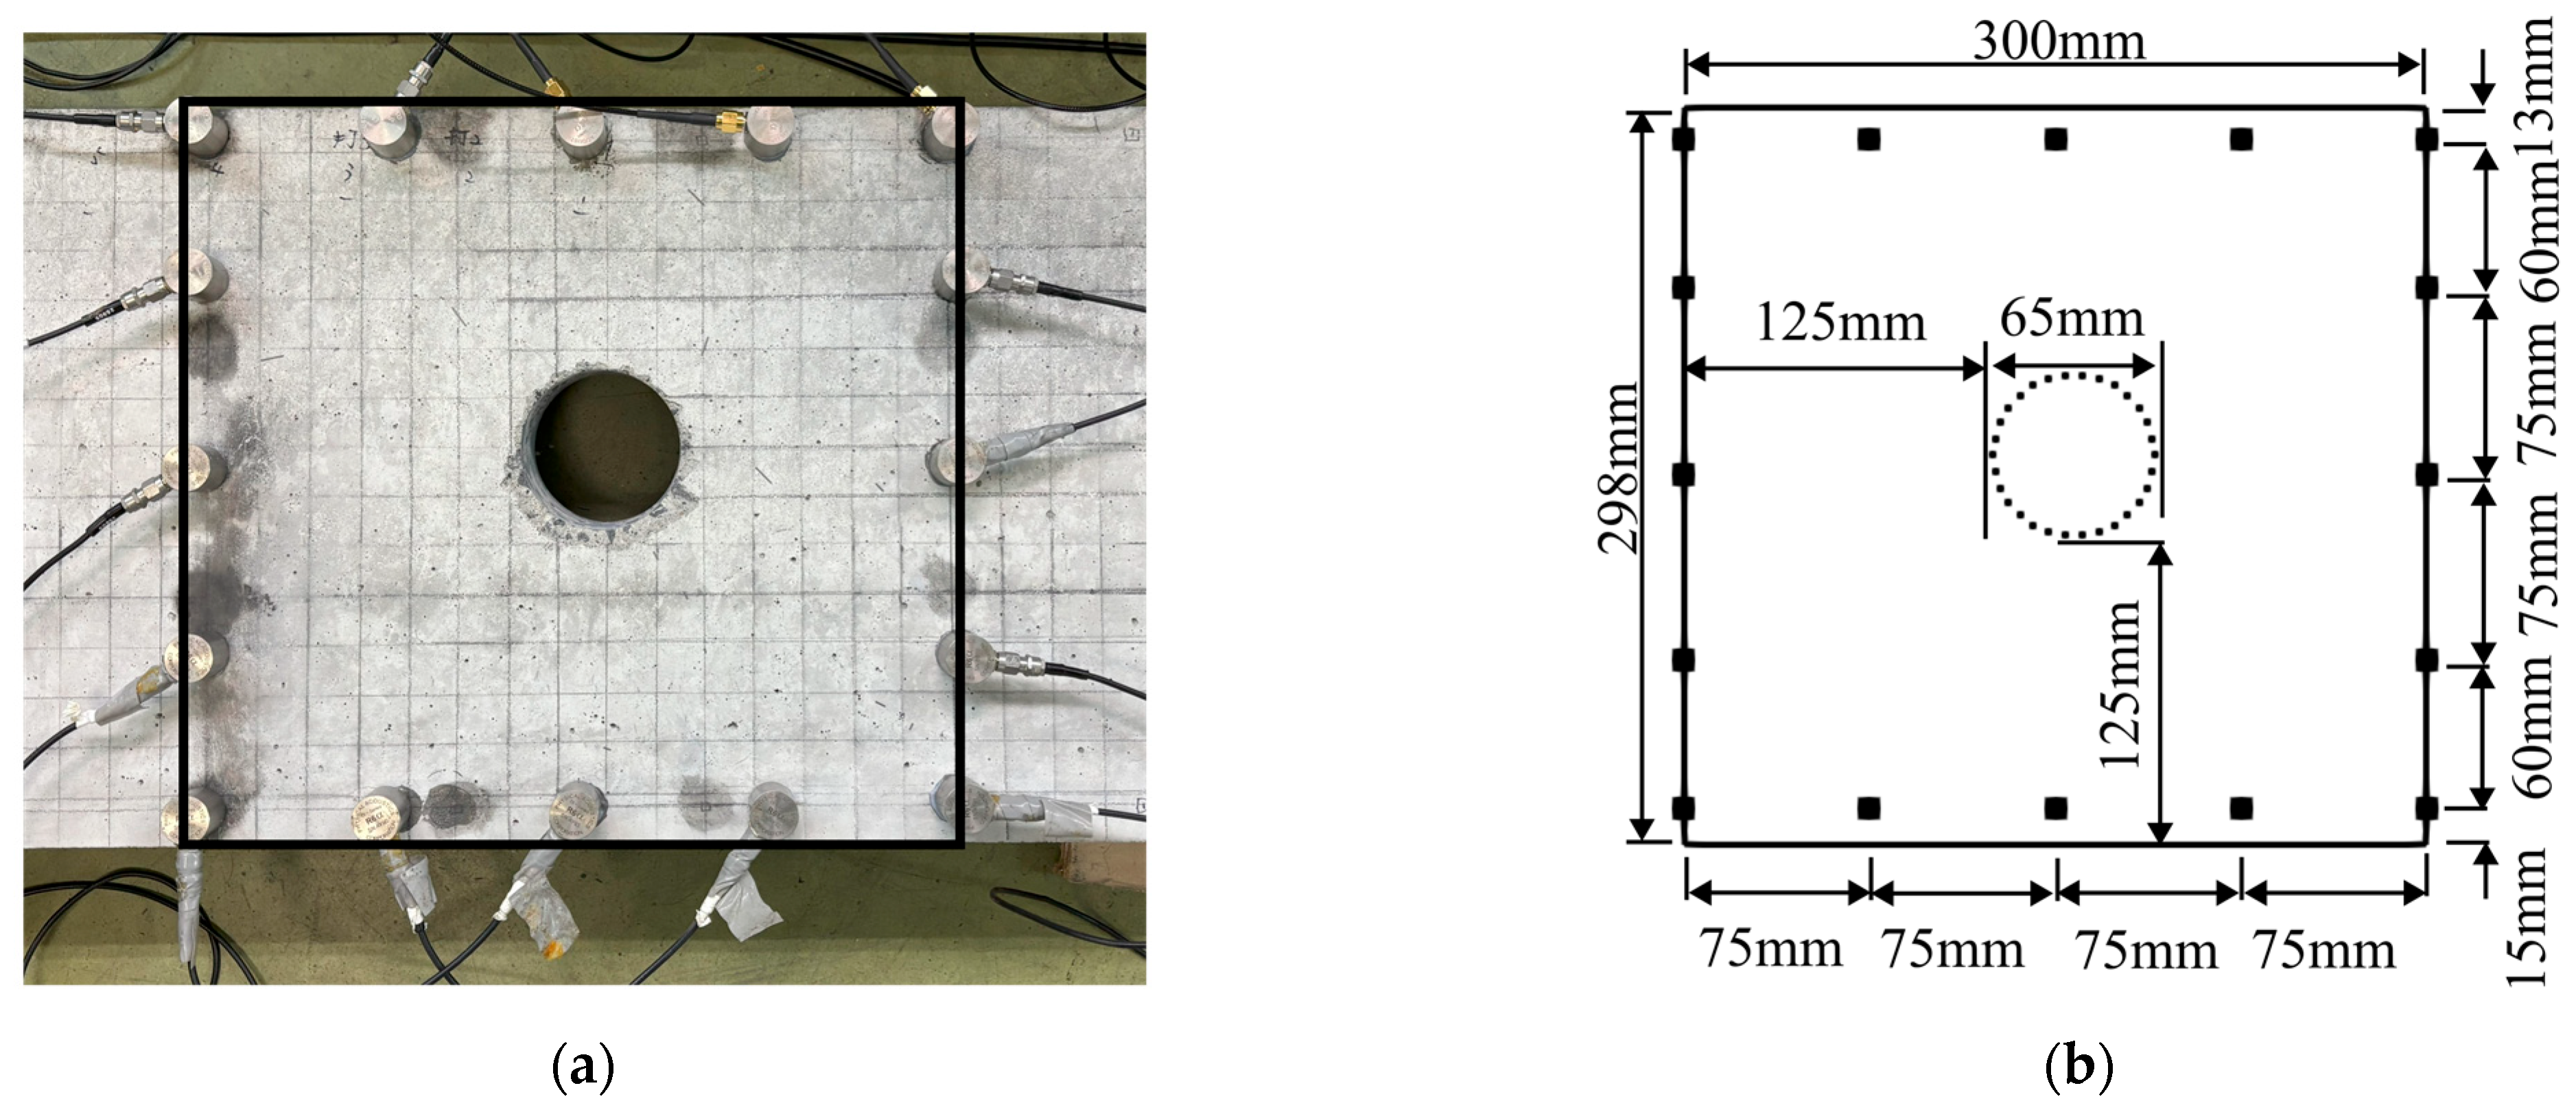
Photographs of the concrete plate used in the model test are shown in Figure 5. The concrete plate measures 910 mm in length, 298 mm in height, and 60 mm in width. Moreover, the concrete plate is manufactured in accordance with Japanese Industrial Standards (JIS) A5372 [22], and it is generally used in retaining walls. This specimen is a standardized industrial product, and the initial presence of heterogeneity is considered unlikely. The concrete plate contains a circular defect. Furthermore, the cracks are not propagating, and the region outside the defect is expected to be sound. In Figure 5a, the sensors used in the elastic wave measurement are installed around the defect. On the other hand, in Figure 5b, the sensors are installed around the undamaged area. In this model test, AET is conducted in each analysis area. In order to illustrate the size of the analysis area, the photograph and the illustration of the analysis area are shown in Figure 6. The analysis area shown in Figure 6a,b measures 300 mm in length and 298 mm in height. Further, the number of sensors is 16, and the sensors are regularly installed around the analysis area. In the defect area, the defect is located at the center of the analysis area and has a diameter of 65 mm. It should be noted that the size of the undamaged area is the same as the defect area.
Tomography techniques require multiple sensors to obtain the velocity distribution because the identification based on an inverse analysis needs to measure several waves. However, due to the huge cost of sensors, installing a large number of sensors is challenging. Hence, the analysis area should be divided within the infrastructures, as shown in Figure 5, to conduct AET for the structural health monitoring. If AET is conducted in the defect area, it is expected that a low velocity distribution is identified in the location of the defect. Furthermore, homogeneous velocity distribution is expected to be identified in the undamaged area. In order to validate the performance of AET in structural health monitoring, the identified velocity distribution in the defect area is compared to the identified distribution in the undamaged area.
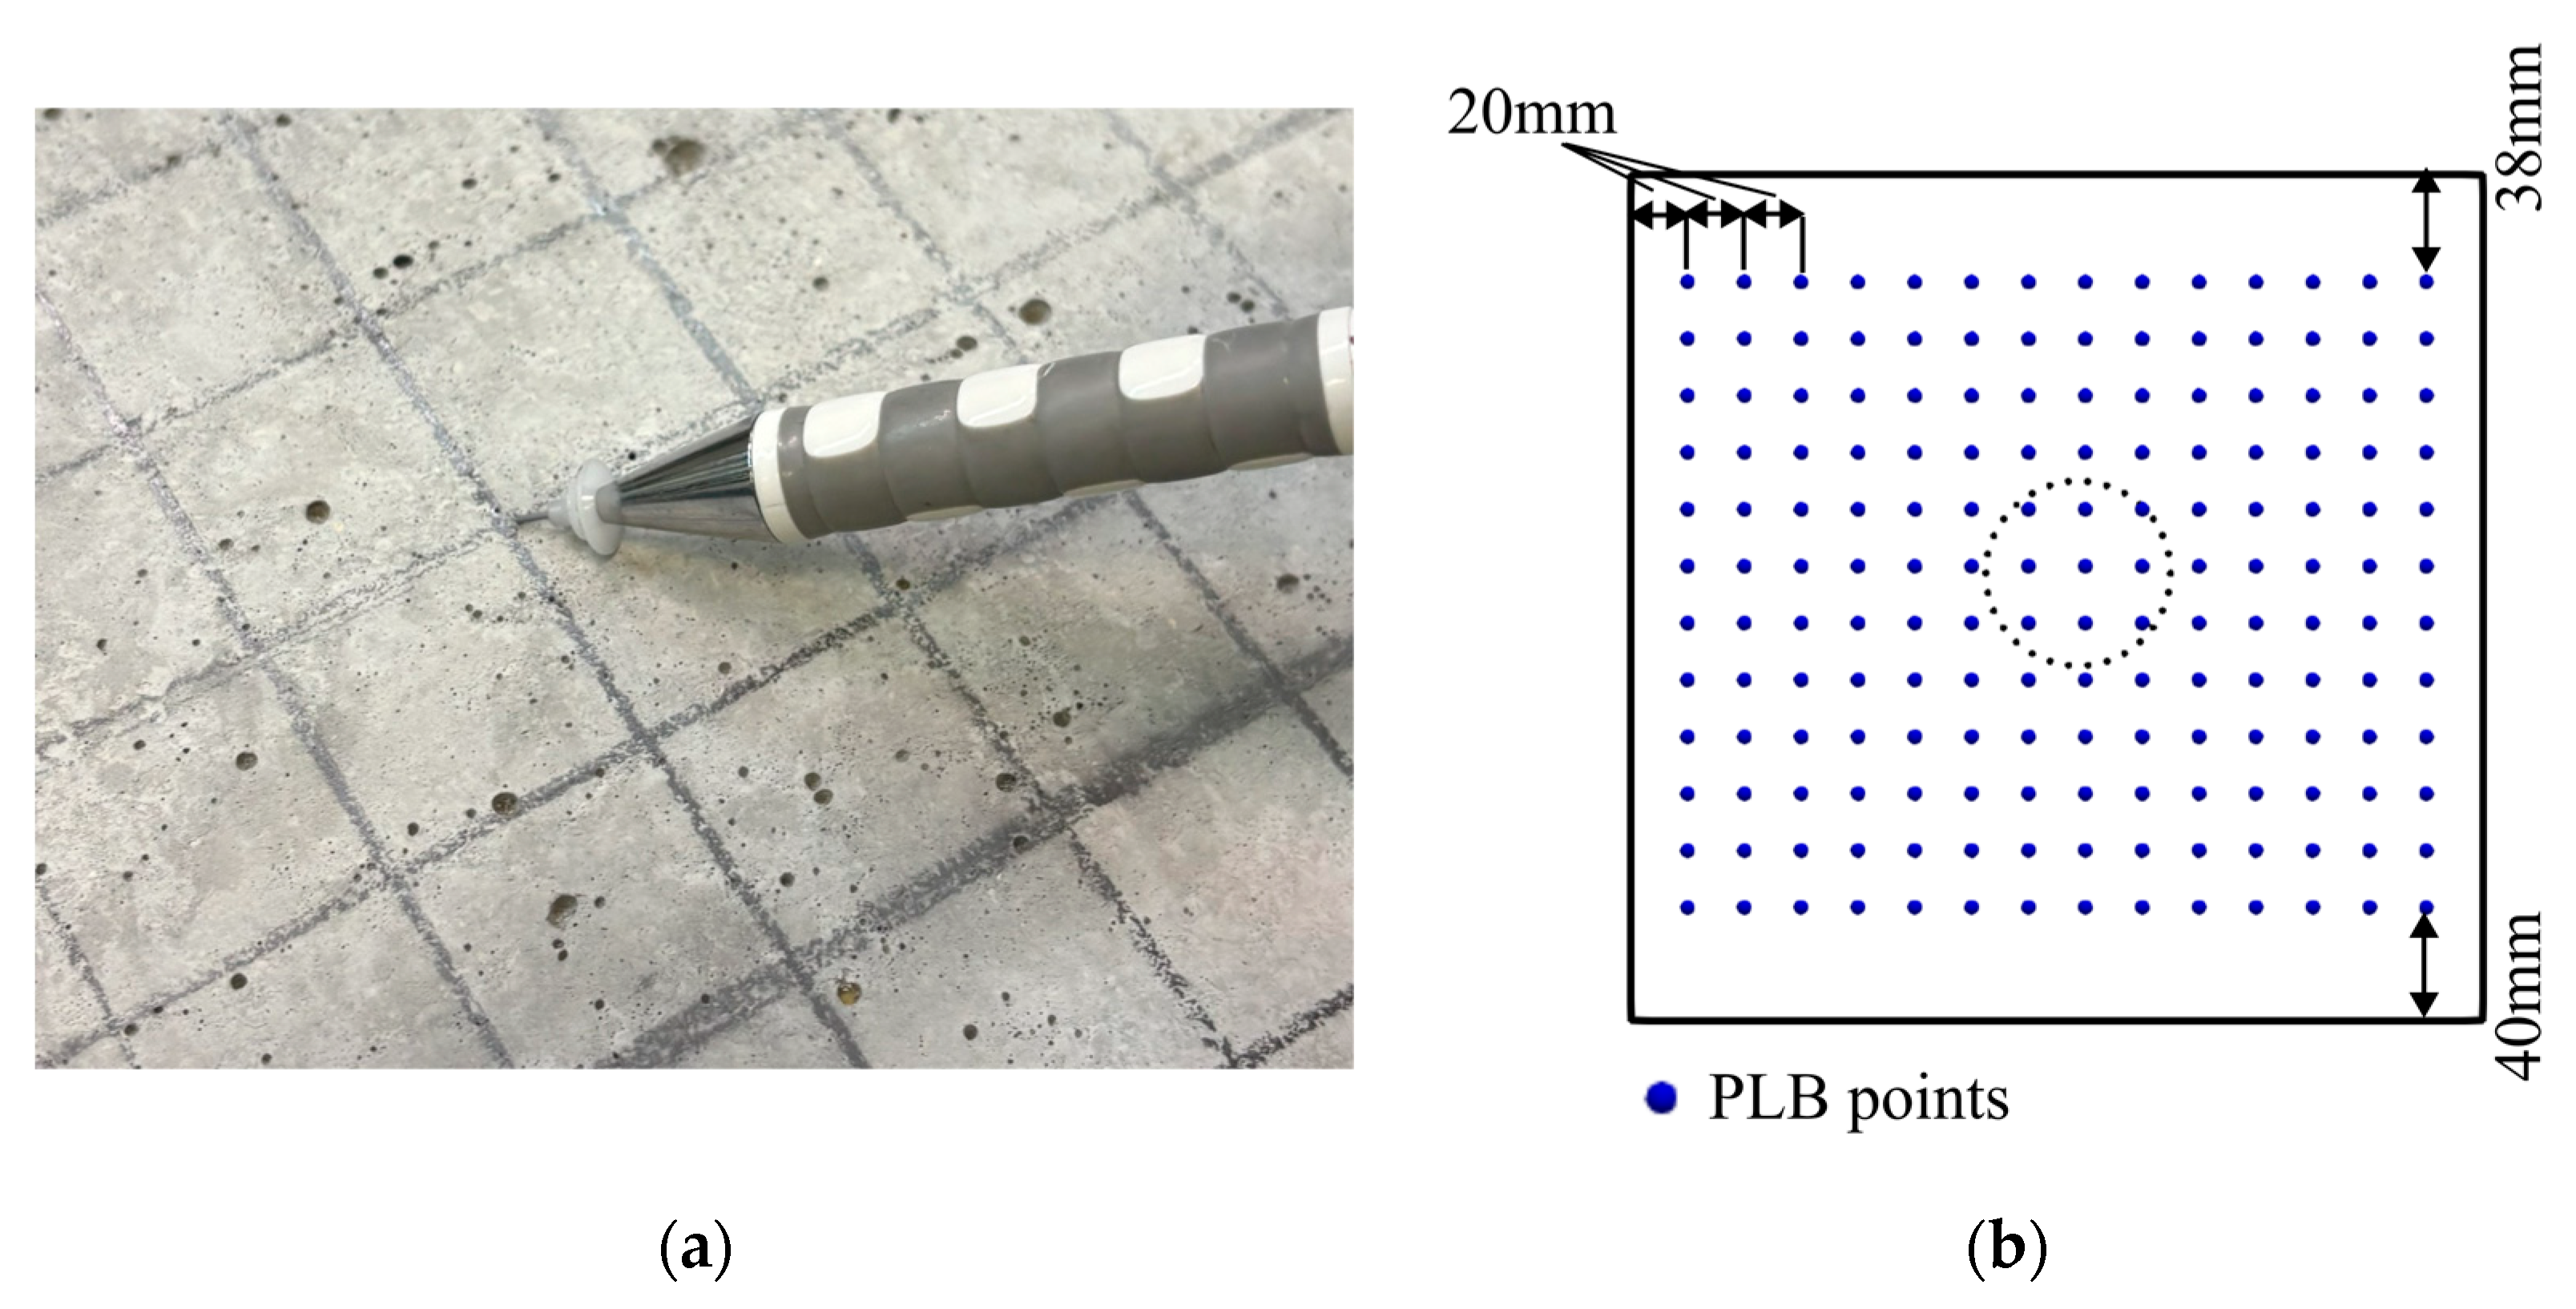
Elastic waves are generated by pencil lead break (PLB) tests, which are generally used in the validation of AE source localization [23,24,25]. Locations of PLB tests are shown in Figure 7. In Figure 7a, PLB tests are conducted in the analysis area. Further, in Figure 7b, PLB points are evenly spaced at 2.0 cm intervals. Thus, a total of 168 PLB points is arranged in the undamaged area. Furthermore, since conducting PLB tests within the defect area is challenging, 159 points are arranged around the defect area instead. It is expected that a sufficient number of elastic waves are measured to enable velocity distribution identification based on SIRT.
The measurement system produced by Physical Acoustics Corporation [26] is used in this model test. Installed sensors are R6a, and the resonant frequency of the installed sensors is 55 kHz. The measured waves are amplified by 40 dB using 2/4/6 preamp. Furthermore, the amplified waves are measured by Express-8 measurement board. It should be noted that the measurement system has been applied to the measurement of the waves generated by PLB tests [27], and it is expected that the measurement system has the potential to measure high S/N signals for practical arrival time detection. The waveforms are measured if the amplitudes exceed the threshold 60 dB, where the amplitude level 0 dB is 100 μV. Moreover, the length of the waveform is 511.5 μs, and the sampling rate is 2 MHz.
The arrival times are detected from the measured waveforms using an auto arrival time detection based on Akaike information criterion (AIC) [28]. The arrival time detection is generally referred to as AIC-picker. In AIC-picker, AICs are computed in the noise part and the signal part of a waveform, respectively [29]. The arrival time is detected at the boundary of the waveform, and the criterion of the boundary is the minimum AIC. Further, AIC-picker has been applied to detect arrival times of elastic waves propagating in the concrete specimen [30]. Furthermore, the arrival times detected by AIC-picker have contributed to developing advanced source localization [31]. Thus, AIC-picker has been applied to NDT, and it is expected that the practical arrival time can be detected for AET. However, AIC-picker detects the expected boundary as the arrival time. Hence, it should be noted that the detected arrival times are not the original times. Moreover, if a large difference in amplitudes exists within a signal, AIC-picker has the potential to detect the middle of the signal. In this validation, the measured waves are attenuated by the diffraction, and the difference in amplitudes of signals may occur. Thus, the detected arrival times may include errors. This validation employs arrival times that may include practical errors, similar to those expected in real-world NDT scenarios. By considering such realistic uncertainties, the application of Lagrange interpolation is evaluated under practical conditions.
In order to apply the detected arrival times to the tomography, the arrival times have to be classified for events. It should be noted that generating a signal elastic wave source is referred to as the events. The arrival times are classified by:
A j A j + 1 R V p ,
where R is the maximum propagation range of elastic waves and V p is the propagation velocity. If the subtraction between the arrival times is less than the maximum travel time obtained by the division of R and V p , the arrival times are assumed to be detected from measured waves generated by the one event. In this model test, R is 424 mm and is the approximate diagonal of the analysis area. Moreover, V p is assumed to be 4000 m/s, based on the identified velocity distribution of concretes in the undamaged area [4,5,16]. Furthermore, according to JIS A5372 [22], the compressive strength of this plate should exceed 30 N/mm2. The compressive strength is related to the propagation velocity [32], which is estimated to be approximately 4000 m/s when the compressive strength is assumed to be 30 N/mm2 [33]. If the arrival times belong to an event, A j A j + 1 is expected to be smaller than the travel time in the diagonal of the analysis area. Thus, arrival times are classified based on Equation (7). Furthermore, if 16 arrival times satisfy Equation (7), they are classified as belonging to an event. The obtained events are listed in Table 1. According to Table 1, the number of used events is not equal to the number of PLB points in the undamaged area. It is considered that some detected arrival times do not satisfy Equation (7) because of detection errors.

3.2. Initial Condition of AET

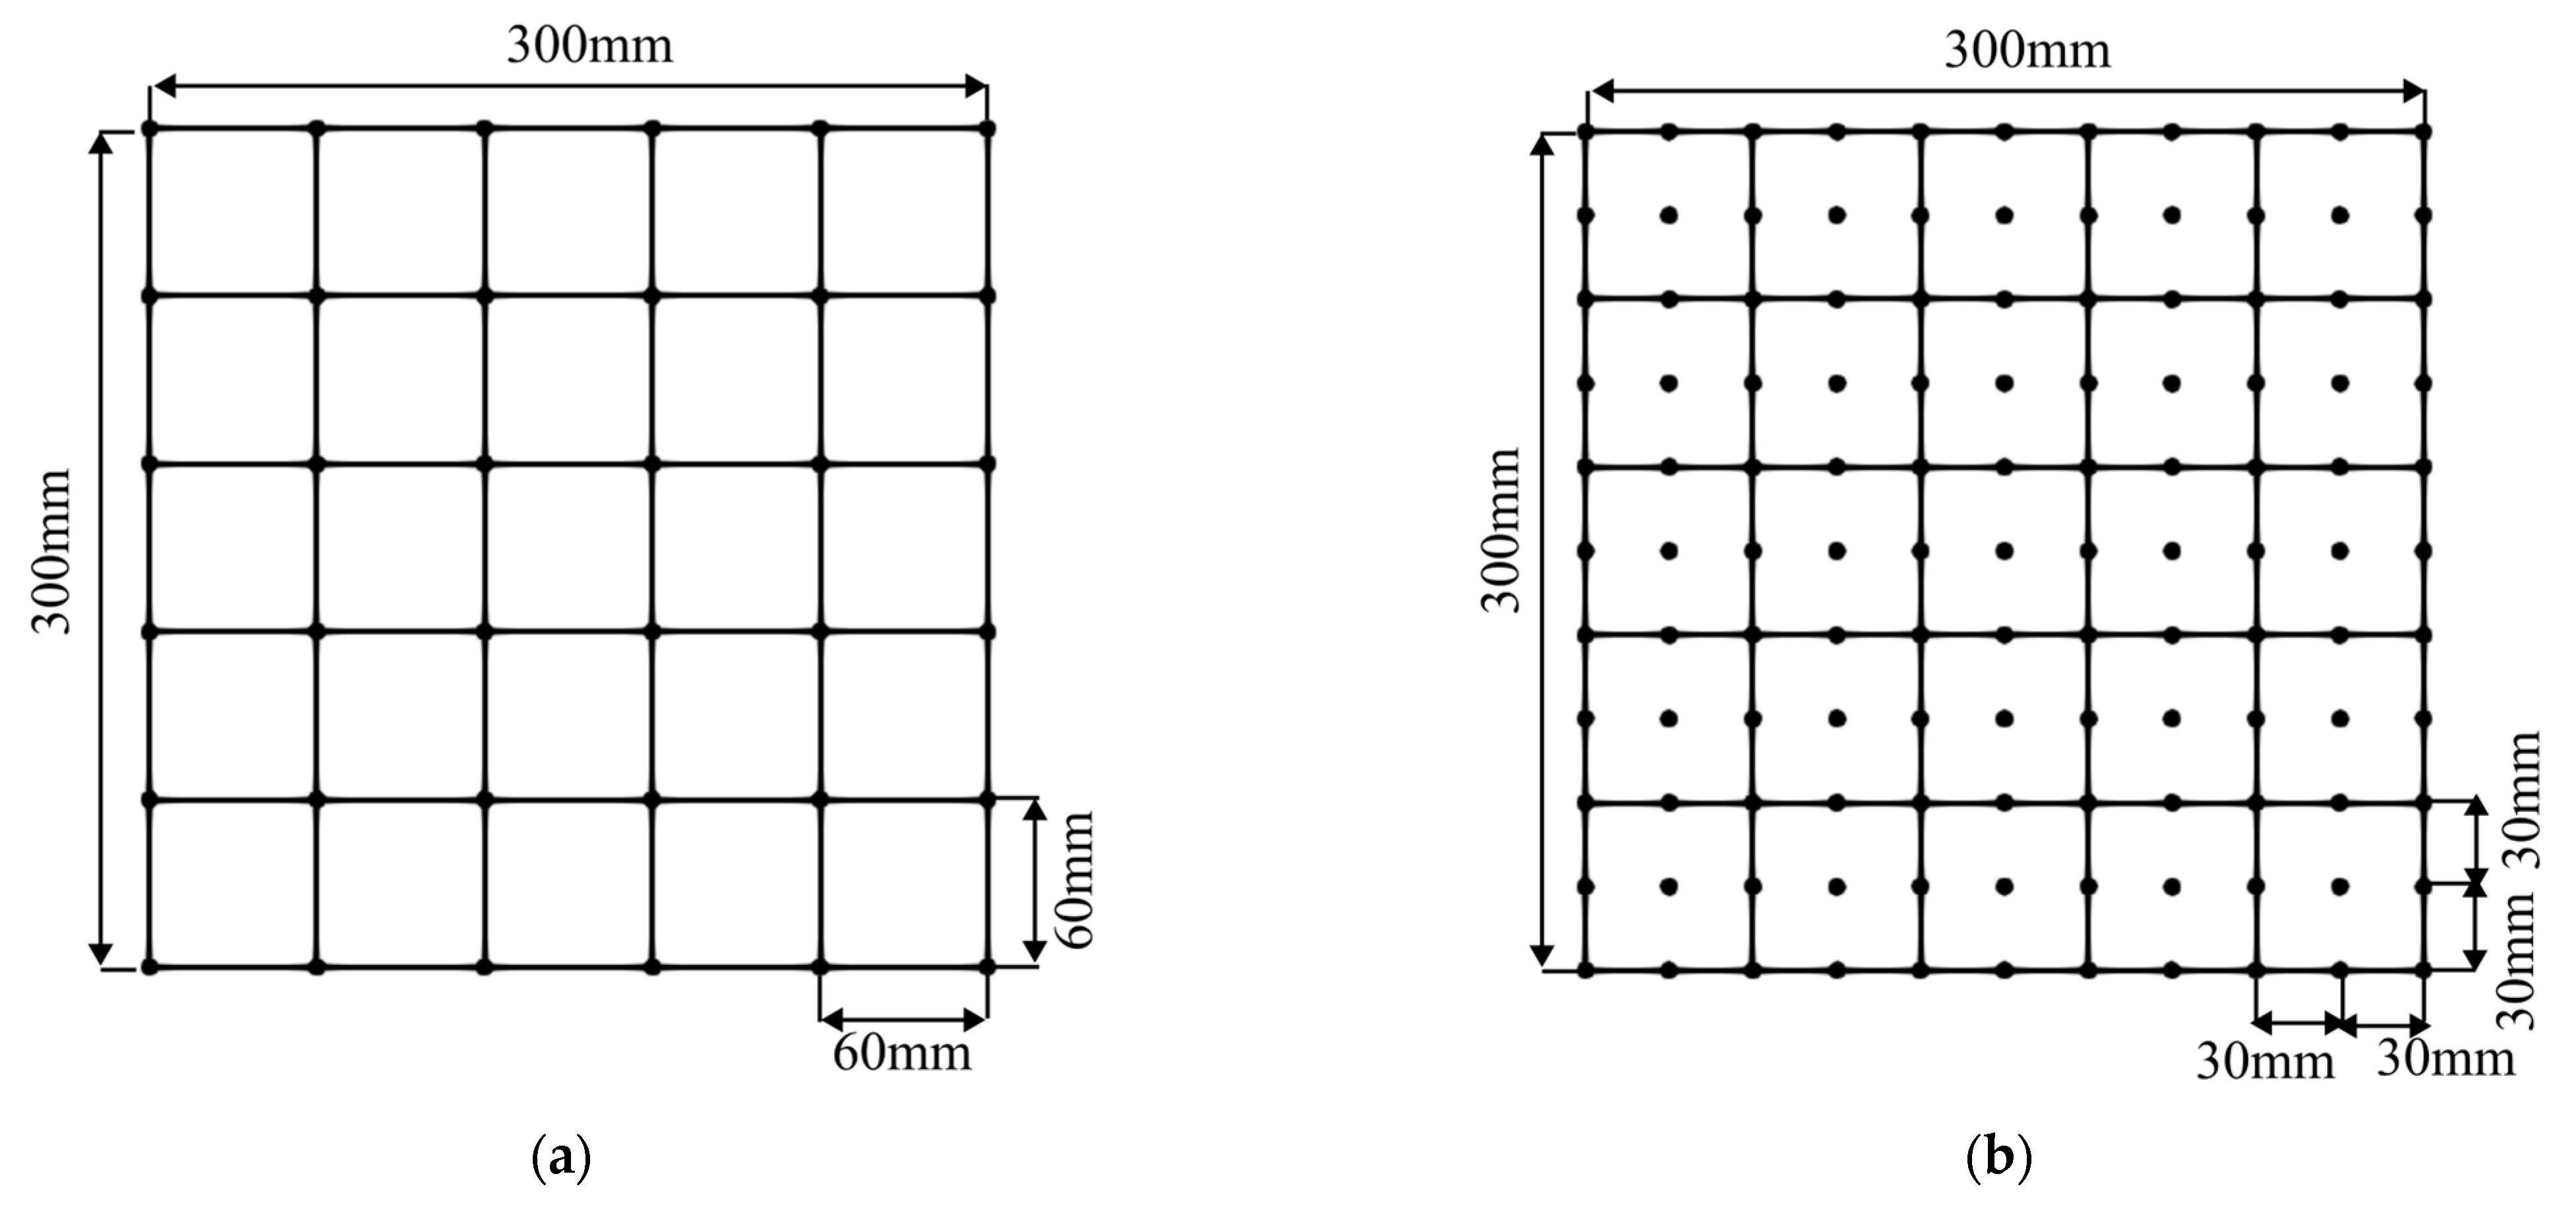
Analysis models used in AET are illustrated in Figure 8. The models are referred to as portions of the concrete plate and take the form of square regions with sensors installed around their perimeters. Each model consists of 25 cells. In Figure 8a, the candidates of sources are located at the nodes of the cells. On the other hand, in Figure 8b, additional candidates are installed between the nodes of the cells. Lagrange interpolation has been performed to localize the source between the candidates; thus, it is expected that minimizing the interval contributes to the accurate identification of the velocity distributions. In this model test, this expected performance is validated using measured waves. Further, a soundness velocity distribution is generally used for the initial velocity distribution in AET. Hence, the homogeneous velocity distribution 4000 m/s is initially applied to the models.
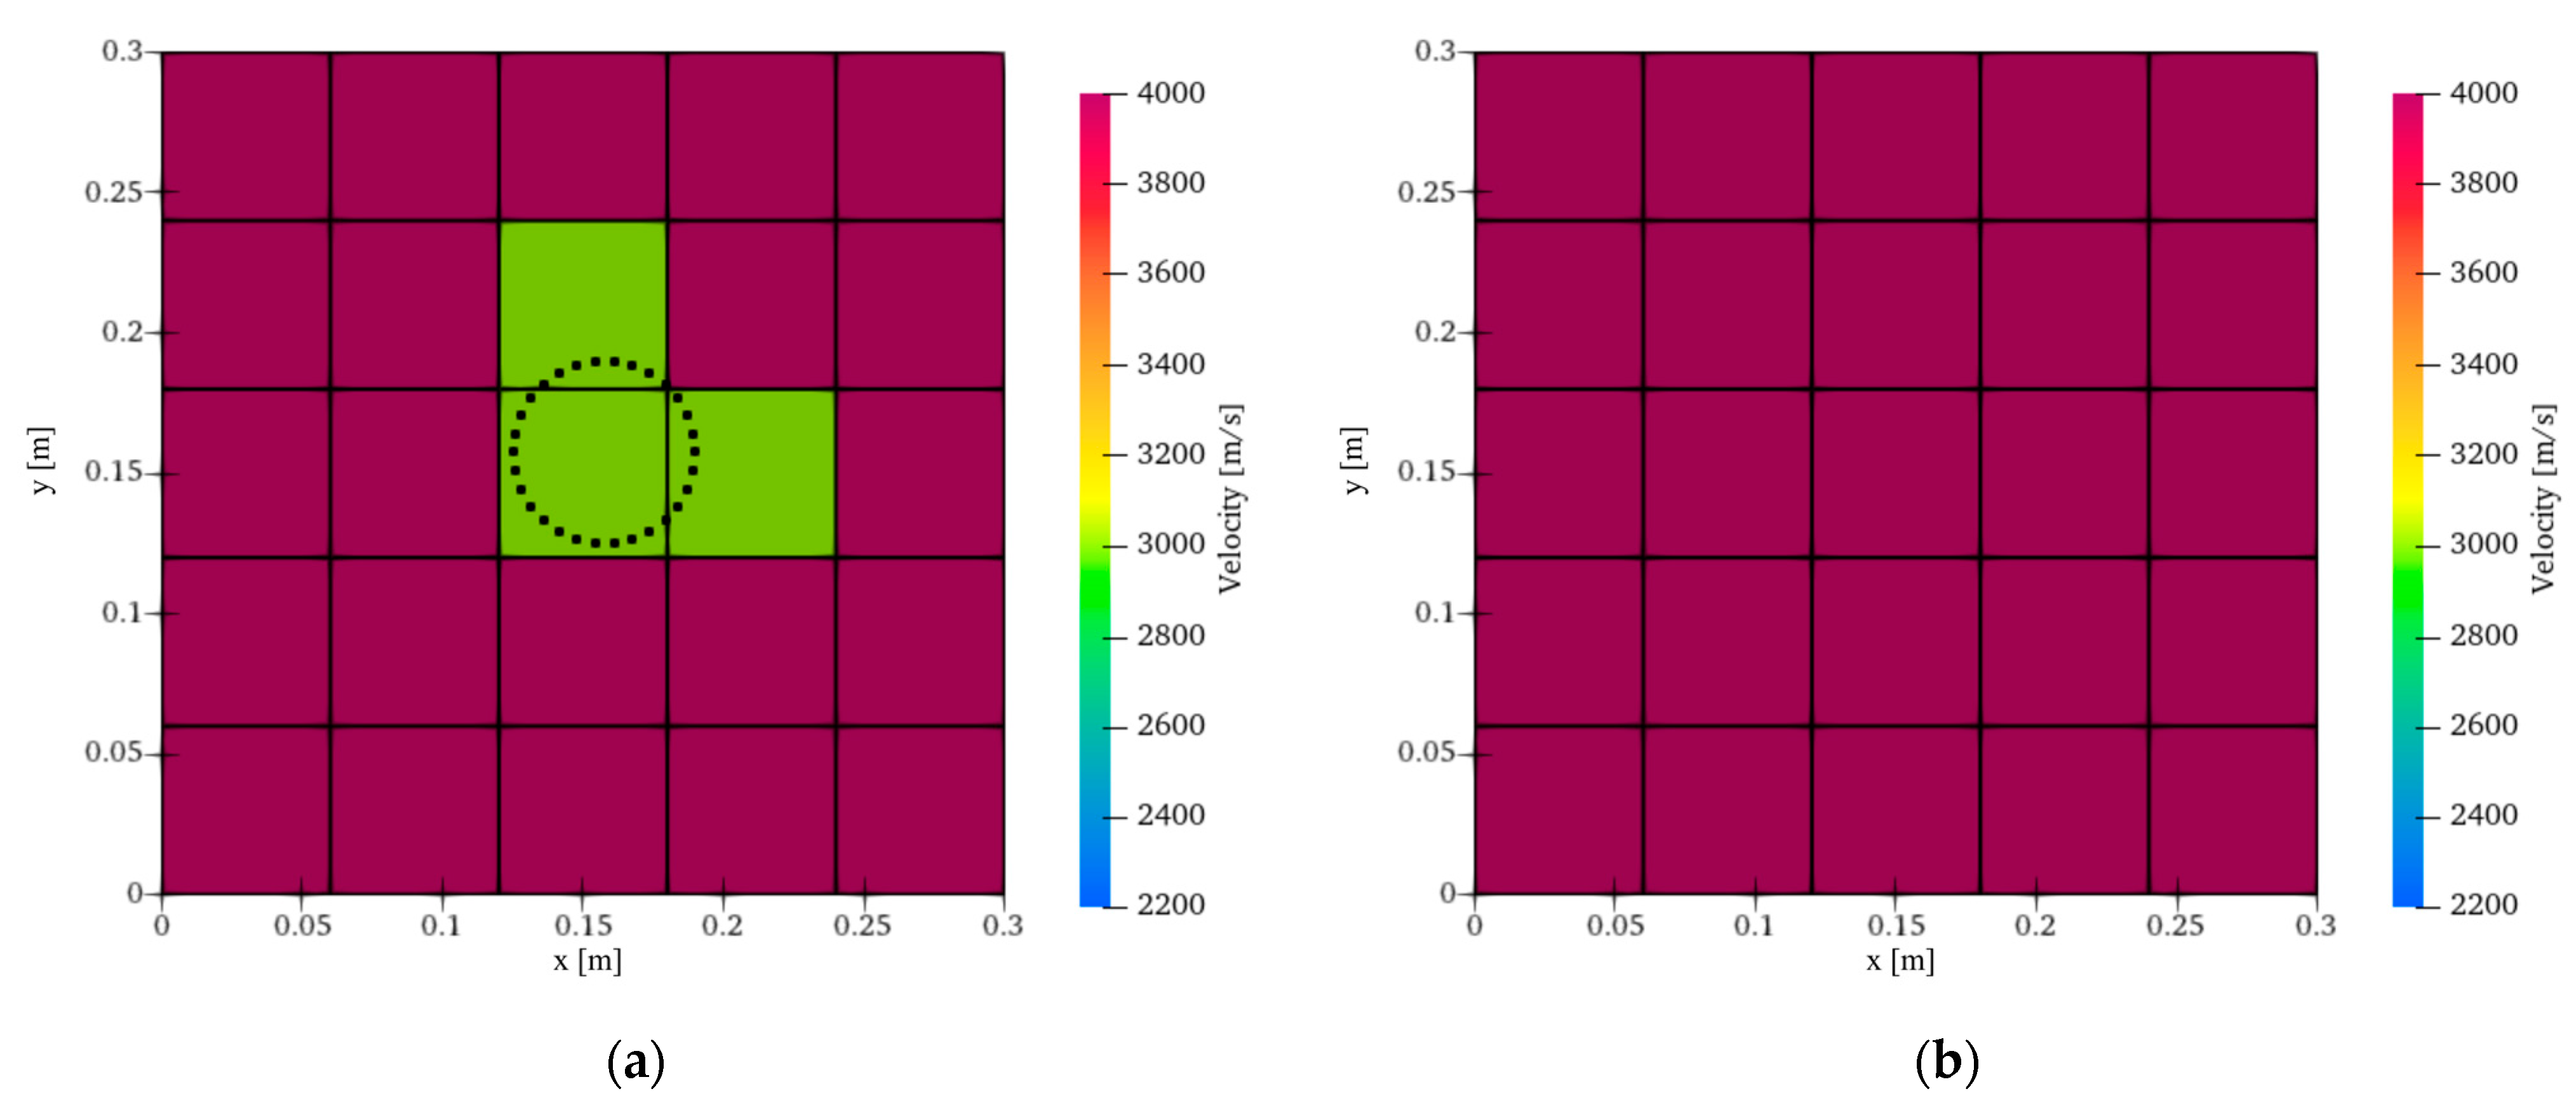
The percentage velocity error has been used to assess the accuracy of the velocity distribution identified using EWT [7]. In order to quantitatively validate the performance of AET, percentage velocity errors are computed using the identified velocity distributions and the estimated velocity distributions. In the estimated velocity distributions shown in Figure 9, the velocity of sound in concrete is 4000 m/s. In contrast, the defect velocity is assumed to be 3000 m/s since the velocity in heterogeneous concrete has been identified as approximately 3000 m/s in previous studies [5,16]. The defect cells correspond to the defect location illustrated by the circle in Figure 9a. Moreover, if the identified velocity distribution is accurate, it is expected to closely resemble the estimated distribution. Furthermore, low percentage errors indicate a small discrepancy between the results and the estimated velocity distribution, suggesting that the identified distribution closely matches the estimated one.

4. Results

4.1. Identification of the Defect Area

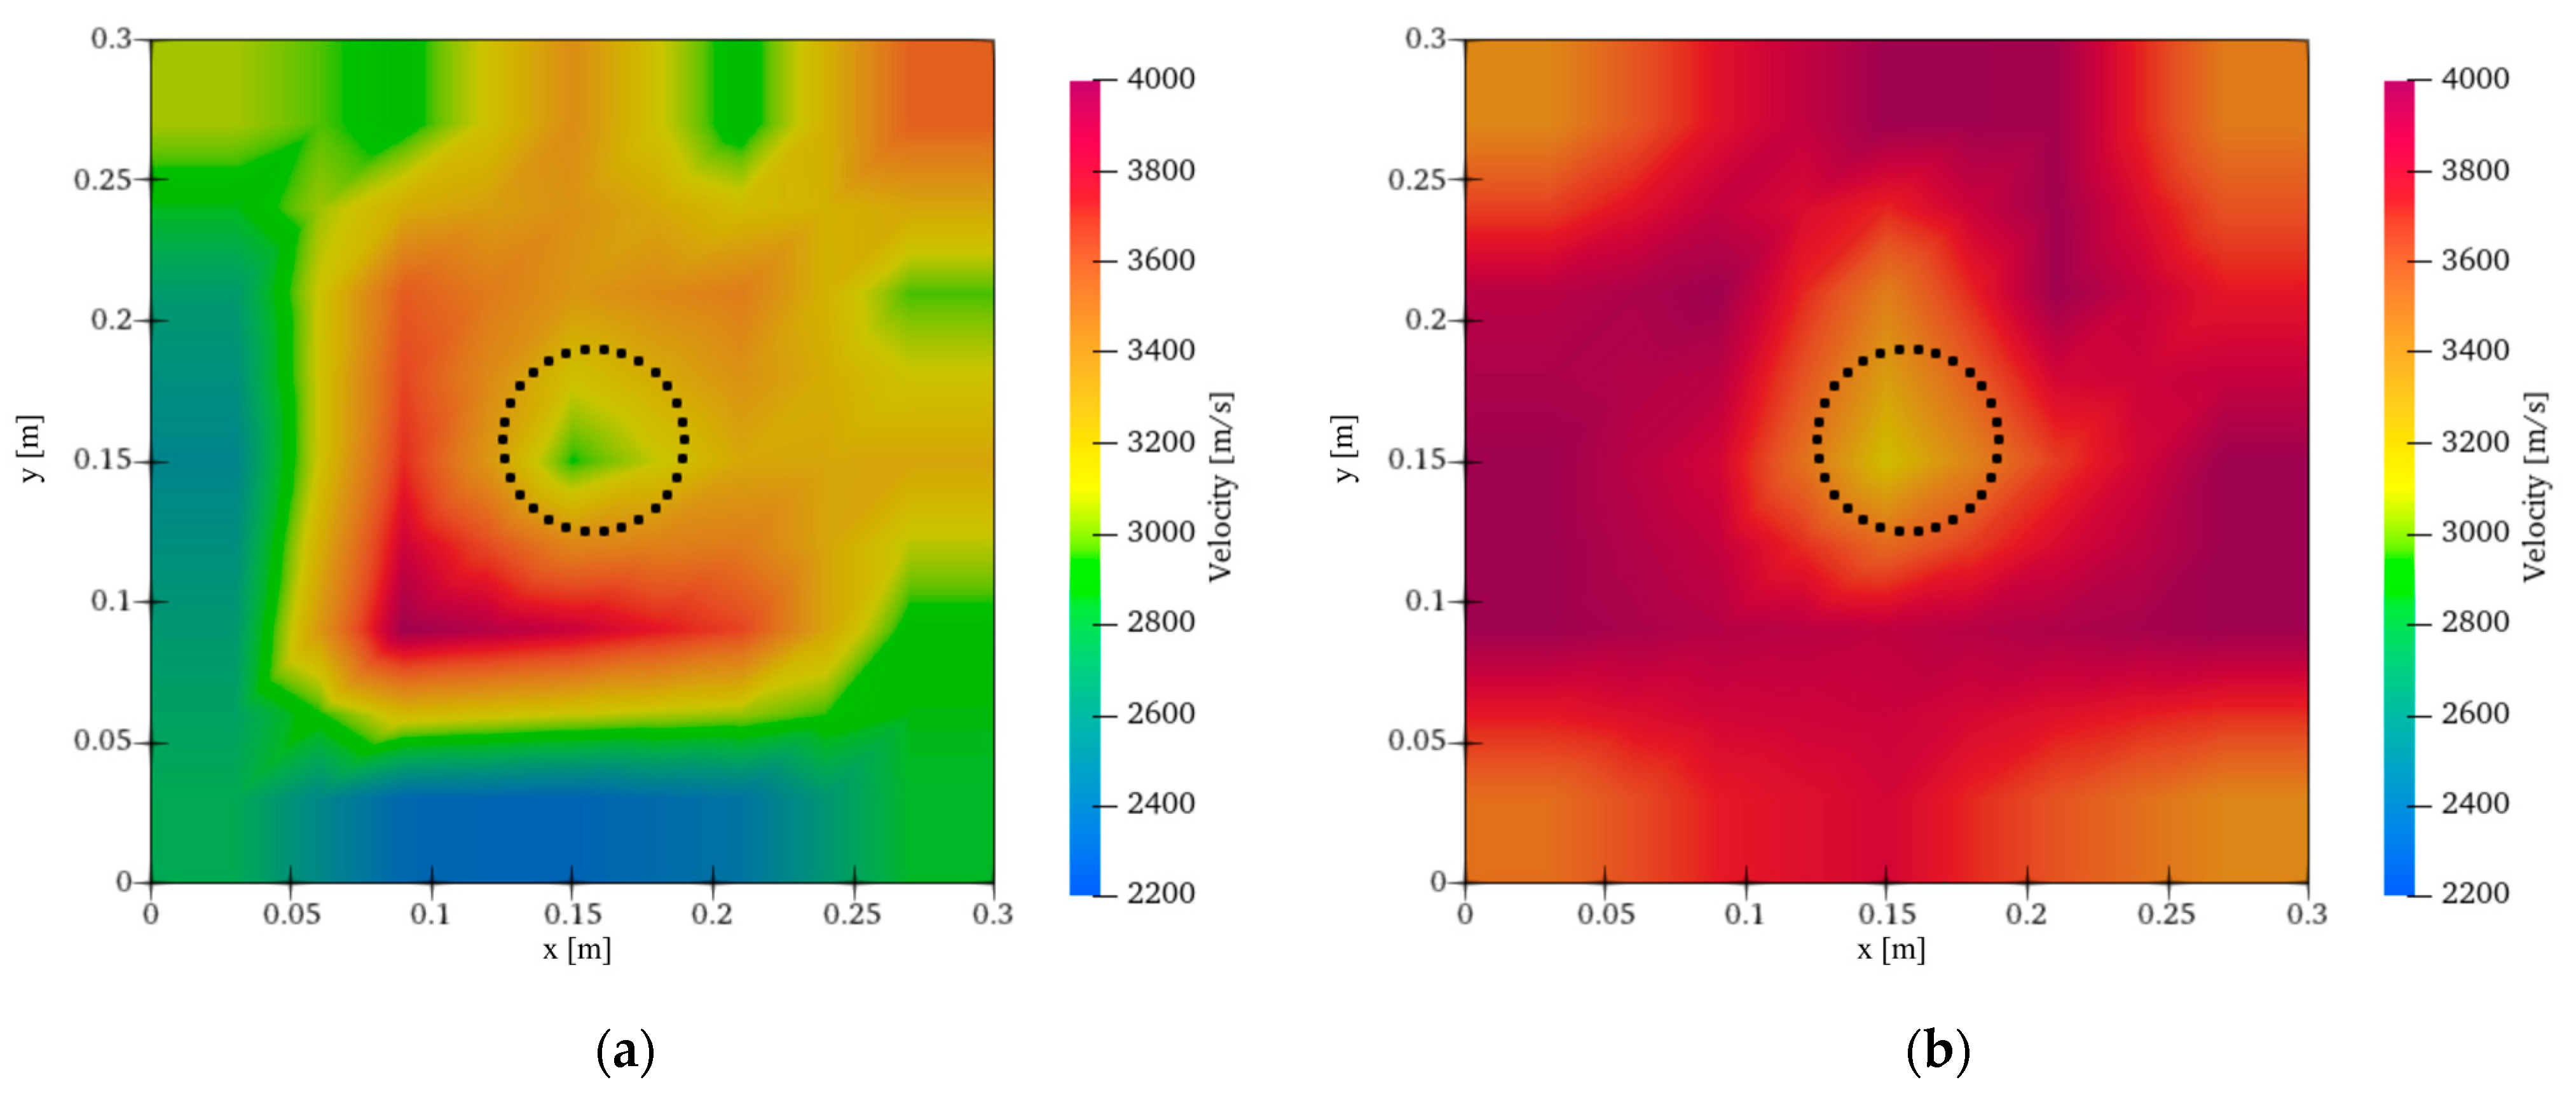
The identified velocity distributions using the candidate interval of 60 mm are shown in Figure 10. Further, the circle illustrated in the identified velocity distribution indicates the location of the defect. In the results of conventional AET shown in Figure 10a, regions of low velocity appear even in undamaged cells. On the other hand, the low velocity distributions identified in the undamaged cells are improved in the results of the application of Lagrange Interpolation, shown in Figure 10b. Moreover, in Figure 10b, the highlighted low velocity region, shown in yellow, corresponds to the defect area. Therefore, these results confirm that applying Lagrange interpolation improved the identified velocity distribution even with a coarse candidate interval.
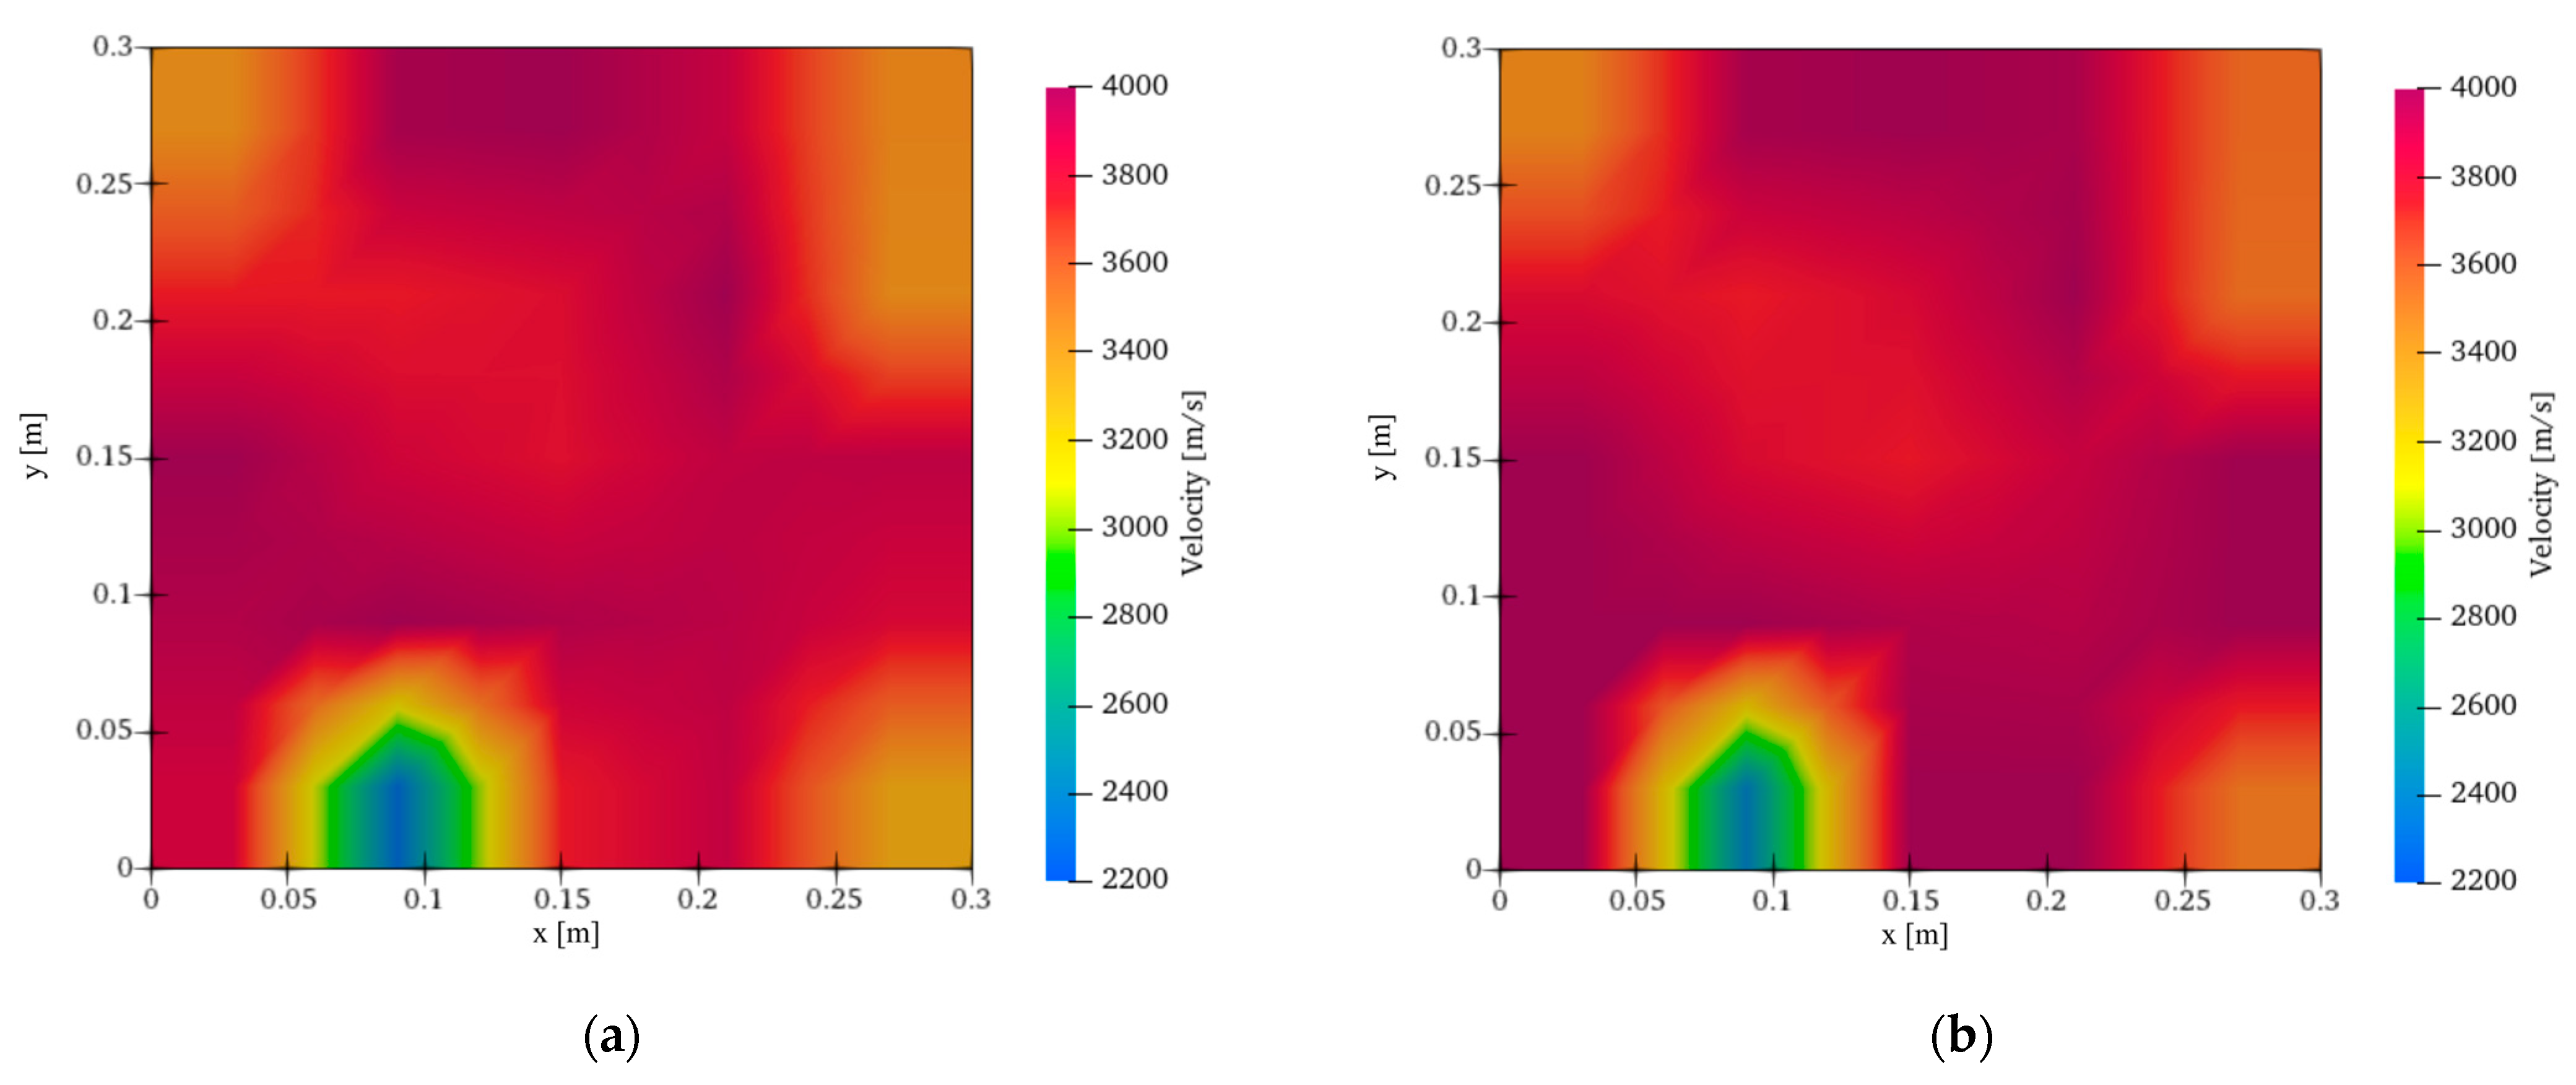
Figure 11 shows the identified velocity distributions obtained using a candidate interval of 30 mm. According to Figure 11a,b, both results identified the defect location more clearly than those in Figure 10a,b. In the previous study of AET [10], reducing the candidate interval contributed to the improvement in the identification of the velocity distributions since the localized sources were closer to the original elastic wave sources. Moreover, if the candidate interval is reduced, the vertex of the Lagrange interpolation output representing the localized source is expected to be closer to the elastic wave sources. In this model test, the above improvements are confirmed with measured waves. Furthermore, these results indicate that a tighter candidate interval enhances velocity distribution identification in both conventional AET and Lagrange interpolation.
The percentage velocity errors are shown in Table 2. According to Table 2, the percentage velocity error of the case “L60D” is 8.4%, which is low compared to the case “C60D”, which had an error of 25%. Moreover, the case “L60D” was able to visualize the defect using 36 candidates. In contrast, case “C30D” required 121 candidates to detect the defect. This confirms that the application of Lagrange interpolation was able to identify a practical velocity distribution using only about 30% of the candidates required by case C30D.
In the cases “C30D” and “L30D”, the percentage velocity error of the case “C30D” is smaller than that of the case “L30D”. However, both errors are approximated, suggesting that the limited performance of Lagrange interpolation may be due to the 30 mm interval. This limitation is considered to have occurred due to measurement errors and differences between the analysis model and the actual concrete plate. In the arrival time detection, although AIC-picker generally detects the point at which the significant amplitude differences occur in the measured waveform, the detected points may not correspond to the original arrival times if the measured amplitude is attenuated. Thus, localization errors may occur due to detection errors. Furthermore, although the installed sensors are assumed to be point sensors in the analysis model, they actually measure waves over a surface area. The installed sensors have a diameter of 19 mm, and the localized sources in the application of Lagrange interpolation may include errors of approximately this size. Moreover, ray-tracing localizes the sources with errors whose average is approximately half of the interval between candidates [34]. Thus, the identification results are not expected to show significant differences, as the localization accuracy using Lagrange interpolation is comparable to that of conventional localization.

4.2. Identification of Undamaged Area

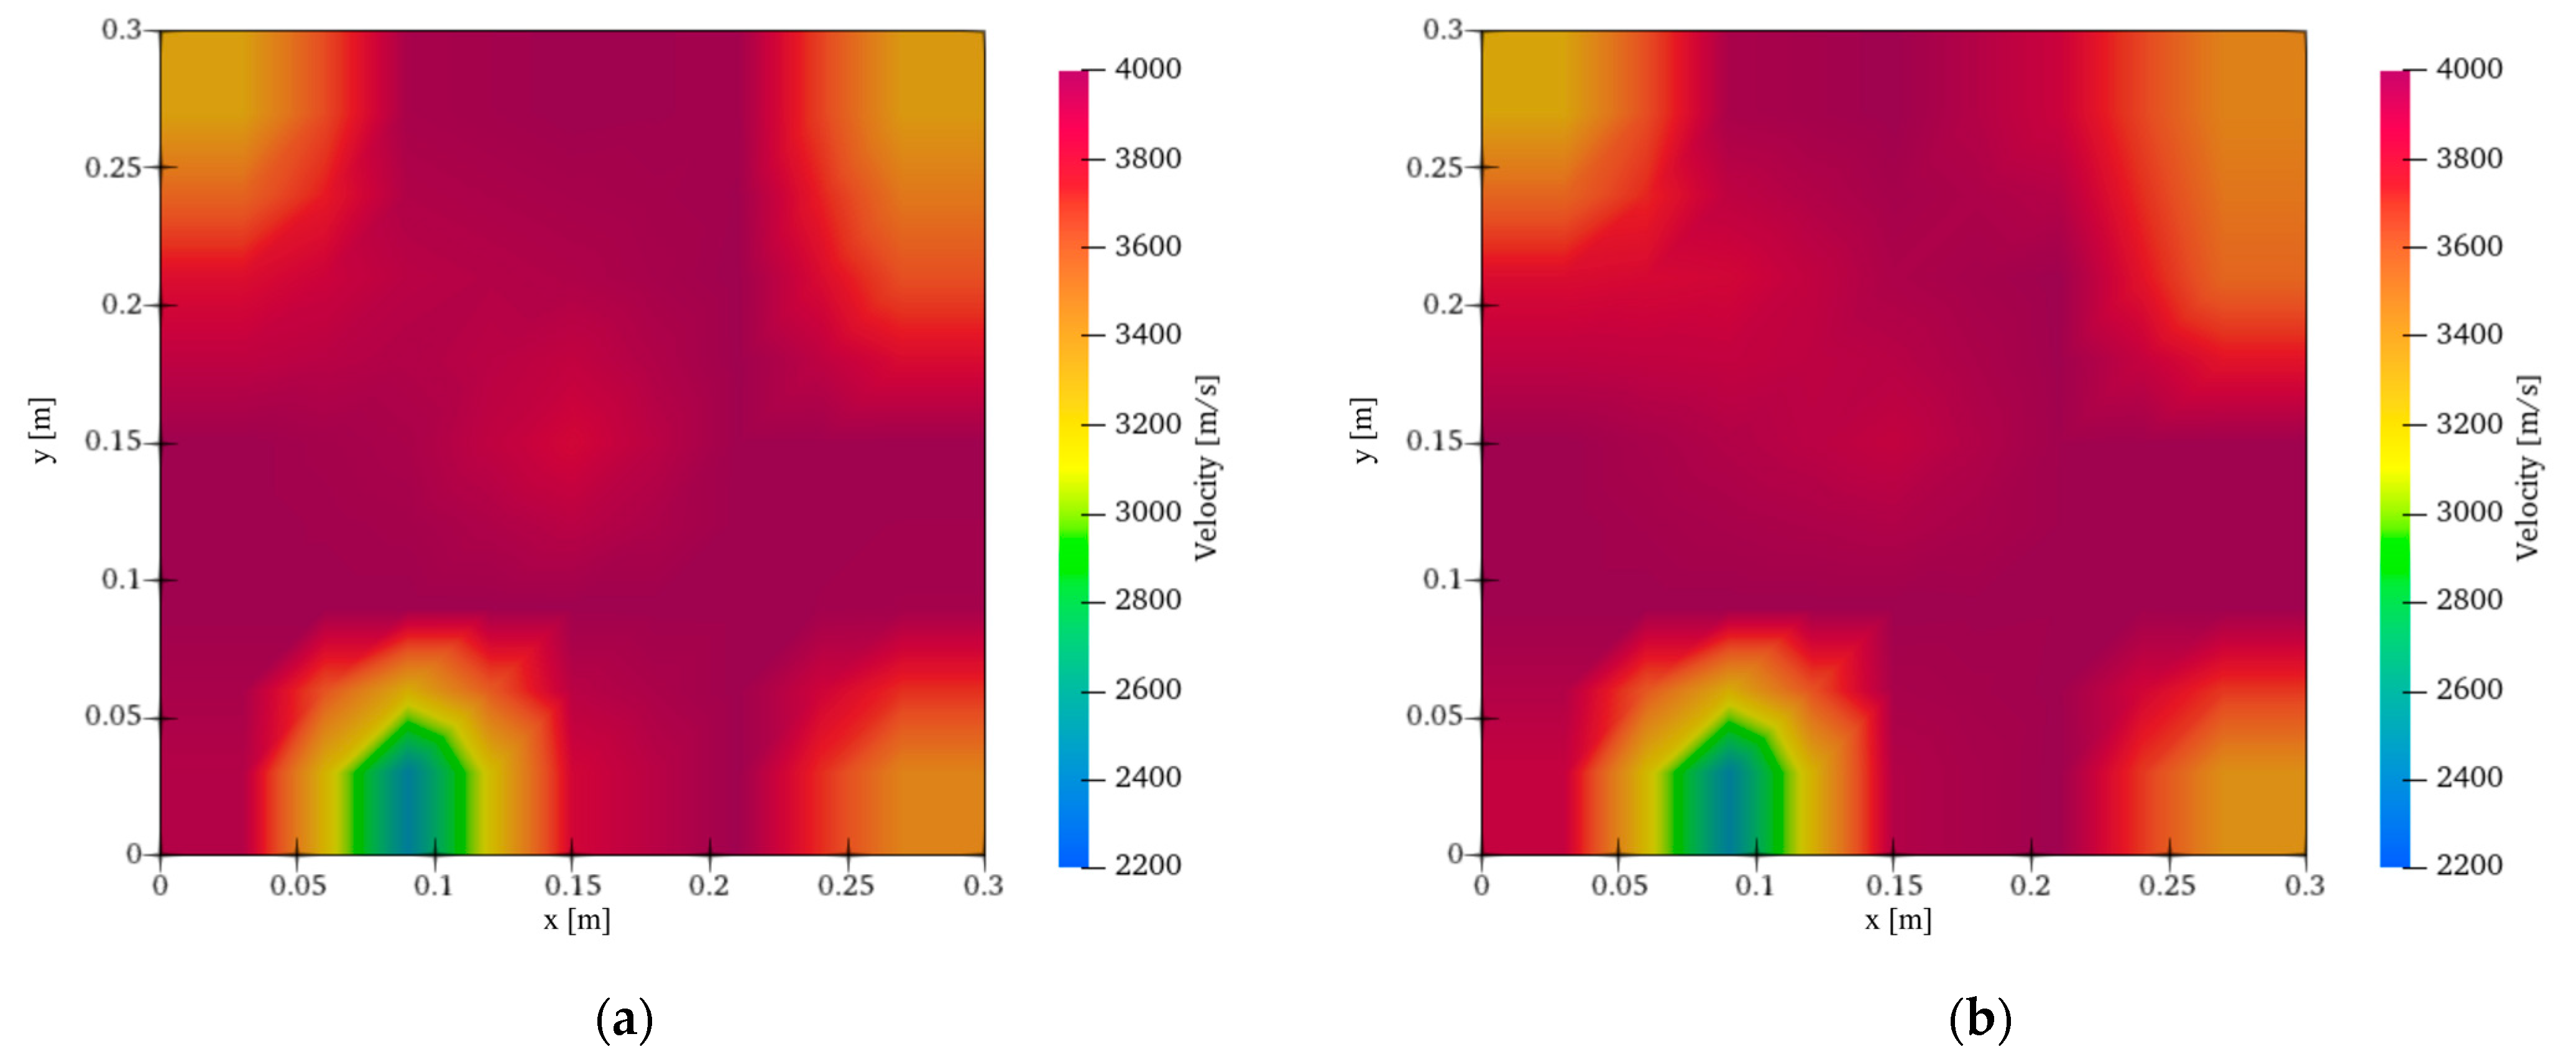
The results of AET are obtained in the undamaged area. Moreover, the identified velocity distributions using the candidate interval of 60 mm are shown in Figure 12. The result of the Lagrange interpolation shown in Figure 12b approximates the result of conventional AET shown in Figure 12a. Furthermore, although the defect is emphasized by the low velocity in Figure 10b, the defect is not identified in Figure 12b. Thus, the identified velocity distribution based on Lagrange interpolation is confirmed to contribute to the visualization of both defect and undamaged areas. However, the low velocity is identified at the bottom of the analysis model, which is considered an error in the identified velocity distribution. The error is also identified in the results using a 30 mm interval, as shown in Figure 13a,b. The identified distribution shown in Figure 13a,b is not significantly different from Figure 12a,b.
The percentage velocity errors obtained from the undamaged area also indicated that no significant differences were observed. These errors are summarized in Table 3. According to Table 3, all of the percentage velocity errors are approximately 10%. The application of Lagrange interpolation identifies similar velocity distributions to those of the conventional method. Thus, it is noted that the application of Lagrange interpolation does not contribute to the occurrence of the error located at the bottom of the model.
In the previous tomography analyses [5,8], identification errors were observed near the sensor locations. Hence, these errors are considered to be caused by the characteristics of the tomography algorithm. Within this framework, travel time errors significantly affect the accuracy of the identification if the lengths of ray-paths are short. Therefore, the travel time error in the wave generated by a PLB point located near the sensor leads to the misidentification of a low velocity.

5. Discussion

Based on the results presented in Section 4, the following points are discussed.
According to the results of the PLB tests, the number of events used in AET is not the same as the number of PLB points. The number of events was determined using Equation (7). In this model test, if all arrival times satisfied this equation, they were classified as a signal event. In applying AET to structural health monitoring, the number of events tends to be reduced due to the difficulty of accurate arrival time detection. Thus, if the number of events used is significantly lower than the number of generated sources, events that do not contain all arrival times should also be used. In this validation, the number of the ray-paths is 16 sensors × 159 events. According to tomography techniques, the number of ray-paths is the number of equations used in inverse analysis, while the number of cells is the number of parameters. Therefore, the number of events is sufficient in this validation since the number of ray-paths is larger than the 25 cells used in the analysis model.
The validity of Lagrange interpolation applied in AET has not been examined using concrete specimens. According to the results of the model test, the application of Lagrange interpolation identified the defect in the concrete plate using measured waves. These findings suggest that AET incorporating Lagrange interpolation can be applied to practical problems and may contribute to structural health monitoring of concrete structures. Moreover, the analysis of AET using measured waves is not sufficiently reported. These results are expected to contribute to advancing the field of structural health monitoring using AET.
In improving computational resources for AET, the application of Lagrange interpolation may not reduce candidates in the 30 mm interval. However, the application can identify the distribution using a smaller number of candidates compared to conventional AET. These results indicate that Lagrange interpolation does not compromise the accuracy of AET under realistic conditions. Therefore, it should be applied to AET, as it reduces computational resource demands compared to the conventional method. Furthermore, in this validation, the number of candidate points used was 36 and 121. According to the ray-trace algorithm, if ray-tracing is performed from one candidate to 120 points, a total of 120 × 121 straight paths are computed. These paths are stored as 8-byte double-precision values, resulting in a data size of 116,160 bytes. In contrast, when 36 points are used in the analysis model, the data size is 10,080 bytes. This confirms that the computational resource demand is reduced to approximately one-tenth when Lagrange interpolation is applied to AET. It should be noted that these values are approximate and may vary depending on the implementation of the computational program.
In the results of AET obtained from the undamaged area, the identification error was confirmed around the sensors. If AET is applied to structural health monitoring of concrete structures, the identification errors are considered to lead to misdiagnosis. Although this was addressed in Section 4, the low velocity errors are considered to be caused by the small distance from the sources to the sensors, and they are expected to be identified around the sensors. Therefore, if a low velocity appears in the cell in which the sensor is installed, it should be considered a likely error. To validate whether a low velocity anomaly reflects a true defect, the analysis area should be adjusted within the same specimen to include the suspected region. If the anomaly consistently appears at the same location across multiple identification results, it may indicate a real defect. Conversely, if the anomaly occurs inconsistently, it is more likely due to measurement error, which tends to be irregular. Furthermore, improving the accuracy of arrival time detection may help prevent low velocity errors, as it directly affects travel time estimation in AET. In the previous study [27], artificial AE was classified based on unsupervised learning methods to be applied for accurate source localizations. If the measured waves in which accurate arrival times can be detected are classified based on unsupervised learning methods, detection errors are expected to be reduced by using the classified waves.
For future considerations, narrowly composited reinforcement should be considered. In studies on the impact–echo method, the relationship between reflection phenomena and material heterogeneities has been investigated based on finite element method (FEM) simulations [35]. According to this study, half the wavelength corresponds to the size of the defect. The frequency of elastic waves generally used in tomography techniques is lower than the radius of the reinforcement. It is noteworthy that this mechanism may also explain the tendency to ignore the boundaries of coarse aggregates. Therefore, it is expected that elastic waves can penetrate reinforced concrete structures. Moreover, Lagrange interpolation should be validated for narrowly composited steel under low-frequency conditions.
In addition, complex structural geometries should be validated. In tomography techniques, the shape of analysis cells is not limited to rectangles; triangular cells are also employed [16]. This suggests that the analytical model has the potential to adapt to various target geometries. Thus, Lagrange interpolation should be validated for different cell types.

6. Conclusions

In order to validate the application of Lagrange interpolation to AET for optimizing computational resources, the velocity distribution of the concrete plate was identified using measured waves. The conclusions obtained from the model test are listed as follows.
  • AET implementing Lagrange interpolation identified the defect and the undamaged area based on the identified velocity distribution. These results indicated that AET implementing Lagrange interpolation could be applied to the actual phenomenon.
  • Although conventional AET requires 121 candidates to visualize the defect, AET implementing Lagrange interpolation requires 36 candidates to visualize it. Therefore, in this model test, it was noted that the application of Lagrange interpolation identified the practical velocity distribution using a number of candidates using only about 30% of the candidates required by the conventional AET analysis.
  • If the candidate interval of 30 mm was used in the application of Lagrange interpolation, the identified velocity distribution is approximated as the result of conventional AET. These results confirmed that Lagrange interpolation may not contribute to improving the identified velocity distribution if the interval of 30 mm was used.
  • In the results of AET obtained from the undamaged area, the low velocity errors were identified around the sensors. It is expected that the low velocity errors can be confirmed if additional AET analyses are conducted in a relocated analysis area or if accurate arrival times are applied.
For future considerations, the application of Lagrange interpolation should be validated in narrowly composited steel and alternative cell types to advance structural health monitoring.

Author Contributions

Conceptualization, K.N.; methodology, K.N.; software, K.N.; validation, K.N.; formal analysis, K.N.; investigation, K.N., Y.K., M.F., K.O. and S.S.; resources, Y.K. and K.O.; data curation, K.N.; writing—original draft preparation, K.N.; writing—review and editing, Y.K., M.F., K.O. and S.S.; visualization, K.N. All authors have read and agreed to the published version of the manuscript.

Funding

This work was supported by JSPS KAKENHI Grant Number 24K07665.

Institutional Review Board Statement

Not applicable.

Informed Consent Statement

Not applicable.

Data Availability Statement

The original contributions presented in this study are included in the article. Further inquiries can be directed to the corresponding author.

Conflicts of Interest

The authors declare no conflicts of interest.

References

  1. Shigeishi, M.; Colombo, S.; Broughton, K.J.; Rutledge, H.; Batchelor, A.J.; Forde, M.C. Acoustic emission to assess and monitor the integrity of bridges. Constr. Build. Mater. 2001, 15, 35–49. [Google Scholar] [CrossRef]
  2. Liu, R.; Li, S.; Zhang, G.; Jin, W. Depth detection of void defect in sandwich-structured immersed tunnel using elastic wave and decision tree. Constr. Build. Mater. 2021, 305, 124756. [Google Scholar] [CrossRef]
  3. Usui, T.; Ueda, Y.; Takamine, H.; Watabe, K.; Shiotani, T. Continuous Health Monitoring of Reinforced Concrete Bridge Deck based on Traffic Load-induced Acoustic Emission. In Proceedings of the 36th Conference of the European Working Group on Acoustic Emission, Potsdam, Germany, 18–20 September 2024; Volume 29. [Google Scholar] [CrossRef]
  4. Hashimoto, K.; Shiotani, T.; Nishida, T.; Miyagawa, T. Application of Elastic-Wave Tomography to Repair Inspection in Deteriorated Concrete Structures. J. Disaster Res. 2017, 12, 496–505. [Google Scholar] [CrossRef]
  5. Perlin, L.P.; de Andrade Pinto, R.C. Use of network theory to improve the ultrasonic tomography in concrete. Ultrasonics 2019, 96, 185–195. [Google Scholar] [CrossRef] [PubMed]
  6. Sassa, K. Suggested for seismic testing within and between boreholes. Int. J. Rock Mech. Min. Sci. Geomech. Abstr. 1988, 25, 447–472. [Google Scholar] [CrossRef]
  7. Sanny, T.A.; Sassa, K. Detection of fault structure under a near-surface low velocity layer by seismic tomography: Synthetics studies. J. Appl. Geophys. 1996, 35, 117–131. [Google Scholar] [CrossRef]
  8. Schubert, F. Basic principles of acoustic emission tomography. J. Acoust. Emiss. 2024, 22, 147–158. [Google Scholar]
  9. Kobayashi, Y.; Shiotani, T. Computerized AE Tomography, Innovative AE and NDT Techniques for On-Site Measurement of Concrete and Masonry Structures: State-of-the-Art Report of the RILEM Technical Committee 239-MCM, 1st ed.; Ohtsu, M., Ed.; Springer: Dordrecht, The Netherlands, 2016; pp. 47–68. [Google Scholar]
  10. Kobayashi, Y.; Nakamura, K.; Oda, K. New algorithm of Acoustic Emission Tomography that considers change of emission times of AE events during identification of elastic wave velocity distribution. In Proceedings of the 11th International Conference on Bridge Maintenance, Safety and Management, Barcelona, Spain, 11–15 July 2022. [Google Scholar]
  11. Okude, N.; Shiotani, T.; Nishida, T.; Hashimoto, K.; Furuno, S. Evaluation of Crack Repair Effect for RC Slab Using AE Tomography. Proceedings 2018, 2, 433. [Google Scholar] [CrossRef]
  12. Cheng, Y.; Hagan, P.; Mitra, R.; Wang, S.; Yang, H.-W. Experimental Investigation of Progressive Failure Processes Using 3D Acoustic Emission Tomography. Front. Earth Sci. 2021, 9, 765030. [Google Scholar] [CrossRef]
  13. Kundu, T. Acoustic source localization. Ultrasonics 2014, 54, 25–38. [Google Scholar] [CrossRef]
  14. Manuello, A.; Gianni, N.; Carpinteri, A. AE monitoring of a concrete arch road tunnel: Damage evolution and localization. Eng. Fract. Mech. 2019, 210, 279–287. [Google Scholar] [CrossRef]
  15. Rodríguez, P.; Celestino, T.B. Assessment of damage distribution in brittle materials by application of an improved algorithm for three-dimensional localization of acoustic emission sources with P-wave velocity calculation. Constr. Build. Mater. 2020, 231, 117086. [Google Scholar] [CrossRef]
  16. Sagradyan, A.; Ogura, N.; Shiotani, T. Application of elastic wave tomography method for damage evaluation in a large-scale reinforced concrete structure. Dev. Built Environ. 2023, 14, 100127. [Google Scholar] [CrossRef]
  17. Xie, C.; Yuan, L.; Zhao, M.; Jia, Y. Study on failure mechanism of porous concrete based on acoustic emission and discrete element method. Constr. Build. Mater. 2020, 235, 117409. [Google Scholar] [CrossRef]
  18. Song, Z.; Li, S.; Cheng, L.; Yu, Q. Corrosion-induced deterioration and fracture mechanisms in ultra-high-performance fiber-reinforced concretet. Constr. Build. Mater. 2024, 423, 135886. [Google Scholar] [CrossRef]
  19. Nie, Q.; Liu, H.; Ma, T.; Cui, H. Experimental study on acoustic emission of steel fiber broken pebble recycled concrete. Constr. Build. Mater. 2024, 452, 138942. [Google Scholar] [CrossRef]
  20. Nakamura, K.; Furukawa, M.; Oda, K.; Shigemura, S.; Kobayashi, Y. Implementation of lagrange interpolation for optimization of computational resource used in ae tomography. In Proceedings of the 12th Annual Conference of Society for Structural Integrity and Life (DIVK12), Belgrade, Serbia, 17–19 November 2024. [Google Scholar]
  21. Sassa, K.; Ashida, Y.; Kozawa, T.; Yamada, M. Improvement in the accuracy of seismic tomography by use of an effective ray-tracing algorithm. In Proceedings of the MMIJ/IMM JOINT SYMPOSIUM, Today’s Technology for the Mining and Metallurgical Industries, Kyoto, Japan, 2–4 October 1989; pp. 129–136. [Google Scholar]
  22. JIS A 5372:2016; Precast Reinforced Concrete Products. Japanese Standards Association: Tokyo, Japan, 2016.
  23. Tian, H.; Qiang, P.; Xiandong, L.; Yingchun, S. AE beamforming method for damage inspection of aircraft structures. Procedia Eng. 2011, 17, 297–302. [Google Scholar] [CrossRef]
  24. Xiao, D.; He, T.; Pan, Q.; Liu, X.; Wang, J.; Shan, Y. A novel acoustic emission beamforming method with two uniform linear arrays on plate-like structures. Ultrasonics 2014, 54, 737–745. [Google Scholar] [CrossRef]
  25. Mirgal, P.; Pal, J.; Banerjee, S. Online acoustic emission source localization in concrete structures using iterative and evolutionary algorithms. Ultrasonics 2020, 108, 106211. [Google Scholar] [CrossRef]
  26. Physical Acoustics Corporation. AEwin Software User’s Manual, Express-8 AE System; Physical Acoustics Corporation: Princeton Junction, NJ, USA, 2014. [Google Scholar]
  27. Nakamura, K.; Kobayashi, Y.; Oda, K.; Shigemura, S. Application of Classified Elastic Waves for AE Source Localization Based on Self-Organizing Map. Appl. Sci. 2023, 13, 5745. [Google Scholar] [CrossRef]
  28. Akaike, H. A new look at the statistical model identification. IEEE Trans. Autom. Control. 1974, 19, 716–723. [Google Scholar] [CrossRef]
  29. Takanami, T.; Kitagawa, G. A new efficient procedure for the estimation of onset times of seismic waves. J. Phys. Earth 1988, 36, 267–290. [Google Scholar] [CrossRef]
  30. Ohno, K.; Uji, K.; Ueno, A.; Ohtsu, M. Fracture process zone in notched concrete beam under three-point bending by acoustic emission. Constr. Build. Mater. 2014, 67, 139–145. [Google Scholar] [CrossRef]
  31. Jones, M.R.; Rogers, T.J.; Worden, K.; Cross, E.J. A Bayesian methodology for localising acoustic emission sources in complex structures. Mech. Syst. Signal Process. 2022, 15, 108143. [Google Scholar] [CrossRef]
  32. Tatsumi, E.; Nakata, Y.; Kawatani, S. Study on method for estimating compressive strength of concrete by impact elastic wave: Influence of variations of concrete materials and mix proportions on elastic wave velocity. J. Struct. Constr. Eng. 2005, 587, 15–21. (In Japanese) [Google Scholar] [CrossRef]
  33. Qixian, L.; Bungey, J.H. Using compression wave ultrasonic transducers to measure the velocity of surface waves and hence determine dynamic modulus of elasticity for concrete. Constr. Build. Mater. 1996, 10, 237–242. [Google Scholar] [CrossRef]
  34. Kobayashi, Y.; Oda, K.; Nakamura, K. A Source Localization Technique Based on a Ray-Trace Technique with Optimized Resolution and Limited Computational Costs. Proceedings 2018, 2, 477. [Google Scholar] [CrossRef]
  35. Martin, J.; Hardy, M.S.A.; Usmani, A.S.; Forde, M.C. Accuracy of NDE in bridge assessment. Eng. Struct. 1998, 20, 979–984. [Google Scholar] [CrossRef]
Figure 1. Example of an analysis model used in AET.
Applsci 15 08965 g001
Figure 2. Illustration of arrival times and travel times.
Applsci 15 08965 g002
Figure 3. Illustration of the source localization implementing Lagrange interpolation: (a) Source localized between candidates; (b) Location of the source in Lagrange interpolation.
Applsci 15 08965 g003
Figure 4. Flow of AET implementing Lagrange interpolation.
Applsci 15 08965 g004
Figure 5. Photographs of the concrete plate used in the model test and installed sensors: (a) Sensors installed in the defect area; (b) Sensors installed in the undamaged area.
Applsci 15 08965 g005
Figure 6. Illustrated analysis area of AET: (a) Defect area shown in the concrete plate; (b) Locations of sensors and the defect.
Applsci 15 08965 g006
Figure 7. Photograph of PLB test and Illustration of the source locations: (a) PLB test conducted on the concrete plate; (b) Source locations in the analysis area.
Applsci 15 08965 g007
Figure 8. Analysis models of AET used in the model test: (a) Candidate interval of 60 mm; (b) Candidate interval of 30 mm.
Applsci 15 08965 g008
Figure 9. Estimated velocity distributions: (a) Estimated defect area. The circle indicates the location of the defect; (b) Estimated undamaged area.
Applsci 15 08965 g009
Figure 10. Identified velocity distributions of defect area using the candidate interval of 60 mm. The circle indicates the location of the defect: (a) Results of conventional AET; (b) Results of application of Lagrange interpolation.
Applsci 15 08965 g010
Figure 11. Identified velocity distributions of defect area using the candidate interval of 30 mm. The circle indicates the location of the defect: (a) Results of conventional AET; (b) Results of application of the Lagrange interpolation.
Applsci 15 08965 g011
Figure 12. Identified velocity distributions of the undamaged area using the candidate interval of 60 mm: (a) Results of conventional AET; (b) Results of application of the Lagrange interpolation.
Applsci 15 08965 g012
Figure 13. Identified velocity distributions of the undamaged area using the candidate interval of 30 mm: (a) Results of conventional AET; (b) Results of application of the Lagrange interpolation.
Applsci 15 08965 g013
Table 1. Events applied to AET.
Analysis AreaNumber of PLB PointsNumber of Used Events
Defect area159159
Undamaged area168159
Table 2. Percentage velocity errors obtained from the defect area.
CaseMethodInterval of
Candidates [mm]
Number of
Candidates
Percentage Velocity
Error [%]
C60DConventional AET603625
L60DApplication of Lagrange Interpolation60368.4
C30DConventional AET301215.3
L30DApplication of Lagrange Interpolation301216.2
Table 3. Percentage velocity errors obtained from the undamaged area.
CaseMethodInterval of
Candidates [mm]
Number of
Candidates
Percentage Velocity
Error [%]
C60SConventional AET603610
L60SApplication of Lagrange Interpolation603610
C30SConventional AET3012111
L30SApplication of Lagrange Interpolation3012110
Disclaimer/Publisher’s Note: The statements, opinions and data contained in all publications are solely those of the individual author(s) and contributor(s) and not of MDPI and/or the editor(s). MDPI and/or the editor(s) disclaim responsibility for any injury to people or property resulting from any ideas, methods, instructions or products referred to in the content.