1. Introduction
Muons are produced by the interaction of cosmic rays with the atmosphere, characterized by high flux and strong penetrating power. In the Standard Model of particle physics, the muon is a fundamental particle and belongs to the constituents of matter. The mass of a muon exceeds that of the electron by a factor of 206. It is produced through the interaction of cosmic rays with the Earth’s atmosphere [
1], via the decay of pions. Both pions and kaons are particles produced in high-energy collisions. The former are the primary source of muons in the upper atmosphere, while the latter can also generate muons through decay. Muons born in the upper atmosphere hurtle toward the ground at near-light speeds. Due to their high velocity, their lifespan appears extended to ground observers: their original 2.2 microseconds, which would allow them to travel only about 660 m, stretches to several tens of microseconds, enabling them to cover tens of kilometers. Thus, they can traverse the vast atmospheric distance and ultimately reach the ground to be detected. Muons generated in the atmosphere reach the Earth’s surface in a shower-like distribution and have a very high flux. Among charged particles of cosmic rays at sea level, muons exhibit the highest flux, with an average flux significantly higher than that of other particles [
2]. Cosmic ray muons span a wide energy range, from several hundred million electron volts (MeV) to teraelectron volts (TeV). Moreover, muons possess strong penetrating power, with a small cross-section for interactions with matter, enabling them to penetrate hundreds of meters of rock layers and even reach depths of several kilometers underground [
3]. In view of the unique properties of cosmic ray muons, such as high flux and strong penetrating power, various types of muon detectors have been developed to meet different detection requirements.
Muon detectors differ due to their diverse methods of detecting muons. From the perspective of detection technology, they can be fundamentally classified into three types, nuclear emulsion detectors, gas detectors, and scintillation detectors. Among them, nuclear emulsion detectors, among the earliest muon detectors, were developed by Powell et al. in 1946. They record the trajectories of incident muons through photosensitive films and determine the tracks of incident particles by the exposure positions across multiple film layers [
4]. However, it is difficult to adapt to the changeable climatic conditions and high-efficiency detection requirements in fieldwork. Gas detectors include types like resistive plate chambers and multi-wire chambers, but their performance is unstable in complex environments, limiting field use [
5,
6,
7]. Scintillation detectors are the most commonly used muon detectors in muon transmission imaging technology, typically employing plastic scintillators for detection. A typical plastic scintillator detector consists of two or more detection planes. For example, the detector designed by Tanaka et al. in 2003 has a specific distance between each pair of detection planes [
8]. Plastic scintillators have the advantages of easy processing and stable performance, making them suitable for fieldwork. The continuous advancement of muon detector technology is crucial for expanding the application of muons in various fields. Muon detection technology has been applied to multiple geophysical exploration fields, including geological structure studies of fault zones [
9], nuclear safety monitoring [
10,
11], volcanic internal structure imaging [
12,
13,
14], mineral exploration [
15,
16], underground cave detection [
17,
18], and archeological research [
19,
20,
21,
22].
Muon detection technology is an emerging geophysical detection method that has developed in recent years, and it makes use of natural cosmic ray muon as the radiation source to image the target [
23,
24,
25,
26]. In 1995, Nagamine et al. successfully obtained the internal structure of Mount Tsukuba in Japan using muon detection, constructing a two-dimensional areal density map through density distribution inversion [
15]. Tanaka et al. used muon imaging to invert seismic fault zones, achieving imaging of fault areas within 50 m of the surface [
9]. Borozdin and Takamatsu applied muon methods to detect the Fukushima reactor and the High-Temperature Engineering Test Reactor, respectively [
10,
11]. In 2018, Schouten et al. combined muon data with three-dimensional inversion algorithms in a uranium mine in Canada, obtaining density images highly consistent with borehole data [
13]. Breakthroughs in archeology are equally remarkable. The experiment led by Alvarez used muon detection to search for potential burial chambers in pyramids, marking the first application of muons imaging technology in archeology [
19]. Subsequently, Morishima et al. deployed different muon detectors inside and outside the pyramid, confirming the existence of an unknown burial chamber [
20]. Muon detection technology has also made significant progress in the inspection of ancient city walls and other structures in China. Lanzhou University carried out muon measurement work on the Xi’an ancient city wall, reconstructed the internal density distribution of the city wall based on measured data and inversion algorithms, discovered a low-density abnormal area [
21]. Su et al. conducted Monte Carlo simulations of muons imaging for a simplified model of the Mausoleum of the First Qin Emperor, and the simulation results clearly reflected the location information of abnormal structures such as the burial chamber in the underground palace [
22]. These studies indicate that muon detection technology has provided valuable technical support for multiple geophysical fields.
With the extensive application of muon methods in various fields, their detection approaches and processing techniques have been continuously improved. As early as 1997, Caffau et al. conducted measurements on the muon flux in natural caves and found that flux changes were correlated with the zenith angle and the rock mass through which muon passed, making it possible to determine cave shapes via muon imaging [
27]. With the in-depth research on muon imaging, many scholars have obtained higher-resolution results by combining muon data with topographic data. Cheng et al. combined muon data with UAV topographic data to invert the density distribution of the volcanic cone of Laohei Mountain Volcano in China [
14]. Saracino et al. combined muon data with digital terrain models to invert subsurface density, verifying the existence of known caves and discovering clues to unknown caves [
16]. With the development of machine learning in the geophysical field, Cosburn applied muons imaging and inversion technology to machine learning in 2022 [
28], proposing a Bayesian joint inversion method that integrates muons and gravity data. To improve the accuracy of muon imaging, Liu et al. proposed a computational neurodynamics algorithm for muon imaging, which can obtain higher-resolution muon imaging results [
29]. However, existing studies have not effectively addressed the problem of selecting optimal detection parameters. In muon detection, it usually requires a long data acquisition time. Improper parameter selection directly leads to the decline of muon flux data quality, prolongs the acquisition time, and increases the acquisition cost. Therefore, scientifically and accurately selecting optimal detection parameters is particularly critical, which can not only maximize the acquisition of effective data within a limited detection time but also lay a solid data foundation for subsequent inversion and imaging work.
To obtain optimal detection parameters, this paper proposes a method for selecting the best observation parameters based on FreeCAD modeling and the energy attenuation formula of muon rays penetrating matter, which improves the quality of muon flux data acquisition within a limited time. Meanwhile, this paper establishes a calculation method for density-length product (the product of density and length) based on the muon survival rate formula, using the muon survival rate formula to reflect the attenuation of muon flux, so as to perform density inversion of objects. The above methods are first applied to the detection of Tomb No. 2 of the XiXia Imperial Tombs, verifying that muon detection technology can effectively identify density anomalies in the tomb tower, providing key data support for the structural analysis and protection of the XiXia imperial tombs.
2. The Principle of Muon Imaging
2.1. The Basic Properties of Muon
In 1912, Austrian physicist Victor Hess made the pivotal discovery of cosmic rays during a series of high-altitude balloon experiments. When measuring radiation intensity at different altitudes, he found that instead of decreasing, the radiation intensity increased with increasing altitude. From this, he inferred that such radiation originated from outer space beyond the Earth, hence naming it cosmic rays. Subsequently, cosmic rays were observed at various altitudes, including high above the Earth, on the ground, and underground, as well as at different longitudes and latitudes. Through a large amount of observational data, it has been found that within the primary cosmic rays impacting the Earth’s atmospheric surface, 82.4% of the particles are positively charged protons, 11.5% of the particles are light nuclei, along with a small number of heavy nuclei and there are also neutral gamma rays, neutrinos, etc. Within the energy band of a few GeV to 100 TeV, the distribution of primary nucleons in cosmic rays can be approximated as follows:
denotes the energy of nucleons, while represents the differential spectral index of the cosmic ray flux. When the primary cosmic rays penetrate the atmosphere, their emission occurs at a height of about 32 km above the Earth’s surface and collides with the atomic nuclei in the atmosphere, generating charged pions and kaons. These two kinds of charged mesons are very unstable and decay into charged muons and neutral neutrinos in a very short time. These primary and secondary particles continue to penetrate the atmosphere and may continue to interact, generating more particles. The mass of a muon exceeds that of the electron by a factor of 2066, and it has strong penetrative ability. Muons are more likely to reach the Earth’s surface, and among the cosmic rays observed near the terrestrial surface, the flux of muons accounts for the vast majority. The energy distribution and zenith angle distribution of muons near the terrestrial surface are extremely wide. The muon flux is related to the altitude and latitude of the observation point, as well as the solar activity during the observation period, with the muon flux near the equator being lower than that near the poles.
At present, there are two methods by which the energy spectrum of muons can be acquired. The first method is Monte Carlo simulation. In the simulation, according to the observed energy spectrum of the primary cosmic rays, air showers occur within the higher atmospheric regions to generate muons. Then, the muons are transported from the position in the upper atmosphere where they are produced and propagate toward the terrestrial surface, and the energy spectrum model of muons at different altitudes is obtained. The second method is to ignore the physical processes of muon generation and transportation, employ the detector to directly measure the flux and directional distribution of muons at sea level, and use multiple parameter constraints for fitting to obtain a multi-parameter model to describe the energy spectrum of muons. The units of the differential energy spectra obtained by the two methods are unified as . There are the following several models commonly used to describe the energy spectrum of muons.
The Gaisser model takes into account the muon generated by the decay of pions and kaons as well as the muons directly produced by protons and uses an equilibrium parameter to adjust the proportion of muons generated by the decay of kaons. The analytical form of the muon energy spectrum is as follows:
is an adjustable parameter,
is the power exponent,
is a parameter for adjusting the proportion of muons produced by the decay of kaons,
is the proportion of muons directly produced by protons.
and
are the critical values of pions and kaons in the direction of vertical incidence obtained through a large number of quantum mechanical calculations, and in some theoretical fittings of experimental data, they are still regarded as adjustable parameters.
is the energy of the initially produced muons.
is the zenith angle. When
is greater than 70, the influence of the reduced thickness of the atmosphere through which muons pass caused by the curvature of the ground needs to be considered. Therefore, an equivalent zenith angle
is required to replace
:
is the radius of the Earth, which is taken as 6370 km, and is the generation height of muons, which is taken as 32 km.
The Hebberker and Timmermans model are based on Equation (2), Hebberker referred to the parameters obtained from different laboratories and fitted the muon energy spectrum of vertical incidence near the sea level through a new iterative procedure and experimental observation data. The energy spectrum of this model is expressed as follows:
among them,
is expressed as:
where the parameters
,
, and
are, respectively, the logarithms of the differential fluxes at energies of 10 GeV, 100 GeV, and 1000 GeV.
is the differential flux value at an energy of 100 GeV.
The muon flux is related to the altitude of the observation point, latitude, and solar activity during the observation period. In general, muons with different energy levels exhibit distinct energy spectra. For muons with lower energy (less than 1 GeV), their energy distribution is relatively uniform. For muons with higher energy (greater than 10 GeV), the energy distribution decreases exponentially with the −2.7th power of momentum. The average energy of muons at sea level is between 3 and 4 GeV. The vertical direction receives maximal muon flux intensity, with angular dependence following approximately a distribution, where represents the zenith angle of incidence. The muon flux increases with the increase in altitude. Muons detected at higher altitudes traverse significantly shorter atmospheric path lengths than those reaching sea level, resulting in proportionally higher flux measurements due to reduced absorption. The geomagnetic field imposes a momentum-dependent cutoff on incident cosmic rays, effectively filtering out low-energy particles. This results in a pronounced latitudinal variation in muon flux. The muon flux near the equator is lower than that near the poles. The intensity of cosmic rays reaching Earth displays approximately sinusoidal variations that correlate with the solar cycle, showing distinct differences between solar minimum and maximum periods.
2.2. The Principle of Muon Transmission Imaging
Muon transmission imaging operates on the principle of detecting flux attenuation resulting from muon absorption during matter penetration. The Coulomb interaction between muons and the atomic nuclei of the matter causes multiple Coulomb scattering of a muons. The mean energy loss rate of muon follows the Bethe–Bloch equation [
30]:
The key variables in the Bethe–Bloch equation are shown in
Table 1.
The energy loss during the muon passage through a material is a key focus of transmission imaging research. The
repersents the stopping power of a material, alternatively termed energy loss per unit thickness, quantifies the energy dissipated when a muon traverses the medium. Expressed in units of MeV·cm
2/g, this parameter can be computed using Equation (7) for a muon of energy
[
31]:
represents the ionization loss term in MeV·cm
2/g,
represents the radiation loss term in cm
2/g, which includes bremsstrahlung, pair production, and photodisintegration. In the equation,
represents the ionization loss term in MeV·cm
2/g,
represents the radiation loss term in cm
2/g. For high-energy cosmic ray muons, both
and
manifest the slow-variation characteristic with respect to muon energy
. And both of them are dependent on the material the muon passes through. Therefore,
and
can be approximated as constants related to the material, and specific values can be referenced from the research by Donald et al. The density-length product of the material is also known as the opacity. The material’s opacity represents the integrated density along the muon trajectory [
32] and is expressed by Equation (8):
in the equation,
represents the material’s opacity,
represents the unit distance through which a muon passes in a material (m),
is the material density at position
(g/cm
3), and
is the average material density (g/cm
3) along the path of the muons through the material. For a material with uniform density,
. To pass through a material with a particular density-length product value, the lowest starting energy of the muons must be greater than a certain threshold. This minimum energy can be solved using Equation (9) as follows:
in the formula, the remaining energy carried by the muons after penetrating the medium is denoted as
(MeV). For cosmic ray muons, which have a continuously distributed energy spectrum, the lowest energy a muon must possess to traverse the given medium is incorporated into the energy distribution of muons. This allows the calculation of the remaining muon flux after the muons pass through the material, as shown in the following Equation (10):
the residual muon flux following penetration through the material is denoted as
, the zenith angle direction before entering the material is denoted as
(degrees), and the differential muon flux is represented as
.
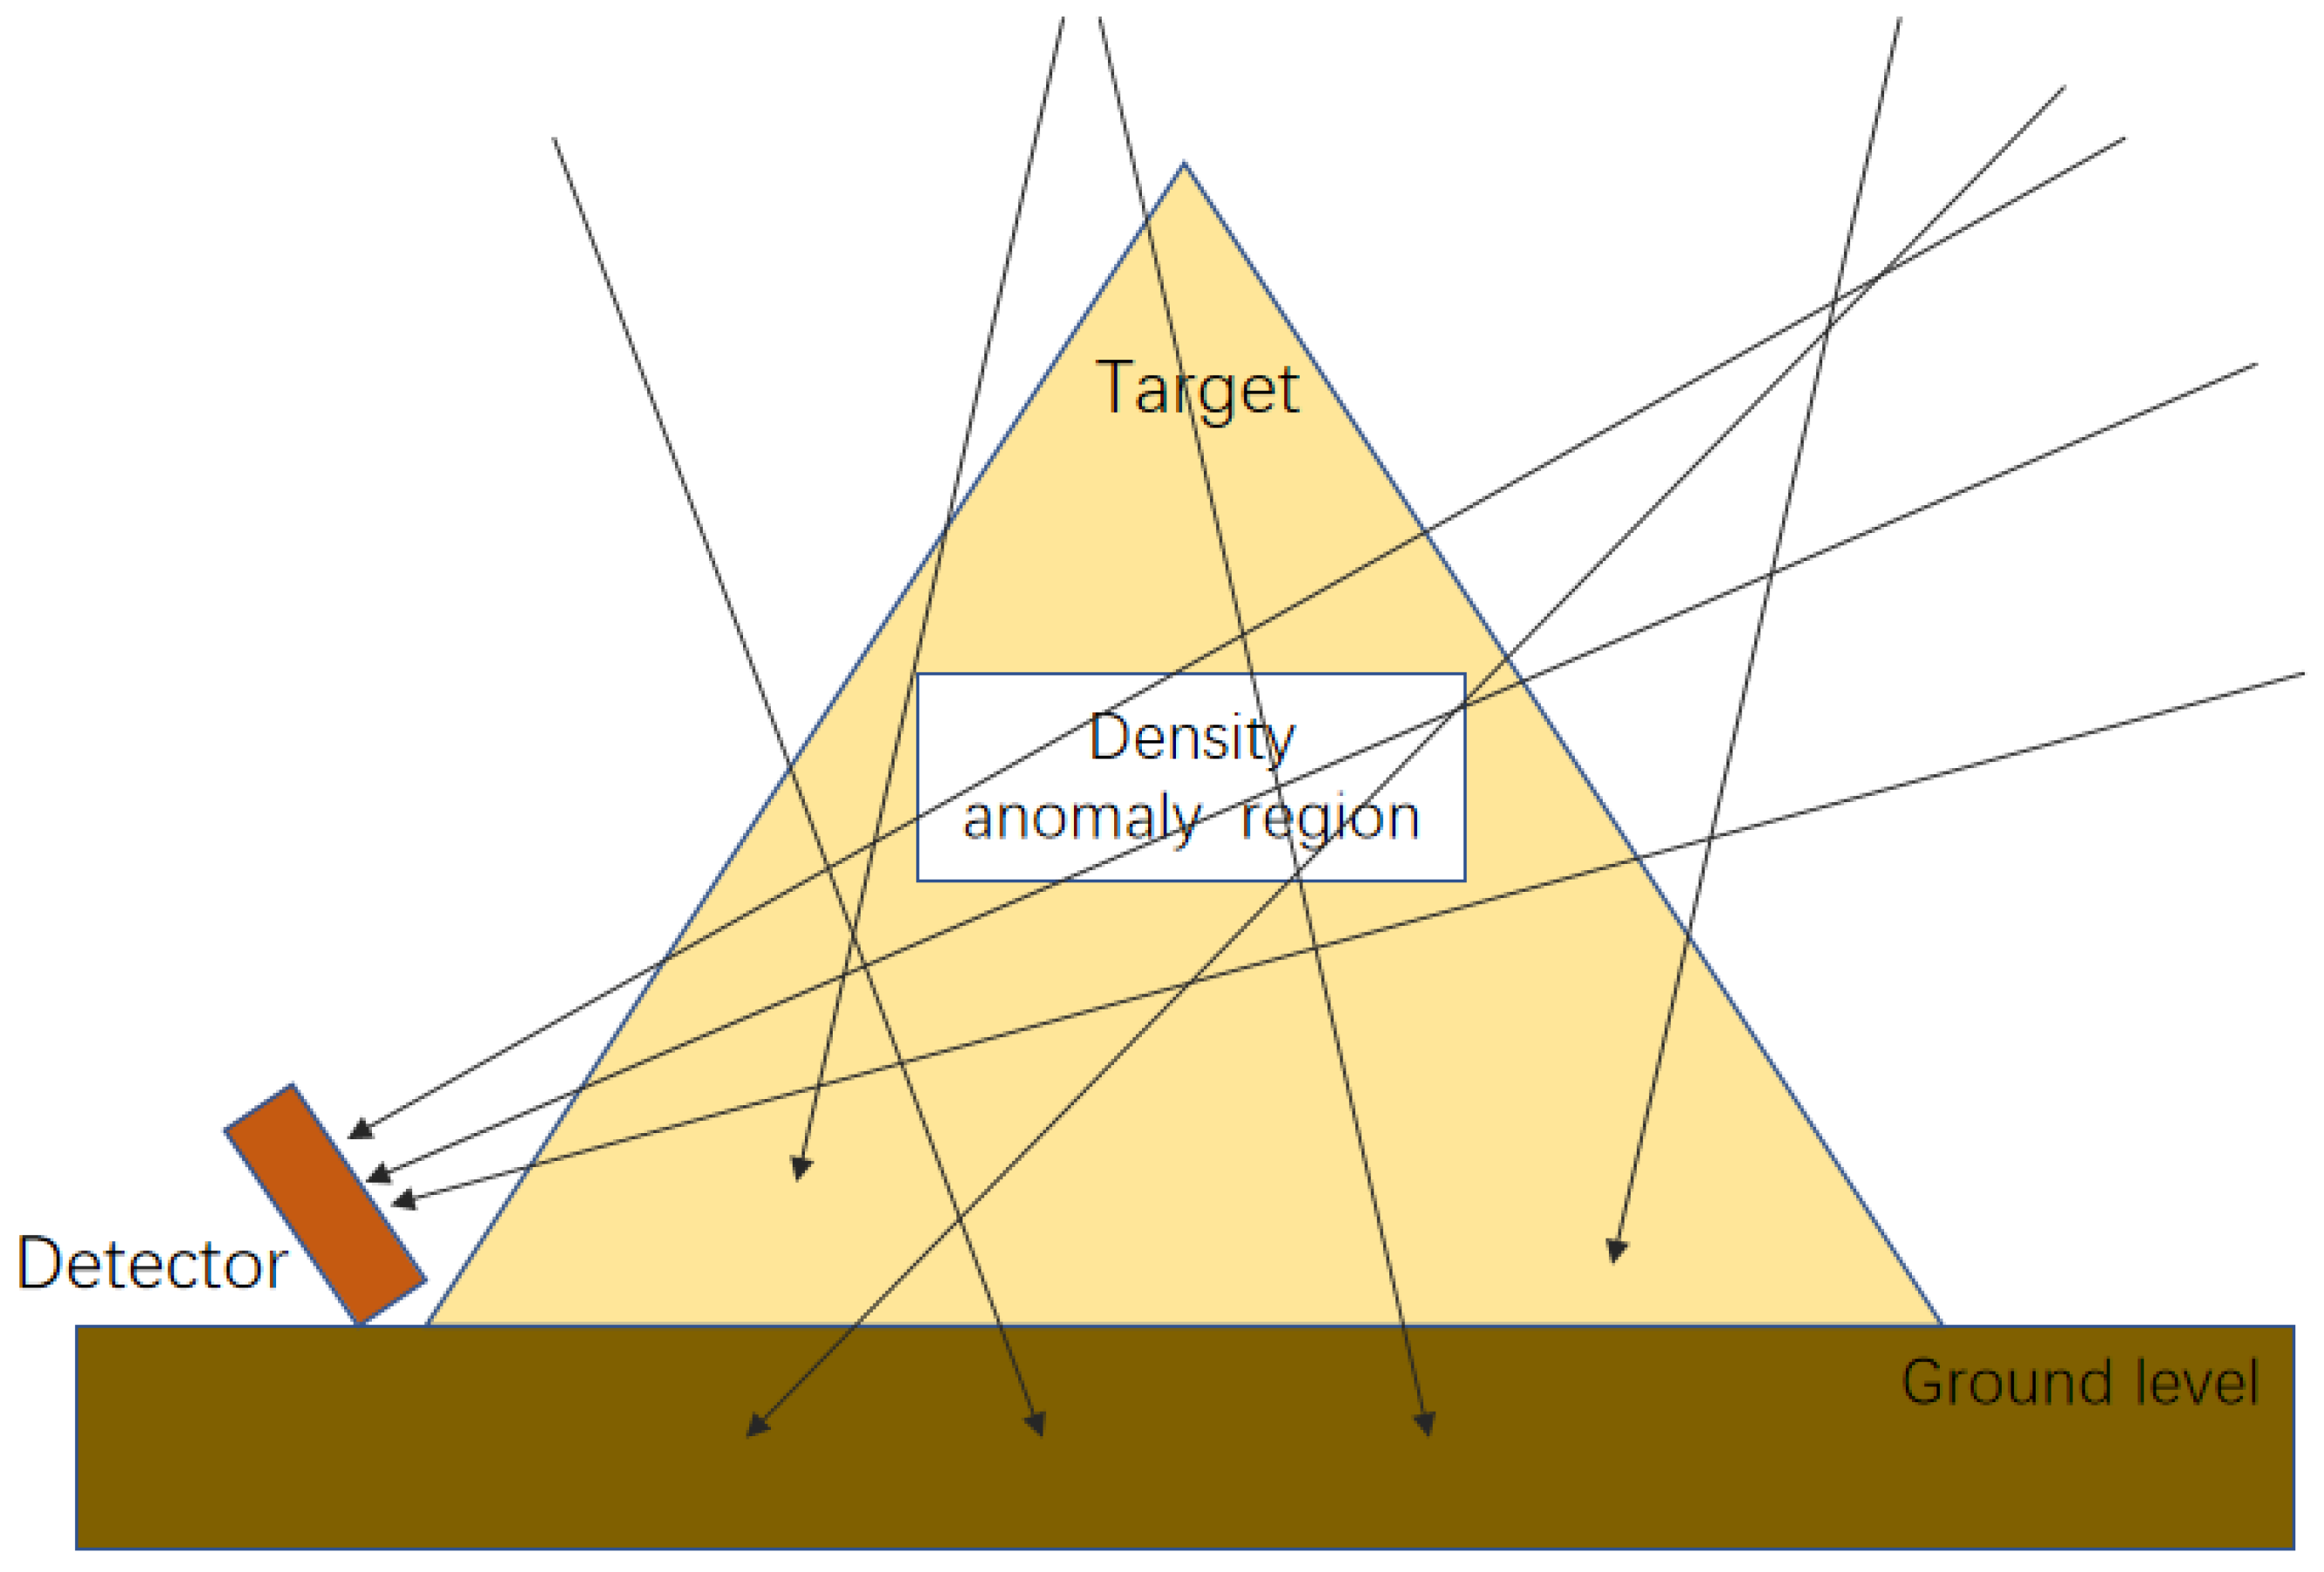
In the actual detection process, the number of muons received by the detector is related to the muon flux. Given the angular distribution of cosmic ray muons at the Earth’s surface, the detector needs to be placed below the target to collect the muons that pass through the target material [
33], as shown in
Figure 1. To measure the diminution of cosmic muon flux, measurements should also encompass the muon flux in the absence of any material obstruction. The reduction in muon intensity is characterized by muon survival rate (ratio) before and after passing through the material, as expressed in the following Equation (11):
in the equation,
represents the survival probability,
indicates the muon count registered by the detector post-material traversal (count),
corresponds to the measured muon count without any material obstruction (count),
is the detector’s acceptance, which is related to the detector’s size parameters (cm
2·sr),
represents the detector’s particle capture efficiency (%),
represents the detection time of the detector (seconds). Based on the law of muon energy loss, a theoretical relationship between this survival rate and the material’s density-length product is established. The density-length product is then obtained by comparing the measured survival rate with this theoretical relationship. Based on Equation (11), it can be seen that by measuring the survival rate of muons following their penetration of the medium, the material’s density-length product along the muon trajectory can be calculated. After obtaining the density length, the density can be inverted by combining the information on the length of the object traversed by the muon path. The geophysical density inversion using muon detection is a geophysical exploration technique that utilizes the penetrating properties of cosmic ray muons and the laws of their interaction with matter. It involves measuring changes in the motion state of muons after they pass through a medium to inversely derive the density distribution of the medium.
The main physical processes of the interaction between muons, as charged particles, and matter include the energy dissipation resulting from particle interactions with the extranuclear electrons of the matter. This process has been described in Equation (7). It also includes multiple Coulomb scattering caused by the interaction with the atomic nuclei of the matter. Multiple Coulomb scattering is the main reason for the deflection of muons when they traverse material media. As muons propagate through matter, each interaction with the atomic nucleus of the matter will lead to a small-angle deflection of the muons. This deflection causes the incident muons to disperse and move along random paths. As a cumulative effect, it eventually makes the muons have a random net deflection from the original incident direction after passing through the matter. This is also the main cause of the range straggling and energy straggling of muons. This physical process can be statistically processed and mathematically described as a probability distribution function where the deflection angle depends on the traversed material thickness. The angular deflection distribution follows an approximately Gaussian form by virtue of the Central Limit Theorem, with its RMS width specified in Equation (12) as follows:
The radiation length can be calculated by Equation (13):
For a material of equal thickness, those with greater atomic numbers, the greater the deflection angle will be. By statistically analyzing the angular deflections of muons caused by multiple Coulomb scattering before and after they pass through the material, it is possible to distinguish materials with different atomic numbers. This is the basic principle of muon scattering imaging. As for muon transmission imaging, muons that can penetrate large structures usually have relatively high energies. According to Equation (12), the angular deflections of these muons caused by multiple Coulomb scattering can generally be ignored. However, when simulating the interaction between muons and matter using software, the process of multiple Coulomb scattering still needs to be considered. The key variables in the multiple Coulomb scattering related formula are shown in
Table 2.
3. Muon Detection Experiment of the XiXia Imperial Tombs
3.1. Muon Simulation Observation Experiment at the XiXia Imperial Tombs
Located on the west side of Yinchuan City, Ningxia Hui Autonomous Region, the XiXia Imperial Tombs are backed by the Helan Mountains in the west and border the Yinchuan Plain in the east, with an altitude ranging from 1130 m to 1200 m. It is one of the imperial mausoleum complexes with the largest existing scale and the most intact preserved above-ground ruins in China and is also the largest existing cultural relic site related to the XiXia Dynasty at present. In this study, the plastic scintillator detector was used to conduct an actual measurement of Mausoleum No. 2 of the XiXia Imperial Tombs for 8.4 h.
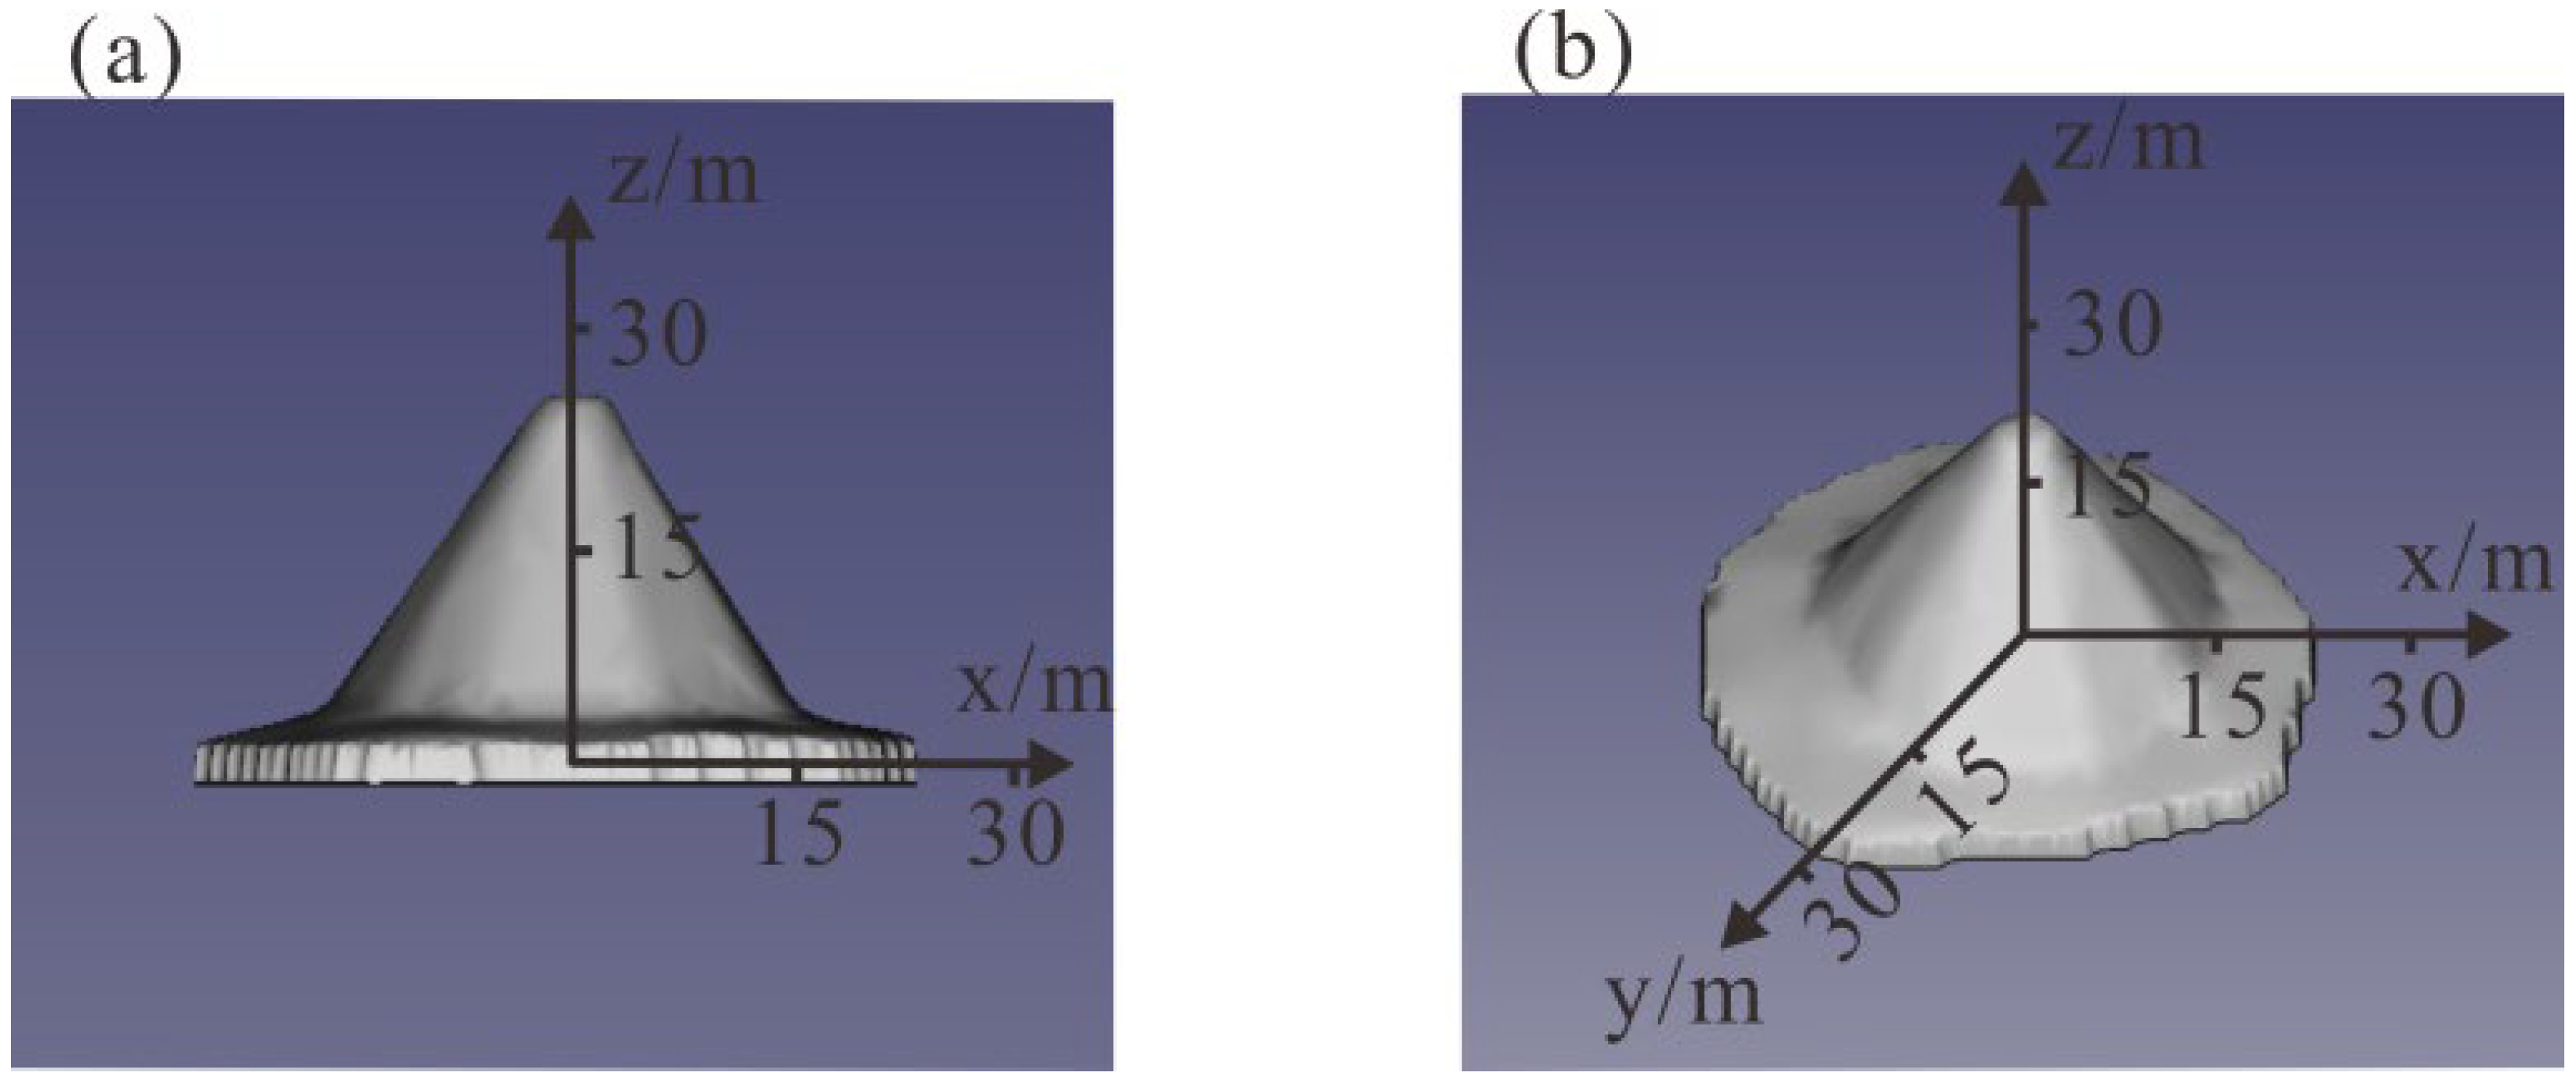
Firstly, we modeled Mausoleum No. 2 of the XiXia Imperial Tombs and carried out a feasibility analysis, including the design of the detection array and its orientation, the assessment of the measurement duration, etc. The bottom diameter of Mausoleum No. 2 of the XiXia Imperial Tombs is approximately 30 m, and its height is about 20 m. We extracted the elevation and shape information of Mausoleum No. 2 from CAD files and carried out the modeling, as shown in
Figure 2 Considering the limited observation time this time, in order to complete the imaging of the overall structural features of the imperial mausoleum as soon as possible and ensure the imaging efficiency and basic effect, we conducted observation simulation experiments to determine the observation parameters. The schematic diagram of the muon simulation detection experiment can refer to
Figure 1.
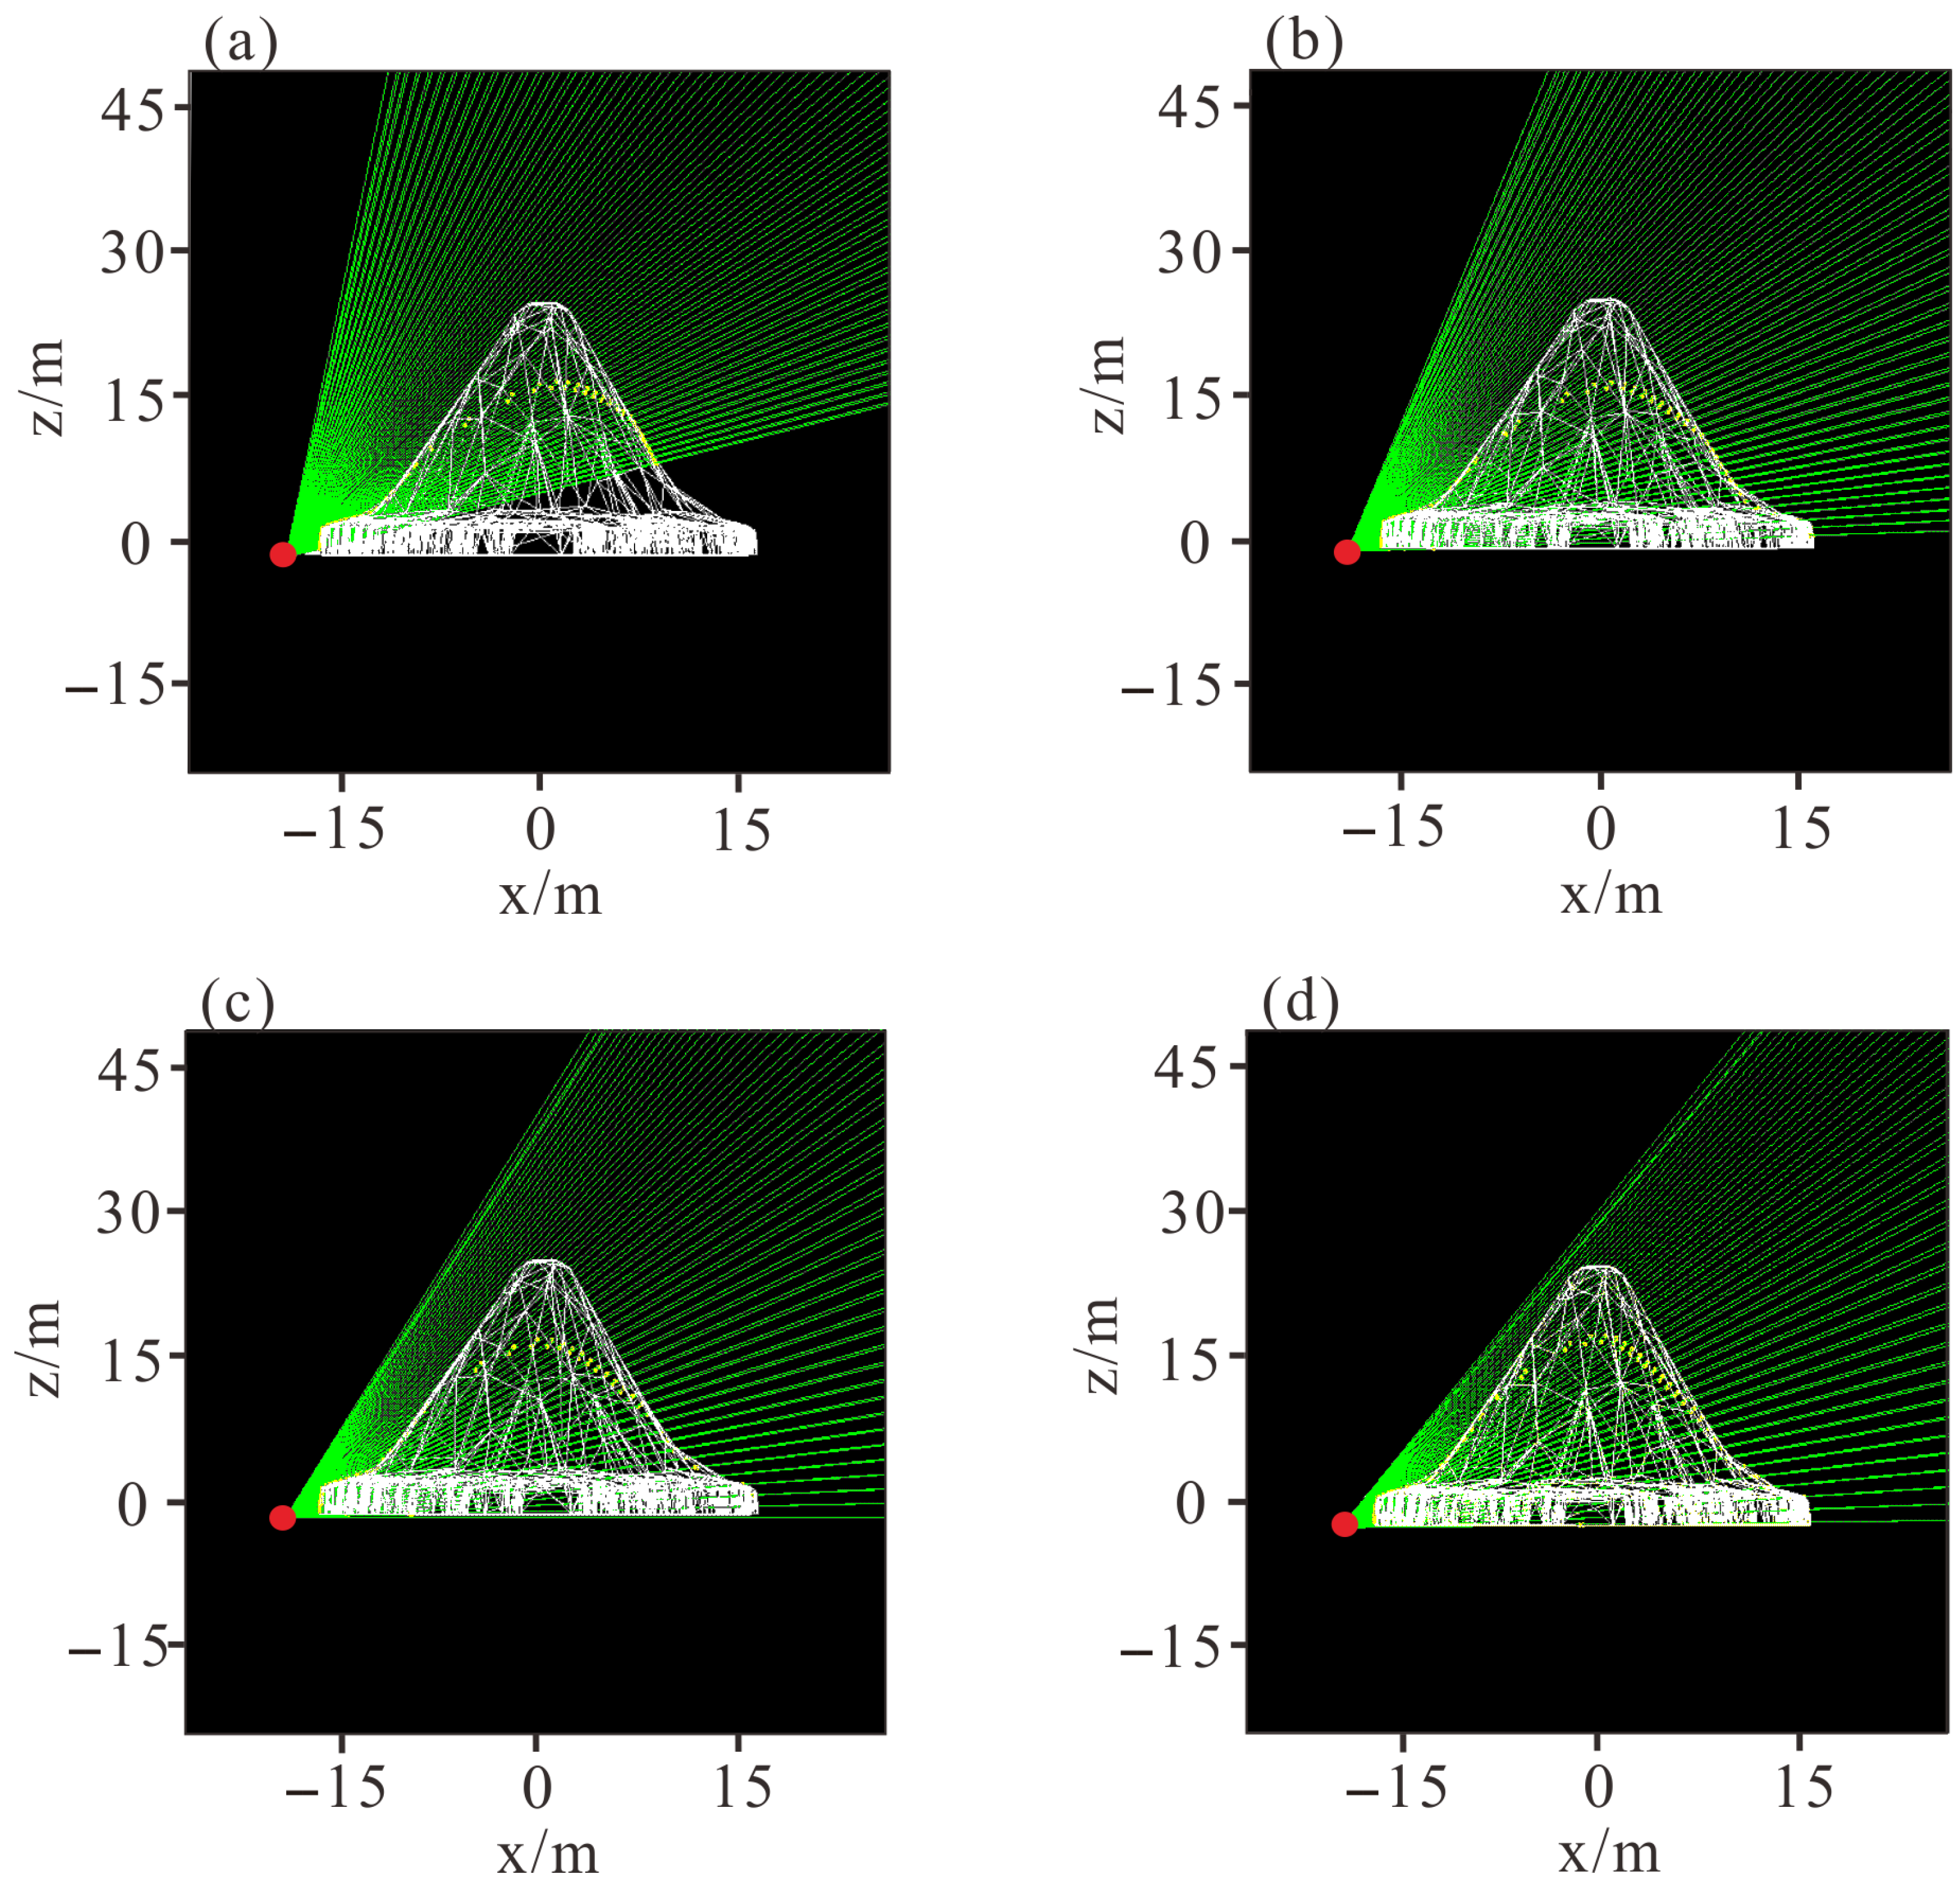
We set the vertical zenith angles of the detector at 30 degrees, 45 degrees, 60 degrees, and 70 degrees, respectively. As shown in
Figure 3, when the vertical zenith angles of the detector are 30 degrees and 45 degrees, the muon rays fail to completely pass through the target object, and there is a part of the area that cannot be detected. When the vertical zenith angles of the detector are 60 degrees and 70 degrees, the muon rays can both completely pass through the target object. However, by comparison, when the vertical zenith angle of the detector is 70 degrees, the number of muon rays passing through the target object is larger, and more muon flux data can be obtained, as shown in
Table 3. Therefore, in the final experiment, the vertical zenith angle of the detector was selected to be 70 degrees.
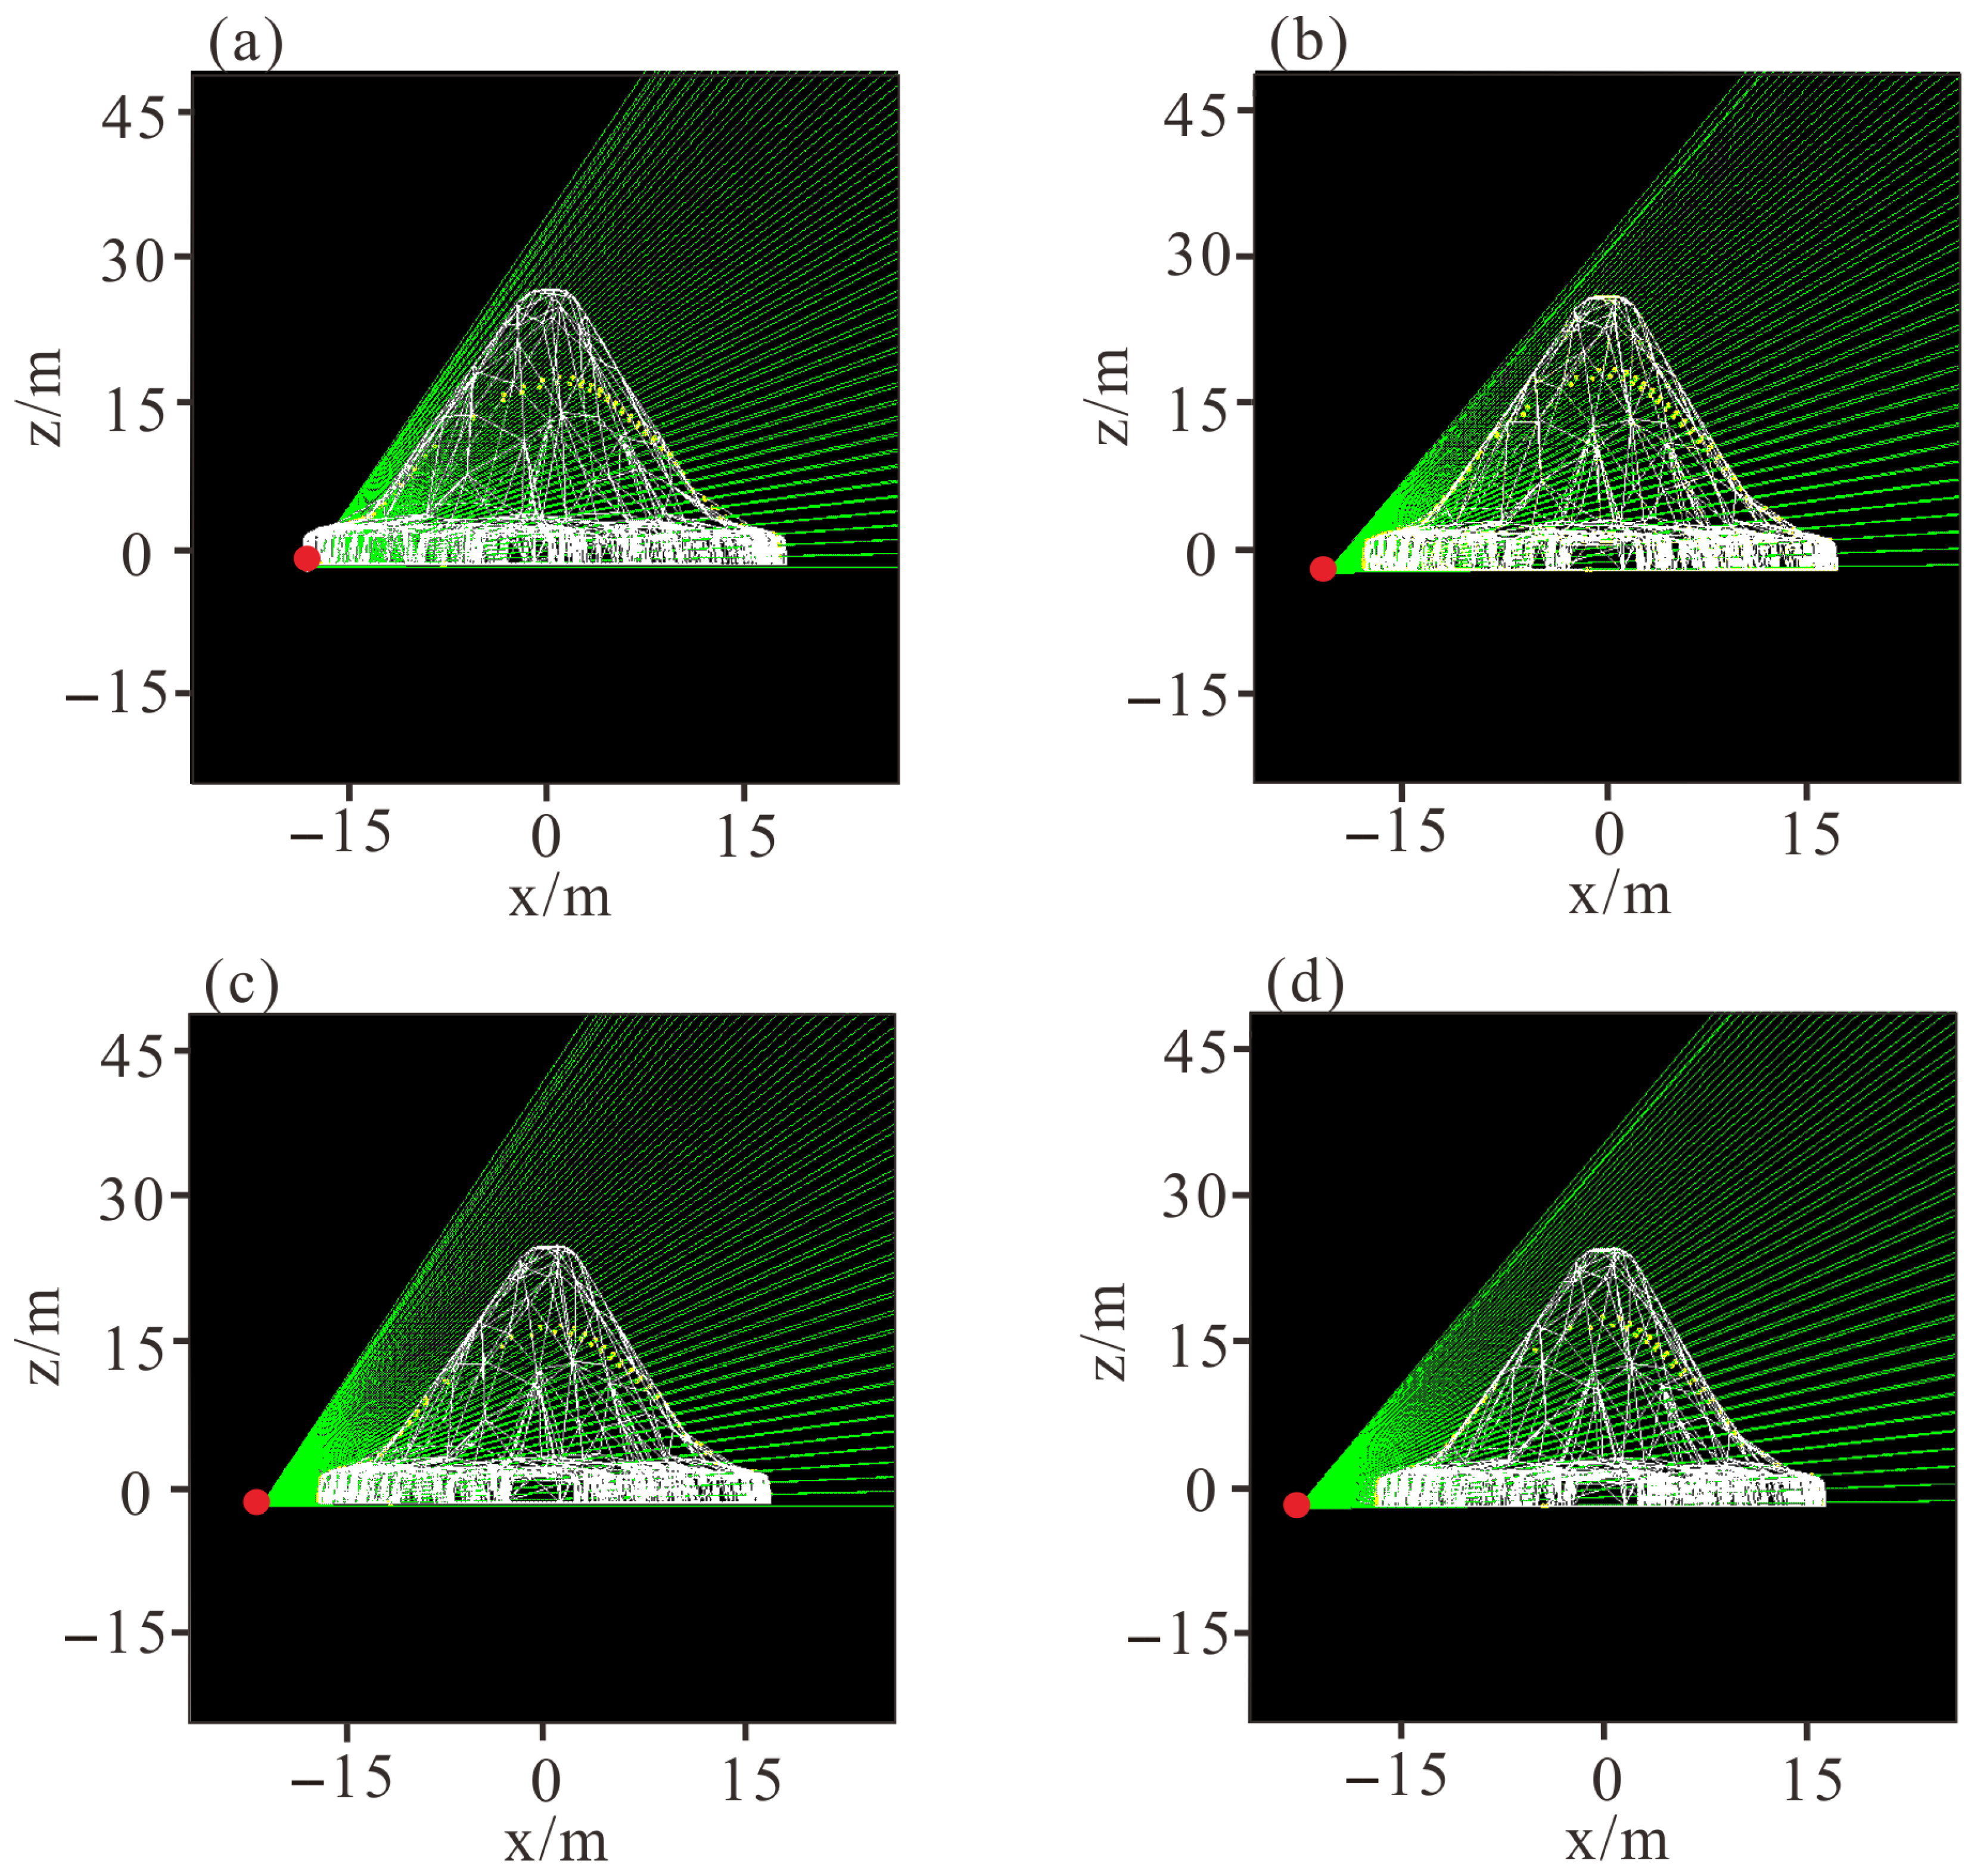
In the muon observation simulation experiment, the muon detectors are deployed at positions 1, 2, 3, and 4. D1 represents the distance between this position and the entrance gate.
After preliminarily determining that the vertical zenith angle of the detector is 70 degrees, we placed the muon detectors at the measuring points 1 m, 3 m, 5 m and 7 m away from the bottom edge of Mausoleum No. 2 of the XiXia Imperial Tombs, respectively. As shown in
Figure 4, when the muon detector is placed 1 m away from the bottom edge of Mausoleum No. 2 of the XiXia Imperial Tombs, the distance is too close, and it cannot receive muon rays from all directions well. When the muon detector is placed 5 m and 7 m away from the bottom edge of Mausoleum No. 2 of the XiXia Imperial Tombs, the distance is too far, and it cannot receive muon rays to the maximum extent, as shown in
Table 4. Therefore, the measuring point 3 m away from the bottom edge of Mausoleum No. 2 of the XiXia Imperial Tombs is selected as the placement position of the muon detector.
Through the simulation experiment, we have tested and determined the following observation parameters. For detector configuration, the spacing between each of the three detection units of the detector is 20 cm. Therefore, the spacing between the first and third detection units of the entire detector is 40 cm. The vertical zenith angle of the detector is set at 70 degrees to ensure a larger imaging field of view so as to obtain the overall characteristics of the imperial mausoleum. Regarding detector distance, we tested different distances between the detector and the bottom edge of the imperial mausoleum. It was found that when the detector is 3 m away from the bottom edge of the imperial mausoleum, a better imaging field of view and reception rate can be obtained.
According to the feasibility analysis and scheme design, we placed the muon detector at the measuring point 3 m away from the bottom edge of Mausoleum No. 2 of the XiXia Imperial Tombs and rotated the detector so that the receiving angle faced Mausoleum No. 2 of the XiXia Imperial Tombs for measurement. The schematic diagram of muon detection is shown in
Figure 1. The cosmic ray muon imaging detector device used in this study is a scintillator detector, which can be conveniently operated in fieldwork. The scintillator detector used in this study is composed of three detection planes, with a distance interval of 20 cm between each detection plane. The effective detection area of the detector is greater than or equal to 2500 cm
2, the position resolution is greater than or equal to 2.5 cm, the detection efficiency of the detector is greater than or equal to 92%, the time resolution is greater than or equal to 10 ns, and the size of the scintillator strip is 50 cm by 2 cm by 1 cm.
During the observation of the XiXia Imperial Tombs, the observation time was approximately 8.4 h. The hourly muon count was about 10,000, and the average disturbance was less than 1%, ensuring the imaging accuracy.
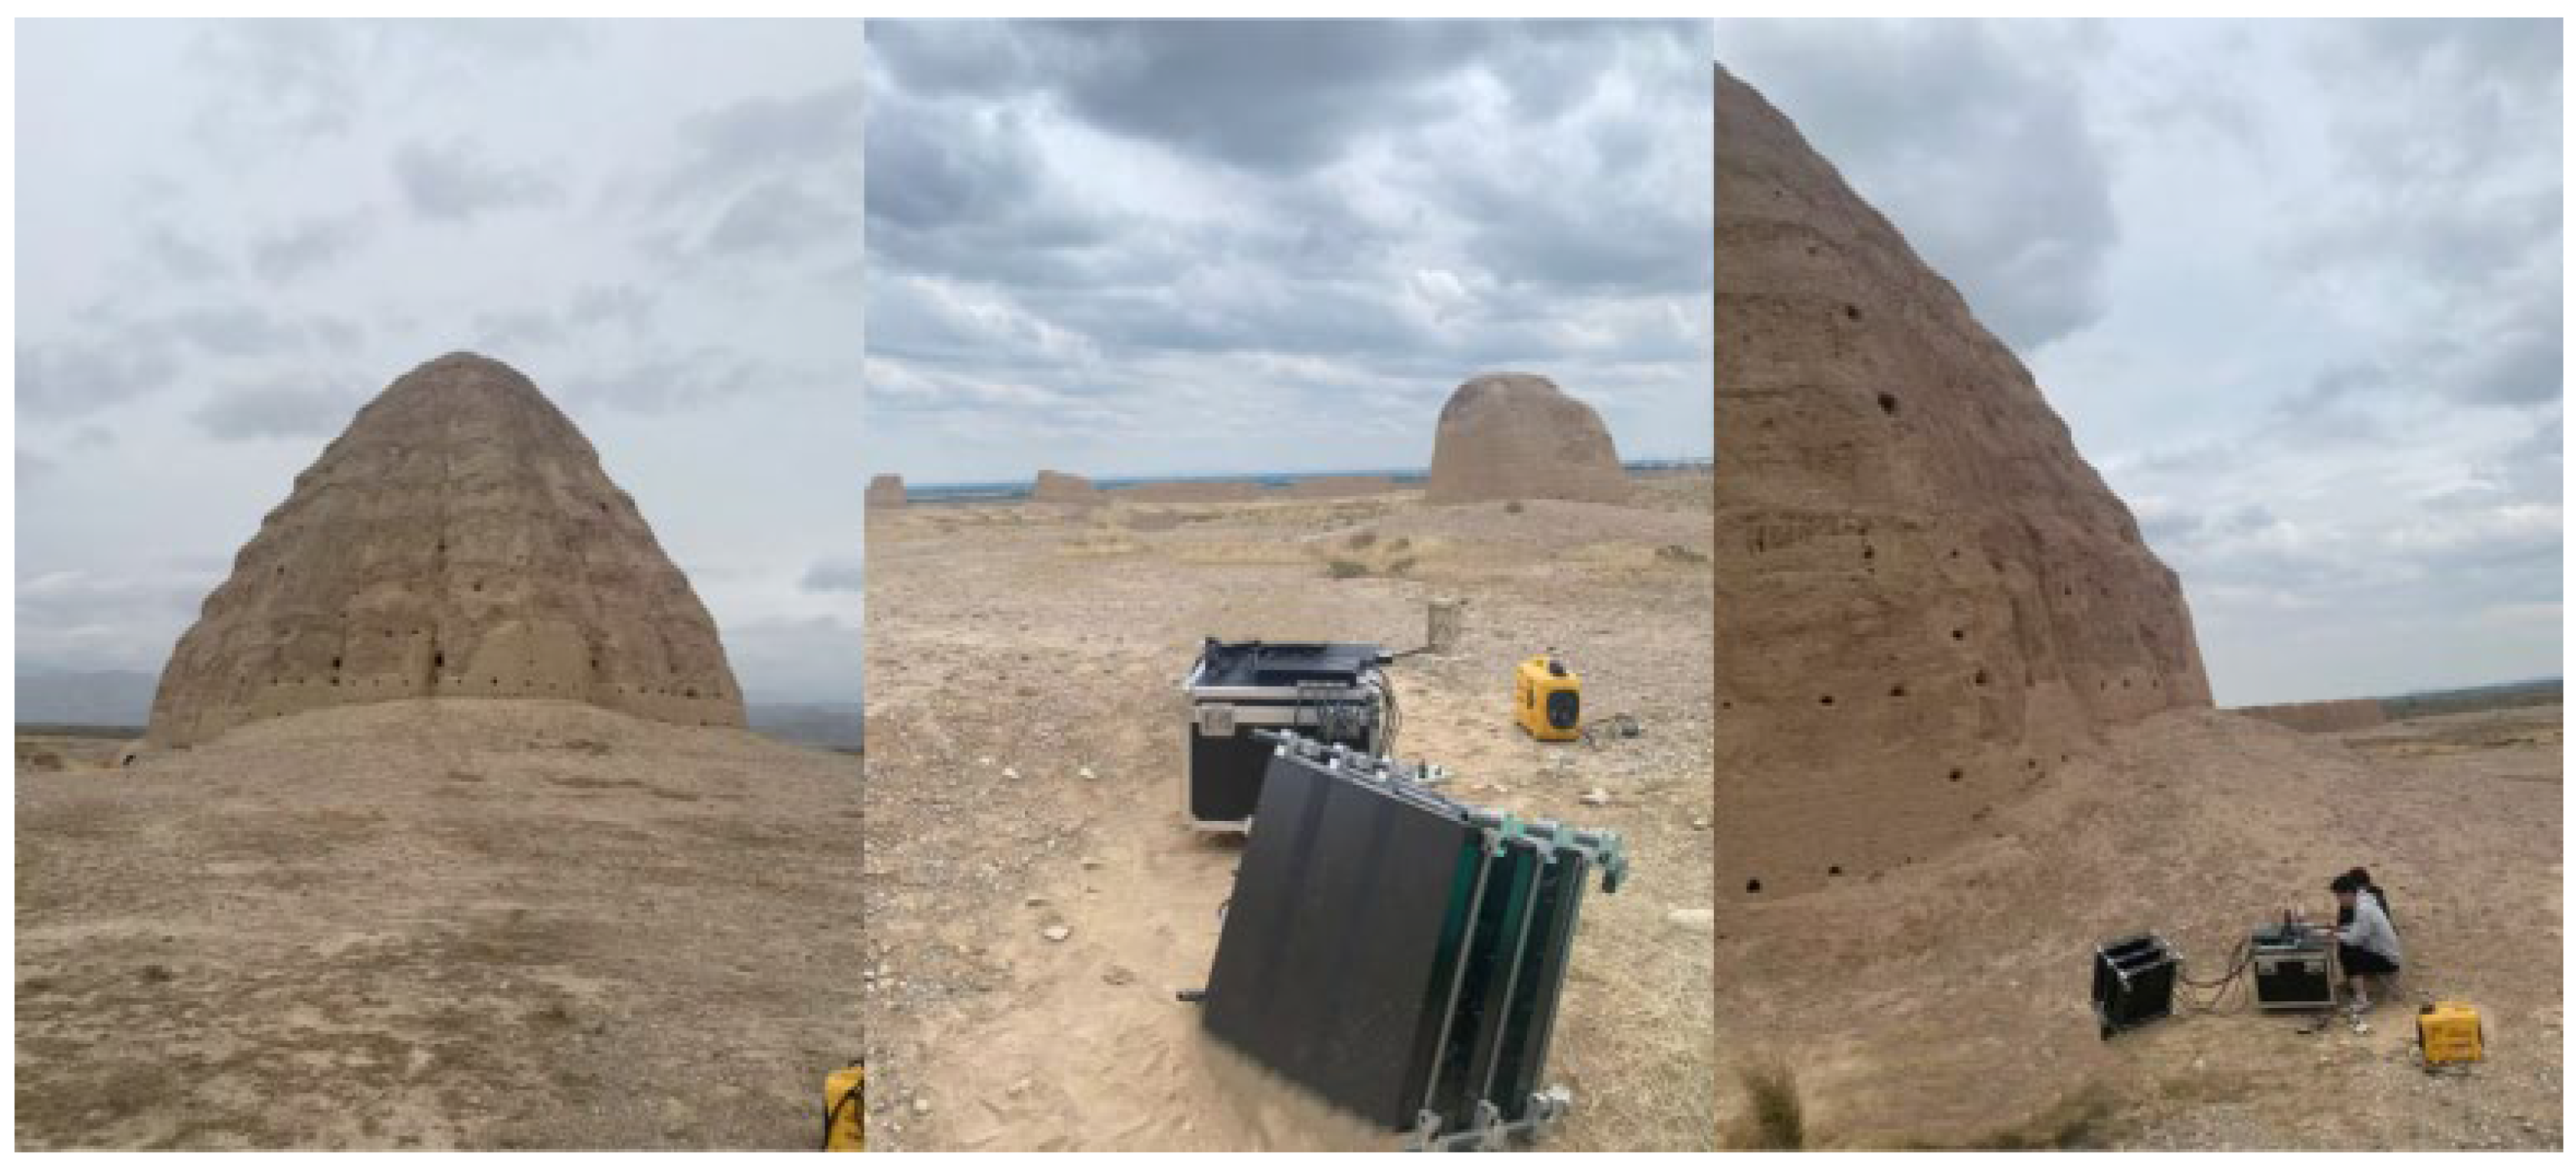
Figure 5 shows the photo of the detector during the actual measurement at the measuring point. The open-sky location was used to collect muon flux data without interference from any solid objects. Using the same observation method as that for the XiXia Imperial Tombs, the observation time was approximately 8.8 h. The number of muons recorded per hour was about 15,000, and the average disturbance was also less than 1%.
3.2. Results of the Muon Detection of the XiXia Imperial Tombs
Based on the measured muon flux at the same location, we separately obtained muon flux data collected by the muon detector facing the unobstructed open sky, as well as muon flux data collected by the muon detector facing Mausoleum No. 2 of the Western Xia Imperial Tombs. The muon detector is oriented toward the north.
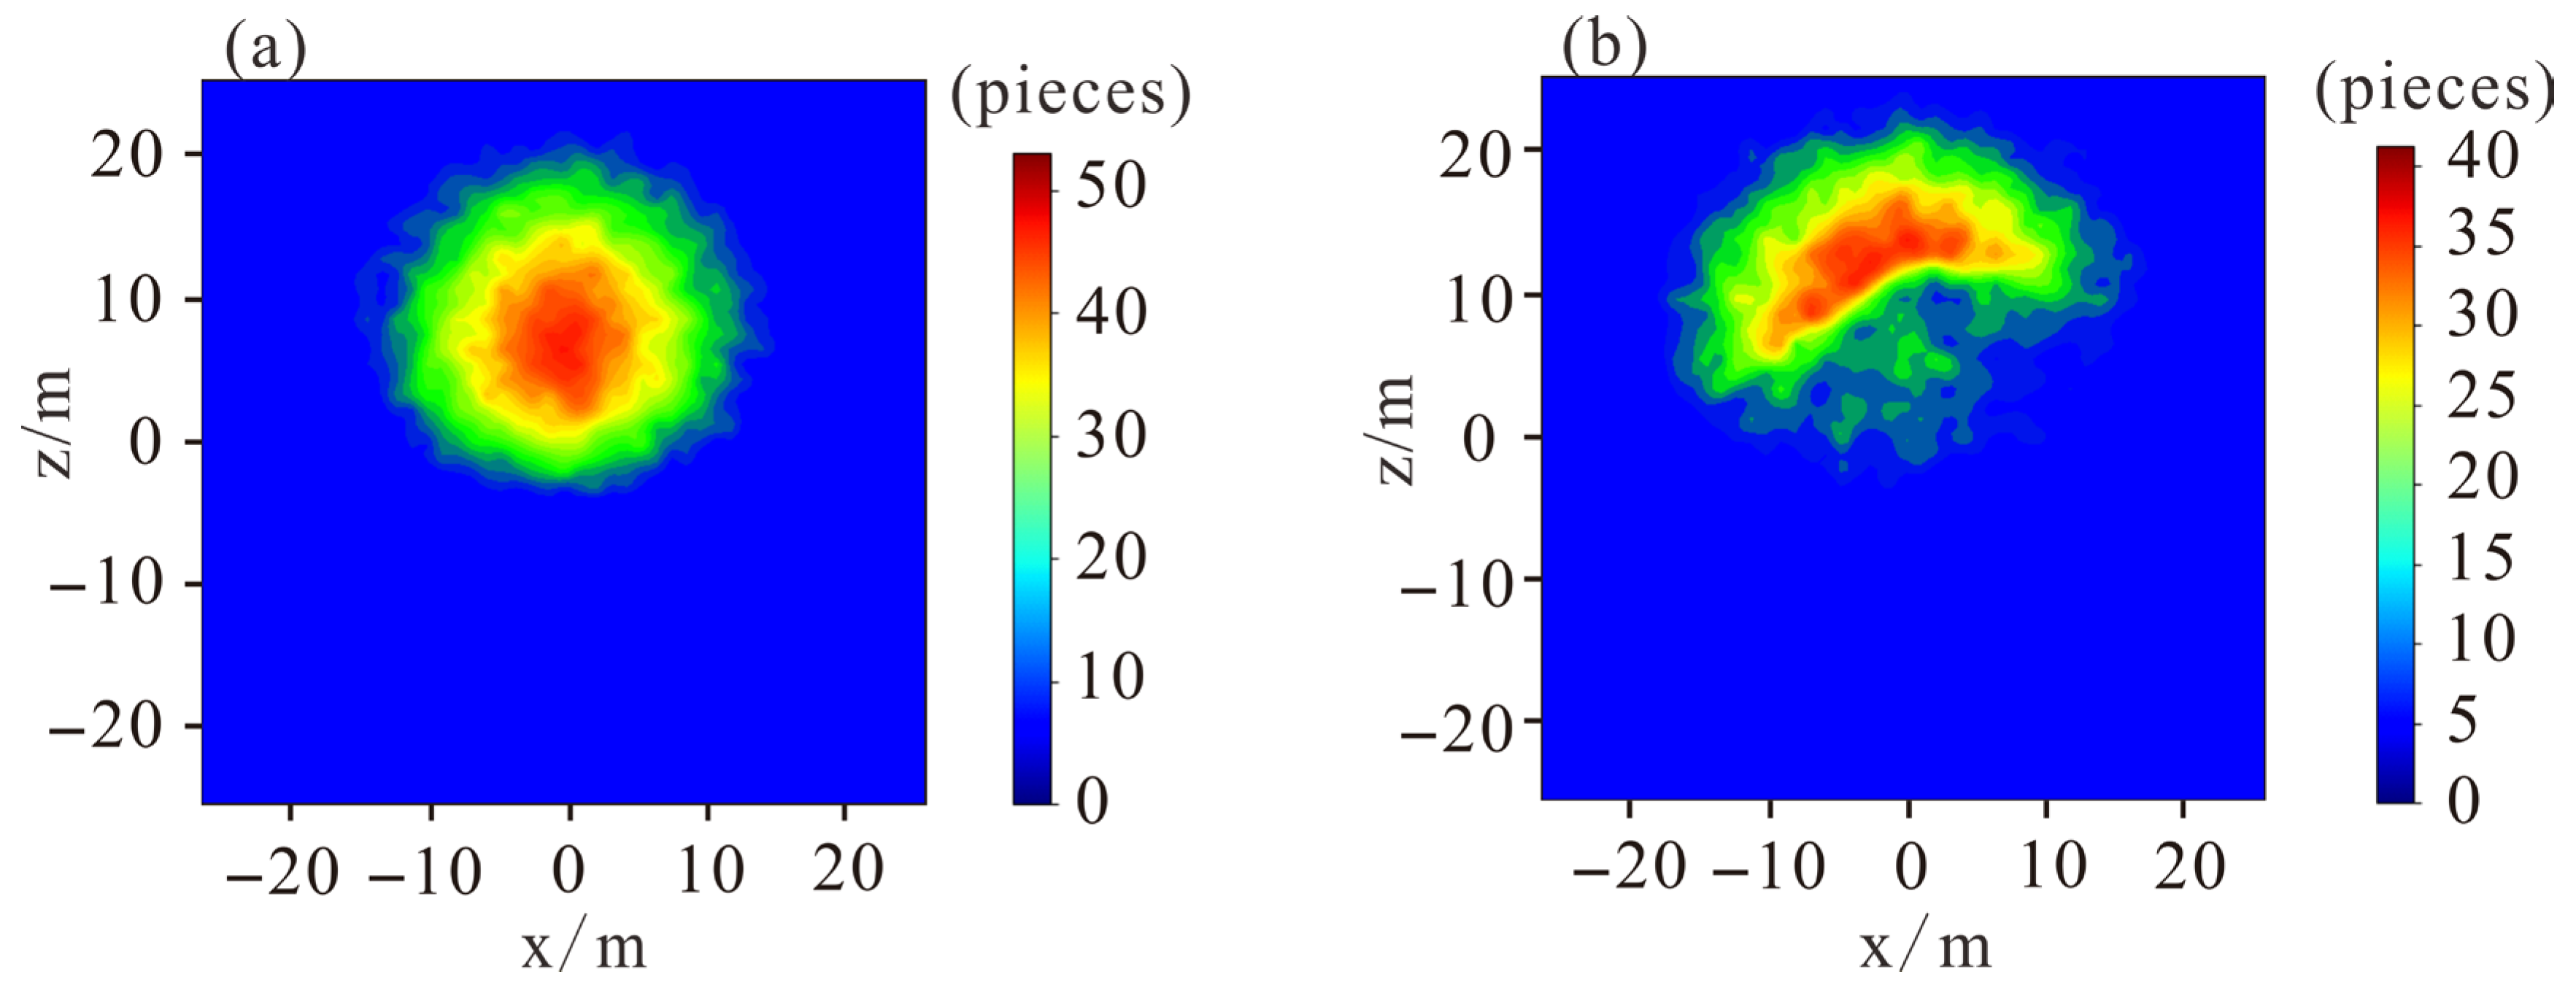
By taking the ratio of the muon counts from the actual measurement of Mausoleum No. 2 of the XiXia Imperial Tombs (as shown in
Figure 6a) to the count rate of the muon flux data collected at the open-sky location (as shown in
Figure 6b), the muon transmission ratio in the corresponding direction, that is, the survival rate of muons, can be obtained. In
Figure 6a,b, the horizontal axis represents the distance from the midpoint of the base of the mausoleum tower in the east–west direction, and the vertical axis represents the actual height above the ground minus ten meters. Areas where the color approaches red indicate a high muon flux count, while areas where the color approaches blue indicate a low muon flux count. Based on the measured muon survival rate at the measuring point (as shown in
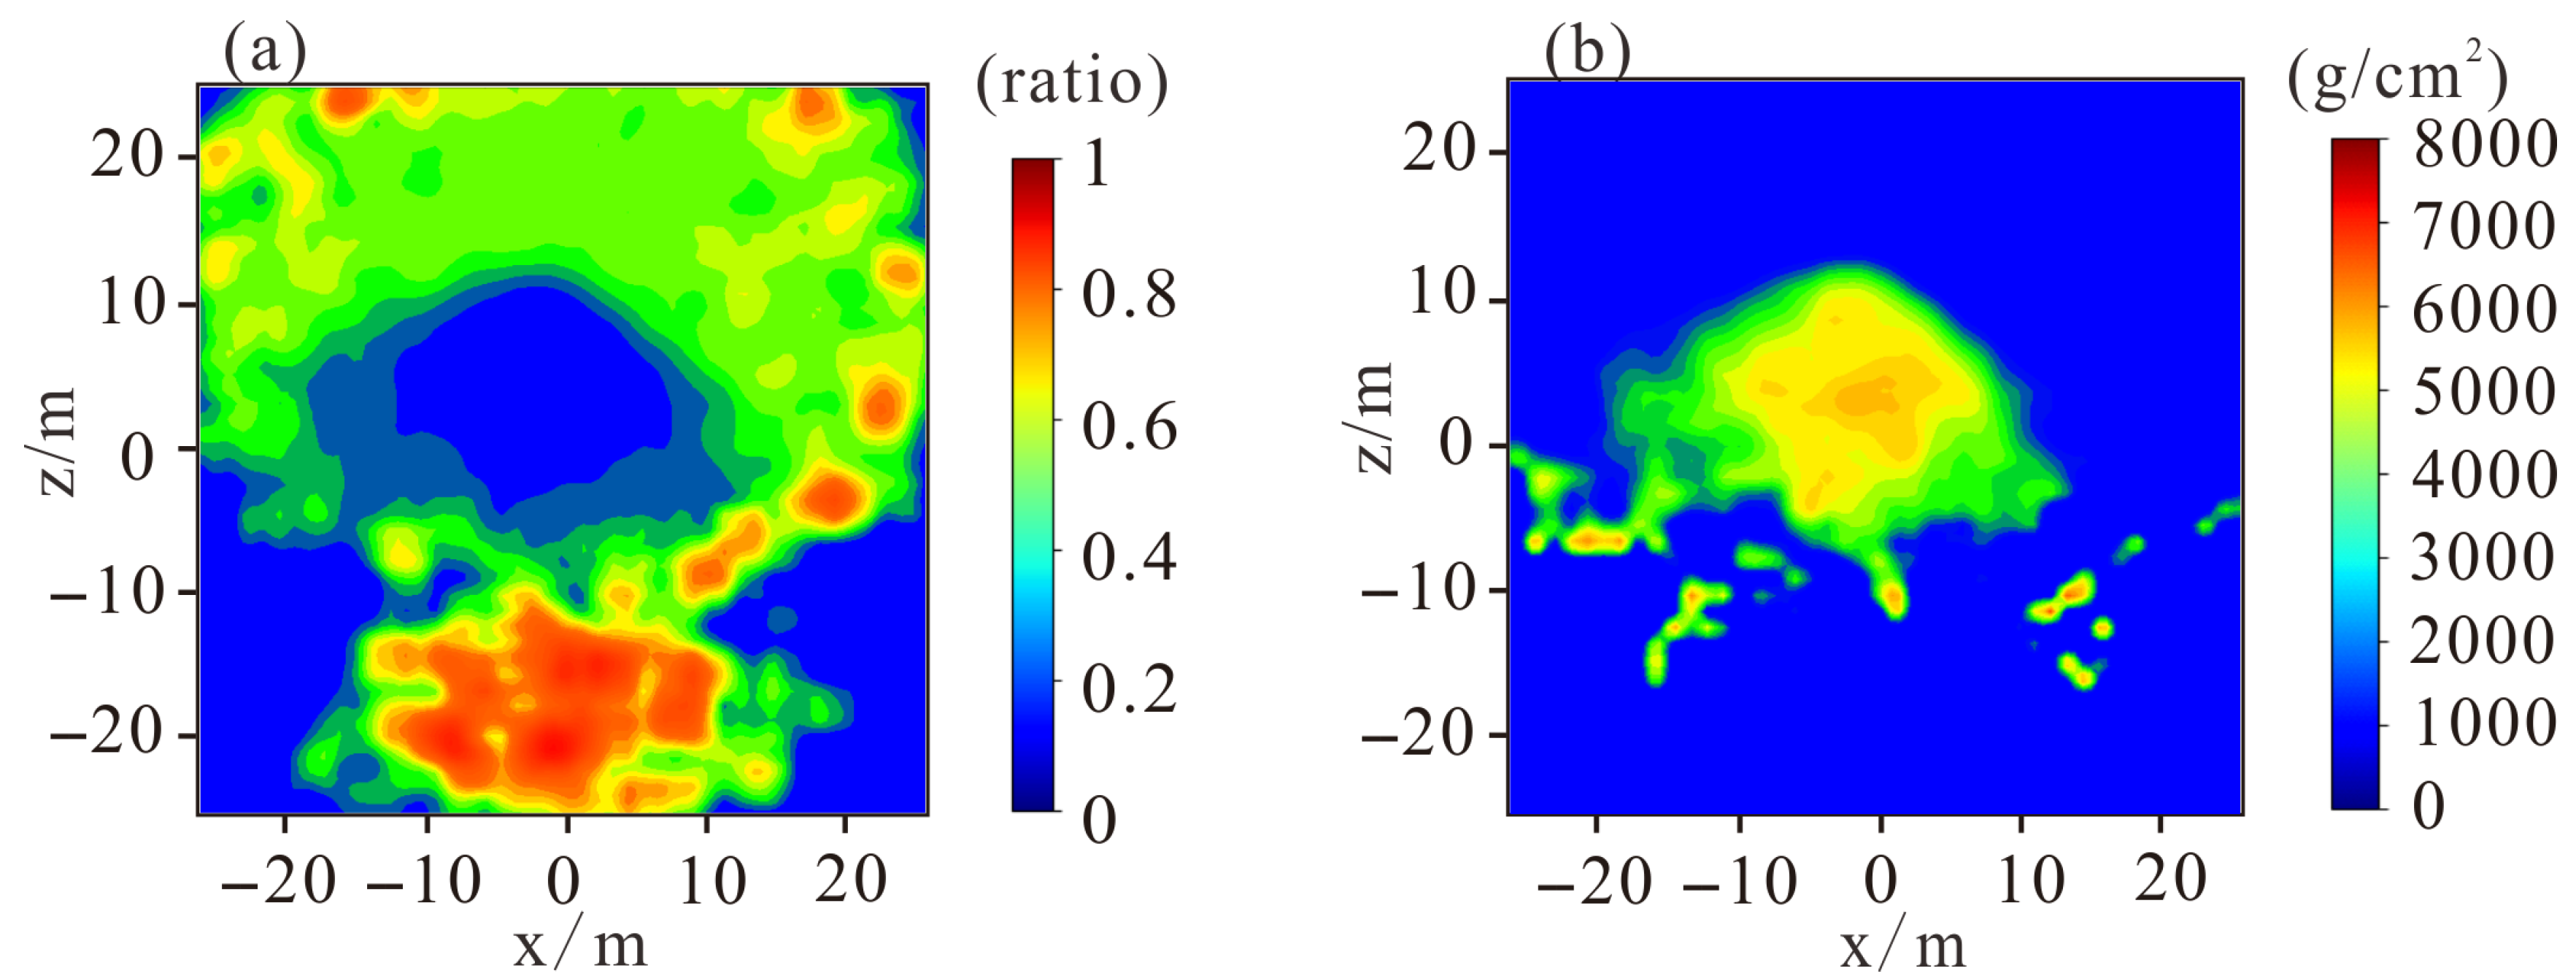
Figure 7a), we deduced the density-length product distribution of Mausoleum No. 2 of the XiXia Imperial Tombs in reverse (as shown in
Figure 7b). This method derives the minimum energy required for muons to penetrate matter from the survival rate and then calculates the corresponding density-length product, thus deriving the density-length product distribution.
In
Figure 7a,b, the horizontal and vertical axes represent the same meanings as in
Figure 6. In
Figure 7a, areas where the color approaches red indicate a high ratio of muon flux and a high survival rate, while areas approaching blue indicate the opposite. In
Figure 7b, areas where the color approaches red indicate a large value of density length, and areas approaching blue indicate the opposite. We present the density-length product distribution in the coordinate system, as shown in
Figure 7b. Given the known terrain, as shown in
Figure 8a, we obtained the length that the rays passed through by means of modeling, and thus the density distribution could be calculated by dividing the density-length product by this path length. Finally, according to the length that the muons passed through (as shown in
Figure 8a), the corresponding density distribution was obtained (as shown in
Figure 8b). In
Figure 8a,b, the horizontal and vertical axes represent the same meanings as in
Figure 6. In
Figure 8a, areas where the color approaches red indicate that the length of muon rays passing through the XiXia mausoleum tower is large, while areas approaching blue indicate the opposite. In
Figure 8b, areas where the color approaches red represent high density.
According to the density imaging results, there is a local high-density zone in the upper part of the mausoleum tower, while the density at the tower’s base is relatively uniform without significant differences. The density gradually increases from bottom to top, showing an obvious gradient change overall. It also decreases gradually from the center to the edges. In the y-axis direction, the density distribution exhibits a certain degree of symmetry, with a similar downward trend in density from the high-density area to both the left and right sides.
4. Discussion
In this study, a local high-density zone was identified in the upper part of the tower of Mausoleum No. 2, whose formation is speculated to may be closely linked to the fine screening of rammed earth raw materials and the optimization of ramming methods. The rammed earth used to construct the tower was strictly processed, where ordinary loess was screened and mixed with fine sand, lime, and other components to form a composite structure, enhancing water resistance and mitigating seepage risks [
34]. In the ramming process, the thickness of rammed layers and the frequency of ramming strokes significantly influenced density. Therefore, it might be conjectured that the high-density zone in the upper part of the tower is primarily composed of a loess-fine sand-lime mixture, a result of the intensified thin-layer and high-frequency ramming process of thin-layer ramming and high-frequency ramming. This appears to be consistent with the historical records of XiXia architecture emphasizing meticulous craftsmanship, aligns with the technical chain of similar sites, and may reflect the superb architectural engineering level of the XiXia period.
It is worth noting that in the Tang and Song dynasties, the tops of high-ranking buildings such as pagodas and mausoleum towers often appear to have a special chamber purportedly for housing cultural relics. Based on this, it might be tentatively speculated that Mausoleum No. 2 may have emulated this system. If such an area exists, the walls of its cavity would be reinforced with bricks, stones, or rammed earth, and internal cultural relics such as bronze wares, stone coffins, etc., would have higher densities, forming local high-density extreme regions with clear boundaries. However, current muon imaging tends to be difficult to identify small-scale cavities or cultural relics and may require further verification through the following means. As the current data has not overcome the above limitations, it is conservatively inferred that the phenomenon is likely caused by differences in building materials and craftsmanship, while maintaining ample room for multiple interpretations pending follow-up research [
2,
3].
In this study, the spatial resolution of density imaging was constrained by the limited field observation time. Therefore, it is recommended that in subsequent research, the model of Mausoleum No. 2 of the XiXia Imperial Tombs be further refined, detection time be extended, the number and distribution density of detectors be increased, higher-resolution segmented scintillator detectors be used, multi-position and multi-angle observations be conducted around the research target, and more muon data be collected to provide richer data to enhance imaging resolution. Higher-resolution tomographic inversion algorithms should be applied to obtain three-dimensional density structures and form high-resolution density images of the mausoleum tower [
27].
