Article

Comprehensive Approach with Machine Learning Techniques to Investigate Early-Onset Preeclampsia and Its Long-Term Cardiovascular Implications

by
Paula Domínguez-del Olmo
1,2,
Ignacio Herraiz
2,3,4,
Cecilia Villalaín
2,3,4,
Alberto Galindo
2,3,4,
Mailyn Moreno-Espino
5,6 and
Jose Luis Ayala
1,7,*
1
Department of Computer Architecture and Automation, Faculty of Informatics, Complutense University, 28040 Madrid, Spain
2
Maternal and Child Health and Development Research Network (RICORS-SAMID Network) Ref. RD21/0012, Spain
3
Department of Public and Maternal-Child Health, Complutense University of Madrid, 12 de Octubre University Hospital, 28041 Madrid, Spain
4
Research Institute Hospital 12 de Octubre (i+12), 28041 Madrid, Spain
5
Department of Software Engineering and Artificial Intelligence, Faculty of Informatics, Complutense University, 28040 Madrid, Spain
6
Institute of Knowledge Technology, Complutense University, 28040 Madrid, Spain
7
Maternal and Child Health and Development Research Network (RICORS-SAMID Network) Ref. RD24/0013/0013, Spain
*
Author to whom correspondence should be addressed.
Appl. Sci. 2025, 15(16), 8887; https://doi.org/10.3390/app15168887
Submission received: 9 June 2025 / Revised: 25 July 2025 / Accepted: 4 August 2025 / Published: 12 August 2025
(This article belongs to the Special Issue Advanced Technologies in Medical/Health Informatics)

Abstract

Featured Application

This study highlights the clinical applicability of artificial intelligence in both the short- and long-term management of early-onset preeclampsia (eoPE). The predictive models developed enable dynamic reclassification of eoPE risk during the second trimester, using routinely collected early pregnancy data, and facilitate the early identification of women at risk for future cardiovascular disease, particularly hypertension. In addition, the integration of follow-up clustering analysis lays the groundwork for establishing long-term cardiovascular monitoring programs tailored to women with a history of eoPE. Together, these tools support the advancement of improved screening protocols and personalized care pathways in both obstetric and cardiovascular medicine.

Abstract

Preeclampsia (PE), a major cause of perinatal morbidity and mortality, is frequently under-recognized as an early indicator of future cardiovascular (CV) disease. This study examines early-onset preeclampsia (eoPE) across three phases—pre-pregnancy, diagnosis, and follow-up—to dynamically reclassify risk of eoPE in the second-trimester and assess long-term CV implications. A case-control study involving 50 women with eoPE (diagnosed before 34 weeks) and 50 matched controls with uncomplicated pregnancies employed supervised machine learning to develop two predictive models: one for reevaluating first-trimester eoPE risk, with test sensitivity/specificity of 95.0% (92.2–97.8%)/99.0% (97.6–100.0%) and another for predicting post-pregnancy hypertension (HT), with test sensitivity/specificity of 74.1% (67.2–80.9%)/89.1% (85.5–92.8%). Metaheuristic methods identified key features for risk reevaluation and prediction, achieving high predictive performance using routine early pregnancy data and diagnostic information. These findings should be interpreted with caution due to the sample size limitations. Additionally, unsupervised machine learning on follow-up data (median 7.5 years postpartum) was used to explore how pregnancy conditions shape long-term health in eoPE patients.

1. Introduction

Preeclampsia (PE) is a complex and multifaceted disorder affecting 5–8% of pregnancies worldwide, presenting significant challenges for maternal and fetal health. It is characterized by the onset of hypertension (HT) after 20 weeks of gestation, often accompanied by proteinuria or signs of organ dysfunction such as renal failure, liver damage, neurological impairment, or fetal growth restriction (FGR) [1,2,3]. The repercussions of PE extend beyond pregnancy, with long-term cardiovascular (CV) complications being markedly prevalent among women who have experienced this condition [4,5].
Clinical practice distinguishes between early-onset PE (eoPE), diagnosed before 34 weeks of gestation, and late-onset PE, diagnosed thereafter [6]. Research indicates that eoPE is associated to more severe placental dysfunction and greater maternal physiology alterations, which may contribute to a higher CV burden [4,5,6,7]. CV disease, the leading cause of morbidity and mortality in women, has traditionally been under-researched in this population, often being viewed as a male condition and that excluded women from clinical trials [6]. Non-traditional CV disease risk contributors, such as gestational complications, have increased recognition, highlighting their role in women’s CV health [8]. Pregnancy involves major physiological adaptations to support placental function, and in severe cases, vascular dysfunction may manifest as eoPE before 34 weeks [7]. Although eoPE resolves after delivery, it leaves women vulnerable to lifelong CV disease risk. In a recent prospective case-control study, we reported a 4.7-fold risk of chronic HT in women with a history of eoPE compared to matched controls by prior CV risk factors. Notably, traditional CV risk scores failed to identify these women, suggesting that a history of eoPE should be considered as an independent factor for the development of CV disease [9].
Early detection of eoPE is crucial, enabling timely intervention to prevent adverse maternal and fetal outcomes. Currently, a first-trimester screening method using Bayes’ theorem and combining maternal factors with biophysical and biochemical markers exists, with good sensitivity (75%) and specificity (90%) [10]. However, it is still not widely implemented (e.g., it is not endorsed in the U.S.), and does not update the risk with the new information that the ongoing pregnancy provides, nor does it give information on long-term CV risks. Additionally, more than 95% of patients considered to be at high-risk of developing eoPE with this approach will never have this condition. This highlights a critical gap for methods that can strengthen risk detection and address the long-term CV consequences associated with eoPE as well.
In light of these challenges, artificial intelligence (AI) has been identified as an area of potential progress, offering a promising approach to enhancing early detection and management strategies. By harnessing the power of AI, particularly machine learning (ML), we seek to uncover complex patterns and early indicators of eoPE that traditional methods might overlook [11]. Leveraging a unique longitudinal dataset encompassing three critical time points—pre-pregnancy baseline, PE diagnosis, and midterm follow-up post-delivery—our methodology reevaluates eoPE risk in the second trimester and predicts subsequent CV complications. Bio-inspired metaheuristic algorithms have been employed for feature selection and clustering analysis, enhancing model performance and providing insights into eoPE progression and its long-term impacts. This approach aims to improve immediate patient outcomes through earlier, more precise interventions while establishing a foundation for comprehensive, long-term health monitoring and risk mitigation strategies.
Section 2 provides an overview of the current state of research in the field. Section 3 describes the study methodology, beginning with an introduction to the datasets and their specific applications across three time points. It then outlines the methodological approach, distinguishing between supervised and unsupervised ML techniques. Section 4 presents the results organized by time frame and Section 5 provides an in-depth discussion; finally, Section 6 concludes with a summary and final remarks.

2. Related Work

The traditional assessment of PE risk relied on identifying maternal risk factors (medical history, age, body mass index, etc.), classifying patients as high or low risk. While simple, this method has low predictive accuracy and lacks individualized risk estimates [12]. To address these limitations, ML techniques are being integrated to enhance diagnostic accuracy and optimize medical processes. In particular, the use of AI for detecting PE and assessing postpartum CV risk has gained significant attention in recent research. Table 1 summarizes representative prior studies that have applied supervised and unsupervised ML algorithms to predict PE, outlining their main approaches, merits, and limitations.
To the best of our knowledge, no prior study has addressed all three critical temporal stages of pregnancy in a single study. Our research fills this gap by providing insights into the continuum of PE impact throughout pregnancy, highlighting its lasting effects on women’s health beyond childbirth. Additionally, although the use of evolutionary algorithms has gained popularity recently, there has been little progress in adapting these methods for PE screening. PE is a constantly changing condition, and traditional risk models often ignore the dynamic interactions of risk factors and their evolving effects on PE development. Our study introduces an innovative framework by incorporating genetic algorithms that can continuously refine and improve risk models in response to new data, ensuring they remain current and accurate representations of the disease environment.
The eoPE risk reevaluation model is not intended to substitute the first-trimester screening but to complement it by allowing dynamic risk reclassification, aiming to optimize prevention strategies and enhance clinical management. Furthermore, unlike previous models that broadly assessed CV risk [16], our second model focuses on providing greater specificity by predicting post-pregnancy HT.

3. Materials and Methods

3.1. Study Overview and Dataset Composition

This observational case-control study includes a retrospective phase in which we analyzed data from women who delivered at Hospital 12 de Octubre in Madrid between 2008 and 2017, all aged ≥18 years, with singleton pregnancies unaffected by congenital anomalies and complete perinatal results. The prospective phase focused on evaluating the postpartum period. This research is a post-hoc analysis of a recently published study [9].
Cases of eoPE were retrieved from a repository of prior investigations [17,18]. PE was defined by the presence of de novo HT (systolic blood pressure ≥ 140 mmHg or diastolic blood pressure ≥ 90 mmHg demonstrated on at least two occasions separated by ≥4 h and ≤7 days) after the 20th week of gestation and accompanied by significant proteinuria (≥300 mg in 24 h urine or ≥0.3 protein (mg/dL)/creatinine (mg/dL) ratio in a random urine sample or ≥+1 on dipstick) [19]. Although current definitions of PE no longer require proteinuria, we adhered to this criterion to maintain consistency during the study period when eoPE cases occurred. Additionally, an sFlt-1/PlGF ratio >85 in peripheral blood at the time of eoPE diagnosis was used as a surrogate marker of maternal endothelial damage [20]. To reduce bias from preexisting factors, 1:1 matching was conducted between the groups based on maternal age at delivery (±2 years), delivery date (±6 months), parity (nulliparous or multiparous prior to the selected pregnancy), and body mass index (BMI) (±3 kg/m2).
Recruitment took place between May 2019 and May 2023. A complete description of the methodology is available elsewhere [9]. In brief, women from both groups were contacted via telephone, informed about the study, and invited to participate. Priority was given to those with the longest latency time since delivery, who had available contact information and lived locally.
Databases from previous research yielded 247 women with a history of eoPE in the past 12 years, who met all eligibility criteria. Of these, 90 were invited to participate, with 50 (55.56%) consenting and 40 (44.44%) either unreachable or declining due to time constraints. Control participants were matched according to predefined criteria, resulting in 100 total participants.
Baseline and diagnosis data were obtained from medical records, while visit data corresponded to tests performed during the prospective phase, which involved a single scheduled appointment with each participant. We have summarized the dataset structure in Table A1 in Appendix A. This includes the number of patients, total variables, type of variables, and missing data percentage across each study phase.
All data were collected using the REDCap (Research Electronic Data Capture) tool hosted at the Research Institute Hospital 12 de Octubre [21]. This study was approved by the local research ethics committee (PI19/01579).

3.1.1. Timestamp 1: Pre-Pregnancy Baseline

The baseline period in our study includes pre-pregnancy, first-trimester, and second-trimester stages, ending with the 20-week ultrasound. Given our study design, the model is required to utilize data from the second trimester for dynamic risk reclassification. At this stage, all patients included in this study had not yet been diagnosed with eoPE.
Our baseline dataset initially comprised 100 patients, divided equally into 50 cases (those who later developed eoPE) and 50 controls. The dataset included 30 variables: 15 numerical and 15 categorical. These variables captured a broad spectrum of maternal health and demographic factors at the start of pregnancy, such as maternal age, weight, and chronic HT. Additionally, the dataset incorporated pregnancy-related information from first- and second-trimester ultrasound scans, including crown-rump length and uterine artery pulsatility indices.
Upon analyzing the dataset, we found a total missing value percentage of 6.50%. Notably, variables related to uterine arteries had the highest percentage of missing values at 38%. Recognizing the importance of these variables for diagnosing PE and the impracticality of imputing such a high percentage of missing data, we decided to remove some patients lacking this data. This reduction resulted in a final dataset of 80 patients, with 40 labeled as ‘case’ and 40 as ‘control’. Consequently, the total percentage of missing values decreased to 4.49%, and the missing data for uterine artery-related features dropped to a manageable 23.75%, which was then carefully imputed.
A table presenting the summary statistics and statistical comparison between the case and control groups has been included in Appendix A (Table A2).
Designed for use after the 20-week scan, this model complements first-trimester screening by enabling dynamic risk re-classification, crucial for adapting clinical management as pregnancy progresses. It identifies changes in actual risk and reassesses risk in women initially classified as low risk, enhancing safety and confidence. This foundation supports further analyses at the diagnostic and follow-up stages.
Table A3 in Appendix A provides a detailed description of all variables included in the baseline dataset.

3.1.2. Timestamp 2: Diagnosis-to-Delivery Phase

The diagnostic phase of our study aims to identify variations in the manifestation of eoPE and predict the development of post-pregnancy HT in women with a history of eoPE. This phase includes variables collected from the time of eoPE diagnosis until the end of pregnancy.
Initially, our diagnostic dataset included 50 women. However, to ensure the accuracy of our predictions, we excluded five patients with preexisting chronic HT, resulting in a final dataset of 45 patients. Among them, 17 developed HT: 12 cases within the first two years postpartum, 2 cases between the 4th and 6th years, and 3 cases between the 6th and 8th years.
The dataset comprised 28 input variables, with 18 numerical and 10 categorical. These variables covered a broad range of factors related to maternal health during pregnancy, such as blood pressure readings, pulsatility indices of various arteries, medication usage, symptoms, corticosteroid administration, severity criteria, and maternal complications. To ensure data quality, features with more than 25% missing values were excluded, reducing the overall percentage of missing data to 5.06%. This comprehensive set of features was designed to capture the nuances of eoPE manifestation and its progression, aiding in the development of a model for predicting post-pregnancy HT (defined as systolic BP ≥ 140 mmHg, diastolic BP ≥ 90 mmHg, or the use of antihypertensive medication, which must be present at least three months after delivery).
Table A4 in Appendix A provides a detailed description of the variables included in the diagnostic dataset.

3.1.3. Timestamp 3: Follow-Up Visit

The prospective phase of our study involved a single in-person appointment per participant. During this visit, detailed explanations of the study procedures were provided, and informed consent was obtained from all participants. The assessments, conducted at a median of 7.5 years (interquartile range, 6.5–9) postpartum, comprised three main components: blood and urine tests, atherosclerosis evaluation, and ambulatory blood pressure monitoring (ABPM).
Peripheral blood and urine samples were collected to analyze routine parameters such as hemogram, coagulation, biochemistry, lipids, iron metabolism, renal function, and immunologic markers, along with two vascular remodeling biomarkers: MMP-9 and TIMP-1. Subclinical atherosclerosis was assessed via 2D ultrasound by measuring intima-media thickness (IMT) in the carotid and femoral arteries and detecting plaques, defined as focal parietal thickenings exceeding 1.3 mm or 50% thicker than the adjacent arterial wall. Additionally, ABPM was performed over 24 h to evaluate blood pressure variations under normal daily conditions, providing valuable CV insights. Additionally, participants completed a brief survey to collect baseline visit data, including BMI, smoking status, medical history, and current medication usage.
Our analysis employed clustering techniques to examine how specific conditions during pregnancy influence future health phenotypes among eoPE patients. This approach aimed to uncover patterns that could inform more personalized and effective interventions, thereby enhancing our understanding of the long-term health impacts of eoPE.
Figure 1 illustrates the datasets used in this phase: the blood and urine analysis dataset included 43 patients and 47 numerical variables with a total missing value percentage of 0.92%; the atherosclerosis study dataset comprised 44 patients and 5 numerical variables with a total missing value percentage of 1.89%; and the ABPM dataset consisted of 37 patients and 15 numerical variables with no missing values. Table A5 in the Appendix A provides a detailed description of all variables included in the visit phase.

3.2. Data Strategy

Data preprocessing, a critical step in any ML pipeline, was uniformly applied across datasets from each study phase to ensure data quality and integrity. For these, scikit-learn 1.2.1, PywinEA 0.0.2, Pandas 2.0.3, numpy 1.23.5 and matplotlib 3.7.5 libraries from Python 3.8.5 were used. Missing values were imputed using the MissForest technique, which iteratively predicts and updates missing data using Random Forest models. The process involves splitting the dataset into complete and incomplete parts, building decision trees from the complete subset, predicting missing values, and updating the dataset iteratively until convergence is achieved [22]. This approach ensures accurate and refined imputation, enhancing the reliability of the dataset for subsequent analyses.
MissForest was selected for its ability to handle both numerical and categorical variables, effectively detect and manage outliers, and capture complex, nonlinear relationships between variables. Unlike simpler imputation methods, it avoids assumptions of linearity, preserves the structure and distribution of the original data, and produces more accurate imputations, which are critical for the reliability of ML models [22]. Using the Iterative Imputer tool in Scikit-Learn with a Random Forest classifier [23], we ensured high-quality imputed data for both supervised and unsupervised analyses. After the imputation process, we checked that the distribution of each imputed data set was consistent with the original data.
To maintain data quality, we eliminated variables with more than 25% missing values, particularly ultrasound and laboratory variables from the diagnostic phase, since these were not consistently available across all patients and were not uniformly collected due to varying progression times after diagnosis.
Dichotomous categorical variables were encoded as 0 and 1, representing “no” and “yes” responses, respectively. Polytomous categorical variables were transformed into one-hot vectors. Numerical variables were normalized using the Standard Scaler tool from the Scikit-Learn library [24], standardizing the data to have a mean of 0 and a standard deviation of 1, as shown in Equation (1).
X s t d = X μ σ

3.3. Machine-Learning Models

We applied tailored strategies for each specific time frame of our study, implementing these approaches using custom Python scripts.

3.3.1. Supervised Learning

To develop the eoPE risk reevaluation and post-pregnancy HT models, we combined supervised ML classifiers with a metaheuristic feature selection strategy to address the challenges of high-dimensional data and small sample size. Specifically, we implemented the GA using the PyWinEA library [25].
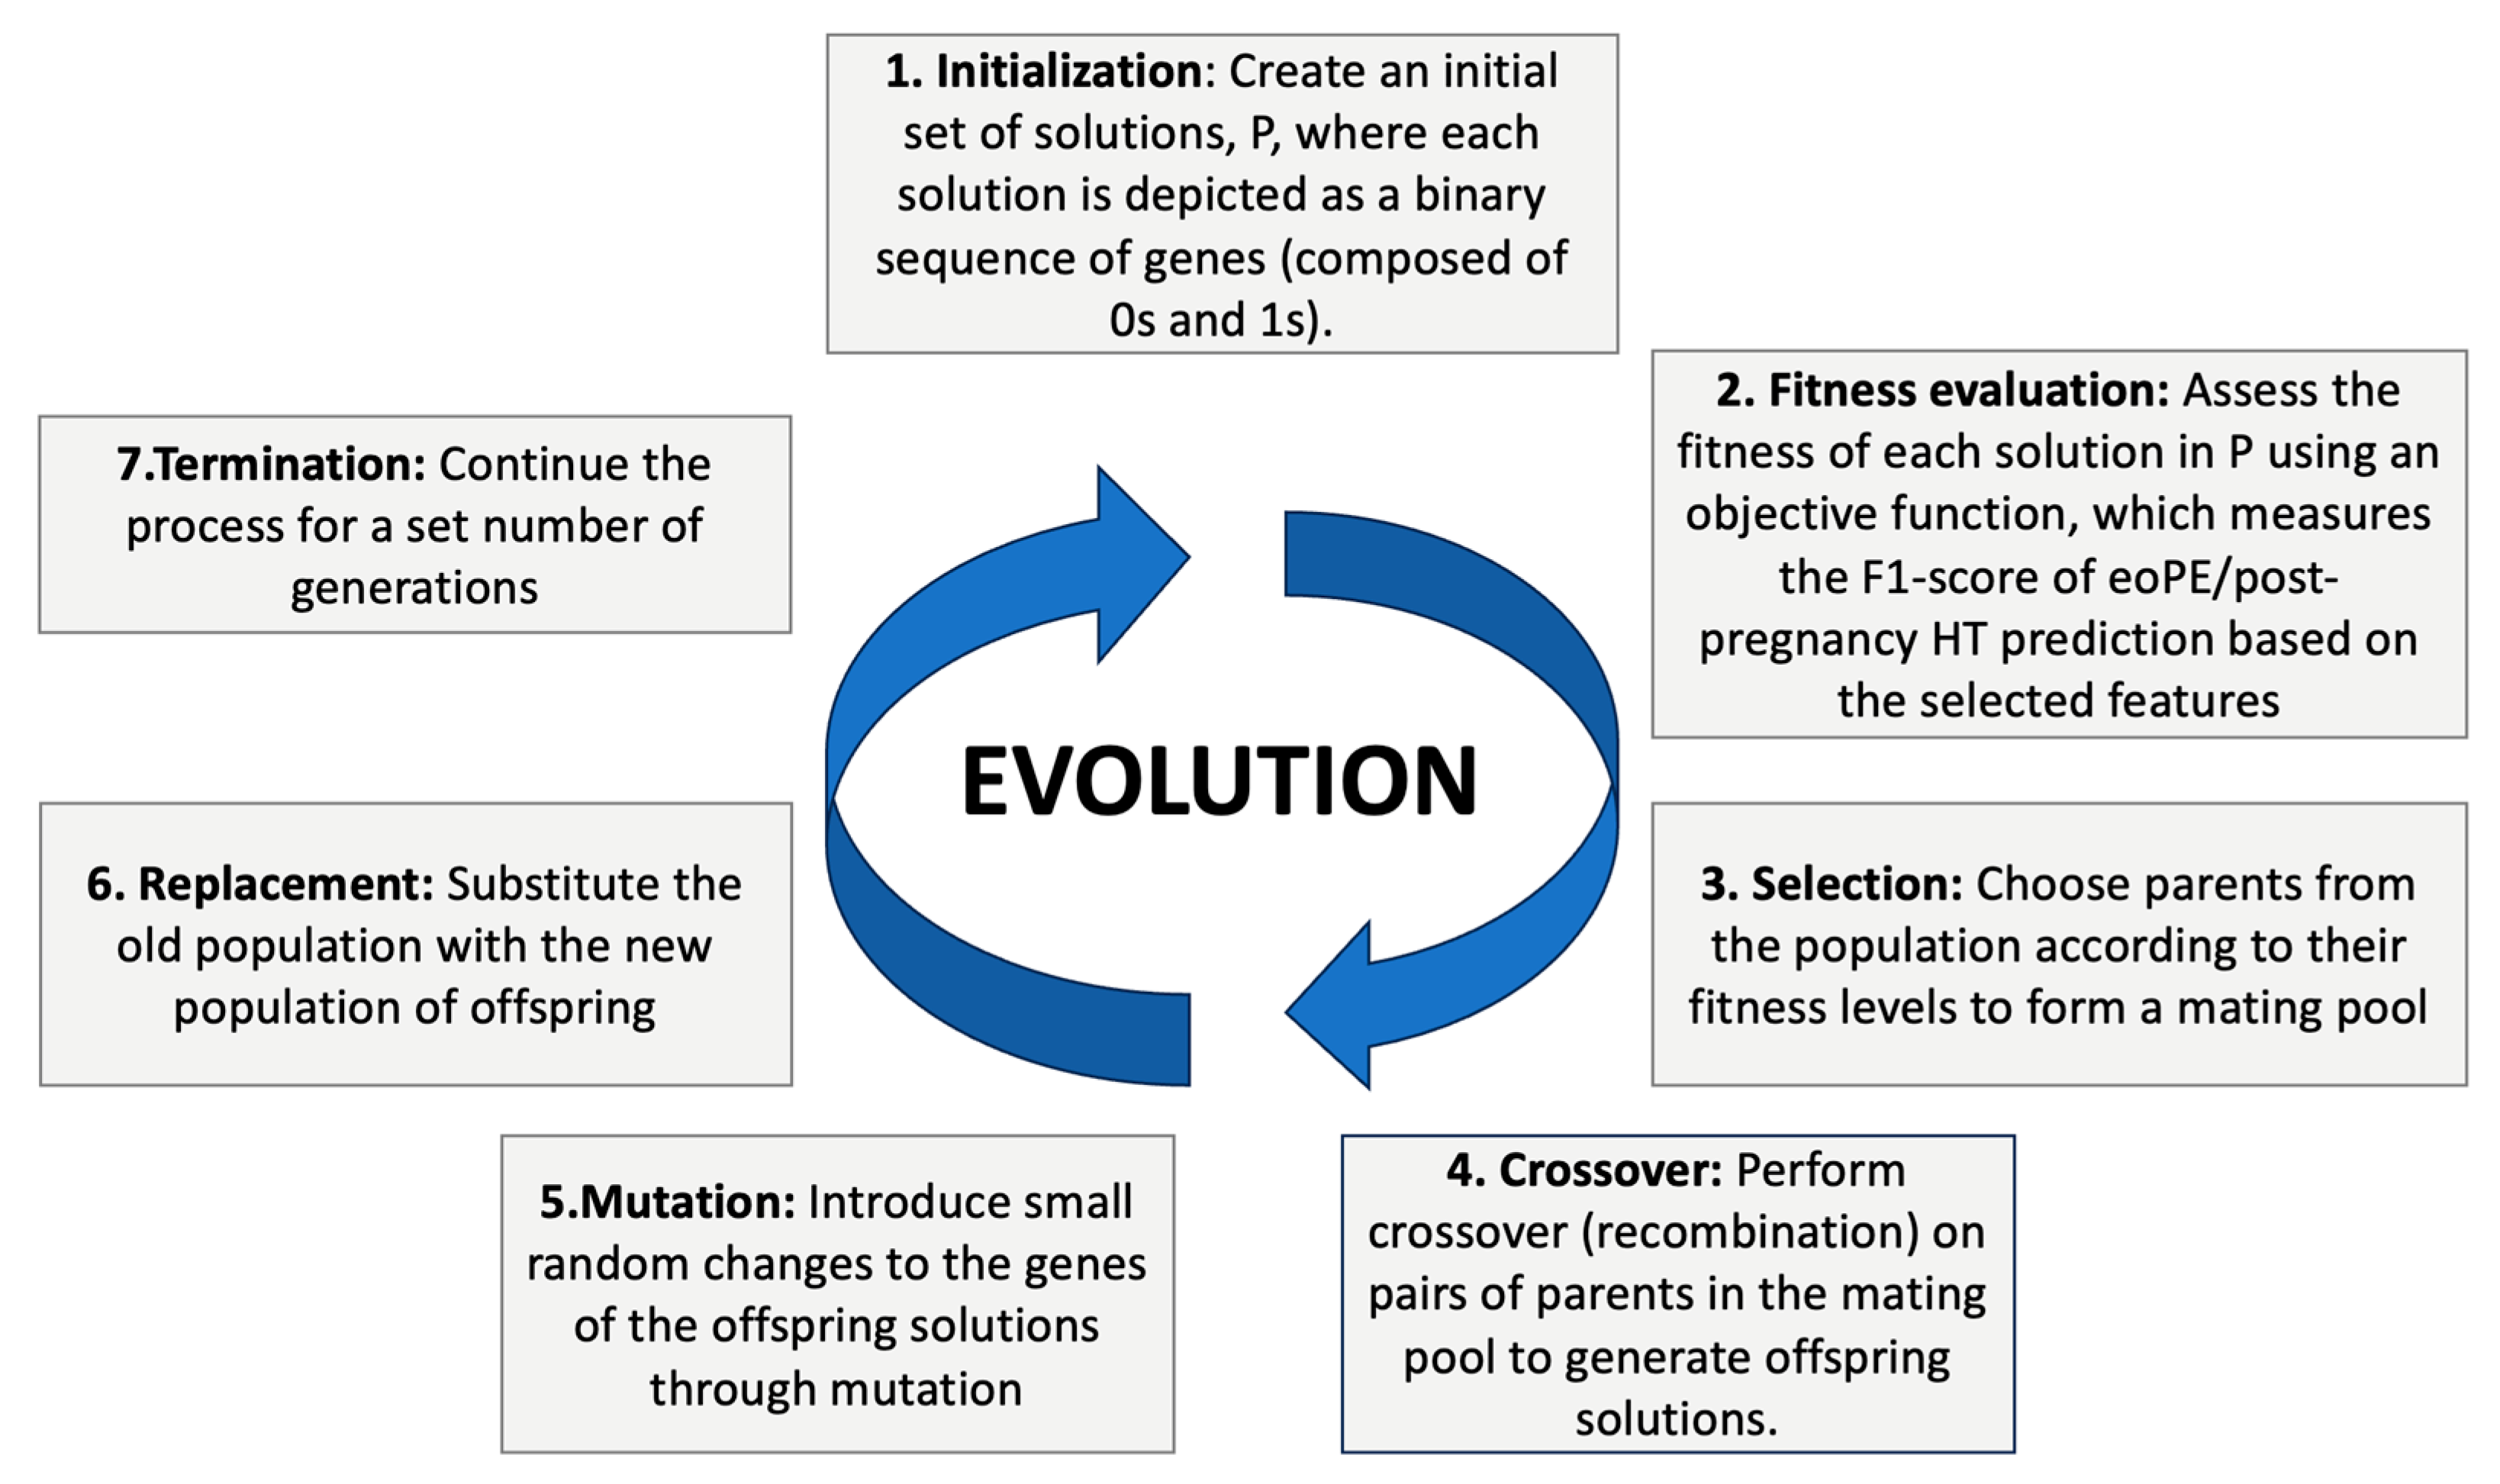
The GA operates through an evolutionary process inspired by natural selection. It begins by generating an initial population of “chromosomes”, where each chromosome represents a unique subset of features from the dataset. These feature subsets are evaluated using a fitness function, which quantifies their predictive performance—measured via F1-score. Based on fitness values, chromosomes are ranked, and the best-performing ones are selected to form the next generation. This selection process is guided by an elitism mechanism, which ensures that top-performing solutions are retained.
The selected chromosomes either pass to the next generation unchanged or undergo crossover and mutation operations. Crossover combines segments of two parent chromosomes to generate new feature combinations, while mutation introduces small random changes to encourage diversity and avoid premature convergence. The overall GA workflow is illustrated in Figure 2.
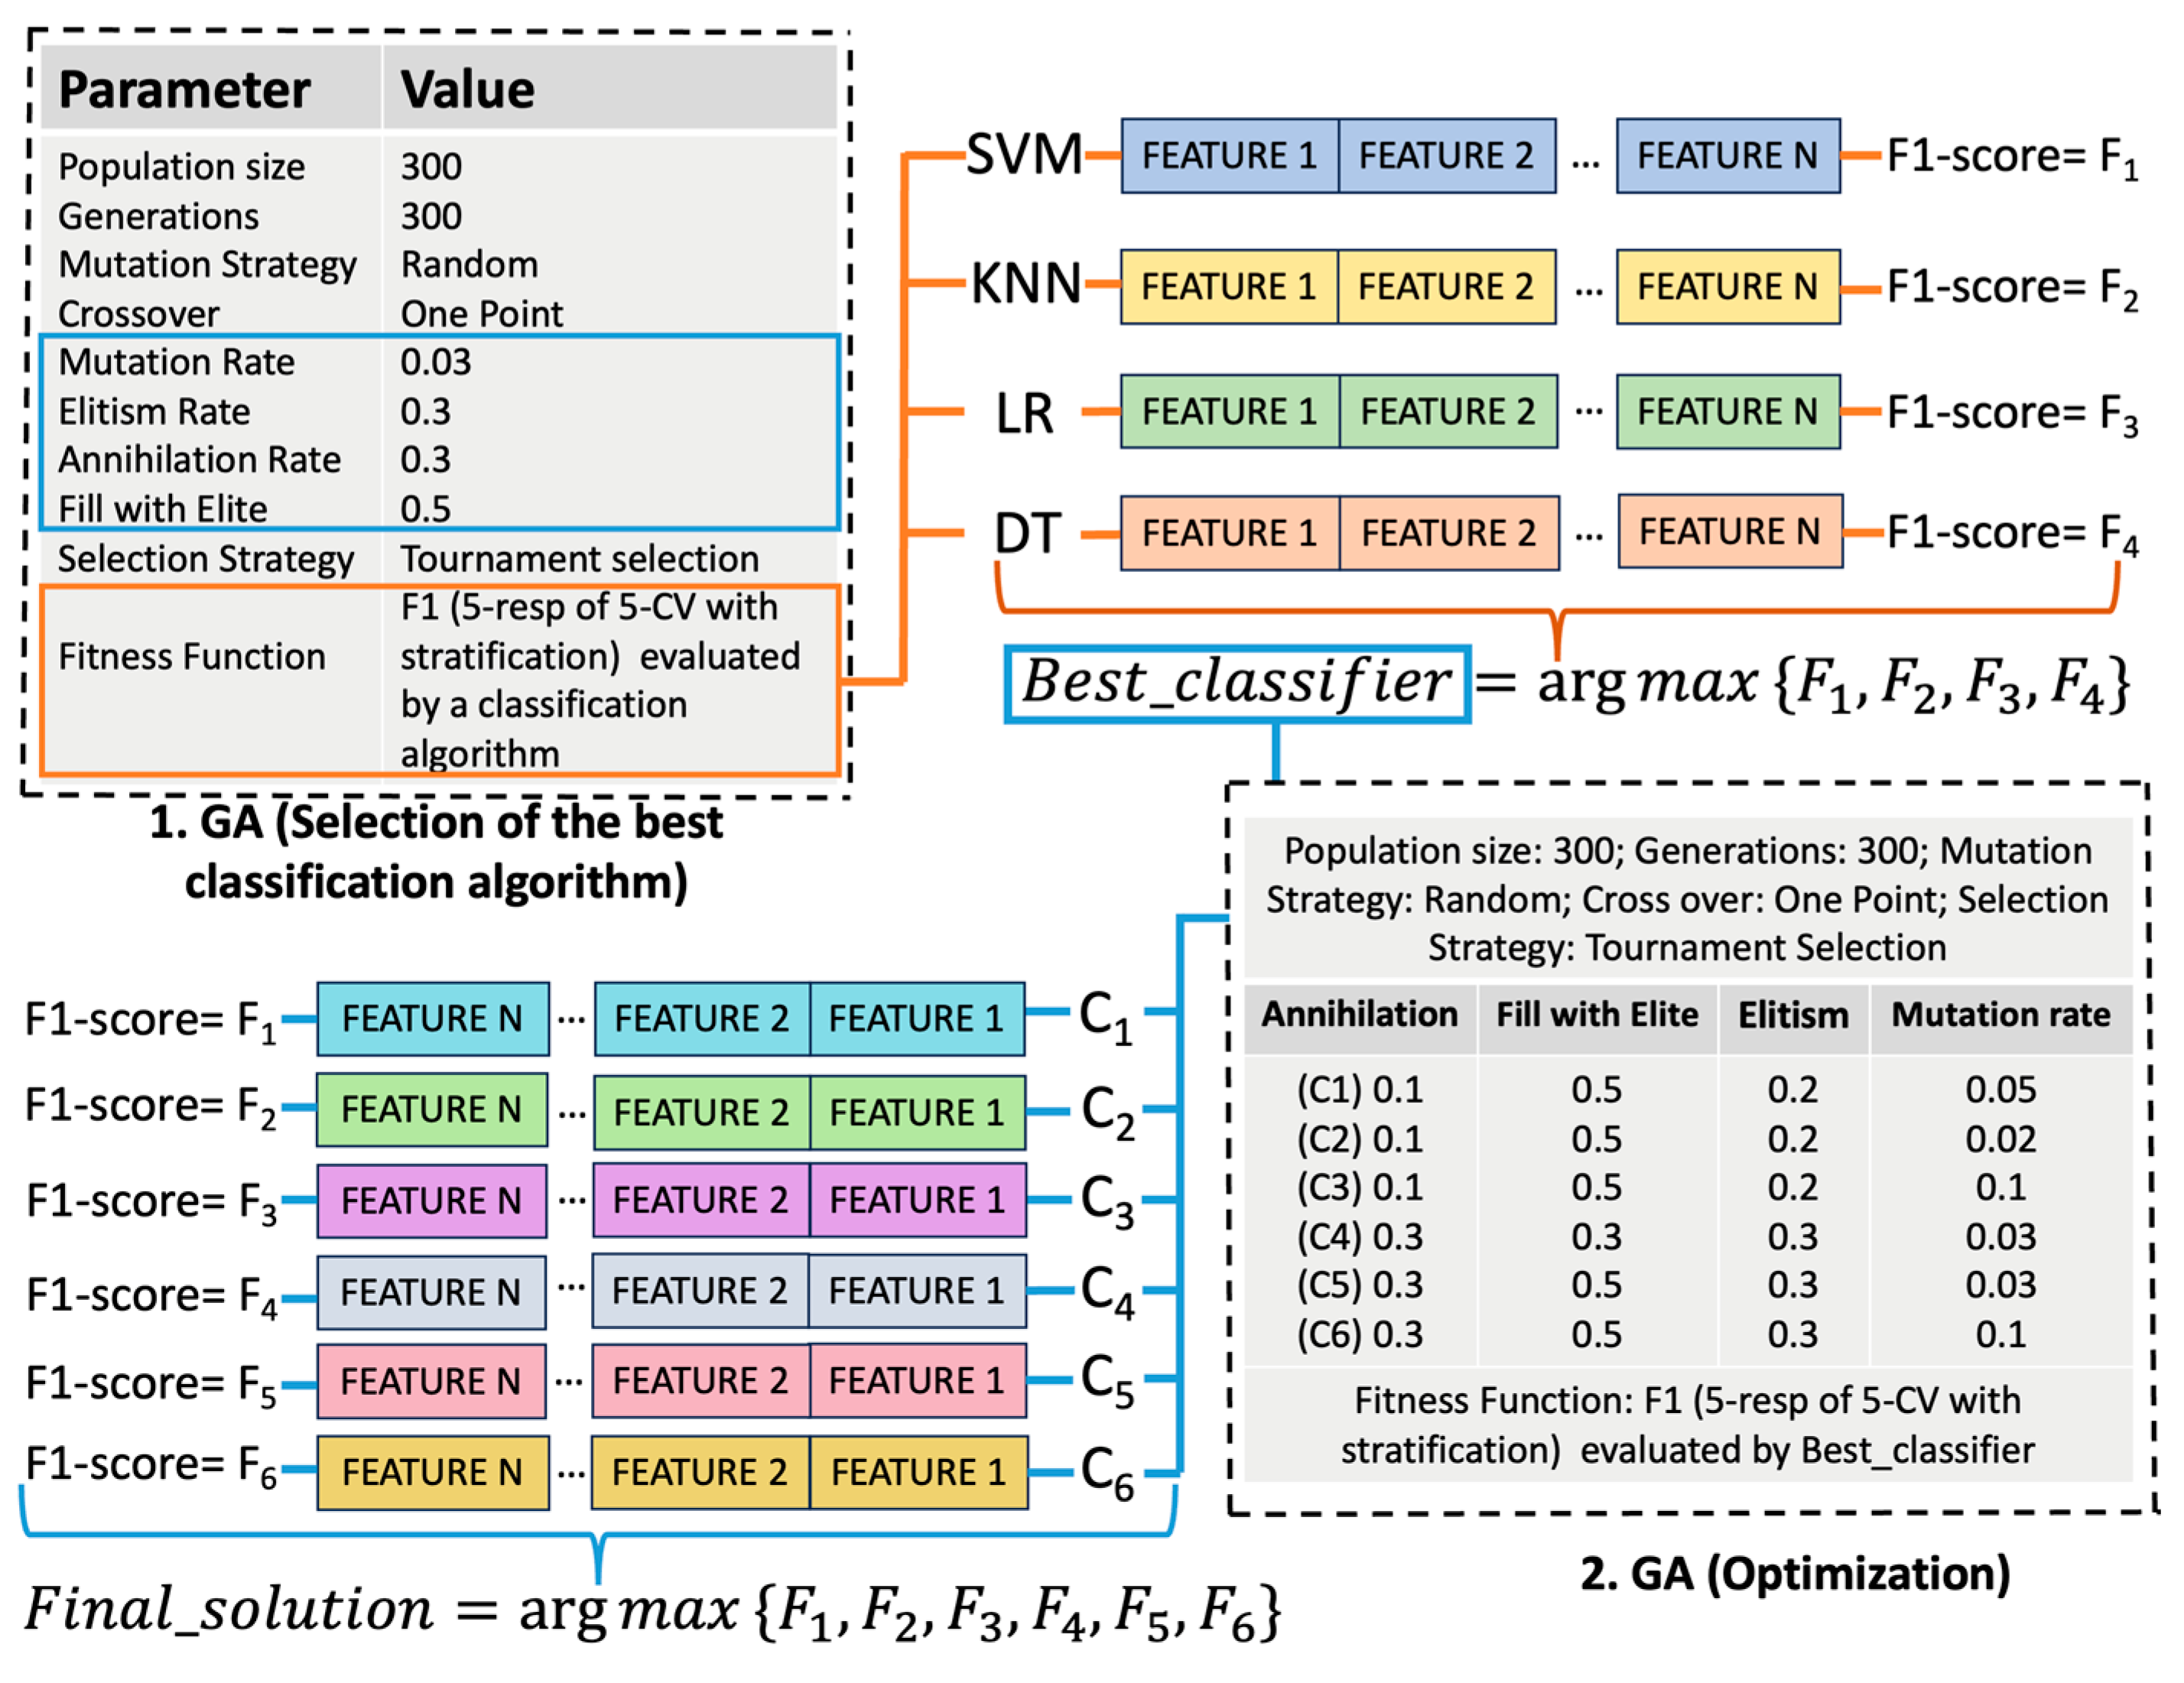
As shown in Figure 3, our implementation followed a two-phase pipeline: (1) algorithm selection and (2) optimization. In the first phase, the GA was integrated with four candidate classifiers—Support Vector Machines (SVMs), Logistic Regression (LR), K-Nearest Neighbors (KNN), and Decision Trees (DT)—which served as estimators within the fitness function. The classifier that achieved the highest F1-score was selected for the corresponding dataset.
In the second phase, once the optimal classifier was chosen, we fine-tuned the GA hyperparameters (mutation rate, fill with elite, elitism, annihilation strategy) to improve robustness and convergence stability.
To ensure reliable performance estimates and minimize overfitting, we used repeated stratified 5-Fold cross-validation with 5 repetitions from scikit-learn Python library [26]. Stratified folds guaranteed class balance [27], and repeated cross-validation provided more stable estimates by reducing variance across splits.
Model performance was assessed using established criteria, including accuracy, precision, recall, specificity, negative predictive value (NPV) and F1-score, all of them explained in the Appendix A (Table A6). The area under the receiver operating characteristic (ROC-AUC) curve have been also used to evaluate discriminative ability and the confusion matrix to facilitate the clinical interpretation of classification errors. All calculations were performed using scikit-learn in Python.
SVM and LR were selected as the final classifiers for the baseline and diagnostic datasets, respectively. In both cases, model hyperparameters were tuned using GridSearchCV from scikit-learn Python library [28].
To improve interpretability, we used SHapley Additive exPlanations (SHAP). SHAP values were computed after final model training on the full dataset, using the SHAP Python package [29]. SHAP summary plots ranked features by their overall impact, while color gradients indicated whether higher values increased or decreased the predicted risk. Waterfall plots illustrated how each feature contributed to individual predictions.
A summary of all algorithms and techniques applied, including their role and justification, is provided in Table 2.

3.3.2. Unsupervised Learning

To explore whether specific clinical conditions during pregnancies affected by eoPE are associated with distinct CV health phenotypes years postpartum, we applied K-means clustering using Python [30], selected after testing other methods like DBSCAN for its superior coherence and interpretability. The optimal number of clusters (K) was determined using the elbow method, which evaluates the within-cluster inertia to identify the point of diminishing returns.
Clustering was performed independently on three follow-up datasets: blood and urine tests, atherosclerosis, and ABPM. For each dataset, we tested 2, 3, and 4 clusters, selecting the configuration that achieved the best Silhouette score and Davies–Bouldin index, ensuring optimal cluster separation. In the blood test analysis, only variables with significant case-control differences were retained to improve relevance.
Once K was established, the algorithm assigned each patient to the nearest centroid based on Euclidean distance, iteratively updating centroids until convergence. After clustering, we characterized each group by comparing demographic and pregnancy-related variables. Distribution normality was assessed with the Shapiro–Wilk test, and comparisons used t-tests or Mann–Whitney U tests for continuous variables, and chi-square or Fisher’s exact tests for categorical variables.

4. Results

4.1. Early-Onset Preeclampsia Risk Reevaluation Model

During the algorithm selection phase, SVM was adopted among LR, KNN, and TD.
With the SVM hyperparameters set as C = 1.0, cache_size = 200, class_weight = “None”, kernel = “rbf”, degree = 3 and gamma = “scale”; and the GA parameters for annihilation (A), fill with elite (FWE), elitism (E), and mutation rate (MR) set to 0.3, 0.5, 0.3, and 0.03 respectively, the selected input features provided an F1-score of 0.968 ± 0.039.
The features selected by the GA included, on one hand, parameters obtained from Doppler studies—specifically, the mean pulsatility index of the uterine arteries and the pulsatility index of the right uterine artery. Both reflect placental function and uteroplacental perfusion, which are directly impaired in eoPE. Although they may appear redundant, the algorithm may be detecting that specific combinations of these values (e.g., a normal mean PI but an elevated right PI) are predictive of risk. On the other hand, the algorithm selected variables that are well established in the literature as risk factors: chronic HT is associated with baseline endothelial dysfunction and increased hemodynamic load during pregnancy; maternal age over 40 is linked to a higher incidence of obstetric complications, including PE; and nephropathy is a condition strongly associated with endothelial damage, baseline proteinuria, and poor hemodynamic adaptation to pregnancy. In the case of heparin, at our center it is administered before 16 weeks of gestation to women with high thrombotic risk or as an adjunct in assisted reproductive techniques. Thus, the algorithm is not identifying a preventive effect of heparin per se but rather learning that most women receiving it present with more significant risk factors—meaning they are closer to the clinical phenotype of eoPE.
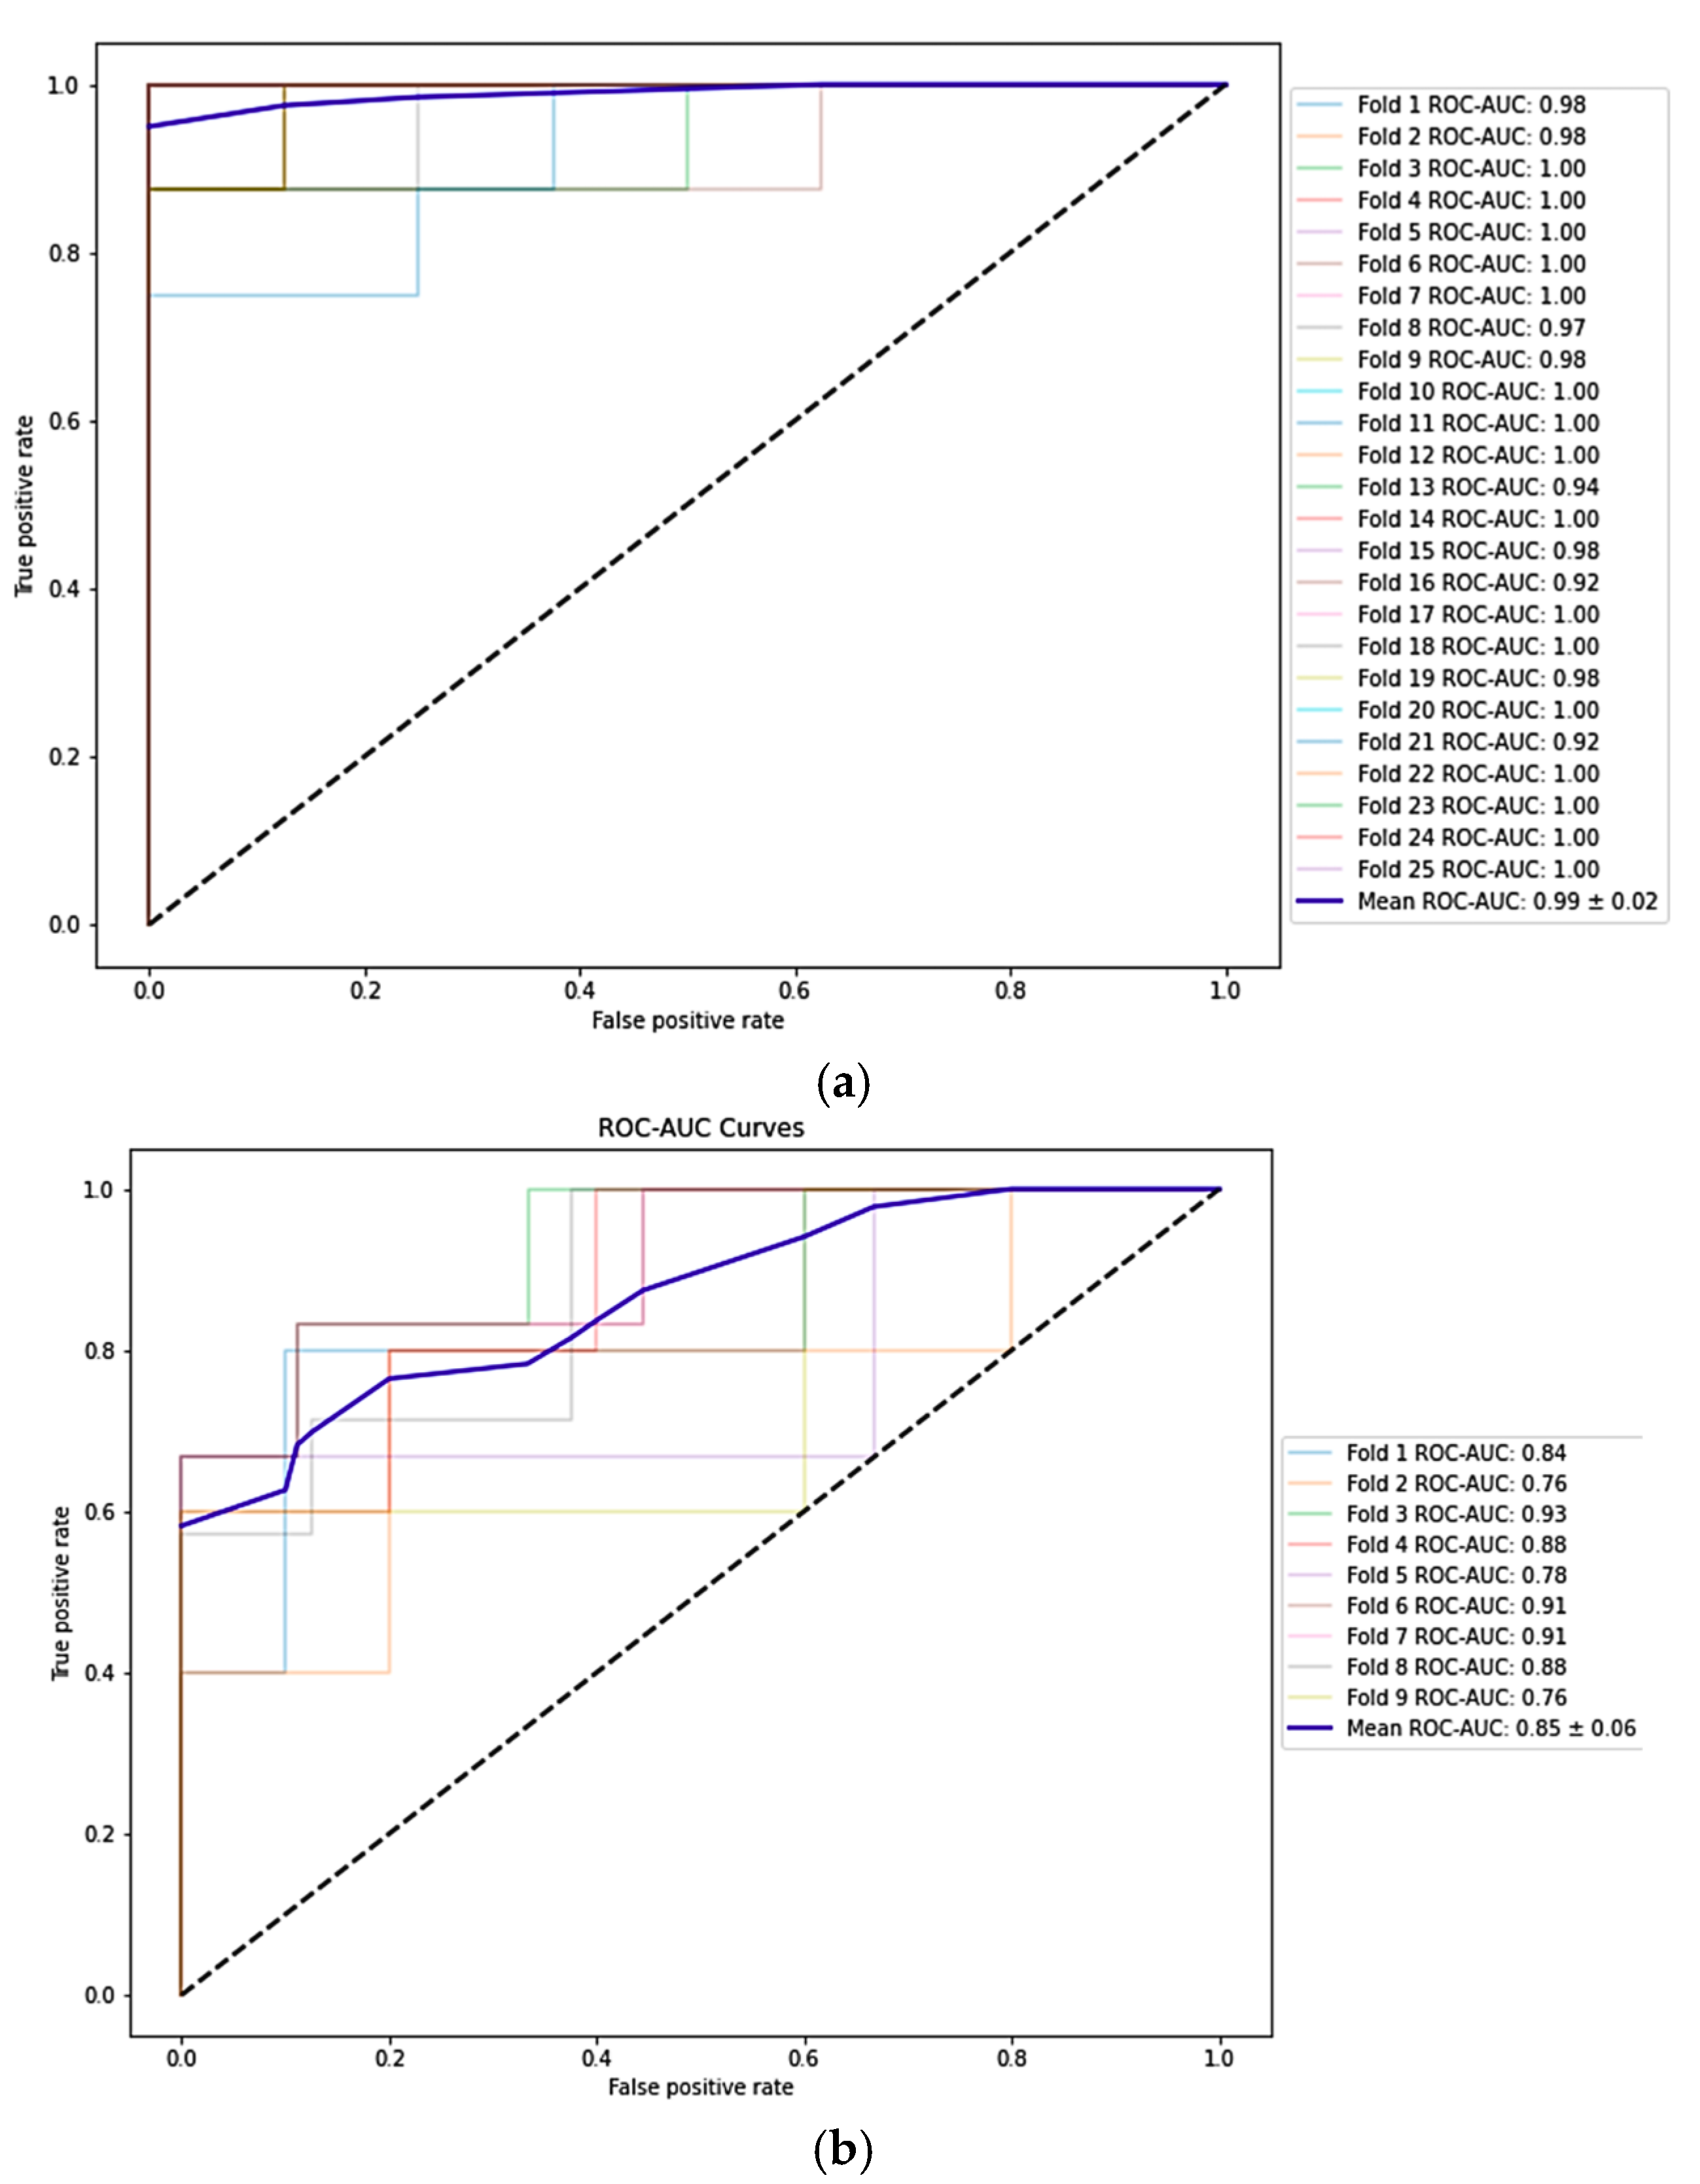
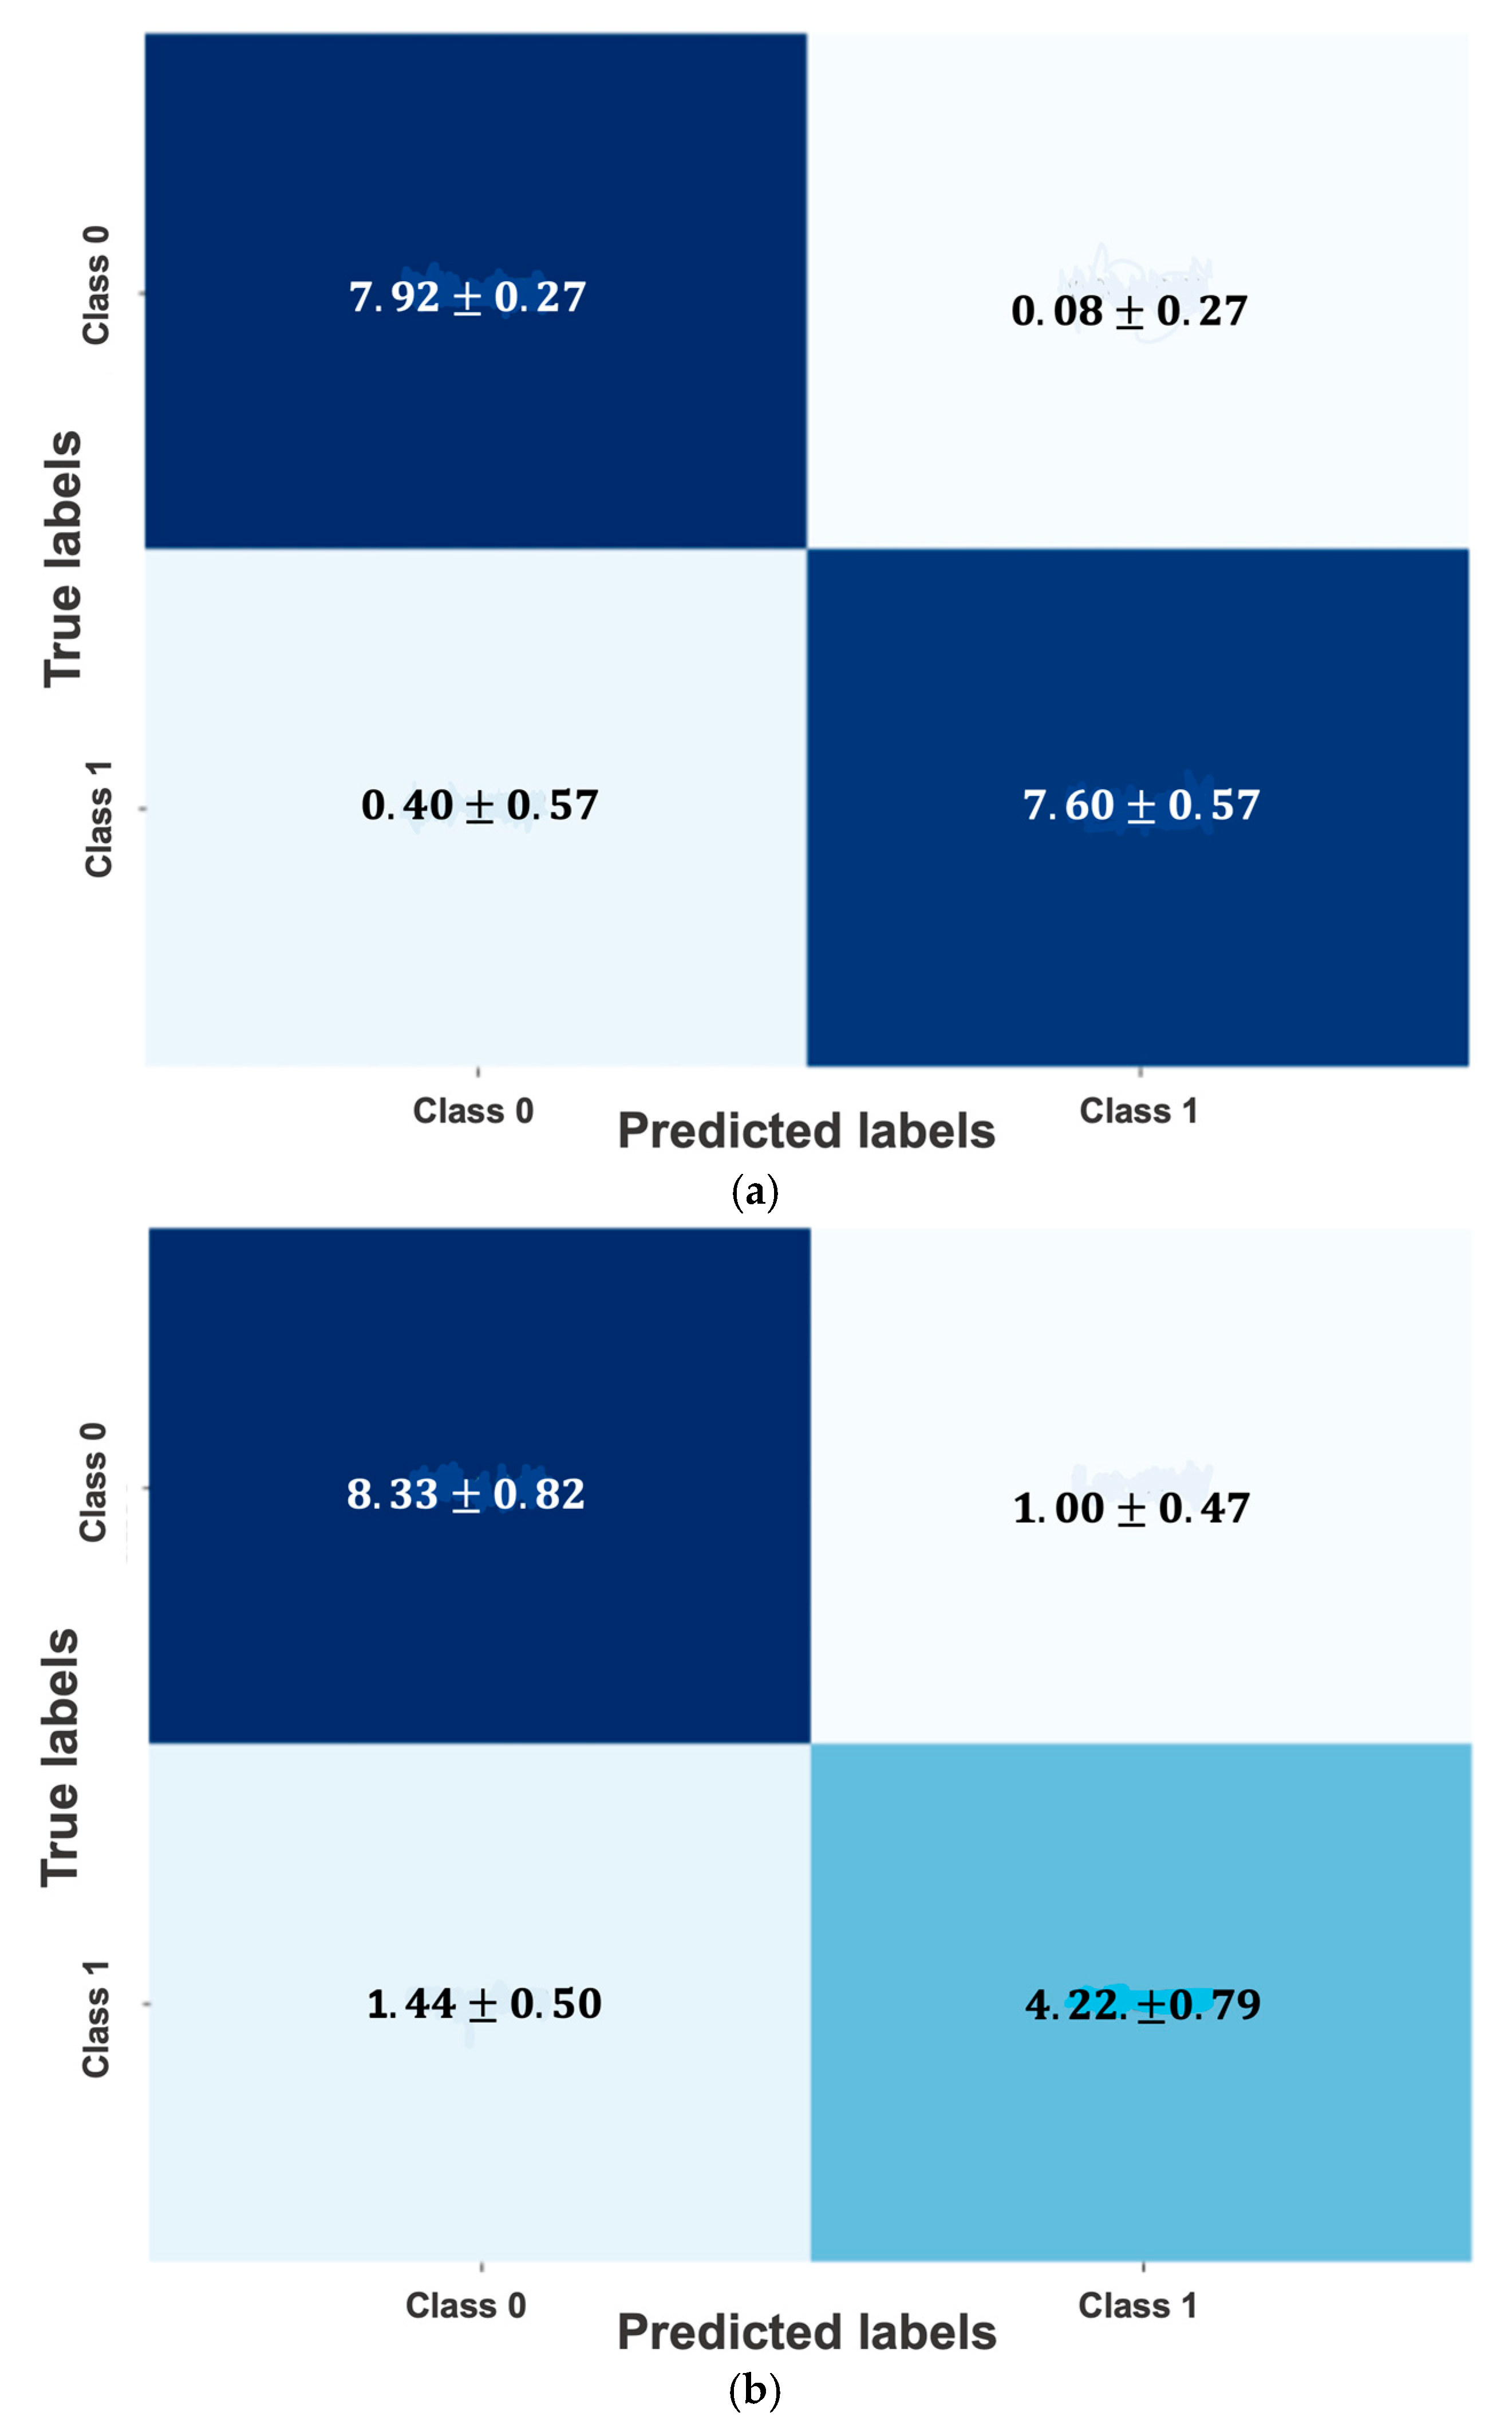
Stratified 5-fold cross-validation with five repetitions was implemented, with metrics reported as the mean (95% confidence Interval) across 25 folds, providing a more robust and realistic estimate of model performance that accounts for variability due to the small sample size and potential heterogeneity of the dataset. As can be shown in Table 3, the best solution demonstrated strong performance across all metrics, with accuracy (0.973 training, 0.970 validation), precision (0.997 training, 0.991 validation), recall (0.950 training, 0.950 validation), and F1-score (0.972 training, 0.968 validation). NPV reached 0.951 in training and 0.956 in validation, while specificity reached 0.998 in training and 0.990 in validation. Additionally, the model achieved a mean ROC-AUC of 0.990 ± 0.02 (Figure A2a Appendix A), reflecting consistently high performance across data partitions. The Appendix A also includes the average confusion matrix (Figure A3a Appendix A), allowing for a more detailed analysis of the distribution of true positives, false positives, true negatives, and false negatives across the cross-validation process. However, these favorable metrics should be interpreted prudently, given the inherent limitations of the dataset and the lack of independent validation, both of which are discussed in the Limitations section.
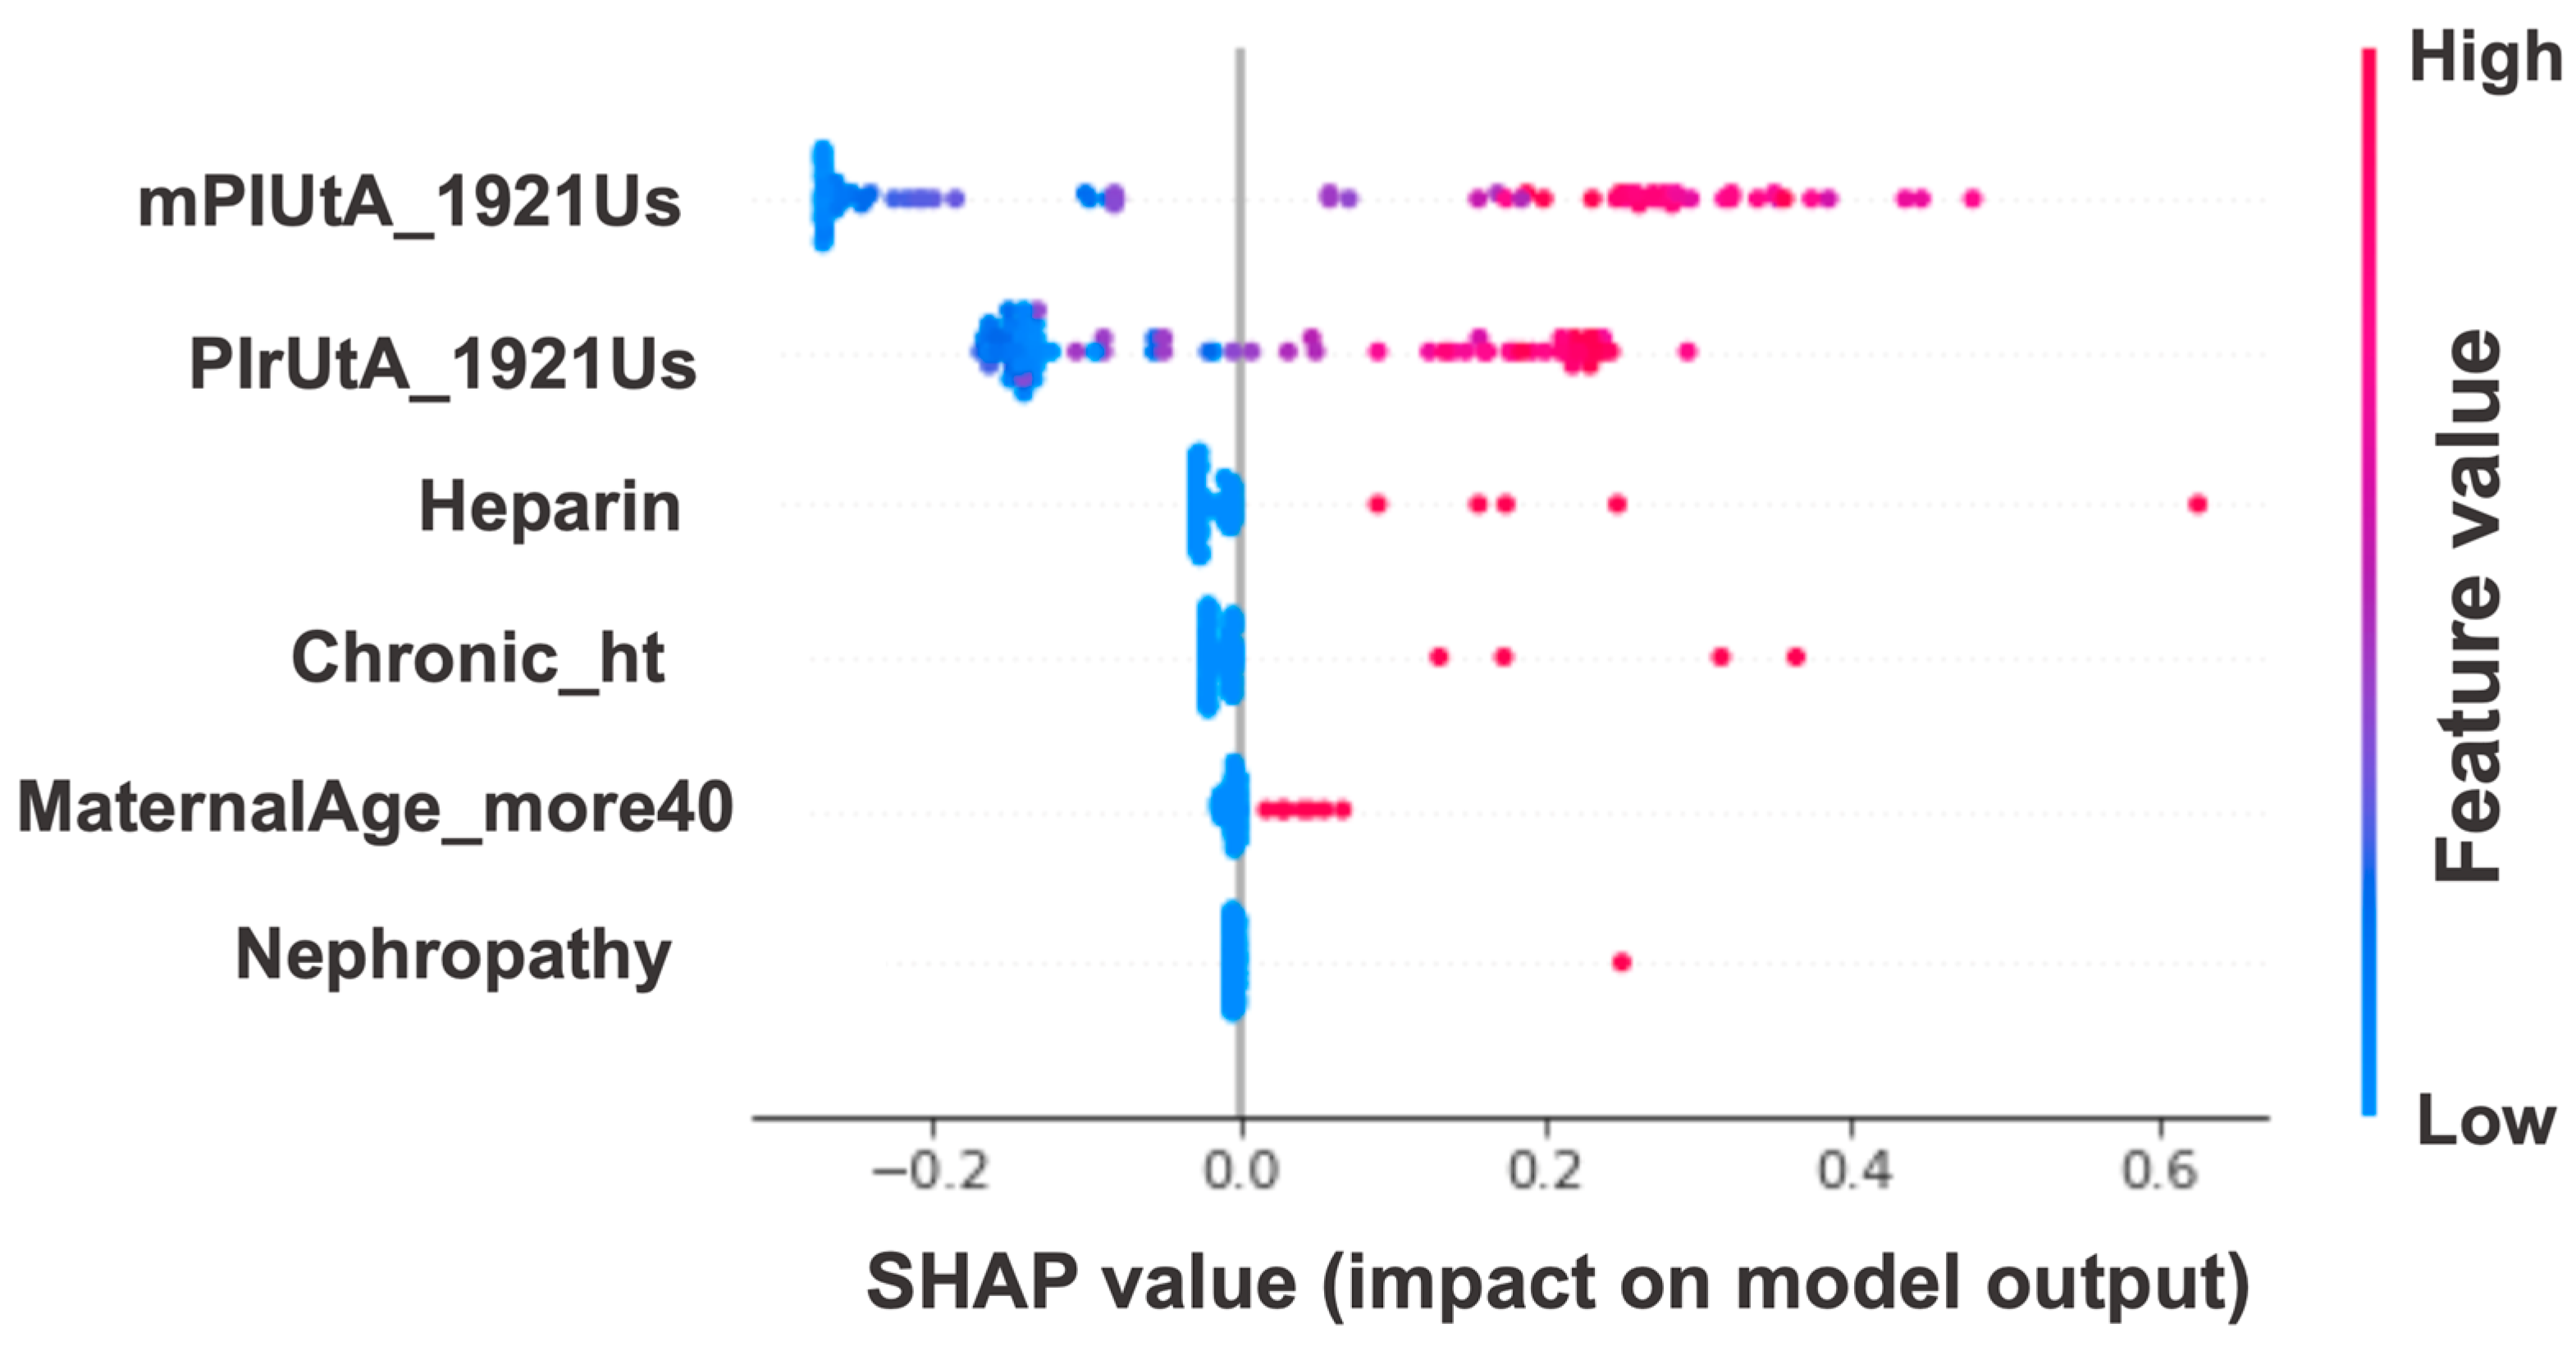
Figure 4 shows that variables related to the uterine arteries (“mPIUtA_1921Us” and “PIrUtA_1921Us”) are clearly the most influential in the prediction. Their SHAP values range approximately from −0.2 to 0.5. High values of these variables (red points) tend to have positive SHAP values, indicating an increased probability of eoPE, while low values (blue points) have negative SHAP values, indicating a decreased probability. The remaining variables are less important. Since all are categorical, we can interpret that when these variables are in category 0 (absence), they have little relevance in the prediction, as their SHAP values cluster around 0 on the x-axis. However, when the category is 1 (presence), they drive the prediction towards the eoPE side.
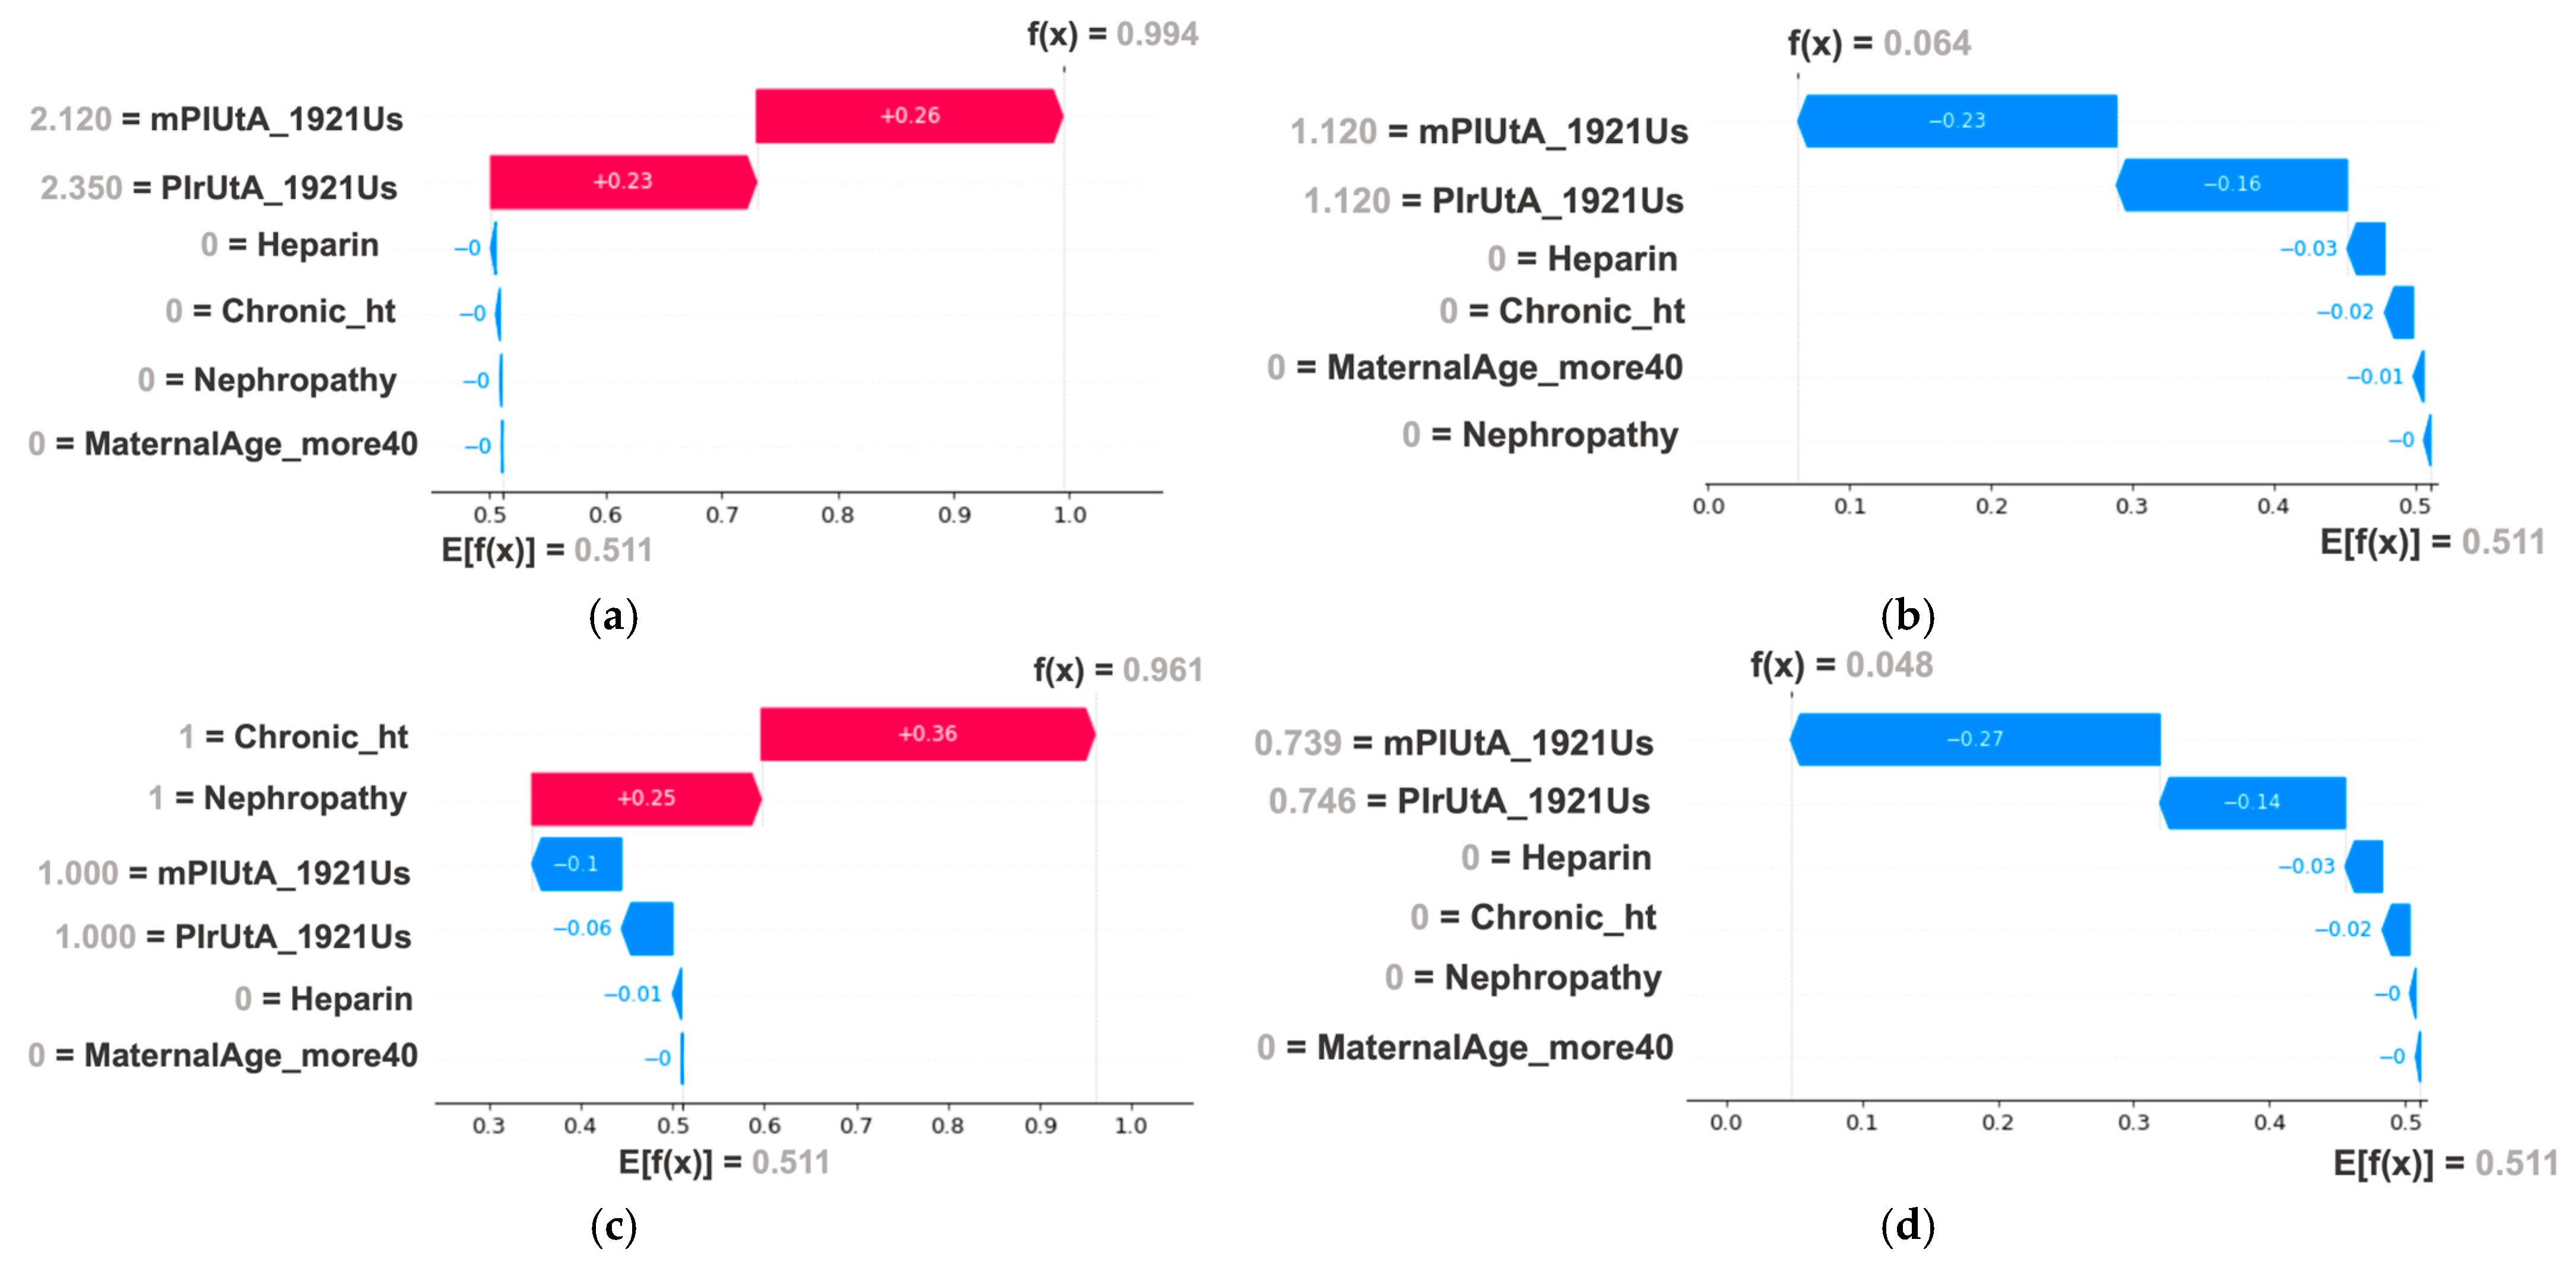
There were highly significant differences (p < 0.001) between patients with eoPE and those without across all uterine artery features: “PIrUtA_1921Us” (0.94 ± 0.28 vs. 1.88 ± 0.66 for controls vs. cases), “PIlUtA_1921Us” (0.93 ± 0.26 vs. 1.77 ± 0.70), and “mPIUtA_1921Us” (0.93 ± 0.24 vs. 1.82 ± 0.53). A detailed cross-validation analysis of the model’s performance confirmed that uterine artery features are highly influential but not the sole predictors of eoPE. When known risk factors such as chronic HT or nephropathy are present, they exert a dominant influence on the model’s predictions. However, in their absence, uterine artery indices become the primary determinants of eoPE risk. This dynamic is illustrated in Figure 5, where SHAP values provide a clear interpretation of how individual predictors contribute to each patient’s classification.
The previous results suggest that uterine variables play a key role in prediction. For this reason, we applied the GA as described in the methods section to identify the best solution without including these variables. The top-performing classifier was KNN, with hyperparameters set to n_neighbors = 5, weights = “uniform”, algorithm = “auto” and metric = “Minkowski”. Using ‘BMI_more35’, ‘Previous_PE’, ‘ASA’, and ‘Weight’ as input features and applying 3 repetitions of stratified 3-fold cross-validation, the model yielded the following test scores across the 9 folds: accuracy of 0.659 (0.632–0.685), precision of 0.668 (0.640–0.695), sensitivity of 0.642 (0.611–0.673), specificity of 0.674 (0.616–0.732), NPV of 0.652 (0.623–0.680) and F1 Score of 0.653 (0.633–0.673). The difference with the results obtained when including uterine variables seems to further confirm their importance. However, the small sample size limits the generalizability of this finding.

4.2. Post-Pregnancy Hypertension Prediction Model

During the algorithm selection phase, LR was adopted among SVM, KNN, and TD.
With the LR hyperparameters fine-tuned and set to C = 1, class_weight = “None”, max_iter = 1000, penalty =“l2” and solver = “lbfgs”; and the GA parameters for A, FWE, E, and MR set to 0.3, 0.5, 0.3, and 0.03 respectively, the selected input features provided an F1-score of 0.771 ± 0.055.
The GA selected variables related to blood pressure, including maximum systolic blood pressure and maximum mean blood pressure during pregnancy (from eoPE diagnosis to delivery). Elevated blood pressure can lead to structural changes in the arteries, such as arterial wall thickening and reduced elasticity, which may persist postpartum and contribute to chronic HT. Although these two variables may appear redundant, systolic blood pressure provides complementary information to mean arterial pressure and may be particularly useful in identifying cases with severe hypertensive peaks. The algorithm also selected other variables, such as having two or more risk factors in the medical history (as defined by PREP-L and PREP-S), which reflects baseline CV risk; the cerebro-placental ratio on diagnostic ultrasound, which measures fetal blood flow redistribution; the end-diastolic flow in the umbilical artery on diagnostic ultrasound, a marker of placental resistance; and the ‘a’ wave in ductus venosus on diagnostic ultrasound, which indicates fetal hemodynamic compromise.
Stratified 3-fold cross-validation with three repetitions was implemented, with metrics in Table 4 reported as the mean (95% confidence Interval) across 9 folds. The best solution demonstrated solid performance across all metrics: accuracy (0.844 training, 0.837 validation), precision (0.821 training, 0.818 validation), recall (0.754 training, 0.741 validation), and F1-score (0.785 training, 0.771 validation). NPV reached 0.858 in training and 0.855 in validation, while specificity was 0.898 in training and 0.891 in validation. Additionally, the model achieved an average ROC-AUC of 0.860 ± 0.05 (Figure A2b in Appendix A). Despite some variability in validation metrics, the model proved to be robust and reliable overall. Figure A3b in Appendix A shows the average confusion matrix.
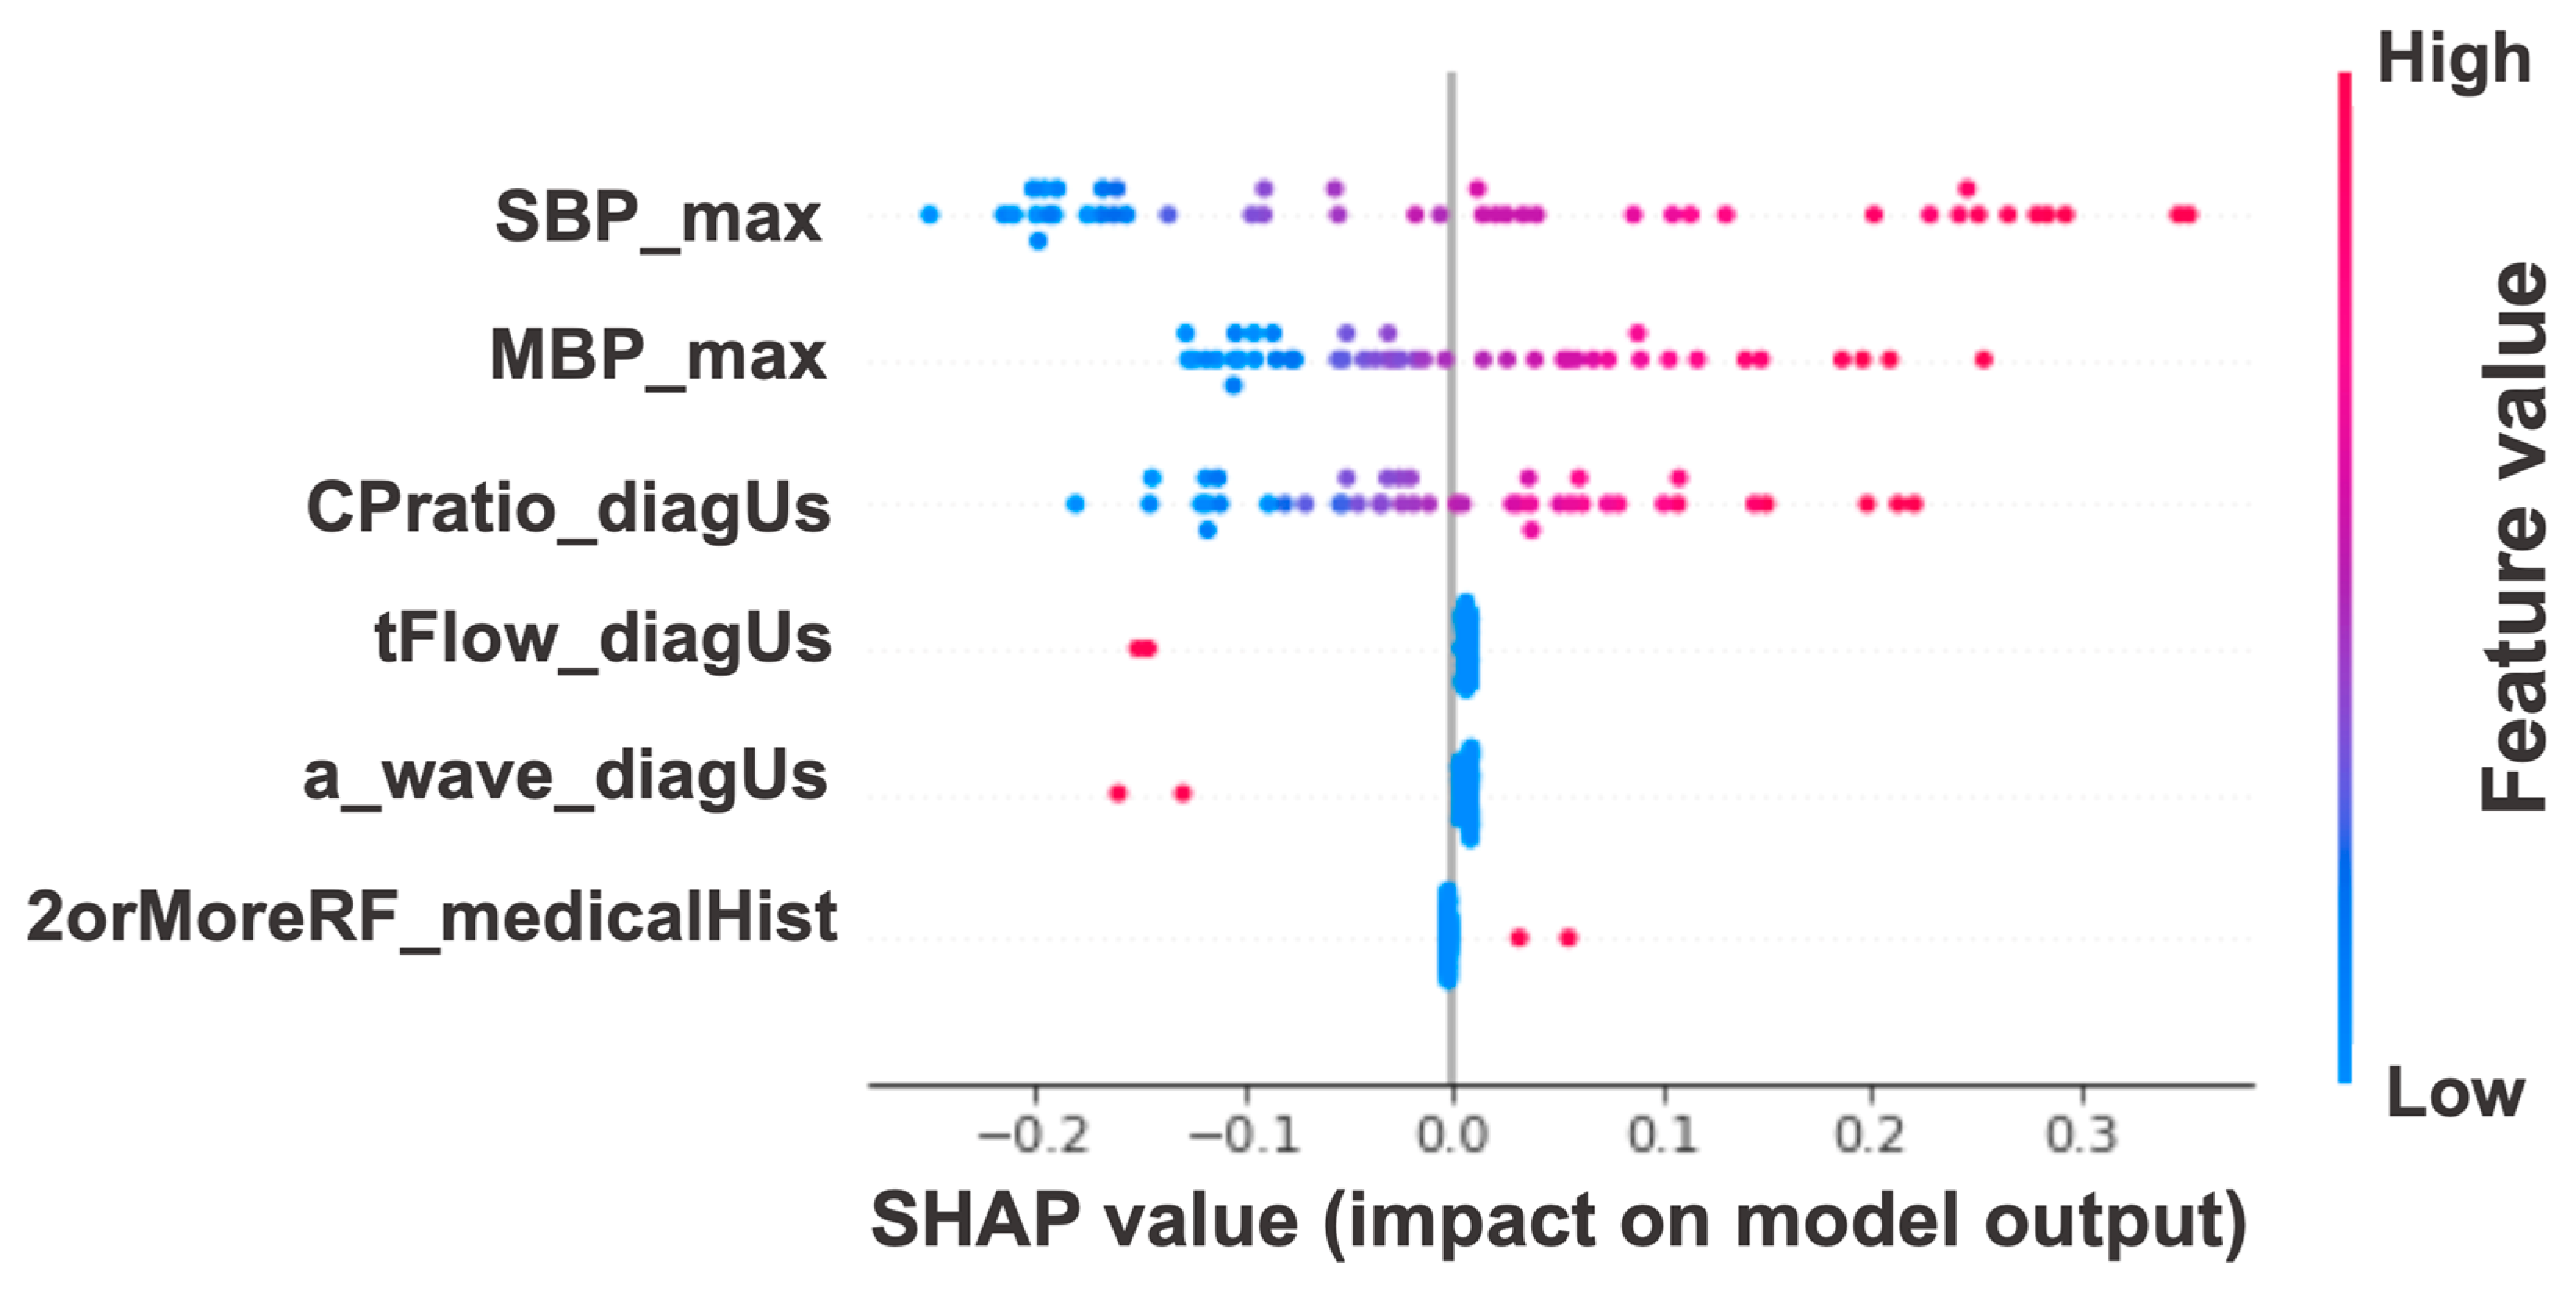
In the SHAP-based model interpretation, the summary plot (Figure 6) shows that “SBP_max” is the most important feature, with SHAP values ranging from −0.25 to 0.35. High values (red points) increase the probability of post-pregnancy HT, while low values (blue points) decrease it. The second most important features are “MBP_max” and “CPratio_diagUs”, with SHAP values ranging from −0.15 to 0.25 and a similar behavior to “SBP_max”; The remaining features are less influential. It is important to note that the GA selects subsets of variables that collectively optimize model performance. While some features may have low individual impact, their inclusion is essential for capturing complex interactions and improving the model’s robustness generalization.
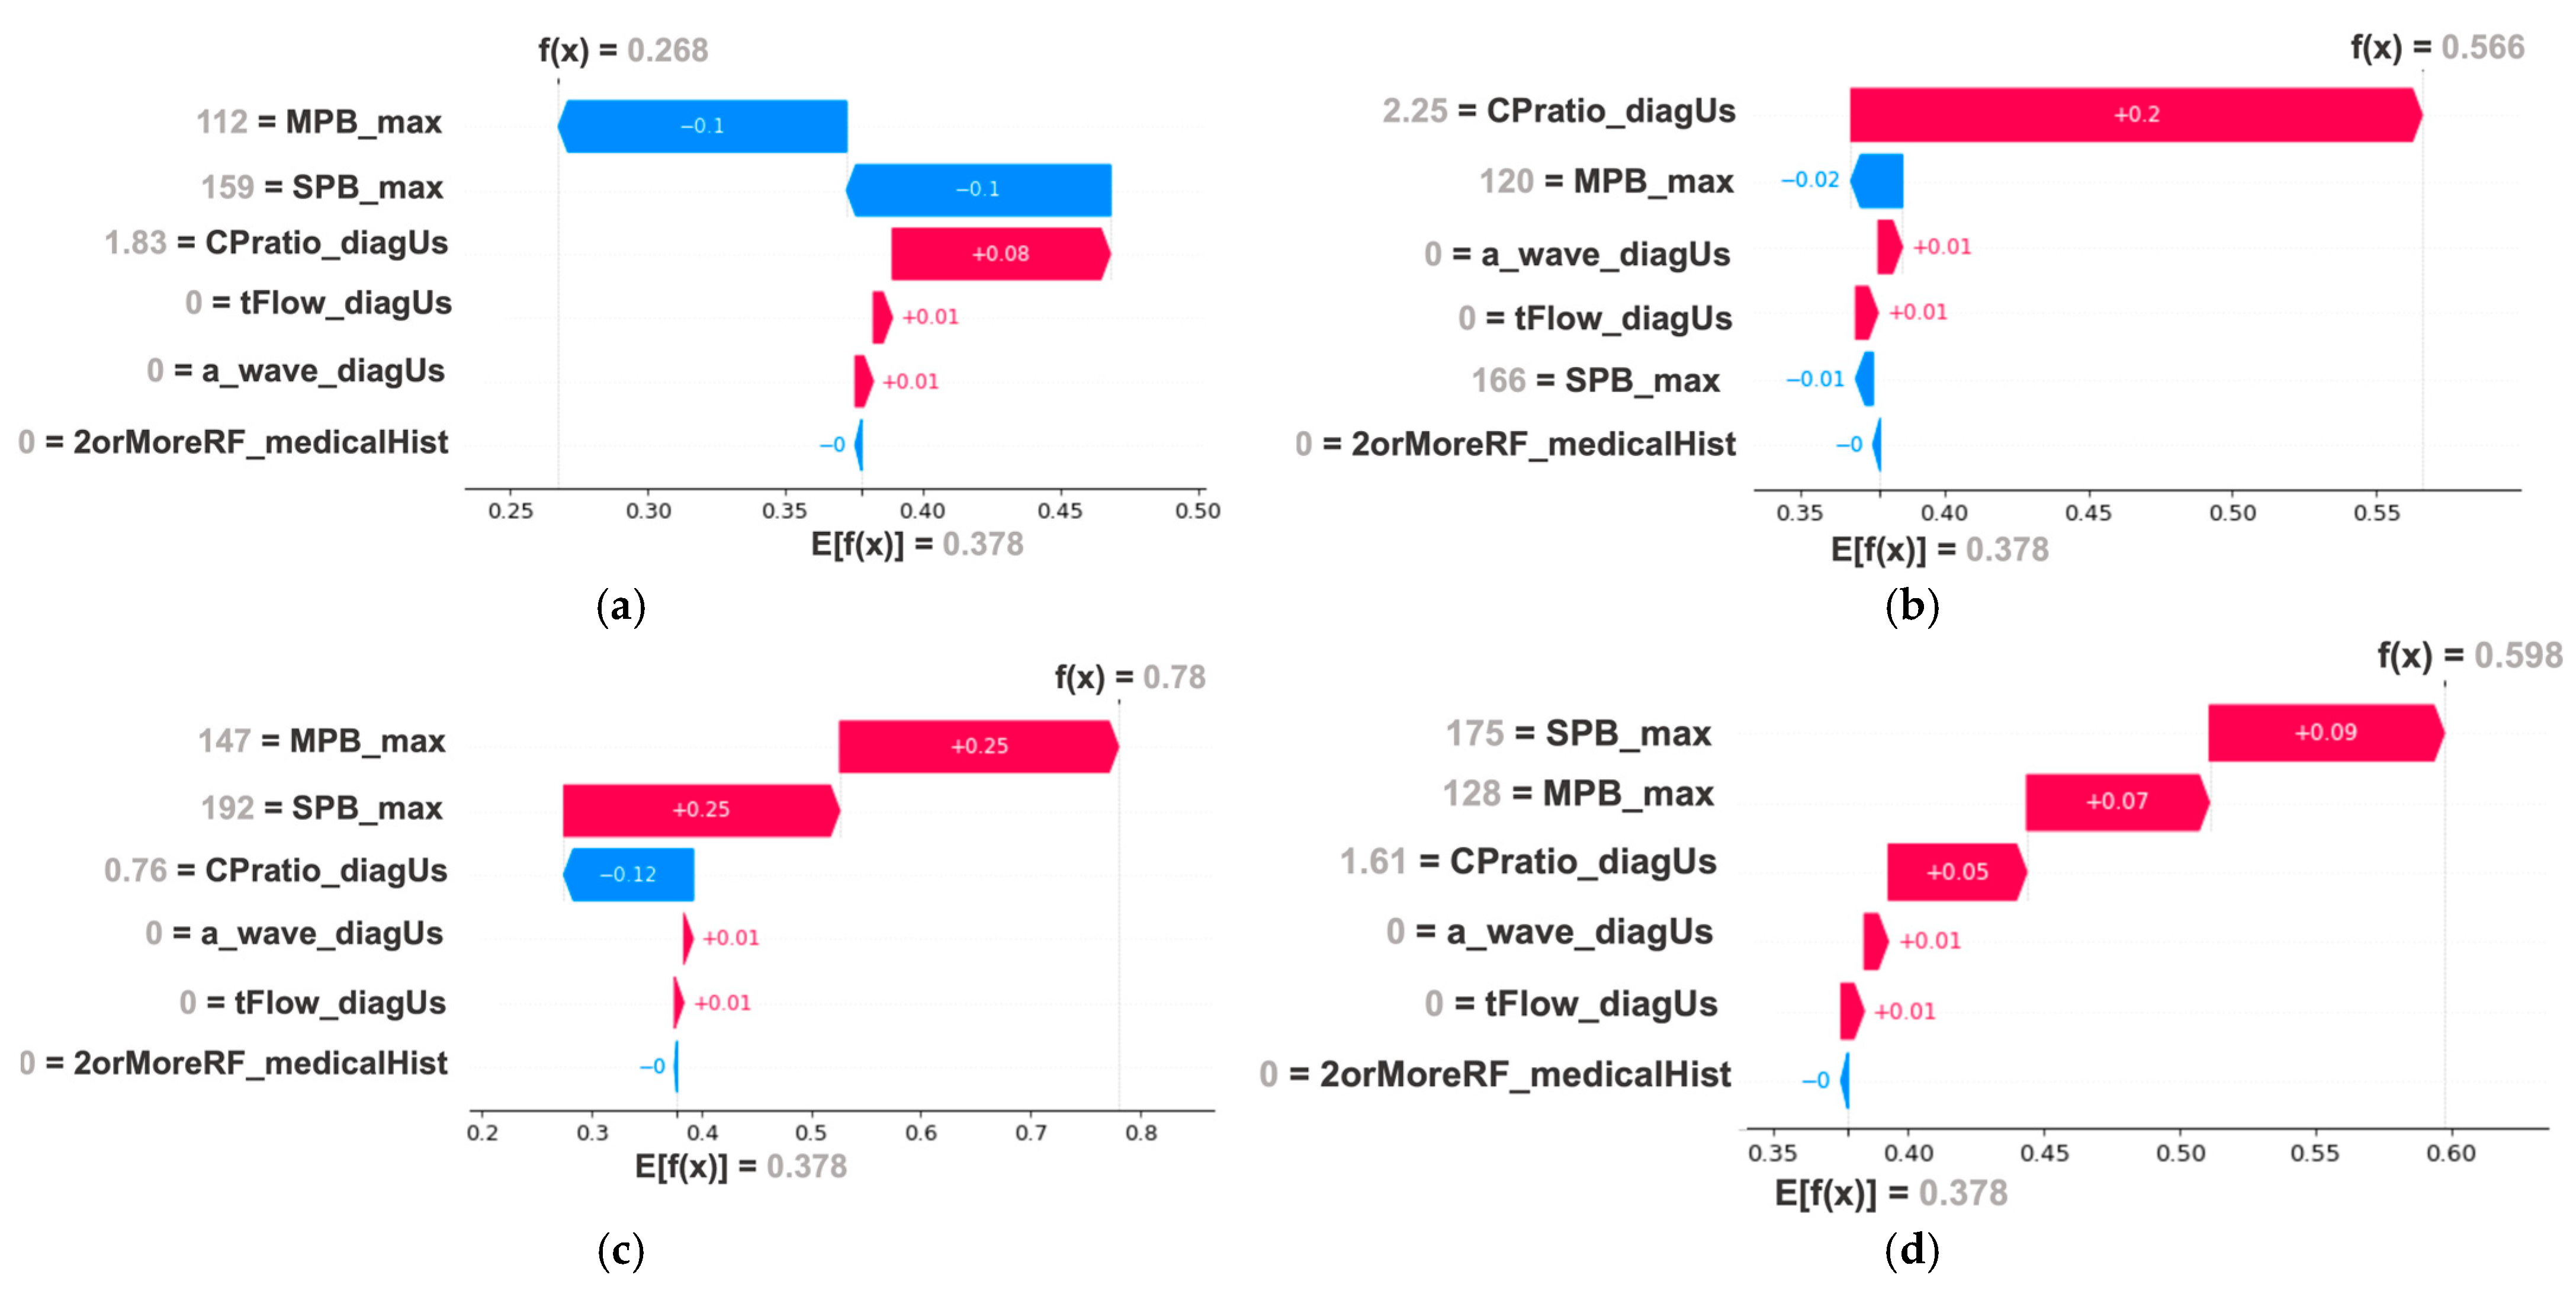
There were highly significant differences in all blood pressure features between patients with post-pregnancy HT and those without: “SBP_diagnosis” (152.22 ± 19.03 for non-HT vs. 171.47 ± 15.72 for HT, p < 0.001), “DBP_diagnosis” (94.47 ± 8.32 vs. 101.53 ± 9.66, p < 0.05), “MBP_diagnosis” (113.72 ± 11.04 vs. 124.94 ± 8.87, p < 0.001), “SBP_max” (157.39 ± 16.91 vs. 180.29 ± 16.36, p < 0.001), “DBP_max” (96.61 ± 7.88 vs. 103.24 ± 10.01, p < 0.05), and “MBP_max” (116.89 ± 9.61 vs. 128.50 ± 9.88, p < 0.001). Although “CPratio_diagUs” did not show a significant difference (1.32 ± 0.51 vs. 1.50 ± 0.50), it remains an influential feature in predictions. Detailed fold analysis revealed that blood pressure features predominantly drive predictions. However, when a patient has an intermediate value (neither near the HT nor non-HT group mean), the brain–placental index becomes the dominant predictor, as illustrated in Figure 7.

4.3. Mid-Term Follow up

By identifying patient subgroups based on patterns in blood and urine tests, CV imaging, and 24 h ABPM, our goal was to assess whether certain obstetric characteristics predispose women to specific long-term health profiles.
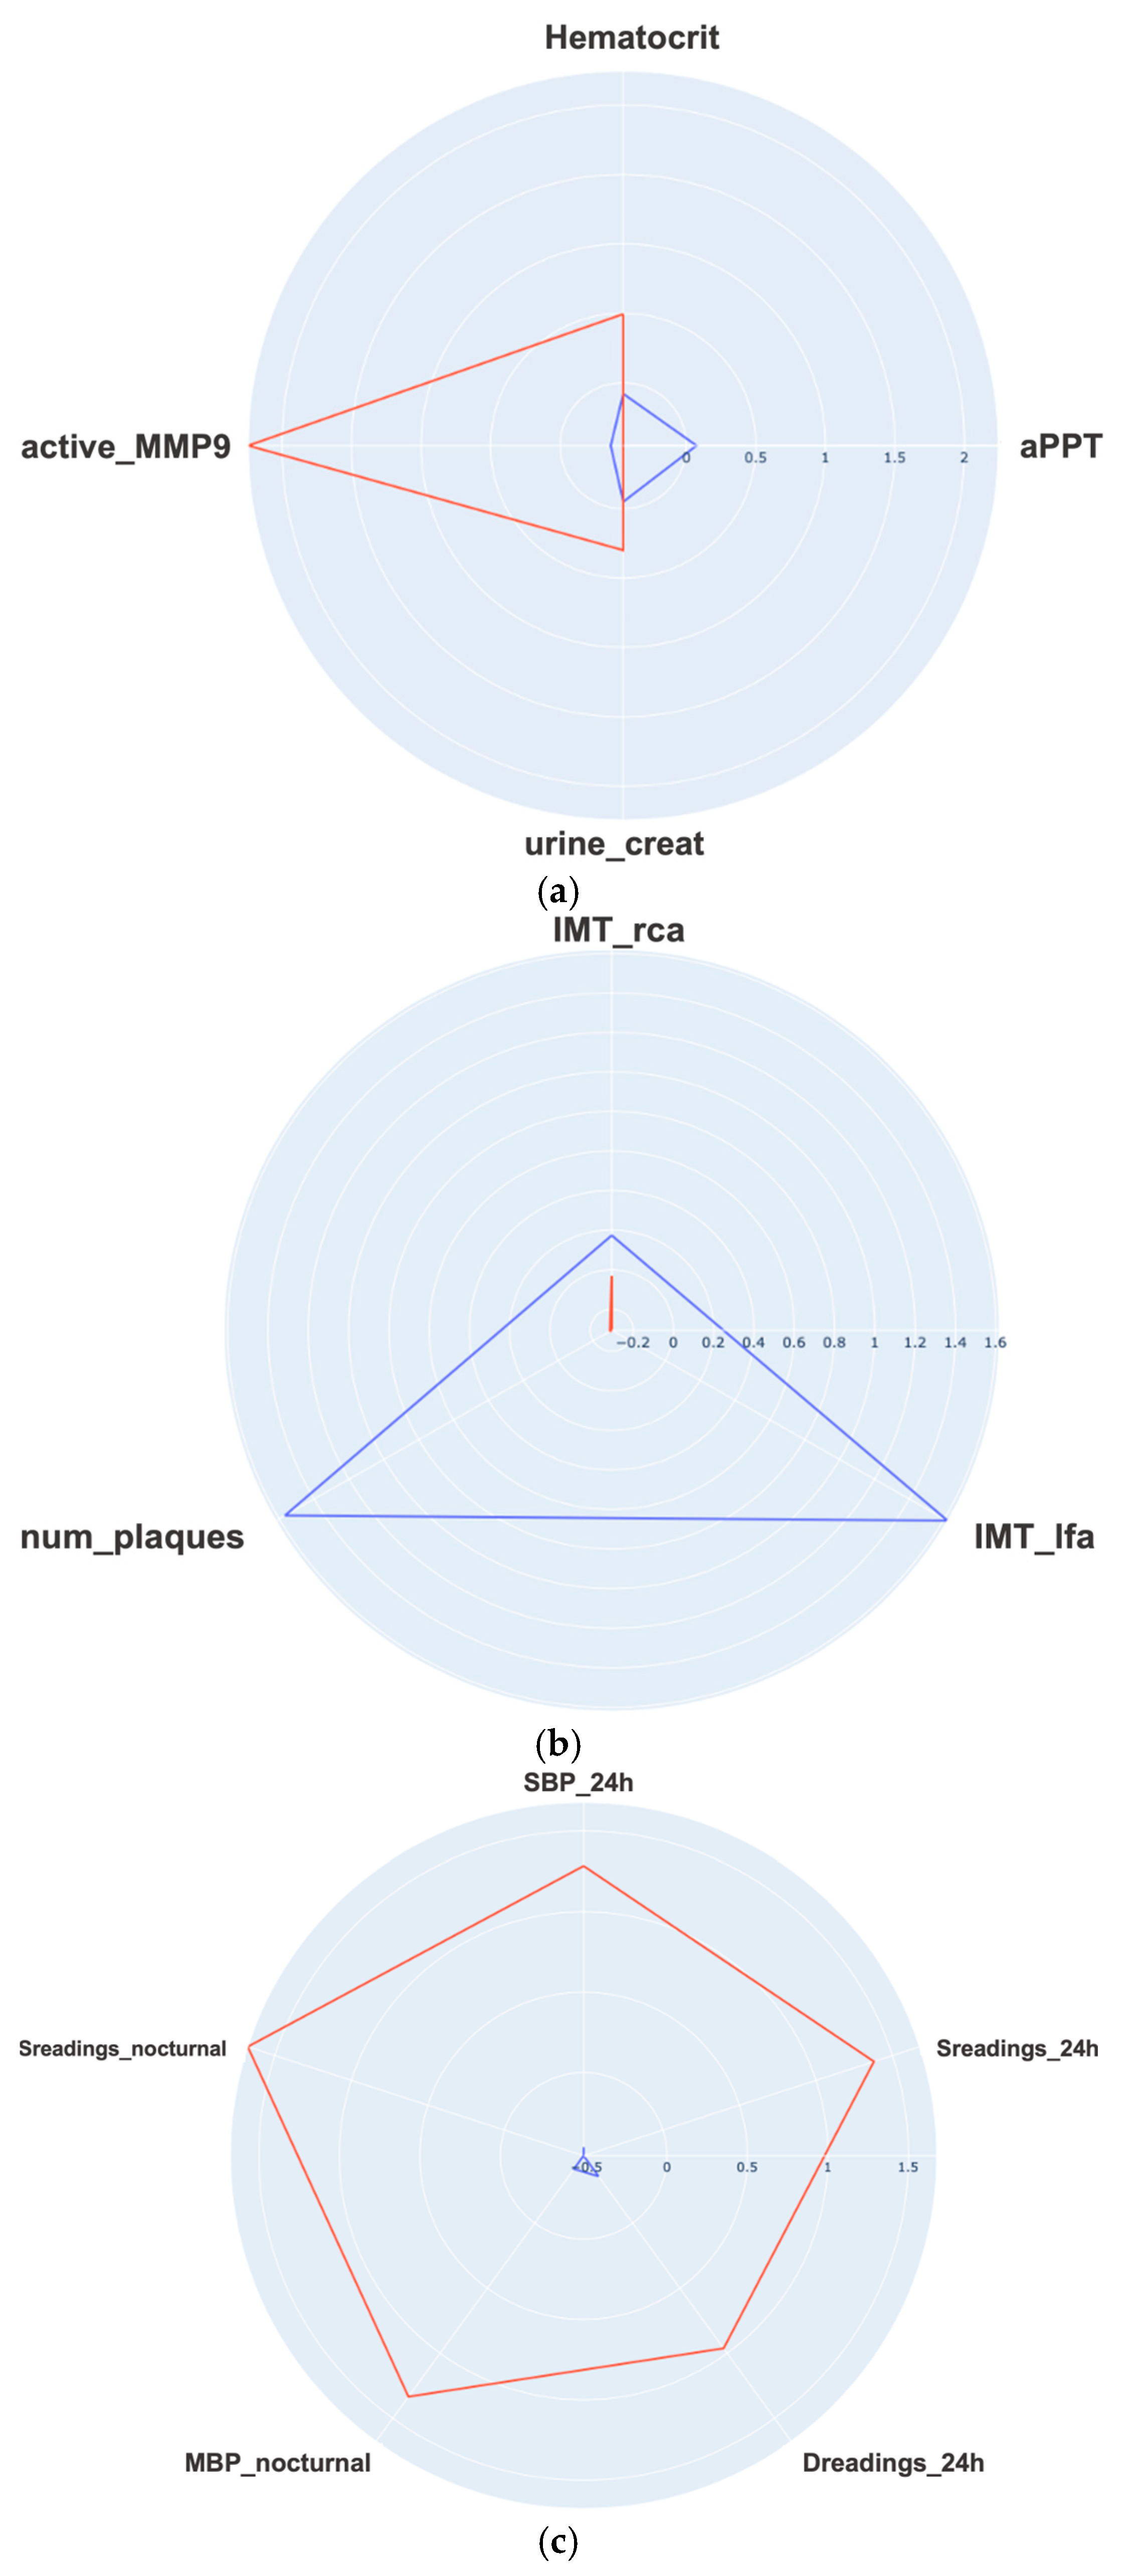
For the Blood test dataset (Figure 8a), clustering based on hematocrit, aPTT, urine creatinine, and active MMP9 (silhouette index: 0.384; Davies–Bouldin: 1.170; K = 2) identified two subgroups with modest differences in coagulation and inflammation markers. The blue group (n = 6) showed significantly higher levels of active and total MMP9 (2.75 ± 1.79 vs. 6.29 ± 3.78, p < 0.01), total MMP9 (2.75 ± 1.79 vs. 6.29 ± 3.78, p < 0.01), and MMP9/TIMP1 ratio (4.19 ± 7.36 vs. 6.26 ± 2.15, p < 0.01), ALT (16.27 ± 6.20 vs. 28.00 ± 16.20, p < 0.005), AST (19.62 ± 6.00 vs. 23.33 ± 5.32, p < 0.05) and immunoglobulin M (152.73 ± 83.28 vs. 210.67 ± 81.62, p < 0.05), suggesting a more proinflammatory profile. Although differences in obstetric parameters were observed between groups—such as lower cerebroplacental ratio (1.31 ± 0.52 vs. 1.85 ± 0.35, p < 0.05), more frequent administration of magnesium sulfate, and a higher number of maternal complications—these findings do not support a conclusive clinical interpretation.
For the CV dataset (Figure 8b), clustering using IMT of the right carotid, left femoral artery, and number of atherosclerotic territories (silhouette index: 0.480; Davies–Bouldin: 1.154; K = 2) revealed one blue group (n = 7) with higher left femoral IMT (0.721 ± 0.152 vs. 0.463 ± 0.085, p < 0.00001) and more atherosclerotic plaques (6/7 had ≥1 plaque vs. 12/37 in the red group, p < 0.0001). Although obstetric differences were present between clusters—including higher rates of maternal complications and oliguria, and more frequent perinatal complications—these findings do not appear to be clinically meaningful.
For the ABPM dataset (Figure 8c), the best clustering performance (K = 2; silhouette index: 0.548; Davies–Bouldin index: 0.692) was obtained with the variables systolic blood pressure (24 h), systolic readings over limit (24 h), diastolic readings over limit (24 h), mean blood pressure (nocturnal), and systolic readings over limit (nocturnal). The resulting groups consisted of 31 patients (blue cluster) and 6 patients (red cluster). The red group exhibited significantly poorer blood pressure control across the 24 h, diurnal, and nocturnal periods. These findings are summarized in Table 5, which presents all statistically significant differences (p < 0.005) between groups by time period.
In addition, several variables related to eoPE diagnosis and pregnancy outcomes differed significantly between clusters. Patients in the red group had higher diastolic (95.77 ± 9.01 vs. 105.50 ± 10.43, p < 0.05) and mean blood pressure (116.83 ± 10.48 vs. 137.83 ± 11.20, p < 0.05) at diagnosis, higher maximum systolic blood pressure (163.26 ± 18.74 vs. 185.17 ± 14.76, p < 0.05) and mean blood pressure (119.87 ± 10.19 vs. 131.0 ± 12.83, p < 0.05) values during pregnancy, and a higher prevalence of severe hypertension (no: 16 vs. 0; yes: 15 vs. 6, p < 0.05). Notably, all patients in the red cluster developed postpartum HT. Despite their favorable ABPM profile, six patients in the blue group had a diagnosis of chronic HT at follow-up; upon individual review, four of them were receiving antihypertensive therapy, one had undergone bariatric surgery with normalization of blood pressure, and another was on anticoagulants. These cases highlight the influence of effective treatment and physiological recovery on post-partum vascular phenotype and demonstrate that the clustering reflects current hemodynamic status rather than static clinical diagnoses.

5. Discussion

5.1. Principal Findings

This study analyzes three key stages of pregnancy: pre-pregnancy baseline, diagnosis-to-delivery (for eoPE cases), and follow-up visit. In each phase, the most critical features were selected from a large set of demographic characteristics and clinical data collected during pregnancy and postpartum. A summary of our principal findings for each stage as well as its potential clinical applicability is provided in Table 6.
For the baseline and diagnostic phases, we used a GA-based optimization technique to enhance the ML model’s performance. With the baseline selected features, the SVM-based eoPE risk reevaluation model achieved high predictive accuracy (F1-score > 96%). These results are comparable to those reported by Wright et al. [31], who developed a Bayes-based model that combines maternal factors with biomarkers to generate dynamic risk estimates. Achieving similar results without relying on first-trimester screening marker like PlGF is noteworthy.
The combination of variables selected by the GA allowed the model to integrate both baseline predisposition and underlying hemodynamic manifestations. SHAP analysis (Figure 4 and Figure 5) revealed that, in the absence of known risk factors, the most influential predictors were the uterine artery pulsatility indices from the mid-trimester scan. These reflect placental vascular resistance, which normally decreases during pregnancy to ensure adequate fetal perfusion. In PE, this adaptation fails, leading to increased resistance [32]. Interestingly, it appears that women with predisposing chronic conditions (such as chronic HT or nephropathy) may not require as strong a placental insult to develop eoPE, as their uterine artery resistance does not need to be markedly elevated for them to reach a high-risk state. Beyond its predictive value, the model contributes to a better understanding of the dynamic pathophysiological mechanisms underlying PE risk, highlighting how changes between the first and second trimesters may reflect evolving risk profiles and offer opportunities for timely intervention.
With the selected diagnostic features, we developed a ML model to predict the occurrence of post-pregnancy HT which, despite having a slightly lower F1-score than the baseline model (77.1% in validation), still demonstrates robust performance. An interesting finding from the SHAP analysis (Figure 6 and Figure 7) is that certain variables typically associated with greater fetal compromise due to feto-placental dysfunction—such as a low cerebroplacental ratio, absent end-diastolic flow in the umbilical artery, and reversed ‘a’ wave in the ductus venosus—were linked to a lower risk of postpartum HT. One possible pathophysiological explanation is that, in cases where the mother has a limited ability to mount an effective hypertensive response to placental insufficiency, fetal perfusion may become more severely compromised, leading to more pronounced alterations in fetal hemodynamic parameters. This reduced hypertensive reactivity could, in turn, be associated with a lower tendency to develop HT after delivery. This hypothesis also suggests that pregnant women who can generate a stronger compensatory hypertensive response to placental dysfunction—thereby protecting the fetus in the short term—may, as a trade-off, have a higher predisposition to develop long-term hypertensive disorders, ultimately impacting maternal health in the longer term.
The SHAP analysis also revealed that the most influential predictors in the model were the maximum values of systolic and mean blood pressures recorded during pregnancy. This underscores the central role of hypertensive burden during gestation, which may reflect both the severity of PE and an underlying predisposition to chronic HT. The relationship between HT and PE is complex and multi-directional: chronic HT is a risk factor for PE, and PE is associated with increased long-term CV morbidity (including HT) and mortality in the mother. Even if postpartum blood pressure returns to normal, these seemingly healthy women may suffer from adverse metabolic and vascular changes [33]. Moreover, women who develop PE with very high systolic blood pressure may have an underlying predisposition to HT, which becomes more pronounced during pregnancy due to the added CV demands [34]. Despite this, structured postpartum CV follow-up remains limited. The predictive model developed in this study could aid in identifying high-risk individuals and inform targeted interventions to mitigate long-term health risks.
However, given the relatively small sample size of our cohort, the promising results obtained from both models should be interpreted as preliminary and require validation in independent and more diverse populations to ensure their generalizability.
Regarding the clustering results, no clinically consistent associations were found between obstetric features during eoPE and mid-term phenotypes based on blood/urine analyses or CV imaging. Although some differences in inflammatory markers and vascular parameters were observed, the small size of the minority clusters, along with potential confounders such as follow-up heterogeneity, lifestyle, or menopausal status, limit the interpretability and clinical value of these findings.
By contrast, the most clinically coherent pattern emerged from the ABPM dataset. The minority cluster showed persistently elevated blood pressure and poor hemodynamic control postpartum, which aligned with higher blood pressure values at the time of PE diagnosis and a greater incidence of chronic HT at follow-up. These findings are consistent with those identified by the SHAP analysis in the postpartum HT prediction model and support the clinical implications outlined in Table 6.

5.2. Limitations

This study is not exempt from limitations. The most significant one from a ML perspective is the small sample size, which may not adequately capture the full variability of the target population. This limitation has several implications. First, it increases the risk of overfitting, especially in high-dimensional settings where the number of predictors approaches the number of observations. As a result, the high scores obtained—particularly in the eoPE risk reevaluation model—may be overly optimistic and reflect sample-specific patterns rather than generalizable relationships. To mitigate this, we applied three complementary strategies: (1) repeated stratified cross-validation to ensure stability and reduce evaluation bias; (2) regularization of classifiers, particularly by optimizing the hyperparameter C in the SVM, which controls the trade-off between maximizing the margin and minimizing classification error, thereby penalizing overly complex decision boundaries; and (3) dimensionality reduction through feature selection using genetic algorithms (GAs), which iteratively identify compact subsets of predictive variables that improve generalization by reducing the feature space and minimizing the risk of fitting noise or spurious correlations. Nonetheless, these measures cannot fully compensate for the lack of external validation, and the absence of techniques such as bootstrapping or nested cross-validation limits our ability to estimate variance and uncertainty in the reported metrics.
Second, small sample sizes reduce the statistical power to detect true effects and increase the likelihood of spurious associations, especially in the clustering analyses. This means that some observed patterns may be due to chance rather than underlying pathophysiological differences, particularly in smaller clusters. Additionally, performance metrics may exhibit greater variance and be less stable across folds, reducing the reliability of the reported results.
Therefore, the findings should be interpreted as preliminary and exploratory, and future research should focus on replicating these models in larger, more diverse cohorts to confirm their robustness and clinical applicability.
A second limitation is that our study was conducted at a single center, meaning the data may not be representative of the general population. Additionally, there was a substantial amount of missing data, which prevented us from using angiogenic biomarkers, limited the amount of laboratory data available, and reduced the study cohort’s size.
Additionally, the eoPE risk reevaluation model was developed using data from women at the extremes of the spectrum: those who either experienced eoPE or had a completely normal pregnancy. If we were to include a more “gray” population—such as those with growth restriction or late-onset PE—it is possible that the model’s performance might be slightly inferior. Furthermore, since the model relies on data obtained after the second-trimester ultrasound, its utility for prescribing early aspirin prophylaxis is limited. Future studies should aim to integrate first-trimester risk assessment as a starting point, including a ‘first-trimester screening result’ variable in the second-trimester model.
Specific to the clustering analyses, the small sample size in some clusters, particularly those with very few patients, raises the possibility of overinterpreting patterns that may not be generalizable. K-means clustering is also sensitive to initial centroid selection and assumes spherical clusters with similar variance, which may not fully capture the complex clinical reality. Additionally, clustering reflects the current phenotype based on numerical data, which may be influenced by treatment effects (e.g., antihypertensive therapy) rather than intrinsic patient characteristics. These factors should be considered when interpreting the clinical relevance of the identified clusters.
Finally, during the study’s design, we did not consider excluding patients undergoing antihypertensive treatment. However, since the medical history records whether patients were on antihypertensive treatment, we can identify that those with normal ABPM values were likely due to this treatment.
Overall, we believe that these limitations were significantly mitigated by the depth of our methodological approach. Nonetheless, external validation is essential to confirm the robustness and clinical utility of the findings.

5.3. Future Work

To strengthen the methodological rigor of the proposed models, future studies should incorporate additional internal validation strategies such as bootstrapping or external hold-out testing. These techniques, which estimate performance variability and model uncertainty across multiple resampled or independent partitions, would complement our current approach based on repeated stratified cross-validation. In particular, bootstrapping could provide confidence intervals for model metrics and further mitigate optimistic bias, especially in small datasets.
Beyond internal validation, the next essential step is prospective external validation. This would involve applying the developed models to an independent cohort of women with and without a history of eoPE—ideally from a different hospital and geographic region—to evaluate their predictive performance and calibration in a real-world clinical setting. Such a study would help determine the generalizability of the models and their potential applicability across diverse populations and healthcare systems. Only after rigorous external validation should these tools be considered for clinical implementation, ensuring their safety, accuracy, and fairness in real-world use.
Future research should also focus on the continuous refinement of these algorithms, integrating new data types such as genetic markers and lifestyle factors to enhance predictive accuracy. The exploration of new biomarkers and their incorporation into AI models could yield deeper insights into the pathophysiology of PE and its long-term effects. For instance, investigating the role of angiogenic factors and inflammatory markers in greater detail could elucidate their predictive value and mechanism of action. Moreover, the complex nature of PE and its crossover implications for CV health highlight the importance of interdisciplinary research. Collaborations among obstetricians, cardiologists, and data scientists are crucial for developing more holistic approaches to under-standing and managing the disease. Finally, translating AI models from research settings into practical, user-friendly tools for routine clinical use represents a critical step forward. This translation involves not only technological development but also the training of healthcare providers and addressing the ethical considerations related to the use of AI in healthcare.

6. Conclusions

The integration of AI with traditional clinical methodologies in this study has highlighted its potential to significantly enhance the early detection of eoPE and the prediction of associated long-term CV risks like chronic HT. This approach not only has the potential to improve immediate patient care during pregnancy but also contributes to long-term health strategies for women affected by the condition.
The application of AI-driven models supports the development of enhanced screening protocols for eoPE. By identifying key predictors through GAs and validating them via supervised learning models, clinicians can adopt these indicators into screening strategies. Early identification allows for the initiation of preventive or mitigative treatments before the onset of severe symptoms, potentially reducing the incidence of adverse outcomes. Furthermore, the variability in the manifestation of PE, as revealed by our clustering analyses, underscores the necessity for personalized patient management plans. Understanding individual risk profiles enables healthcare providers to tailor interventions specific to the risk factors and health status of each patient, improving treatment efficacy and enhancing patient engagement and compliance. Additionally, the confirmed link between PE and increased risk of CV disease advocates for the implementation of long-term monitoring programs focused on CV health assessment and intervention, aiming to mitigate risks early in their development.

Author Contributions

Conceptualization, C.V., I.H. and A.G.; methodology, C.V., I.H., A.G., P.D.-d.O., M.M.-E. and J.L.A.; software, P.D.-d.O., M.M.-E. and J.L.A.; validation, C.V., I.H., A.G., P.D.-d.O., M.M.-E. and J.L.A.; formal analysis, P.D.-d.O., M.M.-E. and J.L.A.; investigation, C.V., I.H., A.G., P.D.-d.O., M.M.-E. and J.L.A.; resources, I.H. and J.L.A.; data curation, P.D.-d.O.; writing—original draft preparation, P.D.-d.O.; writing—review and editing, C.V., I.H., A.G., P.D.-d.O., M.M.-E. and J.L.A.; visualization, P.D.-d.O.; supervision, C.V., I.H., A.G. and J.L.A.; project administration, C.V., I.H., A.G. and J.L.A.; funding acquisition, I.H. and J.L.A. All authors have read and agreed to the published version of the manuscript.

Funding

This research was funded by Instituto de Salud Carlos III (Spanish Ministry of Economy, Industry and Competitiveness) through the projects PI19/01579, RD21/0012/0024 and RD24/0013/0013 (Primary Care Interventions to Prevent Maternal and Child Chronic Diseases of Perinatal and Developmental Origin: RICORS network) and financed by the European Union though the Next Generation EU funds, which finance the actions of the Recovery and Resilience Facility (RRF).

Institutional Review Board Statement

This study was approved by the local research ethics committee (PI19/01579).

Informed Consent Statement

Patient consent was waived due to the retrospective, non-interventional design of the study and the use of anonymized data.

Data Availability Statement

A link containing all the information regarding the data could be provided upon request for research purposes. The data can be shared if requested. All data have been obtained in the context of a clinical study and comply with ethical committee guidelines. The data are available to researchers through a 1:1 agreement.

Acknowledgments

The authors acknowledge all the patients and their caregivers who have made this study possible.

Conflicts of Interest

The authors declare no conflicts of interest.

Abbreviations

The following abbreviations are used in this manuscript:
PEPreeclampsia
CVCardiovascular
eoPEEarly-onset preeclampsia
FGRFetal Growth Restriction
AIArtificial intelligence
MLMachine learning
ABPMAmbulatory blood pressure monitoring
IMTIntima media thickness
GAGenetic algorithm
NPVNegative predictive value
ROC-AUCArea under the receiver operating characteristic
SVMsSupport Vector Machines
LRLogistic Regression

Appendix A

Table A1. Summary of dataset composition across study phases.
Dataset PhaseN PatientsN VariablesNumericalCategoricalMissings (%)
Baseline (T1)803015154.49
Diagnosis to delivery (T2)452818105.09
Follow-up visit (T3): Blood test43474700.92
Follow-up visit (T3):
Atherosclerosis
445501.89
Follow-up visit (T3):
Ambulatory blood pressure
37151500
Table A2. Summary statistics and comparative analysis between case and control groups.
Development of Early-Onset Preeclampsia
CharacteristicsNo (N = 40)Yes (N = 40)p-Value
Maternal Ethnicity
Caucasian
African American
South American

31 (77.5)
2 (5.0)
7 (17.5)

26 (65.0)
1 (2.5)
13 (32.5)


NS
Maternal age (years)32.40 +/− 5.6432.25 +/− 5.55NS
Pre-gestational weight (kg)70.85 +/− 12.3674.68 +/− 19.48NS
Maternal size (cm)161.38 +/− 7.19160.15 +/− 6.55NS
Maternal body mass index (Kg/m2)26.80 +/− 5.0428.55 +/− 6.91NS
Conception method
Spontaneous
In vitro fertilization
IVF-Ovodonation

40 (100.0)
0 (0)
0 (0)

38 (95.0)
1 (2.5)
1 (2.5)


NS
Number of previous gestations that have reached the 22 weeks of gestation
0
1
>1

20 (50.0)
11 (27.5)
9 (22.5)

20 (50.0)
14 (35.0)
6 (15.0)


NS
Number of previous vaginal deliveries
0
1
>1

26 (65.0)
6 (15.0)
8 (20.0)

25 (62.5)
11 (27.5)
4 (10.0)


NS
Number of previous cesarean sections
0
1
>1

34 (85.0)
5 (12.5)
1 (2.5)

33 (82.5)
6 (15.0)
1 (2.5)


NS
Number of previous abortions
0
1
>1

25 (62.5)
10 (25.0)
5 (12.5)

27 (67.5)
8 (20.0)
5 (12.5)


NS
Preeclampsia in previous gestations
Early-onset preeclampsia
Late-onset preeclampsia

0 (0)
0 (0)

2 (5.0)
4 (10.0)

<0.05
Maternal chronic hypertension0 (0)4 (10.0)NS
Baseline maternal renal disease0 (0)1 (2.5)NS
Pre-gestational diabetes mellitus0 (0)3 (7.5)NS
Maternal thrombophilia0 (0)2 (5.0)NS
Maternal age > 403 (7.5)4 (10.0)NS
Nullipara or the last children was more than 10 years ago20 (50.0)20 (50.0)NS
Maternal body mass index > 35 Kg/m22 (5.0)6 (15.0)NS
Mother/sister with history of preeclampsia0 (0)2 (5.0)NS
Low dose aspirin intake (100 mg/day)
Starting at or before 16 weeks
Starting after 16 weeks

0 (0)
0 (0)

2 (5.0)
7 (17.5)

<0.05
Low dose heparin prophylaxis
Starting at or before 16 weeks
Starting after 16 weeks

0 (0)
0 (0)

2 (5.0)
3 (7.5)

NS
Smoking during pregnancy2 (5.0)2 (5.0)NS
Crown-rump length (1st trimester ultrasound)64.32 +/− 10.3756.26 +/− 5.83<0.005
Gestational age based on the crown-rump length12.65 +/− 0.7912.00 +/− 0.46<0.005
Gestational age based on the 1st trimester ultrasound12.55 +/− 1.0612.67 +/− 1.68NS
Gestational age based on the 2nd trimester ultrasound20.74 +/− 0.7720.44 +/− 0.88NS
Pulsatility index of the right uterine artery0.92 +/− 0.261.93 +/− 0.56<0.005
Pulsatility index of the left uterine artery0.92 +/− 0.241.78 +/− 0.57<0.005
Mean pulsatility index of the uterine arteries0.92 +/− 0.231.86 +/− 0.44<0.005
Table A3. Data sources and percentage of missing values for the features used in the early-onset preeclampsia (eoPE) risk reevaluation model, arranged chronologically from pre-pregnancy to first-and second-trimester data. N: Numerical; DC: Dichotomous Categorical; PC: Polytomous Categorical.
FeatureFeature MeaningCategoryScaleMissing Values (%)
EthnicityMaternal ethnicityPC0: Caucasian, 1: African American, 2: South American, 3: North African, 4: Indian, 5: Other0
WeightPre-gestational weightNKg0
SizeMaternal sizeNcm0
BMIMaternal body mass indexNKg/m20
ConceptionConception methodPC0: Spontaneous, 1: Spousal artificial insemination, 2: Donor artificial insemination, 3: In vitro fertilization, 4: IVF-Ovodonation0
ParityPrevious gestations that have reached at least the 22 weeksNNumber0
Vaginal_dPrevious vaginal deliveriesNNumber0
CesareaPrevious cesarean sectionsNNumber0
MiscarriagesPrevious abortionsNNumber0
Previous_PEPreeclampsia in previous gestationsPC0: No, 1: Yes (early-onset preeclampsia), 2: Yes (late-onset preeclampsia)0
Chronic_htMaternal chronic hypertensionDC0: No, 1: Yes0
NephropathyBaseline maternal renal diseaseDC0: No, 1: Yes0
Pregest_dmPre-gestational diabetes mellitusDC0: No, 1: Yes0
ThrombophiliaMaternal thrombophiliaDC0: No, 1: Yes1.25
SLESystemic lupus erythematosusDC0: No, 1: Yes0
Fh_PEFamily history of preeclampsiaDC0: No, 1: Yes (Mother or sister)10.0
NulliparousPrevious childrenDC0: No, 1: Yes0
BMI_more35Maternal body mass index > 35 Kg/m2DC0: No, 1: Yes0
SmokerMaternal smoking habitsPC0: No, 1: Yes, 2: Former smoker0
Maternal ageAge at onset of pregnancyNYears0
MaternalAge_more40Age at onset of pregnancy >40 yearsDC0: No, 1: Yes0
ASAAspirin intakePC0: No, 1: Yes (before week 16), 2: Yes (week 16-week 20)1.25
HeparinLow molecular weight heparin administrationPC0: No, 1: Yes (before week 16), 2: Yes (week 16-week 20)0
1Us-gestAgeGestational age based on the 1st trimester ultrasoundNWeeks7.50
CR-length_Us1Crown-rump length (1st trimester ultrasound)Nmm20.00
CR-gestAgeGestational age based on the crown-rump lengthNWeeks20.00
2Us-gestAgeGestational age based on the 2nd trimester ultrasoundNWeeks12.50
PIlUtA_1921UsPulsatility index of the left uterine artery (19 + 0–21 + 6 weeks ultrasound)NNumber23.75
PIrUtA_1921UsPulsatility index of the right uterine artery (19 + 0–21 + 6 weeks ultrasound)NNumber23.75
mPIUtA_1921UsMean pulsatility index of the uterine arteries (19 + 0–21 + 6 weeks ultrasound)NNumber23.75
Table A4. Data sources and percentage of missing values for the features used in the post-pregnancy hypertension (HT) model. N: Numerical; DC: Dichotomous Categorical; PC: Polytomous Categorical.
FeatureFeature MeaningCategoryScaleMissing Values (%)
GA_diagnosisGestational age at which the diagnosis of preeclampsia was establishedNWeeks6.67
SBP_diagnosisSystolic blood pressure at diagnosisNmmHg2.22
DBP_diagnosisDiastolic blood pressure at diagnosisNmmHg2.22
MBP_diagnosisMean blood pressure at diagnosisNmmHg2.22
PIlUtA_diagUsPulsatility index of the left uterine artery in the diagnostic ultrasoundNNumber11.11
PIrUtA_diagUsPulsatility index of the right uterine artery in the diagnostic ultrasoundNNumber11.11
mPIUtA_diagUsMean pulsatility index of the uterine arteries in the diagnostic ultrasoundNNumber11.11
tFlow_diagUsEnd-diastolic flow in the umbilical artery on diagnostic ultrasoundPC0: Anterograde, 1: Absent, 2: Retrograde11.11
MCAPI_diagUsPulsatility index in the middle cerebral artery on diagnostic ultrasoundNNumber13.33
UAPI_diagUsPulsatility index in the umbilical artery on diagnostic ultrasoundNNumber8.89
CPratio_diagUsCerebro-placental ratio in diagnostic ultrasoundNNumber13.33
a_wave_diagUs‘a’ wave in ductus venosus on diagnostic ultrasoundPC0: Anterograde, 1: Absent, 2: Retrograde15.56
sFlt1_diagUsSoluble fms-like tyrosine kinase-1 on diagnostic ultrasoundNpg/mL24.44
1RF_medicalHist1 risk factor in the medical history (for PREP-L and PREP-S)DC0: No, 1: Yes0
2orMoreRF_medicalHist2 or more risk factors in the medical history (for PREP-L and PREP-S)DC0: No, 1: Yes0
SBP_maxMaximum systolic blood pressureNmmHg0
DBP_maxMaximum diastolic blood pressureNmmHg2.22
MBP_maxMaximum mean blood pressure (systemic or pulmonary)NmmHg2.22
Num_oralAntihypertNumber of oral antihypertensive drugs administered between alphamethyldopa, labetalol, hydralazine, and nifedipineNNumber0
Num_intravAntihypertNumber of intravenous antihypertensive drugs administered between alfamethyldopa, labetalol and hydralazine.NNumber0
Corticost_admPrenatal corticosteroid administrationPC0: No, 1: Yes (at least 1 complete cycle), 2: Yes (incomplete)0
Mg_sulfate_admMagnesium sulfate administrationPC0: No, 1: Yes (antepartum), 2: Yes (intrapartum), 3: Yes (antepartum and intrapartum), 4: Yes (postpartum), 5: Yes (antepartum, intrapartum and postpartum)0
Neuro_symptomsPatients’ symptoms (headache or visual disturbance)DC0: No, 1: Yes0
thirdSpace_symptomsPatients’ symptoms (edema of the face and hands, sudden weight gain or chest pain)DC0: No, 1: Yes0
Hepatic_symptomsPatients’ symptoms (nausea/vomiting or epigastric pain)DC0: No, 1: Yes0
Num_severityCritNumber of severity criteria, including severe hypertension, thrombocytopenia, hepatic impairment, renal impairment, pulmonary edema and neurological eventsNNumber0
Num_maternalCompNumber of maternal complications, including refractory hypertension, ischemic heart disease, intubation, oliguria, dialysis, HELLP syndrome, hepatic hematoma, coagulopathy, stroke and abruptioNNumber0
FGR_finalStageFetal growth restriction stage (final classification)PC0: No, 1: Stage I, 2: Stage II, 3: Stage III, 4: Stage IV, 5: Small for gestational age (SGA)8.89
Table A5. Data sources and percentage of missing values for follow-up visit features used in the clustering analysis, distributed according to the three different tests performed: blood test, atherosclerosis study and ambulatory blood pressure monitoring. N: Numerical.
FeatureFeature MeaningCategoryScaleMissing Values (%)
Blood and Urine Test Features
HemoglobinProtein in red blood cells that carries oxygenNd/dL2.33
HematocritProportion of blood volume occupied by red cellsN%2.33
MCVMean corpuscular volumeNfL (femtoliters)2.33
NeutrophilsA type of white blood cellN109/L2.33
LeukocytesWhite blood cells that fight infectionN109/L2.33
PlateletsCells that help blood clotN109/L2.33
Prothrombin_actTest to measure blood clotting abilityN%0
Prothrombin_tTime taken for blood to clotNSeconds0
INRStandardized measure of blood clottingNRatio0
aPTTTime to form a blood clot in a partial thromboplastin test (Activated Partial Thromboplastin Time)NSeconds0
TriglyceridesType of fat found in bloodNmg/dL0
CholesterolTotal cholesterol level in bloodNmg/dL0
LDLLow-density lipoprotein (‘bad cholesterol’)Nmg/dL0
HDLHigh-density lipoprotein (‘good cholesterol’)Nmg/dL0
GlucoseBlood sugar levelNmg/dL0
CreatinineWaste product indicating kidney functionNmg/dL0
SodiumEssential electrolyte in bloodNMmol/L0
PotassiumEssential electrolyte in bloodNMmol/L0
CalciumEssential mineral for bones and teethNmg/dL0
PhosphorusImportant mineral for bones and energy productionNmg/dL0
ALT/GPTLiver enzyme indicating liver healthNU/L0
AST/GOTLiver enzyme indicating liver healthNU/L0
TSHHormone stimulating the thyroidN μ U/mL0
BilirubinYellow pigment formed by breakdown of red blood cellsNmd/dL0
LDHEnzyme that helps producing energyNU/L0
Total_proteinsTotal protein in bloodNg/dL0
Glycated_HbLong term indicator of blood sugar levelsN%0
C_reactive_protInflammation markerNmg/dL0
Uric_acidWaste product indicating metabolismNmg/dL0
IronEssential mineral for blood productionN μ g/dL0
FerritinProtein that stores ironNng/dL0
TransferrinProtein that transports ironsNmg/dL0
Transferrin_satPercentage of transferrin that is saturated with ironN%0
AlbuminMain protein in bloodNg/dL0
Urine_albProtein in urine indicating kidney damageNmg/dL0
Urine_creatWaste product in urine indicating kidney functionNmg/dL0
Urine_alb/creatRatio indicating kidney functionNMg/g0
Anithyroid_peroxAntibodies against thyroid peroxidaseNIU/mol0
IgAImmunoglobulin A (a type of antibody)Nmg/dL0
IgGImmunoglobulin G (a type of antibody)Nmg/dL0
IgMImmunoglobulin M (a type of antibody)Nmg/dL0
C3_complementProtein of the immune systemNmg/dL0
C4_complementProtein of the immune systemNmg/dL0
Active_MMP9Active form of the enzyme matrix metalloproteinase-9Nng/dL4.65
Total_MMP9Total matrix metalloproteinase-9Nng/dL4.65
TIMP1Tissue inhibitor of metalloproteinase-1Nng/dL4.65
MMP9/TIMP1Ratio of MMP9 to TIMP1Nratio4.65
Atherosclerosis study features
IMT_lfaIntima-media thickness of left femoral arteryNmm6.81
IMT_rfaIntima-media thickness of right femoral arteryNmm4.55
IMT_lcaIntima-media thickness of left carotid arteryNmm0
IMT_rcaIntima-media thickness of right carotid arteryNmm0
Num_plaquesNumber of territories with atherosclerotic plaquesNNumber0
Ambulatory blood pressure monitoring features
SBP_24hSystolic blood pressure 24 hNmmHg0
DBP_24hDiastolic blood pressure 24 hNmmHg0
MBP_24hMean blood pressure 24 hNmmHg0
Sreadings_24hSystolic readings over limit in 24 hN%0
Dreadings_24hDiastolic readings over limit in 24 hN%0
SBP_diurnalDiurnal systolic blood pressureNmmHg0
DBP_diurnalDiurnal diastolic blood pressureNmmHg0
MBP_diurnalDiurnal mean blood pressureNmmHg0
Sreadings_diurnalDiurnal systolic readings over limitN%0
Dreadings_diurnalDiurnal diastolic readings over limit in 24 hN%0
SBP_ nocturnalNocturnal systolic blood pressureNmmHg0
DBP_ nocturnalNocturnal diastolic blood pressureNmmHg0
MBP_ nocturnalNocturnal mean blood pressureNmmHg0
Sreadings_ nocturnalNocturnal systolic readings over limitN%0
Dreadings_ nocturnalNocturnal diastolic readings over limit in 24 hN%0
Table A6. Definitions of performance metrics used in this study.
MetricFormula
Accuracy(TP + TN)/(TP + TN + FP + FN)
Precision (PPV)TP/(TP + FP)
Recall (Sensitivity)TP/(TP + FN)
SpecificityTN/(TN + FP)
Negative Predictive Value (NPV)TN/(TN + FN)
F1-score2 × (Precision × Recall)/(Precision + Recall)
Figure A1. Genetic Algorithm workflow: (1) The process begins with the random generation of an initial population. (2) Each individual (or solution) is evaluated using a fitness function to measure its performance. (3) The best-performing individuals are selected to reproduce, passing their traits to the next generation through crossover (gene exchange) and mutation (random changes). (4) This evolutionary cycle continues iteratively, promoting diversity and gradually improving the population until an optimal solution is reached.
Applsci 15 08887 g0a1
Figure A2. Receiver operating characteristic (ROC) curves for both models. The closer the curve follows the left-hand border and the top border, the better the model’s performance. Area under the curve (AUC). (a) ROC curve for early-onset preeclampsia risk reevaluation model using the Support Vector Machine algorithm. The AUC is 0.990, indicating high discrimination ability; (b) ROC curve for post-pregnancy hypertension model using the Logistic Regression algorithm. The AUC is 0.860.
Applsci 15 08887 g0a2
Figure A3. Average confusion matrices for both models. The mean values of true negatives, false positives, false negatives, and true positives, along with their corresponding standard deviations are shown. (a) Average confusion matrix for early-onset preeclampsia risk reevaluation model using the Support Vector Machine algorithm, obtained through cross-validation; (b) Average confusion matrix for post-pregnancy hypertension model using the Logistic Regression algorithm, obtained through cross-validation.
Applsci 15 08887 g0a3

References

  1. Gathiram, P.; Moodley, J.J. Pre-eclampsia: Its pathogenesis and pathophysiolgy. Cardiovasc. J. Africa 2016, 27, 71–78. [Google Scholar] [CrossRef] [PubMed]
  2. Lisonkova, S.; Sabr, Y.; Mayer, C.; Young, C.; Skoll, A.; Joseph, K.S. Maternal morbidity associated with early-onset and late-onset preeclampsia. Obstet. Gynecol. 2014, 124, 771–781. [Google Scholar] [CrossRef]
  3. Brown, M.A.; Lindheimer, M.D.; De Swiet, M.; Van Assche, A.; Moutquin, J.M. The classification and diagnosis of the hypertensive disorders of pregnancy: Statement from the International Society for the Study of Hypertension in Pregnancy (ISSHP). Hypertens. Pregnancy 2001, 20, ix–xiv. [Google Scholar] [CrossRef]
  4. Bellamy, L.; Casas, J.P.; Hingorani, A.D.; Williams, D.J. Pre-eclampsia and risk of cardiovascular disease and cancer in later life: Systematic review and meta-analysis. BMJ 2007, 335, 974–977. [Google Scholar] [CrossRef]
  5. McDonald, S.D.; Malinowski, A.; Zhou, Q.; Yusuf, S.; Devereaux, P.J. Cardiovascular sequelae of preeclampsia/eclampsia: A systematic review and meta-analyses. Am. Heart J. 2008, 156, 918–930. [Google Scholar] [CrossRef]
  6. Verghese, D.; Muller, L.; Velamakanni, S. Addressing Cardiovascular Risk Across the Arc of a Woman’s Life: Sex-Specific Prevention and Treatment. Curr. Cardiol. Rep. 2023, 25, 1053–1064. [Google Scholar] [CrossRef]
  7. Masini, G.; Foo, L.F.; Tay, J.; Wilkinson, I.B.; Valensise, H.; Gyselaers, W.; Lees, C.C. Preeclampsia has two phenotypes which require different treatment strategies. Am. J. Obstet. Gynecol. 2022, 226, S1006–S1018. [Google Scholar] [CrossRef] [PubMed]
  8. McNestry, C.; Killeen, S.L.; Crowley, R.K.; McAuliffe, F.M. Pregnancy complications and later life women’s health. Acta Obstet. Et Gynecol. Scand. 2023, 102, 523–531. [Google Scholar] [CrossRef]
  9. Domínguez del Olmo, P.; Herraiz, I.; Villalaín, C.; De la Parte, B.; Rodríguez-Sánchez, E.; Ruiz-Hurtado, G.; Fernández-Friera, L.; Morales, E.; Ayala, J.L.; Solís, J.; et al. Cardiovascular disease in women with early-onset preeclampsia: A matched case-control study. J. Matern.-Fetal Neonatal Med. 2025, 38, 2459302. [Google Scholar] [CrossRef] [PubMed]
  10. Tan, M.Y.; Wright, D.; Syngelaki, A.; Akolekar, R.; Cicero, S.; Janga, D.; Singh, M.; Greco, E.; Wright, A.; Maclagan, K.; et al. Comparison of diagnostic accuracy of early screening for pre-eclampsia by NICE guidelines and a method combining maternal factors and biomarkers: Results of SPREE. Ultrasound Obstet. Gynecol. 2018, 51, 743–750. [Google Scholar] [CrossRef]
  11. Yoffe, L.; Gilam, A.; Yaron, O.; Polsky, A.; Farberov, L.; Syngelaki, A.; Nicolaides, K.; Hod, M.; Shomron, N. Early Detection of Preeclampsia Using Circulating Small non-coding RNA. Sci. Rep. 2018, 8, 3401. [Google Scholar] [CrossRef]
  12. Chaemsaithong, P.; Sahota, D.S.; Poon, L.C. First trimester preeclampsia screening and prediction. Am. J. Obstet. Gynecol. 2022, 226, S1071–S1097.e2. [Google Scholar] [CrossRef] [PubMed]
  13. IMarić, I.; Tsur, A.; Aghaeepour, N.; Montanari, A.; Stevenson, D.K.; Shaw, G.M.; Winn, V.D. Early prediction of preeclampsia via machine learning. Am. J. Obstet. Gynecol. MFM 2020, 2, 100100. [Google Scholar] [CrossRef]
  14. Butler, L.; Gunturkun, F.; Chinthala, L.; Karabayir, I.; Tootooni, M.S.; Bakir-Batu, B.; Celik, T.; Akbilgic, O.; Davis, R.L. AI-based preeclampsia detection and prediction with electrocardiogram data. Front. Cardiovasc. Med. 2024, 11, 1360238. [Google Scholar] [CrossRef]
  15. Villa, P.M.; Marttinen, P.; Gillberg, J.; Lokki, A.I.; Majander, K.; Orden, M.R.; Taipale, P.; Pesonen, A.; Räikkönen, K.; Hämäläinen, E.; et al. Cluster analysis to estimate the risk of preeclampsia in the high-risk Prediction and Prevention of Preeclampsia and Intrauterine Growth Restriction (PREDO) study. PLoS ONE 2017, 12, e0174399. [Google Scholar] [CrossRef] [PubMed]
  16. Wang, G.; Zhang, Y.; Li, S.; Zhang, J.; Jiang, D.; Li, X.; Li, Y.; Du, J. A Machine Learning-Based Prediction Model for Cardiovascular Risk in Women with Preeclampsia. Front. Cardiovasc. Med. 2021, 8, 736491. [Google Scholar] [CrossRef]
  17. Villalain, C.; Gómez-Arriaga, P.; Simón, E.; Galindo, A.; Herraiz, I. Longitudinal changes in angiogenesis biomarkers within 72 h of diagnosis and time-to-delivery in early-onset preeclampsia. Pregnancy Hypertens. 2022, 28, 139–145. [Google Scholar] [CrossRef]
  18. Gõmez-Arriaga, P.I.; Herraiz, I.; Lõpez-Jiménez, E.A.; Escribano, D.; Denk, B.; Galindo, A. Uterine artery Doppler and sFlt-1/PlGF ratio: Prognostic value in early-onset pre-eclampsia. Ultrasound Obstet. Gynecol. 2014, 43, 525–532. [Google Scholar] [CrossRef] [PubMed]
  19. Report of the National High Blood Pressure Education Program Working Group on High Blood Pressure in Pregnancy—PubMed. Available online: https://pubmed.ncbi.nlm.nih.gov/10920346/ (accessed on 8 July 2024).
  20. Verlohren, S.; Herraiz, I.; Lapaire, O.; Schlembach, D.; Zeisler, H.; Calda, P.; Sabria, J.; Markfeld-Erol, F.; Galindo, A.; Schoofs, K.; et al. New gestational phase-specific cutoff values for the use of the soluble fms-like tyrosine kinase-1/placental growth factor ratio as a diagnostic test for preeclampsia. Hypertension 2014, 63, 346–352. [Google Scholar] [CrossRef]
  21. Harris, P.A.; Taylor, R.; Thielke, R.; Payne, J.; Gonzalez, N.; Conde, J.G. Research electronic data capture (REDCap)—A metadata-driven methodology and workflow process for providing translational research informatics support. J. Biomed. Inform. 2009, 42, 377–381. [Google Scholar] [CrossRef]
  22. Stekhoven, D.J.; Bühlmann, P. MissForest—non-parametric missing value imputation for mixed-type data. Bioinformatics 2012, 28, 112–118. [Google Scholar] [CrossRef] [PubMed]
  23. Scikit-Learn Developers. 6.4. Imputation of Missing Values. Available online: https://scikit-learn.org/stable/modules/impute.html (accessed on 13 November 2024).
  24. Scikit-Learn Developers. StandardScaler. Available online: https://scikit-learn.org/stable/modules/generated/sklearn.preprocessing.StandardScaler.html (accessed on 13 November 2024).
  25. Fernando García. PyWinEA Library. Available online: https://github.com/FernandoGaGu/pywinEA (accessed on 2 December 2024).
  26. Scikit-Learn Developers. Cross-Validation: Evaluating Estimator Performance. Available online: https://scikit-learn.org/stable/modules/cross_validation.html (accessed on 3 December 2024).
  27. Brownlee, J. Repeated K-Fold Cross-Validation for Model Evaluation in Python. In Machine Learning Mastery. 2020. Available online: https://machinelearningmastery.com/repeated-k-fold-cross-validation-with-python/ (accessed on 3 December 2024).
  28. Scikit-learn developers. GridSearchCV. Available online: https://scikit-learn.org/stable/modules/generated/sklearn.model_selection.GridSearchCV.html (accessed on 6 February 2025).
  29. Lundberg, S. An introduction to Explainable AI with Shapley Values. Available online: https://shap.readthedocs.io/en/latest/example_notebooks/overviews/An%20introduction%20to%20explainable%20AI%20with%20Shapley%20values.html (accessed on 19 March 2025).
  30. Scikit-Learn Developers. KMeans. Available online: https://scikit-learn.org/stable/modules/generated/sklearn.cluster.KMeans.html (accessed on 10 December 2024).
  31. Wright, D.; Wright, A.; Nicolaides, K.H. The competing risk approach for prediction of preeclampsia. Am. J. Obstet. Gynecol. 2020, 223, 12–23.e7. [Google Scholar] [CrossRef] [PubMed]
  32. Staff, A.C.; Fjeldstad, H.E.; Fosheim, I.K.; Moe, K.; Turowski, G.; Johnsen, G.M.; Alnaes-Katjavivi, P.; Sugulle, M. Failure of physiological transformation and spiral artery atherosis: Their roles in preeclampsia. Am. J. Obstet. Gynecol. 2022, 226, S895–S906. [Google Scholar] [CrossRef] [PubMed]
  33. González, C.V.; García, I.H.; Fernández-Friera, L.; Ruiz-Hurtado, G.; Morales, E.; Solís, J.; Galindo, A. Salud cardiovascular y renal en la mujer: La preeclampsia como marcador de riesgo. Nefrología 2023, 43, 269–280. [Google Scholar] [CrossRef]
  34. Amiri, M.; Tehrani, F.R.; Rahmati, M.; Behboudi-Gandevani, S.; Azizi, F. Changes over-time in blood pressure of women with preeclampsia compared to those with normotensive pregnancies: A 15 year population-based cohort study. Pregnancy Hypertens. 2019, 17, 94–99. [Google Scholar] [CrossRef]
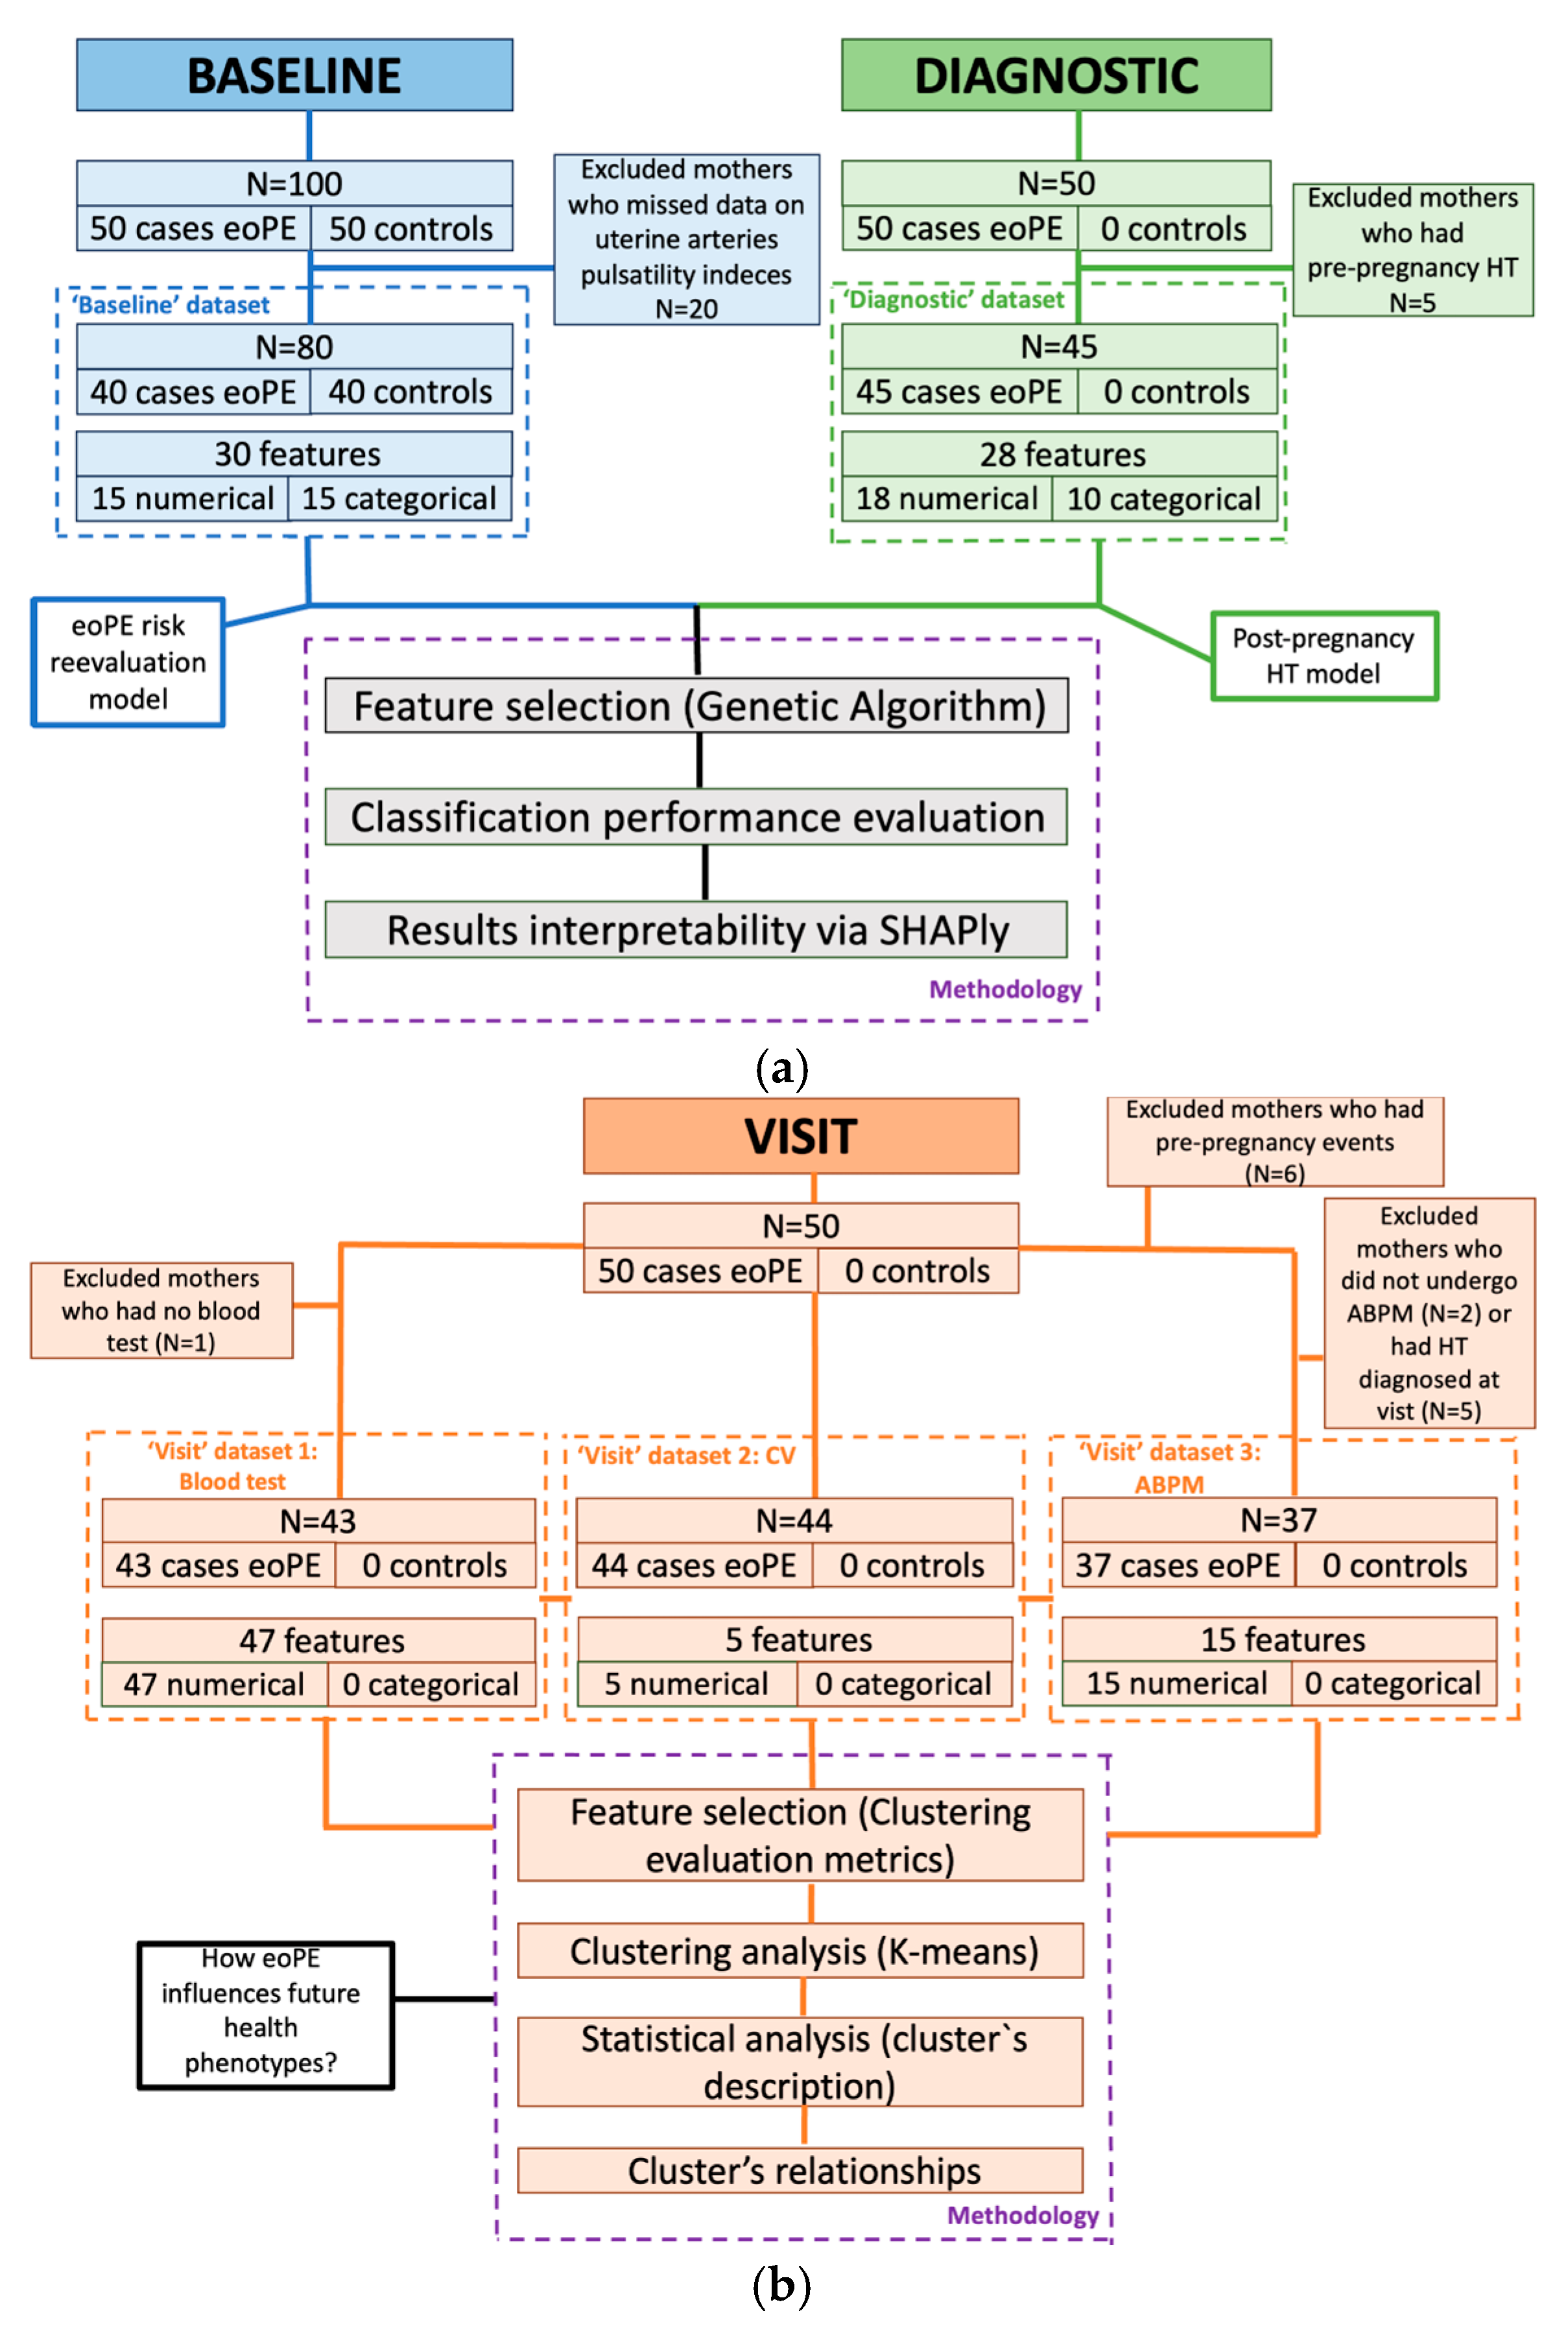
Figure 1. Description of the total sample, features, and methodology applied across the three time frames: (a) Pre-pregnancy baseline and diagnostic phase; (b) Follow-up visit after delivery. ABPM, ambulatory blood pressure monitoring; CV, cardiovascular; eoPE, early-onset preeclampsia; HT, hypertension.
Applsci 15 08887 g001
Figure 2. A comprehensive overview of the steps involved in the Genetic Algorithm (GA) employed for feature selection in developing both the early-onset preeclampsia (eoPE) risk reevaluation model and the post-pregnancy hypertension (HT) prediction model.
Applsci 15 08887 g002
Figure 3. Methodology for applying the Genetic Algorithm (GA): phase one focuses on selecting the optimal classification algorithm, while phase two involves optimizing the selected classifier by fine-tuning the Genetic Algorithm parameters. CV, Cross-Validation; SVMs, Support Vector Machines; KNN, K-Nearest Neighbor; LR, Logistic Regression; DT, Decision Trees; Cn, Combination n.
Applsci 15 08887 g003
Figure 4. Summary plot illustrating the interpretability of the early-onset preeclampsia risk reevaluation model using the Support Vector Machine algorithm. The top six clinical variables are ranked based on their average absolute SHAP values. The red and blue points in each row represent women having high to low values of the specific predictor. The x-axis indicates the SHAP values, showing each variable’s effect on the model predictions—positive SHAP values drive predictions toward early-onset preeclampsia, while negative values push predictions toward the absence of the condition. mPIUtA_1921Us: mean pulsatility index of the uterine arteries (19 + 0–21 + 6 weeks ultrasound); PlrUtA_1921Us: pulsatility index of the left uterine artery (19 + 0–21 + 6 weeks ultrasound); Heparin: low molecular weight heparin administration; Chronic_ht: maternal chronic hypertension; MaternalAge_more40: age at onset of pregnancy >40 years; Nephropathy: baseline maternal renal disease.
Applsci 15 08887 g004
Figure 5. Waterfall plots illustrating the predicted early-onset preeclampsia (eoPE) risk for four representative individuals using the Support Vector Machine algorithm. The baseline probability is 0.511, and each feature’s contribution is visualized using SHAP values. The red color indicates that the value of a given feature increases the predicted outcome relative to the baseline, whereas the blue color indicates that the value decreases it. These cases were selected to highlight key prediction scenarios: (a) True positive: high uterine artery pulsatility indices increase predicted risk; (b) False negative: low Doppler values and absence of risk factors reduce risk estimation; (c) True positive: despite low Doppler values, chronic HT and renal disease increase risk; (d) True negative: low Doppler values reduce predicted risk.
Applsci 15 08887 g005
Figure 6. Summary plot illustrating the interpretability of the post-pregnancy hypertension (HT) model using the Logistic Regression algorithm. The top six clinical variables are ranked based on their average absolute SHAP values. The red and blue points in each row represent women having high to low values of the specific predictor. The x-axis indicates the SHAP values, showing each variable’s effect on the model predictions—positive SHAP values drive predictions toward post-pregnancy HT, while negative values push predictions toward the absence of the condition. SBP_max: maximum systolic blood pressure; MBP_max: maximum mean blood pressure; CPratio_diagUs: cerebro-placental ratio in ultrasound performed at the time of early onset preeclampsia diagnosis; tFlow_diagUs: end-diastolic flow in the umbilical artery in ultrasound performed at the time of early onset preeclampsia diagnosis; a_wave_diagUs: ‘a’ wave in ductus venosus in ultrasound performed at the time of early onset preeclampsia diagnosis; 2orMoreRF_medicalHist: 2 or more risk factors in the medical history).
Applsci 15 08887 g006
Figure 7. Waterfall plots illustrating the predicted post-pregnancy hypertension (HT) risk for four representative individuals using the Logistic Regression algorithm. The baseline probability is 0.378, and each feature’s contribution is visualized using SHAP values. The red color indicates that the value of a given feature increases the predicted outcome relative to the baseline, whereas the blue color indicates that the value decreases it. These cases were selected to highlight key prediction scenarios: (a) False negative: low SBP and MBP values reduce the predicted risk; (b) True positive: intermediate SBP and MBP values have limited influence; high CPI value increases risk; (c) True positive: extremely high SBP and MBP values significantly increase the predicted risk; (d) False positive: elevated SBP, MBP and CPI values lead to overestimation of risk.
Applsci 15 08887 g007
Figure 8. Radar chart for each dataset. Each radial axis corresponds to one variable, with the value of an observation represented by the distance from the center of the chart to the outer edge. The x-axis indicates the normalized values of the variables, allowing for a visual comparison of the differences between groups. (a) Blood test dataset. There is a clear difference in the “active_MMP9” variable between the groups, suggesting that this could be a significant differentiating factor. Hematocrit: Hematocrit (%); aPPT: activated Partial Thromboplastin Time (s); urine_creat: creatinine in urine (mg/dL); active_MMP9: active Metalloproteinase-9 (ng/mL); (b) Cardiovascular dataset. The blue line represents a group with consistently high values in the “IMT_lfa” variable. IMT_rca: intima media thickness (mm) right carotid artery; IMT_lfa: intima media thickness (mm) left femoral artery; num_plaques: number of territories with atherosclerotic plaque; (c) Ambulatory blood pressure monitoring dataset. The groups are clearly differentiated with all variables being particularly high in the red group. SBP_24h: systolic blood pressure (mmHg) 24 h measurement; Sreadings_24h: systolic readings over limit in 24 h (%); Dreadings_24h: diastolic readings over limit in 24 h (%); MBP_nocturnal: nocturnal mean blood pressure (mmHg); Sreadings_nocturnal: nocturnal systolic readings over limit (%).
Applsci 15 08887 g008
Table 1. Summary of representative studies applying machine learning to preeclampsia and cardiovascular risk prediction. AUC, area under the curve; CV, cardiovascular; ECG, electrocardiogram; PE, preeclampsia.
ReferenceMethod/ApproachMerits (Key Findings)Limitations/Research Gap
Maric et al. [13]Elastic Net and Gradient Boosting algorithms using 67 early prenatal variables.Achieved a high predictive accuracy with an AUC of 0.89 and a true-positive rate of 72.3%.Faced issues with substantial missing data. Limited its analysis to variables collected before 16 weeks of gestation.
Butler et al. [14]Modified ResNet Convolutional Neural Network analyzing raw ECG signals.Demonstrated high performance in predicting PE risk up to 90 days before diagnosis, with AUCs reaching 0.92.The study focuses solely on ECG data, potentially missing other relevant clinical factors.
Villa PM et al. [15]Unsupervised cluster analysis on women with known clinical risk factors for PE.Identified 25 distinct patient clusters with different risk factor combinations, enabling more granular risk assessment.The approach identifies risk groups but does not provide individualized predictive scores for future risk.
Wang G et al. [16]Five different ML algorithms (including Random Forest) for postpartum CV risk prediction.The Random Forest model showed the best performance for general CV risk prediction (AUC of 0.711).The model struggled to identify positive cases (low sensitivity) and did not focus specifically on post-pregnancy hypertension.
Table 2. Summary of the machine learning methods used in model development.
Method/TechniqueDataset(s) UsedRole in the StudyJustification/Description
Genetic AlgorithmBaseline and diagnosticFeature selectionEvolutionary algorithm selected due to its flexibility, modular structure, and availability of reliable Python libraries.
Most important parameters: Elitism (to retain the best-performing individuals), Annihilation (to eliminate the least fit), Fill with elite (to repopulate with top individuals) and Mutation rate (to introduce diversity and avoid local optima).
Cross-validationAll supervised modelsModel optimization (in the GA fitness function to identify the combination of variables that maximized the F1 score) and validation (in performance evaluation to prevent overfitting)Ensures robust performance estimation by averaging across multiple folds and repetitions; reduces overfitting and variance
Support Vector MachineBaseline and diagnosticFinal classifier for eoPE risk reevaluation modelDefines an optimal hyperplane that maximizes class separation, making it suitable for high-dimensional, small-sample problems; best F1-score on baseline dataset
Logistic RegressionBaseline and diagnosticFinal classifier for post-pregnancy HT modelModels the log-odds of the outcome using a logistic function; best F1-score on diagnostic dataset
K-Nearest NeighborsBaseline and diagnosticEvaluated but not selectedClassifies based on labels of nearest neighbors; lower F1-score on both datasets
Decision TreeBaseline and diagnosticEvaluated but not selectedRule-based partitioning; lower F1-score on both datasets
GridSearchCVFinal modelsHyperparameter tuning of classifiersSystematic search over predefined parameter grids applied to optimize model-specific parameters, enhancing predictive performance and model generalizability.
SHAPFinal modelsModel interpretabilityExplains individual predictions by estimating feature contributions; enhances transparency and clinical insight
Table 3. Performance metrics of the best result achieved through the two-phase genetic algorithm (GA) process for the early-onset preeclampsia risk reevaluation model, developed using the Support Vector Machine algorithm. The input features outlined in the first table row were carefully selected through the GA process to ensure an optimized combination for maximum predictive F1 score. mPIUtA_1921Us: mean pulsatility index of the uterine arteries (19 + 0–21 + 6 weeks ultrasound); PlrUtA_1921Us: pulsatility index of the right uterine artery (19 + 0–21 + 6 weeks ultrasound); Chronic_ht: maternal chronic hypertension; MaternalAge_more40: age at onset of pregnancy >40 years; Nephropathy: baseline maternal renal disease; Heparin: low molecular weight heparin administration. All metrics are reported as the mean (95% confidence interval).
mPIUtA_1921Us, PIrUtA_1921Us, Chronic_ht, MaternalAge_more40, Nephropathy, Heparin
AccuracyPrecisionRecallSpecificityNPVF1 Score
TrainValidationTrainValidationTrainValidationTrainValidationTrainValidationTrainValidation
0.973 (0.969–0.978)0.970 (0.956–0.984)0.997 (0.994–1.000)0.991 (0.979–1.000)0.950 (0.941–0.957)0.950 (0.922–0.978)0.998 (0.994–1.000)0.990 (0.976–1.000)0.951 (0.944–0.959)0.956 (0.932–0.981)0.972 (0.968–0.977)0.968 (0.953–0.984)
Table 4. Performance metrics of the best result achieved through the two-phase genetic algorithm (GA) process for the post-pregnancy hypertension model, developed using the Logistic Regression algorithm. The input features outlined in the first row were carefully selected through the GA process to ensure an optimized combination for maximum predictive F1 score. 2orMoreRF_medicalHist: 2 or more risk factors in the medical history; CPratio_diagUs: cerebro-placental ratio in ultrasound performed at the time of early onset preeclampsia diagnosis; tFlow_diagUs: end-diastolic flow in the umbilical artery in ultrasound performed at the time of early onset preeclampsia diagnosis; a_wave_diagUs: ‘a’ wave in ductus venosus in ultrasound performed at the time of early onset preeclampsia diagnosis; SBP_max: maximum systolic blood pressure; MBP_max: maximum mean blood pressure. All metrics are reported as the mean (95% confidence interval).
2orMoreRF_medicalHist, CPratio_diagUs, tFlow_diagUs, a_wave_diagUs, SBP_max, MBP_max
AccuracyPrecisionRecallSpecificityNPVF1 Score
TrainValidationTrainValidationTrainValidationTrainValidationTrainValidationTrainValidation
0.844 (0.823–0.866)0.837 (0.814–0.860)0.821 (0.789–0.852)0.818 (0.767–0.870)0.754 (0.714–0.795)0.741 (0.672–0.809)0.898 (0.876–0.921)0.891 (0.855–0.928)0.858 (0.839–0.878)0.855 (0.828–0.882)0.785 (0.754–0.816)0.771 (0.733–0.810)
Table 5. Statistically significant differences in ABPM variables between clusters (24 h, diurnal, and nocturnal periods). SBP, systolic blood pressure; DBP, diastolic blood pressure; MBP, mean blood pressure; Sreadings, systolic readings; Dreadings, diastolic readings.
24 hDiurnalNocturnal
BlueRedBlueRedBlueRed
SBP110.39 ± 7.61129.83 ± 6.82113.39 ± 8.27132.33 ± 8.55102.16 ± 8.39121.67 ± 3.88
DBP71.13 ± 5.5382.50 ± 9.5474.0 ± 6.1984.50 ± 10.1963.00 ± 6.6676.17 ± 6.43
MBP84.26 ± 5.7798.17 ± 8.2187.13 ± 6.40100.33 ± 9.0376.10 ± 6.8091.33 ± 5.35
Sreadings5.97 ± 7.5445.50 ± 21.904.10 ± 7.0139.73 ± 21.685.41 ± 8.1647.0 ± 14.57
Dreadings19.13 ± 15.6048.78 ± 24.6213.64 ± 14.5242.60 ± 31.1422.62 ± 24.8163.28 ± 17.65
Table 6. Summary of principal findings and their potential clinical applicability across the study phases once externally validated.
Principal FindingsClinical Applicability
Baseline phase: SVM-based eoPE risk reevaluation model achieved an F1-score of 97.2% (96.8–97.7%) in training and 96.8% (95.3–98.4%) in validation. Additionally, the model demonstrated high sensitivity (95.0% (94.1–95.7%) in training and 95.0 (92.2–97.8%) in validation)Refined risk stratification during the second trimester could be crucial for assigning risk to patients who missed first-trimester screening and for reclassifying the risk of those already taking (or not taking) aspirin, to determine whether they would benefit from more intensive monitoring. Additionally, it could replace current Bayes-based models without the need to use biomarkers such as PlGF, which are expensive and not universally available.
Diagnostic phase: LR-based post-pregnancy hypertension prediction model achieved an F1-score of 78.5% (75.4–81.6%) in training and 77.1% (73.3–81.0%) in validationIt could lead to better resource allocation to identify high-risk individuals who require intensive blood pressure monitoring and treatment after delivery, as well as promote lifestyle interventions to prevent cardiovascular events.
Mid-term follow-up: clustering-based analysis on blood test, CV test and ABPM variablesHigh blood pressure levels at the time of PE diagnosis should be taken into account in mid-term follow up, as they are associated with persistent chronic HT and poor postpartum blood pressure control.
Disclaimer/Publisher’s Note: The statements, opinions and data contained in all publications are solely those of the individual author(s) and contributor(s) and not of MDPI and/or the editor(s). MDPI and/or the editor(s) disclaim responsibility for any injury to people or property resulting from any ideas, methods, instructions or products referred to in the content.