Featured Application
The DNA barcode data generated from 403 fruit fly individuals across 21 species provides a valuable molecular resource to support global efforts in species delineation and identification. These sequences will significantly contribute to accurate species identification, aiding researchers, diagnosticians, and biosecurity programs worldwide in their surveillance and management strategies. Additionally, the real-time PCR assays developed for four target species—Bactrocera facialis, B. passiflorae, B. kirki, and B. distincta—provide enhanced detection tools to initiate timely responses to emerging biosecurity threats.
Abstract
Polyphagous fruit fly (Diptera: Tephritidae) pests from the Pacific Islands pose a biosecurity risk to New Zealand, a country free from pest fruit flies. Among them, Bactrocera facialis, B. passiflorae, B. kirki, and B. distincta are sympatric species commonly intercepted at immature stages at the border. However, current mitochondrial cytochrome oxidase I (COI) barcode data lack sufficient variation for a confident identification of the above four species. To address this, we generated COI barcode data for 403 fruit fly individuals including these four species and an additional 17 related fruit fly species. A phylogenetic analysis of the COI sequences of B. facialis revealed two genetically distinct populations, one closely related to B. passiflorae. Complete mitochondrial genomes were explored, identifying minor fixed differences in Cytochrome b (CYTB), NADH dehydrogenase 2 (ND2), and ATP synthase membrane subunit 6 (ATP6) genes. Based on sequence data for COI, ND2, and ATP6 genes, a multiplex real-time PCR assay has been developed and validated for the four target species. Each assay demonstrated high specificity, with no cross-reactions, and sensitivity as low as 10 copies/μL of the target DNA. This study shows that the developed assays enable the rapid and reliable identification of the target fruit fly species, supporting global biosecurity efforts.
1. Introduction
Polyphagous fruit fly pests of the family Tephritidae are among the greatest threats to New Zealand’s horticultural industry [1,2,3]. Fruit fly species pose varying degrees of risks based on their host and climate preferences, level of infestation, and invasiveness [4]. Accurate, rapid, and reliable identification of fruit flies to species level is essential for the adoption of appropriate quarantine/treatment actions. However, morphological differentiation between harmful and non-harmful fruit flies can be difficult, especially for immature stages. Morphological keys are only available for the third larval instar of some fruit fly species, and accurate species identification is nearly impossible due to similar larval characteristics [5]. Unfortunately, early developmental stages are the most likely to be intercepted at borders, and their diagnosis relies on risky and time-consuming procedures, such as rearing to adults [6,7]. As an alternative, DNA-based diagnostic protocols enable reliable identification of morphologically indistinct immature life stages, cryptic species, and damaged specimens [4].
Various molecular techniques are currently available for fruit fly identification, including DNA barcoding, restriction fragment length polymorphism (RFLP), real-time polymerase chain reaction (PCR), loop-mediated isothermal amplification (LAMP), and microfluidic dynamic array techniques [1,8,9,10,11,12]. Of these, DNA barcoding is the most commonly used technique for molecular identification of fruit flies due to its capacity to discriminate between most species [13,14,15]. However, this method is time-consuming, due to DNA sequencing step, and relies on the availability of good quality reference sequences in public databases [16,17,18,19]. Molecular identification using real-time PCR assays has many advantages, including speed, lower contamination rate, higher sensitivity, higher specificity, and easy standardisation [9,10].
Several real-time PCR assays are available for the identification of various fruit fly pest species [1,10,20]; however, no rapid methods have been developed for Bactrocera facialis (Coquillett), B. passiflorae (Froggatt), B. kirki (Froggatt), and B. distincta (Malloch). These species share similar distributions, cause significant damage to fruits and vegetables in Pacific Island countries, and are considered quarantine pests in countries where they are absent, such as New Zealand. Bactrocera passiflorae is a serious pest in several Pacific Island countries and is known to attack over 50 host plants, including economically valuable crops, such as passionfruit, guava, and tomato. Bactrocera kirki is a highly polyphagous fruit fly pest which was first recorded in French Polynesia in 1928, and now has a wide distribution in the Polynesian Islands, demonstrating its invasive potential [21]. Bactrocera facialis is a major pest of capsicum and chili peppers in Tonga, while B. distincta is a minor oligophagous fruit pest found in Fiji, Samoa, Tonga, and Wallis Island [22]. Moreover, one B. passiflorae and two B. facialis individuals were detected in the fruit fly surveillance traps in Auckland in 1990 and 2019, respectively [23]. It should be noted that no additional flies and no breeding populations were detected following extensive response efforts. In addition, immature stages of the fruit fly species, including eggs and larvae, are commonly intercepted at New Zealand borders, and urgent molecular diagnostics are needed for identification. However, DNA barcode sequences are limited for these species, and no rapid detection protocols are available. Therefore, the aims of this study are as follows: (i) to capture the sequence-level variations and geographic patterns of the COI barcode from fruit flies from the Pacific Islands; and (ii) to develop rapid real-time PCR assays to distinguish the sympatric species B. distincta, B. facialis, B. kirki, and B. passiflorae.
2. Materials and Methods
2.1. Sample Collection and Identification
The samples used to develop the assays were from New Zealand border interceptions and overseas collections of fruit fly species. Most of the specimens were sourced from fruit fly traps across Australia, the Cook Islands, Fiji, French Polynesia, New Caledonia, Tonga, and Vanuatu (Table 1). All adult specimens were identified using morphological taxonomic keys [24,25] by entomologists from the Plant Health and Environment Laboratory, Ministry for Primary Industries, before conducting molecular analyses. The morphological identifications of some specimens were confirmed by the fruit fly taxonomist Dr Dick Drew (Australia). Additional specimens intercepted at the New Zealand border and collected from overseas (other than the Pacific Islands) were also used for the development and validation of the real-time PCR assays (Table 2).

Table 1.
List of Bactrocera samples from the Pacific Islands used in the COI barcode and real-time PCR assays development for detection of Bactrocera distincta, B. facialis, B. kirki, and B. passiflorae. N = numbers of individuals.
Table 2.
Other target and non-target specimens used in the development of the real-time PCR assay for detection of Bactrocera distincta, B. facialis, B. kirki, and B. passiflorae. The DNA extraction method for all these samples was DNeasy Blood and Tissue kit (Qiagen). N = numbers of individuals.
2.2. DNA Extraction and Barcoding
Total DNA from individual specimens was extracted using the DNeasy Blood and Tissue kit (Qiagen, Valencia, CA, USA) as per the manufacturer’s instructions. An adult leg, a piece of larva, or an egg was used for each extraction. Briefly, insect tissue was incubated in ALT buffer and Proteinase K overnight at 56 °C with gentle agitation (900 rpm). DNA was eluted in 100 µL of TE buffer. For some samples, DNA was also extracted using crude extraction methods with the prepGEM® DNA kit (ZyGem Corporation Ltd., Hamilton, New Zealand).
2.3. Mitochondrial COI Barcode Analysis
To obtain the DNA barcode of the 17 fruit fly species from the Pacific Island countries, the mitochondrial cytochrome oxidase I (COI) gene was sequenced and analysed. DNA extracted from the specimens was used for PCR amplification with the universal primers, LCO1490 and HCO2198 [27]. For B. passiflorae specimens, primers BP-F1 and BP-R1 [2] were used, while B. tryoni specimens were amplified using FFCOI-F and HCO2198 [13] due to the presence of nuclear mitochondrial pseudogenes (NUMT) that can interfere with COI amplification in these species. PCR reactions were carried out in 20 µL volumes containing 1× GoTaq® Master Mix (Promega, Madison, WI, USA), 250 nM of each primer, 0.5 µg/µL Bovine Serum Albumin (BSA, Sigma-Aldrich Co., Burlington, MA, USA), 1.5 mM additional MgCl2 (Promega, Madison, WI, USA), and 2 µL of DNA template. The PCR reaction conditions consisted of an initial denaturation at 94 °C for 5 min followed by 40 cycles of denaturation at 94 °C for 15 s, annealing at 50 °C for 30 s, and an elongation at 72 °C for 45 s, with a final elongation step at 72 °C for 7 min. The PCR products were electrophoresed on 1.2% agarose gels prepared in 1× TAE buffer, stained with SYBR® safe (Life Technologies™, Carlsbad, CA, USA). Gels were visualised and imaged using a Gel Doc Software system (Bio-Rad, Hercules, CA, USA). Each PCR product was diluted 2–4× with water depending on the band density, and the dilutions were sequenced bi-directionally using the respective amplification primers by EcoGene (Auckland, New Zealand) or Macrogen (Seoul, Republic of Korea). DNA sequences were trimmed and analysed using Geneious Prime 2021.1.1 (https://www.geneious.com). The DNA sequences were submitted to BOLD database under the project name of “Operational Research Project Fruit Flies Pacific Islands” (ORPFF).
To determine intra-specific and inter-specific variation, pairwise distances between the COI sequences were calculated separately using the K80 model of evolution in the dist.dna function of ape package in R. A barcoding gap analysis was performed with K80 genetic distances using the BarcodingR package 1.0-3 [28]. Multiple sequence alignment was performed using MAFFT version 7.505 using the default parameters [29], followed by manual editing to refine alignment quality using Geneious Prime 2021.1.1. All available COI sequences from Bactrocera distincta, B. kirki, B. facialis, and B. passiflorae (as of 13 January 2023) were included. Additionally, reference sequences from the following Bactrocera species were incorporated: B. caledoniensis (MH125330), B. dorsalis (DQ116274), B. melanotus (DQ116298), B. minuta (DQ116301), B. mucronis (MZ093286), B. neohumeralis (DQ116304), B. obscura (CSCAFFPSpecimen_17W560), B. psidii (DQ116312), B. trilineola (DQ116338), B. tryoni (DQ006866), B. umbrosa (DQ006867), and B. xanthodes (08a357). In total, 452 COI sequences comprising 664 base pairs were aligned and used for phylogenetic analyses with Ceratitis capitata as the outgroup. Phylogenetic reconstruction was conducted employing the maximum likelihood (ML) method in IQ-TREE [30], with bootstrap support estimated from 10,000 replicates. To further explore intra-specific variation, a haplotype network was reconstructed using the R package Pegas [31] based on the aligned COI sequences from B. distincta (n = 19), B. kirki (n = 31), B. facialis (n = 102), and B. passiflorae (n = 42). Due to their minimal genetic divergence, B. facialis and B. passiflorae were analysed together. To facilitate the identification of geographic patterns, samples were grouped according to their country of origin.
2.4. Development and Validation of the Real-Time PCR Assays
2.4.1. Design of Bactrocera facialis, B. passiflorae, B. kirki, and B. distincta Primers and Probes
To develop specific real-time PCR assays, a reference database of the COI sequences of Bactrocera fruit fly species was constructed. To accomplish this, a total of 19,870 COI sequences representing 289 Bactrocera species distributed worldwide were retrieved from BOLD and NCBI (up to 13 January 2023). Unidentified sequences were removed prior to the analysis, which resulted in 19,701 COI sequences. Closely related species were selected based on the latest phylogenetic reconstructions of Dacini fruit flies [24,32,33,34]. Only the COI sequences from closely related fruit fly species were aligned using MAFFT. NUMT sequences were manually removed from the alignment in Geneious Prime 2021.1.1. To perform this, genetically divergent sequences (>8%) from other Mt-COI sequences of the same species were translated to amino acids to detect stop codons [2,13]. For designing specific primers and probes for B. distincta, the alignment included all 298 available sequences for B. careyeae, B. distincta, B. furvilineata, B. kraussi, B. manskii, B. moluccensis, B. morobiensis, B. musae, B. obscura, B. unitaeniola, and B. wuzhishana. For B. kirki, the alignment included all 498 available sequences for B. albistigrata, B. caledoniensis, B. frauenfeldi, B. kirki, B. melanotus, B. psidii, B. trilineola, and B. unifasciata. Unfortunately, the COI sequences do not contain enough genetic variation to discriminate B. facialis and B. passiflorae. Therefore, to design specific real-time PCR assays for these two species, entire mitochondrial genome sequences from the Dacini tribe (genus Bactrocera, Dacus, and Zeugodacus) were aligned. Mitogenome alignment included 244 sequences from 70 species from the Dacini tribe, 176 of them were retrieved from GenBank on 19 May 2023, while the remaining 82 sequences were generated in-house as part of this project [35]. For the four target species, regions showing species-specific differences were manually selected from the respective alignments and used to design specific probes and primers. The optimal condition for melting temperatures, GC content, dimer formation, and secondary structure formation were analysed through Oligo Analyzer Tool (IDT) and Geneious Prime 2021.1.1.
2.4.2. In Silico Analysis for Specificity
The specificity of the selected primers and probes was checked in Geneious Prime 2021.1.1 using the test-specific primers function against the sequence alignment. Additionally, the specificity of all designed primers and probes were also evaluated in silico using GoPrime (Supplementary Notes). The in silico analyses of the primers and probes were performed using all available haplotypes of the target species, non-target closely related species, and commonly intercepted Bactrocera species. Eighteen forward primers, seventeen reverse primers, and fifteen TaqMan probes were selected for the four targets (Supplementary Table S1). The dual-labelled probes were synthetised with Black Hole Quencher (BHQ) and, for Bactrocera facialis, with Quasar 670, B. passiflorae probes with CAL Fluor Red 610 (CAL RED 610), B. distincta probes with Quasar 705, and B. kirki probes with FAM fluorophore. This configuration allows the real-time PCR assays to be multiplexed, and TaqMan™ 18S internal control assay (VIC fluorophore, Applied Biosystems™, Foster City, CA, USA) to be included. All primers and BHQ probes were synthesised by LGC Biosearch Technologies (https://www.biosearchtech.com/).
2.4.3. Optimisation of Real-Time PCR Assays
All real-time PCR reactions were set up on a CFX96™ Touch Real-time platform (Bio-Rad, Hercules, CA, USA). For each PCR assay, 2 µL of the DNA extract was added to a 20 µL final volume of reaction mix, containing 10 µL of the 2x master mix, variable volumes of forward and reverse primers and probes depending on tested concentrations (Table 3) and DEPC water. The qPCR reaction mix was prepared in duplicate, and all the assays included positive control for target species and non-template control (NTC).
Table 3.
The detailed information about the real-time PCR assays for the detection of Bactrocera facialis, B. passiflorae, B. kirki, and B. distincta, and the cycling parameters. An 18S internal control has been used successfully to assess PCR competency of DNA samples. S = Singleplex, M = Multiplex; “-“ indicates no amplification.
Newly designed primers and probes for each assay (Supplementary Table S1) were initially tested in different combinations in the real-time PCR assay using both the target species and the closely related species. Specimens selected for preliminary assays include different haplotypes of the target species, as well as the specimens from non-target species with the lowest predicted ΔCq in silico analysis to minimise the risk of cross-reaction (see “initial specificity” test in Supplemental Table S2). The primers/probe combination selected for further optimisation was based on results from the specificity assessment and the absence of primer/probe complementarity between the assays, allowing their use in a multiplex format (Table 3). Each qPCR assay was initially tested using different qPCR master mixes, such as Platinum™ Quantitative PCR SuperMix-UDG (Invitrogen, Carlsbad, CA, USA), PerfeCTa® qPCR ToughMix® (Quanta Bioscience, New South Wales, Australia) and SsoAdvanced™ Universal Probes Supermix (Bio-Rad, Hercules, CA, USA), to determine the best performing master mix. Each qPCR assay was further optimised using an annealing temperature gradient (57.0–64.1 °C), different primer concentrations (200–400 nM), probe concentrations (100–300 nM), and with or without the addition of BSA (0.1 µg/µL). For the assay performance evaluation, the baseline threshold was set to 100.
To achieve conditions suitable for the multiplex assay performance, the real-time PCR assay against the four target species was tested under optimised primer and probe concentrations (Table 3). The concentration of the B. kirki probe was further adjusted to achieve higher fluorescence intensity for some haplotypes that contained mismatches. Additionally, the TaqMan™ 18S ribosomal RNA (rRNA) reagent, which has been widely used to assess PCR competency [10,36,37], was incorporated in the multiplex assays as an internal control.
2.4.4. Sensitivity and Specificity
The sensitivity of the qPCR assay was tested using serial dilutions of the “all-in-one” synthetic positive control (Bac_PFDK_allin_control), a gBlocks™ Gene Fragment from Integrated DNA Technologies, prepared in TE buffer with the concentration ranging from 0.1 copy/µL to 1 × 10⁷ copies/µL. A 488 bp single fragment, incorporating the binding sites of the four assays, was used as a positive control for the real-time detection of B. facialis, B. passiflorae, B. kirki, and B. distincta. Strings of C and G nucleotides were inserted between and after the primers and probes to increase CG content and to adjust the melting temperature (Tm) of the gBlock fragment (Figure 1). To ensure effective polymerase binding, additional nucleotides were incorporated at both 5′ and 3′ termini of the gBlock fragment. Additionally, sensitivity was tested with ten-fold serial dilutions of genomic DNA from the target specimens (concentration ranging from 1 fg/µL to 10 ng/µL). Standard curves, PCR efficiency, and R2 values were automatically generated by the CFX manager software (Bio-Rad). The specificity of the assays was further tested in a singleplex format using DNA samples extracted from 31 specimens, sourced from different hosts and countries, where possible, including common interceptions in New Zealand (Supplementary Table S2).
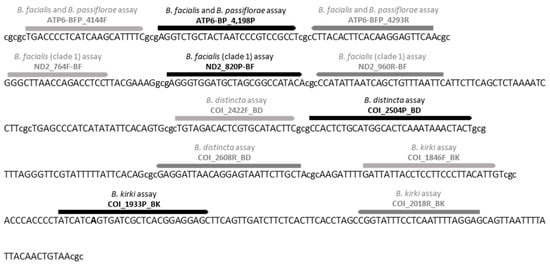
Figure 1.
Primers (grey) and probe (black) concatenated sequence for the Bactrocera facialis, the B. passiflorae, the B. kirki, and the B. distincta qPCR assay found within the ‘all-in-one’ synthetic template (Bac_PFDK_allin_control). Nucleotides in lowercase indicate connecting strings of Cs and Gs. Bold letter indicates a mismatch between the “all-in-one” synthetic control and the probe COI_1933P_BK.
For assays targeting B. facialis and B. passiflorae, the specificity was tested with 9 specimens from B. facialis, 6 from B. passiflorae of different haplotypes, respectively, and specimens form 16 non-target species (Supplementary Table S2). The Bactrocera kirki real-time PCR assay was validated using six target specimens and DNA samples from 22 non-target species. Similarly, five target specimens and samples from 19 non-target species were tested with B. distincta assay. All the samples were tested in triplicate wells, and non-template controls (NTCs) were included in each run to monitor any potential contamination. All tested specimens were included in the calculation of the analytical and diagnostic specificity of the assays.
2.4.5. Blind Panel Test and Robustness of the Real-Time PCR
A total of 21 samples from the specimens and the “all-in-one” synthetic control were provided to the operators for blind panel testing. The samples were tested against the real-time assay in singleplex format. For each run, positive and NTCs were included to validate the assay performance. All the samples were tested in triplicate wells to ensure repeatability of the results.
2.4.6. Repeatability and Reproducibility
Repeatability (intra-run variation) and reproducibility (inter-run variation) for each specific singleplex real-time assay were assessed by calculating the standard deviation of the Cq value and the percentage coefficient of variance (%CV) within and between assay runs. To estimate the repeatability, eight concentrations (0.1 copy/µL to 1 × 10⁷ copies/µL) of “all-in-one” synthetic control were tested in five replicates. Also, the assays were run independently at different times on two different machines under the same conditions to calculate %CV as a measure of reproducibility. Measurement of uncertainty (MU) was calculated based on the standard deviation obtained from repeatability and reproducibility assessments. The MU was determined using the formula:
3. Results
3.1. DNA Barcode of Fruit Flies from the Pacific Islands
A total of 411 mitochondrial COI DNA sequences were obtained from 21 fruit fly species within the genera Bactrocera, Dacus, and Dirioxa, sampled across eight Pacific Island countries. For most species, multiple specimens were analysed to document intra-specific variability, with an average of 20.23 specimens per species. Only B. mucronis was represented by a single specimen, and B. facialis was represented by 105. Maximum likelihood phylogenetic analyses of fruit flies from the Pacific Islands were largely consistent with previous studies and current taxonomic classifications (Figure 2 and Supplementary Figure S1). The species B. facialis, B. passiflorae, B. trilineola, and B. caledoniensis were not monophyletic based on the COI barcodes. Bactrocera facialis and B. passiflorae were grouped in one clade with a bootstrap value of 100%, while B. trilineola and B. caledoniensis formed one clade with 95% support (Figure 2).
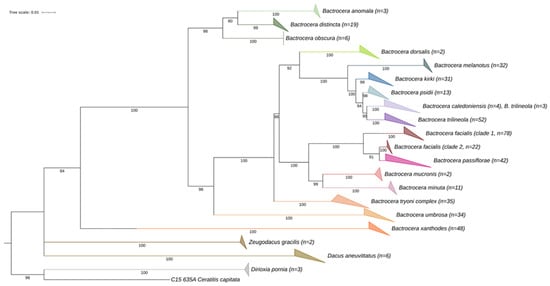
Figure 2.
Maximum likelihood (ML) phylogenetic analysis of Bactrocera fruit fly specimens collected across the Pacific Islands, along with reference sequences, was conducted using IQ-TREE based on the COI alignment. Ceratitis capitata was included as the outgroup. Bootstrap support values ≥80 are shown at each node. To improve visualisation of the tree topology, clades at the species and genus levels have collapsed, with the number of specimens represented in each collapsed clade indicated. The Bactrocera tryoni complex includes B. tryoni, B. neohumeralis and B. curvipennis.
The barcoding gap analysis of 403 COI sequences from 18 Bactrocera species revealed slight overlap between the intra-species and the inter-species genetic distances (Figure 3). The average inter-species K80 genetic distance was 0.113 (0.000–0.215), while the intra-species distance was 0.008 (0.000–0.047).
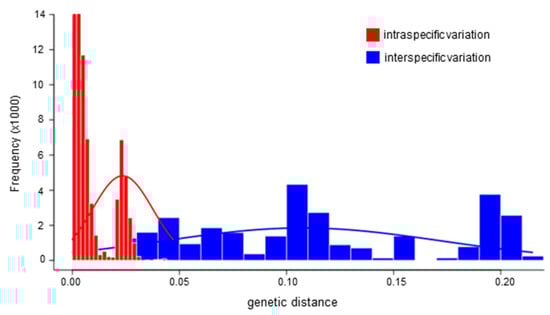
Figure 3.
The distribution of pairwise genetic distance of inter-specific and intra-specific genetic variation of the COI sequences (DNA barcoding gap analysis) of the Bactrocera fruit fly from the Pacific Islands obtained in this study. In red the intra-specific genetic variation and in blue the inter-specific genetic variation.
For B. distincta, the intra-specific genetic distance was 0.004 ± 0.003, with the inter-specific distances from related species (B. unitaelinola, B. obscura, and B. anomala) at 0.064 ± 0.002. The genetic difference of B. distincta from B. dorsalis, B. correcta, B. zonata, and B. tryoni was ~10%. The phylogenetic tree and haplotype network of B. distincta revealed regionally structured genetic variation, with evidence of both shared lineages and localised divergence across the Pacific Island populations (Supplementary Figure S2).
Bactrocera kirki had an intra-specific distance of 0.007 ± 0.005, and the inter-specific distance within the B. frauenfeldi complex was 0.016 ± 0.005 (3–5% sequence difference). Greater genetic divergence was found between B. kirki and B. dorsalis, B. correcta, and B. zonata (6–8%), and B. tryoni (9–10%). The haplotype network of B. kirki reveals pronounced genetic differentiation among regional populations, with longer branch lengths and distinct haplotypes indicating limited gene flow and deep evolutionary divergence (Supplementary Figure S3).
While COI barcoding effectively distinguishes B. distincta and B. kirki, identifying B. facialis and B. passiflorae was more challenging due to limited sequence variation in COI and overlap within the barcoding gap. Bactrocera facialis exhibited higher intra-specific genetic distance (0.011 ± 0.010) than B. passiflorae (0.004 ± 0.003), despite an inter-species genetic distance of 0.023 ± 0.007 (2.45 ± 0.93%). Pairwise genetic analysis (Supplementary Figure S4) and ML phylogenetic trees (Figure 2, Supplementary Figure S1) revealed two B. facialis clades: one genetically divergent (clade 1: identities = 97.21 ± 0.69%, inter-specific distance = 0.025 ± 0.002) and another closely resembling B. passiflorae (clade 2: identities = 98.73 ± 0.68%, inter-specific distance = 0.009 ± 0.007). A haplotype network analysis further supports this pattern, showing that clade 2 of B. facialis shares closely connected and low-divergent haplotypes with B. passiflorae (Supplementary Figure S5). Although no shared haplotypes were identified between B. facialis and B. passiflorae, the COI sequences lack sufficient variations to support the development of probe-based assays for their specific detection. However, the increasing availability of complete mitochondrial genome sequences in the public databases provide access to more informative molecular markers—such as ND2, ND6, CYTB, and ATP6—which offer improved resolution for species delimitation between these two taxa [38,39,40]. Accordingly, the entire mitochondrial genome sequences were used to design species-specific real-time PCR assays.
3.2. Real-Time PCR Assay Design and In Silico Analysis
Real-time PCR assays targeting B. kirki and B. distincta were developed from the 5′ and 3′ fragment of the COI gene, respectively (Table 3). A preliminary specificity assessment of the ten primers and probe sets designed on COI for B. facialis and B. passiflorae were not useful in distinguishing the two species (Supplementary Table S1). However, the mitochondrial genes CYTB, ATP6, and ND2 demonstrated greater potential for specific detection of the B. facialis and B. passiflorae species (Supplementary Table S1). Based on these findings, the gene ATP6 was selected to develop a real-time PCR assay for the detection of both B. facialis and B. passiflorae (Supplementary Figure S7a). In addition, a second qPCR assay was developed from the ND2 gene for the detection of B. facialis clade 1. The rigorously in silico analysis revealed mismatches in the forward primer, reverse primer, and probe binding sites of the ND2 assay for B. facialis clade 2 and B. passiflorae (Supplementary Figure S7b). The GoPrime analysis also predicted real-time PCR cycle threshold (ΔCq) values of 18.58 and 16.68 for B. facialis clade 2 and B. passiflorae, respectively, when tested with the ND2 assay (Supplementary Table S3), indicating late or potentially no amplification.
3.3. Optimisation of the Singleplex Real-Time PCR Assays
Real-time PCR conditions were optimised to enhance sensitivity while maintaining high specificity for the target species. Annealing temperatures ranging from 57.0 to 64.1 °C were evaluated. The sensitivity of the B. facialis (clade 1, gene ND2) and B. distincta assays remained stable across this range. However, B. passiflorae and B. facialis (gene ATP6) and B. kirki assays annealing temperatures above 62 °C resulted in higher Cq values with lower fluorescence intensities (Supplementary Notes). As a result, the annealing temperature of 63 °C was selected for all the assays, which enable amplification of the four target species and reduce the chance of cross-reactions with the tested non-target species. The optimised real-time cycling conditions included an initial denaturation at 95 °C for 2 min, followed by 40 cycles of denaturation at 95 °C for 15 s, and annealing and extension at 63 °C for 60 s (Table 3). All assays performed consistently well using SsoAdvanced™ Universal Probes Supermix in both singleplex and multiplex assays. For the B. kirki assay, addition of BSA at the concentration of 0.1 µg/µL improved the fluorescence intensity (RFU) of the haplotypes with a higher number of mismatches; thus, BSA was incorporated into the B. kirki assay. Minor variations in the Cq values and fluorescence intensity were also observed using different concentrations of primers and probes. Recommended concentrations for each primer and probe are detailed in Table 3.
3.4. Sensitivity
All real-time PCR assays showed a strong linear correlation, with R2 > 0.998 between the Cq value and the template concentrations over a range of seven orders of magnitude (Figure 4). The amplification efficiency was 88.0% for the B. facialis (clade 1), 96.4% for the B. passiflorae and the B. facialis, 98.2% for the B. distincta, and 96.7% for the B. kirki assay, respectively. Each assay reliably detected the template concentration of 10 copies/μL with an average Cq value of 35 cycles. The analytical cut-off value for the assay was established at 36 cycles for all the assays based on the specificity (Table 4) and the sensitivity results (Figure 4) [41]. The limits of detection (LOD) for the four assays were determined to be 20 copies of the target DNA in 20 µL reaction.
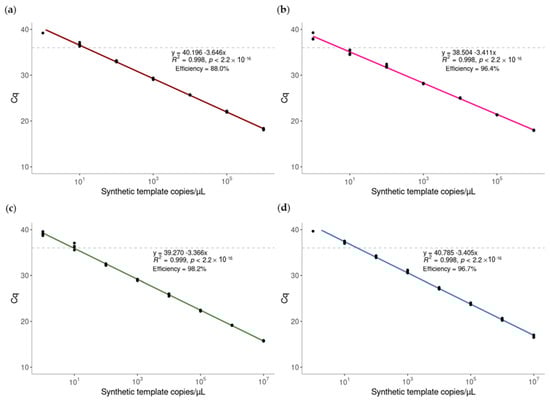
Figure 4.
Sensitivity of the real-time PCR assays for the detection of (a) Bactrocera facialis (clade 1), (b) B. passiflorae and B. facialis, (c) B. distincta, and (d) B. kirki. The gBlock containing the concatenated binding sites of primers and probes were serially diluted and tested with each singleplex real-time PCR assay. Linear regression was performed using the concentrations of gBlock and the Cq values. The standard curve built from Cq values against the log copy number (range = 107 copies–1 copy) of Bac_PFDK_allin_control.
Table 4.
Results from the specificity and blind panel testing (see Supplementary Table S2) for real-time PCR assays for the detection of Bactrocera facialis, B. passiflorae, B. kirki, and B. distincta. Green = positive result with early amplification (Cq > 30), yellow = positive result with late amplification (30 < Cq < 36), and light orange = negative result with no amplification or very late amplification (Cq > 36), white was not tested. N indicates the number of specimens tested in each assay. Quantification cycle threshold (Cq) is presented as mean ± standard deviation. “-“ indicates no amplification.
To assess performance under biologically relevant conditions, the real-time PCR sensitivity was assessed using serial dilutions of genomic DNA extracted from whole adult fruit flies representing the four target species. The assays successfully amplified genomic DNA at concentrations as low as 10 fg/μL, yielding Cq values around 35 cycles (Supplementary Figure S8).
3.5. Specificity and Robustness
The specificity and blind panel testing showed that the B. facialis (clade 1 and 2), the B. passiflorae, the B. kirki, and the B. distincta specimens were successfully identified using the specific singleplex assays, regardless of their life stages (Table 4). Across all tested samples (Table S2), the assay successfully detected all haplotypes included in the specificity and blind panels, which represented 85.4% of known B. facialis haplotype diversity, 54.7% of B. passiflorae, 46.2% of B. kirki, and 86.2% of B. distincta. The assay specificity was 100% at a Cq cut-off value of 36 cycles, although occasional very late non-specific amplifications were observed beyond this threshold in single individuals of specific species (Table 4). Accordingly, specimens with Cq greater than 36 were considered negative for the target species.
All the tested B. passiflorae samples were successfully amplified by the real-time PCR ATP6 assay with Cq values of <30. Similarly, B. facialis (clade 1) yielded Cq values < 30 in both the ATP6 and the ND2 assays, well below the diagnostic threshold. By contrast, B. facialis (clade 2) samples in the ATP6 assay had Cq values ranging from 30 to 36 but showed variable results in the ND2 assay. Of the six B. facialis clade 2 specimens tested, three produced late positive amplification (BFT16 = Cq 33.81; BFT34 = Cq 31.19; BFT94 = Cq 32.07), while the remaining three showed amplification over the Cq cut-off (Cq > 37) or no amplification (Table 4). Therefore, both the ATP6 and the ND2 assays should be applied to differentiate whether the sample is B. facialis clade 1 or 2. If the Cq values are <30 cycles in both assays, the sample is B. facialis clade 1; if the Cq value is around 30–36 in the ATP6 assay and >36 in the ND2 assay, the sample is likely to be B. facialis clade 2 (Table 3). Additionally, one B. kirki specimen (BKS4) showed a Cq of 31.12 and lower fluorescence intensity (<700 RFU) under the optimised conditions, likely due to primer mismatches (Supplementary Figure S9). For all four real-time PCR assays, two independent blind test runs produced consistent and accurate results, matching the original sample identities. These results demonstrated the assays’ robustness and reliability.
3.6. Repeatability and Reproducibility
The assays demonstrated high repeatability and reproducibility, with %CV constantly below 3% across serial dilutions of the Bac_PFDK_allin_control, which contains the primer and probes binding sites for all four PCR assays. The intra-run %CV ranged from 0.17 to 2.47% while the inter-run %CV remained similarly low, ranging from 0.63 to 2.17% (Table 5). The measurement of uncertainty of the assays was range from 0.39 to 0.52 of the Cq values for the assays.
Table 5.
Repeatability, reproducibility, and measurement uncertainty of each real-time PCR assay for the detection of Bactrocera facialis, B. passiflorae, B. kirki, and B. distincta.
3.7. Multiplex Real-Time PCR Assays
The optimised cycling and reaction conditions established for the singleplex assay were applied to the multiplex assay, with the addition of BSA of 0.1 µg/µL to accommodate the requirements of the B. kirki assay. However, under multiplex conditions, B. kirki haplotypes with a higher number of mismatches exhibited reduced fluorescence intensities. Therefore, a higher probe concentration was selected for the multiplex format (Table 3). For the 18S internal control, the primers and probe concentrations followed the manufacturers’ suggestion, i.e., 50 nM of each primer (Rib fwd and Rib rev) and 200 nM of the probe (Rib probe). Under the optimised multiplex PCR assay condition, comparable Cq values were obtained for the assays tested in both singleplex and multiplex formats (Table 6), indicating that the multiplex assay performs with equivalent efficiency. Additionally, the sensitivity and amplification efficiency of the multiplex assay were comparable to those of the corresponding singleplex assays (Supplementary Figure S10). For the B. facialis (clade 1) ND2 assay, the very late amplification of some specimens of B. facialis (clade 2) in the singleplex assay was not observed in the multiplex format. No non-specific amplifications were observed with the other species tested (Supplementary Table S4).
Table 6.
Cq values of each target species DNA tested in the real-time PCR assays run as singleplex and multiplex formats with an 18S internal control. S = Singleplex, M = Multiplex. Green = positive result with early amplification (Cq > 30), yellow = positive result with late amplification (30 > Cq > 36), and light orange = negative result with no amplification or very late amplification (Cq > 36). Quantification cycle threshold (Cq) is presented as a mean, and NA indicates no amplification.
4. Discussion
The accurate and rapid identification of fruit fly pest species is crucial for rapid detection of the economically significant pests and informed biosecurity decision-making to avoid unnecessary fumigation of consignments at the border. Although molecular identification using the COI barcode plays an important role in the identification of fruit flies, the reference database still lacks representation of the polyphagous fruit fly pests from the Pacific Islands. This study provides essential DNA barcode data for fruit fly species from those countries, which has enriched the DNA barcode database and will assist in the identification of Bactrocera species. Furthermore, novel multiplex real-time PCR assays targeting B. facialis, B. passiflorae, B. kirki, and B. distincta were developed according to the MIQE guidelines for qualitative assays [42,43]. The resulting assays targeting four sympatric fruit fly species from Fiji and Polynesia are highly specific, efficient, sensitive, and unlikely to give false positives for unrelated species. The application of the real-time multiplex assay offers an alternative to DNA barcoding by eliminating post-PCR processing, thereby significantly reducing the overall identification time for the fruit fly at all life stages.
The reliability of DNA-based species identification depends heavily on adequately capturing both intra and inter-specific variation within the COI gene [15,44]. However, the majority of DNA barcoding studies have focused on widely distributed pest species, with many species represented by only a few individuals [14,15]. To date, more than 19,800 sequence records of the Bactrocera species have been deposited in BOLD, belonging to 271 species (fewer than 40% of the described species), and collected from 76 countries (as of 13 January 2023). To improve the accuracy and completeness of barcode libraries, we obtained 403 COI sequence records for 18 Bactrocera species from eight Pacific Island countries (Australia, Cook Islands, Fiji, French Polynesia, New Caledonia, Samoa, Tonga, and Vanuatu). The ranges of intra- and inter-specific COI genetic distances found in our study were similar to those found previously in fruit flies, which commonly showed <0.04 intra-specific and >0.02 inter-specific variation [14,18]. Consequently, the COI sequences can be used successfully for the design of the real-time PCR assay for genetically distinct species with small intra-specific variation, like B. distincta (0.004 ± 0.003), and higher inter-specific distance to the closest related species (0.064 ± 0.002). For this species, primers and probes designed in the 3′ fragment of the COI gene were species-specific in in vitro tests (Table 4), despite the lower number of reference sequence of non-target species available for this fragment (Supplementary Table S3).
Species discrimination using the COI gene becomes less reliable within species complexes [1,14,18]. For instance, B. kirki belongs to the B. frauenfeldi complex and exhibits higher intra-specific COI variation (0.007 ± 0.005) and lower inter-specific distance to its closest related species (0.016 ± 0.005) compared with B. distincta. Given the limited sequence data for other gene regions, the 5′ region of the COI sequence of B. kirki was selected for designing the real-time PCR assay, as it enables more reliable in silico specificity testing due to the greater availability of reference sequences (Supplementary Table S3). Although genetically similar, B. frauenfeldi, was not available at the time of the assay testing, only 50% of the sequences available have the predicted ΔCq higher than 13.49 (Supplementary Table S3), with the possibility of late amplification in GoPrime. Sequence alignments also revealed at least three mismatches in the forward primer binding site including at the crucial position at the 3′-end, one mismatch in the probe and another in the reverse primer (Supplementary Figure S6), indicating that amplification is unlikely. Additionally, in terms of geographical distribution, B. kirki is present in Fiji, French Polynesia, Samoa, Tonga, Wallis, and Futuna, whereas B. frauenfeldi has a widespread distribution across Southeast Asia, Australia, and Micronesia. The information may assist in the accurate identification of the species within the B. frauenfeldi complex.
Inter-specific genetic variation in the COI barcode sequences should be significantly greater than intra-specific genetic variation to enable accurate species identification. The sufficient distance between these two levels of variation (intra- and inter-specific) is known as the barcoding gap, which ideally should not overlap [45]. However, a slight overlap in the COI barcoding gap was observed for B. facialis and B. passiflorae. Delimitation of the sibling species B. facialis and B. passiflorae was not possible based on the COI sequences alone. Phylogenetic and pairwise distance analysis of the COI sequences revealed the existence of two genetically distinct clades of B. facialis: (i) one with greater genetic differentiation from B. passiflorae (B. facialis clade 1; inter-specific distance = 0.025 ± 0.002); and (ii) another almost genetically identical to B. passiflorae (B. facialis clade 2; inter-specific distance = 0.009 ± 0.007). These two COI haplotypes of B. facialis are not correlated with the geographical distribution (Supplementary Figure S11). To establish additional genetic markers for developing real-time PCR assays for their accurate identification, the mitochondrial genome and the nuclear genes were also analysed. The nuclear gene regions EIF3L (Eukaryotic translation initiation factor 3 subunit L), ITS1 (Internal Transcribed Spacers 1), and RPA2 (Replication protein A2) are commonly used for discrimination of the Bactrocera species [7,11]. However, the inter-specific genetic distances between B. facialis and B. passiflorae overlapped with the intra-specific genetic distances for all these nuclear genes evaluated (Supplementary Table S5). Like the COI sequences, the entire mitochondrial genomes confirmed the existence of two clades of B. facialis, with the B. facialis clade 2 genetically related to B. passiflorae (inter-specific distance = 0.0102 ± 0.0004). The mitochondrial genes that showed the higher number of inter-species single nucleotide polymorphisms (SNP) were CYTB, ATP6, and ND2, but the drawback is their lower database representation. Thus, expanding mitogenome sequence availability of these species will aid in overcoming the difficulties of discrimination of closely related fruit fly species [38]. In this study, two real-time PCR assays were designed, one for detecting both B. facialis and B. passiflorae (gene ATP6), while a second test primarily detecting B. facialis clade 1 (gene ND2). These two assays can reliably separate B. facialis and B. passiflorae from other fruit fly species, including genetically similar B. minuta (Table 5). Though very late amplification (over the 36 cycles of the Cq cut-off) or no amplification was observed for some B. facialis clade 2 in the singleplex B. facialis ND2 assay, the two clades of B. facialis and B. passiflorae can be separated by running the two assays in a duplex format. Although these sibling species exhibit distinct adult morphology and some geographical separation, they show minimal differences in host usage [46,47]. The limitation of real-time PCR assays to discriminate B. facialis and B. passiflorae can be attributed to unclear species boundaries. While extensive sampling of B. facialis was conducted in this study, B. passiflorae was under-represented, therefore further investigations and broader sampling of B. passiflorae are required.
To achieve high sensitivity and specificity of real-time PCR assays, complementarity between primers, probes, and the target template is essential [48,49]. The primers and probe need to cover the genetic diversity or the occurrence of SNP in the target species, while also incorporating sufficient mismatches to exclude closely related species [42,50,51]. Results of the B. kirki, B. facialis, and B. passiflorae (gene ATP6) assays clearly showed that the presence of mismatches on the target shifts the Cq values upward and reduces the fluorescence intensity (Supplementary Figure S12). Unfortunately, modifying the primers and probe to improve the detection of all haplotypes of B. kirki decreased the assay specificity (Supplementary Table S1). Although mismatches could reduce the sensitivity of the assay [48,49], the limit of detection of our tests were only reduced to 1000 fg/µL in the presence of the mismatches (Supplementary Figure S8c,f). Consequently, this assay will still be capable of detecting immature, degraded, or aged fruit fly specimens, even when mismatches are present. Our findings also confirmed the importance of incorporating at least two SNPs in the probe with additional SNPs in the primers binding sites to maximise the specificity [10] (Supplementary Figures S6 and S7).
By contrast, late amplifications were also observed in some non-target species, these sporadic amplifications could be caused by the nature of the sample collection, where the specimens from different species were occasionally trapped in the same lure [52], and subsequently mixed into a single vial before being sent to us. As a result, those samples contain trace amounts of target DNA, which could have led to late amplification. This also explains why cross-reactions were observed only in certain individuals of specific species; for example, one DNA sample of B. xanthodes produced a Cq value of 39.28, while the other three samples tested showed no amplification (Table 4). Importantly, sequence analysis revealed that any non-specific amplifications occurred in templates with a minimum of six mismatches, further supporting the specificity of the assay (Supplementary Figures S6 and S7). Therefore, our findings demonstrate the high sensitivity of the real-time PCR assays and the importance of proper sampling in molecular diagnostics.
To date, primer and probe selection has relied primarily on screening of nucleotide alignments and conducting BLAST searches [50]. In this study, we tested the feasibility of in silico tools like GoPrime to predict the cross-reactivity of primer/probe combinations across all available COI sequences for fruit flies. GoPrime not only was able to identify most of likely non-target species but helped to predict target variants that could compromise the detection of positive results. GoPrime predictions were consistent with the alignments; however, some cross-reactivity with a few non-target species was not anticipated by the tool. Further research is required to increase the prediction accuracy of tools like GoPrime, as they could significantly contribute to improve the specificity and sensitivity of the species-specific PCR assays. Our results also demonstrate that, although primer/probe design is critical for PCR success, other parameters influencing primer-to-template annealing are equally important in the assay design [42,48]. Optimisation of annealing temperature, probe concentration, and the addition of BSA were used to enhance the diagnostic specificity of our PCR assays.
New Zealand’s unique biodiversity and export-driven horticultural sector are highly vulnerable to the introduction of exotic pest species, particularly fruit fly species. The development and validation of the real-time PCR assays for the rapid and specific detection of B. facialis, B. passiflorae, B. kirki, and B. distincta represent a valuable advancement in biosecurity preparedness. These species, which are not currently present in New Zealand, pose a significant biosecurity threat due to their broad host range across fruits and vegetables, and their potential to cause considerable economic damage [21,22,25]. All four species originate from tropical or subtropical regions in the Pacific Islands and are known to infest both native and commercially important plants, with a wide host range [22]. They have been intercepted at New Zealand borders, underscoring the real risk of accidental introduction via imported goods, passenger luggage, or contaminated equipment. Biosecurity measures are essential to prevent the establishment of these species in New Zealand. The application of the real-time PCR assays developed in this study enhances New Zealand’s biosecurity surveillance capabilities. This tool allows for the rapid identification of suspect specimens at points of entry and in surveillance traps, ensuring timely decision-making. Together with strong border controls, public awareness, and international collaboration, this approach supports New Zealand’s goal of remaining free from the Bactrocera species.
5. Conclusions
The COI barcode sequences generated from this study significantly enrich the reference databases and improve the accuracy of fruit fly species identification. The real-time PCR assays developed in this study are capable of rapidly and accurately identifying the four target fruit fly species, B. facialis, B. passiflorae, B. kirki, and B. distincta. Our assays significantly improve on the current DNA barcoding method and incorporate alternative mitochondrial genes for the diagnosis of fruit fly species. Furthermore, the multiplex PCR assay developed in this study will provide rapid diagnosis for border security agencies and facilitate decision-making regarding international trade, ultimately improving biosecurity response capability.
Supplementary Materials
The following supporting information can be downloaded at: https://www.mdpi.com/article/10.3390/app15168889/s1, Supplementary Notes: GoPrime and PCR optimization; Table S1: Primers and probes developed for detection of Bactrocera facialis, B. passiflorae, B. kirki, and B. distincta. Table S2: Results from the initial specificity, assay optimisation, specificity, and blind panel testing for real-time PCR assays for the detection of Bactrocera facialis, B. passiflorae, B. kirki, and B. distincta. Table S3: Results from the specificity and blind panel testing for real-time PCR assays for the detection of Bactrocera facialis, B. passiflorae, B. kirki, and B. distincta. Table S4: Cq values of each target species DNA tested in the real-time PCR assays run as singleplex and multiplex formats with an 18S internal control. Table S5: Genetic distances of EIF3L, ITS1, and RPA2 sequences between specimens of Bactrocera facialis and B. passiflorae calculated using the model K80. Figure S1: Maximum likelihood (ML) phylogenetic analysis of Bactrocera fruit fly specimens collected across the Pacific Islands. Figure S2: Phylogenetic relationships and haplotype network of Bactrocera distincta based on the mitochondrial COI sequences. Figure S3: Phylogenetic relationships and haplotype network of Bactrocera kirki based on the mitochondrial COI sequences. Figure S4: Pairwise genetic distances of the COI sequences between specimens of Bactrocera facialis and B. passiflorae calculated using the model K80. Figure S5: Phylogenetic relationships and haplotype network of Bactrocera facialis and B. passiflorae based on the mitochondrial COI sequences. Figure S6: Alignment of the amplified regions of the COI sequences of (a) Bactrocera distincta and (b) B. kirki, its closely related species and commonly intercepted Bactrocera. Figure S7: Alignment of the amplified regions of (a) ATP6 sequences of Bactrocera passiflorae and B. facialis and (b) ND2 sequences of Bactrocera facialis clade 1, its closely related species and commonly intercepted Bactrocera. Figure S8: Sensitivity of the real-time PCR assays for the detection of (a) Bactrocera facialis (clade 1), (b,c). B. passiflorae and B. facialis, (d) B. distincta, and (e,f). B. kirki. Figure S9: Effects of mismatches on the cycle quantification (Cq) and fluorescence intensity (RFU). Figure S10: Sensitivity of the real-time PCR assays for the detection of Bactrocera facialis, B. passiflorae, B. kirki, and B. distincta with the addition of the internal control (18S assay) tested as multiplex using synthetic template. Figure S11: Geographical distribution of the Bactrocera facialis clades based on the COI sequences in Tonga. Figure S12: Effects of mismatches on the cycle quantification (Cq) and fluorescence intensity (RFU).
Author Contributions
Conceptualization, D.L., S.G., D.N.G., and B.M.; methodology, N.L.C. and J.Y.; software, N.L.C.; validation, N.L.C. and D.L.; formal analysis, N.L.C.; resources, D.N.G. and B.M.; data curation, N.L.C.; writing—Original Draft Preparation, N.L.C.; writing—Review and Editing, N.L.C., D.L., S.G., D.N.G., J.Y., and B.M.; visualization, N.L.C.; supervision, D.L.; funding acquisition, D.L. All authors have read and agreed to the published version of the manuscript.
Funding
This research was funded by New Zealand Ministry for Primary Industries (MPI), grant number 406793.
Institutional Review Board Statement
Not applicable.
Informed Consent Statement
Not applicable.
Data Availability Statement
The DNA sequences were submitted to BOLD database under the project name of “Operational Research Project Fruit Flies Pacific Islands” (ORPFF). The original contributions presented in the study are included in the article/Supplementary Material, further inquiries can be directed to the corresponding author.
Acknowledgments
We would like to thank Piriaki Maaoo from the Ministry of Agriculture—Cook Islands, Siutoni Tupou from Ministry of Agriculture, Food and Forests—Tonga, Jainesh Ram from Biosecurity Authority Fiji, Faalelei Tunupopo from the Ministry of Agriculture and Fisheries—Samoa, Laura Hartamann from the Biosécurité de la Polynésie française, and Jeffline Tasale from Vanuatu Biosecurity for providing the Bactrocera specimens for testing the PCR assays. This work was funded by the New Zealand Ministry for Primary Industries Operational Research Programme (406793). We also acknowledge the use of New Zealand eScience Infrastructure (NeSI) high-performance computing facilities. Our thanks also go to Jeyaseelan Baskarathevan (Seelan) from MPI for his critical review of this manuscript.
Conflicts of Interest
The authors declare no conflicts of interest.
Abbreviations
The following abbreviations are used in this manuscript:
| ATP6 | ATP synthase membrane subunit 6 |
| COI | Cytochrome c oxidase I |
| CO2 | Cytochrome c oxidase 2 |
| Cq | Cycle quantification |
| ΔCq | Cq of target of interest-Cq of reference target |
| CTYB | Cytochrome b |
| EIF3L | Eukaryotic translation initiation factor 3 subunit L |
| HTS | High-Throughput Sequencing |
| ITS1 | Internal Transcribed Spacers 1 |
| LAMP | Loop-mediated isothermal amplification |
| ML | Maximum likelihood |
| NeSI | New Zealand eScience Infrastructure |
| ND2 | NADH dehydrogenase subunit 2 |
| RPA2 | Replication protein A2 |
| SNP | Single Nucleotide Polymorphism |
References
- Dhami, M.K.; Gunawardana, D.N.; Voice, D.; Kumarasinghe, L. A Real-Time PCR Toolbox for Accurate Identification of Invasive Fruit Fly Species. J. Appl. Entomol. 2016, 140, 536–552. [Google Scholar] [CrossRef]
- Li, D.; McCarthy, B.; Gunawardana, D.N.; Waite, D.W.; Anderson, D.; George, S. Molecular Identification of Bactrocera passiflorae (Diptera: Tephritidae): Challenge and Solution for DNA Barcoding. J. Appl. Entomol. 2020, 144, 877–884. [Google Scholar] [CrossRef]
- Stephenson, B.P.; Gill, G.S.C.; Randall, J.L.; Wilson, J.A. Biosecurity Approaches to Surveillance and Response for New Plant Pest Species. N. Z. Plant Prot. 2003, 56, 5–9. [Google Scholar] [CrossRef]
- Armstrong, K.F.; Ball, S.L. DNA Barcodes for Biosecurity: Invasive Species Identification. Philos. Trans. R. Soc. Lond. B Biol. Sci. 2005, 360, 1813–1823. [Google Scholar] [CrossRef] [PubMed]
- White, I.M.; Elson-Harris, M.M. Fruit Flies of Economic Significance: Their Identification and Bionomics; CAB International: Wallingford, UK, 1992; ISBN 978-0-85198-790-3. [Google Scholar]
- Fleming, C.C.; Rao, J.; Moreland, B.; Craig, D.; Turner, S.J. Diagnostics of Cyst Nematodes and Tephritid Fruit Flies Using Mitochondrial and Ribosomal DNA*. EPPO Bull. 2000, 30, 585–590. [Google Scholar] [CrossRef]
- Krosch, M.N.; Schutze, M.K.; Strutt, F.; Clarke, A.R.; Cameron, S.L. A Transcriptome-based Analytical Workflow for Identifying Loci for Species Diagnosis: A Case Study with Bactrocera Fruit Flies (Diptera: Tephritidae). Austral Entomol. 2017, 58, 395–408. [Google Scholar] [CrossRef]
- Jiang, F.; Fu, W.; Clarke, A.R.; Schutze, M.K.; Susanto, A.; Zhu, S.; Li, Z. A High-Throughput Detection Method for Invasive Fruit Fly (Diptera: Tephritidae) Species Based on Microfluidic Dynamic Array. Mol. Ecol. Resour. 2016, 16, 1378–1388. [Google Scholar] [CrossRef]
- Koohkanzade, M.; Zakiaghl, M.; Dhami, M.K.; Fekrat, L.; Namaghi, H.S. Rapid Identification of Bactrocera zonata (Dip.: Tephritidae) Using TaqMan Real-Time PCR Assay. PLoS ONE 2018, 13, e0205136. [Google Scholar] [CrossRef]
- Li, D.; Waite, D.W.; Gunawardana, D.N.; McCarthy, B.; Anderson, D.; Flynn, A.; George, S. DNA Barcoding and Real-Time PCR Detection of Bactrocera xanthodes (Tephritidae: Diptera) Complex. Bull. Entomol. Res. 2019, 109, 102–110. [Google Scholar] [CrossRef]
- Plant Health Australia. The Australian Handbook for the Identification of Fruit Flies; Version 3.1.; Plant Health Australia: Canberra, Australia, 2018; ISBN 978-0-648-24566-7. [Google Scholar]
- Starkie, M.L.; Fowler, E.V.; Zhu, X.; Agarwal, A.; Rako, L.; Schneider, I.C.; Schutze, M.K.; Royer, J.E.; Gopurenko, D.; Gillespie, P.; et al. Loop-Mediated Isothermal Amplification (LAMP) Assays for Detection of the New Guinea Fruit Fly Bactrocera trivialis (Drew) (Diptera: Tephritidae). Sci. Rep. 2022, 12, 12602. [Google Scholar] [CrossRef]
- Blacket, M.J.; Semeraro, L.; Malipatil, M.B. Barcoding Queensland Fruit Flies (Bactrocera tryoni): Impediments and Improvements. Mol. Ecol. Resour. 2012, 12, 428–436. [Google Scholar] [CrossRef]
- Doorenweerd, C.; Jose, M.S.; Leblanc, L.; Barr, N.; Geib, S.; Chung, A.Y.C.; Dupuis, J.; Ekayanti, A.; Fiegalan, E.R.; Hemachandra, K.S.; et al. DNA Barcodes and Reliable Molecular Identifications in a Diverse Group of Invasive Pests: Lessons from Bactrocera Fruit Flies on Variation across the COI Gene, Introgression, and Standardization. bioRxiv 2020. [Google Scholar] [CrossRef]
- Krosch, M.N.; Strutt, F.; Blacket, M.J.; Batovska, J.; Starkie, M.; Clarke, A.R.; Cameron, S.L.; Schutze, M.K. Development of Internal COI Primers to Improve and Extend Barcoding of Fruit Flies (Diptera: Tephritidae: Dacini). Insect Sci. 2018, 27, 143–158. [Google Scholar] [CrossRef]
- Drew, R.A.I.; Hancock, D.L. Biogeography, Speciation and Taxonomy within the Genus Bactrocera Macquart with Application to the Bactrocera dorsalis (Hendel) Complex of Fruit Flies (Diptera: Tephritidae: Dacinae). Zootaxa 2022, 5190, 333–360. [Google Scholar] [CrossRef] [PubMed]
- Jiang, F.; Liang, L.; Li, Z.; Yu, Y.; Wang, J.; Wu, Y.; Zhu, S. A Conserved Motif within Cox 2 Allows Broad Detection of Economically Important Fruit Flies (Diptera: Tephritidae). Sci. Rep. 2018, 8, 2077. [Google Scholar] [CrossRef] [PubMed]
- Jiang, F.; Jin, Q.; Liang, L.; Zhang, A.B.; Li, Z.H. Existence of Species Complex Largely Reduced Barcoding Success for Invasive Species of Tephritidae: A Case Study in Bactrocera spp. Mol. Ecol. Resour. 2014, 14, 1114–1128. [Google Scholar] [CrossRef] [PubMed]
- Smit, J.; Reijnen, B.; Stokvis, F. Half of the European Fruit Fly Species Barcoded (Diptera, Tephritidae); a Feasibility Test for Molecular Identification. Zookeys 2013, 365, 279–305. [Google Scholar] [CrossRef]
- Li, D.; Nair, S.; Anderson, D.; Doddala, P.; Gunawardana, D.N.; George, S. Real-Time PCR Assays for Rapid Detection of Zeugodacus cucumis and Bactrocera jarvisi (Diptera: Tephritidae) for Quarantine Application. J. Appl. Entomol. 2019, 143, 155–163. [Google Scholar] [CrossRef]
- Allwood, A.J.; Drew, R.A.I. Management of Fruit Flies in the Pacific. In Proceedings of the Regional Symposium, Nadi, Fiji, 28–31 October 1996; Australian Centre for International Agricultural Research: Canberra, Australia, 1997. [Google Scholar]
- Leblanc, L.; Vueti, E.T.; Allwood, A.J. Host Plant Records for Fruit Flies (Diptera: Tephritidae: Dacini) in the Pacific Islands: 2. Infestation Statistics on Economic Hosts. Proc. Hawaii. Entomol. Soc. 2013, 45, 83–117. [Google Scholar]
- MacLellan, R.; Murphy, B.; King, K.; McCarthy, B.; Chen, Y. National Fruit Fly Surveillance Programme Annual Report. Surveill. Annu. Report. 2022, 49, 133–136. [Google Scholar]
- Doorenweerd, C.; San Jose, M.; Geib, S.; Dupuis, J.; Leblanc, L.; Barr, N.; Fiegalan, E.; Morris, K.Y.; Rubinoff, D. A Phylogenomic Approach to Species Delimitation in the Mango Fruit Fly (Bactrocera frauenfeldi) Complex: A New Synonym of an Important Pest Species with Variable Morphotypes (Diptera: Tephritidae). Syst. Entomol. 2022, 48, 10–22. [Google Scholar] [CrossRef]
- Drew, R.A.I.; Drew, R.A.I. The Tropical Fruit Flies (Diptera: Tephritidae: Dacinae) of the Australasian Region and Oceanic Regions. Mem. Qld. Mus. 1989, 26, 1–521. [Google Scholar]
- Dhami, M.K.; Kumarasinghe, L. A HRM Real-Time PCR Assay for Rapid and Specific Identification of the Emerging Pest Spotted-Wing Drosophila (Drosophila Suzukii). PLoS ONE 2014, 9, e98934. [Google Scholar] [CrossRef]
- Folmer, O.; Black, M.; Hoeh, W.; Lutz, R.; Vrijenhoek, R. DNA Primers for Amplification of Mitochondrial Cytochrome c Oxidase Subunit I from Diverse Metazoan Invertebrates. Mol. Mar. Biol. Biotechnol. 1994, 3, 294–299. [Google Scholar]
- Zhang, A.-B.; Hao, M.; Yang, C.; Shi, Z. BarcodingR: An Integrated R Package for Species Identification Using DNA Barcodes. Methods Ecol. Evol. 2016, 8, 627–634. [Google Scholar] [CrossRef]
- Katoh, K.; Standley, D.M. MAFFT Multiple Sequence Alignment Software Version 7: Improvements in Performance and Usability. Mol. Biol. Evol. 2013, 30, 772–780. [Google Scholar] [CrossRef]
- Minh, B.Q.; Schmidt, H.A.; Chernomor, O.; Schrempf, D.; Woodhams, M.D.; von Haeseler, A.; Lanfear, R. IQ-TREE 2: New Models and Efficient Methods for Phylogenetic Inference in the Genomic Era. Mol. Biol. Evol. 2020, 37, 1530–1534. [Google Scholar] [CrossRef]
- Paradis, E. Pegas: An R Package for Population Genetics with an Integrated–Modular Approach. Bioinformatics 2010, 26, 419–420. [Google Scholar] [CrossRef]
- Starkie, M.L.; Cameron, S.L.; Krosch, M.N.; Phillips, M.J.; Royer, J.E.; Schutze, M.K.; Strutt, F.; Sweet, A.D.; Zalucki, M.P.; Clarke, A.R. A Comprehensive Phylogeny Helps Clarify the Evolutionary History of Host Breadth and Lure Response in the Australian Dacini Fruit Flies (Diptera: Tephritidae). Mol. Phylogenetics Evol. 2022, 172, 107481. [Google Scholar] [CrossRef]
- Valerio, F.; Zadra, N.; Rota-Stabelli, O.; Ometto, L. The Impact of Fast Radiation on the Phylogeny of Bactrocera Fruit Flies as Revealed by Multiple Evolutionary Models and Mutation Rate-Calibrated Clock. Insects 2022, 13, 603. [Google Scholar] [CrossRef] [PubMed]
- Zhang, Y.; Li, H.; Feng, S.; Qin, Y.; De Meyer, M.; Virgilio, M.; Singh, S.; Jiang, F.; Kawi, A.P.; Susanto, A.; et al. Mitochondrial Phylogenomics Reveals the Evolutionary and Biogeographical History of Fruit Flies (Diptera: Tephritidae). Entomol. Gen. 2022, 43, 359–368. [Google Scholar] [CrossRef]
- Castellanos, N.L.; Gunawardana, D.N.; McCarthy, B.; Sathish, P.; George, S.; Li, D. Mitochondrial Genome of Bactrocera Fruit Flies (Tephritidae: Dacini): Features, Structure, and Significance for Diagnosis. BMC Genom. 2025, 26, 700. [Google Scholar] [CrossRef] [PubMed]
- Li, D.; Sooda, A.; Gunawardana, D.N.; Thomas, A.; Chen, Y.; Kumarasinghe, L. DNA Barcodes for Thrips Species and Development of Multiplex Real-Time PCR Assay for Frankliniella Occidentalis Pergande, Frankliniella Panamensis Hood, Thrips Palmi Karny and Thrips Tabaci Lindeman (Thysanoptera: Thripidae). N. Z. Entomol. 2023, 46, 16–34. [Google Scholar] [CrossRef]
- Li, D.; Fan, Q.-H.; Waite, D.W.; Gunawardana, D.; George, S.; Kumarasinghe, L. Development and Validation of a Real-Time PCR Assay for Rapid Detection of Two-Spotted Spider Mite, Tetranychus urticae (Acari: Tetranychidae). PLoS ONE 2015, 10, e0131887. [Google Scholar] [CrossRef]
- Andrews, K.J.; Bester, R.; Manrakhan, A.; Maree, H.J. Utilisation of a Mitochondrial Intergenic Region for Species Differentiation of Fruit Flies (Diptera: Tephritidae) in South Africa. BMC Genom. 2022, 23, 793. [Google Scholar] [CrossRef] [PubMed]
- Andrews, K.J.; Bester, R.; Manrakhan, A.; Maree, H.J. A Multiplex PCR Assay for the Identification of Fruit Flies (Diptera: Tephritidae) of Economic Importance in South Africa. Sci. Rep. 2022, 12, 13089. [Google Scholar] [CrossRef] [PubMed]
- Kneubehl, A.R.; Muñoz-Leal, S.; Filatov, S.; de Klerk, D.G.; Pienaar, R.; Lohmeyer, K.H.; Bermúdez, S.E.; Suriyamongkol, T.; Mali, I.; Kanduma, E.; et al. Amplification and Sequencing of Entire Tick Mitochondrial Genomes for a Phylogenomic Analysis. Sci. Rep. 2022, 12, 19310. [Google Scholar] [CrossRef]
- Caraguel, C.G.B.; Stryhn, H.; Gagné, N.; Dohoo, I.R.; Hammell, K.L. Selection of a Cut-off Value for Real-Time Polymerase Chain Reaction Results to Fit a Diagnostic Purpose: Analytical and Epidemiologic Approaches. J. VET Diagn. Investig. 2011, 23, 2–15. [Google Scholar] [CrossRef]
- Bustin, S.; Huggett, J. QPCR Primer Design Revisited. Biomol. Detect. Quantif. 2017, 14, 19–28. [Google Scholar] [CrossRef]
- Bustin, S.A.; Benes, V.; Garson, J.A.; Hellemans, J.; Huggett, J.; Kubista, M.; Mueller, R.; Nolan, T.; Pfaffl, M.W.; Shipley, G.L.; et al. The MIQE Guidelines: Minimum Information for Publication of Quantitative Real-Time PCR Experiments. Clin. Chem. 2009, 55, 611–622. [Google Scholar] [CrossRef]
- Doorenweerd, C.; San Jose, M.; Barr, N.; Leblanc, L.; Rubinoff, D. Highly Variable COI Haplotype Diversity between Three Species of Invasive Pest Fruit Fly Reflects Remarkably Incongruent Demographic Histories. Sci. Rep. 2020, 10, 6887. [Google Scholar] [CrossRef]
- Meyer, C.P.; Paulay, G. DNA Barcoding: Error Rates Based on Comprehensive Sampling. PLoS Biol. 2005, 3, e422. [Google Scholar] [CrossRef]
- CABI. CABI Compendium. Available online: https://www.cabidigitallibrary.org/journal/cabicompendium (accessed on 10 February 2023).
- Leblanc, L. The Dacine Fruit Flies (Diptera: Tephritidae: Dacini) of Oceania. Insecta Mundi 2022, 948, 1–167. [Google Scholar]
- Boyle, B.; Dallaire, N.; MacKay, J. Evaluation of the Impact of Single Nucleotide Polymorphisms and Primer Mismatches on Quantitative PCR. BMC Biotechnol. 2009, 9, 75. [Google Scholar] [CrossRef]
- Süß, B.; Flekna, G.; Wagner, M.; Hein, I. Studying the Effect of Single Mismatches in Primer and Probe Binding Regions on Amplification Curves and Quantification in Real-Time PCR. J. Microbiol. Methods 2009, 76, 316–319. [Google Scholar] [CrossRef] [PubMed]
- Howson, E.L.A.; Orton, R.J.; Mioulet, V.; Lembo, T.; King, D.P.; Fowler, V.L. GoPrime: Development of an In Silico Framework to Predict the Performance of Real-Time PCR Primers and Probes Using Foot-and-Mouth Disease Virus as a Model. Pathogens 2020, 9, 303. [Google Scholar] [CrossRef] [PubMed]
- Li, D.; Waite, D.W.; Fan, Q.-H.; George, S.; Semeraro, L.; Blacket, M.J. Molecular Detection of Small Hive Beetle Aethina tumida Murray (Coleoptera: Nitidulidae): DNA Barcoding and Development of a Real-Time PCR Assay. Sci. Rep. 2018, 8, 9623. [Google Scholar] [CrossRef] [PubMed]
- Fowler, E.V.; Starkie, M.L.; Blacket, M.J.; Mayer, D.G.; Schutze, M.K. Effect of Temperature and Humidity on Insect DNA Integrity Evaluated by Real-Time PCR. J. Econ. Entomol. 2024, 117, 1995–2002. [Google Scholar] [CrossRef]
Disclaimer/Publisher’s Note: The statements, opinions and data contained in all publications are solely those of the individual author(s) and contributor(s) and not of MDPI and/or the editor(s). MDPI and/or the editor(s) disclaim responsibility for any injury to people or property resulting from any ideas, methods, instructions or products referred to in the content. |
© 2025 by the authors. Licensee MDPI, Basel, Switzerland. This article is an open access article distributed under the terms and conditions of the Creative Commons Attribution (CC BY) license (https://creativecommons.org/licenses/by/4.0/).