Article

Optical Sensing Technologies for Cryo-Tank Composite Structural Element Analysis and Maintenance

by
Monica Ciminello
1,*,
Carmine Carandente Tartaglia
2 and
Pietro Caramuta
3
1
Adaptive Structures-SHM Lab., Italian Aerospace Research Center (CIRA), 81043 Capua, Italy
2
Space Qualification Centre, Italian Aerospace Research Center (CIRA), 81043 Capua, Italy
3
Mechanical Test Lab., Italian Aerospace Research Center (CIRA), 81043 Capua, Italy
*
Author to whom correspondence should be addressed.
Appl. Sci. 2025, 15(15), 8748; https://doi.org/10.3390/app15158748
Submission received: 2 July 2025 / Revised: 28 July 2025 / Accepted: 1 August 2025 / Published: 7 August 2025
(This article belongs to the Special Issue Recent Advances in Optical Sensors)

Abstract

This article focuses on activities addressed in the European project hydrogen lightweight & innovative tank for zero-emission aircraft, H2ELIOS. The authors propose a preliminary approach oriented to the design of a structural health monitoring SHM system conceived for a cryo-tank liquid hydrogen storage for medium range vehicles. The system was ideated to be installed on board and operating during service, to provide early detection and localization of potential damage, critical both in terms of safety and maintenance. The use of optical fibers for strain measurement is justified, on one hand, by the capability of pure silica fiber to prevent hydrogen darkening effects and, on the other hand, by the absence of metal components, which eliminates the risk of embrittlement. In detail, distributed and fiber Bragg grating FBG sensors designed for this specific application have demonstrated reliable monitoring capabilities, even after exposure to hydrogen and at cryogenic temperatures. Furthermore, another key contribution of this preliminary activity is the analysis of thermoplastic material faults by correlating damage characteristics with static and dynamic response. This is due to the fact that the investigated physics strongly depend on the nature of occurring damage. Achievements lie in the demonstrated ability to assess the health status of the reference composite structure, establishing the first steps for a future qualification of the proprietary system, made of commercial and original hardware and software.

1. Introduction

The H2ELIOS project [1] is an ambitious initiative to develop an innovative hydrogen storage solution for the aviation sector [2]. The main idea is to reduce emissions and minimize the environmental impact of the aircraft by developing a lightweight [3] and cost-effective solution for storing liquid hydrogen, utilizing sustainable polymer-based materials for the tank structure [3].
In the development of composite cryo-tank technology, the Boeing Company has been building cryo-tanks focused on composite material since 2010. Key design features included one-piece wall construction to minimize overall weight (eliminating the need for a bellyband joint), 3-dimensionally (3D) reinforced y-joint material to alleviate stress concentrations at the tank-to-skirt interface, and a purgeable fluted core skirt to carry high axial launch loads [4].
Gloyer-Taylor Laboratories Inc. (Tullahoma, TN, USA) [5], an aerospace engineering research and development company, has announced breakthrough results in its ultra-lightweight cryogenic tanks made from graphite fiber composites and other materials. According to GLT, its cryogenic tanks have demonstrated a huge 75 percent mass reduction when compared to “state-of-the-art aerospace cryo-tanks (metal or composite).”
The AIMEN Technology Centre has achieved a milestone in the field of industrial innovation with the 3D manufacture of an innovative cryogenic tank demonstrator, designed for future applications in the storage of liquid hydrogen (LH2) in aircraft [6].
LH2 is a key fuel used for space launchers but is also being developed by Airbus and other aircraft OEMs for zero-emission aviation. When transferring LH2 from a delivery or storage tank to vehicle tanks, NASA [7] and other entities have reported high losses due to boil-off of the cryogenic liquid to vapor and other issues that still need to be addressed.
The EU, indeed, recognizes hydrogen as a clean fuel with the potential to reduce emissions in the aviation sector, but current technologies limit the use of hydrogen-powered aircraft due to challenges in terms of storage safety, weight, and cost-efficiency.
Airworthiness regulation [8] must be formulated to support the adoption of hydrogen. Although its gravimetric energy density is 2.5 times [9] greater than that of kerosene, its volumetric energy density is 4 times lower, leading to larger tanks and posing significant limitations for cost-effectiveness on medium to long-range flights.
The new generation of cryo-tank storage systems must comply with specific analysis [10]. Integral tanks, which are part of the aircraft’s main structure, seem promising, but existing designs show limitations in the integration with the airframe and insulation capabilities. To address these issues, the study in [11] proposes the analysis of an integral tank concept featuring a double wall architecture with vacuum insulation and outward-facing structural reinforcements connecting to the fuselage skin. Preliminary results point to fuel containment efficiencies consistent with previous designs, with buckling stability identified as the critical design criterion.
For the new generation of cryogenic composite vessels, additional standards and optimized on-board inspection techniques need to be implemented more than ever.
Due to their complex geometry, sometimes characterized by encapsulated shell assemblies and peculiar material properties, internal, and therefore hidden, defects such as flaws, delamination or joint debonding may occur.
As a result, conventional inspections and maintenance procedures can be very expensive and difficult. For many reasons, among the other extreme pressure and temperature levels, the tank system must be verified both prior to flight and throughout its service life.
Currently, tomography is one of the most used techniques for this kind of analysis. It guarantees a complete and detailed survey but is expensive and time consuming [12]. There is therefore an industrial demand for the implementation of different, integrated and flight-ready systems.
From a safety and maintenance perspective, an integrated monitoring system working during operational life appears to be a useful tool [13]. In this sense, the standard regulations require sensors able to work in harsh conditions [14]: ATEX-certified sensors, preventing embrittlement, exhibiting EM immunity, limiting their impact on weight, reducing the thermal bridge and hydrogen darkening effects.
Currently, many areas foresee a significant growth of fiber optic sensor applications, from medical to civil, aerospace, and industrial applications [15]. This kind of monitoring architecture is highly desirable for non-destructive assessment for many reasons. Among others, one recalls the capability to resist under chemically aggressive environments, the high integrability, and the characteristic of hosting many sensitive elements on a single fiber. Bragg grating arrays (FBGs) and long-period gratings (LPGs) have been developed during the last decades and allow very accurate sensing. For the most demanding applications, a quasi-continuous sensing technology is available based on Rayleigh backscattering, enabling the monitoring of tens of meters with millimeter-resolution. This kind of system is generally used for monitoring large civil infrastructures such as bridges, railways, and so on [16].
In this paper, different optical monitoring technologies are analyzed, with the perspective of developing a robust and integrated approach for SHM applications on composite cryo-tanks, particularly during acceptance static pressure tests.
Specifically regarding pressurized tank items, some studies in the literature report the implementation of monitoring systems by using fiber optic sensors. Strain sensors are used to monitor distributed strain in composite overwrapped pressure vessels (COPVs) throughout the manufacturing process until qualification testing [17]. Sensible elements are embedded along circumferential patterns, at various locations along the structural thickness. Filament-wound cylinders are investigated with multiple layers of carbon fiber, integrated with glass fiber composite on the outer surface for extra durability. Each cylinder is filled with water and pressurized to complete the process.
In [18,19], cryogenic y-joint tests validated the performance of distributed optical strain sensing at liquid helium temperatures (around 130 °K). SHM experiments are conducted to explore the durability and survivability of the fiber optic sensor system and related surface bonding techniques through multiple liquid helium temperature excursions and mechanical load cycles. The results on a reduced-scale tank showed that internally bonded strain gauges often failed, while the use of fiber optics sensors seemed a viable method to mitigate the evidenced problems, especially in harsh or extreme environmental conditions.
In [20], the issue is again faced. Indeed, strict process control is required during bonding operations. The latest non-destructive joint inspection techniques cannot quantify the strength of the bond and only indicate the presence of disbonds or delaminations. Expensive and time-consuming proof-load testing of the joints is required to demonstrate structural performance. This work focuses on experimentally evaluating joint-health monitoring with piezoelectric sensors exposed to repeated loadings until failure.
In order to verify the functionality of fiber optic sensors at cryogenic conditions, several studies have been conducted. In [21], the authors described the experimental characterization of thermal responses of four commercially available optical fiber samples with different polymeric coatings in the temperature range from 5 K to 300 K: two with acrylate coatings of different thickness, one with a polyimide coating and one with a polyether–ether–ketone (PEEK) coating.
In the present paper, strain acquisition is performed on a representative cylindrical coupon of the target structural system, during bending solicitation up to flaw initiation. The experimental data are processed by specific algorithms, already developed by the authors [22,23,24], considering either quasi-static or dynamic patterns. The aim is to correlate the achieved readouts by means of static and transient features, providing an integral view of the phenomenon driven by the structural defect, and, in the end, to provide a methodology selection with respect to the established target, addressing industrial requirements and issues.

2. Industrial Requirements

The most immediate application of health monitoring would be during flight, and the information provided could also be vital in post-flight analyses to detect anomalies and provide corrections to the design in order to improve reliability, which is the most important parameter, along with cost.
After manufacturing, cryo-tank components are usually required to undergo acceptance pressure tests to simulate the flight environment with appropriate margins and reduce the probability of a structural failure in flight. Such tests usually start with a quasi-static pressurization, and then, if success is involved, large facilities are needed to implement the final functionality test, simulating fully operative conditions.
Thus, monitoring during a test would allow the test engineers to decide to stop the test when an item is revealed to be critical. In the end, no propagation or initiation of defects is allowed during such tests by the relevant standards. To monitor its status, the case is subjected to non-destructive inspections NDIs before and after the test. Such controls are very time-consuming and costly. For this reason, finding signs of defect evolution using the instrumentation involved in the test would have a strong impact on the optimization of the overall production and verification processes. In particular, the LH2 storage concept demonstrator being developed at H2ELIOS [1] (Figure 1) consists of the following components:
  • A composite tank, consisting of domes and a middle skirt;
  • A metal joint system;
  • An encapsulating-type geometry.
Figure 1. LH2 storage concept demonstrator being developed at H2ELIOS (patented by ACITURRI) [1].
Applsci 15 08748 g001
The test article taken into consideration for the preliminary SHM implementation and functionality verification is representative of the tank’s cylinder material. Typical skirt-cylinder joints are indeed considered as a critical region for flaws onset, and the highest strain variations, during pressurization, are actually expected to solicit the middle section of the cylinder.
The performance requirements for the measurement system specialized for this application are as follows:
  • Easy and fast application for compliance with industrial applications;
  • Robustness during process operations and testing;
  • Negligible losses due to hydrogen darkening;
  • Atex cables designed for use in hazardous environments where explosive atmospheres may be present;
  • Distributed measures to detect local variations in strain;
  • A sample rate that can capture variations in the strain trend;
  • Handling of a large amount of data, reducing cable routing complexity;
  • The possibility of embedding the sensor inside the composite material before curing.
The latter requirement is a desirable one: this capability would indeed allow for the monitoring of the tank throughout the production cycle, delivery, and flight. In particular, it would come in handy to intercept anomalies when they occur or to obtain a large amount of direct data from the structure if local failures occur. For this feature to be available, the sensing elements shall not jeopardize the structural performance. Moreover, they shall withstand the very low temperature reached during gaseous H2 filling, and compensation for thermal effects is possible.

3. Test Article Description

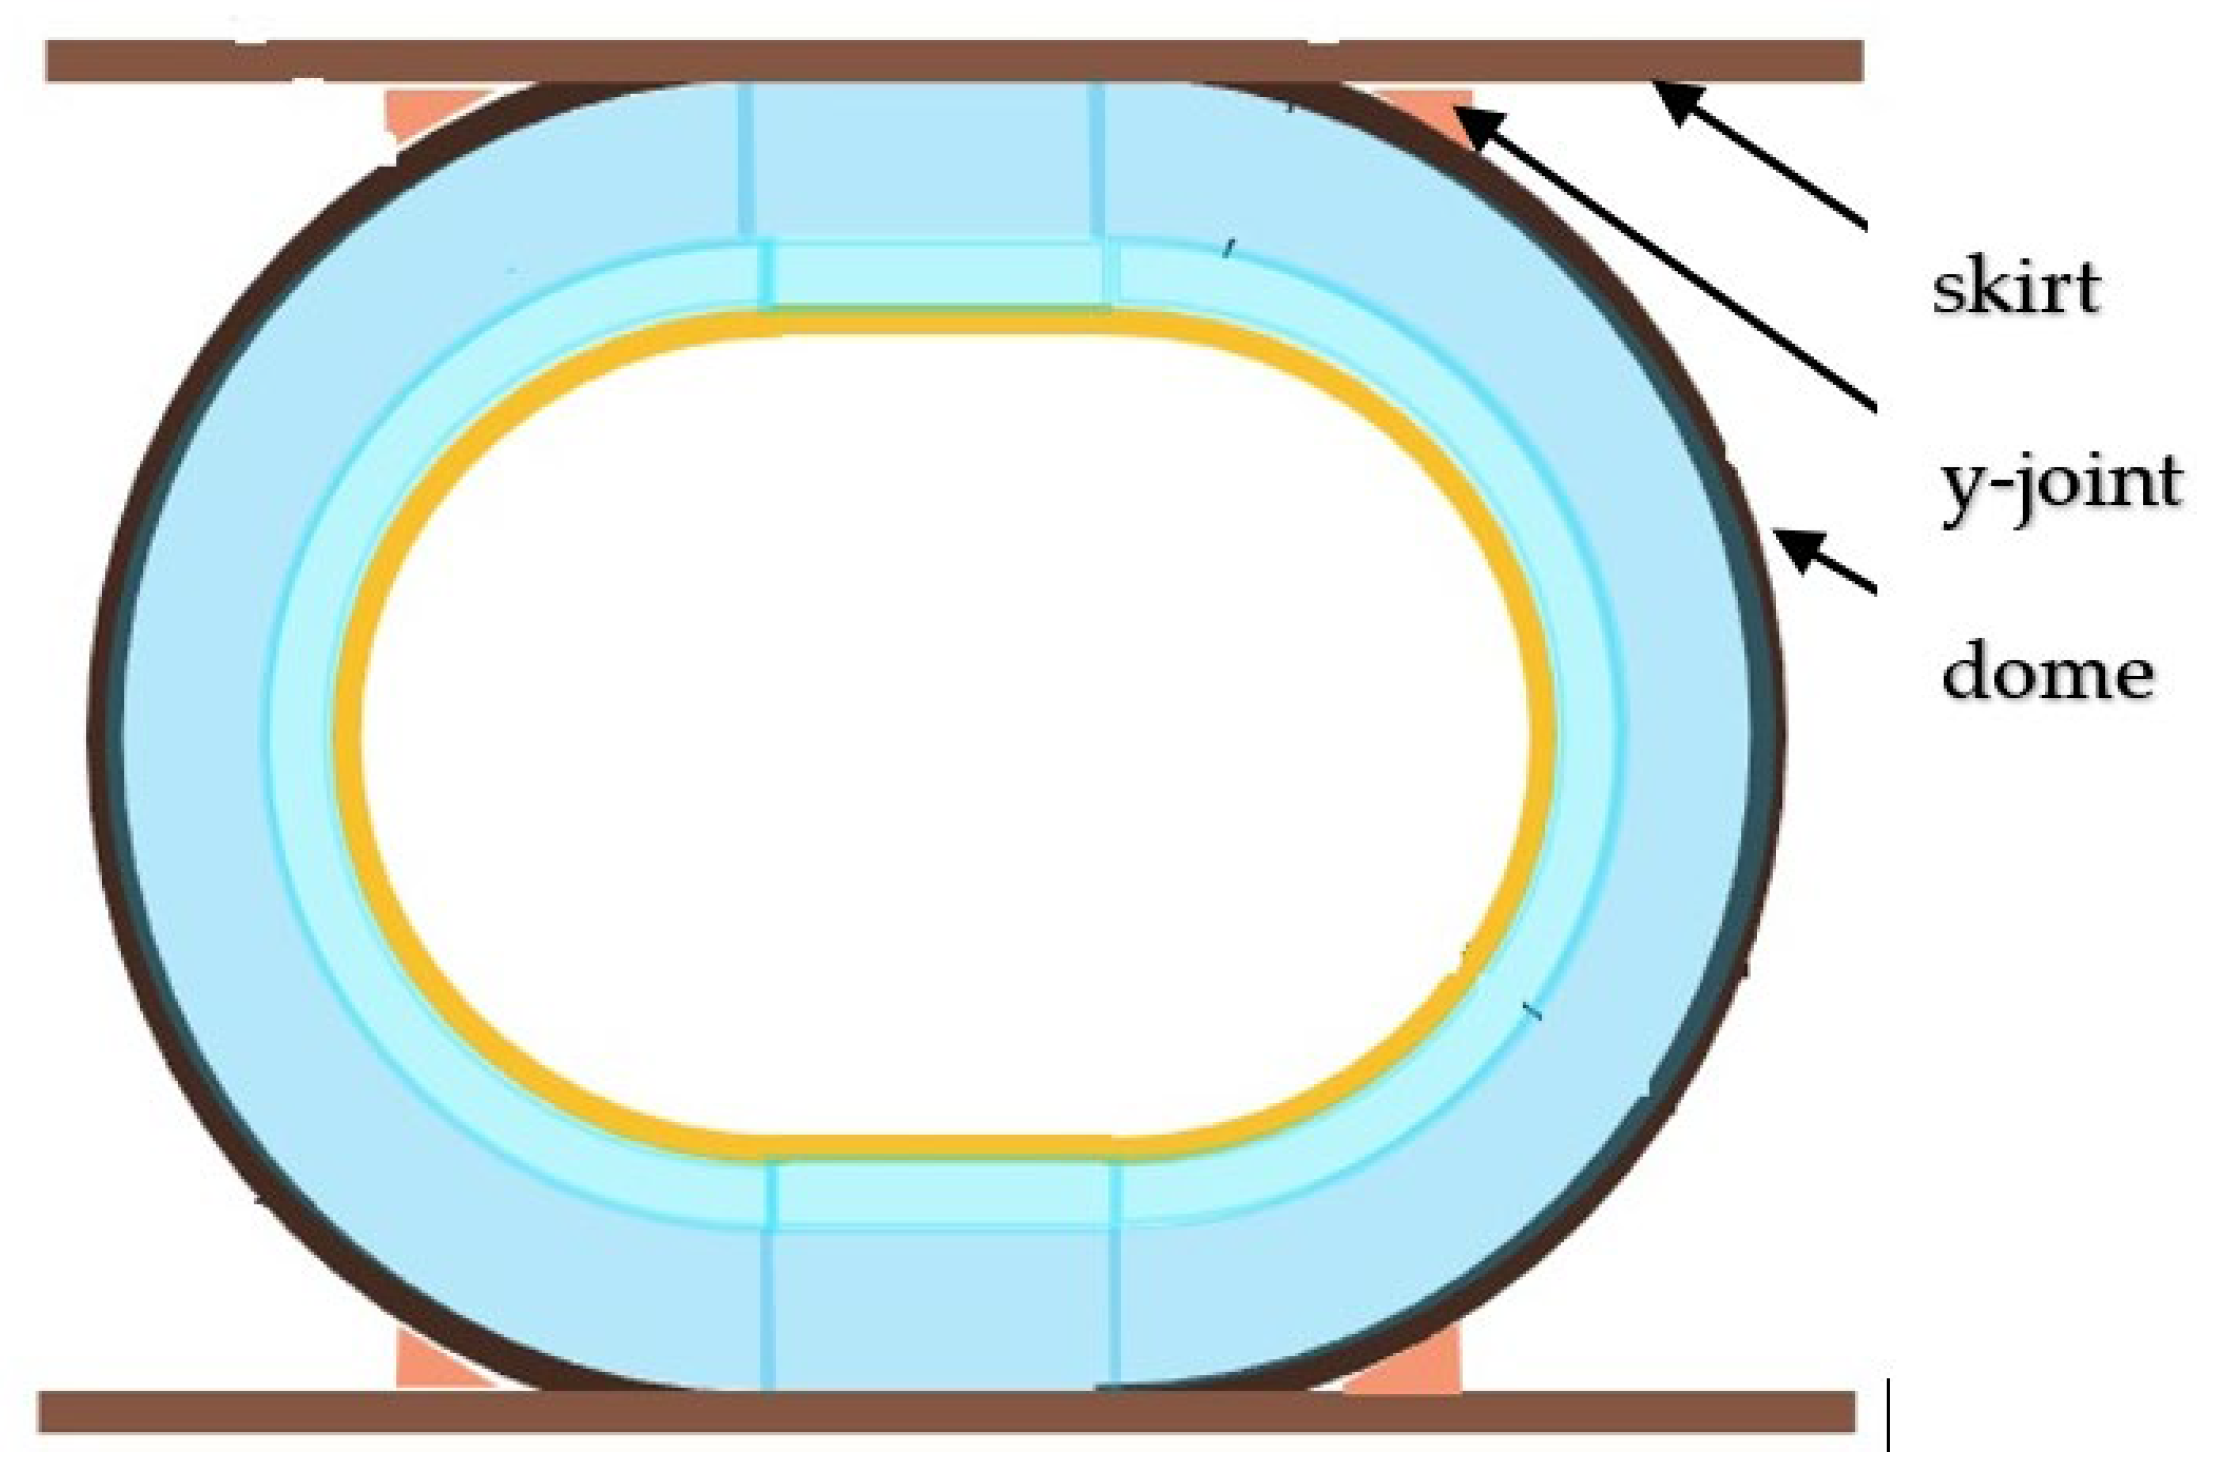
The test articles are representative sections of the cylinder skirt, schematically shown in Figure 2, in which a typical junction is illustrated, even if this is not a current solution considered in H2ELIOS. The most effective sensor installation method in terms of both time and cost is to bond the fiber on the surface, in the longitudinal direction.
A dedicated test rig, Figure 3, is designed to apply an incremental bending action to simulate, to some extent, the effects of a pressure solicitation on the cylinder element. In fact, since the external surface is the region of interest of this study, the selected type of load provides an effective means of inducing high-strain levels along the monitored area, where potential flaw emergence and delamination propagation can be observed.
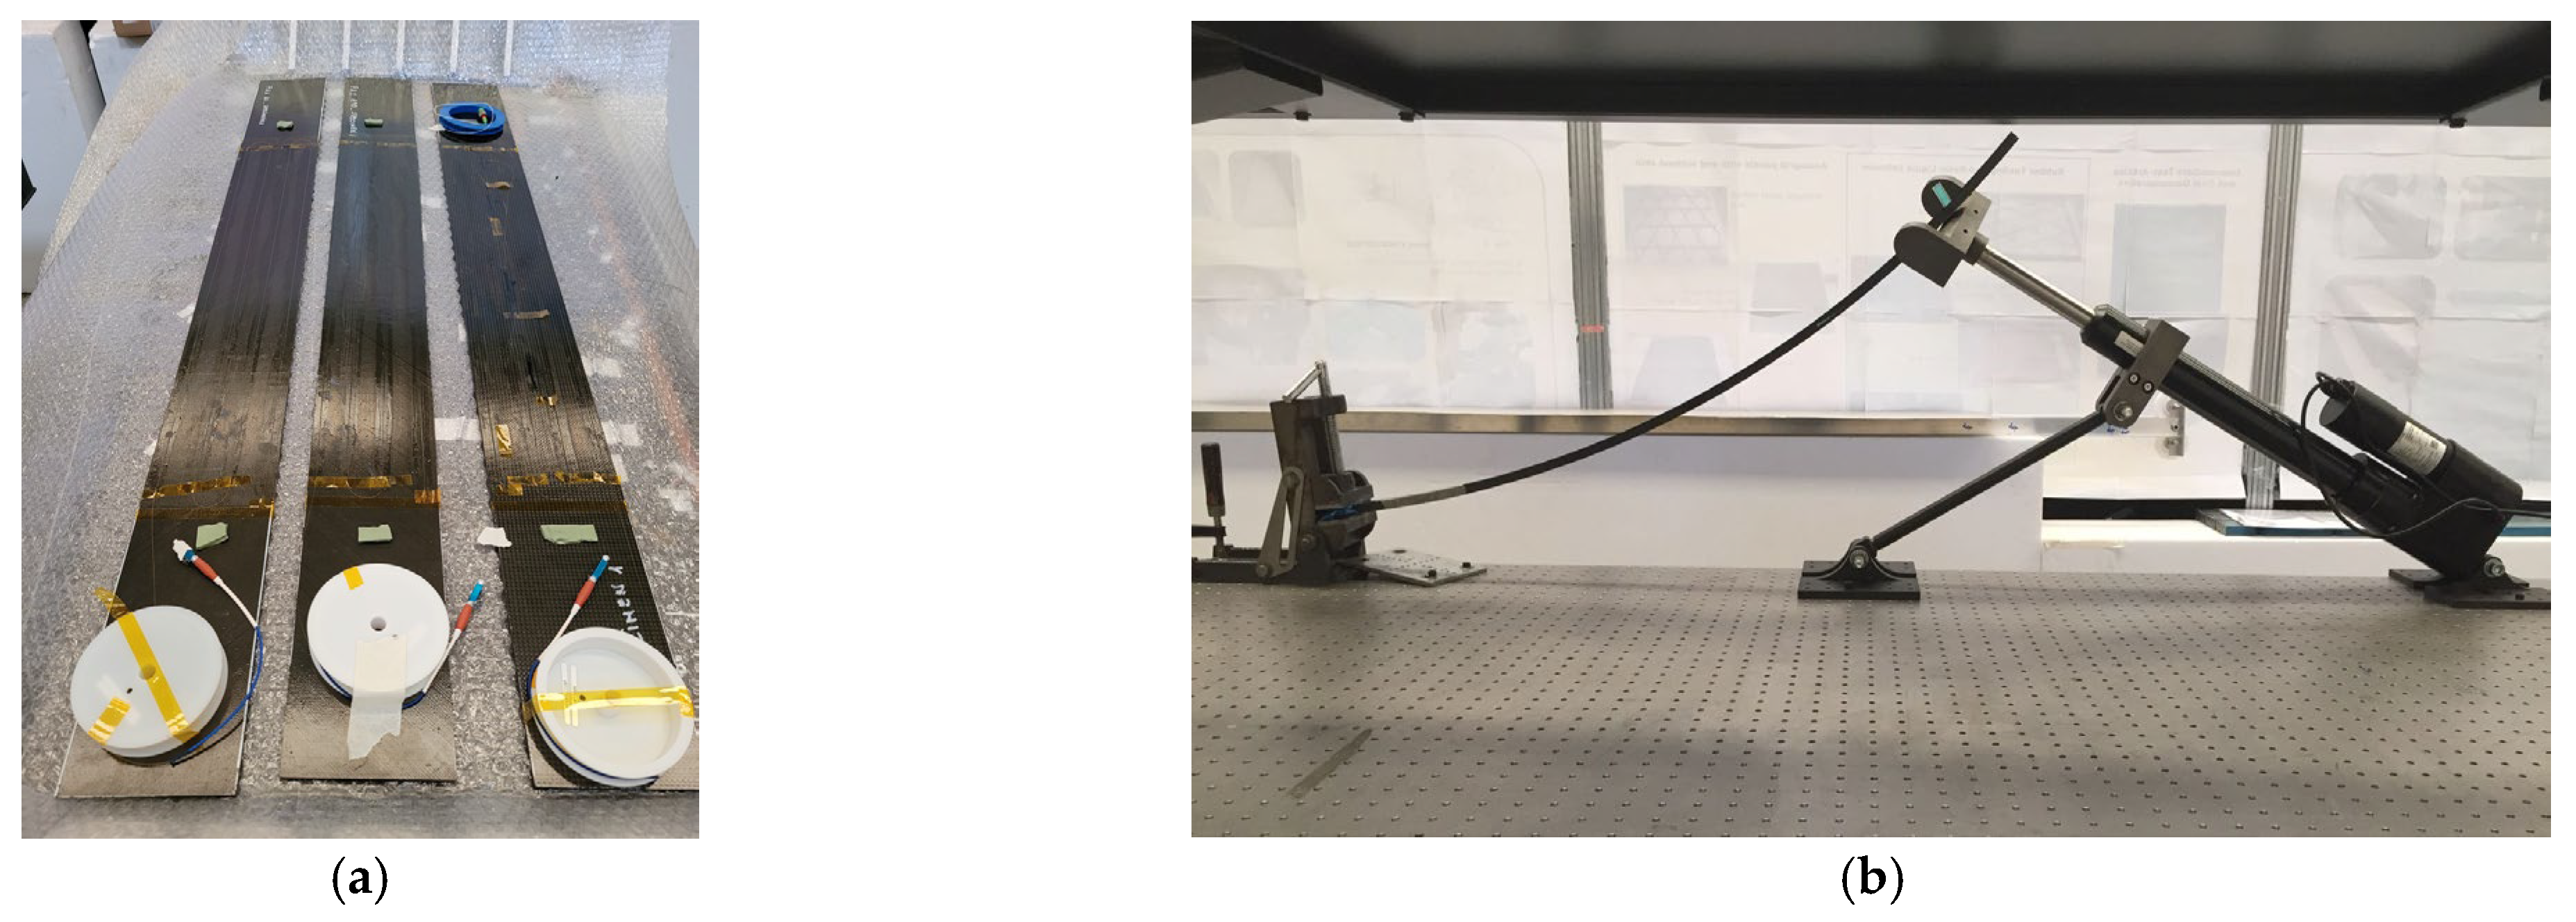
There are three items (Figure 4a) provided by the manufacturer and sensorized by using fiber optic sensors, both FBGs and distributed, with consistent results. Nevertheless, the damage realized during bending solicitation in two of these items was characterized by negligible energy release to provide a meaningful post-processing analysis. The test article is clamped on one side and driven by a linear actuator at the free edge (HIWIN type LAI2), as shown in Figure 4b. Strain data are logged at a specific data rate. Specific off-line post-processing techniques are then applied, according to the selected methodology, and the results are evaluated.

3.1. Optical Technologies

Referring to the experimental setup previously described in Figure 4b, fiber optic sensors (both FBG and distributed) are used for quasi-static (tens of Hz) and dynamic acquisitions (tens of kHz). The three systems are simultaneously applied during the test in order to achieve signal correlation (Figure 5a,b).

3.1.1. Fiber Bragg Grating Sensor

The physical principle of the FBG is based on the diffraction occurring from an electromagnetic radiation in accordance with Bragg’s law. It describes the condition for constructive interference from several crystallographic planes of the crystalline lattice separated by a distance d:
2dsinθ =
where θ is the incident angle, n is an integer, and λ is the wavelength. The reflected spectrum is centered on the Bragg wavelength and depends on the effective index of refraction and the period (Λ) of the grating, according to the well-known equation:
λ = 2neff Λ
In the hypothesis of constant temperature, if a local deformation is present, the grating period varies, and the reflected wavelength changes accordingly.
An FBG is bonded close to the clamped edge of the tested curved plate, where the strain achieves the maximum value. Related strain data are logged along the entire test execution by two different sets of instruments. The quasi-static-strain history is saved by an MOI sm-130 interrogator, while time response is monitored by Redondo FAE sense 400 (Redondo Optics, Inc., Corona, CA, USA), characterized by a dynamic bandwidth of tens of kHz. The two data sets are correlated but refer to distinct phenomena: the modification of the structural elastic behavior following an internal crisis, and the structure-borne sound caused by flaws initiation, respectively.

3.1.2. Distributed Fiber Optic Sensor

By contrast, the physical principle at the basis of the distributed sensing is the Rayleigh scattering, which originates from the interaction between the electromagnetic wave propagating in the fiber core and the intrinsic silica impurities. The Rayleigh backscatter profile of a certain optical fiber is correlated with its specific heterogeneous reflective index, distributed randomly along its length (called fiber signature). After an external stimulus (such as strain), the backscatter pattern exhibits a spectral shift that may be used to estimate the occurred deformation field along the fiber itself by a comparison with the reference (original) state. The space resolution of such information (ΔZ) is related to the optical frequency sweep range of the tunable laser source (ΔF) exciting the fiber, as given by Equation (3), where c is the speed of light and n is the fiber refractive index:
Δ Z = c/2nΔF
In this application, the distributed fiber is again displayed along the main direction of the plate. Strain data are logged during the test execution by the Luna OdisiB interrogator.

3.2. Sensors Performance

Fiber optic sensors are selected as they have well-established advantages. Nevertheless, in this application, the extremely “on the edge” operating conditions of a cryo-tank storing liquid hydrogen during flight would expose to the monitoring system to an extremely harsh environment, potentially explosive, characterized by a temperature window ranging from cryogenic to high temperatures.
For this reason, among the requirements for the selection of specialized sensors, it is mandatory to install devices without affecting the overall gravimetric index, while ensuring safety in a harsh environment and minimizing hydrogen darkening effects, which in turn would produce power losses and signal absence. In [25], the influence of hydrogen gas on fiber Bragg grating (FBG)-based optical fiber sensors has been validated experimentally. The paper demonstrates that the refractive index changes due to the presence of hydrogen in the micro-holes and its penetration into the fiberglass.
To preliminarily evaluate the sensor’s performance and functionality, the first step is to test the Bragg grating in the presence of gaseous hydrogen. The sensors are put inside a pressurized tank under a hydrogen atmosphere at a pressure of 4 bar. After the filling–emptying cycle, the tank is filled with hydrogen, which is kept inside the tank for approximately 2 days. After this time, the hydrogen is removed from the tank using nitrogen, following the same procedure explained before (filling–emptying cycles).
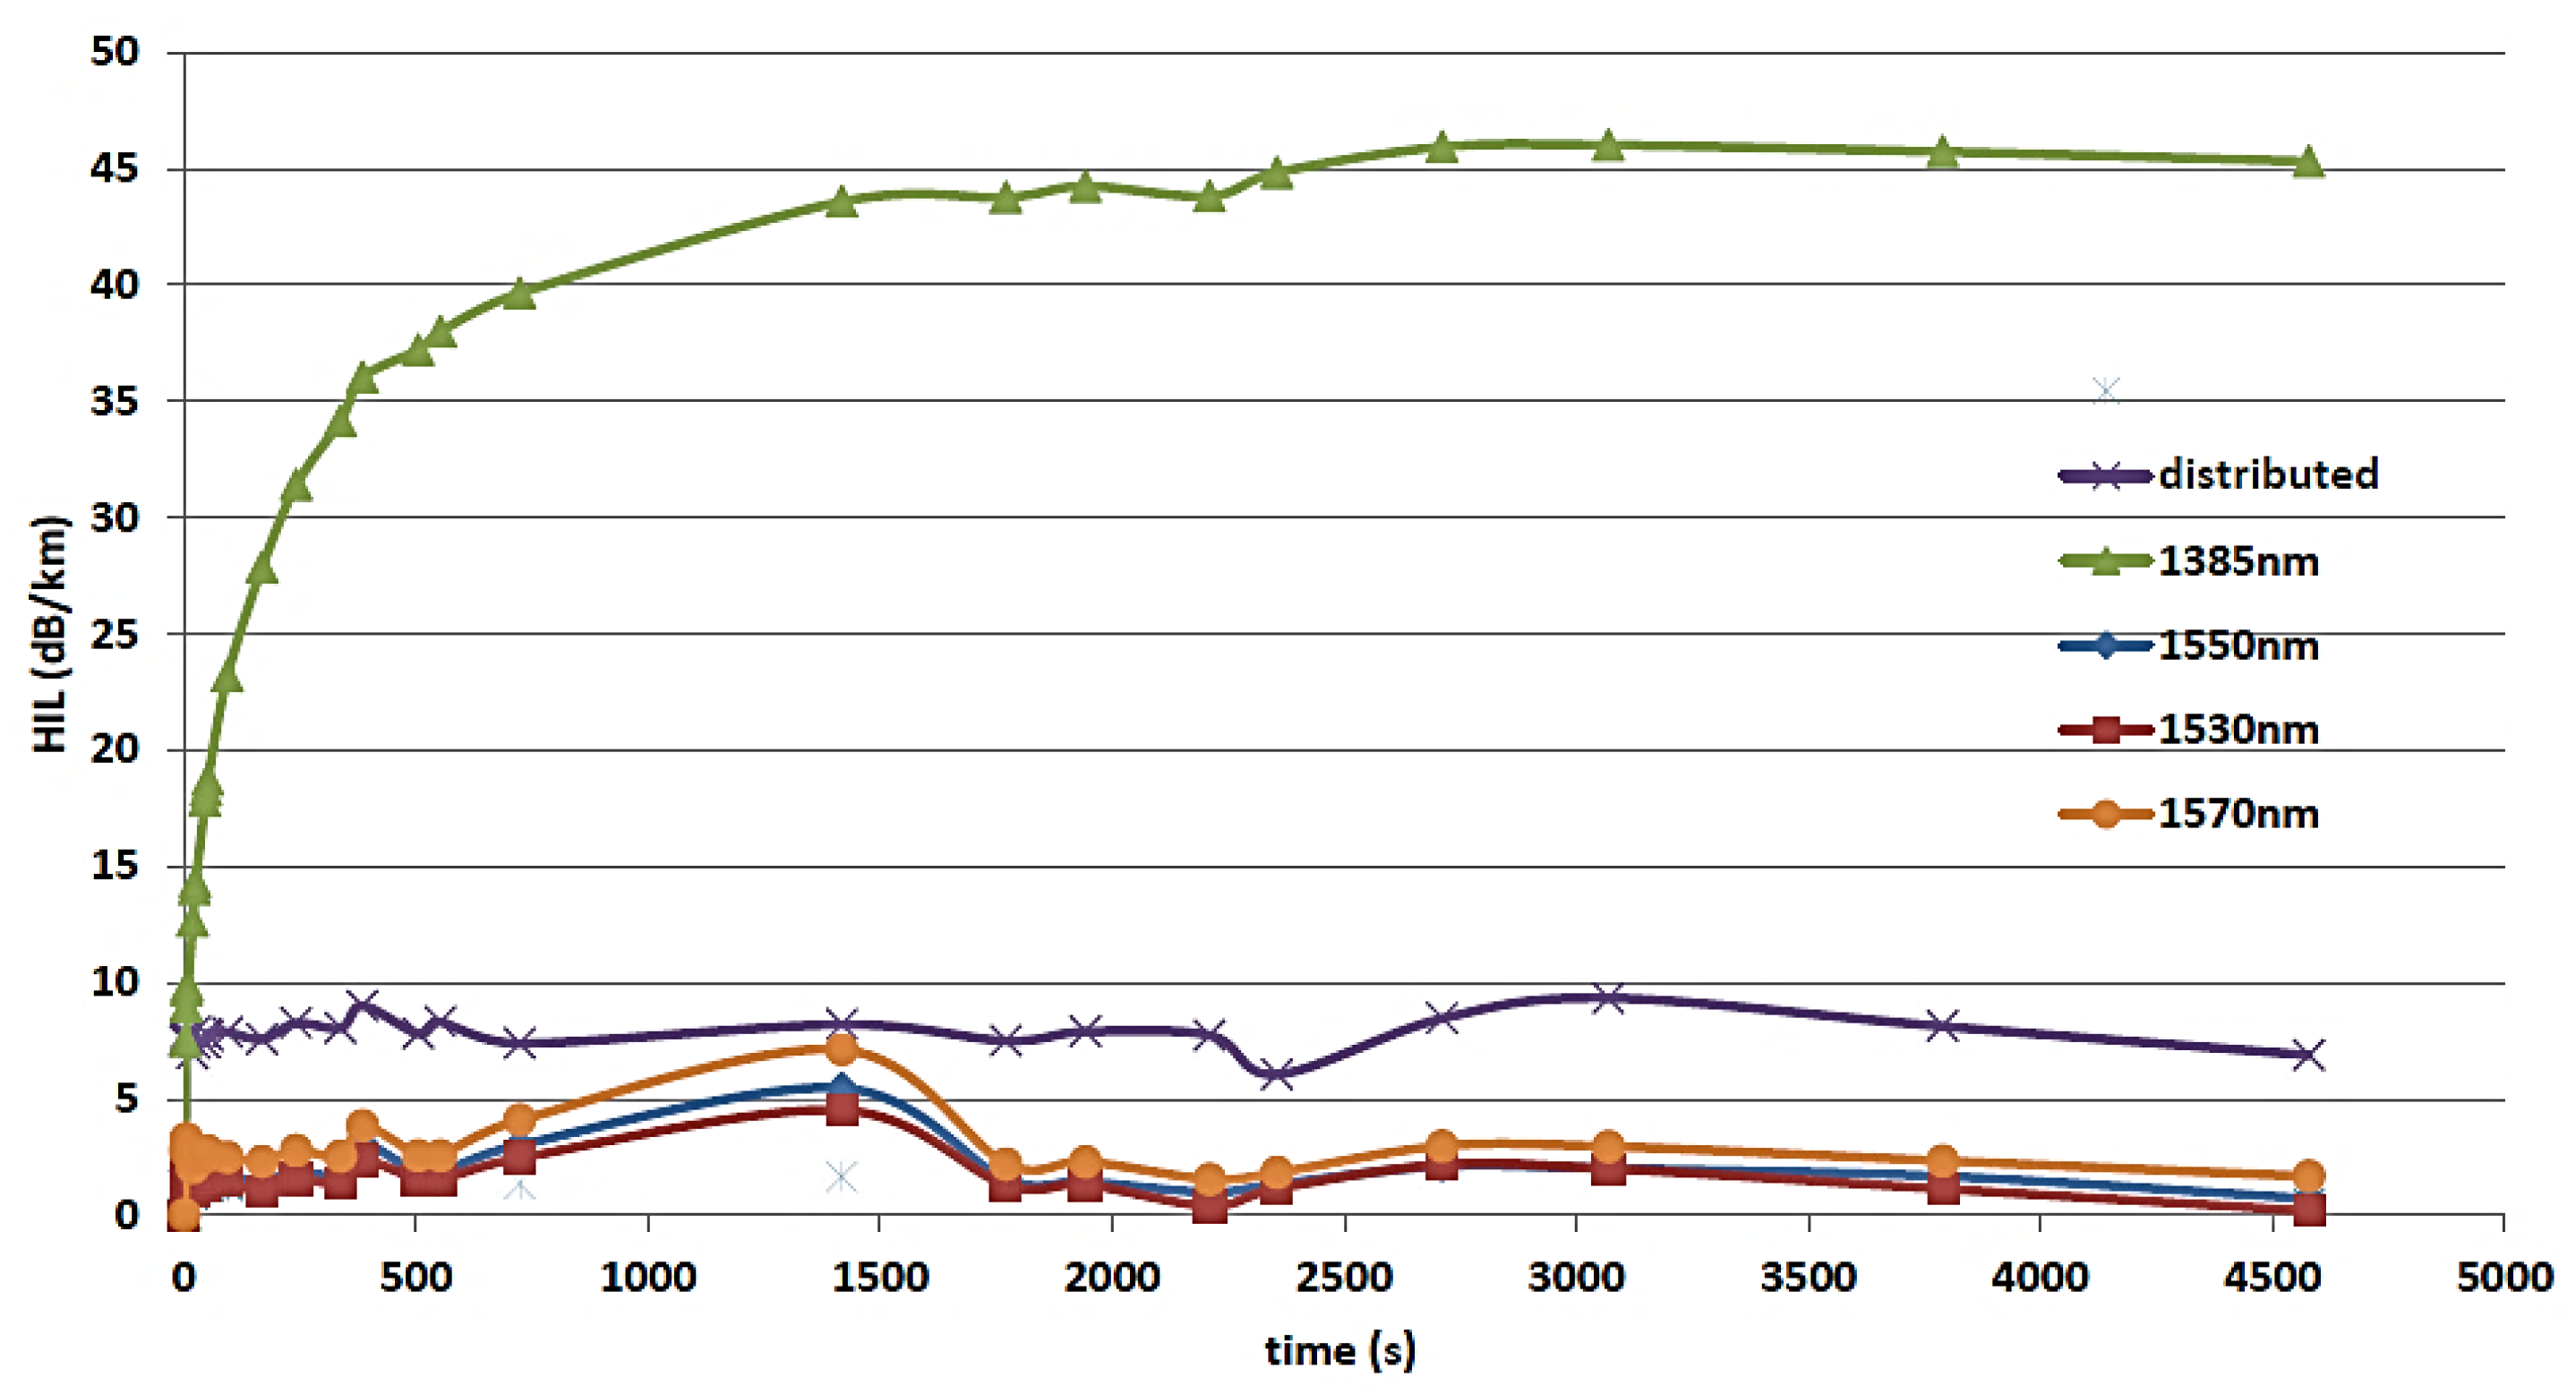
Absorption may occur at specific wavelengths and is observed as an increase in attenuation. In this case, a pure silica core single-mode fiber with carbon-polyimide coating is specifically designed for hydrogen-rich environments. The silica core prevents photodarkening effects, which are normally associated with germanium-doped fibers [26]. As shown in Figure 6, the central wavelengths exhibiting lower hydrogen absorption are 1530 nm 1550 nm and 1570 nm for the FBGs, while in the case of distributed fiber, the internal laser module emitted wavelengths swept from 1510 to 1570 nm which is in line with the observation.
The functionality test campaign is then conducted in order to verify the sensing response at specific thermo-mechanical loading conditions, after hydrogen exposure.
The sensors are tested in a controlled chamber in two steps. First −70 Celsius (Figure 7a) is targeted. A thermocouple is used as a reference sensor to calibrate the FO output. The fiber optic is left unstrained in the chamber to experience only thermo-optic deformations driven by its CTE (thermal expansion coefficient and refractive index variations). The gauge factor used to convert wavelength to temperature is 10.021 pm/°C, providing a linear response and consistent temperature values concerning the reference. In the second step, the temperature is cooled down to cryogenic conditions to verify the optical signal stability at −160 Celsius again (Figure 7b) and to simulate the operating working scenario.
At this point, to assess possible measurement deviations or uncertainty recorded before and after these exposures, a simple tension solicitation is applied to the sensors, comparing strain signals before and after both hydrogen conditioning and the cryogenic bath. The strain signal comparison is reported for the FBG (Figure 8a) and for the distributed fiber (Figure 8b), showing very good consistency.

4. Structural Element Analysis

The experiment is now carried out by applying an increasing bending load at room temperature until the initiation of damage.

4.1. Methodology

Devoted algorithms are implemented to process the acquired information and extract hints on damage presence. In Figure 9, a simplified sketch is reported describing the proposed integral methodology:
The methodology explores the possibility of recognizing and characterizing a damage event by using different features provided by different static and dynamic “patterns” associated with the same damage. Data post-processing is then correlated and merged to provide an integral and robust response. In what follows, each one of the single techniques is introduced, giving evidence of its peculiarity and specialization in terms of the main pattern parameters.

4.1.1. First-Order Derivative Sign of FBG Quasi-Static Strain Data

Structural damage is expected to give rise to local strain distribution discontinuity as a consequence of the generated material or geometric irregularity. In this case, strain distribution is therefore expected to exhibit significant gradients in the region of interest. Based on these considerations, a simple post-processing methodology is proposed, based on the first-order derivative, recognizing local discontinuities in the strain pattern. In the experiments carried out, the bending load is reached by progressive increments, with plafond steps at 0.3%, 0.5%, and 0.6%, as shown in Figure 10. At these levels, the structure behaves regularly. After 0.7%, some events occur. In detail, the FBGs are used to log data via the MOI-sm130 instrument (Micron Optics, Inc., Atlanta, GA, USA) at a max data rate of 250 Hz. Two signal drops are logged, with relevant strain losses as a result of a flaw onset. Post-processing analysis using the first-order derivative (red curve) and the vector product (blue curve) is applied to highlight the events. The sharp local edge onset (red spike) and the negative sign product (blue arrow) indicate that that load increased while strain loss occurred.
The proposed methodology is a non-model-based technique that does not require a preliminary characterization of the investigated item. It indeed uses the sign of the load as a reference value. Such an approach is able to detect and partially quantify the damage occurrence in the time domain, but without the capability of producing information about the extent of the damage. To resolve this issue, FBG dense arrays or distributed sensing approaches appear more suitable and are introduced in the next paragraphs.

4.1.2. Wavelet Decomposition for Transient Dynamics by FBG

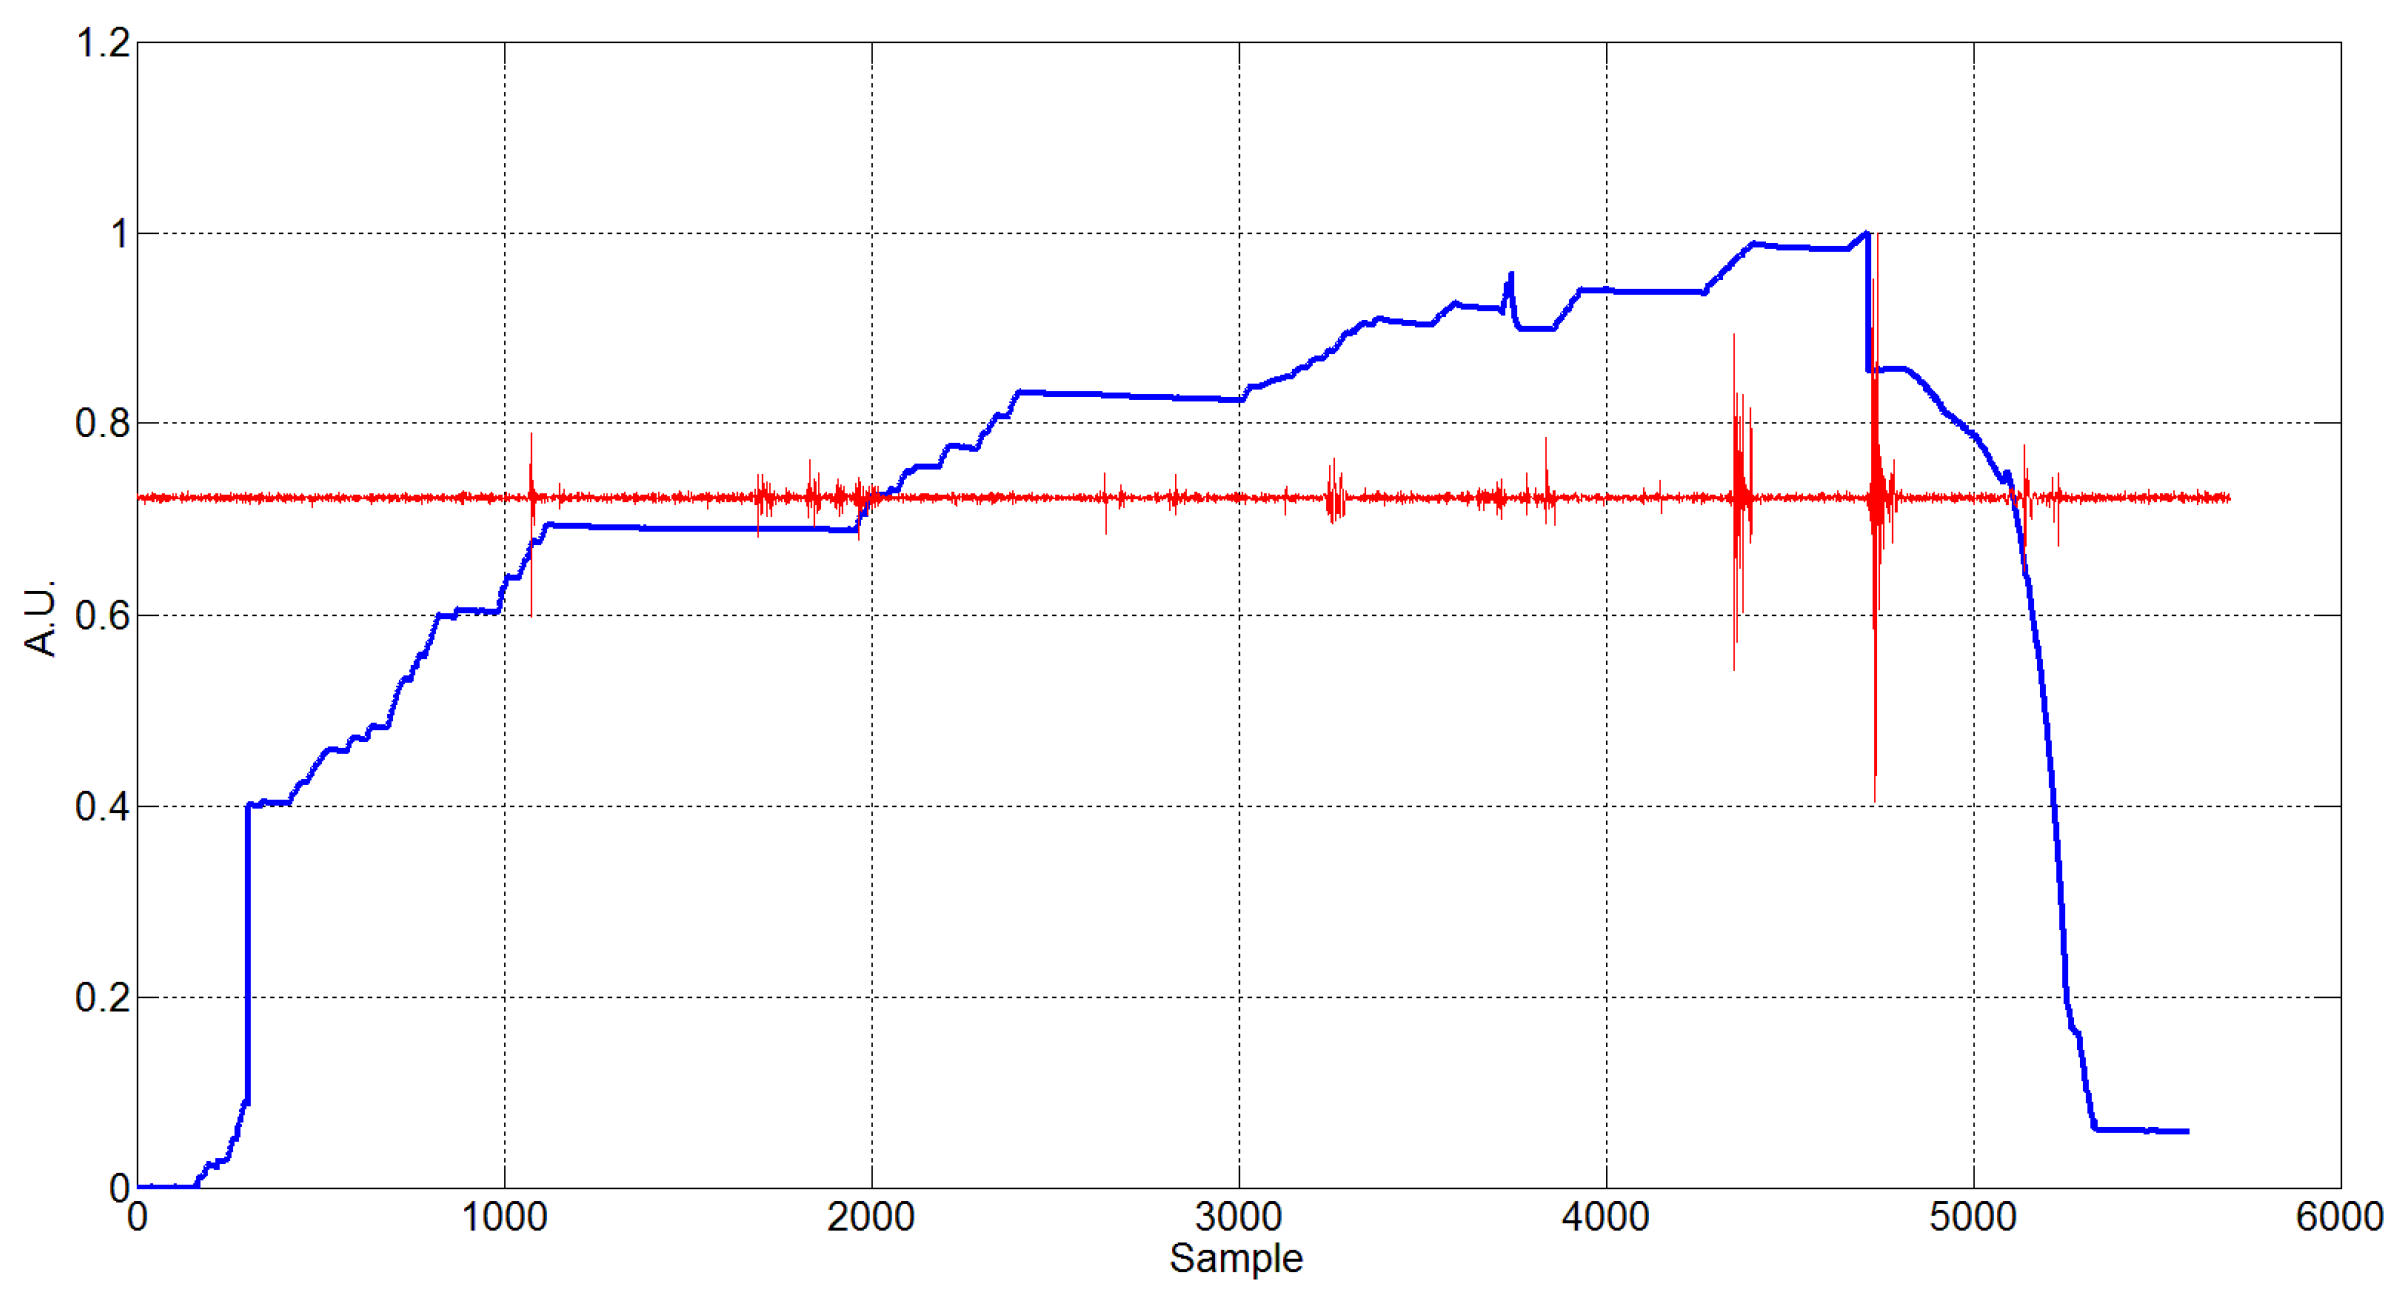
In this technique, the same FBG is used at high frequency for monitoring the transient dynamic response associated with flaw emergence. In detail, the FBGs are interrogated via an FAE-400 instrument at a max data rate of 25 KHz. To this purpose, wavelet analysis is a suitable approach to extract tailored signal features. Typically, wavelets with a small number of vanishing moments have a better time resolution and can be used to detect abrupt changes (discontinuities) in the time domain. Conversely, wavelets with a large number of vanishing moments have a better frequency resolution, and can be used to detect periodicities in the time series. In the discrete-time domain, the implementation of the wavelet transform is based on a bank of discrete time filters. The discrete wavelet transform (DWT) is computed by successive low-pass and high-pass filtering, referred to as the Mallat algorithm [27]. The coefficients for the approximation signals (aj,k) and detail signals (dj,k), corresponding to the wavelet scaling index (j) of the mother wavelet Ψ(t) and shifting index (k), can be plotted. The acquisition is reported in Figure 11. The signal includes events characterized by different magnitude, along with the time. In particular, two specific events are synchronized with the initiation of the flaw (red curve).
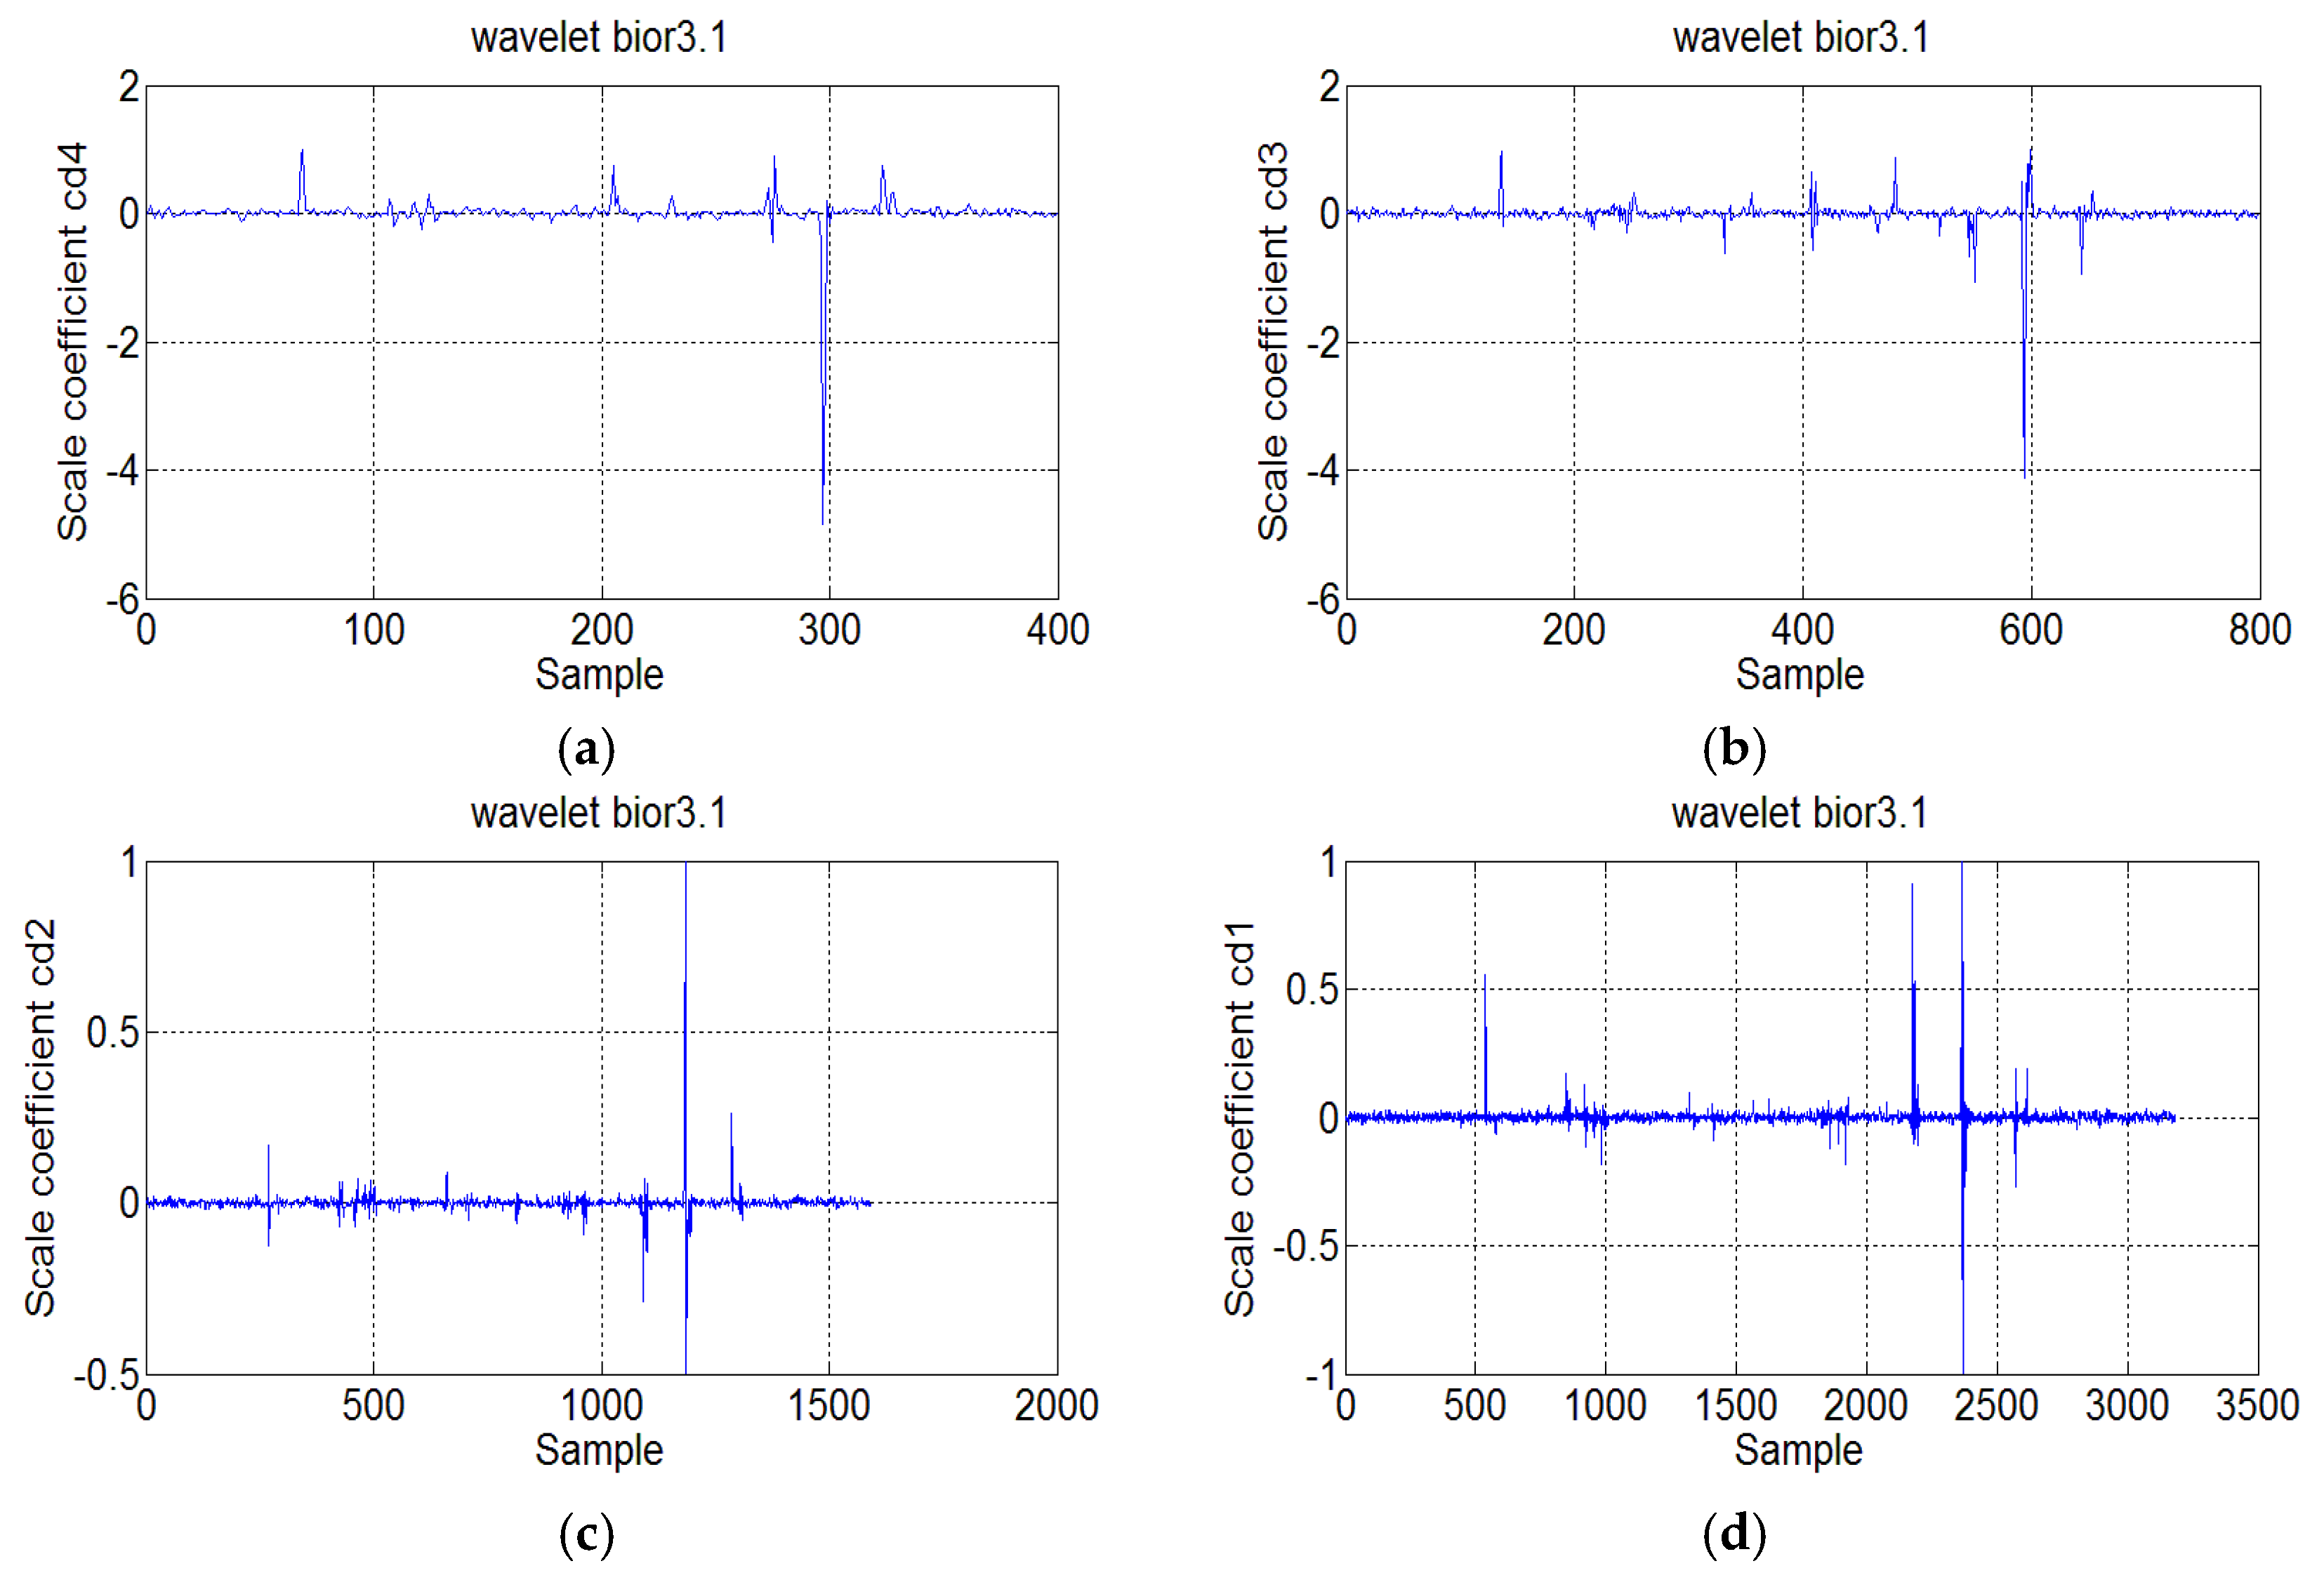
A wavelet multi-resolution analysis is performed by iteratively applying scaling and wavelet functions as low and high pass filters, respectively. The mother wavelet considered is biorthogonal (bior) 3.1. As shown in Figure 12, such a data process allowed the separation of the signal’s main frequency components, preserving sufficient time resolution.
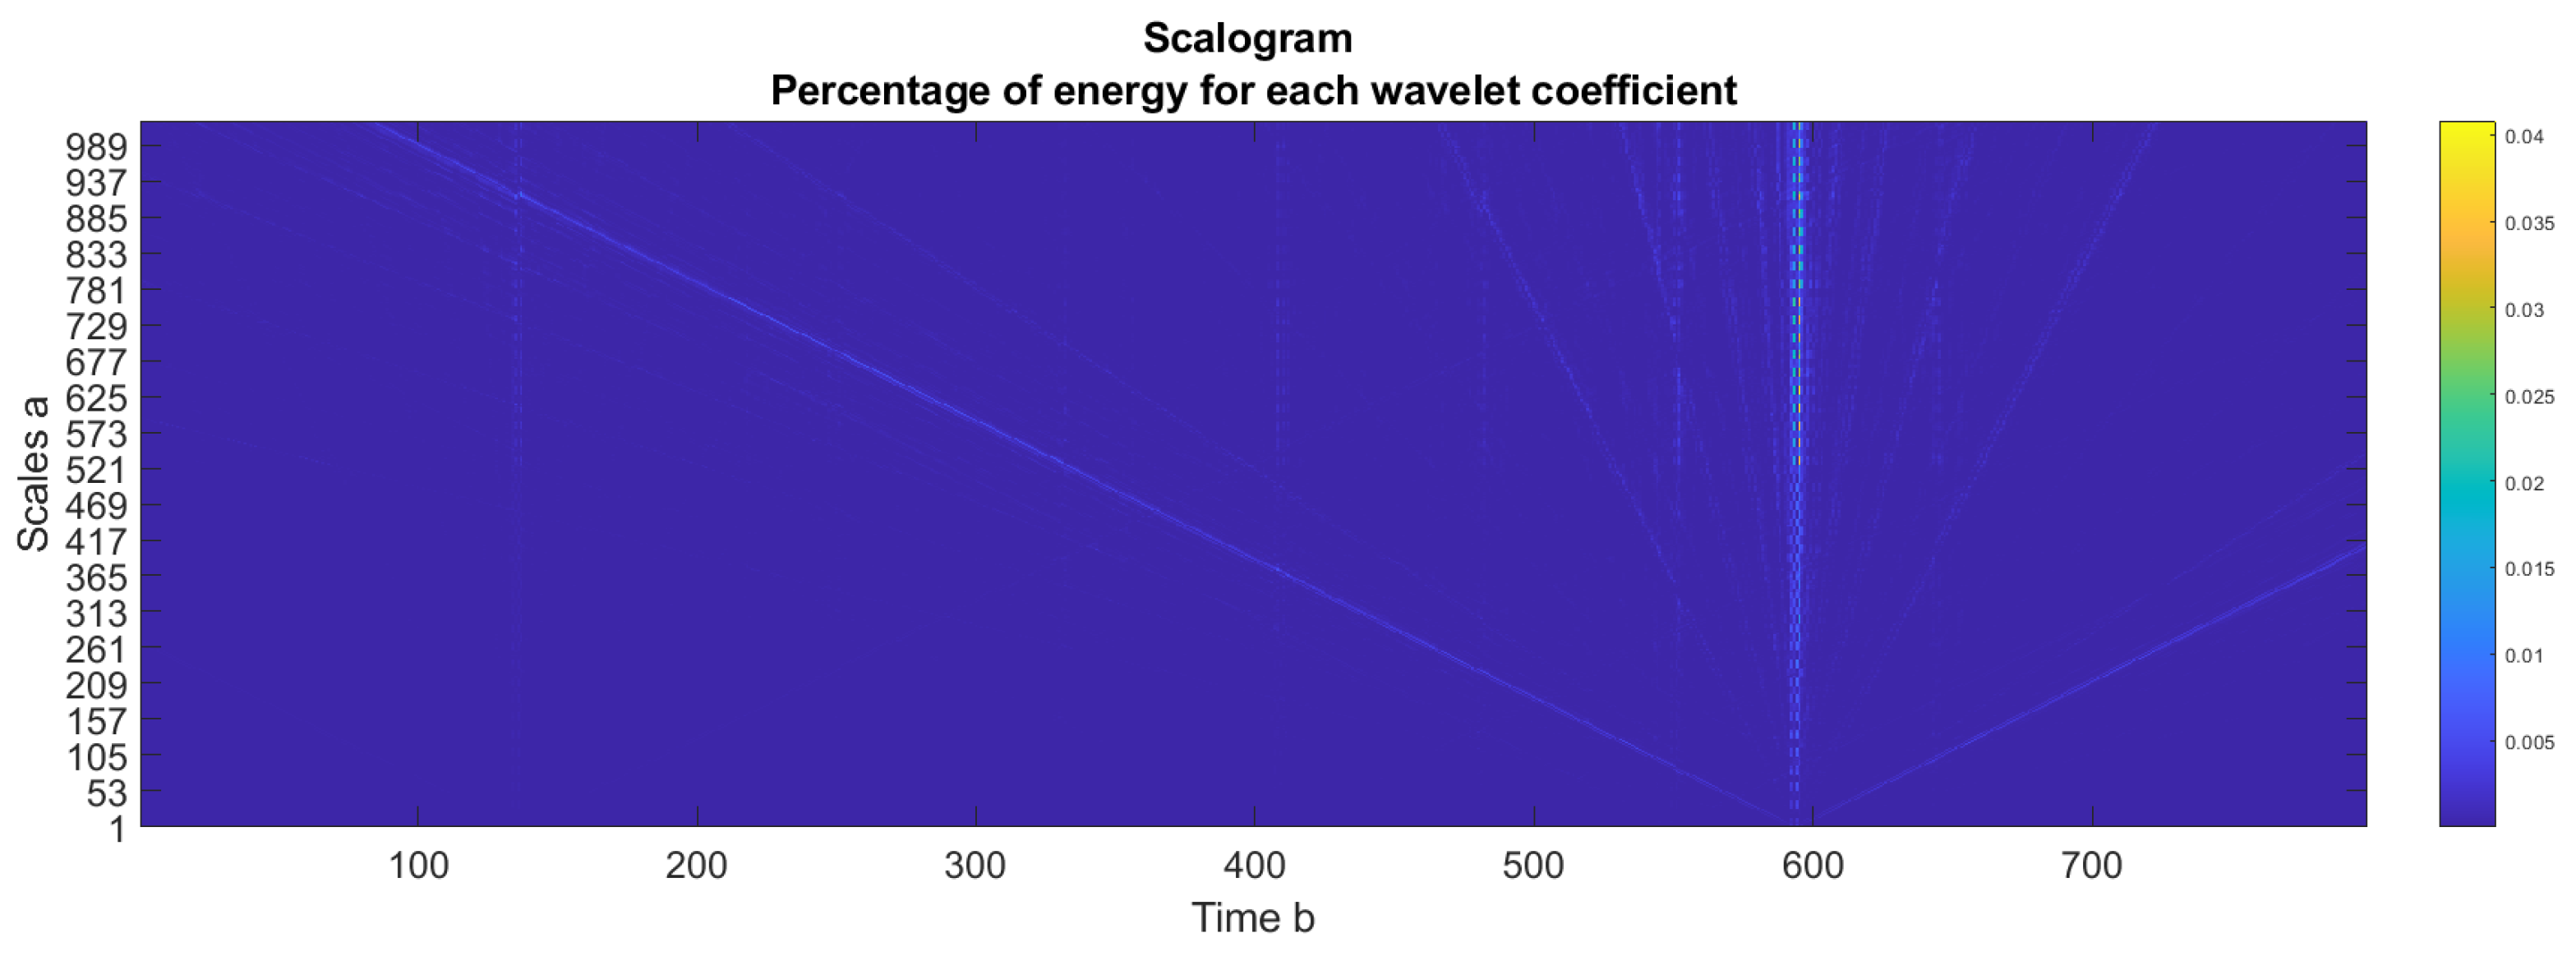
The slow change in the low-frequency constituent captured by cd4 and cd3 provides evidence of damage occurrence, as a high local gradient event, and shows a certain potential in identifying damage time laps. In addition, a scalogram (Figure 13) can be potentially used to correlate the high local gradient with the corresponding energy value. The horizontal axis represents time. The vertical axis represents frequency. The color or intensity at each point (time, frequency) corresponds to the magnitude (or energy) of the wavelet coefficient at that scale and time. A threshold energy level (TEL) is arbitrarily estimated by plotting the scalogram for each decomposition and computing a simple mean value among them. The TEL can be set to filter eligible events.

4.1.3. Auto-Correlation Analysis for Distributed Sensors

When applying distributed sensing, double information can be used. Typical data output is a matrix with a time history evolution for any sensing point along the fiber. In other words, strain variations can be detected and tracked in both the time and space domains. In this case as well, the methodology is a non-model-based technique that does not require a preliminary characterization of the investigated item since the current status will be the reference for the next.
The autocorrelation function is applied to verify if the generic sensing point is experiencing very high scattering with respect to the current data reading. The damaged position can be calculated again as a function of the input strain. Therefore, the distributed fiber optic is bonded along the longitudinal direction of the item, and the strain signature is expected to be a slope featuring zero strain at the tip section and maximum strain at the clamp (Figure 14). A marked irregularity can be noted along the strain profile, sharply located in space (the x-axis corresponding to the fiber length). The nonlinearity of the slope is then associated with a variation in material stiffness due to the permanent structural modification.

5. Conclusions

Damage detection is a complex and crucial operation enhancing the level of safety through the early identification of critical flaws before failure or, alternatively, reducing the design penalty factors in composite structures, required by safety and maintenance regulations. Unfortunately, there is a wide range of damage, each exhibiting specific characteristics. Therefore, techniques that can be suitable for one, often are not, or poorly, applicable to others. Even for a single type of defect, different attributes should be considered, and this cannot be achieved with a single technology. With a focus on fiber optic technologies, different systems, despite their specific limitations, can be highlighted for their ability to access some of the traits, distinguishing features to be correlated and merged, in view of an integrated multi-scenario approach. Experiments are conducted on a representative coupon thermoplastic material from the cylinder element, but the reported concepts may be scaled to full-scale systems.
From this perspective, the non-destructive methods are not taken into consideration, as they cannot be installed on board or operate during the system’s service life, being intended to be used on the ground during scheduled inspections. The SHM system is instead conceived to provide a tool to aid in the real-time detection of structural faults.
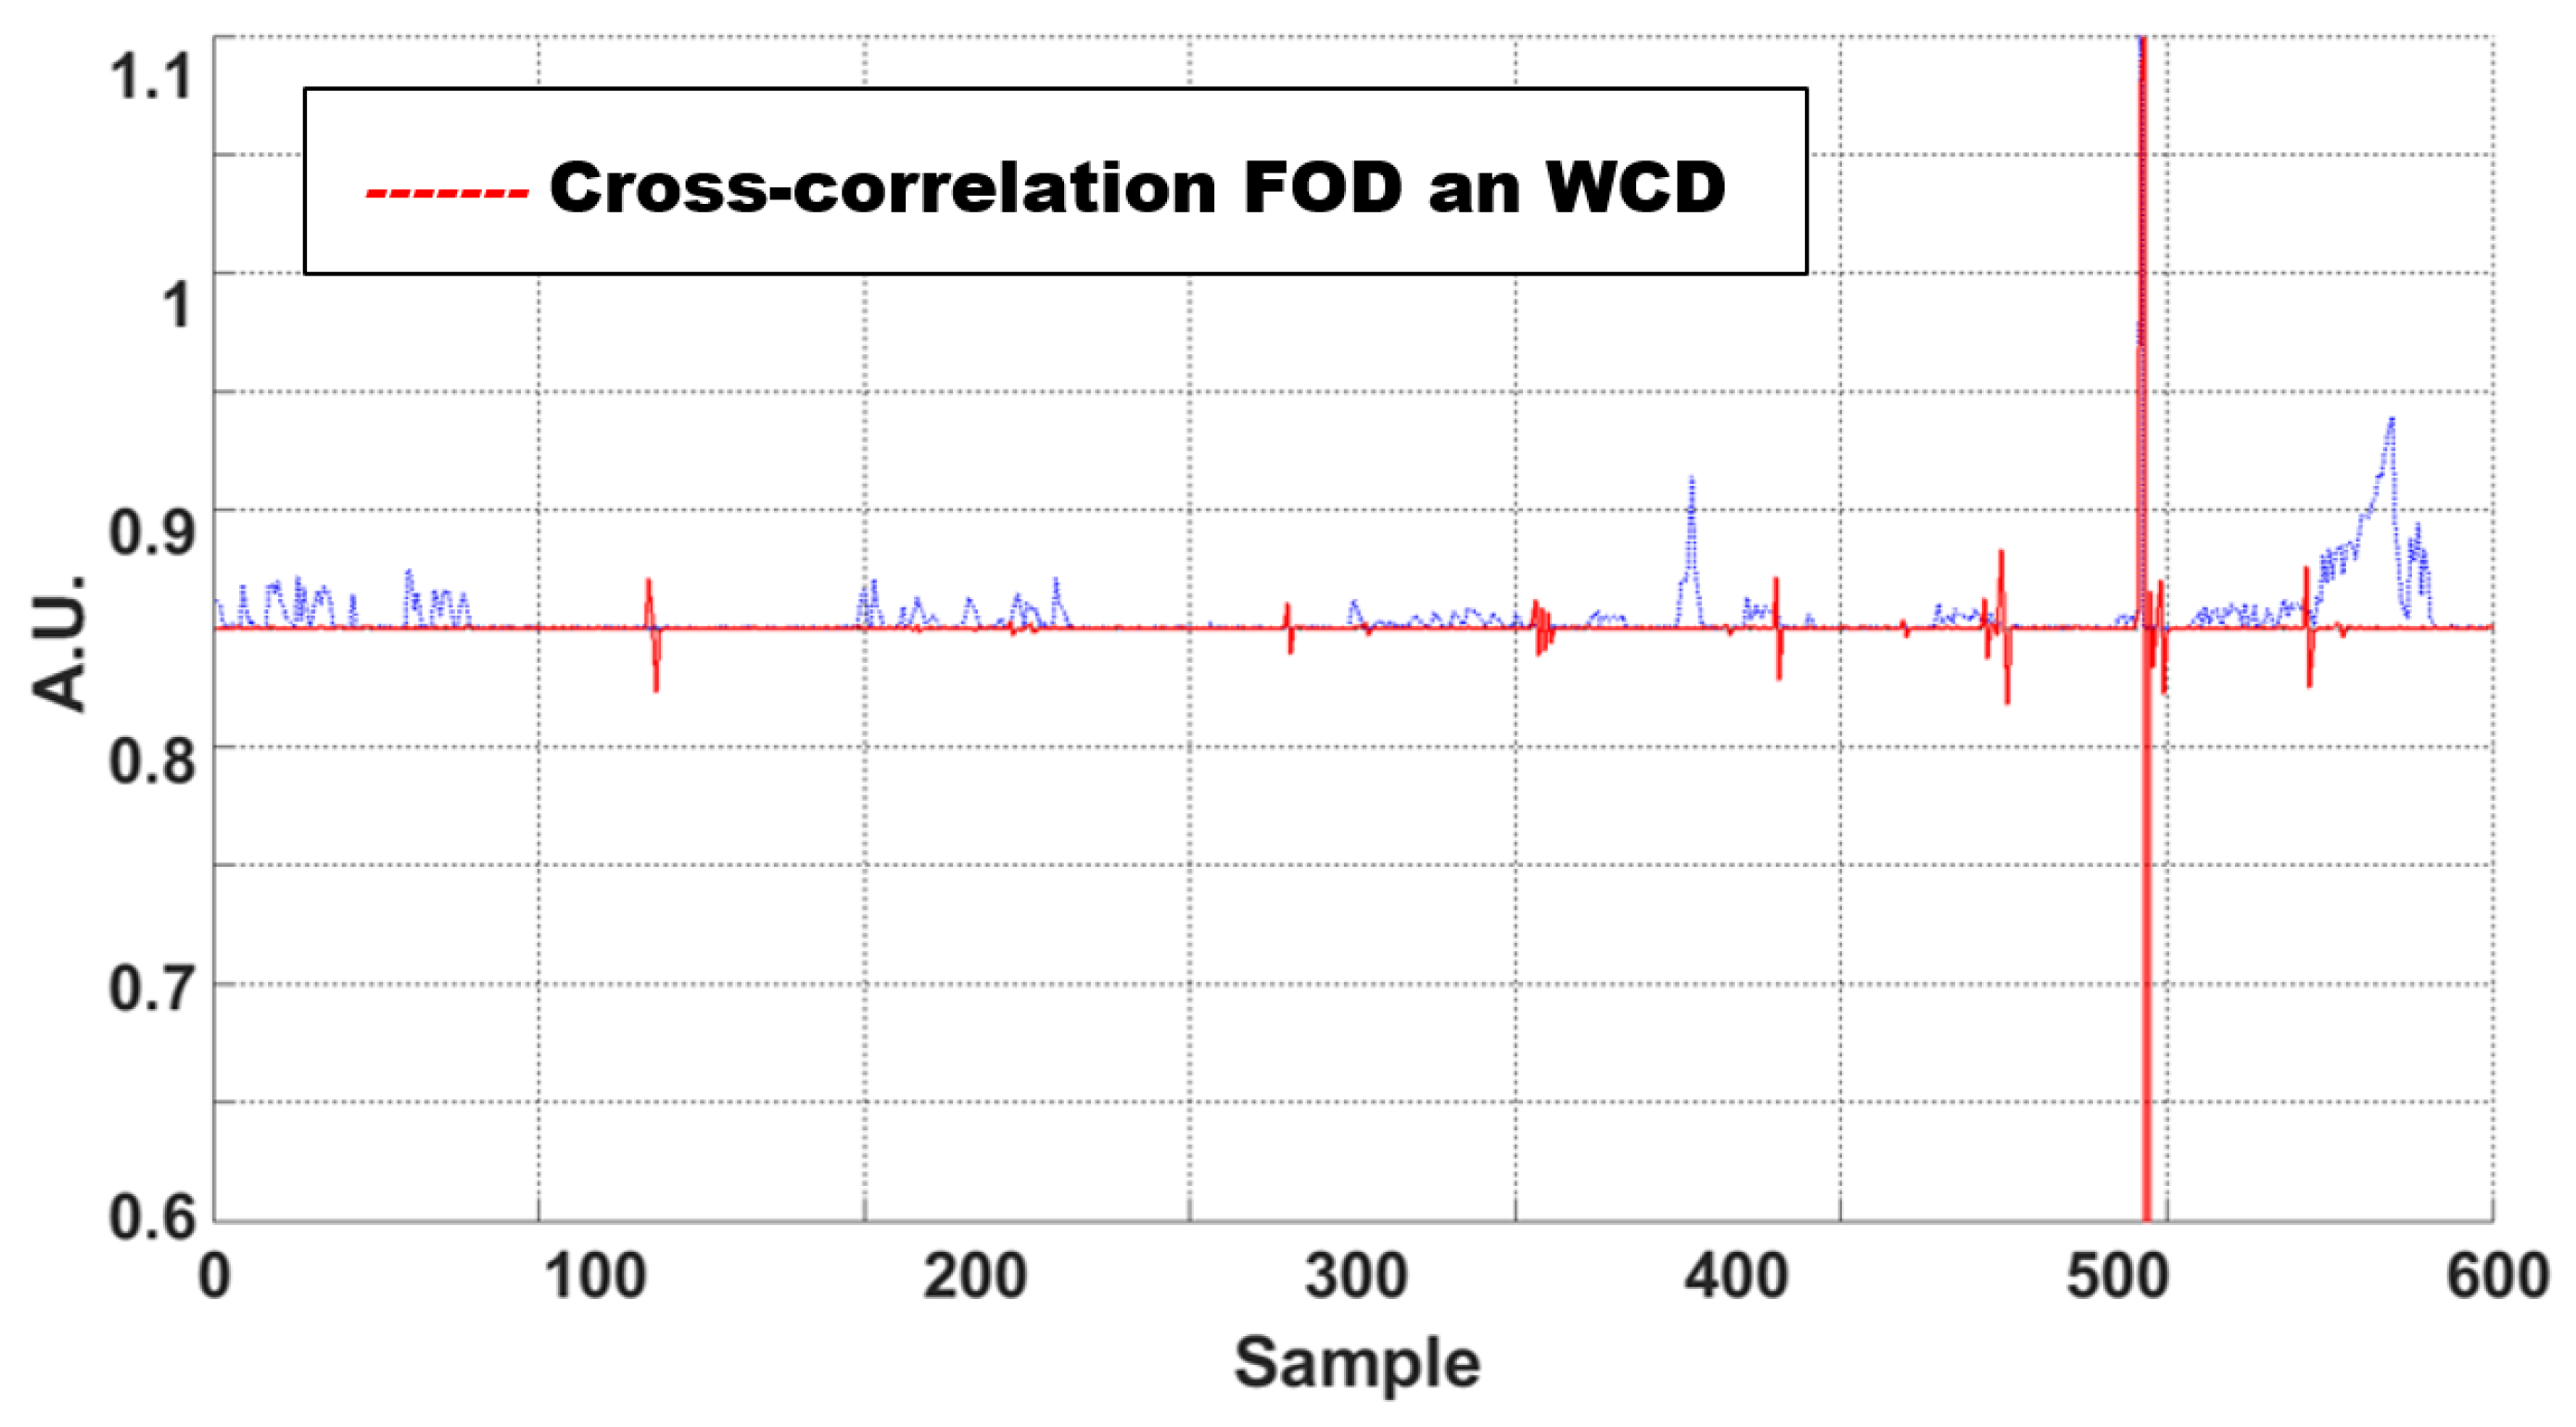
Three different methodologies are investigated in this work: FBG-based sensing, in both static and dynamic configurations, and distributed sensing for static configurations. The distributed sensing technique provides, at different extents, useful information of the strain map, allowing for a structural overview of the region of interest in both the time and space domains. A visual inspection of the tested coupon confirmed the flaw emergence at 34 cm from the clamped edge (located at 3 cm from the origin), as shown in Figure 15. By comparing the visual inspection with the results of the SHM algorithm (Figure 14), the damage onset is estimated at 1872 mm relative to an origin located at 1544 mm. In addition, the flaw extension can be estimated at 32 mm by fixing its termination at 1904 mm. On the other hand, the FBGs, whether in static or high-dynamic-range configurations, can detect the damage and provide information about its location and evolution in the time domain. Again, the cross-correlation between the two signals allowed the identification of events characterized by a non-negligible energy release, as shown in Figure 16. In the picture, an anomaly in the processed data makes it possible to understand the instant when the carbon fiber enters the fracture process and the propagation begins.
Table 1 provides a short summary of the different methodologies under the above assumptions, highlighting their main characteristics. In this way, it is believed to offer a preliminary, yet effective tool for better addressing the issue of damage detection. These considerations are not affected by the herein chosen architectures, since this approach can be easily extended to different methodologies, integrating further capabilities.
The current activity is part of an ongoing research project that will end with the full-scale functionality test next year. Mapping damage severity or identifying critical region severity is the focus of the final activity.
Author Contributions

Methodology, M.C.; software, M.C.; validation, M.C.; experimental work, C.C.T.; sensorization, P.C.; writing—original draft preparation, M.C. All authors have read and agreed to the published version of the manuscript.

Funding

The activity herein presented has been carried out within the Project H2ELIOS, “HydrogEn Lightweight & Innovative tank for zerO-emisSion aircraft”, funded within the EU research programme and, specifically, the topic HORIZON-JU-CLEAN-AVIATION-2022-01-HPA-03-Large Scale Lightweight Liquid Hydrogen Integral Storage Solutions.

Institutional Review Board Statement

Not applicable.

Informed Consent Statement

Not applicable.

Data Availability Statement

The original contributions presented in this study are included in the article. Further inquiries can be directed to the corresponding author.

Acknowledgments

The authors gratefully acknowledge the support of the European Union and of the Joint Undertaking initiative to the work herein presented. The project H2ELIOS is supported by the Clean Aviation Joint Undertaking and its members, funded by the European Union. However, the views and opinions expressed are those of the author(s) only and do not necessarily reflect those of the European Union or Clean Aviation Joint Undertaking. Neither the European Union nor the granting authority can be held responsible for them. The authors wish to thank Alestis Aerospace, Piaggio Aerospace, Aciturri and Antonio Concilio for their support.

Conflicts of Interest

The authors declare no conflicts of interest.

References

  1. Available online: https://h2elios.eu/home (accessed on 1 May 2025).
  2. Lee, D.S.; Fahey, D.W.; Skowron, A.; Allen, M.R.; Burkhardt, U.; Chen, Q.; Doherty, S.J.; Freeman, S.; Forster, P.M.; Fuglestvedt, J.; et al. The contribution of global aviation to anthropogenic climate forcing for 2000 to 2018. Atmos. Environ. 2021, 244, 117834. [Google Scholar] [CrossRef] [PubMed]
  3. Hydrogen-Powered Aviation–A Fact-Based Study of Hydrogen Technology, Economics, and Climate Impact by 2050; Tech. rep.; Publications Office of the European Union: Luxembourg, 2020. [CrossRef]
  4. NASA Press. Composite Cryotank Technologies & Demonstration; NASA: Washington, DC, USA, 2014. Available online: https://ntrs.nasa.gov/archive/nasa/casi.ntrs.nasa.gov/20140016807.pdf (accessed on 16 December 2022).
  5. Anagnostopoulou, A.; Tserpes, K.; Sotiropoulos, D.; Lampeas, G.; González Teodoro, J.R.; Carrasco Loras, B. Sustainability Assessment of Composite Aircraft Liquid Hydrogen Tanks Using Multi-Criteria Decision-Making Methods. In Proceedings of the ECCM21—21st European Conference on Composite Materials, Nantes, France, 2–5 July 2024. [Google Scholar] [CrossRef]
  6. Schillaci, E.; Oliet, C.; Rigola, J. Calibration and verification of CFD-VOF models for the analysis of pressurization scenarios in LH2 tanks. J. Phys. Conf. Ser. 2024, 2766, 012041. [Google Scholar] [CrossRef]
  7. Dreossi, G.; Horvat, A.B. Permeation Characterization of Thermoset and Thermoplastic CFRP Materials for LH2 Tank Solutions, Thermally Shocked and Mechanically Cycled at Cryogenic Temperatures. Aerospace 2025, 12, 342. [Google Scholar] [CrossRef]
  8. P. Helåsen, A.; La Rosa, A.D.; Grammatikos, S. Environmental impact of multi layered aerospace composite structures. Zenodo. [CrossRef]
  9. Huete, J.; Nalianda, D.; Pilidis, P. Impact of tank gravimetric efficiency on propulsion system integration for a first-generation hydrogen civil airliner. Aeronaut. J. 2022, 126, 1324–1332. [Google Scholar] [CrossRef]
  10. Mantzaroudis, V.K.; Theotokoglou, E.E. Computational Analysis of Liquid Hydrogen Storage Tanks for Aircraft Applications. Materials 2023, 16, 2245. [Google Scholar] [CrossRef] [PubMed]
  11. Oom Ortiz de Montellano, T.; Heidebrecht, A.; Hoogreef, M.F.M. Structural Analysis of a Novel Integral Tank Concept for Hydrogen Storage Onboard Commercial Aircraft. In Proceedings of the AIAA SCITECH 2025 Forum Article AIAA 2025–1244, Reston, VA, USA, 6–10 January 2025; American Institute of Aeronautics and Astronautics Inc. (AIAA): Reston, VA, USA. [Google Scholar] [CrossRef]
  12. Dhital, D.; Lee, J.R.; Farrar, C.; Mascarenas, D. A review of flaws and damage in space launch vehicles: Motors and engines. J. Intell. Mater. Syst. Struct. 2013, 25, 524–540. [Google Scholar] [CrossRef]
  13. Gao, D.; Wu, Z.; Yang, L.; Zheng, Y.; Yin, W. Structural Health Monitoring for Long-Term Aircraft Storage Tanks under Cryogenic Temperature. Aerosp. Sci. Technol. 2019, 92, 881–891. [Google Scholar] [CrossRef]
  14. Rovera, A.; Tancau, A.; Boetti, N.; Vedova, M.D.L.D.; Maggiore, P.; Janner, D. Fiber Optic Sensors for Harsh and High Radiation Environments in Aerospace Applications. Sensors 2023, 23, 2512. [Google Scholar] [CrossRef] [PubMed]
  15. Habel, W.R.; Krebber, K. Fiber-optic sensor applications in civil and geotechnical engineering. Photonic Sens. 2011, 1, 268–280. [Google Scholar] [CrossRef]
  16. Henault, J.-M.; Moreau, G.; Blairon, S.; Salin, J.; Courivaud, J.-R.; Taillade, F.; Merliot, E.; Dubois, J.-P.; Bertrand, J.; Buschaert, S.; et al. Truly distributed optical fiber sensors for structural health monitoring: From the telecommunication optical fiber drawling tower to water leakage detection in dikes and concrete structure strain monitoring. Adv. Civ. Eng. 2010, 2010, 930796. [Google Scholar] [CrossRef]
  17. Maurin, L.; Ferdinand, P.; Nony, F.; Villalonga, S. OFDR Distributed Strain Measurements for SHM of Hydrostatic Stressed Structures: An Application to High Pressure Hydrogen Storage Type IV Composite Vessels-H2E Project. In Proceedings of the EWSHM-7th European Workshop on Structural Health Monitoring, IFFSTTAR, Inria, Université de Nantes, Nantes, France, 9 July 2014. hal-01021252. [Google Scholar]
  18. Kenner, W.S.; Allison, S.; Palm, T.; Shah, C.; McCleskey, S.; Lavoie, A.; Enno, D.; Wang, D.; Bohlen, J.; Hasan; et al. Experimental and Analytical Investigation of a Joint Between Liquid Hydrogen Tank and Intertank Structure for a Reusable Launch Vehicle. In Proceedings of the JANNAF 40th Combustion Subcommittee/28th Airbreathing Propulsion Subcommittee/22nd Propulsion Systems Hazards Subcommittee/4th Modeling and Simulation Subcommittee Joint Meeting, Charleston, SC, USA, 13–16 June 2005. [Google Scholar]
  19. Katsumata, S.; Ogasawara, T.; Uchino, T.; Hirayama, N.; Sakata, K.; Uzawa, K. Experimental and analytical study of a high-pressure hydrogen storage tank made of CFRP with dome–cylinder split molding structure for fuel cell vehicles. Int. J. Hydrogen Energy 2025, 101, 269–279. [Google Scholar] [CrossRef]
  20. Caldwell, S.P.; Radford, D.W. The Health Monitoring of Bonded Composite Joints Using Both Thickness and Radial Impedance Resonance Responses. Sensors 2024, 24, 2508. [Google Scholar] [CrossRef] [PubMed]
  21. Marcon, L.; Chiuchiolo, A.; Castaldo, B.; Bajas, H.; Galtarossa, A.; Bajko, M.; Palmieri, L. The Characterization of Optical Fibers for Distributed Cryogenic Temperature Monitoring. Sensors 2022, 22, 4009. [Google Scholar] [CrossRef] [PubMed]
  22. Ciminello, M.; Concilio, A.; Galasso, B.; Pisano, F.M. Skin–stringer de-bonding detection using distributed dispersion index features. Struct. Health Monit. 2018, 17, 1245–1254. [Google Scholar] [CrossRef]
  23. Concilio, A.; Ciminello, M.; Galasso, B.; Pellone, L.; Mercurio, U.; Apuleo, G.; Cozzo-lino, A.; Kressel, I.; Shoham, S.; Bardenstein, D. De-Bonding Numerical Characterization and Detection in Aeronautic Multi-Element Spars. Sensors 2022, 22, 4152. [Google Scholar] [CrossRef] [PubMed]
  24. Ciminello, M.; Sikorski, B.; Galasso, B.; Pellone, L.; Mercurio, U.; Apuleo, G.; Cirio, D.; Bosco, L.; Cozzolino, A.; Kressel, I.; et al. Laboratory Results of a Real-Time SHM Integrated System on a P180 Full-Scale Wing-Box Section. Sensors 2023, 23, 6735. [Google Scholar] [CrossRef] [PubMed]
  25. Huang, J.-Y.; Van Roosbroeck, J.; Vlekken, J.; Kinet, D.; Martinez, A.; Geernaert, T.; Berghmans, F.; Van Hoe, B.; Lindner, E.; Caucheteur, C. Effect of hydrogen gas on FBG-based optical fiber sensors for downhole pressure and temperature monitoring. Opt. Express 2019, 27, 5487–5501. [Google Scholar] [CrossRef] [PubMed]
  26. Available online: https://www.ghtphotonics.com/chi-siamo/ght-photonics-sensing/ (accessed on 1 June 2025).
  27. Quaranta, V.; Dimino, I. Experimental Training and Validation of a System for Aircraft Acoustic Signature Identification. J. Aircr. 2007, 44, 1196–1204. [Google Scholar] [CrossRef]
Figure 2. Typical skirt-cylinder joint sketch as critical region of interest for flaws onset.
Applsci 15 08748 g002
Figure 3. Scheme of the sensorization: OdisiB instrument (Luna Innovations Incorporated, Roanoke, VA, USA) for monitoring distributed fiber optics; MOI-130 instrument (Micron Optics, Inc., Atlanta, GA, USA) for monitoring FBG at low frequency; FAE-400 instrument (AFL Global, Duncan, BC, USA) for monitoring FBG at high frequency.
Applsci 15 08748 g003
Figure 4. Setup view: (a) representative structural element from outer tank, 1 m long; (b) lateral view of the element mounted in the test rig for bending load application.
Applsci 15 08748 g004
Figure 5. Optical interrogators: (a) low-frequency MOI sm-130 for FBG; very-high-frequency Redondo for FBG; (b) very low frequency for distributed sensing (OdisiB).
Applsci 15 08748 g005
Figure 6. Optical hydrogen losses for very long exposition at different central wavelengths (courtesy of GhT Photonics s.r.l.).
Applsci 15 08748 g006
Figure 7. Fiber optic temperature signal: (a) the temperature calibration at −70 Celsius for FBG sensor; (b) the temperature signal stability of FBGs during cryogenic tests.
Applsci 15 08748 g007
Figure 8. Fiber optic strain signal: (a) the FBGs’ strain measurements before and after hydrogen and cryogenic exposure under tension loading and unloading; (b) the distributed strain before and after hydrogen and cryogenic exposure during 4 cycles of tension loading and unloading.
Applsci 15 08748 g008
Figure 9. Methodology of integrated monitoring approach by fiber optic sensors and data processing.
Applsci 15 08748 g009
Figure 10. FBG strain slope tracking and first-order derivative analysis; the effects of damage onset are indicated in the dotted boxes.
Applsci 15 08748 g010
Figure 11. FBG dynamic high-strain history (red curve) and static-strain evolution (blue curve) showing synchronization.
Applsci 15 08748 g011
Figure 12. Wavelet decomposition of the biorthogonal 3.1 function at different scale resolutions: (a) scale coefficient cd4 at 400 samples; (b) scale coefficient cd3 at 800 samples; (c) scale coefficient cd2 at 2000 samples; (d) scale coefficient cd1 at 3500 samples.
Applsci 15 08748 g012
Figure 13. Wavelet decomposition energy magnitude (colored bar) for the cd3 coefficient.
Applsci 15 08748 g013
Figure 14. Strain profile from distributed sensing during bending loading and unloading actions. The black and blue curves represent two acquisitions taken during bending load; the red, green, and cyan curves represent two acquisitions taken during unloading after flaw initiation and propagation.
Applsci 15 08748 g014
Figure 15. Detail of the flaw onset on the element and distance from the initial edge.
Applsci 15 08748 g015
Figure 16. FBG static and dynamic cross-correlation (first-order derivative, FOD in blue, and wavelet coefficient decomposition, WCD in red).
Applsci 15 08748 g016
Table 1. Characteristics of the methodologies investigated.
MethodologyApplicabilityProsCons
FBG-static
(single sensor)
Presence of damage
Propagation of damage
Hot-spot monitoring
Cheap
Easy
Local
(unless arrays are used)
FBG-dynamic
(single sensor)
Onset of damage
Presence of damage
Propagation of damage
Hot-spot monitoring
Time-consumingLocal
(unless arrays are used)
Distributed sensingPresence of damage
Propagation of damage
Hot-region monitoring
Diffuse monitoring
Cost-effective
Wide coverage
Installation process
Disclaimer/Publisher’s Note: The statements, opinions and data contained in all publications are solely those of the individual author(s) and contributor(s) and not of MDPI and/or the editor(s). MDPI and/or the editor(s) disclaim responsibility for any injury to people or property resulting from any ideas, methods, instructions or products referred to in the content.