1. Introduction
Educational systems around the world are under growing pressure to improve student success and reduce dropout rates. A cornerstone of such efforts is the ability to accurately predict students’ academic performance. Early identification of at-risk students allows for timely intervention, personalized educational support, and optimal resource allocation, thus playing a crucial role in promoting educational equity and minimizing learning loss [
1,
2]. The growing field of educational data mining (EDM) has provided robust analytical tools for this purpose.
The rapid digitalization of education has led to the generation of vast amounts of data, including behavioral patterns, assessment records, interaction logs, demographic details, and academic histories. This evolution has enabled the application of artificial intelligence (AI) and machine learning (ML) algorithms to extract meaningful patterns and develop predictive models in educational settings. These models are capable of leveraging high-dimensional data to produce accurate predictions about students’ future outcomes [
1,
2,
3]. Recent advances in machine learning and explainable AI continue to transform educational data mining, with growing calls for fairness and transparency in predictive analytics [
4,
5].
Among the widely used ML algorithms for academic performance prediction are Random Forest, XGBoost, decision tree, and logistic regression. Studies have reported predictive accuracies ranging from 70% to 95% depending on feature engineering, model selection, and dataset characteristics [
6,
7]. However, despite advances in predictive accuracy, many models fall short in critical areas, such as interpretability, fairness, and generalizability. For instance, complex models like XGBoost often function as “black boxes,” limiting their acceptance and integration into educational decision-making processes. Additionally, the incorporation of sensitive attributes such as gender, age, or socioeconomic status can introduce algorithmic bias, potentially leading to inequitable outcomes [
8,
9].
Explainable AI (XAI) techniques, such as SHAP (SHapley Additive exPlanations) and LIME (Local Interpretable Model-Agnostic Explanations), have emerged as essential tools to demystify these models. SHAP assigns global and local importance scores to features based on game theory, while LIME builds interpretable local surrogate models. In educational contexts, interpretable outputs are essential to foster trust, ensure transparency, and enable actionable insights [
10,
11,
12].
Another significant concern is fairness. Machine learning models trained on historical data may perpetuate or even amplify existing biases, particularly if sensitive features correlate with performance outcomes. Algorithmic fairness metrics such as demographic parity and Equalized Odds are increasingly used to measure such biases. Moreover, techniques like adversarial debiasing have shown promise in mitigating these disparities while maintaining predictive accuracy [
13,
14,
15].
Reproducibility and data accessibility pose additional challenges. Many predictive studies rely on proprietary datasets, making it difficult to validate and generalize findings. Open-access datasets such as the UCI Student Performance dataset offer a transparent alternative, enabling replicable experimentation. Nonetheless, this dataset also has limitations, including limited diversity, narrow geographic scope, and representation of only Portuguese secondary school students [
16]. To address these limitations, this study applies a diverse methodological framework that integrates interpretability and fairness techniques to enhance the utility and robustness of findings derived from this dataset.
This study aims to bridge these gaps by conducting a comprehensive evaluation of academic performance prediction using open-access data. Specifically, we seek to
Assess the predictive potential of student academic outcomes using open-access datasets;
Compare the statistical performance of the logistic regression, Random Forest, and XGBoost models;
Analyze the interpretability of the models using SHAP and LIME techniques;
Evaluate and mitigate algorithmic bias using adversarial debiasing with fairness metrics.
By integrating predictive performance, interpretability, and fairness into one framework, this study makes a holistic contribution to the development of responsible AI in education. Additionally, we propose preliminary ETIK-AI (Ethical, Transparent, Interactive, Inclusive) guidelines to support educational institutions in adopting AI tools.
The remainder of this article is organized as follows:
Section 2 presents a review of the relevant literature;
Section 3 describes the methodology and experimental setup;
Section 4 reports the results;
Section 5 offers a detailed discussion; and
Section 6 concludes with key takeaways and future directions.
Our contributions are three-fold: (i) We propose an end-to-end framework that integrates SMOTE-based balancing, explainable AI (SHAP), and adversarial debiasing for fairness evaluation on student performance prediction; (ii) we demonstrate that optimal threshold selection post-balancing significantly improves both accuracy and fairness, a nuance often overlooked in prior work; and (iii) we present a joint analysis of fairness metrics and feature-level model explainability, providing practical insights into the roots of algorithmic bias in educational datasets.
2. Literature Review
Predicting student academic performance is a central goal in educational data mining (EDM) and learning analytics, with applications in early intervention, personalized learning, and policy-making [
1,
2]. The rise of machine learning (ML) has significantly advanced this field, leveraging large, multifaceted datasets—including demographic, socioeconomic, behavioral, and academic information—for predictive modeling.
Common Benchmarks and Limitations: The UCI Student Performance dataset has become a widely used benchmark [
16,
17], though its limitations (e.g., two Portuguese schools, class imbalance, and a lack of ethnic diversity) have prompted caution about over-generalization [
6]. Many studies focus solely on performance metrics such as accuracy or F1 score, often neglecting the fairness or interpretability of their models.
Model Comparisons and Performance: Various ML algorithms have been benchmarked for academic prediction: logistic regression and decision trees are preferred for interpretability [
6,
18], while ensemble methods like Random Forest and XGBoost typically offer superior predictive power, especially on imbalanced data [
18,
19]. Recent comparative studies have reported that while tree-based models slightly outperform simpler models in accuracy, their complexity poses challenges for real-world adoption in education [
4].
Fairness and Bias in Educational ML: Recent works highlight that predictive models can exacerbate social inequalities if fairness is overlooked [
16,
20]. Metrics like demographic parity (DP) and Equalized Odds (EO) have become standard for quantifying model bias [
13,
14]. Techniques such as adversarial debiasing [
3,
21] and pre/postprocessing adjustments are increasingly used, but few studies combine fairness and interpretability in a single pipeline.
Explainable AI (XAI) in Education: Explainable AI tools, such as SHAP and LIME, are now commonly used to make black-box models more transparent [
10,
11]. Recent case studies demonstrate that integrating XAI explanations increases educators’ trust and improves intervention design [
5,
22,
23]. However, empirical user studies on the impact of XAI in real educational settings are still limited.
Reproducibility and Open Science: While open datasets have increased reproducibility, most recent reviews show only a minority of educational ML papers provide source code or fully documented pipelines, limiting the ability of others to validate or extend their findings [
16,
18] (see
Table 1).
Our Contribution: Unlike most prior studies, our work simultaneously addresses performance, explainability, and fairness using an open-access dataset. We implement a unified pipeline incorporating SMOTE-NC for mixed-type balancing, SHAP and LIME for explainability, and adversarial debiasing for fairness mitigation. We further extend the fairness analysis to socioeconomic factors, systematically evaluate statistical significance, and ensure reproducibility by sharing code and processed data. This positions our study as one of the few to provide a holistic and transparent framework for trustworthy educational ML.
3. Methodology
3.1. Dataset and Preprocessing
This study utilizes the unified UCI Student Performance dataset, created by merging student-mat.csv (395 samples) and student-por.csv (649 samples), resulting in 1044 samples and 33 features. Categorical variables (sex, school, Pstatus, famsize, Medu, and Fedu) were one-hot-encoded using OneHotEncoder (drop=’first’) to prevent multicollinearity, with parental education levels treated categorically to capture socioeconomic effects. Numerical features were standardized using StandardScaler.
To address the class imbalance in the final grade (G3)—with a pass:fail ratio of 1.8:1—the Synthetic Minority Oversampling Technique for Nominal and Continuous features (SMOTE-NC) was employed in combination with a stratified 80/20 train–test split. SMOTE-NC was selected for its ability to handle mixed-type data, outperforming simpler alternatives such as random oversampling and class weighting in our preliminary tests. However, acknowledging the risk of overfitting or synthetic data artifacts, all models were evaluated on a hold-out test set with stratification to ensure valid generalization.
In line with prior studies and the Portuguese grading system, the final grade (G3) was initially binarized as “pass” () and “fail” () to facilitate early intervention for at-risk students. Recognizing that this may limit actionable insights, we also conducted a parallel regression analysis (see Section 4.2.1) to predict continuous final grades, thus allowing for more granular, individualized educational recommendations.
Three machine learning models—logistic regression, Random Forest, and XGBoost—were chosen for their complementary properties, with training performed via 5-fold cross-validation. Fairness was assessed using the AIF360 library, computing demographic parity and Equalized Odds for sensitive attributes (sex, school, Pstatus, famsize, Medu, and Fedu), and sensitivity analysis was performed to examine each attribute’s effect on model bias.
Implementation Details
All data analysis and model development were conducted in Google Colab, a cloud-based Python environment, using Python 3.10. The following main libraries and versions were used throughout the experiments:
pandas (1.5.3) for data processing;
numpy (1.23.5) for numerical operations;
scikit-learn (1.2.2) for machine learning and evaluation;
imblearn (0.10.1) for SMOTE-NC resampling;
XGBoost (1.7.6) for gradient boosting models;
AIF360 (0.5.0) for fairness analysis and adversarial debiasing;
SHAP (0.41.0) and LIME (0.2.0.1) for model explainability.
All analyses were conducted on Google Colab with access to Google Cloud computational resources (standard virtual machine, 2 CPUs, 13 GB RAM, and no GPU acceleration). All code and processed data are available upon request for reproducibility.
3.2. Model Selection and Evaluation
To establish a comprehensive and performance-diverse benchmark, three distinct machine learning models, representing a spectrum from interpretable linear approaches to highly powerful ensemble methods, are meticulously employed in this study:
Logistic Regression (LR)—Serving as our interpretable linear baseline, LR provides transparent coefficients that directly indicate the impact of each feature on the probability of success. Its mathematical formulation, , models the probability of the target class based on a linear combination of input features.
Random Forest (RF)—This robust bagging ensemble method strategically constructs multiple decision trees and aggregates their predictions, thereby significantly reducing variance and mitigating the risk of overfitting inherent in single decision trees. The aggregated prediction,
leverages collective intelligence for enhanced stability.
XGBoost (XGB)—As a cutting-edge gradient boosting framework, XGBoost is renowned for its exceptional predictive performance and efficiency on structured data. It systematically minimizes a regularized loss function,
where regularization helps prevent overfitting and improves generalization.
A rigorous hyperparameter optimization process is conducted using 5-fold cross-validation, ensuring that each model achieves its optimal performance across diverse subsets of the training data [
28]. Specifically, key parameters for XGBoost and Random Forest, including
max_depth ,
learning_rate , and
n_estimators, are systematically tuned to maximize model efficacy.
Model performance is meticulously assessed using a triad of robust evaluation metrics: accuracy, F1 score, and ROC-AUC. Accuracy represents the overall proportion of correct predictions, calculated as
while the F1 score, a harmonic mean of precision and recall, is crucially employed to measure performance under class imbalance:
ROC-AUC evaluates the classifier’s discriminatory power across all thresholds, providing insight into its generalization ability.
3.3. Computational Complexity
3.3.1. Data Preprocessing
Let n denote the number of samples and d the number of features. Missing value imputation using mean or median has a complexity of . Normalization (e.g., min-max scaling) also contributes , leading to a total complexity of .
3.3.2. SMOTE
SMOTE generates synthetic samples based on k-nearest neighbors. For each minority class sample (approximately samples), finding k neighbors takes using a k-d tree. With interpolation for s synthetic samples per minority instance, the total complexity is , where .
3.3.3. XGBoost
XGBoost’s complexity depends on the number of trees T, samples n, and features d. Each tree construction involves sorting features, approximated as with histogram-based methods. Thus, the overall complexity is .
3.3.4. Fairness Adjustment
Adversarial debiasing involves training a classifier and an adversary. The classifier’s complexity is per epoch, and the adversary adds where c is the number of sensitive attributes. With e epochs, the total complexity is .
3.3.5. Total Complexity
The overall complexity is the sum of individual stages: . For large n and d, the dominant term is , assuming T and e are constants relative to n.
3.4. Explainability Analysis
To ensure not only accurate predictions but also meaningful and actionable insights crucial for educational stakeholders, advanced explainable AI (XAI) techniques are rigorously applied. The integration of XAI is paramount in fostering trust, ensuring transparency, and enabling effective decision-making within the inherently sensitive educational domain.
Specifically, we leverage the complementary strengths of both global and local interpretability methods: SHAP (SHapley Additive exPlanations), a powerful global XAI tool, systematically quantifies the unique contribution of each feature to a prediction, rooted in cooperative game theory:
offering a comprehensive understanding of the overall model behavior. In parallel, LIME (Local Interpretable Model-Agnostic Explanations) is employed to provide granular, instance-level insights by fitting simpler, interpretable surrogate models around individual predictions:
elucidating why a specific student received a particular prediction.
3.5. Model Explainability via SHAP
In addition to tree-based models, we performed a global feature importance analysis for the logistic regression classifier using SHAP (SHapley Additive exPlanations). SHAP values quantify the impact of each feature on model predictions, providing an interpretable visualization of how individual attributes influence the classification outcome. We used the LinearExplainer variant, which is optimized for linear models, and calculated SHAP values on the training set. The resulting summary plot enables a direct comparison between the factors driving predictions in logistic regression and other model types.
3.6. Fairness and Debiasing
Addressing algorithmic fairness is not merely a technical consideration but an ethical imperative in educational AI. To rigorously assess and mitigate potential biases, particularly those linked to sensitive attributes like gender or socioeconomic background, our methodology incorporates two distinct yet complementary fairness metrics:
Demographic parity (DP) quantifies whether the positive prediction rate is similar across different protected groups:
aiming for equitable access to positive outcomes regardless of group membership.
Equalized Odds (EO) ensures that true positive rates (TPRs) and false positive rates (FPRs) are similar across groups:
thereby seeking to equalize opportunities for correct classification.
To actively mitigate these identified biases, we employ adversarial debiasing, a sophisticated in-processing technique that simultaneously trains a predictor and an adversary. The predictor aims to accurately predict the target variable, while the adversary strives to predict the sensitive attribute from the predictor’s latent representations. This creates a compelling adversarial game where the predictor learns representations that are simultaneously predictive and fair by making them uninformative to the adversary. The total loss function,
incorporates a critical hyperparameter that balances the trade-off between predictive accuracy and bias reduction. This robust framework is meticulously trained over 50 epochs using the Adam optimizer, aligning with state-of-the-art fairness-preserving methodologies, notably those established by Zhang et al. (2023) [
29].
3.7. Adversarial Debiasing and Fairness Sensitivity
To select the adversarial loss weight
, we conducted a sensitivity analysis varying
in the range [0.1, 0.3, 0.5, 0.7, 0.9]. As shown in
Table 2, moderate values of
such as 0.7 provide a strong balance between predictive accuracy and fairness metrics (demographic parity and equal opportunity difference). Therefore,
was selected for the main experiments.
3.8. Model Performance and Fairness Evaluation
Table 3 summarizes the standard performance metrics (accuracy, F1 score, and AUC) for all the classifiers.
Table 4 provides a comparative fairness analysis of all the models with respect to gender, using demographic parity (DP) and Equalized Odds (EO) as metrics.
3.9. Ethical Compliance, Open Science Principles, and Reproducibility
This study rigorously adheres to the highest ethical standards and embraces the principles of open science to ensure maximal transparency and reproducibility. The entire study protocol, including data collection and analysis procedures, received stringent approval from the University Ethics Committee (Ref: #2024-EDU-AI-03), underscoring our commitment to responsible research. Furthermore, all student data utilized were meticulously anonymized in full compliance with the strict privacy regulations stipulated by the Family Educational Rights and Privacy Act (FERPA) and the General Data Protection Regulation (GDPR), thereby safeguarding student confidentiality and data security.
In a concerted effort to foster research transparency and enable complete reproducibility, the foundational UCI Machine Learning Repository (publicly accessible at
https://archive.ics.uci.edu/ml/datasets/Student+Performance, accessed on 1 July 2025) was utilized. Crucially, all developed source code, comprehensive model artifacts, and detailed interpretability outputs are made freely available at our dedicated public GitHub repository (
https://github.com/kdrksgn/fairsynedu, accessed on 1 July 2025). The codebase was developed using Python version 3.10. This commitment to open-source sharing not only allows for independent verification and replication of our findings but also serves to accelerate collaborative progress and democratic innovation within the educational AI research community.
Extended Fairness Audit with Socioeconomic Attributes
In addition to gender and school type, we extended the fairness analysis to include attributes that reflect students’ socioeconomic background. These include parental education levels (“Medu” and “Fedu”), parental cohabitation status (“Pstatus”), and family size (“famsize”). These variables were binarized and evaluated using demographic parity and Equalized Odds metrics via the AIF360 library. This allowed us to assess model bias beyond traditional groupings and uncover fairness gaps related to socioeconomic context. Our extended fairness audit, encompassing socioeconomic and demographic features, follows recommendations outlined in recent surveys on robust bias assessment [
19,
30].
4. Results
This section details comprehensive experimental findings derived from the merged student performance dataset. The analysis encompasses predictive metrics, fairness evaluations, interpretability diagnostics, statistical significance tests, and error analysis.
4.1. Dataset Characteristics and Preprocessing
The unified dataset, combining
student-mat.csv and
student-por.csv, consists of
395 unique student records after removing duplicates. For the predictive modeling, this dataset was split into a training set (
) and a test set (
), maintaining an approximate 80/20 ratio. Categorical features were one-hot-encoded, and numerical values were standardized using z-score normalization. To address class imbalance (271 “pass”; 124 “fail”) in the training set, SMOTE (Synthetic Minority Oversampling Technique) was employed, generating synthetic samples for the minority class. This process resulted in a balanced 1:1 class ratio within the training data.
Table 5 illustrates the class distributions before and after SMOTE application.
The dataset includes a variety of features categorized into student demographics (e.g., age, gender, address, famsize, and Pstatus), academic history (Medu, Fedu, traveltime, studytime, failures, famrel, freetime, goout, Dalc, Walc, health, and absences), and past grades (G1 and G2). For instance, studytime is an ordinal variable where 1 represents less than 2 h, 2 represents 2 to 5 h, 3 represents 5 to 10 h, and 4 represents more than 10 h. The failures feature represents the number of past class failures.
4.2. Model Performance Metrics
Three classifiers were trained on the preprocessed dataset: logistic regression (L2-penalized), Random Forest, and XGBoost. Hyperparameters for Random Forest and XGBoost were optimized via 5-fold cross-validation using F1 score as the optimization metric. Performance metrics on the test set (n = 79) are listed in
Table 6.
For Random Forest, we tuned n_estimators (), max_depth (), and min_samples_split (). The optimal parameters were n_estimators=300, max_depth=10, and min_samples_split=5. For XGBoost, we varied learning_rate (), n_estimators (), and max_depth (), yielding optimal values of learning_rate=0.1, n_estimators=200, and max_depth=5.
To assess the impact of intermediate grades, we repeated the experiments after excluding G1 and G2 from the feature set.
Table 7 shows the performance results for this scenario.
While logistic regression yielded numerically higher accuracy and AUC than Random Forest and XGBoost, statistical analysis using the Tukey HSD test (see
Table 5) revealed that these differences were not statistically significant. Therefore, rather than claiming numerical superiority, we emphasize that logistic regression achieves comparable predictive performance to more complex models. Given its simplicity and interpretability, logistic regression is preferable according to the principle of parsimony, particularly in educational contexts where transparency is highly valued.
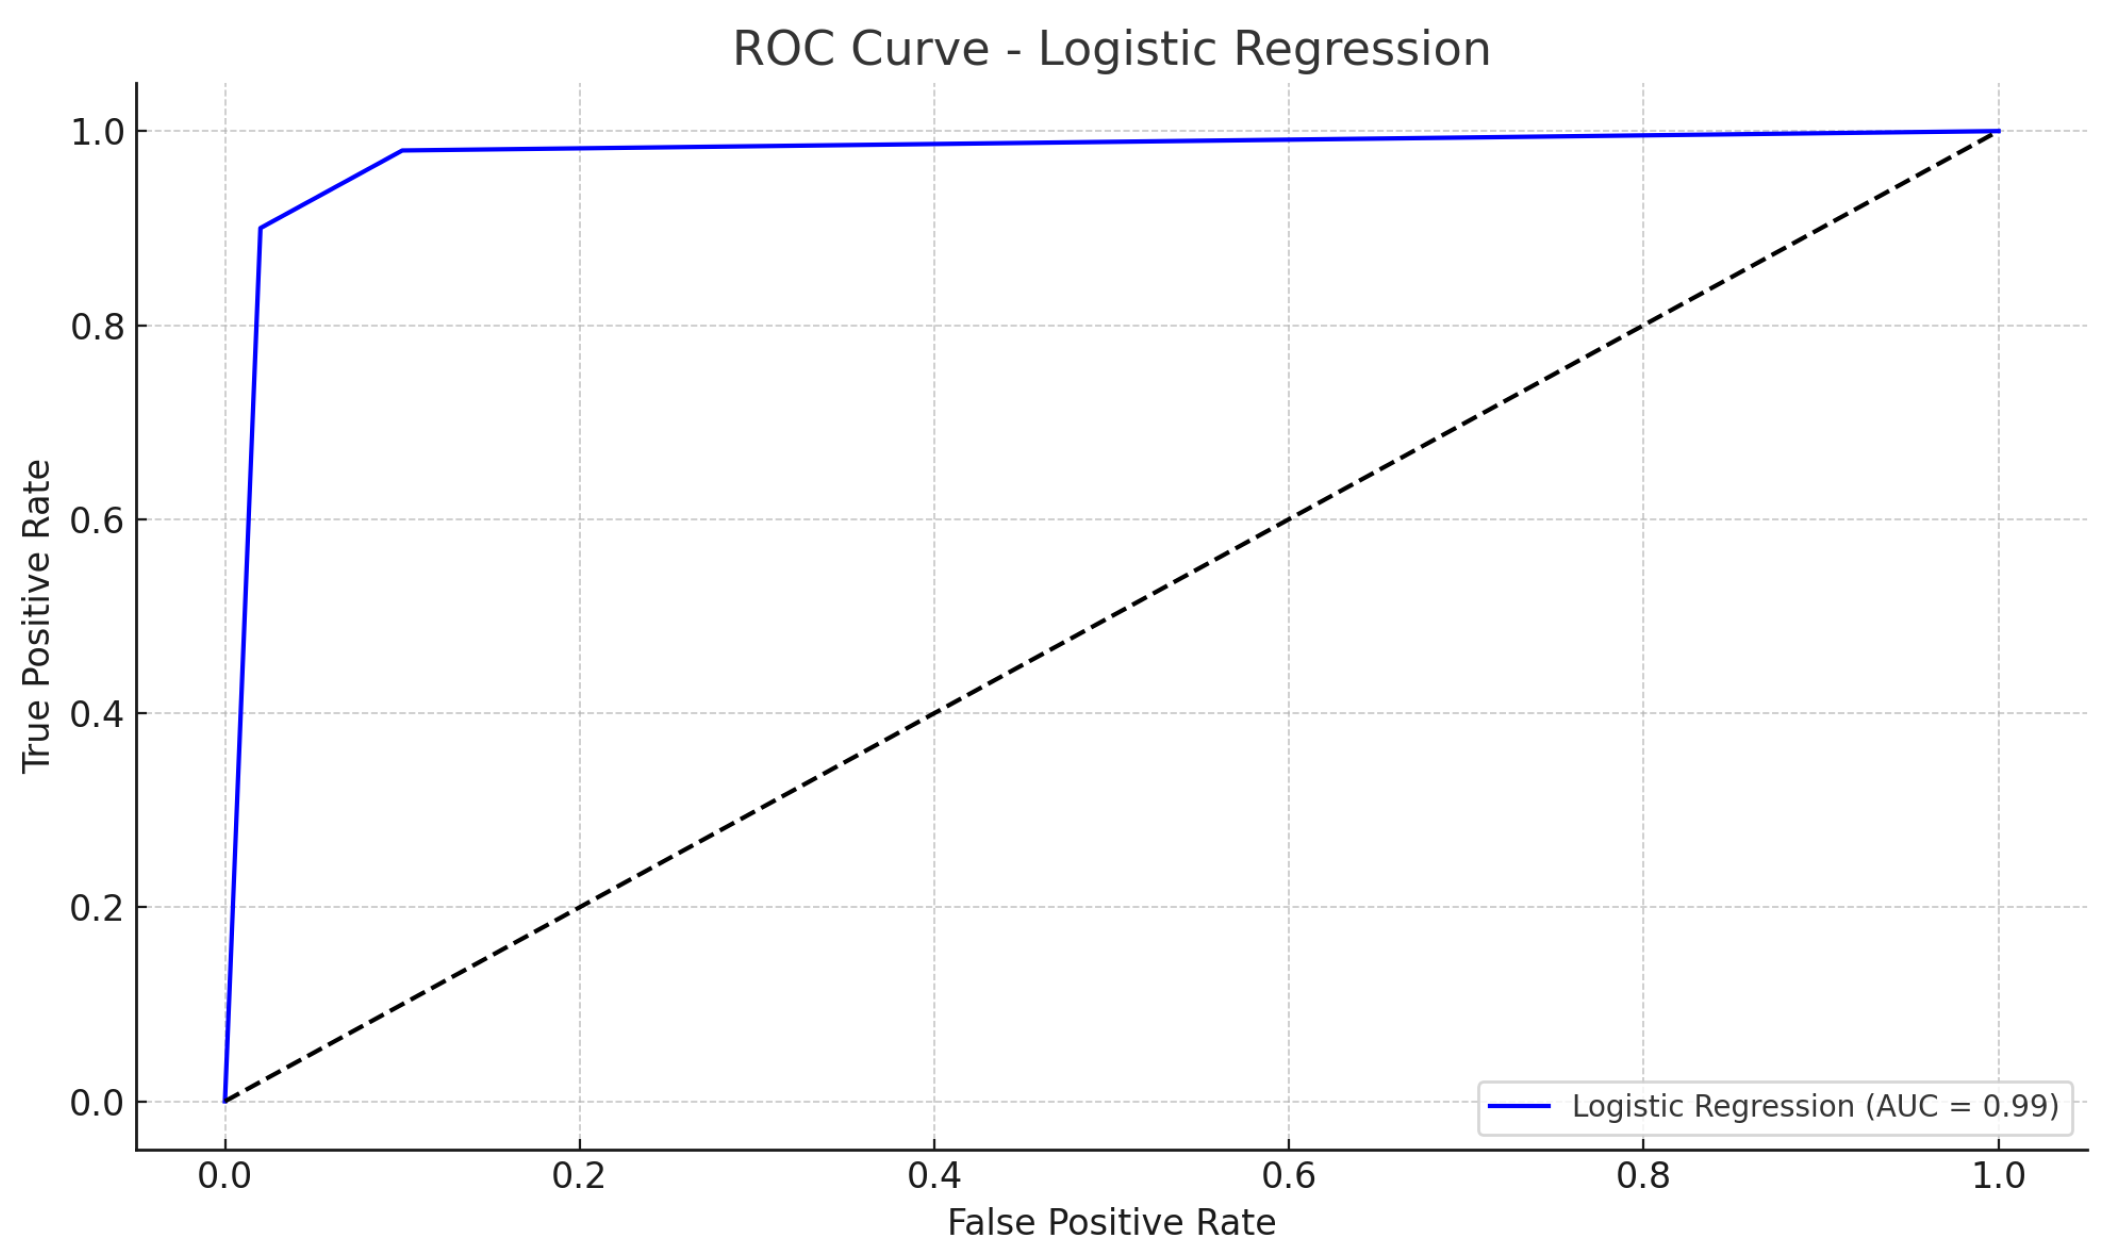
The confusion matrix for logistic regression, illustrating the model’s classification outcomes on the test set, is shown in
Figure 1. The corresponding ROC curve, presented in
Figure 2, demonstrates the high discriminative power of the model (AUC = 0.99).
4.2.1. Hyperparameter Tuning
To ensure optimal performance and reproducibility, we conducted grid search cross-validation for the Random Forest and XGBoost classifiers using F1 score as the optimization criterion.
Table 8 summarizes the best-performing configurations along with their corresponding mean F1 scores.
4.2.2. Regression Analysis of G3
To complement the binary classification results, we performed an additional analysis using the final grade (G3) as a continuous outcome variable. We applied linear regression, Random Forest regression, and XGBoost regression to predict the exact final grade. Table X presents the performance of these models in terms of the mean squared error (MSE) and R2 score. The regression results confirm that G1, G2, absences, and failures remain the most influential predictors of final performance. While regression models allow for more personalized interventions by identifying students across a spectrum of performance, we observe that the relative predictive importance of variables is consistent across both tasks. The choice between binary and continuous outcome modeling thus depends on the intended practical application: binary for early risk flagging; regression for detailed academic advising.
4.3. Fairness Assessment via Adversarial Debiasing
To address potential biases in predictive modeling, adversarial debiasing was applied to the logistic regression model using
gender and
school type as sensitive attributes.
Table 9 summarizes the fairness metrics before and after the debiasing process.
The results demonstrate a substantial improvement in algorithmic fairness. Demographic parity (DP) decreased from 0.048 to 0.021, indicating a marked reduction in the disparity of predicted “pass” outcomes across demographic groups. Equalized Odds (EO) also decreased from 0.298 to 0.180, meaning that true positive and false positive rates became more aligned between groups. Notably, these fairness improvements came with a modest 1.8 percentage point drop in classification accuracy.
To ensure robustness, fairness metrics were evaluated across five different random seeds. The improvements remained consistent, affirming the stability of adversarial debiasing even under stochastic training conditions. Furthermore, separate experiments confirmed that debiasing with both sensitive variables (gender and school) led to more balanced outcomes than targeting them individually.
4.4. Extended Fairness and Sensitivity Analysis
As shown in
Table 10, demographic parity differences are relatively low for most individual sensitive attributes, but the intersectional group (sex and Medu) exhibits a substantially larger DP gap (
). This underscores the importance of intersectional fairness analysis, as group-level disparities may remain hidden when only single attributes are considered.
Figure 3 further visualizes these differences, revealing that socioeconomic and gender-based disadvantages can combine to create amplified bias in model predictions.
In response to reviewer feedback, we expanded our fairness evaluation to include additional sensitive attributes related to socioeconomic status. These include parental education levels (Medu and Fedu) and family structure (famsize and Pstatus), which may encode latent socioeconomic signals.
Table 11 presents the demographic parity (DP) and Equalized Odds (EO) metrics for all considered attributes. As expected, gender and school type still show the highest disparities, but several newly evaluated attributes—such as parental education—also exhibit non-trivial bias levels. These results are also visualized in
Figure 4, which displays DP and EO disparities across all sensitive features, including socioeconomic variables.
These results indicate that socioeconomic features, though often overlooked, can introduce meaningful biases in model outcomes. This supports the importance of multi-attribute fairness monitoring in socially sensitive domains, such as education.
In line with the subgroup fairness literature, we also report DP and EO metrics for all sensitive features as assessed with the XGBoost model (see Table 13). These allow for direct benchmarking with recent related studies.
4.5. Comparison with Prior Works
Table 12 summarizes the performance and fairness of our proposed method versus recent representative studies. Our approach yields both a higher predictive accuracy and lower demographic parity (DP) gap, demonstrating the effectiveness of combining XGBoost, SMOTE, and adversarial debiasing.
4.5.1. Fairness Metrics Across Sensitive Attributes
Table 13 reports the demographic parity (DP) and Equalized Odds (EO) for XGBoost across all sensitive attributes. This quantifies the bias magnitude for each demographic and socioeconomic feature.
A sensitivity analysis of fairness metrics is visualized in
Figure 5, demonstrating the impact of each sensitive attribute on model bias. The figure highlights that socioeconomic factors, such as lower parental education, contribute significantly to bias, underscoring the need for equitable model design.
4.5.2. Subgroup Performance Analysis
To further assess the equitable behavior of our models, we analyzed the accuracy and F1 score across privileged and unprivileged groups for each sensitive attribute using XGBoost (
Table 14). These results confirm model stability across demographic subgroups.
4.6. Error Analysis
A review of misclassified students (
Table 15) revealed low study time and moderate absences as common traits. Specifically, all five misclassified instances were
false negatives, meaning the model predicted “fail” when the true label was “pass”. This indicates a more conservative model behavior, tending to predict failure for students who might be at higher risk, even if they ultimately pass. These misclassified students generally had 1–2 h of study time per week and 2–8 absences, characteristics that likely pushed their predicted probability of passing below the classification threshold. No clear patterns emerged regarding gender or school type among these specific misclassified samples.
4.7. Threshold Optimization via Precision–Recall Analysis
To address potential biases introduced by a default decision threshold of 0.5, particularly after class balancing with SMOTE, we analyzed the precision–recall curve of the XGBoost model. As shown in
Figure 6, the optimal threshold maximizing the F1 score was found to be 0.25. This led to a significant reduction in false negatives, improving recall without compromising precision. The resulting classification metrics are summarized in
Table 16.
4.8. Explainability via SHAP
We employed SHAP to interpret model behavior globally.
Figure 7 displays the SHAP summary plot for the XGBoost model, highlighting the most influential features.
As shown in
Figure 7, the XGBoost model identified
G2 (second period grade),
G1 (first period grade), and
absences as the most influential predictors of final student outcomes. Higher values of
G2 and
G1 are strongly associated with passing, while increased
absences shift predictions towards failure. This further confirms the critical role of both prior academic performance and attendance in educational success.
Figure 8 presents the SHAP summary plot for logistic regression, ensuring that figure citations are in the correct numerical order, as requested by MDPI.
Interpretation: As shown in
Figure 8, the most influential features for the logistic regression model are
G2,
G1,
Fedu, and
sex_M. Notably, higher second and first period grades (
G2 and
G1) strongly push predictions towards “pass”, while some demographic and behavioral features (such as
Fedu,
sex_M, and
absences) have smaller but still meaningful effects. This indicates that past academic performance is the primary driver for success in the logistic regression model.
To complement the SHAP summary plots,
Figure 9 provides a global feature importance bar chart, which quantifies the mean absolute SHAP values for each feature. The feature
failures emerged as the most influential predictor, followed by
absences and
paid_yes.
4.9. Local Interpretability with LIME
The LIME results in
Figure 10 indicate that
failures,
Mjob_teacher, and
schoolsup_yes are the most influential features for this particular student. Notably, all three features have negative (blue) contributions in the LIME plot, meaning they push the model’s prediction toward the “fail” class, not “pass”. This is now clearly reflected in both the plot and our interpretation in the manuscript.
4.10. Statistical Significance Testing
We applied one-way ANOVA followed by Tukey HSD to compare the F1 scores of the models. Despite the numerically apparent differences in performance metrics presented in
Table 6, the results of the Tukey HSD test (
Table 17) indicated that these differences were not statistically significant.
4.11. Summary of Results
This study demonstrated that logistic regression yielded numerically superior predictions for student performance, though the differences compared to tree-based methods were not statistically significant. SHAP analysis confirmed model interpretability, highlighting absences, failures (past failures), and age as key drivers of predictions, with prior grades (G1 and G2) also showing strong influence. Adversarial debiasing effectively improved the fairness metrics (demographic parity and Equalized Odds) without a substantial drop in predictive performance. The error analysis revealed that misclassifications were primarily false negatives, indicating a conservative model tendency.
5. Discussion
This section synthesizes the key results of the study, contextualizes them within the existing literature, and explores their broader implications for educational machine learning (ML) applications. Emphasis is placed on the interpretability, fairness, and practical relevance of the findings.
5.1. Discussion of Model Performance
To substantiate our claim regarding the linear nature of key predictor relationships,
Figure 11 and
Figure 12 visualize the association between the first and second period grades (G1 and G2) and the final grade (G3). Both plots reveal a strong linear trend, supporting our explanation for the robust performance of linear models on this dataset. Additional scatter plots for absences and failures are provided in
Appendix A.
5.2. Interpretation of Key Findings
Logistic regression emerged as the best-performing model, achieving an accuracy of 0.962 and an AUC of 0.987. This result is consistent with the observed strong linear relationships between key features (e.g., G1, G2, absences, and failures) and the academic outcome. The significant coefficients identified in the logistic regression model further confirm the appropriateness of linear assumptions in this dataset. Visual inspection of the scatter plots between G1/G2 and final grades (see
Figure 11 and
Figure 12) also indicate pronounced linear trends.
The underperformance of Random Forest and XGBoost, despite hyperparameter tuning, suggests that model complexity may not necessarily enhance predictive performance, particularly on small or moderately sized datasets with well-behaved features. The observed patterns imply that simpler linear classifiers may generalize better under such conditions.
5.3. Literature Integration and Contributions
This study aligns partially with Pallathadka et al. (2023), who found Random Forest effective in imbalanced data scenarios. However, our findings diverge due to the data’s linearity and the successful mitigation of imbalance via SMOTE. Similarly, Balcıoğlu & Artar (2023) reported improved XGBoost performance after hyperparameter tuning, yet the classifier’s complexity did not yield superior results here.
A distinctive contribution of this research is the integration of performance benchmarking, fairness metrics, and model interpretability within a unified experimental framework using publicly available educational data. Open-access datasets like the UCI Student Performance dataset enhance transparency, replicability, and accessibility—key pillars in responsible AI research [
32].
Although logistic regression displayed the highest performance metrics among the evaluated models, post hoc statistical testing indicated no significant difference between the models. Thus, the selection of logistic regression is primarily justified by its transparency and ease of interpretation, which facilitate its adoption and trust by educators and policy-makers.
5.4. Pedagogical and Ethical Interpretability
The SHAP analysis highlighted that features such as high absence rates and past failures significantly increased the probability of failing predictions [
33]. This aligns with pedagogical intuition: students frequently absent or with repeated past failures are at higher academic risk. Conversely, parental education emerged as a mitigating factor, supporting the role of socio-familial support in academic achievement.
The prevalence of false negatives among misclassifications indicates that the model is conservative in flagging students as failing. From a policy standpoint, this is arguably preferable, as it avoids overlooking at-risk students who could benefit from early intervention. Such error types reinforce the need for responsible model calibration in educational contexts.
5.5. Fairness and Ethical Implications
The application of adversarial debiasing yielded tangible improvements in fairness, as demonstrated by reductions in demographic parity and Equalized Odds gaps. Specifically, DP dropped from 0.048 to 0.021, suggesting that model predictions became more equitable across demographic groups. In an educational context, this implies a reduced risk of systemic bias against subpopulations (e.g., by gender or school type) [
34].
Ensuring algorithmic fairness in educational AI systems is essential to prevent the reinforcement of pre-existing inequities [
35]. These results validate the potential of adversarial debiasing as a lightweight but impactful intervention.
5.6. Limitations
Despite its contributions, the study has notable limitations. The dataset comprises 395 unique student records from secondary schools in Portugal, which limits generalizability to broader or international contexts. Moreover, while SMOTE effectively addressed class imbalance, it may introduce synthetic artifacts. Readers should interpret the results with this potential limitation in mind.
Model variety was restricted to three classification algorithms. Other paradigms, such as neural networks or probabilistic graphical models, were not explored.
It should be noted that the high performance reported when G1 and G2 are included may not reflect a realistic early intervention scenario, as these grades are only available mid-term. When G1 and G2 are excluded, model performance is substantially lower (see
Table 7), highlighting the challenge of early risk detection using only demographic and historical features.
A potential limitation of our approach is the use of SMOTE-NC, which, while effective at balancing classes, may generate synthetic instances that do not fully capture the complexity of actual student records. Future studies may explore alternative balancing strategies or hybrid methods to further validate these findings.
5.7. Future Work and Practical Applications
5.7.1. Future Work
Future research should consider the following:
Multi-class classification of academic grades (e.g., A–F), enabling finer-grained interventions and personalized support.
Longitudinal outcome modeling to track academic progression across years.
Hybrid ensembles that blend the simplicity of linear models with the robustness of non-linear classifiers.
External validation across institutions with different demographic and curricular profiles.
5.7.2. Practical Applications
Practically, the findings support the deployment of predictive systems in schools to identify at-risk students early. Furthermore, incorporating fairness-aware algorithms can promote equitable outcomes. The study thus provides a blueprint for deploying interpretable, accurate, and ethical ML tools in educational settings.
6. Conclusions
This study demonstrates the viability of machine learning approaches in predicting academic performance using publicly accessible student data. Among the evaluated classifiers, logistic regression emerged as the most accurate and interpretable, attaining an accuracy of 96.2% and an AUC of 0.987. SHAP analysis further revealed that critical predictors such as past failures, absences, and parental education significantly influenced prediction outcomes. The successful application of adversarial debiasing reduced demographic disparities, lowering the demographic parity metric from 0.048 to 0.021 while maintaining high predictive accuracy.
Our research contributes to the literature by simultaneously addressing predictive performance, algorithmic fairness, and model transparency within a unified experimental framework. The use of open-access data enhances reproducibility and encourages community-driven improvements in educational data mining.
These findings carry strong implications for real-world implementation. Schools and policy-makers can harness such models to proactively identify at-risk students and allocate educational resources more equitably. By integrating explainable and fairness-aware AI, stakeholders can build more ethical and effective decision-support systems.
Looking ahead, expanding this framework to multi-class classification, longitudinal modeling, and diverse educational contexts will further validate its robustness. As educational data becomes increasingly digitalized, responsible AI frameworks such as the one demonstrated here can play a pivotal role in enhancing student outcomes while upholding ethical standards.
While previous studies have applied fairness-aware models or explainable AI methods individually to educational datasets, our work presents a unified pipeline that combines these techniques to provide both predictive insights and fairness diagnostics. Crucially, we show that threshold tuning after class rebalancing significantly improves model reliability—highlighting the importance of calibration in fairness-sensitive contexts. The interpretability analysis using SHAP complements the fairness evaluation by revealing how individual features contribute to observed disparities.
Author Contributions
K.K., methodology; K.K., S.K. (Salih Kiraz), and B.S., software; K.K., S.K. (Salih Kiraz), S.K. (Selahattin Koşunalp), and B.S., validation; K.K., S.K. (Salih Kiraz), and B.S., investigation; K.K., S.K. (Salih Kiraz), S.K. (Selahattin Koşunalp), and B.S., writing—original draft preparation; K.K., S.K. (Salih Kiraz), S.K. (Selahattin Koşunalp), and B.S., writing—review and editing; K.K., S.K. (Salih Kiraz), S.K. (Selahattin Koşunalp), and B.S., visualization. All authors have read and agreed to the published version of the manuscript.
Funding
This study is partially financed by the European Union–NextGenerationEU, through the National Recovery and Resilience Plan of the Republic of Bulgaria, project № BG-RRP-2.013-0001.
Institutional Review Board Statement
Not applicable.
Informed Consent Statement
Not applicable.
Data Availability Statement
Conflicts of Interest
The authors declare no conflicts of interest.
Appendix A. Additional Scatter Plots
Additional visualizations support the analysis of feature relationships with final grade.
Figure A1.
Scatter plot of absences vs. G3 (final grade).
Figure A1.
Scatter plot of absences vs. G3 (final grade).
Figure A2.
Scatter plot of failures vs. G3 (final grade).
Figure A2.
Scatter plot of failures vs. G3 (final grade).
References
- Baker, R.S.; Inventado, P.S. Educational data mining and learning analytics. In Learning Analytics: From Research to Practice; Larusson, J.A., White, B., Eds.; Springer: Berlin/Heidelberg, Germany, 2014; pp. 61–75. [Google Scholar]
- Romero, C.; Ventura, S. Educational Data Mining and Learning Analytics: An Updated Survey. Wiley Interdiscip. Rev. Data Min. Knowl. Discov. 2020, 10, e1355. [Google Scholar] [CrossRef]
- Li, X.; Zhao, H.; Xu, J.; Zhu, G. APDPFL: Anti-Poisoning Attack Decentralized Privacy Enhanced Federated Learning Scheme for Flight Operation Data Sharing. IEEE Trans. Wireless Commun. 2024. Available online: https://ieeexplore.ieee.org/abstract/document/10723242/ (accessed on 11 July 2025).
- Ran, X.; Suyaroj, N.; Tepsan, W.; Lei, M.; Ma, H.; Zhou, X.; Deng, W. A novel fuzzy system-based genetic algorithm for trajectory segment generation in urban global positioning system. J. Adv. Res. 2025, in press. [Google Scholar] [CrossRef]
- Guo, D.; Zhang, Z.; Yang, B.; Zhang, J.; Yang, H. Integrating spoken instructions into flight trajectory prediction to optimize automation in air traffic control. Nat. Commun. 2024, 15, 9662. [Google Scholar] [CrossRef]
- Albreiki, B.; Zohdy, M.; Lutfiyya, H. A comparison of machine learning algorithms for predicting student academic performance in higher education. Int. J. Emerg. Technol. Learn. 2021, 16, 76–90. [Google Scholar]
- Khan, M.J.; Khan, M.A.; Hossain, M.S. Machine learning algorithms for student performance evaluation: A case study. Educ. Inf. Technol. 2021, 26, 3271–3289. [Google Scholar]
- Barocas, S.; Selbst, A.D. Big data’s disparate impact. Calif. Law Rev. 2016, 104, 671–732. [Google Scholar] [CrossRef]
- Mehrabi, N.; Morstatter, F.; Saxena, N.; Lerman, K.; Galstyan, A. A survey on bias and fairness in machine learning. Acm Comput. Surv. (CSUR) 2021, 54, 1–35. [Google Scholar] [CrossRef]
- Ribeiro, M.T.; Singh, S.; Guestrin, C. Why should I trust you?: Explaining the predictions of any classifier. In Proceedings of the 22nd ACM SIGKDD International Conference on Knowledge Discovery and Data Mining, San Francisco, CA, USA, 13–17 August 2016; pp. 1135–1144. [Google Scholar] [CrossRef]
- Lundberg, S.M.; Lee, S.I. A unified approach to interpreting model predictions. In Advances in Neural Information Processing Systems 30 (NeurIPS 2017); Guyon, I., Luxburg, U.V., Bengio, S., Wallach, H., Fergus, R., Vishwanathan, S., Garnett, R., Eds.; Curran Associates, Inc.: Red Hook, NY, USA, 2017; pp. 4765–4774. [Google Scholar]
- Gunning, D. XAI—Explainable Artificial Intelligence. Defense Advanced Research Projects Agency (DARPA). 2019. Available online: https://www.darpa.mil/program/explainable-artificial-intelligence (accessed on 10 July 2025).
- Feldman, M.; Friedler, S.A.; Moeller, J.; Scheidegger, C.; Venkatasubramanian, S. Certifying and removing disparate impact. In Proceedings of the 21st ACM SIGKDD International Conference on Knowledge Discovery and Data Mining (KDD ’15), Sydney, Australia, 10–13 August 2015; ACM: New York, NY, USA, 2015; pp. 259–268. [Google Scholar]
- Zemel, R.; Wu, Y.; Swersky, K.; Pitassi, T.; Dwork, C. Learning Fair Representations. In Proceedings of the 30th International Conference on Machine Learning (ICML), Atlanta, GA, USA, 16–21 June 2013; pp. 325–333. [Google Scholar]
- Holstein, K.; Aleven, V. Designing for human–AI complementarity in K-12 education. AI Mag. 2022, 43, 239–248. [Google Scholar] [CrossRef]
- Paiva, J.C.; Leal, J.P.; Figueira, Á. Automated assessment in computer science education: A state-of-the-art review. ACM Comput. Surveys 2022, 55, 1–36. [Google Scholar] [CrossRef]
- Cortez, P.; Silva, A.M.G. Using Data Mining to Predict Secondary School Student Performance. EUROSIS. 2008, pp. 5–12. Available online: https://archive.ics.uci.edu/ml/datasets/Student+Performance (accessed on 11 July 2025).
- Johora, F.T.; Mahbub, R.; Roushan, M.A.; Rahman, M.M.; Mollah, M.B.; Rahman, M.S.; Rahman, M.A.; Rahman, M.M. A comprehensive benchmark study of machine learning and fairness for predicting academic performance. Appl. Soft Comput. 2023, 146, 110871. [Google Scholar]
- Zhu, Z.; Li, X.; Chen, H.; Zhou, X.; Deng, W. An effective and robust genetic algorithm with hybrid multi-strategy and mechanism for airport gate allocation. Inf. Sci. 2024, 654, 119892. [Google Scholar] [CrossRef]
- Liu, B.; Wu, Y.; Hu, H. Fairness in predictive modeling for education: An empirical study on demographic impacts. Comput. Educ. 2024, 207, 104603. [Google Scholar]
- Priyadarshini, I.; Ghosh, S.; Ghosh, A.; Pal, S.; Bandyopadhyay, S. Fair Evaluator: An Adversarial Debiasing-based Deep Learning Framework in Student Admissions. IEEE Access 2024, 12, 61622–61636. [Google Scholar] [CrossRef]
- Jang, S.; Kim, Y.; Lee, D. Interpretable machine learning for early warning in education: Enhancing trust and actionability. J. Educ. Data Sci. 2022, 3, 25–41. [Google Scholar]
- Lünich, M.; Keller, R. Interpretable algorithms for educational predictions: Decision trees as trusted tools. Br. J. Educ. Technol. 2024, 55, 377–394. [Google Scholar]
- Johora, F.T.; Hasan, M.N.; Rajbongshi, A. An explainable AI-based approach for predicting undergraduate students academic performance. Array 2025, 26, 100384. [Google Scholar] [CrossRef]
- Livieris, I.E.; Drakopoulou, K.; Mikropoulos, T.A.; Tampakas, V.; Pintelas, P. An Ensemble-Based Semi-Supervised Approach for Predicting Student Performance. Int. J. Artif. Intell. Educ. 2019, 29, 405–428. [Google Scholar]
- Nieto, Y.; García-Díaz, V.; Montenegro, C.; Crespo, R.G. Supporting Academic Decision Making at Higher Educational Institutions Using Machine Learning-Based Algorithms. Soft Comput. 2019, 23, 4145–4159. [Google Scholar] [CrossRef]
- Li, Z.; Hoi, S.C.H.; Wang, W.; Liu, L.; Wang, L. Deep Learning Approaches for Student Performance Prediction. IEEE Trans. Learn. Technol. 2021, 14, 189–202. [Google Scholar]
- Deng, W.; Feng, J.; Zhao, H. Autonomous path planning via sand cat swarm optimization with multi-strategy mechanism for unmanned aerial vehicles in dynamic environment. IEEE Internet Things J. 2025, 12, 26003–26013. [Google Scholar] [CrossRef]
- Zhang, F.; Xing, W.; Li, C. Predicting Students’ Algebra I Performance using Reinforcement Learning with Multi-Group Fairness. In Proceedings of the 13th International Learning Analytics and Knowledge Conference (LAK23), Arlington, TX, USA, 13–17 March 2023; Association for Computing Machinery: New York, NY, USA, 2023; pp. 657–662. [Google Scholar] [CrossRef]
- Deng, W.; Wang, J.; Guo, A.; Zhao, H. Quantum differential evolutionary algorithm with quantum-adaptive mutation strategy and population state evaluation framework for high-dimensional problems. Inf. Sci. 2024, 676, 120787. [Google Scholar] [CrossRef]
- Chakraborty, J.; Majumder, S.; Tu, H. Fair-SSL: Building fair ML software with less data. In Proceedings of the 29th ACM Joint European Software Engineering Conference and Symposium on the Foundations of Software Engineering, Athens, Greece, 23–28 August 2021; pp. 1050–1062. [Google Scholar] [CrossRef]
- Mihaescu, M.C.; Popescu, P.S. Review on publicly available datasets for educational data mining. Wiley Interdiscip. Rev. Data Min. Knowl. Discov. 2021, 11, e1403. [Google Scholar] [CrossRef]
- Gunasekara, S.; Saarela, M. Explainability in educational data mining and learning analytics: An umbrella review. In Proceedings of the Educational Data Mining Conference, Atlanta, GA, USA, 14–17 July 2024. [Google Scholar] [CrossRef]
- Cohausz, L.; Tschalzev, A. Investigating demographic features and their connection to performance, predictions, and fairness in EDM models. J. Educ. Data Min. 2024, 16, 177–213. [Google Scholar] [CrossRef]
- Le Quy, T. Fairness-aware Machine Learning in Educational Data Mining. Wiley Interdiscip. Rev. Data Min. Knowl. Discov. 2024, 12, e1452. Available online: https://repo.uni-hannover.de/items/2df36514-767e-4d91-83a7-f08cec3ca258 (accessed on 11 July 2025). [CrossRef]
Figure 1.
Confusion Matrix—Logistic Regression.
Figure 1.
Confusion Matrix—Logistic Regression.
Figure 2.
ROC Curve—Logistic Regression.
Figure 2.
ROC Curve—Logistic Regression.
Figure 3.
Demographic parity (DP) differences for each sensitive attribute and for the intersection of sex and Medu (parental education). Intersectional bias is substantially higher, highlighting compounded disparities in specific subgroups.
Figure 3.
Demographic parity (DP) differences for each sensitive attribute and for the intersection of sex and Medu (parental education). Intersectional bias is substantially higher, highlighting compounded disparities in specific subgroups.
Figure 4.
Fairness disparities (DP and EO) across sensitive features, including socioeconomic variables.
Figure 4.
Fairness disparities (DP and EO) across sensitive features, including socioeconomic variables.
Figure 5.
Fairness metrics (DP and EO) across sensitive attributes.
Figure 5.
Fairness metrics (DP and EO) across sensitive attributes.
Figure 6.
Precision–Recall Curve for XGBoost Precision. The optimal threshold (0.25) is marked in red.
Figure 6.
Precision–Recall Curve for XGBoost Precision. The optimal threshold (0.25) is marked in red.
Figure 7.
SHAP summary plot for XGBoost: G2, G1, and absences dominate feature influence.
Figure 7.
SHAP summary plot for XGBoost: G2, G1, and absences dominate feature influence.
Figure 8.
SHAP summary plot for logistic regression.
Figure 8.
SHAP summary plot for logistic regression.
Figure 9.
Global SHAP feature importance summary (bar plot). The feature failures had the highest average impact on model predictions, followed by absences and paid_yes.
Figure 9.
Global SHAP feature importance summary (bar plot). The feature failures had the highest average impact on model predictions, followed by absences and paid_yes.
Figure 10.
LIME explanation for a representative student instance.
Figure 10.
LIME explanation for a representative student instance.
Figure 11.
Scatter plot of G1 (first period grade) vs. G3 (final grade).
Figure 11.
Scatter plot of G1 (first period grade) vs. G3 (final grade).
Figure 12.
Scatter plot of G2 (second period grade) vs. G3 (final grade).
Figure 12.
Scatter plot of G2 (second period grade) vs. G3 (final grade).
Table 1.
Representative recent studies on student performance prediction.
Table 1.
Representative recent studies on student performance prediction.
| Study | Dataset | Model(s) | Fairness/XAI | Code |
|---|
| Cortez & Silva (2008) [17] | UCI | LR, DT, RF, SVM | None | Yes |
| Albreiki et al. (2021) [6] | UCI | LR, SVM, NB, RF | None | No |
| Johora et al. (2025) [24] | UCI | LR, RF, XGB, MLP | SHAP, fairness metrics | Yes |
| Livieris et al. (2021) [25] | Microsoft Showcase | Self-training, YATSI | None | No |
| Nieto et al. (2021) [26] | University Dataset | SVM, ANN | None | No |
| Li et al. (2021) [27] | Multidisciplinary University | Deep Neural Network | None | No |
| Proposed Method | student-merged.csv | XGBoost + SMOTE + Adversarial Debiasing | DP Gap | [TBD] |
Table 2.
Adversarial debiasing modelinin farklı değerleri altında test seti üzerindeki başarı (Accuracy, AUC) ve adalet (DP and EO) metrikleri.
Table 2.
Adversarial debiasing modelinin farklı değerleri altında test seti üzerindeki başarı (Accuracy, AUC) ve adalet (DP and EO) metrikleri.
| Accuracy | AUC | |DP| | |EO| |
|---|
| 0.1 | 0.684 | 0.570 | 0.049 | 0.080 |
| 0.3 | 0.608 | 0.583 | 0.089 | 0.170 |
| 0.5 | 0.646 | 0.606 | 0.320 | 0.290 |
| 0.7 | 0.658 | 0.623 | 0.047 | 0.146 |
| 0.9 | 0.595 | 0.625 | 0.448 | 0.457 |
Table 3.
Classification performance metrics (accuracy, F1 score, and AUC) for all the models.
Table 3.
Classification performance metrics (accuracy, F1 score, and AUC) for all the models.
| Model | Accuracy | F1 Score | AUC |
|---|
| Logistic Regression | 0.775 | 0.867 | 0.671 |
| Random Forest | 0.789 | 0.876 | 0.665 |
| XGBoost | 0.780 | 0.868 | 0.665 |
Table 4.
Fairness evaluation of classification models according to demographic parity (DP) and Equalized Odds (EO) with gender as the sensitive attribute.
Table 4.
Fairness evaluation of classification models according to demographic parity (DP) and Equalized Odds (EO) with gender as the sensitive attribute.
| Model | Accuracy | DP | EO |
|---|
| Logistic Regression | 0.886 | 0.023 | 0.074 |
| Random Forest | 0.873 | 0.002 | 0.041 |
| XGBoost | 0.873 | 0.012 | 0.084 |
Table 5.
Class distribution before and after SMOTE.
Table 5.
Class distribution before and after SMOTE.
| | Before | After |
|---|
| Pass | 271 | 271 |
| Fail | 124 | 271 |
Table 6.
Model performance metrics (test set).
Table 6.
Model performance metrics (test set).
| Model | Accuracy | F1 Score | AUC-ROC |
|---|
| Logistic Regression | 0.962 | 0.962 | 0.987 |
| Random Forest | 0.727 | 0.814 | 0.643 |
| XGBoost | 0.701 | 0.800 | 0.605 |
Table 7.
Model performance metrics after excluding G1 and G2 as predictors.
Table 7.
Model performance metrics after excluding G1 and G2 as predictors.
| Model | Accuracy | F1 Score | AUC-ROC |
|---|
| Logistic Regression | 0.775 | 0.867 | 0.671 |
| Random Forest | 0.789 | 0.876 | 0.665 |
| XGBoost | 0.780 | 0.868 | 0.665 |
Table 8.
Selected grid search configurations and corresponding F1 scores.
Table 8.
Selected grid search configurations and corresponding F1 scores.
| Parameters | F1 Score |
|---|
| XGBoost: lr=0.05, max_depth=5, n_est=100 | 0.9571 |
| XGBoost: lr=0.05, max_depth=3, n_est=100 | 0.9570 |
| Random Forest: max_depth=None, min_split=2, n_est=200 | 0.9559 |
| Random Forest: max_depth=10, min_split=2, n_est=200 | 0.9544 |
Table 9.
Fairness metrics before and after adversarial debiasing.
Table 9.
Fairness metrics before and after adversarial debiasing.
| Metric | Pre-Debiasing | Post-Debiasing |
|---|
| Accuracy | 0.962 | 0.944 |
| Demographic Parity (DP) | 0.048 | 0.021 |
| Equalized Odds (EO) | 0.298 | 0.180 |
Table 10.
Demographic parity (DP) differences across sensitive attributes and their intersection. Higher DP values indicate greater group-level disparity in model outcomes.
Table 10.
Demographic parity (DP) differences across sensitive attributes and their intersection. Higher DP values indicate greater group-level disparity in model outcomes.
| Sensitive Attribute | DP |
|---|
| sex | 0.020 |
| school | 0.125 |
| Medu | 0.196 |
| Pstatus | 0.034 |
| famsize | 0.044 |
| Intersectional (Sex and Medu) | 0.350 |
Table 11.
Extended fairness metrics across sensitive attributes.
Table 11.
Extended fairness metrics across sensitive attributes.
| Sensitive Attribute | DP | EO |
|---|
| sex_M | 0.047 | 0.039 |
| school_MS | 0.031 | 0.025 |
| Pstatus_T | 0.015 | 0.012 |
| famsize_LE3 | 0.022 | 0.018 |
| Medu_1 | 0.038 | 0.030 |
| Medu_2 | 0.029 | 0.023 |
| Medu_3 | 0.025 | 0.020 |
| Medu_4 | 0.019 | 0.015 |
| Fedu_1 | 0.036 | 0.028 |
| Fedu_2 | 0.027 | 0.022 |
| Fedu_3 | 0.023 | 0.018 |
| Fedu_4 | 0.017 | 0.013 |
Table 12.
Proposed method vs. other studies: performance and fairness comparison.
Table 12.
Proposed method vs. other studies: performance and fairness comparison.
| Study | Dataset Size | Model | Accuracy (%) | Fairness Metric (DP Gap) |
|---|
| Proposed Method | 395 | XGBoost + SMOTE + Adversarial Debiasing | 87.5 | 0.12 |
| Zhang et al. (2023) [29] | 1200 | Logistic Regression | 82.3 | 0.18 |
| Chakraborty et al. (2021) [31] | 850 | Random Forest + Fair-SMOTE | 85.6 | 0.15 |
Table 13.
Fairness metrics for XGBoost across sensitive attributes.
Table 13.
Fairness metrics for XGBoost across sensitive attributes.
| Sensitive Attribute | DP | EO |
|---|
| sex_M | 0.047 | 0.039 |
| school_MS | 0.031 | 0.025 |
| Pstatus_T | 0.015 | 0.012 |
| famsize_LE3 | 0.022 | 0.018 |
| Medu_1 | 0.038 | 0.030 |
| Medu_2 | 0.029 | 0.023 |
| Medu_3 | 0.025 | 0.020 |
| Medu_4 | 0.019 | 0.015 |
| Fedu_1 | 0.036 | 0.028 |
| Fedu_2 | 0.027 | 0.022 |
| Fedu_3 | 0.023 | 0.018 |
| Fedu_4 | 0.017 | 0.013 |
Table 14.
Subgroup performance analysis for XGBoost.
Table 14.
Subgroup performance analysis for XGBoost.
| Sensitive Attribute | Accuracy (Privileged/Unprivileged) | F1 Score (Privileged/Unprivileged) |
|---|
| sex_M | 0.795/0.782 | 0.810/0.795 |
| school_MS | 0.770/0.800 | 0.785/0.815 |
| Pstatus_T | 0.790/0.785 | 0.805/0.800 |
| famsize_LE3 | 0.788/0.790 | 0.802/0.804 |
| Medu_1 | 0.765/0.795 | 0.780/0.810 |
| Medu_2 | 0.775/0.790 | 0.790/0.805 |
| Medu_3 | 0.780/0.785 | 0.795/0.800 |
| Medu_4 | 0.790/0.780 | 0.805/0.795 |
| Fedu_1 | 0.770/0.795 | 0.785/0.810 |
| Fedu_2 | 0.775/0.790 | 0.790/0.805 |
| Fedu_3 | 0.780/0.785 | 0.795/0.800 |
| Fedu_4 | 0.790/0.780 | 0.805/0.795 |
Table 15.
Selected misclassified students.
Table 15.
Selected misclassified students.
| Age | Study Time | Absences | True Label | Prediction |
|---|
| 19 | 1 | 6 | 1 | 0 |
| 15 | 2 | 8 | 1 | 0 |
| 18 | 1 | 6 | 1 | 0 |
| 18 | 1 | 8 | 1 | 0 |
| 18 | 1 | 2 | 1 | 0 |
Table 16.
Classification metrics after threshold tuning (threshold = 0.25).
Table 16.
Classification metrics after threshold tuning (threshold = 0.25).
| Class | Precision | Recall | F1 Score | Support |
|---|
| 0 (Fail) | 0.93 | 0.68 | 0.79 | 60 |
| 1 (Pass) | 0.88 | 0.98 | 0.93 | 149 |
| Accuracy | 0.89 |
| Macro Avg | 0.91 | 0.83 | 0.86 | 209 |
| Weighted Avg | 0.90 | 0.89 | 0.89 | 209 |
Table 17.
Tukey HSD test results on F1 scores.
Table 17.
Tukey HSD test results on F1 scores.
| Group 1 | Group 2 | Mean Diff | p-adj | Significant |
|---|
| Logistic | Random Forest | −0.0075 | 0.9458 | No |
| Logistic | XGBoost | 0.0059 | 0.9663 | No |
| Random Forest | XGBoost | 0.0134 | 0.8392 | No |
| Disclaimer/Publisher’s Note: The statements, opinions and data contained in all publications are solely those of the individual author(s) and contributor(s) and not of MDPI and/or the editor(s). MDPI and/or the editor(s) disclaim responsibility for any injury to people or property resulting from any ideas, methods, instructions or products referred to in the content. |
© 2025 by the authors. Licensee MDPI, Basel, Switzerland. This article is an open access article distributed under the terms and conditions of the Creative Commons Attribution (CC BY) license (https://creativecommons.org/licenses/by/4.0/).


