Review

An Exploratory Review of Microplastic Pollution, Associated Microbiomes and Pathogens in Water

by
Paulina Cholewińska
1,*,
Konrad Wojnarowski
1,
Hanna Moniuszko
2,
Przemysław Pokorny
3 and
Dušan Palić
1
1
Chair of Fish Diseases and Fisheries Biology, Ludwig-Maximilians-University Munich, 80539 Munich, Germany
2
Centre for Climate Research SGGW, Warsaw University of Life Sciences—SGGW (WULS—SGGW), Nowoursynowska 166, 02-787 Warsaw, Poland
3
Faculty of Limnology and Fishery, Institute of Animal Breeding, Wroclaw University of Environmental and Life Sciences, 51-630 Wroclaw, Poland
*
Author to whom correspondence should be addressed.
Appl. Sci. 2025, 15(15), 8128; https://doi.org/10.3390/app15158128
Submission received: 26 May 2025 / Revised: 17 July 2025 / Accepted: 18 July 2025 / Published: 22 July 2025

Abstract

Microplastic particles (MPs) are an emerging global pollutant of increasing concern due to their widespread occurrence, persistence, and multifaceted impact on aquatic ecosystems. This study provides a comprehensive review of peer-reviewed literature from 2011 to 2025, analysing the presence, distribution, and microbiological associations of MPs in surface waters across five continents. The findings confirm that MPs are present in both marine and freshwater systems, with concentrations varying by region, hydrology, and proximity to anthropogenic sources. Polyethylene and polypropylene were identified as the most common polymers, often enriched in river mouths, estuaries, and aquaculture zones. A key focus of this review is the plastisphere—microbial biofilms colonizing MPs—which includes both environmental and pathogenic bacteria such as Vibrio, Pseudomonas, and Acinetobacter. Notably, MPs serve as vectors for the spread of antibiotic resistance genes (ARGs), including sul1, tetA and ermF, and β-lactamase genes like blaCTX-M. This highlights their role in enhancing horizontal gene transfer and microbial dissemination. The results emphasize the need for standardized monitoring protocols and further interdisciplinary research. In light of the One Health approach, understanding the microbial dimension of MP pollution is essential for managing risks to environmental and public health.

1. Introduction

Plastics, since their invention in 1907, have become commonly used in many branches of industry, ranging from food packaging to medicine [1]. In 2023, global plastic production reached approximately 413.8 million tons, with around 47% originating from Asia. China remained the largest producer, accounting for 32% of global output. In the same year, the European plastics industry achieved a positive trade balance of approximately EUR 12.7 billion [2,3]. Both their abundance in the environment and some industrial processes can result in the formation of microplastic particles (MP, <5 mm), which have recently become the subject of intense research due to their negative effects on the aquatic environment. Plastic, including MPs, accounts for up to 95% of marine waste, and notably, these materials are highly resistant to degradation, which leads to their long-term environmental persistence [4,5,6].
MPs found in the environment, including in surface water, can come from various sources including food production, cosmetics, health care, and many others. Its particles enter water through, among other things, malfunctioning treatment plants and runoff with heavy rains from land into water, etc. [4,5]. Their presence is associated with a wide range of adverse effects on aquatic organisms. As demonstrated by the study conducted by Welden and Cowie [7] on Norway lobsters (Nephrops norvegicus) in Scotland, bioaccumulation can be one of such effects. More recent studies confirm the presence of microplastics in N.s norvegicus from various regions, including Irish waters and the Mediterranean Sea. In particular, the study by Hara et al. [8] found microplastics in the gastrointestinal tract of these crustaceans, indicating their ability to accumulate such particles. Moreover, a literature review by Porter et al. [9] indicates that the microplastic burden in benthic marine invertebrates such as N. norvegicus depends on species traits and feeding ecology, which may influence the extent of bioaccumulation.
In a study by Ferrieira et al. [10] on the economically important estuarine apex predator Cynoscion acoupa (n = 552), it was shown that MPs were detected in more than half of the fish examined. Additionally, it was noted that MPs accumulated more frequently in adults than juveniles. With accumulation in the body, heavy metals, chemicals, polymeric or oligomeric substances can be released from MP; however, this depends on the phyco-chemical structures of MP and environmental conditions [11,12]. In addition to fish, the bioaccumulation of microplastics has been widely documented in various other aquatic organisms, including bivalves, crustaceans, zooplankton, and marine mammals. Filter-feeding bivalves such as Mytilus edulis and Crassostrea gigas can accumulate microplastics in their digestive glands and soft tissues, which can result in oxidative stress, immune response alteration, and decreased reproductive capacity [13,14]. Similarly, microplastics have been detected in copepods and cladocerans, affecting feeding behavior and energy acquisition at the base of the aquatic food web [15]. Furthermore, marine mammals such as whales and seals can be exposed through trophic transfer, leading to the presence of plastic particles in gastrointestinal tracts and faeces [16]. These findings underscore the ubiquity of microplastic contamination across aquatic taxa and support the need for holistic ecological assessments.
In addition, MP structures can be altered due to interactions with the various systems in the animal organism, including digestive fluids or gastrointestinal microbes, and then accumulate in the gut [11,17,18]. Another aspect is the impact of the formation of the microbial community on microplastics. One of the first studies presenting this problem was presented by Maso et al. [19], in which the occurrence of potentially harmful Ostreopsips sp., Coolia sp., and Alexandrium taylorii on MP surfaces was detected. On the other hand, a study by Kesy et al. [20] conducted in the Baltic Sea showed that in addition to Alphaproteobacteria and Gammaproteobacteria, pathogenic Vibrio spp. were also present. Furthermore, the authors also suggested that Vibrio spp. are generally among the earliest colonizers of the MP surface.
Importantly, one of the major challenges in comparing the global MP concentration data stems from significant methodological heterogeneity across studies. These include differences in sampling protocols, pre-treatment procedures, particle size thresholds, and analytical identification techniques (e.g., FTIR, Raman spectroscopy, Py-GC/MS, TGA-FTIR). Such methodological inconsistencies can lead to substantial variability in reported MP levels and should be carefully considered when interpreting large-scale patterns and regional comparisons [21,22,23]. Therefore, this study undertook an analysis of the available literature in terms of both the occurrence of MPs in surface waters and their type, microbiological and pathogenic composition.

2. Materials and Methods

2.1. Literature Search

An extensive literature search was carried out by querying the Scopus, Web of Science, and Scholar databases. Various combinations of search keywords, namely ‘microplastics’, ‘surface water’, ‘bacteria’, ‘microbiology’, ‘China’, ‘Japan’, ‘Thailand’, ‘Taiwan’, ‘India’, ‘Europe’, ‘Italy’, ‘Netherlands’, ‘Germany’, ‘Denmark’, ‘Spain’, ‘France’, ‘Finland’, ‘United Kingdom’, ‘Portugal’, ‘Baltic Sea’, ‘North Sea’, ‘Mediterranean sea’, ‘United States’, ‘Canada’, ‘South America’, ‘Argentina’, ‘Brazil’, ‘Paraguay’, ‘Columbia’, ‘Ecuador’, ‘Africa’, ‘America’ and ‘type of microplastic’, ‘composition of microplastic’, ‘pathogens’, ‘antimicrobial resistance genes’, were used. Based on the above-listed criteria, 199 articles (with full access) were selected, covering the period from 2011 to 2025. The majority of studies were published from 2019 onwards.

2.2. Standardization of Data

Standardization was performed by extracting the microplastic concentration values expressed in particles per cubic meter (particles/m3) from the included studies. While a detailed comparison of MP detection methodologies lies beyond the scope of this study, we acknowledge that methodological differences—particularly in sampling depth, mesh size, digestion protocols, and identification techniques (e.g., FTIR, Raman)—significantly affect the comparability of reported concentrations across studies. These variations are briefly noted to contextualize the presented global synthesis. For microbiome data, only studies that provided relative abundance or dominant taxa information based on 16S rRNA sequencing or culturing techniques were included. No new sequencing or sample collection was performed by the authors. In this study, surface water is operationally defined as water sampled from the top 0–20 cm layer of the water column, following conventions in recent MPs studies (e.g., [24,25]). Where possible, only datasets using surface trawls, grab samples, or neuston nets within this depth range were included.

2.3. Statistical Analysis of Socio-Economic Correlations

To explore the potential relationships between economic factors and microplastic (MP) contamination, we conducted a correlation analysis between the country-level gross domestic product per capita (GDP per capita, nominal, year 2023) and the average MP concentration (particles/m3). The analysis was performed separately for different aquatic environments, namely rivers, lakes, and sea/bay. Pearson’s correlation coefficients were calculated using R software (version 4.4.3). Scatter plots with fitted linear regression lines and 95% confidence intervals were generated to visually illustrate the relationships. GDP data were obtained from the World Bank database.

3. Results and Discussion

3.1. Microplastics in Surface Waters

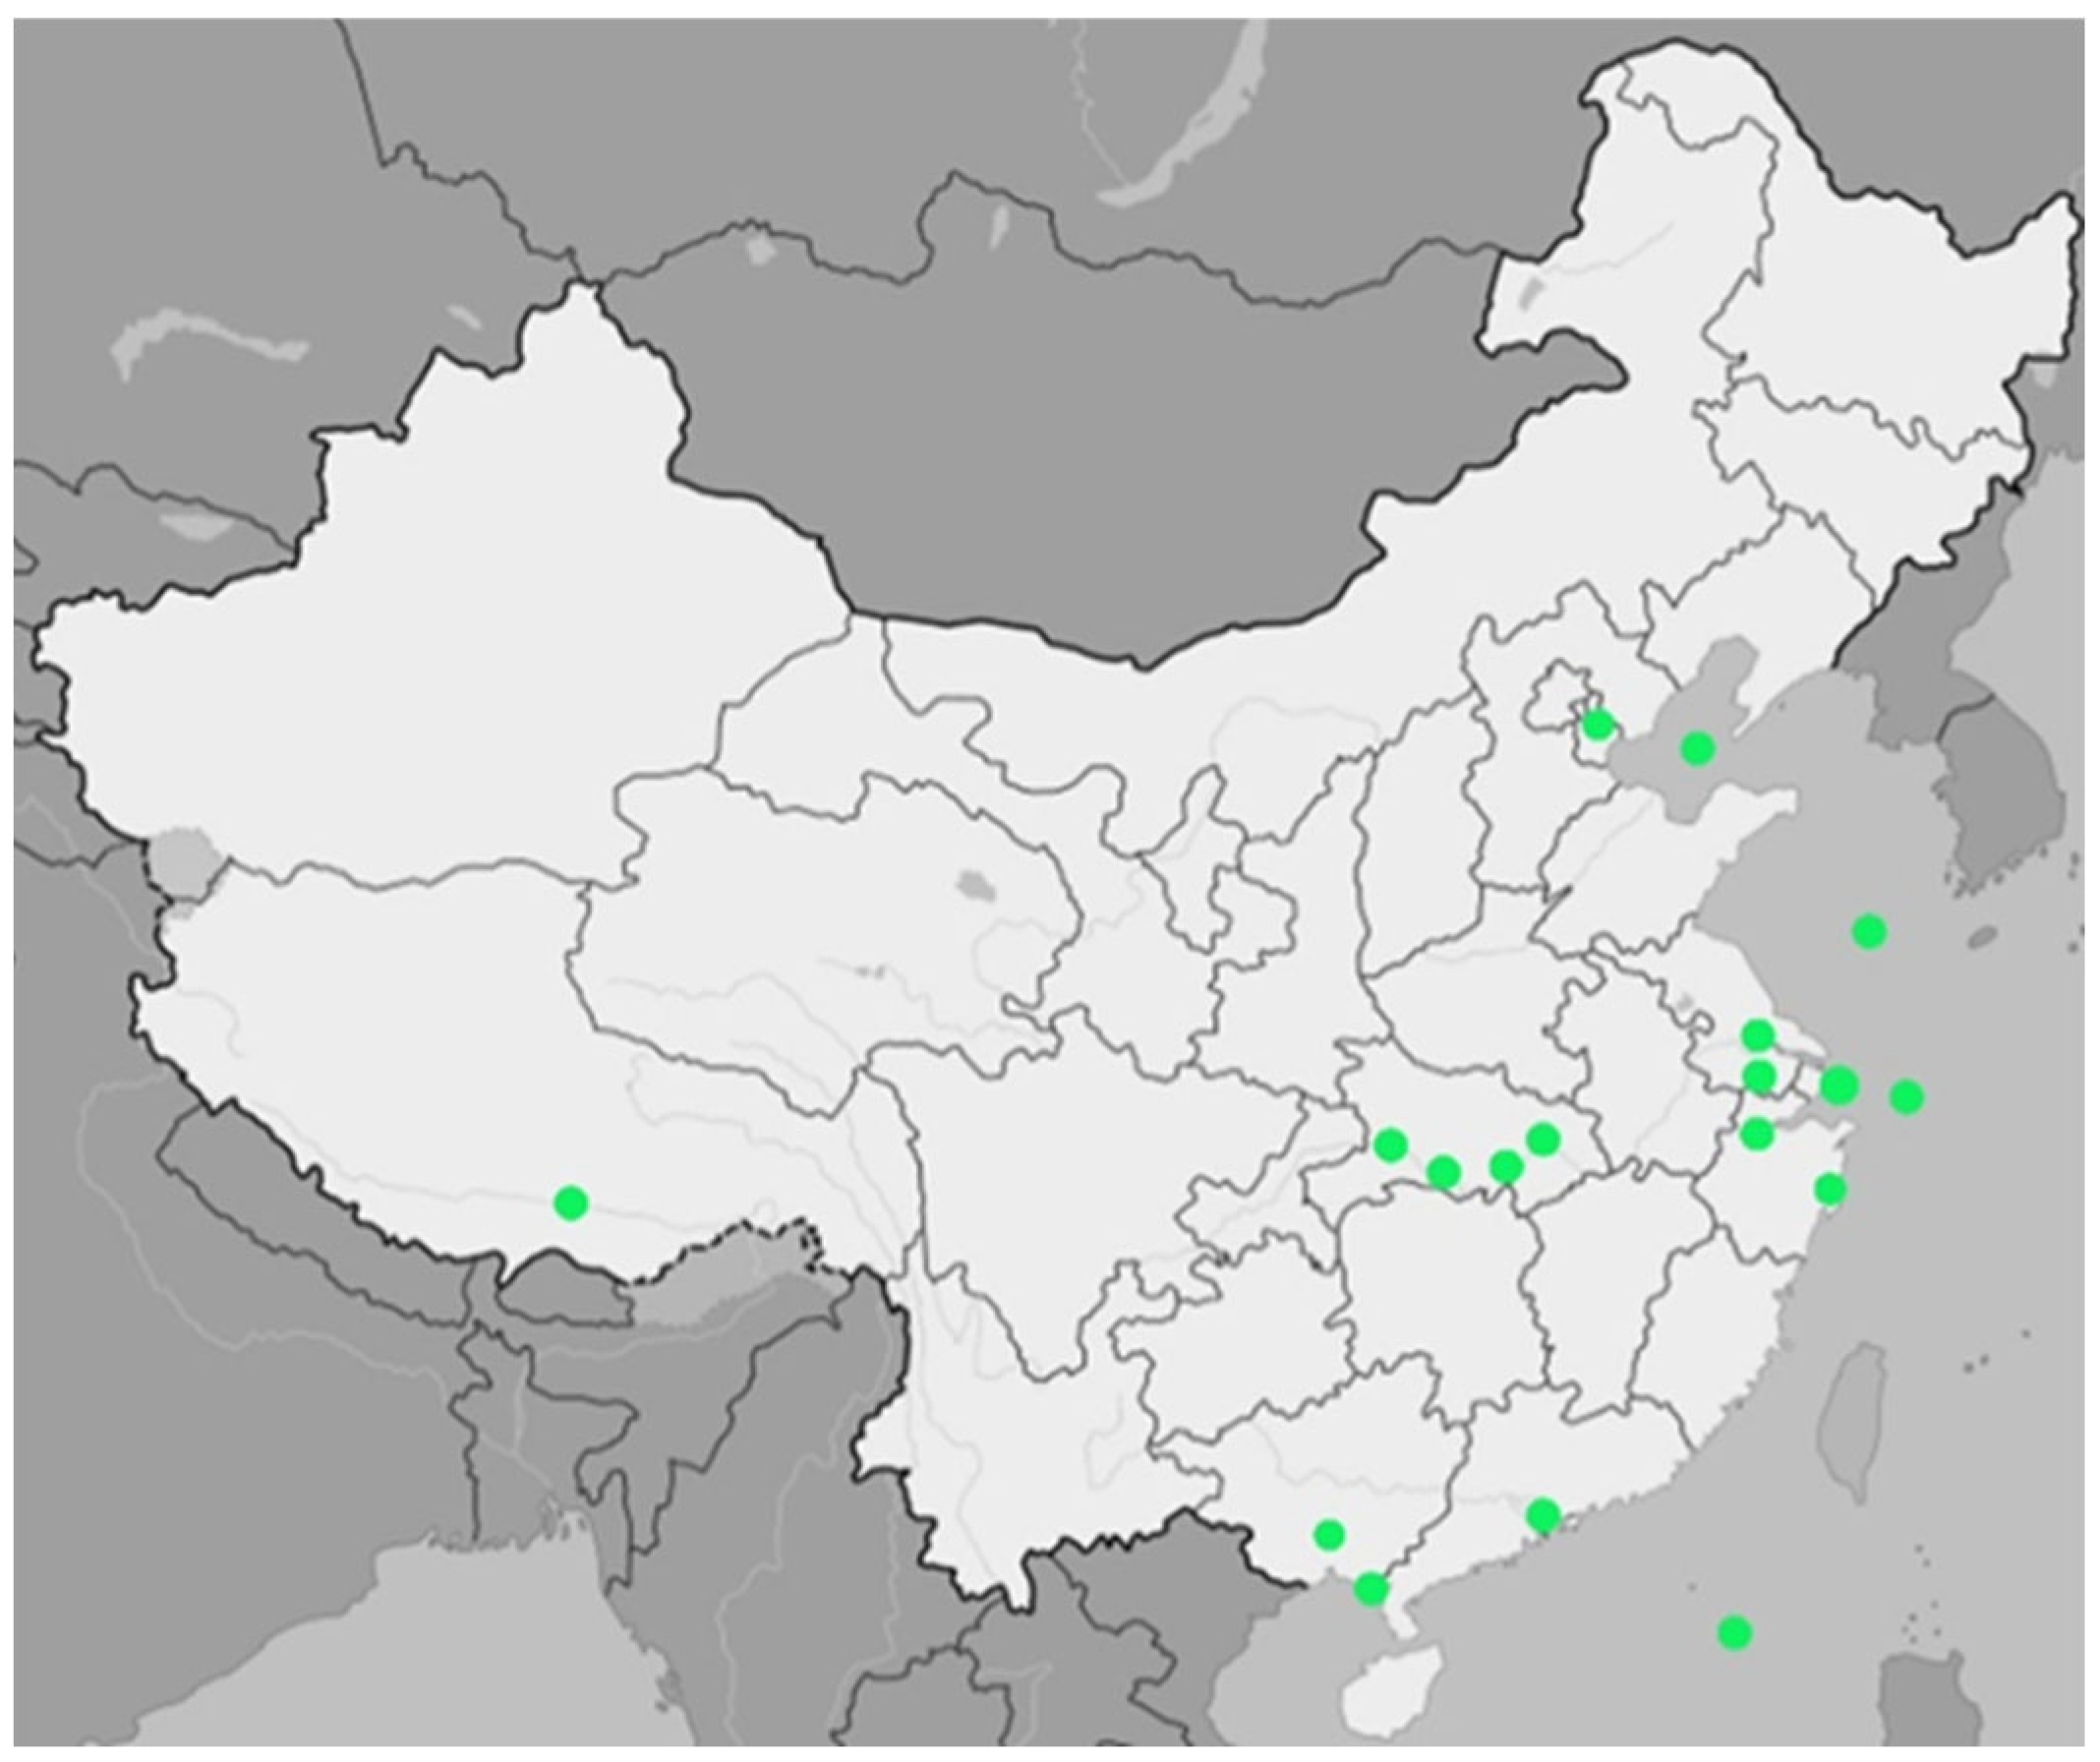
Asia: In the case of Asia, 55 publications regarding the presence of MP in water were selected (Figure 1). The highest countrywide mean value was reported in Japan at the level of ~28,728 particles/m3 (Figure 1, Supplementary File S1—Asia). The highest levels of MP were found in the rivers Awano (~124,000 particles/m3), Ayaragi (~117,000 particles/m3), Asa (~129,500 particles/m3) and Majime (~580,000 particles/m3) [Supplementary File S1—Asia]. Another criterion taken into account during the analysis was water body type. The results of this analysis showed that both rivers and coastal regions have accumulated similar concentrations of MP (~28,827 particles/m3 and ~27,077 particles/m3, respectively) (Supplementary File S1—Asia).
Further studies from 2021 provided additional insights. For instance, a study analyzing surface waters in Japanese rivers reported microplastic concentrations ranging from 300 to 1240 particles/m3 [26]. In Southeast Asia, the Chao Phraya River in Thailand exhibited mean concentrations of ~80 particles/m3 in urban zones and ~48 particles/m3 in estuary zones [27]. The Saigon River in Vietnam showed 68–20 particles/m3 in urban areas and ~42 particles/m3 near its estuary [28]. In contrast, the Citarum River in Indonesia had significantly lower concentrations, with ~12 particles/m3 in urban zones and approximately 0.08 ± 0 particles/m3 in estuarine areas [29].
High levels of MP were also found in Southern Korea, where the average detected concentration in surface waters was ~22,280 particles/m3. A higher amount was found in Jinhae Bay—~88,000 particles/m3 [30]. On the other hand, the lowest concentration was found on the coast of Geoje Island, where the average content was ~1 particles/m3 [31]. The mean content of MP, depending on the type of reservoir, showed that coastal areas were characterized by higher concentrations in comparison to rivers (respectively: ~699 and ~32,751 particles/m3) (Supplementary File S1—Asia). The most frequently studied country in terms of the occurrence of MP in surface waters was China (n = 20; Figure 2), where the average was ~7260 particles/m3. The highest levels were found in the Pearl River Estuary of Guangzhou waters—42,100 particles/m3 [32]. In turn, the lowest occurred in the Yellow Sea and East Chinese Sea waters—~130 and ~170 particles/m3, respectively [33,34]. In the case of China, the lowest mean MP levels were found in the coastal areas, and the highest in the lakes (~2328 and ~13,903 particles/m3, respectively). In the regions of Thailand and India, the average MP level in the waters was similar, at ~715 and ~710 particles/m3, respectively. In the case of Thailand, the lowest level was found in the Inner Gulf of Thailand—~10 particles/m3 [35]. In India, the lowest level was found in the areas of the Ganges/Ballia, Ganges/Patna, Ganges/Bhagalpur, Ganges/Farakka, and Ganges/Diamond Harbor rivers, where it ranged from ~0.38–0.684 particles/m3 [36]. Additionally, in the case of India, MPs were absent in some parts of the Munnar and Chenai rivers [37].
On the other hand, in terms of the water body type (Table 1), the lowest MP level in India was found in lakes (~27 particles/m3), while in Thailand, the average level was quite similar in rivers and coasts (about 692 and 605 particles/m3). Taiwan, on the other hand had the lowest number of available publications regarding the topic (n = 3). The analysis carried out showed that the mean MP content in surface water was about ~16 particles/m3. The highest level was found in water from the Xindian River, and the lowest was in Kaohsiung Bay (~36.95 and 0.48 particles/m3, respectively) [38,39]. In summary, the average content of MPs in surface waters in Asia oscillated around ~12,918 particles/m3, where most analyses were performed in the period 2018–2019. In turn, the comparison by reservoir type showed that coastal areas had the highest MP level (Table 1, Supplementary File S1—Asia). However, the observed discrepancy between the mean and median values likely reflects site-specific outliers, especially in areas affected by urban discharge or aquaculture.
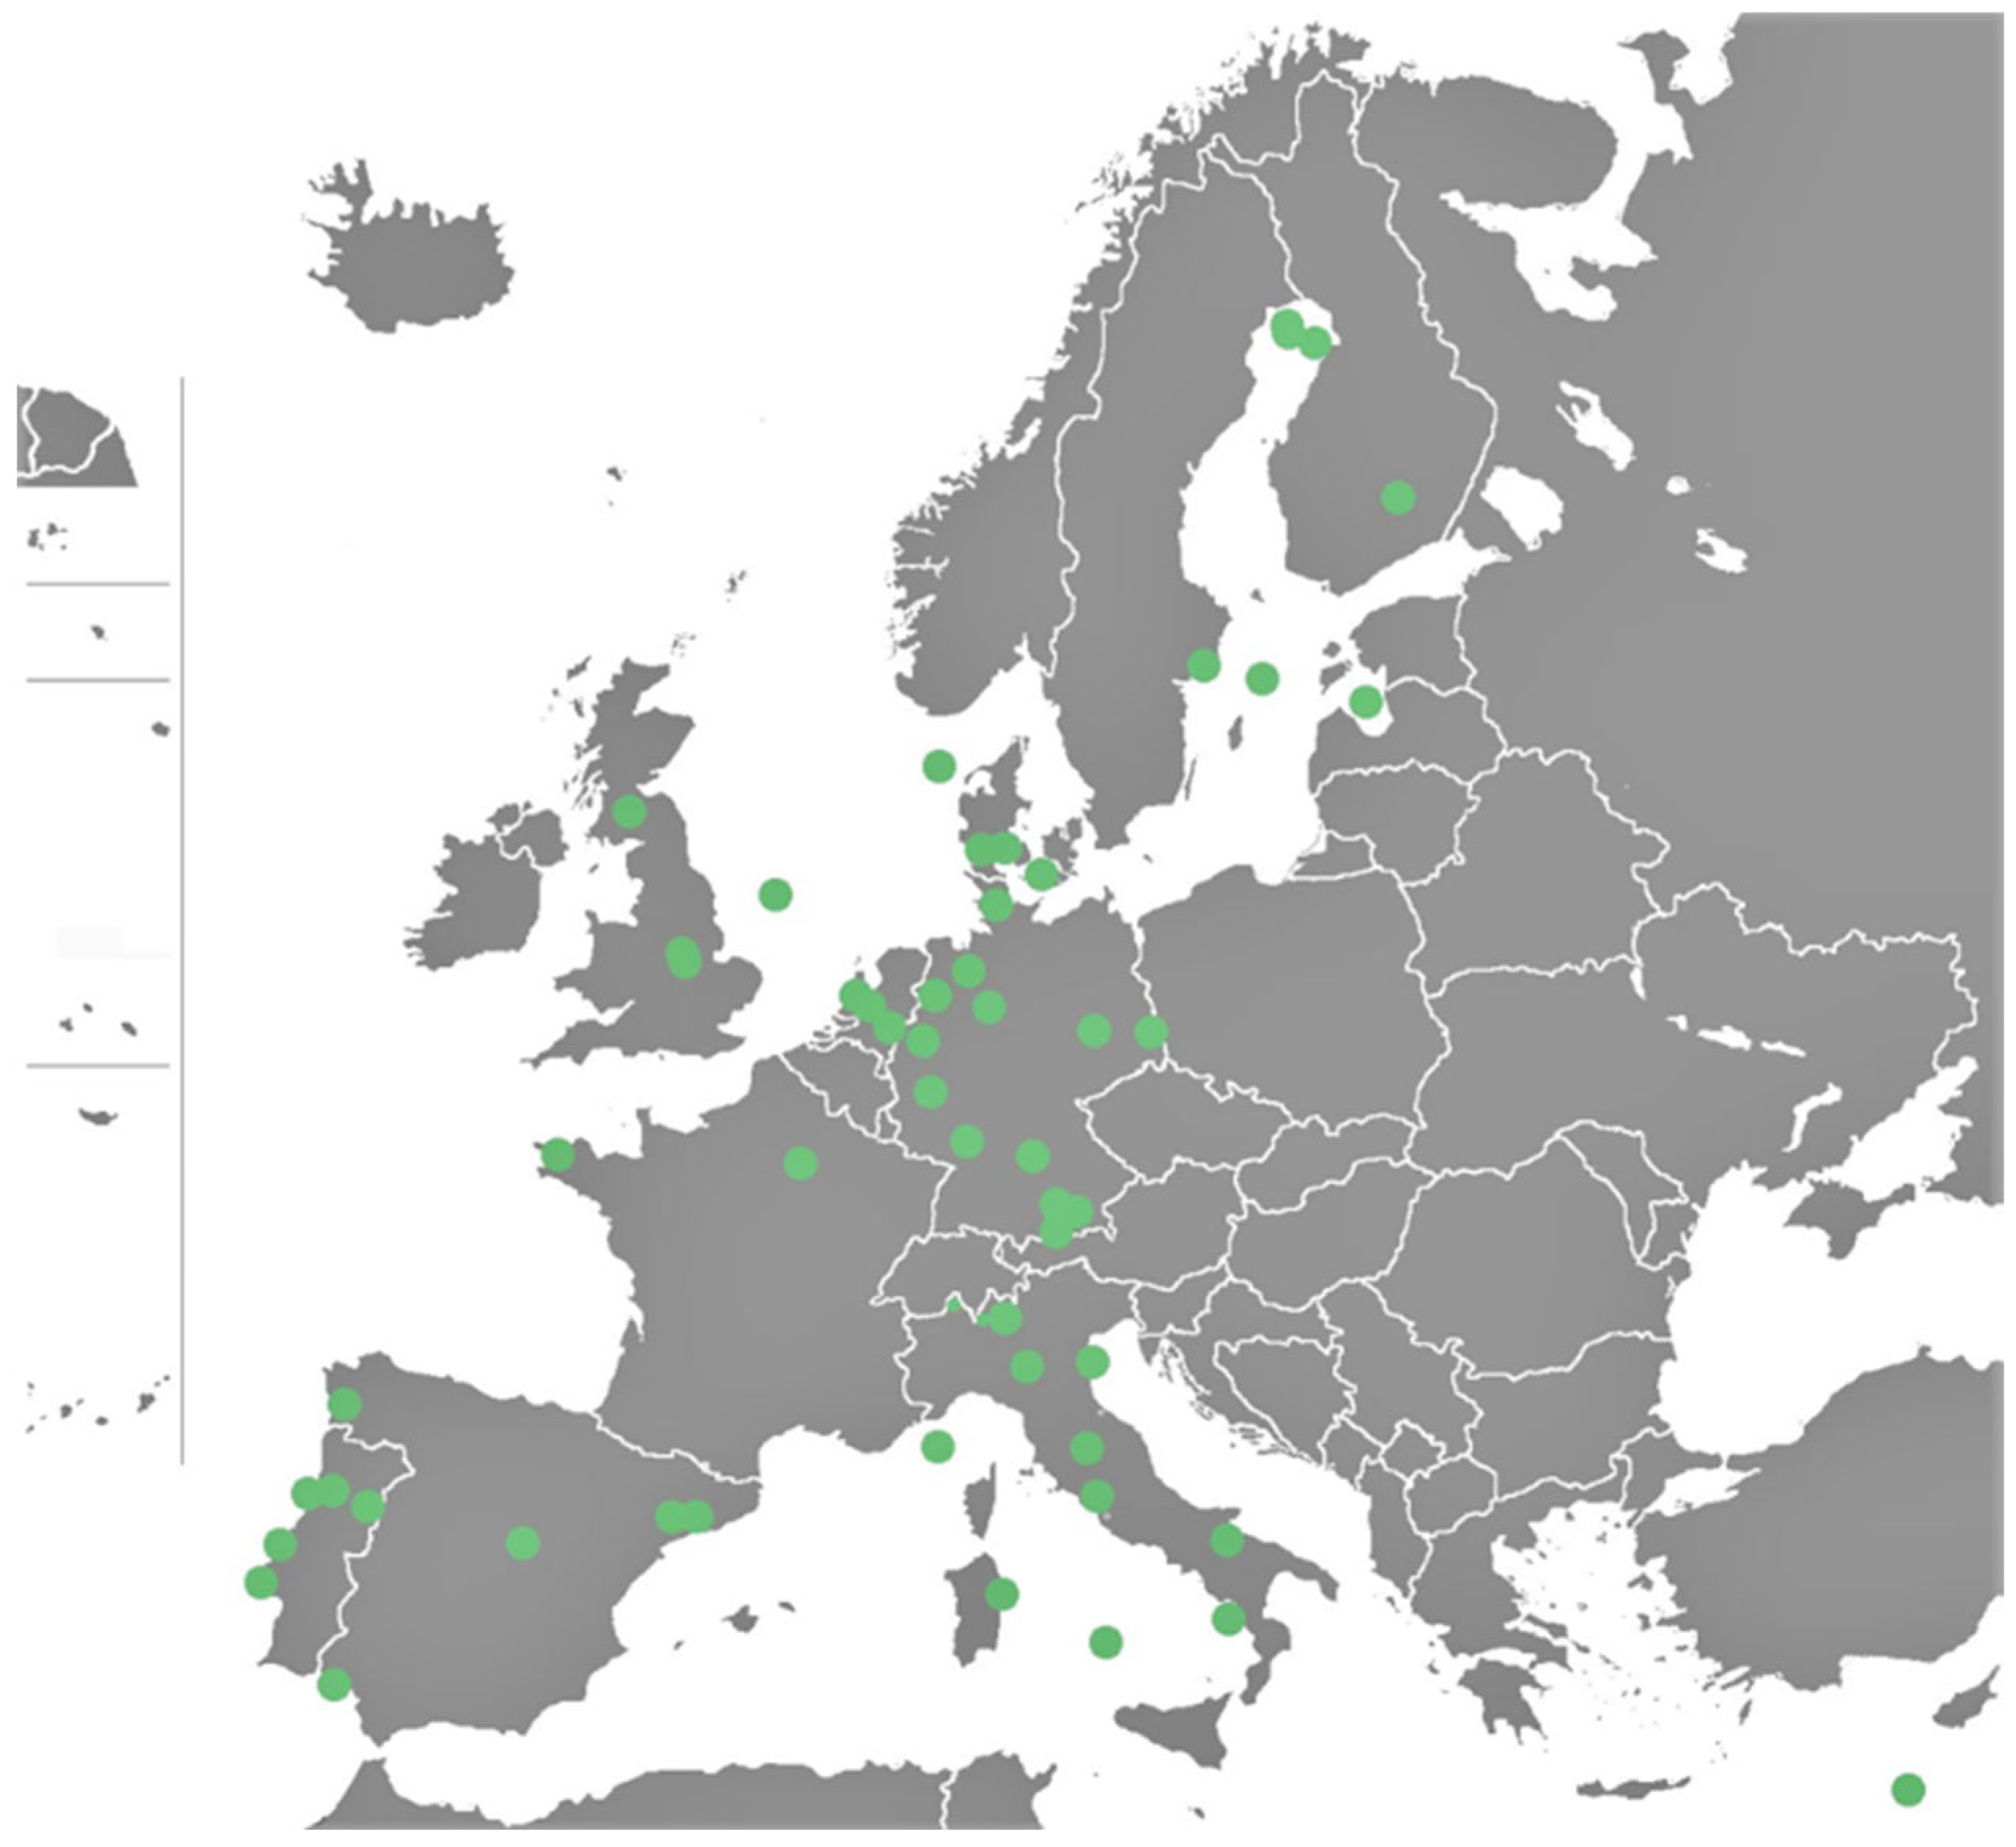
Europe: The MPs in surface water level were analyzed on the basis of 50 available publications (Figure 3). The analysis showed that the highest average MP level was found in Denmark (~120,300 particles/m3), while the lowest was in Italy and the Mediterranean Sea (Supplementary File S2 Europe). In the case of Italy, the lowest levels were found in Lake Bolsena (~0.34–4.08 particles/m3), and the highest were found in the coastal areas of Goro (~50 particles/m3) and the Mignone River (~544 particles/m3) [40,41,42]. The highest MP level in the Mediterranean Sea was 7.68 particles/m3 in the vicinity of the Aegean-Levantine Sea [43]. Additionally, a study conducted by Adamopoulou et al. [44] confirmed the presence of microplastics in the surface waters of the Aegean and Levantine Seas. In this study, 84 samples were collected using a manta net between 2014 and 2020, covering open waters, coastal areas, and enclosed bays (Korfu and Saronikos). Microplastic concentrations varied greatly, ranging from ~0.08 to 10.8 particles/m3, with the highest levels recorded in samples influenced by surface ocean currents. High concentrations of MP were found in surface water in the Netherlands, Portugal and France (~44,961, 51,860 and 17,500 particles/m3, respectively). In the remaining countries analyzed, the level did not exceed ~3400 particles/m3 (Supplementary File S2 Europe).
When analyzing the MP level depending on the type of reservoir, the highest levels of MPs were detected in the coastal areas (~24,372 particles/m3), and the lowest were detected in rivers (~8166 particles/m3) (Table 2) (Supplementary File S2—Europe).
Similar to Asia, the difference between the mean and median values observed in Europe likely reflects the impact of extreme values at specific locations, especially in highly urbanized estuaries or coastal zones influenced by anthropogenic discharge.
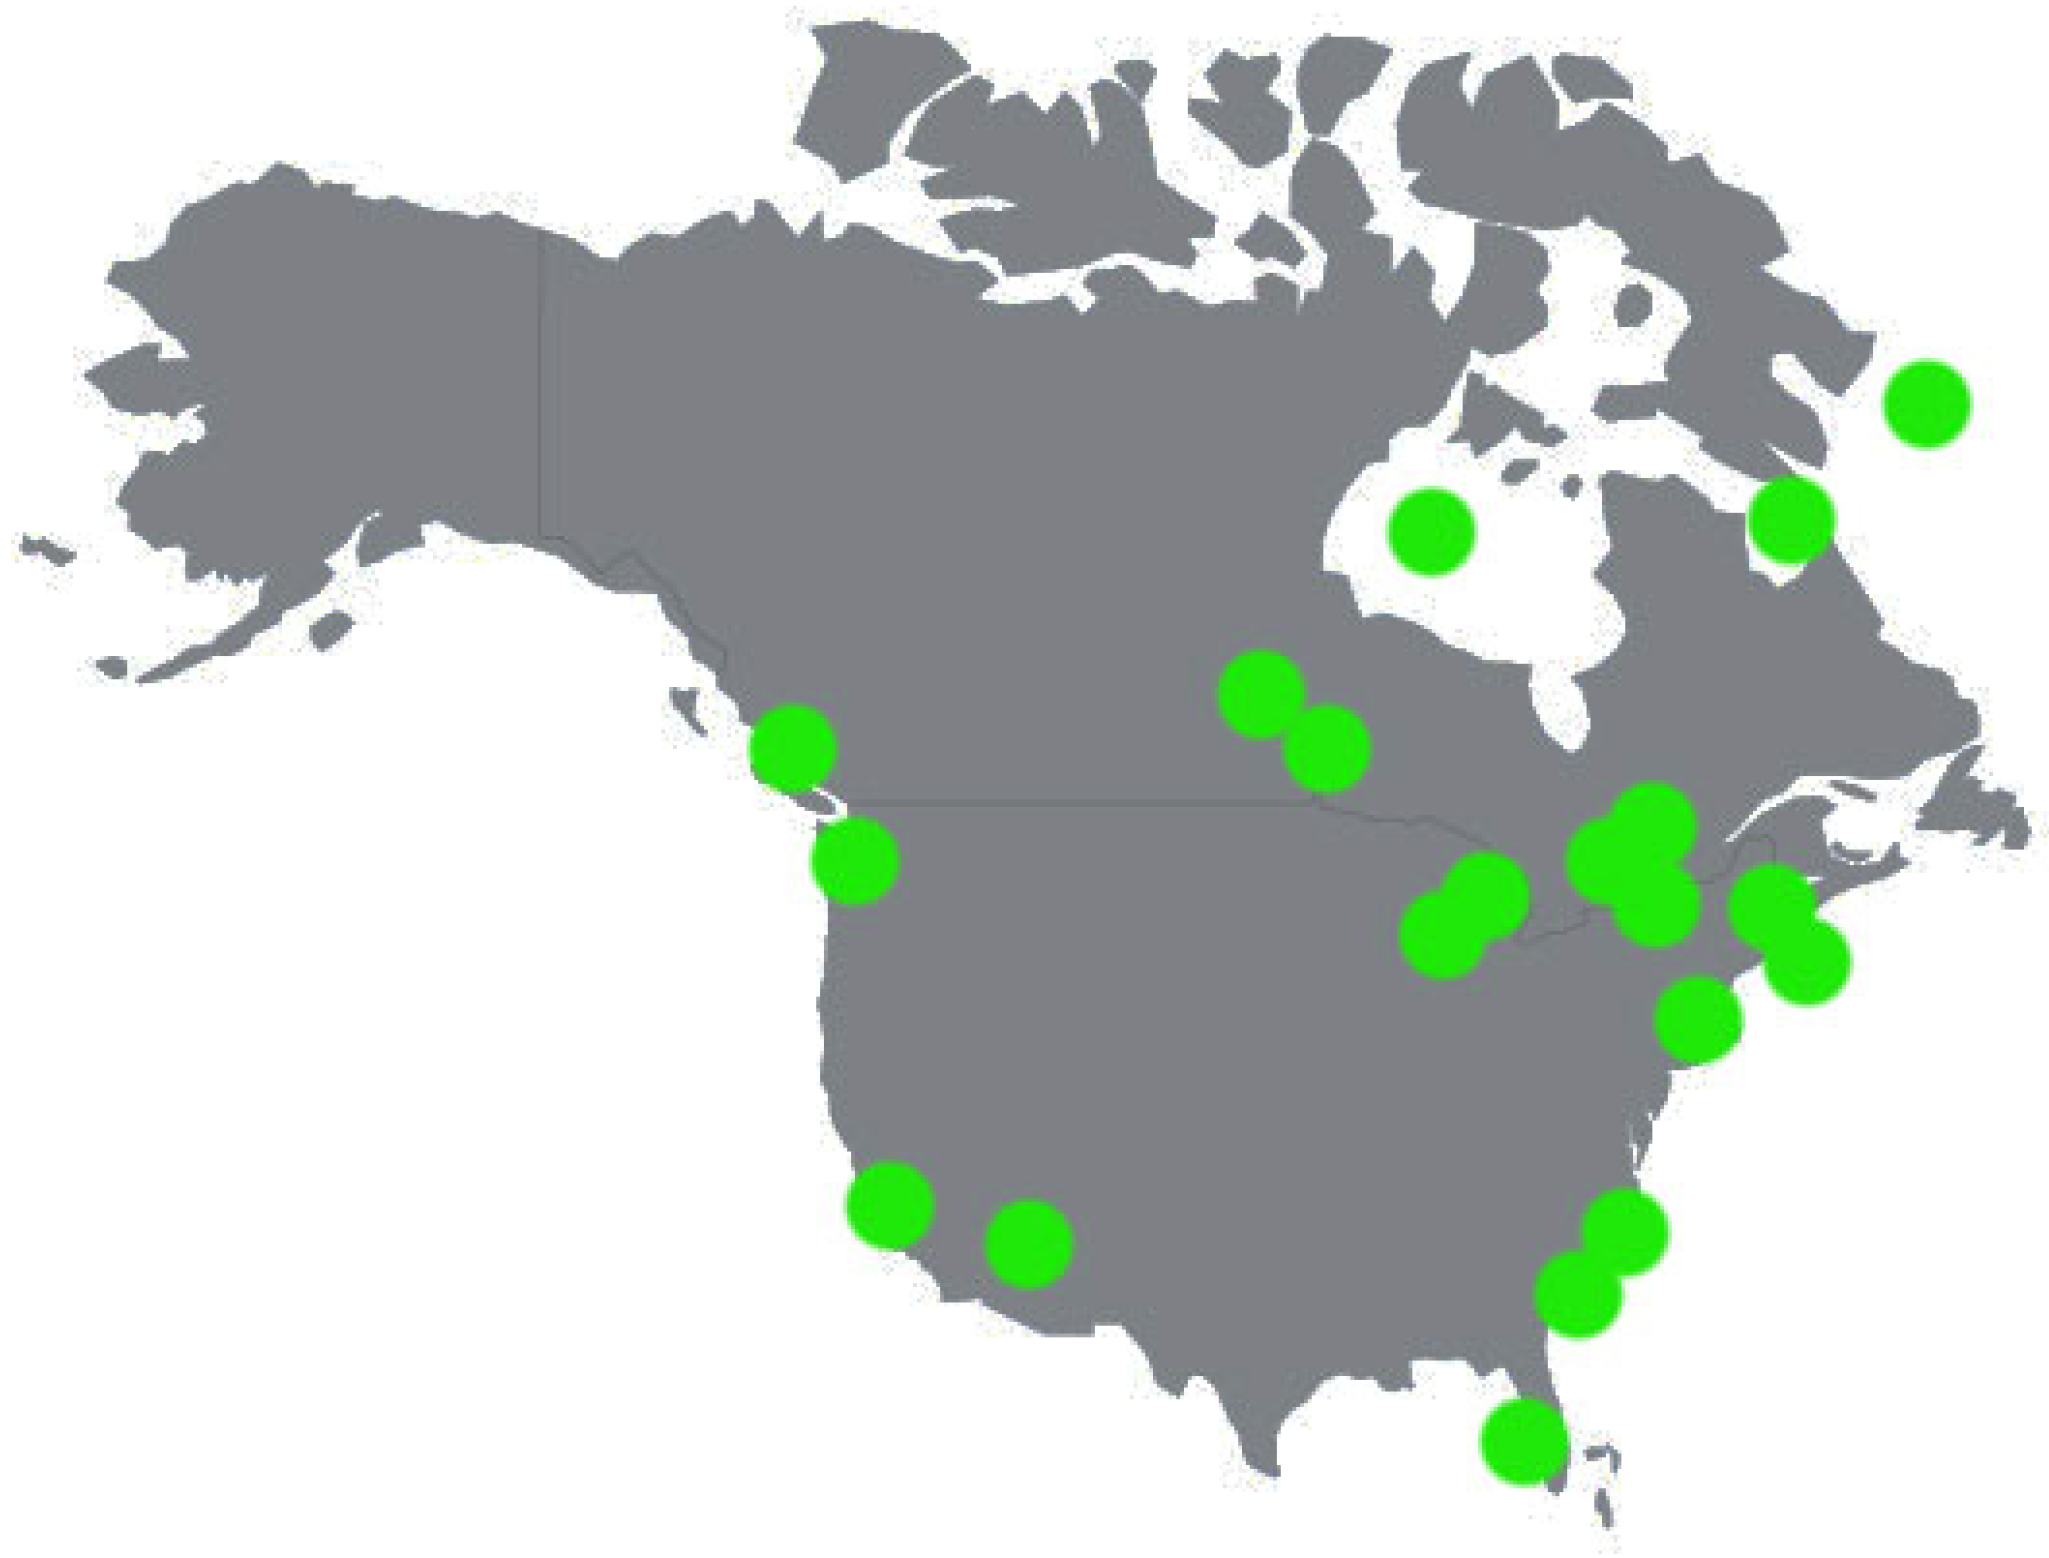
North America: In the case of the USA (n = 9, Figure 3), the highest level was found in Charleston Harbor Estuary, with MPs at the level of ~19,500 particles/m3. On the other hand, the lowest was found in Chesapeake Bay, in which the detected concentrations ranged from ~0.007 to ~1.2 particles/m3 [45,46]. The analysis of the MPS level in individual types of water reservoirs showed that in the coastal areas, the MP level was the highest; the average was about 4156 particles/m3, and the lowest in rivers was ~3.8 particles/m3 (Supplementary File S3—North America).
The next analyzed country was Canada (n = 9). In this case, the lowest level occurred in the Holland River, with ~0.1 particles/m3, while the highest occurred in lake Winnipeg and on the west coast of Vancouver Island (~1933 and ~2000 particles/m3, respectively) [47,48,49,50].
When analyzing the MPS level according to the waterbody type (Table 3), the results showed that in rivers in Canada, the average level of MPS was about ~132 particles/m3 in lakes, at ~5 particles/m3, and in the sea/bays, at ~715 particles/m3 (Supplementary File S3—North America).
On the other hand, when comparing the level between Canada and the USA, a higher level occurred in the USA than in Canada (Supplementary File S3—North America).
As in previous regions, the noticeable difference between the mean and median values is likely driven by a few exceptionally high concentrations recorded in specific coastal or estuarine sites, causing a skewed distribution of MP levels.
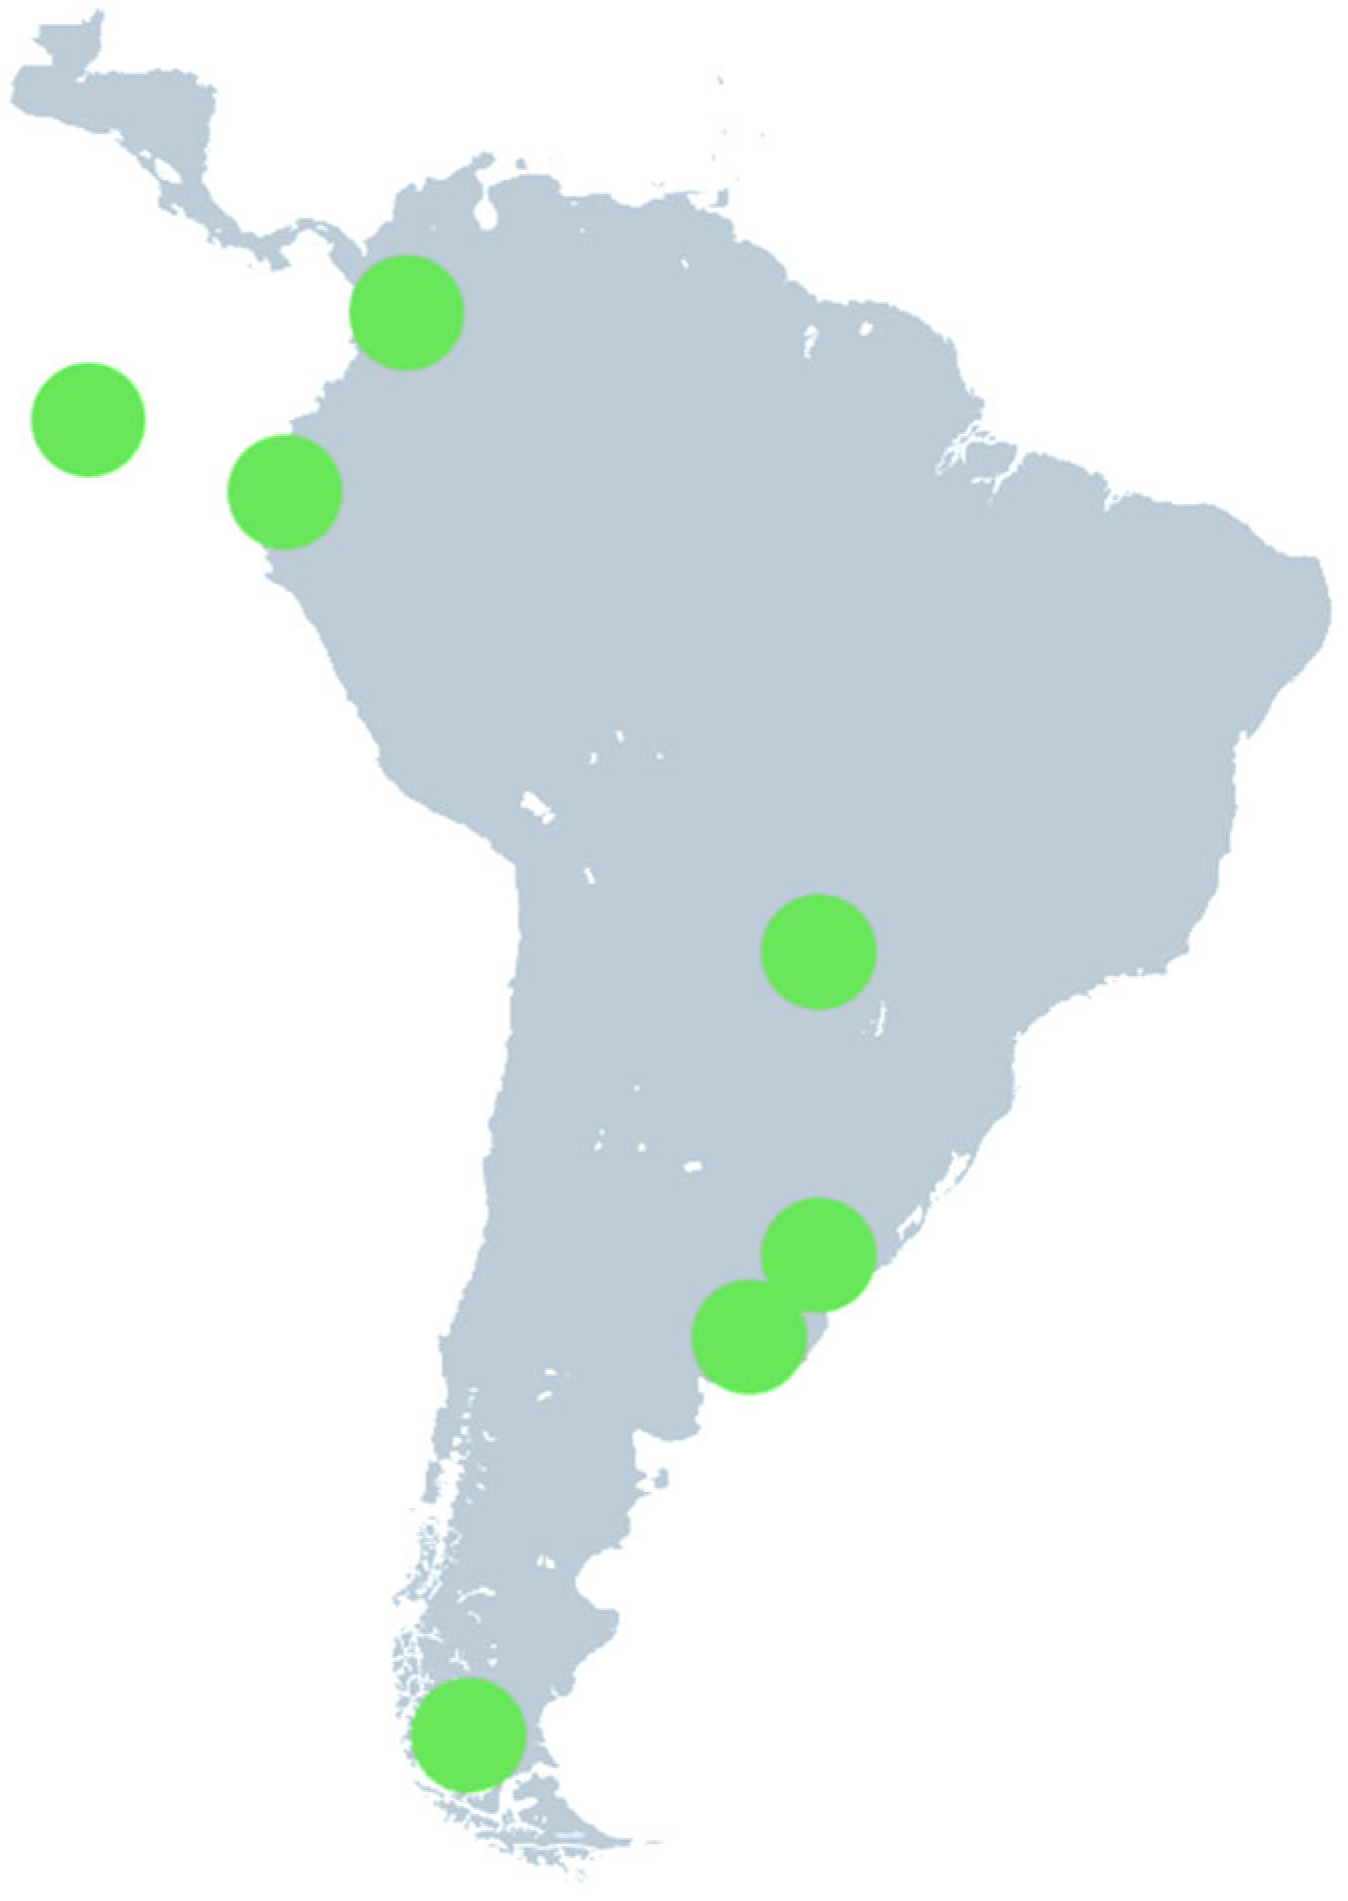
South America: In the case of South America, publications were selected mainly from the areas of Argentina, Ecuador, Paraguay and Colombia (n = 8, Figure 4), where the highest levels were found in The Bahía Blanca estuary (Argentina) in the medium range from about 596 to 30,893 particles/m3. In turn, the lowest levels were found in the Tropical Eastern Pacific and Galápagos, where the level did not exceed 1 particles/m3 [5,51]. In the remaining areas, the level ranged from approximately ~0.4 to 3700 particles/m3; however, most of the values did not exceed 200 particles/m3 (Supplementary File S4—South America).
The highest level, in terms of the waterbody type, was typical for rivers, with an average of ~1278 particles/m3; the lowest levels were in sea/coastal regions, with an average of 0.48 (Table 4, Supplementary File S4—South America). The discrepancy between the mean and median values in South American waters likely results from a few extreme values, especially in estuarine sites like Bahía Blanca, which strongly influence the average and skew the overall distribution.
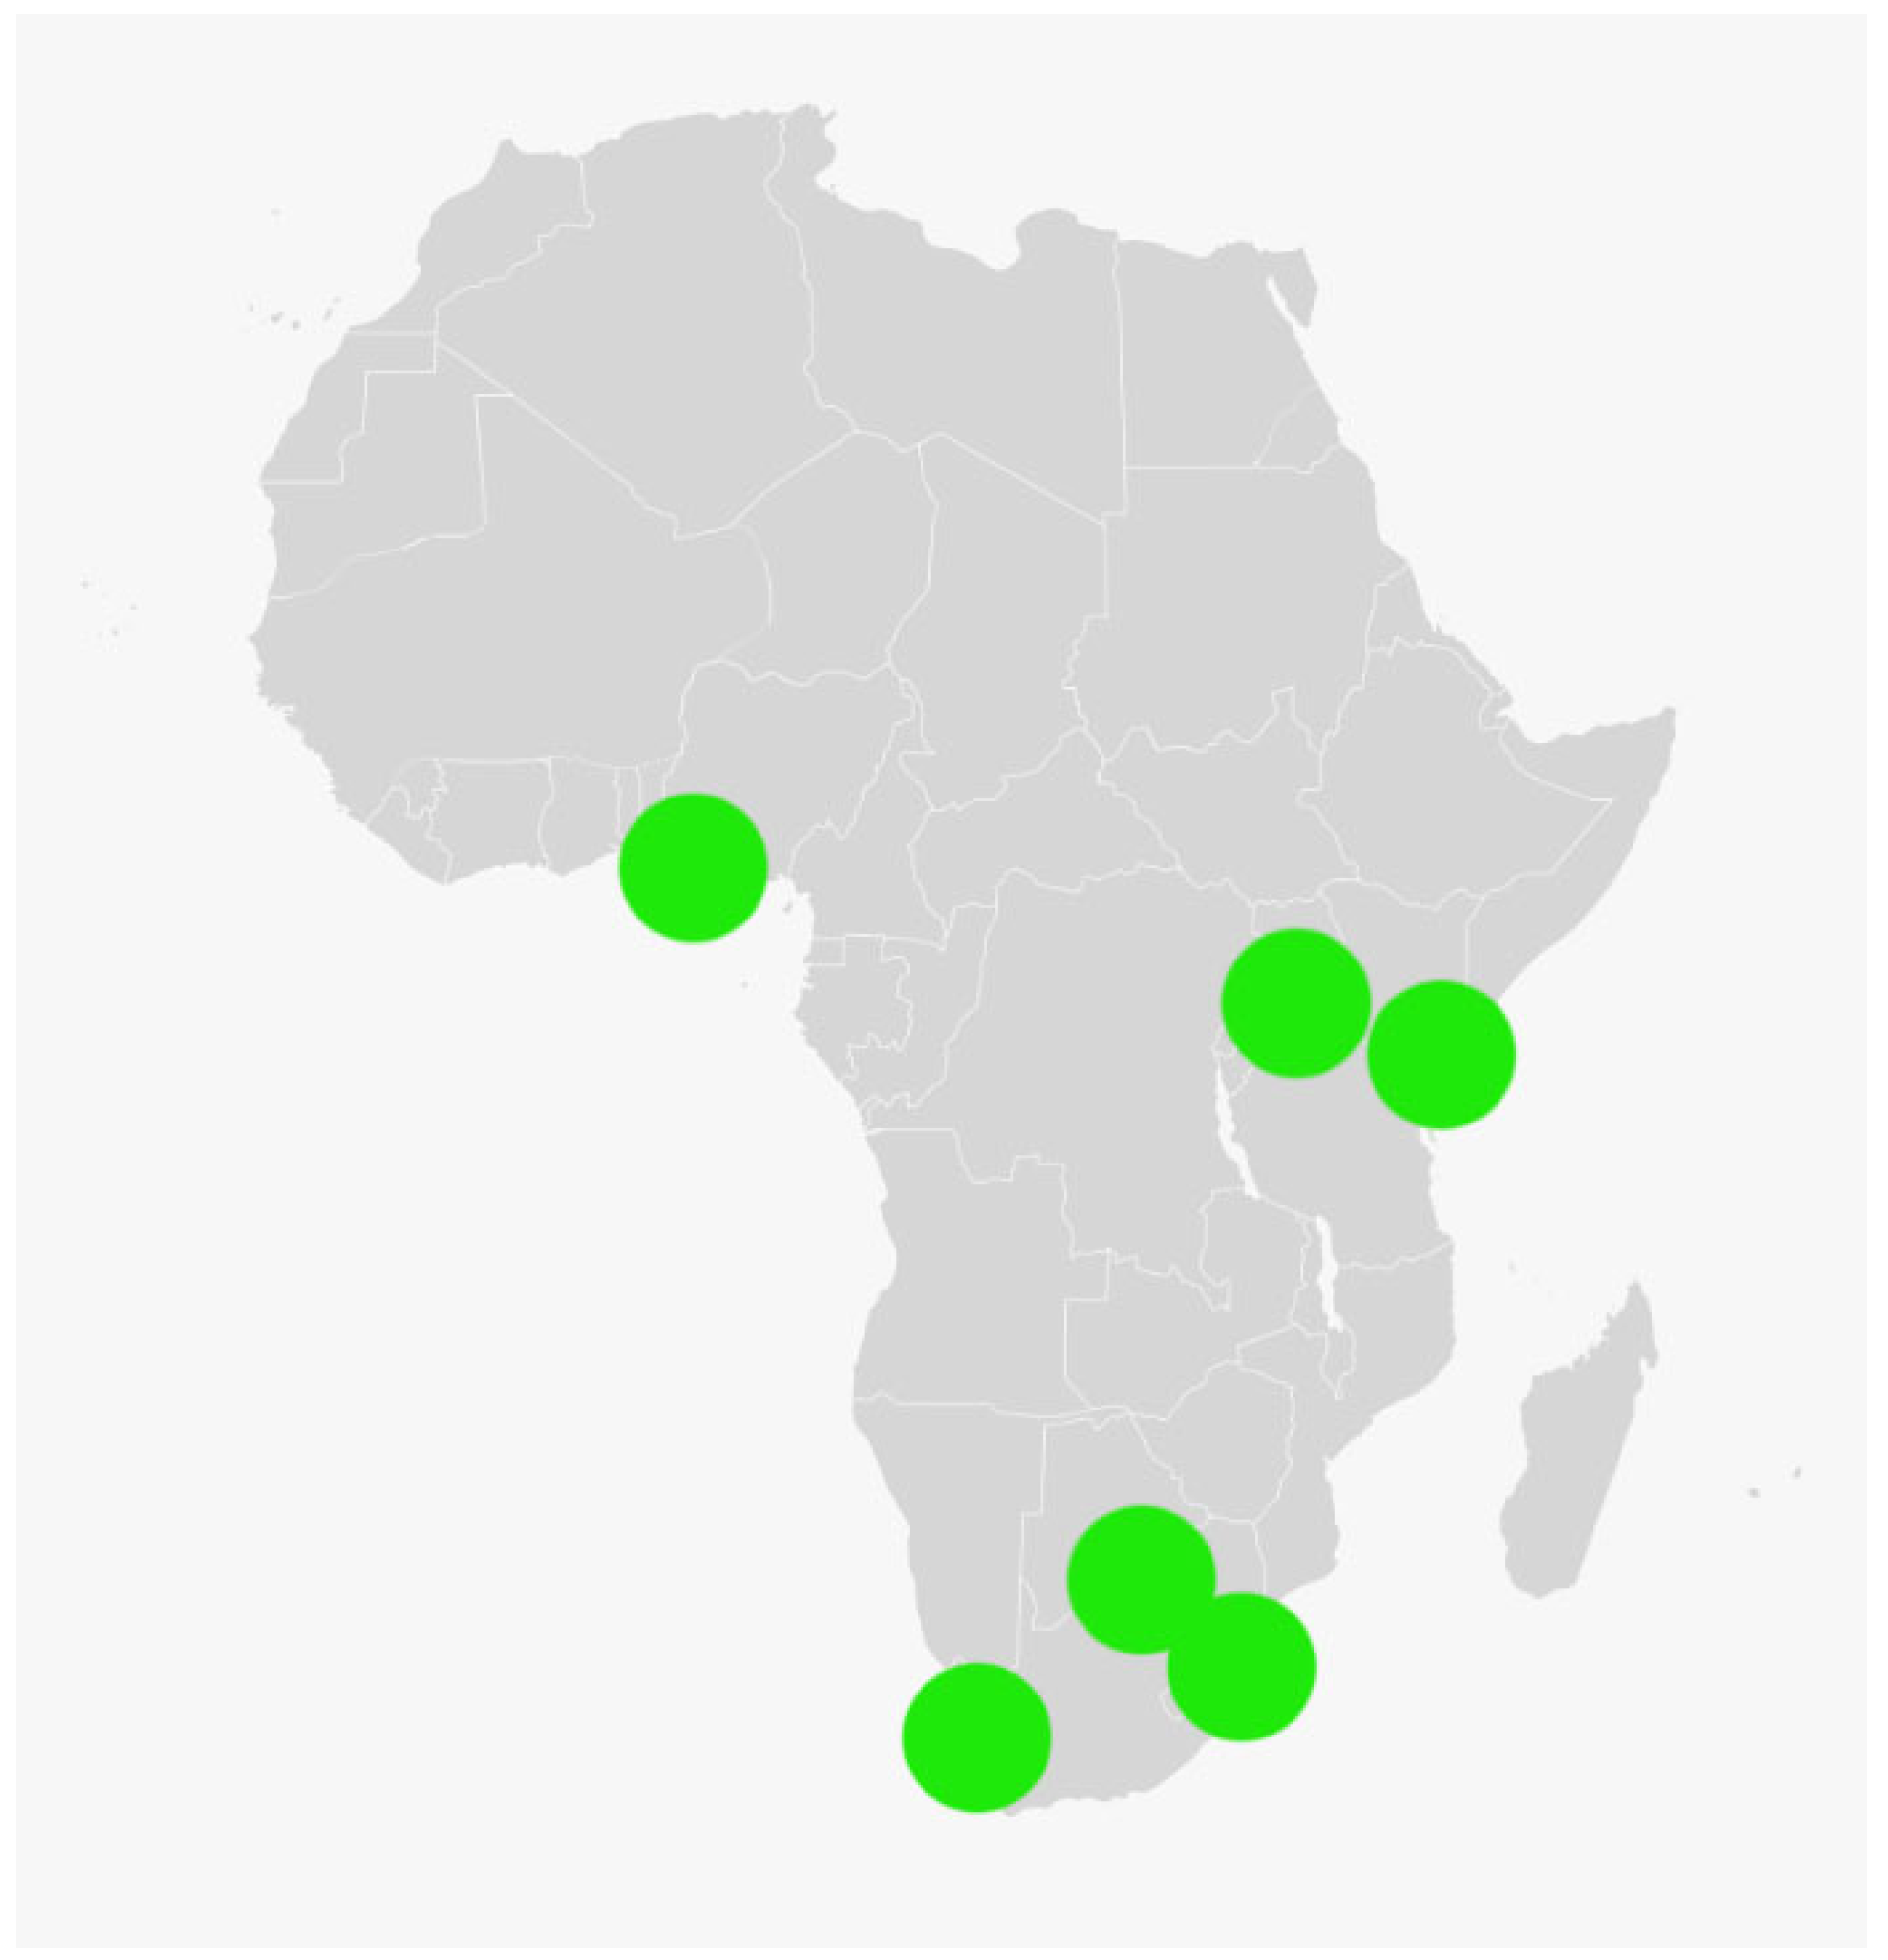
Africa: In the case of Africa (Figure 5), 12 publications were analyzed; these showed the lowest MPs level in the surface water of Lake Victoria, at ~0.14 particles/m3 [52], and the highest level in Lake Yenagoa, where the detected concentrations ranged from about 201 to 8369 particles/m3 [53]. In turn, the average MP level in the analyzed publications was about 814 particles/m3 (Supplementary File S5—Africa and Australia).
The analysis of the MP level due to the type of water reservoir showed that the highest level was found in water from lakes, with an average level of 946 particles/m3, compared to rivers or coastal regions (457 and 368 particles/m3, respectively) (Table 5, Supplementary File S5—Africa and Australia). As in other regions, the observed discrepancy between average and median values may reflect the influence of isolated hotspots with elevated MP levels, particularly in heavily polluted inland waterbodies.
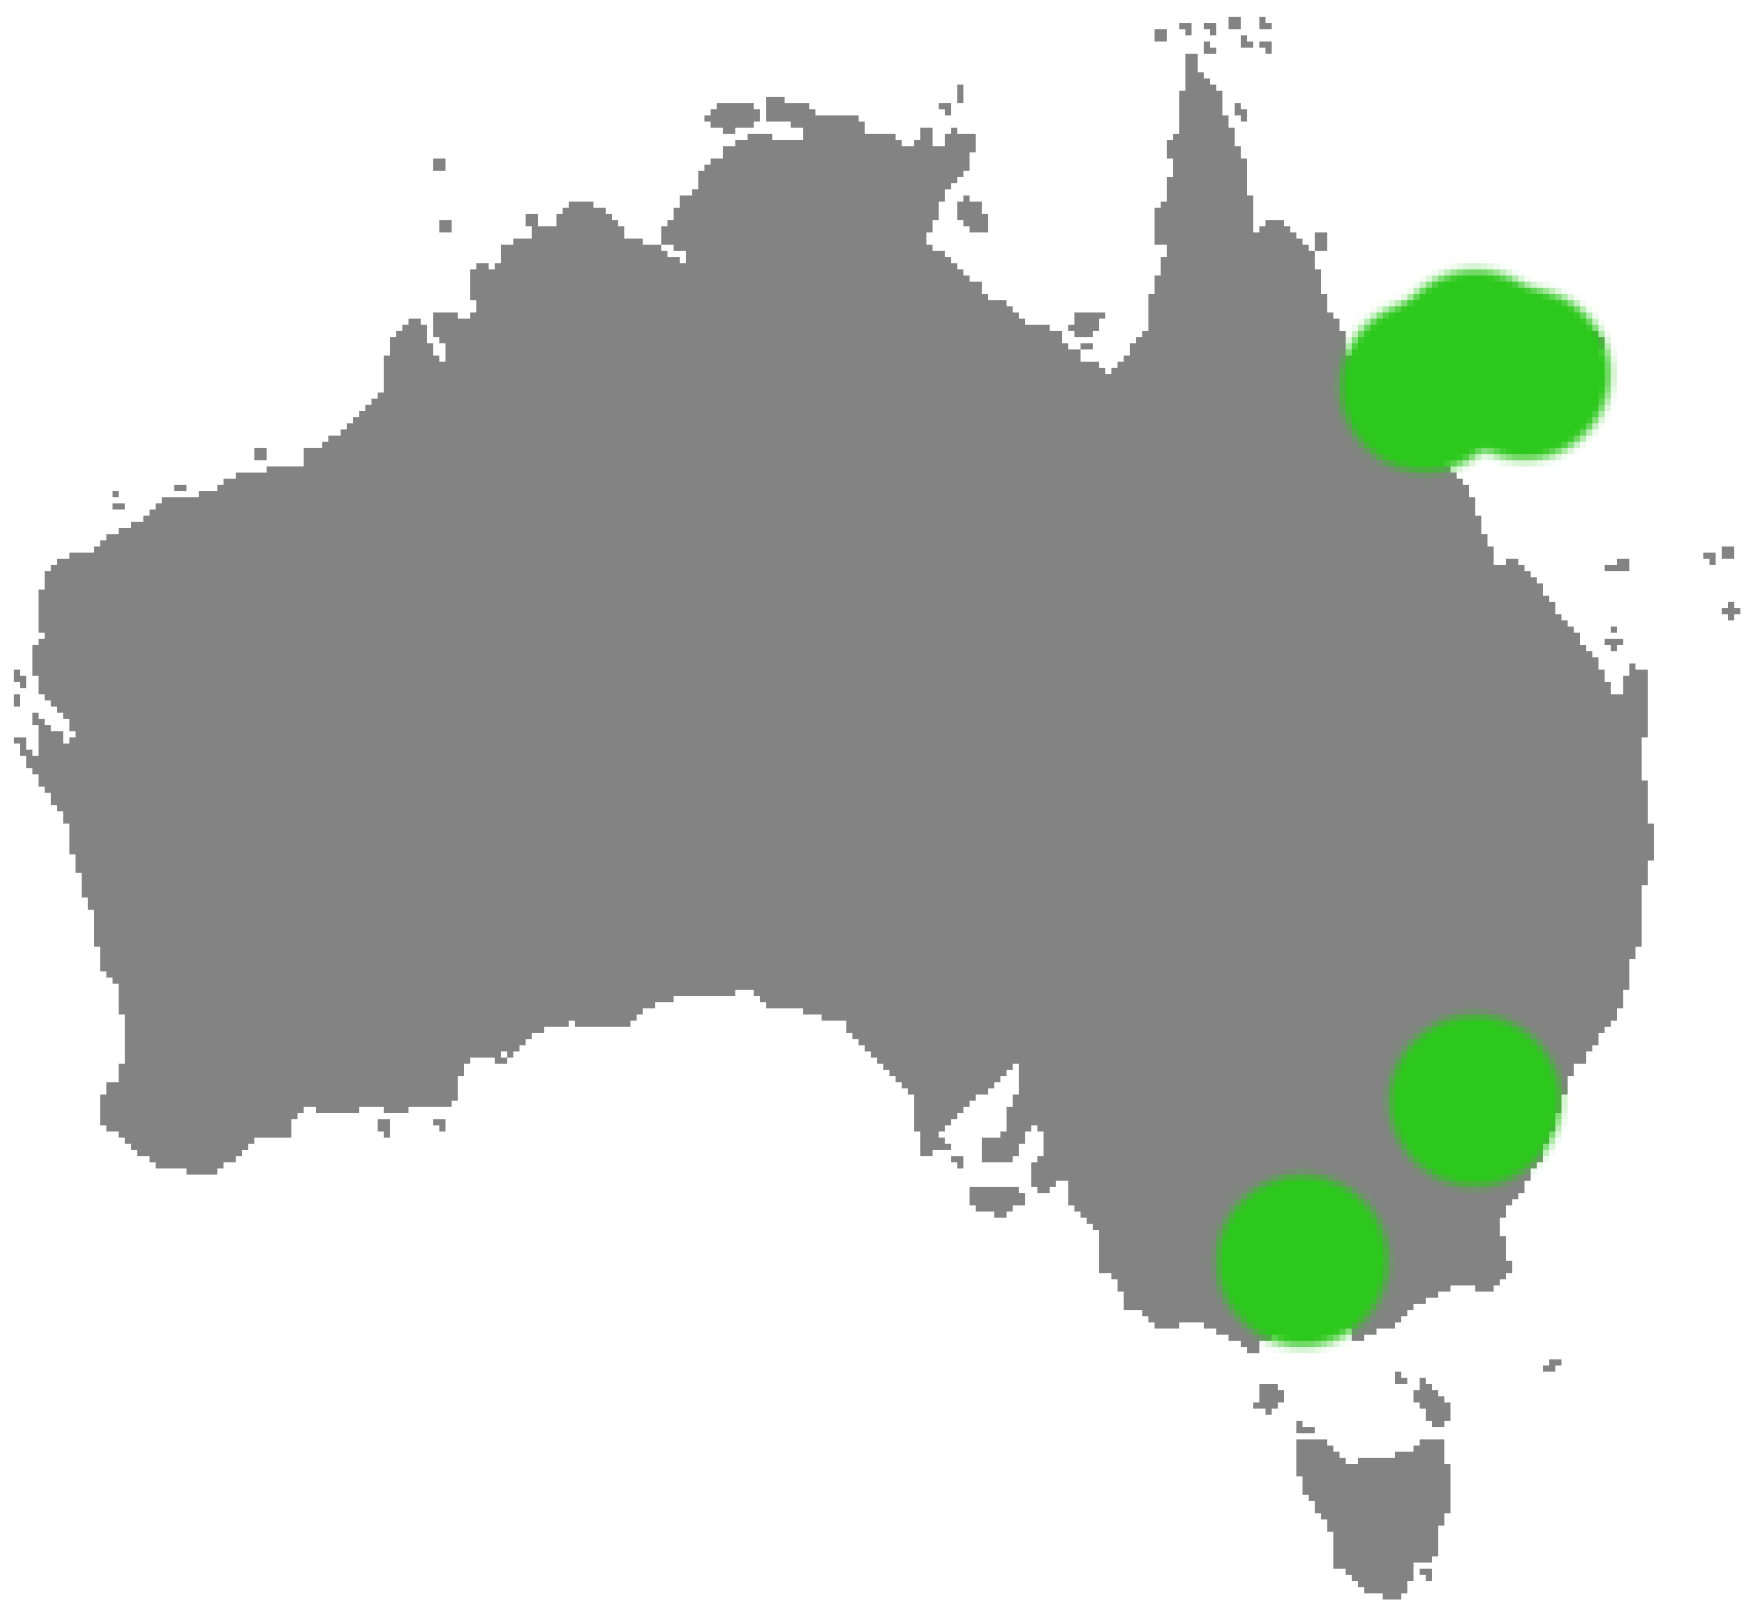
Australia: In the case of Australia, the smallest number of papers was evaluated (n = 3, Figure 6). In the analyzed studies, the highest MP level was found in northern central Victoria in the ponds holding shrimps, with this ranging from 170 to 720 particles/m3, and in the Goulburn River, with the level ranging from ~110 to 650 particles/m3 [54]. In turn, the lowest level was found in the Rib reef area, at 0.02 particles/m3 [55]. In the other analyzed places, the MP level did not exceed 2 particles/m3 (Supplementary File S5—Africa and Australia).
The comparison of MP levels depending on the water body type showed that the highest level was found in the surface water of rivers and lakes. On the other hand, the levels were the lowest in coastal regions, where the average was estimated to be ~0.08 particles/m3 (Table 6, Supplementary File S5—Africa and Australia).
As observed in other regions, the discrepancy between the average and median values may result from high outlier concentrations in specific locations (e.g., aquaculture zones), skewing the overall dataset.
Taken together, the reviewed data reveal substantial regional differences in microplastic concentrations, shaped by local anthropogenic pressures, waterbody types, and research intensity. It should be noted that current knowledge is heavily skewed toward studies from Asia and Europe, while surface waters in South America, Africa, and Australia remain largely understudied. This geographical imbalance limits the global generalizability of conclusions and underscores the urgent need for standardized, large-scale monitoring programs in underrepresented regions to provide a more comprehensive understanding of microplastic pollution patterns worldwide.

3.2. Correlation Between Microplastic Concentration and Socio-Economic Indicators

No significant correlation was found between the GDP per capita and the average concentration of MPs in surface waters across different environments (Figure 7). In rivers, Pearson’s r was 0.10 (p = 0.66), indicating a very weak and non-significant positive relationship. Similar results were observed for lakes (r = 0.28, p = 0.40) and sea/bay areas (r = 0.20, p = 0.52).
These findings suggest that the national income level (expressed as GDP per capita) is not a strong predictor of environmental microplastic contamination based on currently available data. The large variability observed in MP levels may instead be driven by other factors such as the sampling methodology, land use, plastic waste management efficiency, or hydrological conditions.
Despite the initial assumption that higher-income countries may have lower MP contamination due to better waste management [56], our correlation analysis showed no significant relationship between the GDP per capita and MP levels. This supports the idea that methodological heterogeneity and other environmental or policy-driven variables may have a stronger influence on the observed MP concentrations than economic status alone (Supplementary File S6—GDP, All).

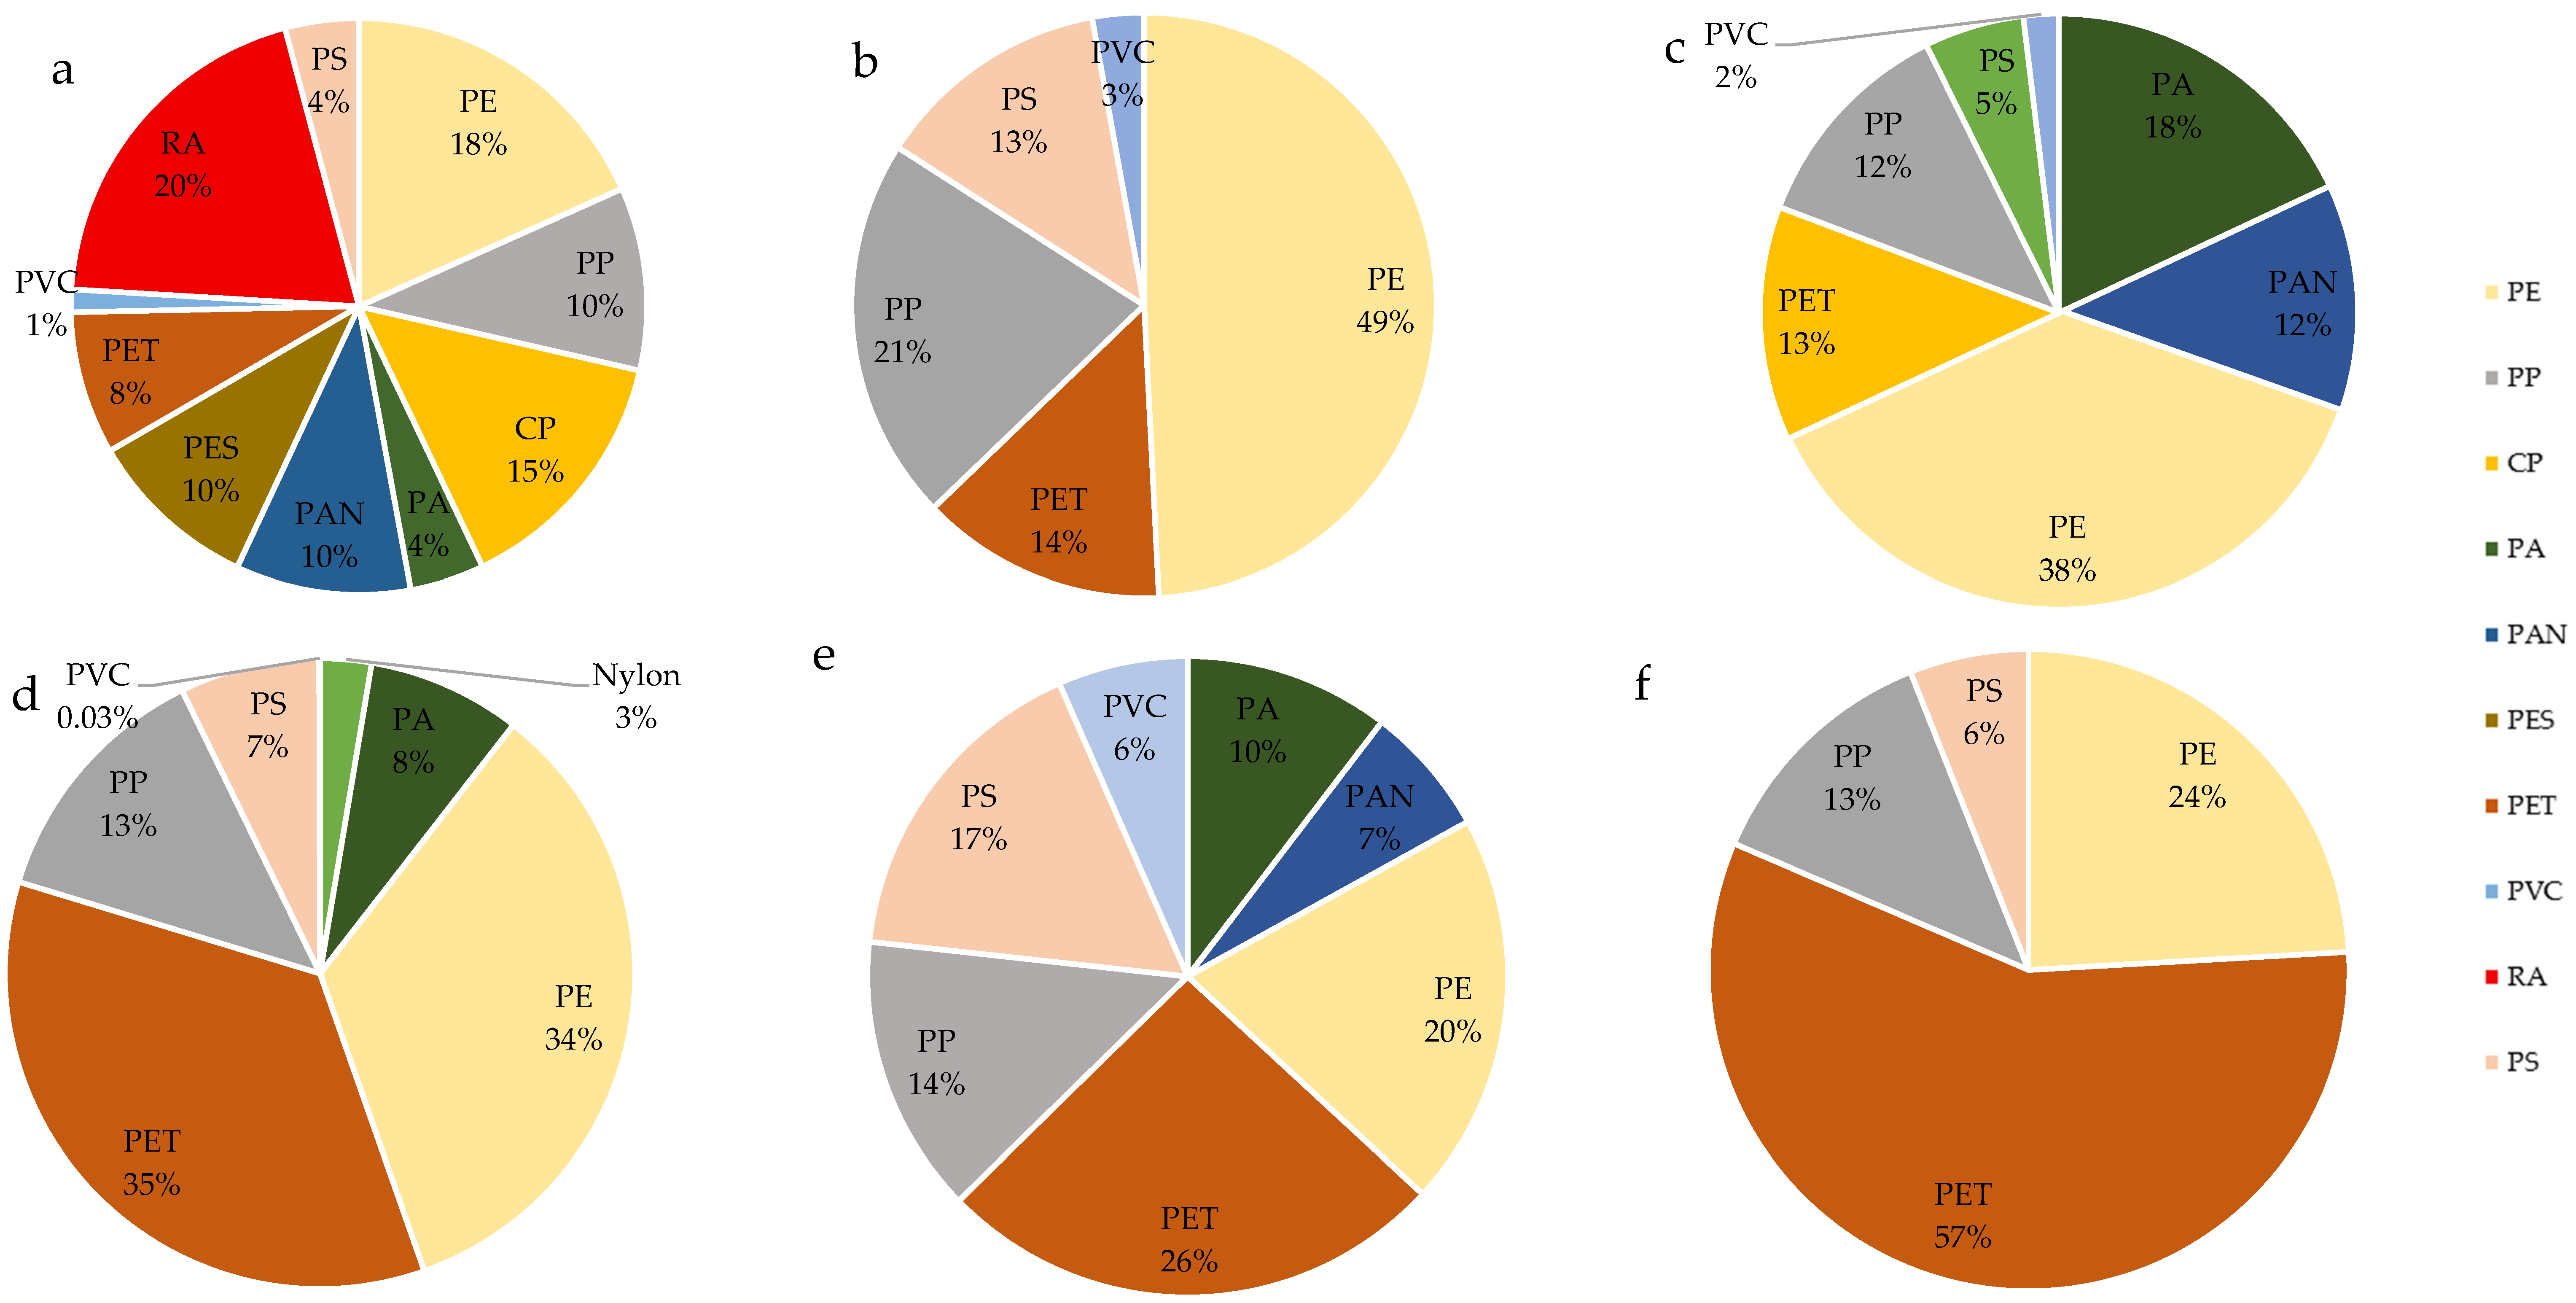
3.3. Type of Microplastic in the Transitional Waters

Asia: In an analysis of the literature in terms of the occurrence of types of MPs in surface waters in Asia, the largest share was represented by MPs from rayon (RA), at 40% on average; Polyethylene (PE), Cellophane (CP), Polypropylene (PP) and Polyester were also frequently reported, alongside terephthalic acid (PES) (Figure 8a, Supplementary File S1—Asia). In the case of China, a significant share was made up of PE and PP, which on average accounted for 20–30% of the total MP particles. In some places, RA was also found at the level of 31%, and CP at 29.2% [32,57,58,59,60,61]. As in the samples taken from China, in Thailand, a significant share comprised PP and PE, where the percentage for PP ranged from 17 to 60% and for PE ranged from 20 to 73% [62,63,64]. The MP samples from Japan, in turn, were characterized by a significant share of PE—the range was from 45 to 80% [65,66,67]. The MP particles found in Taiwan surface waters mainly comprised PE, PP, and polystyrene (PS) (respectively: 50, 30, 10%) [68]. The samples from India mainly showed RA, Polyacrylonitrile (PAN), PP and PE, the share of which was up to 50% [37,69].
Europe: The MP samples analyzed in Europe mostly showed the participation of PP and PE (Figure 8b, Supplementary File S2—Europe). In Italy, the share of PE (about 45%) was dominant, followed by PS (18–24%) and PP (15–17%) [70,71]. In turn, in the Netherlands, PA and Polyvinyl chloride (PVC) were at the level of 30% [72]. In studies on MPs in Germany, the main share comprised PE, from 34 up to 100%. Another type was PP (2.94–68.89%) [73,74]. MP samples from Spain, France and the UK were characterized by a significant share of PE, ranging from 4 to 67.1%, and PP, from 16.5 to 23%. Additionally, in the MP samples from the UK and France, publications showed a significant share of PS, ranging from 16.1 to 30% [6,75,76,77]. MP tests performed in water reservoirs in Portugal were also characterized by a significant share of PP and PE (ranging from 15 to 29.4% and from 29.4 to 33%, respectively) [78,79,80].
North America: An analysis of MP types in the literature (Figure 8c, Supplementary File S3—North America) showed that in the USA, the majority was PE (32%) and PP (13%) [36]. Similarly, in Canada, the range was 27–41.2%. Additionally, significant shares comprised PP (5–21.9%) and polyethylene terephthalate (PET) (8–10%). PA was also detected in one of the studies at the level of 16%, and PVC was detected at 1.7% [81,82,83].
South America: These surface waters (Figure 8d) were characterized by a significant share of PE, PET, and PP (respectively: 11.8–40%, 15–38.3% and 2.9–17%). Additionally, the presence of PS (2.9–8%), PA (6%), Nylon (2%) and PVC (0.03%) was also observed [84,85].
Africa: The most common types of MPs in the waters of Africa were PET, PE, PP and PS (Figure 8e, Supplementary File S5—Africa and Australia). The PET range was 6–72.6%, PE: 0.7–60.5%. PP: 7–38%, PS: 10–56%. In some cases, there was a significant proportion was RA (70.4%) or PA, at 43% [52,53,86,87,88,89,90,91].
Australia: In the case of literature analyzing the type of MPs present in waters in Australia (Figure 8f), PET was the most frequently found, ranging from 35 to 77.7%. Then, the PE ranged from 11.1 to 42%. The presence of PS (4–8%), PA (12.9%), Nylon (7.41%) and RA (8.1%) was also shown. Additionally, one of the publications showed a significant share of Polyester (PES), at 30.6% [54,55,92].

3.4. Most Common Microplastic-Associated Taxa and Their Relevance

Biofilms on microplastics (“plastisphere”—a term coined to describe the microbial biofilm that specifically forms on plastic surfaces, often enriched with unique taxa, including potential pathogens and antibiotic resistance gene carriers [93]) are largely dominated by Proteobacteria, often exceeding ~50% of microbial communities. Numerous studies, such as those conducted by Davidov et al. [94], Gökdağ et al. [95], and Jiao et al. [96], have reported a prevalence of Alphaproteobacteria (e.g., order Rhodobacterales) and Gammaproteobacteria on plastic surfaces. Alphaproteobacteria—especially Rhodobacteraceae—are typical marine biofilm pioneers, contributing to biofilm matrix formation and organic matter degradation. Gammaproteobacteria include both environmentally important taxa (e.g., Alteromonas, Alcanivorax) and potential pathogens (Vibrio, Pseudomonas, Acinetobacter) [94,95,96,97]. Alcanivorax (Proteobacteria) is a well-known hydrocarbon-degrading genus that is frequently found in marine plastispheres due to its ability to degrade aliphatic hydrocarbons and possibly plastic-derived compounds [94,95]. Alteromonas and related taxa (order Alteromonadales) are common in marine biofilms and help utilize dissolved organic carbon, facilitating further microbial colonization (Table 7) [94,96].
The second most abundant plastisphere members are typically Bacteroidetes (e.g., Flavobacteriaceae, Chitinophagaceae). These Gram-negative bacteria specialize in polymer and polysaccharide degradation, helping process organic matter that settles on plastics [94,97]. On polyethylene surfaces in the Mediterranean Sea, Bacteroidetes accounted for ~22–25% of the plastisphere—much higher than in surrounding seawater [97]. Cyanobacteria also colonize microplastics in sunlit surface layers, but their abundance on plastic is often lower than in open water (e.g., ~5% on MPs vs. ~20% in ambient plankton), likely due to competition within the biofilm or light limitation under biofilm layers [94,98]. Actinobacteria generally comprise a smaller fraction of the biofilm (often just a few percent), but some strains contribute to the degradation of recalcitrant compounds and may help break down plastic additives [97,99,100]. In freshwater, Betaproteobacteria (e.g., Burkholderiales) are often dominant, especially in nutrient-rich rivers [101].
Microplastics serve as a novel niche promoting unique microbial communities. Many dominant bacteria—such as Alcanivorax, Alteromonas, Sphingomonas—are known for degrading complex organic matter or even plastic components [94,95]. Alcanivorax, for instance, is often enriched on marine plastics due to its ability to metabolize hydrocarbons [82]. Pseudomonas and Sphingomonas, frequently reported on MPs, are metabolically versatile and capable of degrading polyurethane, PET, and other polymers [97,99]. Some biofilm members (e.g., Nitrospira, Methylophilaceae) may also play roles in nitrogen and carbon cycling, turning the plastisphere into a site of nutrient transformation [100,101].
One major concern is the presence of pathogenic or opportunistic bacteria on plastic surfaces. In marine biofilms, Vibrio spp. is frequently detected—including V. parahaemolyticus and strains related to V. cholerae. Studies show that Vibrio spp. are often more abundant on floating plastic than in surrounding seawater, raising concerns that microplastics could act as vectors for human and fish pathogens [99]. In freshwater systems, genera like Aeromonas, Pseudomonas, and Acinetobacter pose similar risks. Acinetobacter (including A. baumannii) is a known hospital-associated pathogen that was found to be enriched on riverine and estuarine plastics [72,100]. Likewise, Arcobacter (Campylobacterota) was found on riverine MPs, suggesting the potential transport of faecal indicators or wastewater-derived pathogens even in non-wastewater sites [101].
A notable example is Corynebacterium variabile, identified as the dominant taxon on polystyrene MPs in a semi-enclosed harbour in Hong Kong. Although typically associated with soil and water environments, this species can act as an opportunistic pathogen. Its dominance over MPs suggests that stagnant, low-exchange environments may promote rare and potentially harmful taxa on plastic debris [99,102].
Table 7. Dominant bacterial taxa isolated from biofilms on microplastics in freshwater and marine environments (including their average relative abundance, sampling location, and source).
Taxonomy (Phylum—Family—Genus)Abundance (%)Sampling LocationWater TypeReference
Proteobacteria—Pseudomonadaceae—Pseudomonas~12% (most frequent genus)Poyang Lake (China)Fresh[101]
Proteobacteria—Moraxellaceae—Acinetobacter~10% (enriched on MPs)Pearl River Estuary (China)Fresh (Estuarine)[72]
Campylobacterota—Arcobacteraceae—Arcobacter~3–4% (MP enrichment)Rhine River (Netherlands)Fresh[99]
Proteobacteria—Alcanivoracaceae—Alcanivorax(present; MP-specific)Eastern Mediterranean SeaMarine[94]
Proteobacteria—Vibrionaceae—Vibrio(present; dominant order)NW Mediterranean SeaMarine[99]
Actinobacteriota—Corynebacteriaceae—Corynebacterium variabile(dominant on PS MPs)Hong Kong coastal watersMarine[102]
On the other hand, recent studies confirm that microplastics (MPs) floating in natural waters harbour a variety of antibiotic resistance genes (ARGs), suggesting that MPs may act as fomites not only for pathogenic bacteria but also for genetic elements associated with antimicrobial resistance. The most commonly detected ARGs include:
  • Sulphonamide resistance genes—especially sul1 (frequently linked to the integron gene intI1) and sul2, both widely observed in MPs biofilms [103].
  • Tetracycline resistance genes—various tet genes such as tetA and tetW were repeatedly found [104].
  • Macrolide resistance genes—particularly ermF, which encodes an rRNA methyltransferase, conferring resistance to macrolides and lincosamides [105].
  • Other ARGs—such as chloramphenicol resistance genes (cat), aminoglycoside resistance genes (aad, aac), trimethoprim resistance genes (dfr), and fluoroquinolone resistance genes (qnr). Notably, clinically important β-lactamase genes (blaCTX-M, blaTEM, blaSHV) were detected in Acinetobacter, E. coli, and other resistant strains isolated from MP surfaces [106].
Due to the differences in MP composition, studies have shown that there are differences in the type of ARGs detected [103,104]. The most common types of plastics in aquatic environments—PE and PP, as we mentioned before—were also the most frequently colonized by ARG-bearing bacteria [103,105]. Studies in the Yangtze River estuary revealed that PE and PP fragments with visible biofilms had higher ARG concentrations than the surrounding water or sediments [103,106].
Other polymer types, including PS, polyethylene terephthalate PET, and polyvinyl chloride PVC, also carried ARGs. Bacteria like Bacillus, Mycobacterium, and Pseudomonas isolated from these surfaces contained sul1, tet, and other ARGs. While surface chemistry may influence colonization, exposure time and environmental availability are likely stronger factors—older, photo-oxidized, or porous plastics become hotspots for ARG accumulation [103].
The occurrence of antibiotic resistance genes (ARGs) on microplastics has been investigated across various regions of the world—from coastal waters and estuaries in Asia, to European seas, and inland rivers and lakes throughout the Americas. A particularly substantial body of data originates from East Asia (notably China), where rapid industrial development and extensive antibiotic usage contribute to significant environmental contamination. For instance, in the Yangtze River estuary, numerous plastic samples were collected, revealing biofilms enriched with diverse ARGs; the average ARG abundances on these microplastics exceeded those found in the surrounding seawater and sediments [103]. Marine aquaculture regions, such as mariculture ponds in China, are also characterized by high concentrations of ARGs on microplastics, attributed to frequent antibiotic application. One study from such an area identified up to 174 subtypes of resistance genes in the collected samples [105].
In Europe, the problem is also recognized: microplastics from the Mediterranean and Baltic Seas, as well as rivers, have been studied, with ARGs from similar classes (tetracyclines, sulphonamides, beta-lactams) detected, although typically at lower concentrations, likely due to reduced antibiotic pollution pressure [107,108,109]. The highest ARG concentrations are usually recorded where microplastics come into contact with intense sources of contamination: near municipal and hospital wastewater outfalls, river mouths, or fish and shrimp farms, where antibacterial agents enter the water [107,109]. These geographic hotspots—often found along the coasts of Southeast Asia and densely populated river deltas—show the greatest diversity and density of ARGs carried by microplastics [109]. In contrast, remote waters far from pollution sources (e.g., central ocean regions, mountain lakes) also contain microplastics, but generally with a much lower ARG abundance. Nonetheless, even in these areas, the plastisphere may act as a reservoir of ARG-bearing microbes, transported over long distances by water currents [110].
Recent studies have confirmed that microplastics also act as hotspots for antibiotic resistance genes (ARGs), harbouring sulphonamide (sul1, sul2), tetracycline (tetA, tetW), macrolide (ermF), chloramphenicol (cat), aminoglycoside (aad, aac), trimethoprim (dfr), fluoroquinolone (qnr), and clinically relevant β-lactamase genes (blaCTX-M, blaTEM, blaSHV) [109,111,112,113]. Notably, plastic types like PE, PP, PS, PET, and PVC exhibit differential ARG enrichment due to surface chemistry and ageing [113,114].
A recent study by Cholewińska et al. [109] demonstrated that MPs incubated in Oder River water led to a significantly increased pathogen abundance and ARG prevalence in both water and sediment samples, confirming MPs as vectors for antimicrobial resistance in situ.
Advances in nanoplastics research are revealing that particles <1 µm can cross cell membranes, generate reactive oxygen species, and enhance horizontal gene transfer (HGT) within biofilms. For example, a review in 2024 documented increased ARG carriage on aged MPs due to enhanced surface roughness and chemical reactivity [115,116]. In soil-based microcosms, the increased diversity of micro-/nanoplastics correlated with elevated ARG and mobile genetic element (MGE) abundance—highlighting emerging eco-toxicological pathways [117,118,119].
Although our work does not focus on nanoplastics or extreme settings, these recent developments—especially the spread of ARGs in remote or highly polluted environments—underscore the urgent need for integrated studies that combine MP characterization, ARG monitoring, and the evaluation of environmental risk in diverse ecosystems.

4. Conclusions and Perspectives

The reviewed literature confirms that microplastics (MPs) are ubiquitous in aquatic environments, detected in both marine and freshwater ecosystems on a global scale. The reported concentrations in surface waters typically range from a few particles per cubic meter in offshore marine regions to several thousand particles per cubic meter in river mouths and semi-enclosed coastal areas. Freshwater systems, such as lakes and estuaries influenced by urban or agricultural runoff, often exhibit higher contamination levels. Studies have also shown that MP abundance is positively correlated with proximity to anthropogenic sources such as wastewater discharges, aquaculture zones, and densely populated river basins.
A growing body of evidence highlights a strong positive correlation between the abundance of microplastics and the proximity to anthropogenic sources. Urban centres, industrial zones, and agricultural catchments contribute significantly to MP loads via multiple pathways, including wastewater effluent, stormwater runoff, untreated sewage, and effluent from aquaculture and food processing facilities. For instance, river mouths and estuarine systems receiving untreated or partially treated municipal wastewater often show the highest MP concentrations, especially where population density and infrastructure stress are high. Additionally, aquaculture farms and agricultural drainage have been identified as point sources of plastic debris, particularly fibres, films, and fragments from feed bags, nets, and agrochemical packaging. These human-driven inputs not only increase the environmental burden of MPs but also enhance the potential for microbial colonization and ARG dissemination. Therefore, the spatial distribution of MPs is not random but reflects the intensity and nature of local human activities, reinforcing the need for source-targeted mitigation strategies.
Among the polymer types, polyethylene (PE) and polypropylene (PP) are the most frequently identified microplastics in aquatic environments. These low-density polymers dominate due to their widespread use in packaging, textiles, and consumer goods. Other common types include polystyrene (PS), polyethylene terephthalate (PET), and polyvinyl chloride (PVC). The buoyancy and surface properties of these polymers influence their vertical distribution in the water column and their potential to be colonized by microbial biofilms.
The capacity of MPs to serve as a novel habitat—the plastisphere—has ecological and public health implications. Biofilms developing on MPs often differ in composition from surrounding planktonic communities, favouring both opportunistic and potentially pathogenic taxa such as Vibrio, Pseudomonas, Aeromonas, and Corynebacterium variabile. Furthermore, MPs facilitate the horizontal transfer of antibiotic resistance genes (ARGs) within these biofilms, including clinically important genes such as sul1, tetA, ermF, and ESBLs (blaCTX-M, blaTEM). This process is enhanced by co-selective pressures from sorbed pollutants, including antibiotics and heavy metals.
The variability in sampling protocols and analytical methods across studies highlights the need for methodological standardization to enable robust comparisons of MP levels and microbial associations across regions and timeframes. In particular, consistent metrics for reporting MP concentration (e.g., particles per m3 or gram of sediment), size classification, and polymer identification are crucial.
From the perspective of the One Health framework, which recognizes the interconnectedness of human, animal, and ecosystem health, microplastics must be viewed not only as persistent physical pollutants but also as biological vectors. Their ability to transport pathogens and ARGs across hydrological networks can facilitate the emergence and dissemination of waterborne diseases and antimicrobial resistance.
Ultimately, understanding and managing the microbial dimension of microplastic pollution is essential for protecting ecosystem integrity and public health on a global scale.

Supplementary Materials

The following supporting information can be downloaded at: https://www.mdpi.com/article/10.3390/app15158128/s1, Supplementary File S1 Asia, Supplementary File S2 Europe, Supplementary File S3 North America, Supplementary File S4 South America, Supplementary File S5 Africa and Australia, Supplementary File S6 GDP, All.

Author Contributions

Conceptualization, P.C. and K.W.; methodology, P.C. and K.W.; validation, P.P., H.M. and P.C.; formal analysis, K.W. and P.C.; investigation, P.C., K.W. and H.M.; data curation, P.C., K.W. and H.M.; writing—original draft preparation, P.C. and K.W.; writing—review and editing, D.P., P.P. and H.M.; visualization, P.C.; supervision, D.P. and P.P. All authors have read and agreed to the published version of the manuscript.

Funding

This research received no external funding.

Institutional Review Board Statement

Not applicable.

Informed Consent Statement

Not applicable.

Data Availability Statement

Not applicable.

Conflicts of Interest

The authors declare no conflicts of interest.

Abbreviations

The following abbreviations are used in this manuscript:
RARayon
PEPolyethylene
CPCellophane
PPPolypropylene
PESPolyester
PANPolyacrylonitrile
PVCPolyvinyl chloride
PETPolyethylene terephthalate
PSPolystyrene
PAPolyamide
MPsMicroplastic particles
ARGsAntibiotic resistance genes

References

  1. Lintsen, H.; Hollestelle, M.; Hölsgens, R. The plastics revolution. In How the Netherlands Became a Global Player in Plastics; Stichting Historie der Techniek: Eindhoven, The Netherlands, 2017. [Google Scholar]
  2. Plastics Europe. Plastics—The Fast Facts 2024: Europe’s Plastics Industry in 2023. Available online: https://www.plasticsengineering.org/2024/11/europes-plastics-industry-in-2023-007388 (accessed on 26 May 2025).
  3. Houssini, K.; Li, J.; Tan, Q. Complexities of the global plastics supply chain revealed in a trade-linked material flow analysis. Commun. Earth Environ. 2025, 6, 257. [Google Scholar] [CrossRef]
  4. Gigault, J.; Ter Halle, A.; Baudrimont, M.; Pascal, P.Y.; Gauffre, F.; Phi, T.L.; El Hadri, H.; Grassl, B.; Reynaud, S. Current opinion: What is a nanoplastic? Environ. Pollut. 2018, 235, 1030–1034. [Google Scholar] [CrossRef] [PubMed]
  5. European Chemicals Agency. Restricting the Use of Intentionally Added Microplastic Particles to Consumer or Professional Use Products of Any Kind; ECHA: Helsinki, Finland, 2020.
  6. Frère, L.; Maignien, L.; Chalopin, M.; Huvet, A.; Rinnert, E.; Morrison, H.; Kerninon, S.; Cassone, A.-L.; Lambert, C.; Reveillaud, J.; et al. Microplastic bacterial communities in the Bay of Brest: Influence of polymer type and size. Environ. Pollut. 2018, 242, 614–625. [Google Scholar] [CrossRef] [PubMed]
  7. Welden, N.A.; Cowie, P.R. Long-term microplastic retention causes reduced body condition in the langoustine, Nephrops norvegicus. Environ. Pollut. 2016, 218, 895–900. [Google Scholar] [CrossRef] [PubMed]
  8. Hara, J.; Frias, J.; Nash, R. Quantification of microplastic ingestion by the decapod crustacean Nephrops norvegicus from Irish waters. Mar. Pollut. Bull. 2020, 152, 110905. [Google Scholar] [CrossRef] [PubMed]
  9. Porter, A.; Godbold, J.A.; Lewis, C.N.; Savage, G.; Solan, M. Microplastic burden in marine benthic invertebrates depends on species traits and feeding ecology within biogeographical provinces. Nat. Commun. 2023, 14, 8023. [Google Scholar] [CrossRef] [PubMed]
  10. Ferreira, G.V.B.; Barletta, M.; Lima, A.R.A.; Morley, S.A.; Justino, A.K.S.; Costa, M.F. High intake rates of microplastics in a Western Atlantic predatory fish, and insights of a direct fishery effect. Environ. Pollut. 2018, 236, 706–717. [Google Scholar] [CrossRef] [PubMed]
  11. Sun, X.; Chen, B.; Xia, B.; Li, Q.; Zhu, L.; Zhao, X.; Gao, Y.; Qu, K. Impact of mariculture-derived microplastics on bacterial biofilm formation and their potential threat to mariculture: A case in situ study on the Sungo Bay, China. Environ. Pollut. 2020, 262, 114336. [Google Scholar] [CrossRef] [PubMed]
  12. Kumar, M.; Chen, H.; Sarsaiya, S.; Qin, S.; Liu, H.; Awasthi, M.K.; Kumar, S.; Singh, L.; Zhang, Z.; Bolan, N.S.; et al. Current research trends on micro-and nano-plastics as an emerging threat to global environment: A review. J. Hazard. Mater. 2021, 409, 124967. [Google Scholar] [CrossRef] [PubMed]
  13. Van Cauwenberghe, L.; Claessens, M.; Vandegehuchte, M.B.; Janssen, C.R. Microplastics are taken up by mussels (Mytilus edulis) and lugworms (Arenicola marina) living in natural habitats. Environ. Pollut. 2015, 199, 10–17. [Google Scholar] [CrossRef] [PubMed]
  14. Paul-Pont, I.; Lacroix, C.; Fernández, C.G.; Hégaret, H.; Lambert, C.; Le Goïc, N.; Soudant, P. Exposure of marine mussels Mytilus spp. to polystyrene microplastics: Toxicity and influence on fluoranthene bioaccumulation. Environ. Pollut. 2016, 216, 724–737. [Google Scholar] [CrossRef] [PubMed]
  15. Cole, M.; Lindeque, P.; Fileman, E.; Halsband, C.; Galloway, T.S. The impact of polystyrene microplastics on feeding, function and fecundity in the marine copepod Calanus helgolandicus. Environ. Sci. Technol. 2015, 49, 1130–1137. [Google Scholar] [CrossRef] [PubMed]
  16. Nelms, S.E.; Barnett, J.; Brownlow, A.; Davison, N.J.; Deaville, R.; Galloway, T.S.; Godley, B.J. Microplastics in marine mammals stranded around the British coast: Ubiquitous but transitory? Sci. Rep. 2019, 9, 1075. [Google Scholar] [CrossRef] [PubMed]
  17. Lwanga, E.H.; Beriot, N.; Corradini, F.; Silva, V.; Yang, X.; Baartman, J.; Geissen, V. Review of microplastic sources, transport pathways and correlations with other soil stressors: A journey from agricultural sites into the environment. Chem. Biol. Technol. Agric. 2022, 9, 20. [Google Scholar] [CrossRef]
  18. Mammo, F.K.; Amoah, I.D.; Gani, K.M.; Pillay, L.; Ratha, S.K.; Bux, F.; Kumari, S. Microplastics in the environment: Interactions with microbes and chemical contaminants. Sci. Total Environ. 2020, 743, 140518. [Google Scholar] [CrossRef] [PubMed]
  19. Masó, M.; Fortuño Alós, J.M.; De Juan, S.; Demestre, M. Microfouling communities from pelagic and benthic marine plastic debris sampled across Mediterranean coastal waters. Sci. Mar. 2016, 80 (Suppl. S1), 117–127. [Google Scholar] [CrossRef]
  20. Kesy, K.; Oberbeckmann, S.; Kreikemeyer, B.; Labrenz, M. Spatial environmental heterogeneity determines young biofilm assemblages on microplastics in Baltic Sea mesocosms. Front. Microbiol. 2019, 10, 1665. [Google Scholar] [CrossRef] [PubMed]
  21. Kumar, A.; Ram, K. Microplastics in Different Environmental Matrices: Co-Contaminants and its Monitoring Techniques. Water Air Soil Pollut. 2024, 235, 673. [Google Scholar] [CrossRef]
  22. Sruthy, S.; Navaneeth, A.; Jesni, K.C.; Binish, M.B.; Mohan, M.; Surendran, U.; Samuel, M.P. Microplastic Contamination in Urban Groundwater: Risk Assessment, Citizen Perception and Policy Imperatives—A Case Study of Kozhikode City, Kerala State, India. SSRN 2023. [Google Scholar] [CrossRef]
  23. Xie, L.; Ma, M.; Ge, Q.; Liu, Y.; Zhang, L. Machine Learning Advancements and Strategies in Microplastic and Nanoplastic Detection. Environ. Sci. Technol. 2025, 59, 8885–8899. [Google Scholar] [CrossRef] [PubMed]
  24. Li, C.; Zhu, L.; Wang, X.; Li, D. Elucidating the Distribution and Characteristics of Microplastics in Water Column of the Northwestern South China Sea with a Large-Volume In Situ Filtration Technology (Plankton Pump). Front. Mar. Sci. 2025, 12, 1556592. [Google Scholar] [CrossRef]
  25. Lusher, A.L.; Tirelli, V.; O’Connor, I.; Officer, R. Microplastics in Arctic polar waters: The first reported values of particles in surface and sub-surface samples. Sci. Rep. 2015, 5, 14947. [Google Scholar] [CrossRef] [PubMed]
  26. Imbulana, S.; Tanaka, S.; Yukioka, S.; Oluwoye, I. Occurrence and distribution of plastic particles (10–25,000 μm) and microfibers in the surface water of an urban river network in Japan. Environ. Monit. Assess. 2023, 196, 92. [Google Scholar] [CrossRef] [PubMed]
  27. Oo, P.Z.; Boontanon, S.K.; Boontanon, N.; Tanaka, S.; Fujii, S. Horizontal variation of microplastics with tidal fluctuation in the Chao Phraya River Estuary, Thailand. Mar. Pollut. Bull. 2021, 173 Pt A, 112933. [Google Scholar] [CrossRef] [PubMed]
  28. Tong, N.X.; Khuyen, V.T.K.; Thao, N.T.T.; Nguyen, B.T. Unraveling microplastic pollution patterns in sediments of a river system: The combined impacts of seasonal changes and waterway differences. J. Environ. Manag. 2024, 371, 123348. [Google Scholar] [CrossRef] [PubMed]
  29. Cordova, M.R.; Nurhati, I.S.; Shiomoto, A.; Hatanaka, K.; Saville, R.; Riani, E. Spatiotemporal macro debris and microplastic variations linked to domestic waste and textile industry in the supercritical Citarum River, Indonesia. Mar. Pollut. Bull. 2022, 175, 113338. [Google Scholar] [CrossRef] [PubMed]
  30. Song, Y.K.; Hong, S.H.; Jang, M.; Han, G.M.; Shim, W.J. Occurrence and distribution of microplastics in the sea surface microlayer in Jinhae Bay, South Korea. Arch. Environ. Contam. Toxicol. 2015, 69, 279–287. [Google Scholar] [CrossRef] [PubMed]
  31. Kang, J.-H.; Kwon, O.-Y.; Shim, W.J. Potential Threat of Microplastics to Zooplanktivores in the Surface Waters of the Southern Sea of Korea. Arch. Environ. Contam. Toxicol. 2015, 69, 340–351. [Google Scholar] [CrossRef] [PubMed]
  32. Ma, J.; Niu, X.; Zhang, D.; Lu, L.; Ye, X.; Deng, W.; Li, Y.; Lin, Z. High levels of microplastic pollution in aquaculture water of fish ponds in the Pearl River Estuary of Guangzhou, China. Sci. Total Environ. 2020, 744, 140679. [Google Scholar] [CrossRef] [PubMed]
  33. Sun, X.; Liang, J.; Zhu, M.; Zhao, Y.; Zhang, B. Microplastics in seawater and zooplankton from the Yellow Sea. Environ. Pollut. 2018, 242, 585–595. [Google Scholar] [CrossRef] [PubMed]
  34. Zhao, S.; Zhu, L.; Wang, T.; Li, D. Suspended microplastics in the surface water of the Yangtze Estuary System, China: First observations on occurrence, distribution. Mar. Pollut. Bull. 2014, 86, 562–568. [Google Scholar] [CrossRef] [PubMed]
  35. Vibhatabandhu, P.; Srithongouthai, S. Abundance and Characteristics of Microplastics Contaminating the Surface Water of the Inner Gulf of Thailand. Water Air Soil Pollut. 2022, 233, 50. [Google Scholar] [CrossRef]
  36. Singh, N.; Mondal, A.; Bagri, A.; Tiwari, E.; Khandelwal, N.; Monikh, F.A.; Darbha, G.K. Characteristics and spatial distribution of microplastics in the lower Ganga River water and sediment. Mar. Pollut. Bull. 2021, 163, 111960. [Google Scholar] [CrossRef] [PubMed]
  37. Lechthaler, S.; Waldschläger, K.; Sandhani, C.G.; Sannasiraj, S.A.; Sundar, V.; Schwarzbauer, J.; Schüttrumpf, H. Baseline Study on Microplastics in Indian Rivers Under Different Anthropogenic Influences. Water 2021, 13, 1648. [Google Scholar] [CrossRef]
  38. Chen, C.-F.; Ju, Y.-R.; Lim, Y.C.; Hsu, N.-H.; Lu, K.-T.; Hsieh, S.-L.; Dong, C.-D.; Chen, C.-W. Microplastics and their affiliated PAHs in the sea surface connected to the southwest coast of Taiwan. Chemosphere 2020, 254, 126818. [Google Scholar] [CrossRef] [PubMed]
  39. Wong, G.; Löwemark, L.; Kunz, A. Microplastic pollution of the Tamsui River and its tributaries in northern Taiwan: Spatial heterogeneity and correlation with precipitation. Environ. Pollut. 2020, 260, 113935. [Google Scholar] [CrossRef] [PubMed]
  40. Fischer, E.K.; Paglialonga, L.; Czech, E.; Tamminga, M. Microplastic pollution in lakes and lake shoreline sediments—A case study on Lake Bolsena and Lake Chiusi (central Italy). Environ. Pollut. 2016, 213, 648–657. [Google Scholar] [CrossRef] [PubMed]
  41. Atwood, E.C.; Falcieri, F.M.; Piehl, S.; Bochow, M.; Matthies, M.; Franke, J.; Siegert, F. Coastal accumulation of microplastic particles emitted from the Po River, Northern Italy: Comparing remote sensing and hydrodynamic modelling with in situ sample collections. Mar. Pollut. Bull. 2019, 138, 561–574. [Google Scholar] [CrossRef] [PubMed]
  42. Gallitelli, L.; Cesarini, G.; Cera, A.; Sighicelli, M.; Lecce, F.; Menegoni, P.; Scalici, M. Transport and Deposition of Microplastics and Mesoplastics along the River Course: A Case Study of a Small River in Central Italy. Hydrology 2020, 7, 90. [Google Scholar] [CrossRef]
  43. van der Hal, N.; Ariel, A.; Angel, D.L. Exceptionally high abundances of microplastics in the oligotrophic Israeli Mediterranean coastal waters. Mar. Pollut. Bull. 2017, 116, 151–155. [Google Scholar] [CrossRef] [PubMed]
  44. Adamopoulou, A.; Zeri, C.; Garaventa, F.; Gambardella, C.; Ioakeimidis, C.; Pitta, E. Distribution patterns of floating microplastics in open and coastal waters of the eastern Mediterranean Sea (Ionian, Aegean, and Levantine seas). Front. Mar. Sci. 2021, 8, 699000. [Google Scholar] [CrossRef]
  45. Leads, R.R.; Weinstein, J.E. Occurrence of tire wear particles and other microplastics within the tributaries of the Charleston Harbor Estuary, South Carolina, USA. Mar. Pollut. Bull. 2019, 145, 569–582. [Google Scholar] [CrossRef] [PubMed]
  46. Bikker, J.; Lawson, J.; Wilson, S.; Rochman, C.M. Microplastics and other anthropogenic particles in the surface waters of the Chesapeake Bay. Mar. Pollut. Bull. 2020, 156, 111257. [Google Scholar] [CrossRef] [PubMed]
  47. Anderson, P.J.; Warrack, S.; Langen, V.; Challis, J.K.; Hanson, M.L.; Rennie, M.D. Microplastic contamination in Lake Winnipeg, Canada. Environ. Pollut. 2017, 225, 223–231. [Google Scholar] [CrossRef] [PubMed]
  48. Desforges, J.P.W.; Galbraith, M.; Dangerfield, N.; Ross, P.S. Widespread distribution of microplastics in subsurface seawater in the NE Pacific Ocean. Mar. Pollut. Bull. 2014, 79, 94–99. [Google Scholar] [CrossRef] [PubMed]
  49. Felismino, M.E.L.; Helm, P.A.; Rochman, C.M. Microplastic and other anthropogenic microparticles in water and sediments of Lake Simcoe. J. Great Lakes Res. 2021, 47, 180–189. [Google Scholar] [CrossRef]
  50. Alfaro-Núñez, A.; Astorga, D.; Cáceres-Farías, L.; Bastidas, L.; Soto Villegas, C.; Macay, K.C.; Christensen, J.H. Microplastic pollution in seawater and marine organisms across the Tropical Eastern Pacific and Galápagos. Sci. Rep. 2021, 11, 6424. [Google Scholar] [CrossRef] [PubMed]
  51. Forero-López, A.D.; Rimondino, G.N.; Truchet, D.M.; Colombo, C.V.; Buzzi, N.S.; Malanca, F.E.; Spetter, C.V.; Fernández-Severini, M.D. Occurrence, distribution, and characterization of suspended microplastics in a highly impacted estuarine wetland in Argentina. Sci. Total Environ. 2021, 791, 147141. [Google Scholar] [CrossRef] [PubMed]
  52. Egessa, R.; Nankabirwa, A.; Ocaya, H.; Pabire, W.G. Microplastic pollution in surface water of Lake Victoria. Sci. Total Environ. 2020, 741, 140201. [Google Scholar] [CrossRef] [PubMed]
  53. Oni, B.A.; Ayeni, A.O.; Agboola, O.; Oguntade, T.; Obanla, O. Comparing microplastics contaminants in (dry and raining) seasons for Ox-Bow Lake in Yenagoa, Nigeria. Ecotoxicol. Environ. Saf. 2020, 198, 110656. [Google Scholar] [CrossRef] [PubMed]
  54. Nan, B.; Su, L.; Kellar, C.; Craig, N.J.; Keough, M.J.; Pettigrove, V. Identification of microplastics in surface water and Australian freshwater shrimp Paratya australiensis in Victoria, Australia. Environ. Pollut. 2020, 259, 113865. [Google Scholar] [CrossRef] [PubMed]
  55. Jensen, L.H.; Motti, C.A.; Garm, A.L.; Tonin, H.; Kroon, F.J. Sources, distribution and fate of microfibres on the Great Barrier Reef, Australia. Sci. Rep. 2019, 9, 9021. [Google Scholar] [CrossRef] [PubMed]
  56. Chen, H.; Qin, Y.; Huang, H.; Xu, W. A Regional Difference Analysis of Microplastic Pollution in Global Freshwater Bodies Based on a Regression Model. Water 2020, 12, 1889. [Google Scholar] [CrossRef]
  57. Deng, H.; Zhang, Y.; Gong, W.; Li, G.; Wang, X.; Li, J. Microplastic Pollution in Water and Sediment in a Textile Industrial Area. Environ. Pollut. 2020, 258, 113658. [Google Scholar] [CrossRef] [PubMed]
  58. Su, L.; Xue, Y.; Li, L.; Yang, D.; Kolandhasamy, P.; Li, D.; Shi, H. Microplastics in Taihu Lake, China. Environ. Pollut. 2016, 216, 711–719. [Google Scholar] [CrossRef] [PubMed]
  59. Jiang, P.; Zhao, S.; Zhu, L.; Li, D. Microplastic-associated bacterial assemblages in the intertidal zone of the Yangtze Estuary. Sci. Total Environ. 2018, 624, 48–54. [Google Scholar] [CrossRef] [PubMed]
  60. Wang, F.; Wang, B.; Duan, L.; Zhang, Y.; Zhou, Y.; Sui, Q.; Yu, G. Occurrence and distribution of microplastics in domestic, industrial, agricultural and aquacultural wastewater sources: A case study in Changzhou, China. Water Res. 2020, 182, 115956. [Google Scholar] [CrossRef] [PubMed]
  61. Wang, Q.; Huang, K.; Li, Y.; Zhang, Y.; Yan, L.; Xu, K.; Wang, J. Microplastics abundance, distribution, and composition in freshwater and sediments from the largest Xijin Wetland Park, Nanning, South China. Gondwana Res. 2022, 108, 13–21. [Google Scholar] [CrossRef]
  62. Babel, S.; Ta, A.T.; Loan, N.T.P.; Sembiring, E.; Setiadi, T.; Sharp, A. Microplastics pollution in selected rivers from Southeast Asia. APN Sci. Bulletin. 2022, 12, 5–17. [Google Scholar] [CrossRef]
  63. Ta, A.T.; Babel, S. Microplastics pollution with heavy metals in the aquaculture zone of the Chao Phraya River Estuary, Thailand. Mar. Pollut. Bull. 2020, 161, 111747. [Google Scholar] [CrossRef] [PubMed]
  64. Prarat, P.; Hongsawat, P. Microplastic pollution in surface seawater and beach sand from the shore of Rayong Province, Thailand: Distribution, characterization, and ecological risk assessment. Mar. Pollut. Bull. 2022, 174, 113200. [Google Scholar] [CrossRef] [PubMed]
  65. Yagi, M.; Kobayashi, T.; Maruyama, Y.; Hoshina, S.; Masumi, S.; Aizawa, I.; Shimizu, K. Microplastic pollution of commercial fishes from coastal and offshore waters in southwestern Japan. Mar. Pollut. Bull. 2022, 174, 113304. [Google Scholar] [CrossRef] [PubMed]
  66. Ripken, C.; Kotsifaki, D.G.; Chormaic, S.N. Analysis of small microplastics in coastal surface water samples of the subtropical island of Okinawa, Japan. Sci. Total Environ. 2021, 760, 143927. [Google Scholar] [CrossRef] [PubMed]
  67. Kobayashi, T.; Yagi, M.; Kawaguchi, T.; Hata, T.; Shimizu, K. Spatiotemporal variations of surface water microplastics near Kyushu, Japan: A quali-quantitative analysis. Mar. Pollut. Bull. 2021, 169, 112563. [Google Scholar] [CrossRef] [PubMed]
  68. Nguyen, N.T.; Nhon, N.T.T.; Hai, H.T.N.; Chi, N.D.T.; Hien, T.T. Characteristics of microplastics and their affiliated PAHs in surface water in Ho Chi Minh City, Vietnam. Polymers 2022, 14, 2450. [Google Scholar] [CrossRef] [PubMed]
  69. Napper, I.E.; Baroth, A.; Barrett, A.C.; Bhola, S.; Chowdhury, G.W.; Davies, B.F.; Koldewey, H. The abundance and characteristics of microplastics in surface water in the transboundary Ganges River. Environ. Pollut. 2021, 274, 116348. [Google Scholar] [CrossRef] [PubMed]
  70. Sighicelli, M.; Pietrelli, L.; Lecce, F.; Iannilli, V.; Falconieri, M.; Coscia, L.; Di Vito, S.; Nuglio, S.; Zampetti, G. Microplastic pollution in the surface waters of Italian Subalpine Lakes. Environ. Pollut. 2018, 236, 645–651. [Google Scholar] [CrossRef] [PubMed]
  71. Di Pippo, F.; Venezia, C.; Sighicelli, M.; Pietrelli, L.; Di Vito, S.; Nuglio, S.; Rossetti, S. Microplastic-associated biofilms in lentic Italian ecosystems. Water Res. 2020, 187, 116429. [Google Scholar] [CrossRef] [PubMed]
  72. Mughini-Gras, L.; van der Plaats, R.Q.J.; van der Wielen, P.W.J.J.; Bauerlein, P.S.; de Roda Husman, A.M. Riverine microplastic and microbial community compositions: A field study in The Netherlands. Water Res. 2021, 192, 116852. [Google Scholar] [CrossRef] [PubMed]
  73. Bayerisches Landesamt für Umwelt. Mikroplastik in der Umwelt. 2019. Available online: https://www.lfu.bayern.de (accessed on 26 May 2025).
  74. Tamminga, M.; Hengstmann, E.; Deuke, A.K.; Fischer, E.K. Microplastic concentrations, characteristics, and fluxes in water bodies of the Tollense catchment, Germany, with regard to different sampling systems. Environ. Sci. Pollut. Res. 2022, 29, 11345–11358. [Google Scholar] [CrossRef] [PubMed]
  75. Dalmau-Soler, J.; Ballesteros-Cano, R.; Boleda, M.R.; Paraira, M.; Ferrer, N.; Lacorte, S. Microplastics from headwaters to tap water: Occurrence and removal in a drinking water treatment plant in Barcelona Metropolitan area (Catalonia, NE Spain). Environ. Sci. Pollut. Res. 2021, 28, 59462–59472. [Google Scholar] [CrossRef] [PubMed]
  76. Blair, R.M.; Waldron, S.; Gauchotte-Lindsay, C. Average daily flow of microplastics through a tertiary wastewater treatment plant over a ten-month period. Water Res. 2019, 163, 114909. [Google Scholar] [CrossRef] [PubMed]
  77. Hurley, R.R.; Woodward, J.C.; Rothwell, J.J. Ingestion of microplastics by freshwater tubifex worms. Environ. Sci. Technol. 2017, 51, 12844–12851. [Google Scholar] [CrossRef] [PubMed]
  78. Rodrigues, M.O.; Abrantes, N.; Gonçalves, F.J.M.; Nogueira, H.; Marques, J.C.; Gonçalves, A.M.M. Spatial and temporal distribution of microplastics in water and sediments of a freshwater system (Antuã River, Portugal). Sci. Total Environ. 2018, 633, 1549–1559. [Google Scholar] [CrossRef] [PubMed]
  79. Morgado, V.; Gomes, L.; da Silva, R.J.B.; Palma, C. Microplastics contamination in sediments from Portuguese inland waters: Physical-chemical characterisation and distribution. Sci. Total Environ. 2022, 832, 155053. [Google Scholar] [CrossRef] [PubMed]
  80. Sá, B.; Pais, J.; Antunes, J.; Pequeno, J.; Pires, A.; Sobral, P. Seasonal Abundance and Distribution Patterns of Microplastics in the Lis River, Portugal. Sustainability 2022, 14, 2255. [Google Scholar] [CrossRef]
  81. Obbard, R.W.; Sadri, S.; Wong, Y.Q.; Khitun, A.A.; Baker, I.; Thompson, R.C. Global warming releases microplastic legacy frozen in Arctic Sea ice. Earth’s Future 2014, 2, 315–320. [Google Scholar] [CrossRef]
  82. Bujaczek, T.; Kolter, S.; Locky, D.; Ross, M.S. Characterization of microplastics and anthropogenic fibers in surface waters of the North Saskatchewan River, Alberta, Canada. Facets 2021, 6, 26–43. [Google Scholar] [CrossRef]
  83. Huntington, A.; Corcoran, P.L.; Jantunen, L.; Thaysen, C.; Bernstein, S.; Stern, G.A.; Rochman, C.M. A first assessment of microplastics and other anthropogenic particles in Hudson Bay and the surrounding eastern Canadian Arctic waters of Nunavut. Facets 2020, 5, 432–454. [Google Scholar] [CrossRef]
  84. Alfonso, M.B.; Arias, A.H.; Piccolo, M.C. Microplastics integrating the zooplanktonic fraction in a saline lake of Argentina: Influence of water management. Environ. Monit. Assess. 2020, 192, 117. [Google Scholar] [CrossRef] [PubMed]
  85. Kutralam-Muniasamy, G.; Pérez-Guevara, F.; Elizalde-Martínez, I.; Shruti, V.C. Review of current trends, advances and analytical challenges for microplastics contamination in Latin America. Environ. Pollut. 2020, 267, 115463. [Google Scholar] [CrossRef] [PubMed]
  86. Kanhai, L.D.K.; Gardfeldt, K.; Krumpen, T.; Thompson, R.C.; O’Connor, I. Microplastics in sea ice and seawater beneath ice floes from the Arctic Ocean. Sci. Rep. 2020, 10, 5004. [Google Scholar] [CrossRef] [PubMed]
  87. Browne, M.A.; Crump, P.; Niven, S.J.; Teuten, E.; Tonkin, A.; Galloway, T.; Thompson, R. Accumulation of microplastic on shorelines worldwide: Sources and sinks. Environ. Sci. Technol. 2011, 45, 9175–9179. [Google Scholar] [CrossRef] [PubMed]
  88. Karami, A. Gaps in aquatic toxicological studies of microplastics. Chemosphere 2017, 184, 841–848. [Google Scholar] [CrossRef] [PubMed]
  89. Ebere, E.C.; Ngozi, V.E. Microplastics, an emerging concern: A review of analytical techniques for detecting and quantifying microplastics. Anal. Methods Environ. Chem. J. 2019, 2, 13–30. [Google Scholar]
  90. Naidoo, T.; Thompson, R.C.; Rajkaran, A. Quantification and characterisation of microplastics ingested by selected juvenile fish species associated with mangroves in KwaZulu-Natal, South Africa. Environ. Pollut. 2020, 257, 113635. [Google Scholar] [CrossRef] [PubMed]
  91. Kosore, C.M.; Ojwang, L.; Maghanga, J.; Kamau, J.; Shilla, D.; Everaert, G.; Shashoua, Y. Microplastics in Kenya’s marine nearshore surface waters: Current status. Mar. Pollut. Bull. 2022, 179, 113710. [Google Scholar] [CrossRef] [PubMed]
  92. Ziajahromi, S.; Neale, P.A.; Rintoul, L.; Leusch, F.D. Wastewater treatment plants as a pathway for microplastics: Development of a new approach to sample wastewater-based microplastics. Water Res. 2017, 112, 93–99. [Google Scholar] [CrossRef] [PubMed]
  93. Amaral-Zettler, L.A.; Zettler, E.R.; Mincer, T.J. Ecology of the plastisphere. Nat. Rev. Microbiol. 2020, 18, 139–151. [Google Scholar] [CrossRef] [PubMed]
  94. Davidov, K.; Marsay, K.S.; Itzahri, S.; Rubin-Blum, M.; Sobral, P.; Kranzler, C.F.; Oren, M. Community composition and seasonal dynamics of microplastic biota in the Eastern Mediterranean Sea. Sci. Rep. 2024, 14, 26131. [Google Scholar] [CrossRef] [PubMed]
  95. Gökdağ, K.; Pekmez, T.; Akca, G.; Korkmaz, M.; Pacheco, J.P.; Kankılıç, G.B.; Dede, C.; Özkan, K.; Beklioğlu, M.; Jeppesen, E.; et al. Changes in microplastic-associated bacterial communities along a salinity gradient in Central Anatolian lakes of Türkiye. Hydrobiologia 2025. [Google Scholar] [CrossRef]
  96. Jiao, Y.; Zhou, A.; Zhang, D.; Chen, M.; Wan, L. Distinct microbial community structures formed on the biofilms of PLA and PP, influenced by physicochemical factors of sediment and polymer types in a 60-day indoor study. Front. Environ. Sci. 2024, 12, 1452523. [Google Scholar] [CrossRef]
  97. Pedrotti, M.L.; de Figueiredo Lacerda, A.L.; Petit, S.; Ghiglione, J.F.; Gorsky, G. Vibrio spp. and other potential pathogenic bacteria associated to microfibers in the North-Western Mediterranean Sea. PLoS ONE 2022, 17, e0275284. [Google Scholar] [CrossRef] [PubMed]
  98. Qiu, Y.; Wen, X.; Xiang, Z.; Chen, Z.; Qiu, Z.; Peng, M.; Zhong, S.; Huang, J.; Zhou, W.; Yin, L. Comparison of freshwater microbial communities in water and microplastics surfaces: Insights from Dongting Lake, China. J. Ocean. Limnol. 2025, 43, 545–558. [Google Scholar] [CrossRef]
  99. Yang, G.; Gong, M.; Mai, L.; Zhuang, L.; Zeng, E.Y. Diversity and structure of microbial biofilms on microplastics in riverine waters of the Pearl River Delta, China. Chemosphere 2021, 272, 129870. [Google Scholar] [CrossRef] [PubMed]
  100. Lo, L.S.H.; Tong, R.M.K.; Chan, W.; Ho, W.; Cheng, J. Bacterial pathogen assemblages on microplastic biofilms in coastal waters. Mar. Pollut. Bull. 2025, 216, 117958. [Google Scholar] [CrossRef] [PubMed]
  101. Yu, J.; Zhang, X.; Liu, Y.; Wang, Z.; Wang, Y. Characterization of Bacterial Community Structure on Microplastic Surfaces and Prediction of Ecological Risk in Poyang Lake, China. Huan Jing Ke Xue 2024, 45, 3098–3106. [Google Scholar] [CrossRef] [PubMed]
  102. Reisoglu, Ş.; Cati, C.; Yurtsever, M.; Aydin, S. Evaluation of prokaryotic and eukaryotic microbial communities on microplastic-associated biofilms in marine and freshwater environments. Eng. Life Sci. 2024, 24, 2300249. [Google Scholar] [CrossRef] [PubMed]
  103. Ahmad, O.; Ahmed, S.; Khan, F.; Upmanyu, K.; Saif, M.; Haq, Q.M.R. Antibiotic resistant bacteria colonising microplastics in the aquatic environment: An emerging challenge. Discov. Sustain. 2024, 5, 465. [Google Scholar] [CrossRef]
  104. Guo, X.P.; Sun, X.L.; Chen, Y.R.; Hou, L.; Liu, M.; Yang, Y. Antibiotic resistance genes in biofilms on plastic wastes in an estuarine environment. Sci. Total Environ. 2020, 745, 140916. [Google Scholar] [CrossRef] [PubMed]
  105. Silva, I.; Tacão, M.; Henriques, I. Hidden threats in the plastisphere: Carbapenemase-producing Enterobacterales colonizing microplastics in river water. Sci. Total Environ. 2024, 922, 171268. [Google Scholar] [CrossRef] [PubMed]
  106. Lu, J.; Wu, J.; Wang, J. Metagenomic analysis on resistance genes in water and microplastics from a mariculture system. Front. Environ. Sci. Eng. 2022, 16, 4. [Google Scholar] [CrossRef]
  107. Dhinagaran, G. Prevalence of Microplastics, Antibiotic Resistant Genes and Microplastic Associated Biofilms in Estuary—A Review. Environ. Eng. Res. 2023, 28, 220430. [Google Scholar] [CrossRef]
  108. SR, K.S.; Sumithra, T.G. Antimicrobial Resistance in Marine Ecosystem: An Emerging Threat for Public Health. In Handbook on Antimicrobial Resistance; Springer: New York, NY, USA, 2023; p. 67. [Google Scholar] [CrossRef]
  109. Cholewińska, P.; Wojnarowski, K.; Szeligowska, N.; Pokorny, P.; Hussein, W.; Hasegawa, Y.; Dobicki, W.; Palić, D. Presence of microplastic particles increased abundance of pathogens and antimicrobial resistance genes in microbial communities from the Oder river water and sediment. Sci. Rep. 2025, 15, 16338. [Google Scholar] [CrossRef] [PubMed]
  110. Cui, S.; Zhang, R.; Peng, Y.; Gao, X.; Li, Z.; Fan, B.; Guo, L. New insights into ball milling effects on MgAl-LDHs exfoliation on biochar support: A case study for cadmium adsorption. J. Hazard. Mater. 2021, 416, 126258. [Google Scholar] [CrossRef] [PubMed]
  111. Yu, Z.; Yu, Y.; An, Q.Y.; Zhou, L.; Yan, B. Influence of Microplastics on Antibiotic Resistance Genes across Diverse Environments: A Comprehensive Meta and Machine-Learning Analysis. J. Hazard. Mater. 2025, 460, 139042. [Google Scholar] [CrossRef] [PubMed]
  112. Liu, Y.; Liu, L.; Wang, X.; Shao, M.; Wei, Z.; Wang, L.; Zheng, H. Microplastics Enhance the Prevalence of Antibiotic Resistance Genes in Mariculture Sediments by Enriching Host Bacteria and Promoting Horizontal Gene Transfer. Eco-Environ. Health 2025, 4, 100136. [Google Scholar] [CrossRef] [PubMed]
  113. Luo, T.; Dai, X.; Wei, W.; Xu, Q.; Ni, B.J. Microplastics Enhance the Prevalence of Antibiotic Resistance Genes in Anaerobic Sludge Digestion by Enriching Antibiotic-Resistant Bacteria in Surface Biofilm and Facilitating the Vertical and Horizontal Gene Transfer. Environ. Sci. Technol. 2023, 57, 14611–14621. [Google Scholar] [CrossRef] [PubMed]
  114. Zhao, Y.; Hu, Z.; Xie, H.; Wu, H.; Wang, Y.; Xu, H.; Zhang, J. Size-Dependent Promotion of Micro(Nano)Plastics on the Horizontal Gene Transfer of Antibiotic Resistance Genes in Constructed Wetlands. Water Res. 2023, 244, 120520. [Google Scholar] [CrossRef] [PubMed]
  115. Zhai, K.; Yin, K.; Lin, Y.; Chen, S.; Bi, Y.; Xing, R.; Zhou, S. Free Radicals on Aging Microplastics Regulated the Prevalence of Antibiotic Resistance Genes in the Aquatic Environment: New Insight into the Effect of Microplastics on the Spreading of Biofilm Resistomes. Environ. Sci. Technol. 2025, 59, 11735–11744. [Google Scholar] [CrossRef] [PubMed]
  116. Shi, J.; Sun, C.; An, T.; Jiang, C.; Mei, S.; Lv, B. Unraveling the Effect of Micro/Nanoplastics on the Occurrence and Horizontal Transfer of Environmental Antibiotic Resistance Genes: Advances, Mechanisms and Future Prospects. Sci. Total Environ. 2024, 947, 174466. [Google Scholar] [CrossRef] [PubMed]
  117. Zeng, Q.; Xiang, J.; Yang, C.; Wu, J.; Li, Y.; Sun, Y.; Gong, Z. Microplastics Affect Nitrogen Cycling and Antibiotic Resistance Genes Transfer of Sediment. Chem. Eng. J. 2023, 454, 140193. [Google Scholar] [CrossRef]
  118. Sun, R.; He, L.; Li, T.; Dai, Z.; Sun, S.; Ren, L.; Li, C. Impact of the Surrounding Environment on Antibiotic Resistance Genes Carried by Microplastics in Mangroves. Sci. Total Environ. 2022, 837, 155771. [Google Scholar] [CrossRef] [PubMed]
  119. Wang, Y.F.; Liu, Y.J.; Fu, Y.M.; Xu, J.Y.; Zhang, T.L.; Cui, H.L.; Zhu, D. Microplastic Diversity Increases the Abundance of Antibiotic Resistance Genes in Soil. Nat. Commun. 2024, 15, 9788. [Google Scholar] [CrossRef] [PubMed]
Figure 1. Sampling sites for detection of MPs—China.
Applsci 15 08128 g001
Figure 2. Sampling sites for detection of MPs—Europe.
Applsci 15 08128 g002
Figure 3. Sampling sites for detection of MPs—North America.
Applsci 15 08128 g003
Figure 4. Sampling sites for detection of MPs—South America.
Applsci 15 08128 g004
Figure 5. Sampling sites for detection of MPs—Africa.
Applsci 15 08128 g005
Figure 6. Sampling sites for detection of MPs—Australia.
Applsci 15 08128 g006
Figure 7. Relationship between the GDP per capita (USD, 2023) and average microplastic (MP) concentration (particles/m3) in surface waters, based on 2023–2024 literature data. Scatterplots with linear regression lines illustrate the trends across three aquatic environments: rivers, lakes, and marine coastal areas (Sea/bay). Although no statistically significant correlations were observed (Pearson’s r = 0.10 for rivers, r = 0.28 for lakes, r = 0.20 for sea/bay; all p > 0.4), the analysis highlights the variability of MP pollution across socioeconomic contexts.
Applsci 15 08128 g007
Figure 8. The average percentage of the most commonly detected types of MP in surface waters ((a)—Asia, (b)—Europe, (c)—North America, (d)—South America, (e)—Africa, (f)—Australia).
Applsci 15 08128 g008
Table 1. The average level of MPs in Asia depends on water type (particles/m3).
Type Amount of MPS (Particles/m3)References
RiverMedian32.05Supplementary File S1—Asia
Average12,619.33
SD11,988.37
LakesMedian11,000
Average12,079.07
SD11,475.12
Sea/bayMedian322.5
Average14,469.03
SD13,745.57
Table 2. The average level of MPs in Europe depends on water type (particles/m3).
TypeAmount of MPS (Particles/m3)References
RiverMedian392.9Supplementary File S2—Europe
Average8166.39
SD7758.07
LakesMedian5.00
Average14,974.97
SD14,226.22
Sea/bayMedian710.00
Average24,372.06
SD23,153.45
Table 3. The average level of MPs in North America depends on water type (particles/m3).
TypeAmount of MPS (Particles/m3)References
RiverMedian392.9Supplementary File S3—North America
Average8166.39
SD7758.07
LakesMedian5.00
Average14,974.97
SD14,226.22
Sea/bayMedian710.00
Average24,372.06
SD23,153.45
Table 4. The average level of MPs in South America depends on water type (particles/m3).
TypeAmount of MPS (Particles/m3)References
RiverMedian150.00Supplementary File S4—South America
Average1284.42
SD5281.52
LakesMedian1.4
Average37.78
SD58.08
Sea/bayMedian0.47
Average0.48
SD0.17
Table 5. The average level of MPs in Africa depends on water type (particles/m3).
TypeNumber of MPs (Particles/m3)References
RiverMedian457.50Supplementary File S5—Africa and Australia
Average457.50
SD247.50
LakesMedian2.19
Average946.00
SD2549.09
Sea/bayMedian129.53
Average368.66
SD499.78
Table 6. The average level of MPs in Australia depends on water type (particles/m3).
TypeNumber of MPs (Particles/m3)References
RiverMedian110.00Supplementary File S6—Africa and Australia
Average222.50
SD247.22
Sea/bayMedian0.07
Average0.08
SD0.04
LakesMedian415.00
Average401.67
SD175.25
Disclaimer/Publisher’s Note: The statements, opinions and data contained in all publications are solely those of the individual author(s) and contributor(s) and not of MDPI and/or the editor(s). MDPI and/or the editor(s) disclaim responsibility for any injury to people or property resulting from any ideas, methods, instructions or products referred to in the content.

