
Error Distribution Pattern Analysis of Mobile Laser Scanners for Precise As-Built BIM Generation


Abstract
1. Introduction
2. Literature Review
2.1. Analysis of MLS Point Clouds
2.2. Measurement of Object Dimensions Using Point Clouds
3. Experiment Design and Analysis Method
3.1. Laser Scanners
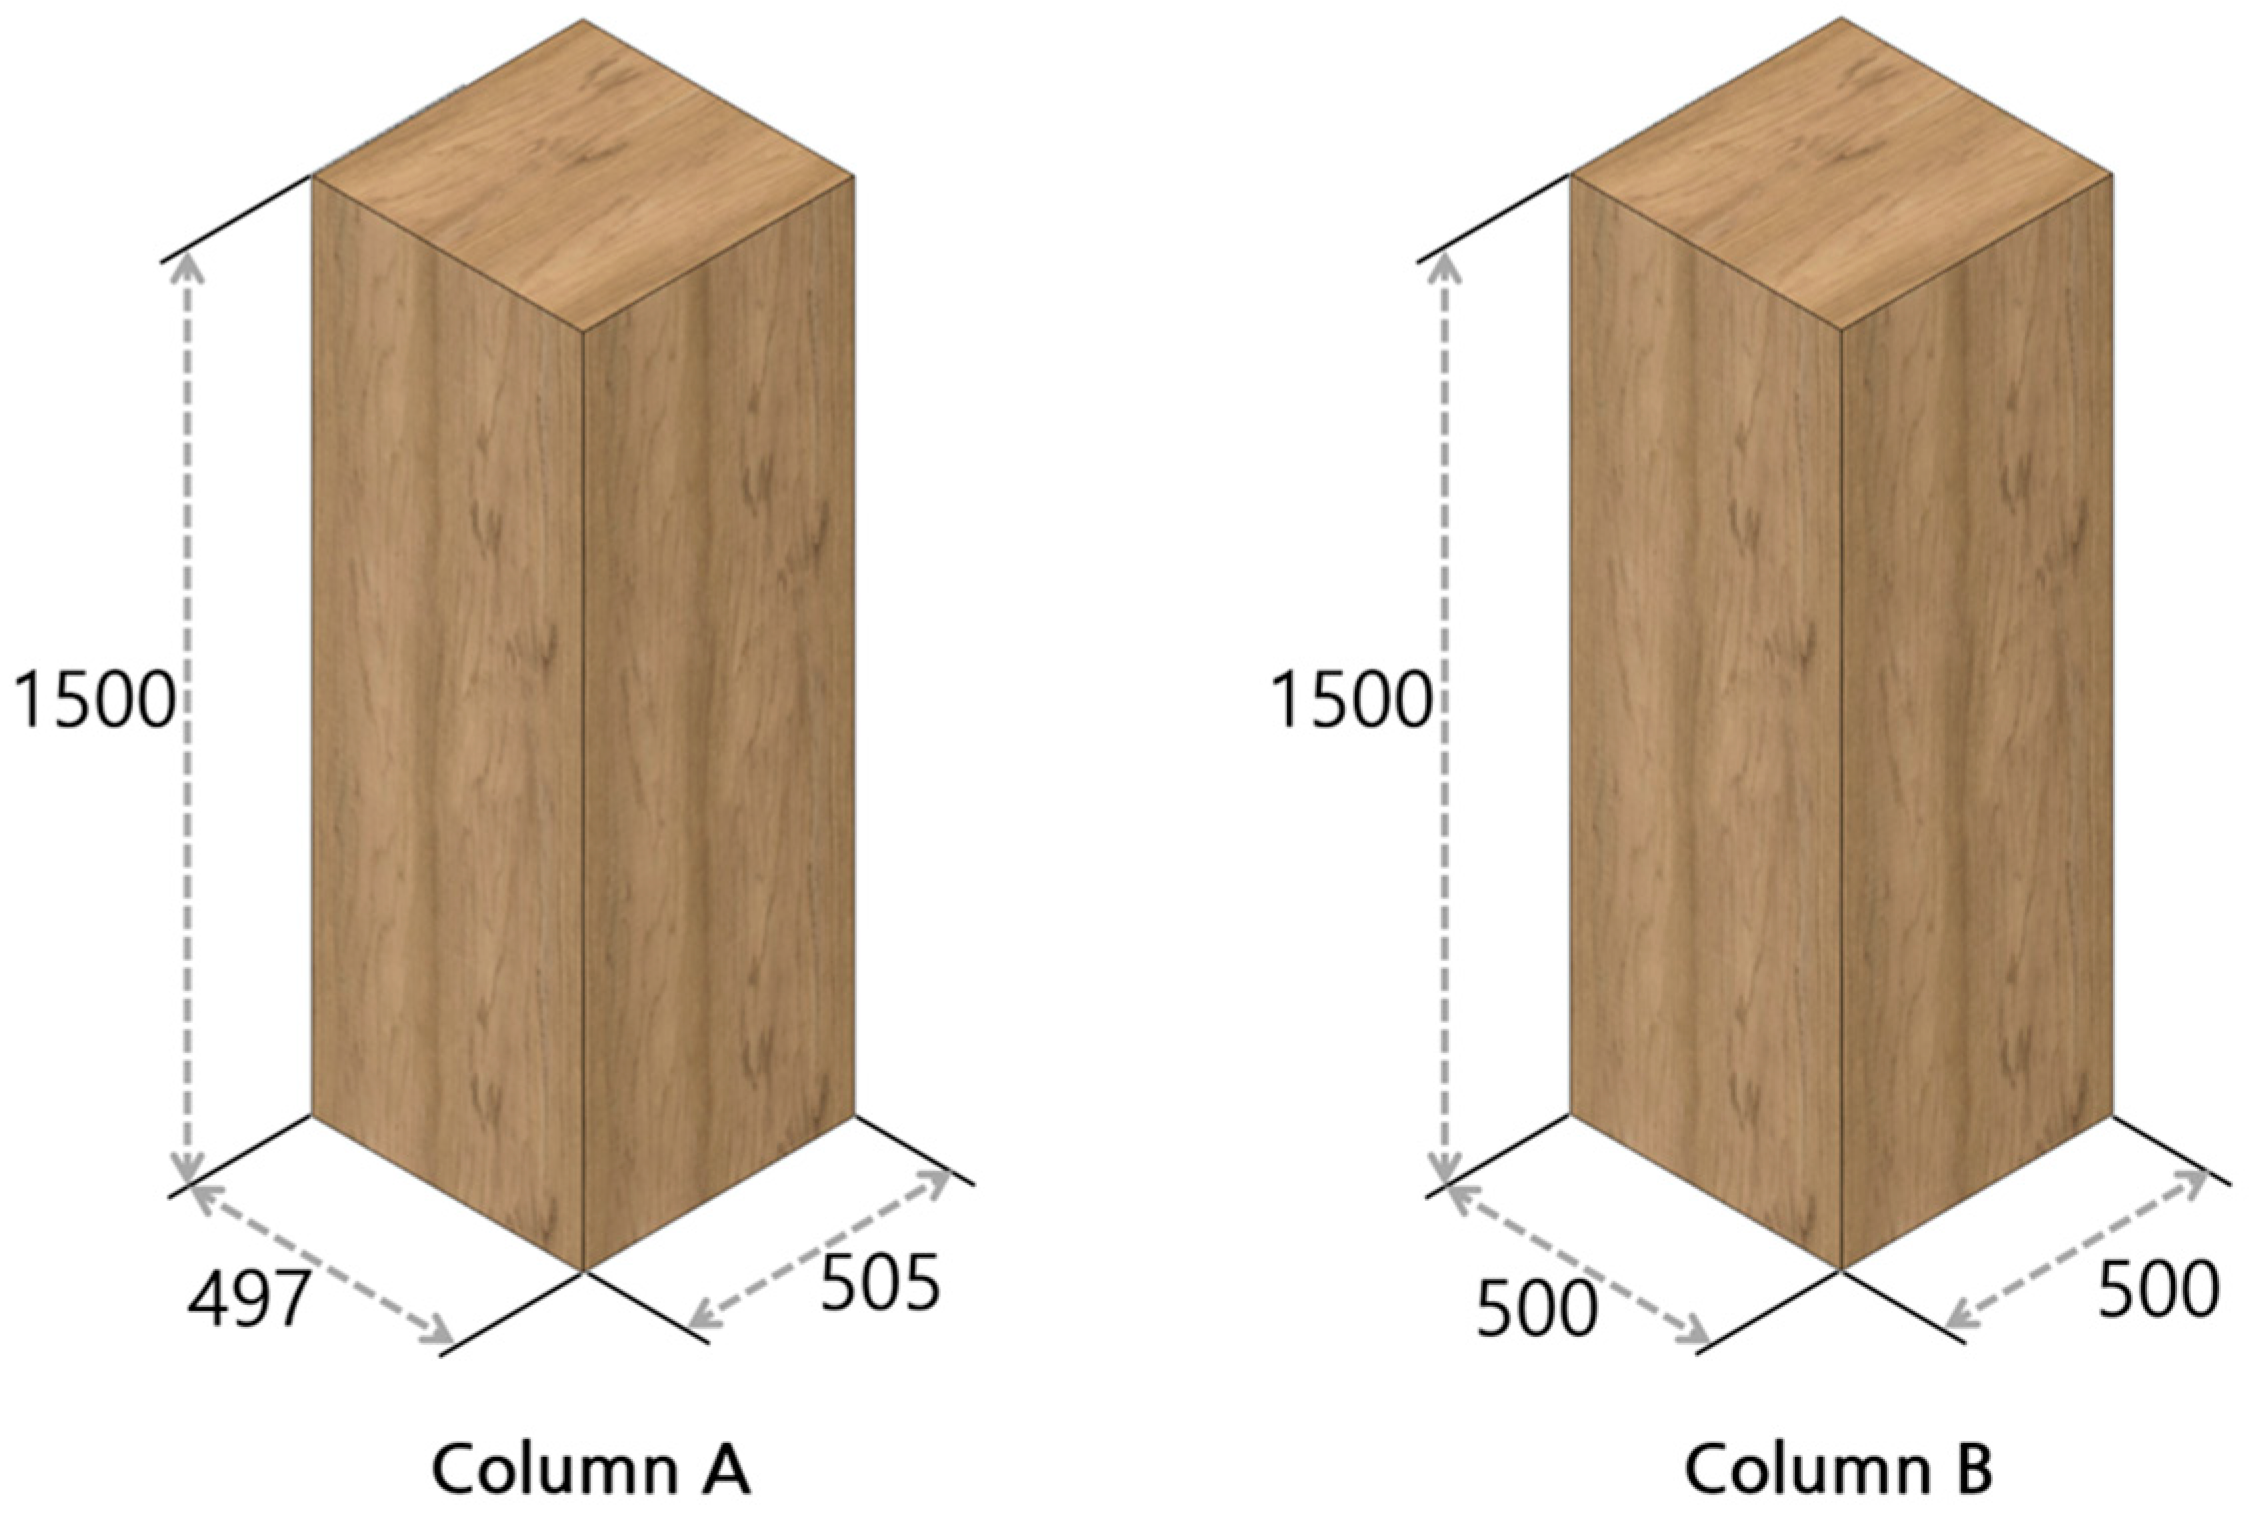
3.2. Mock-Ups
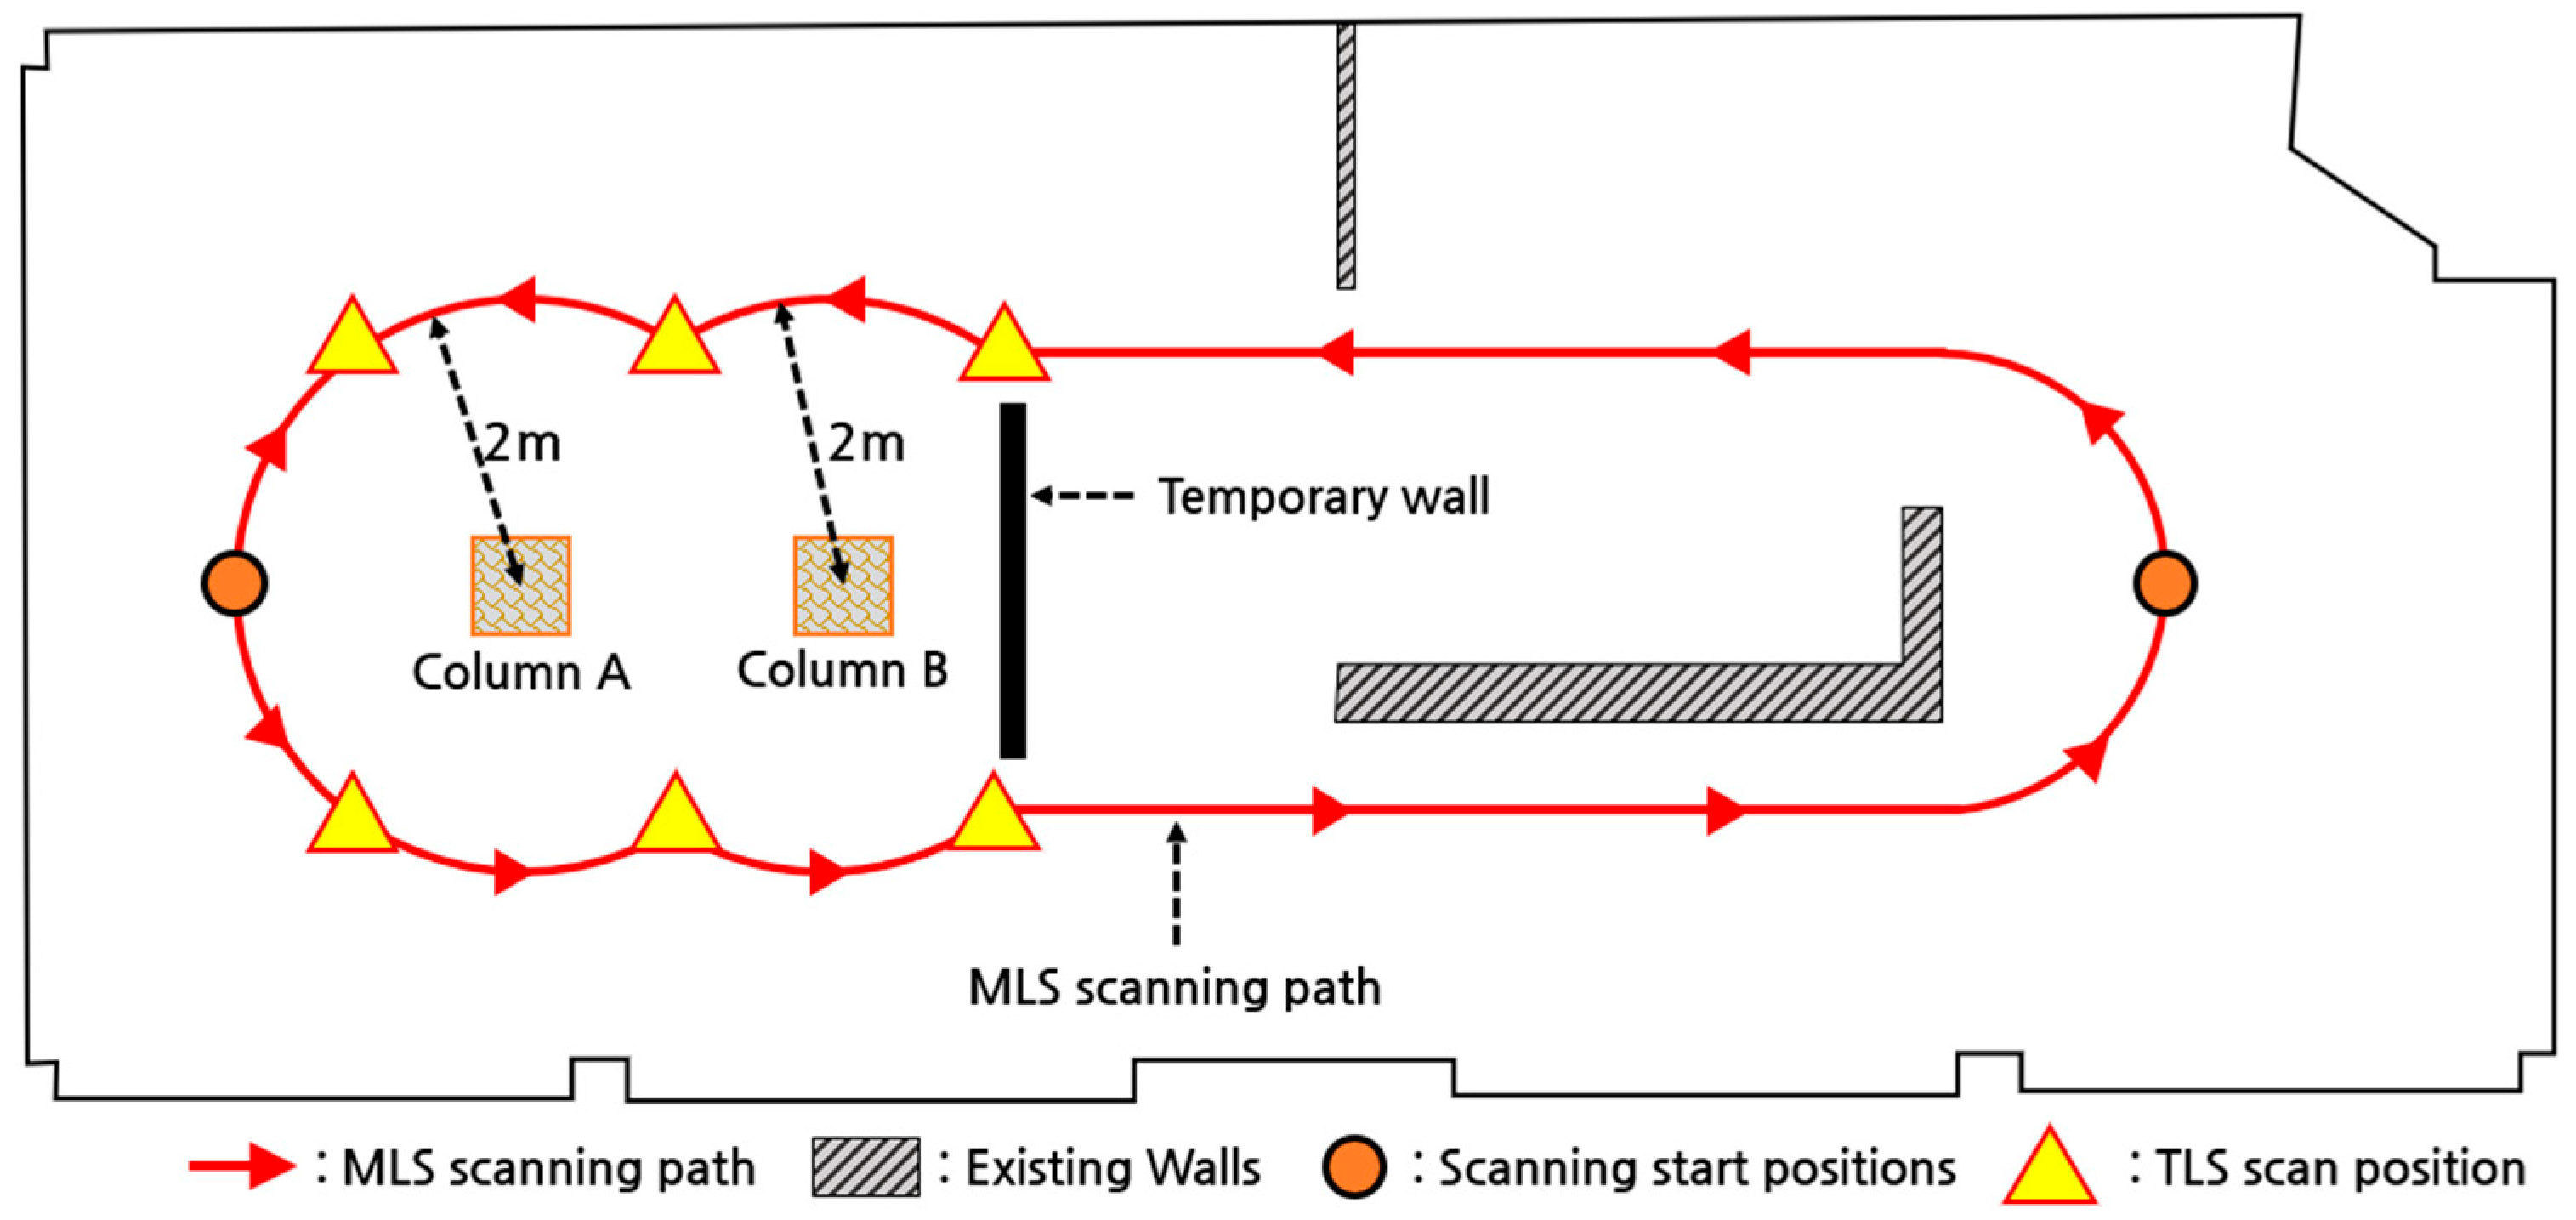
3.3. Data Acquisition
3.4. Analysis Method of Error Distribution Patterns in MLS Point Clouds
3.4.1. Intentions of the Analysis Method
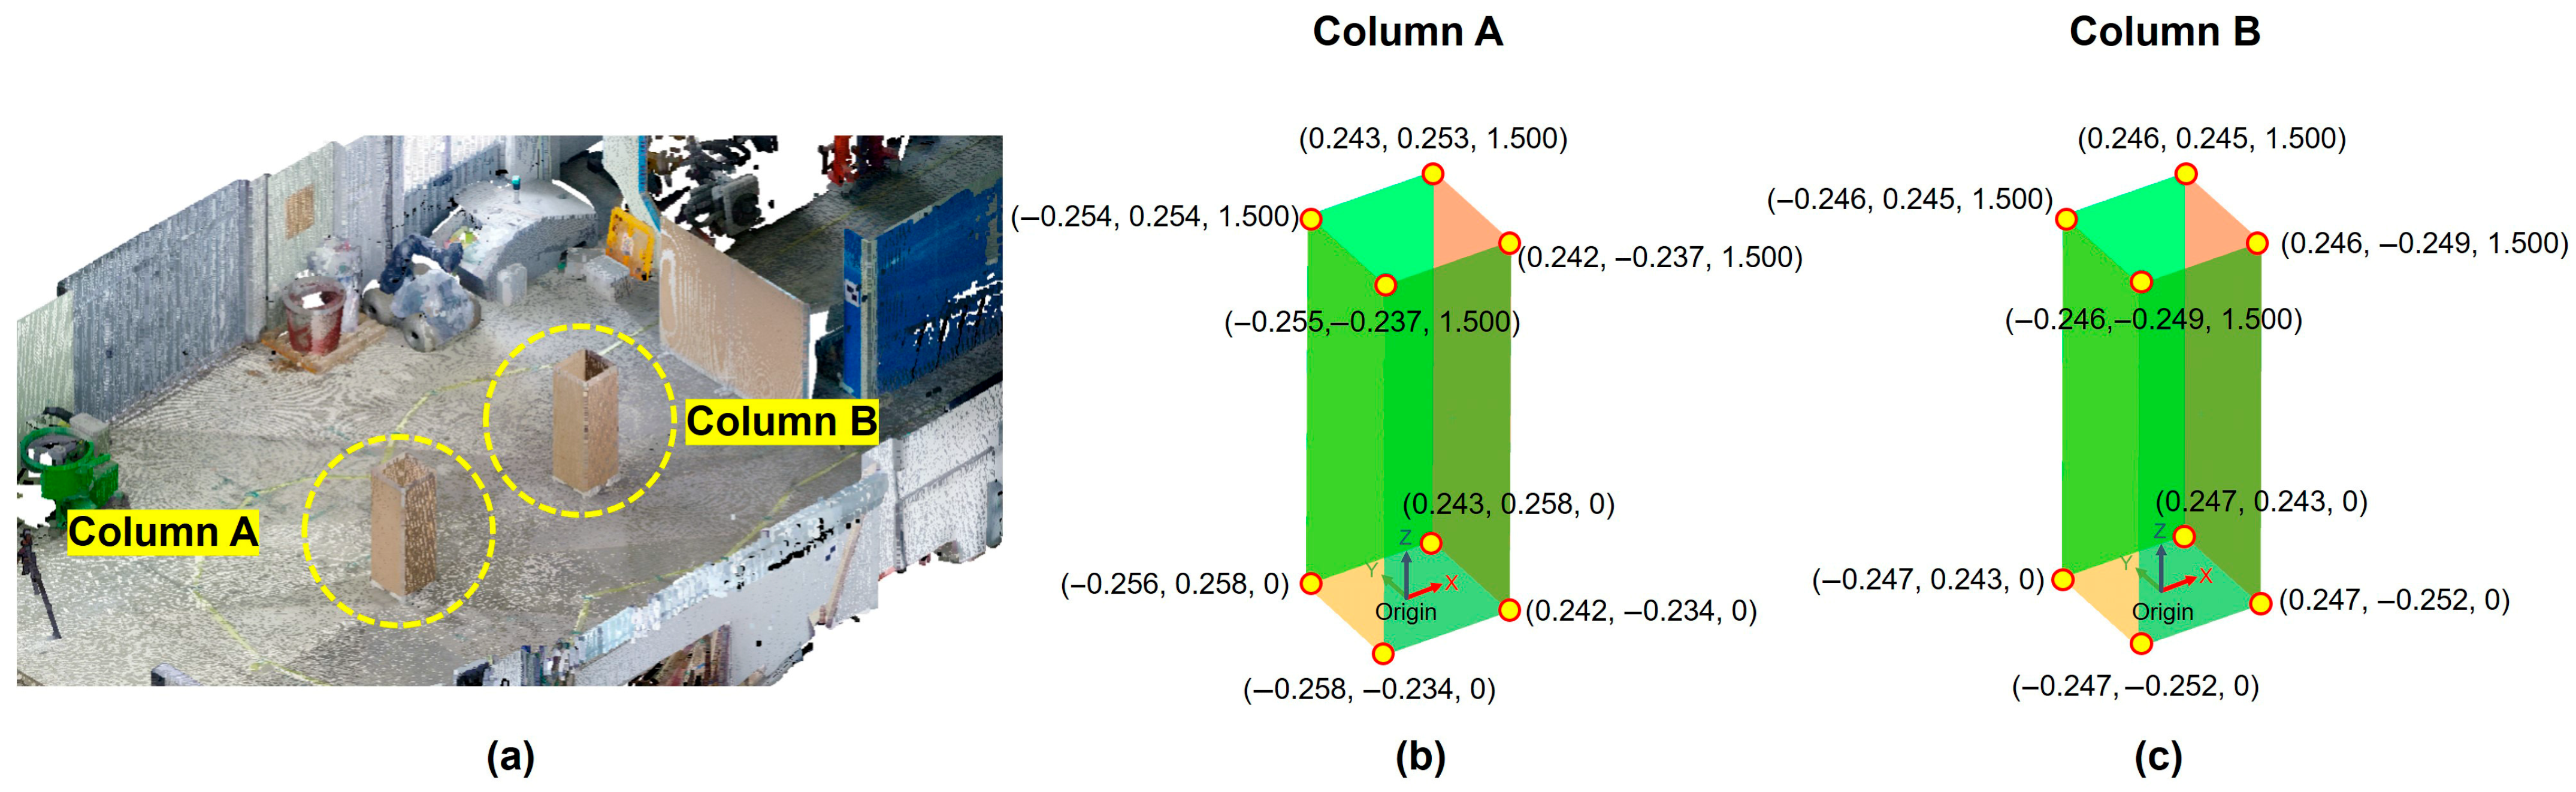
3.4.2. Reference Data Generation
3.4.3. Test Data Preprocessing
3.4.4. Measurement Process
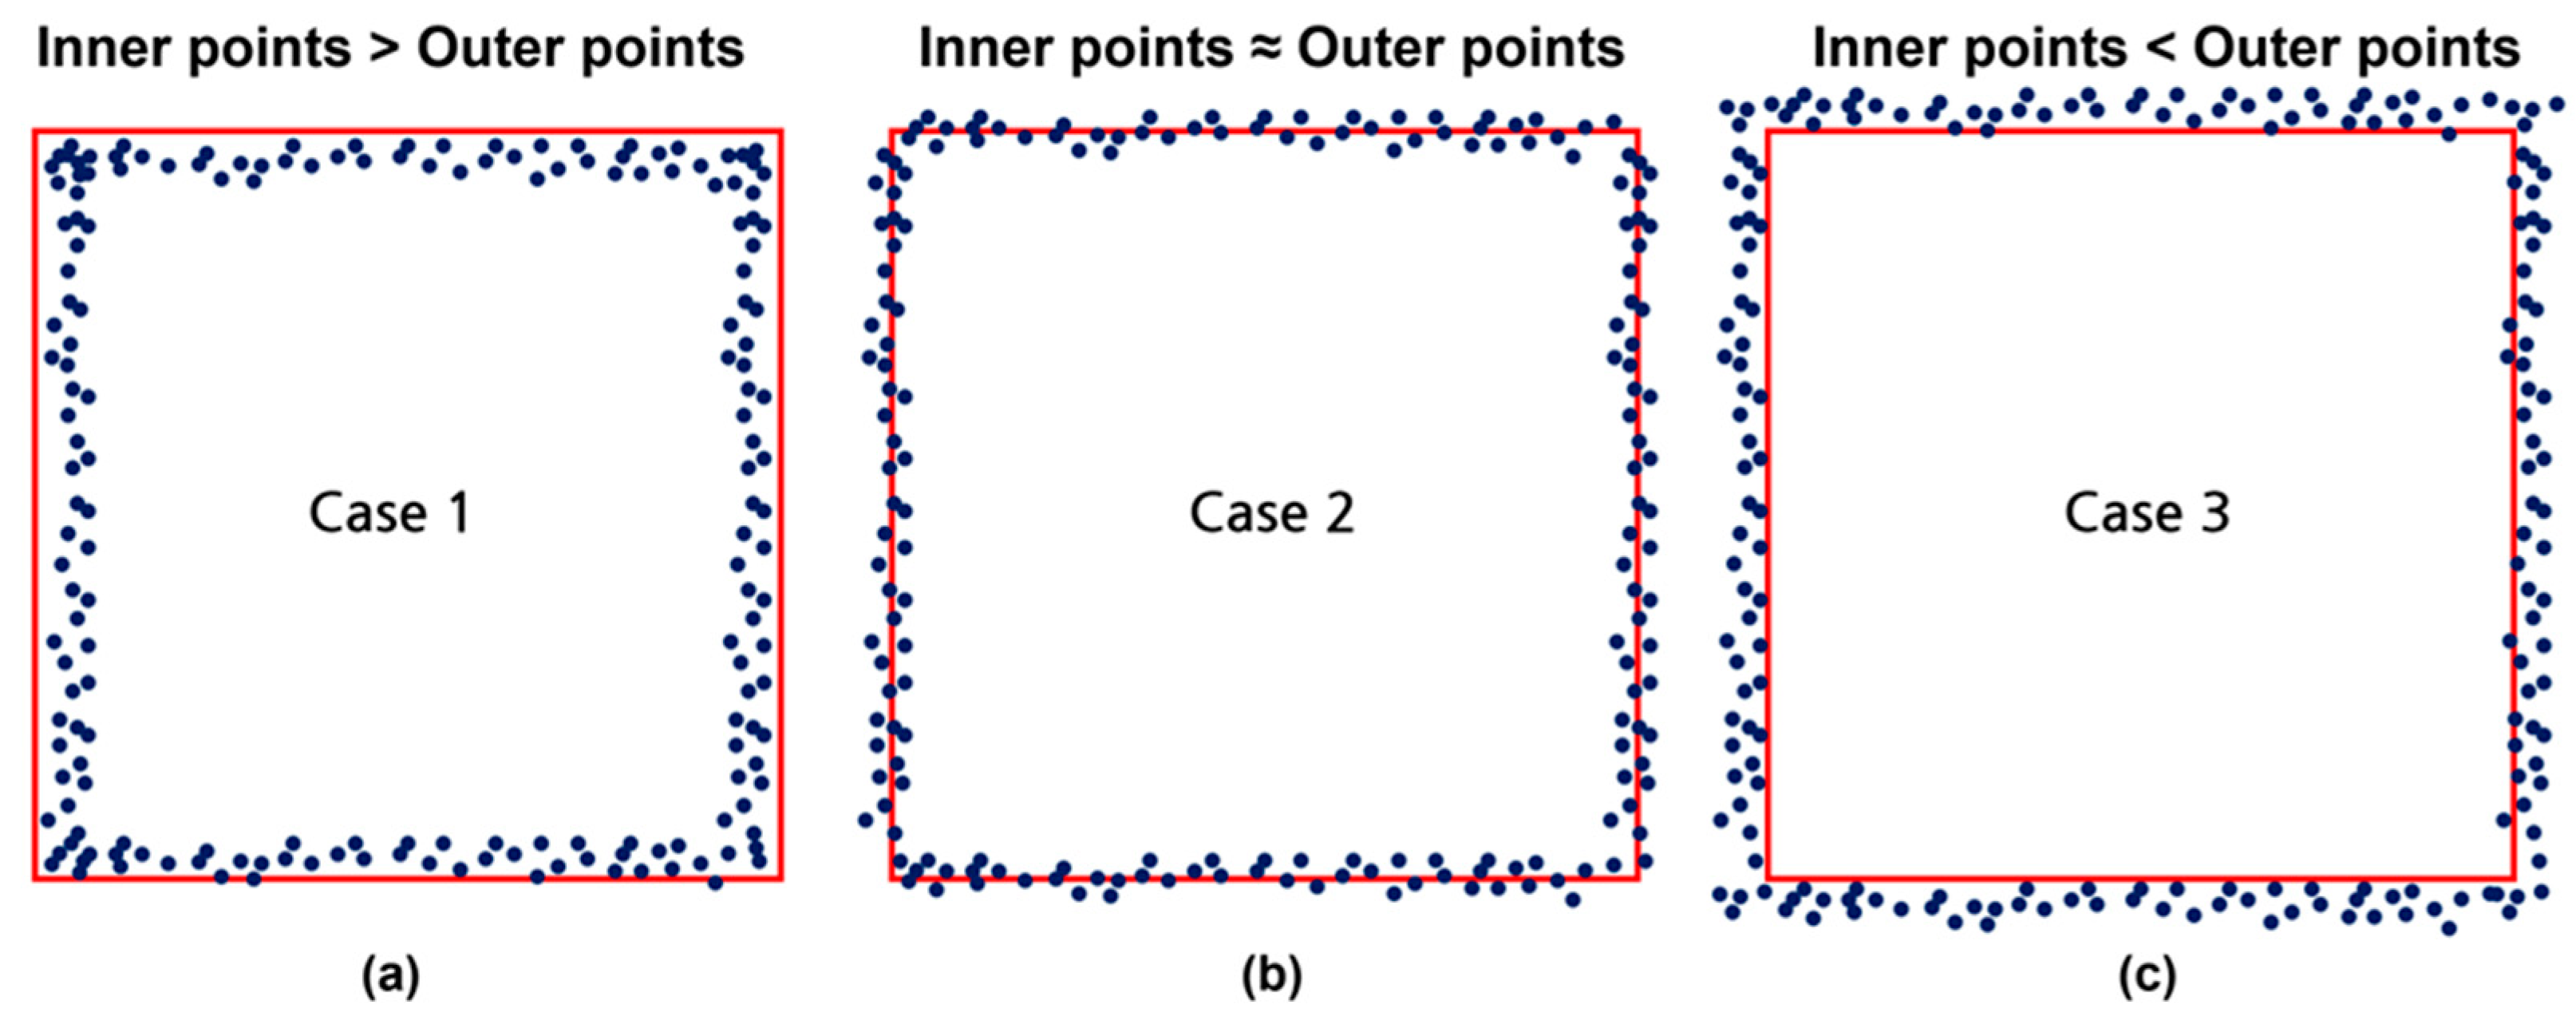
3.4.5. Analysis Metrics
4. Results
4.1. Data Acquisition and Preprocessing Results
4.2. Sensitivity Analysis of Random Downsampling
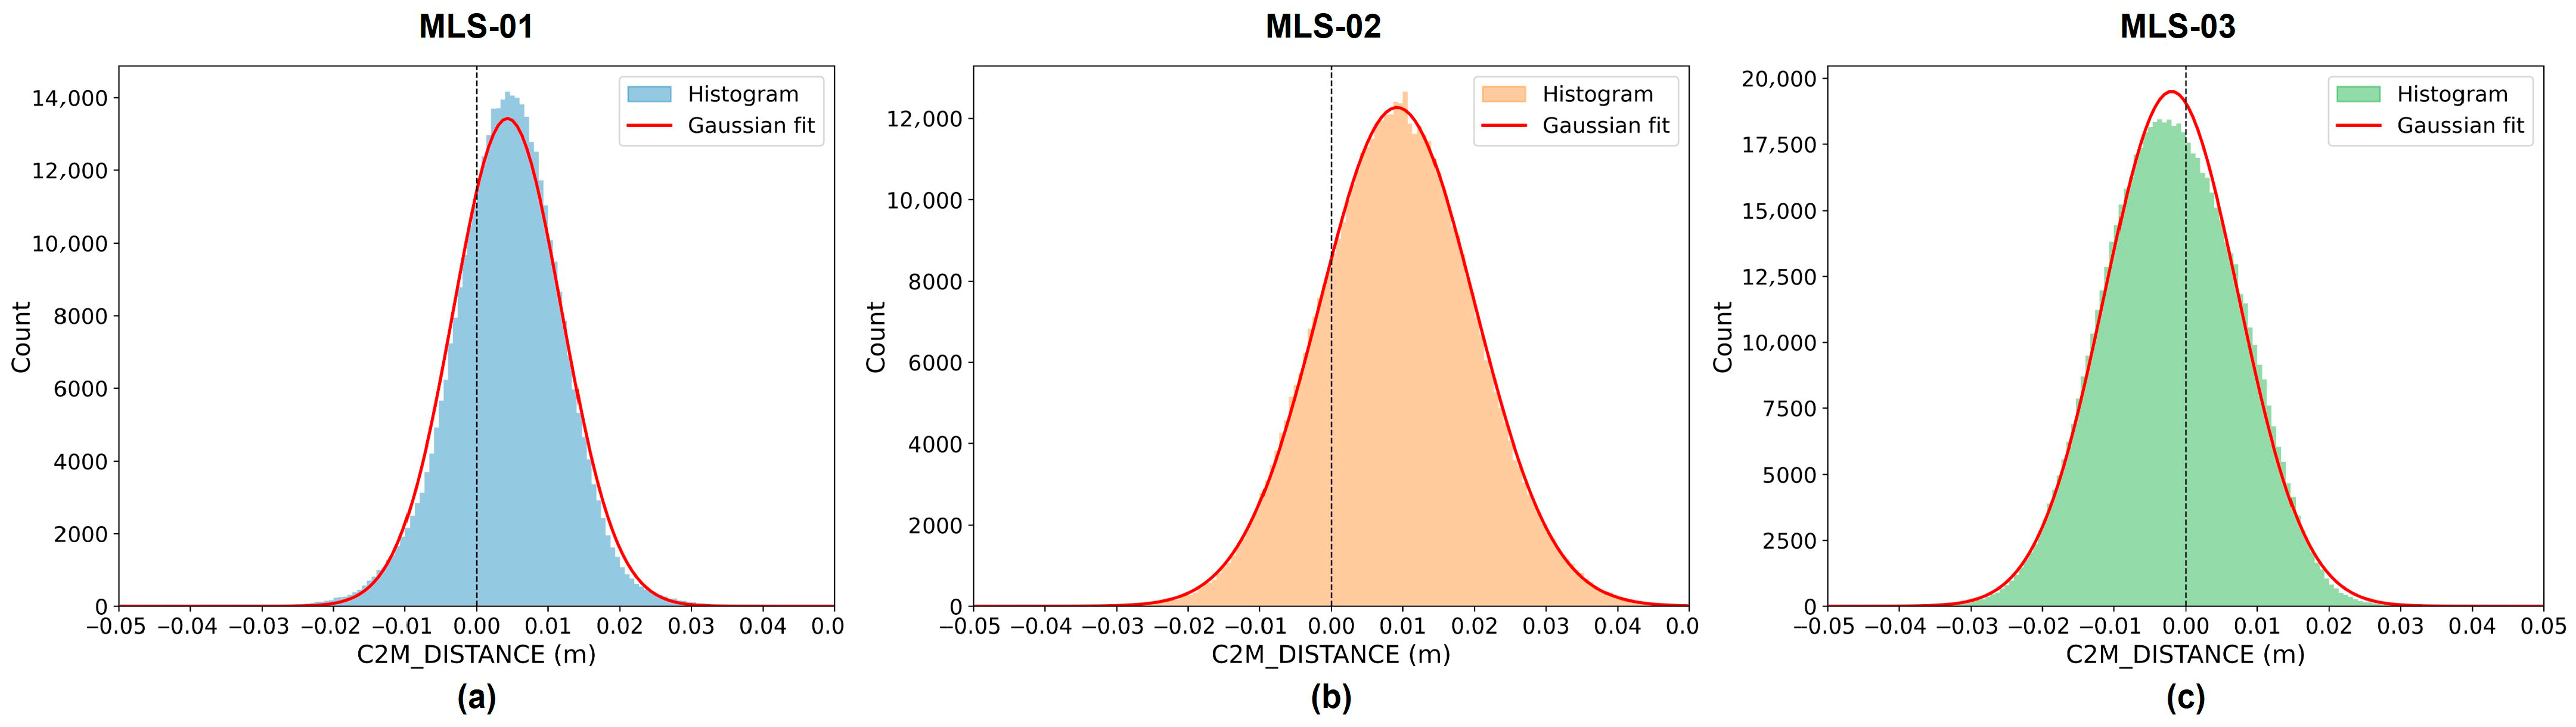
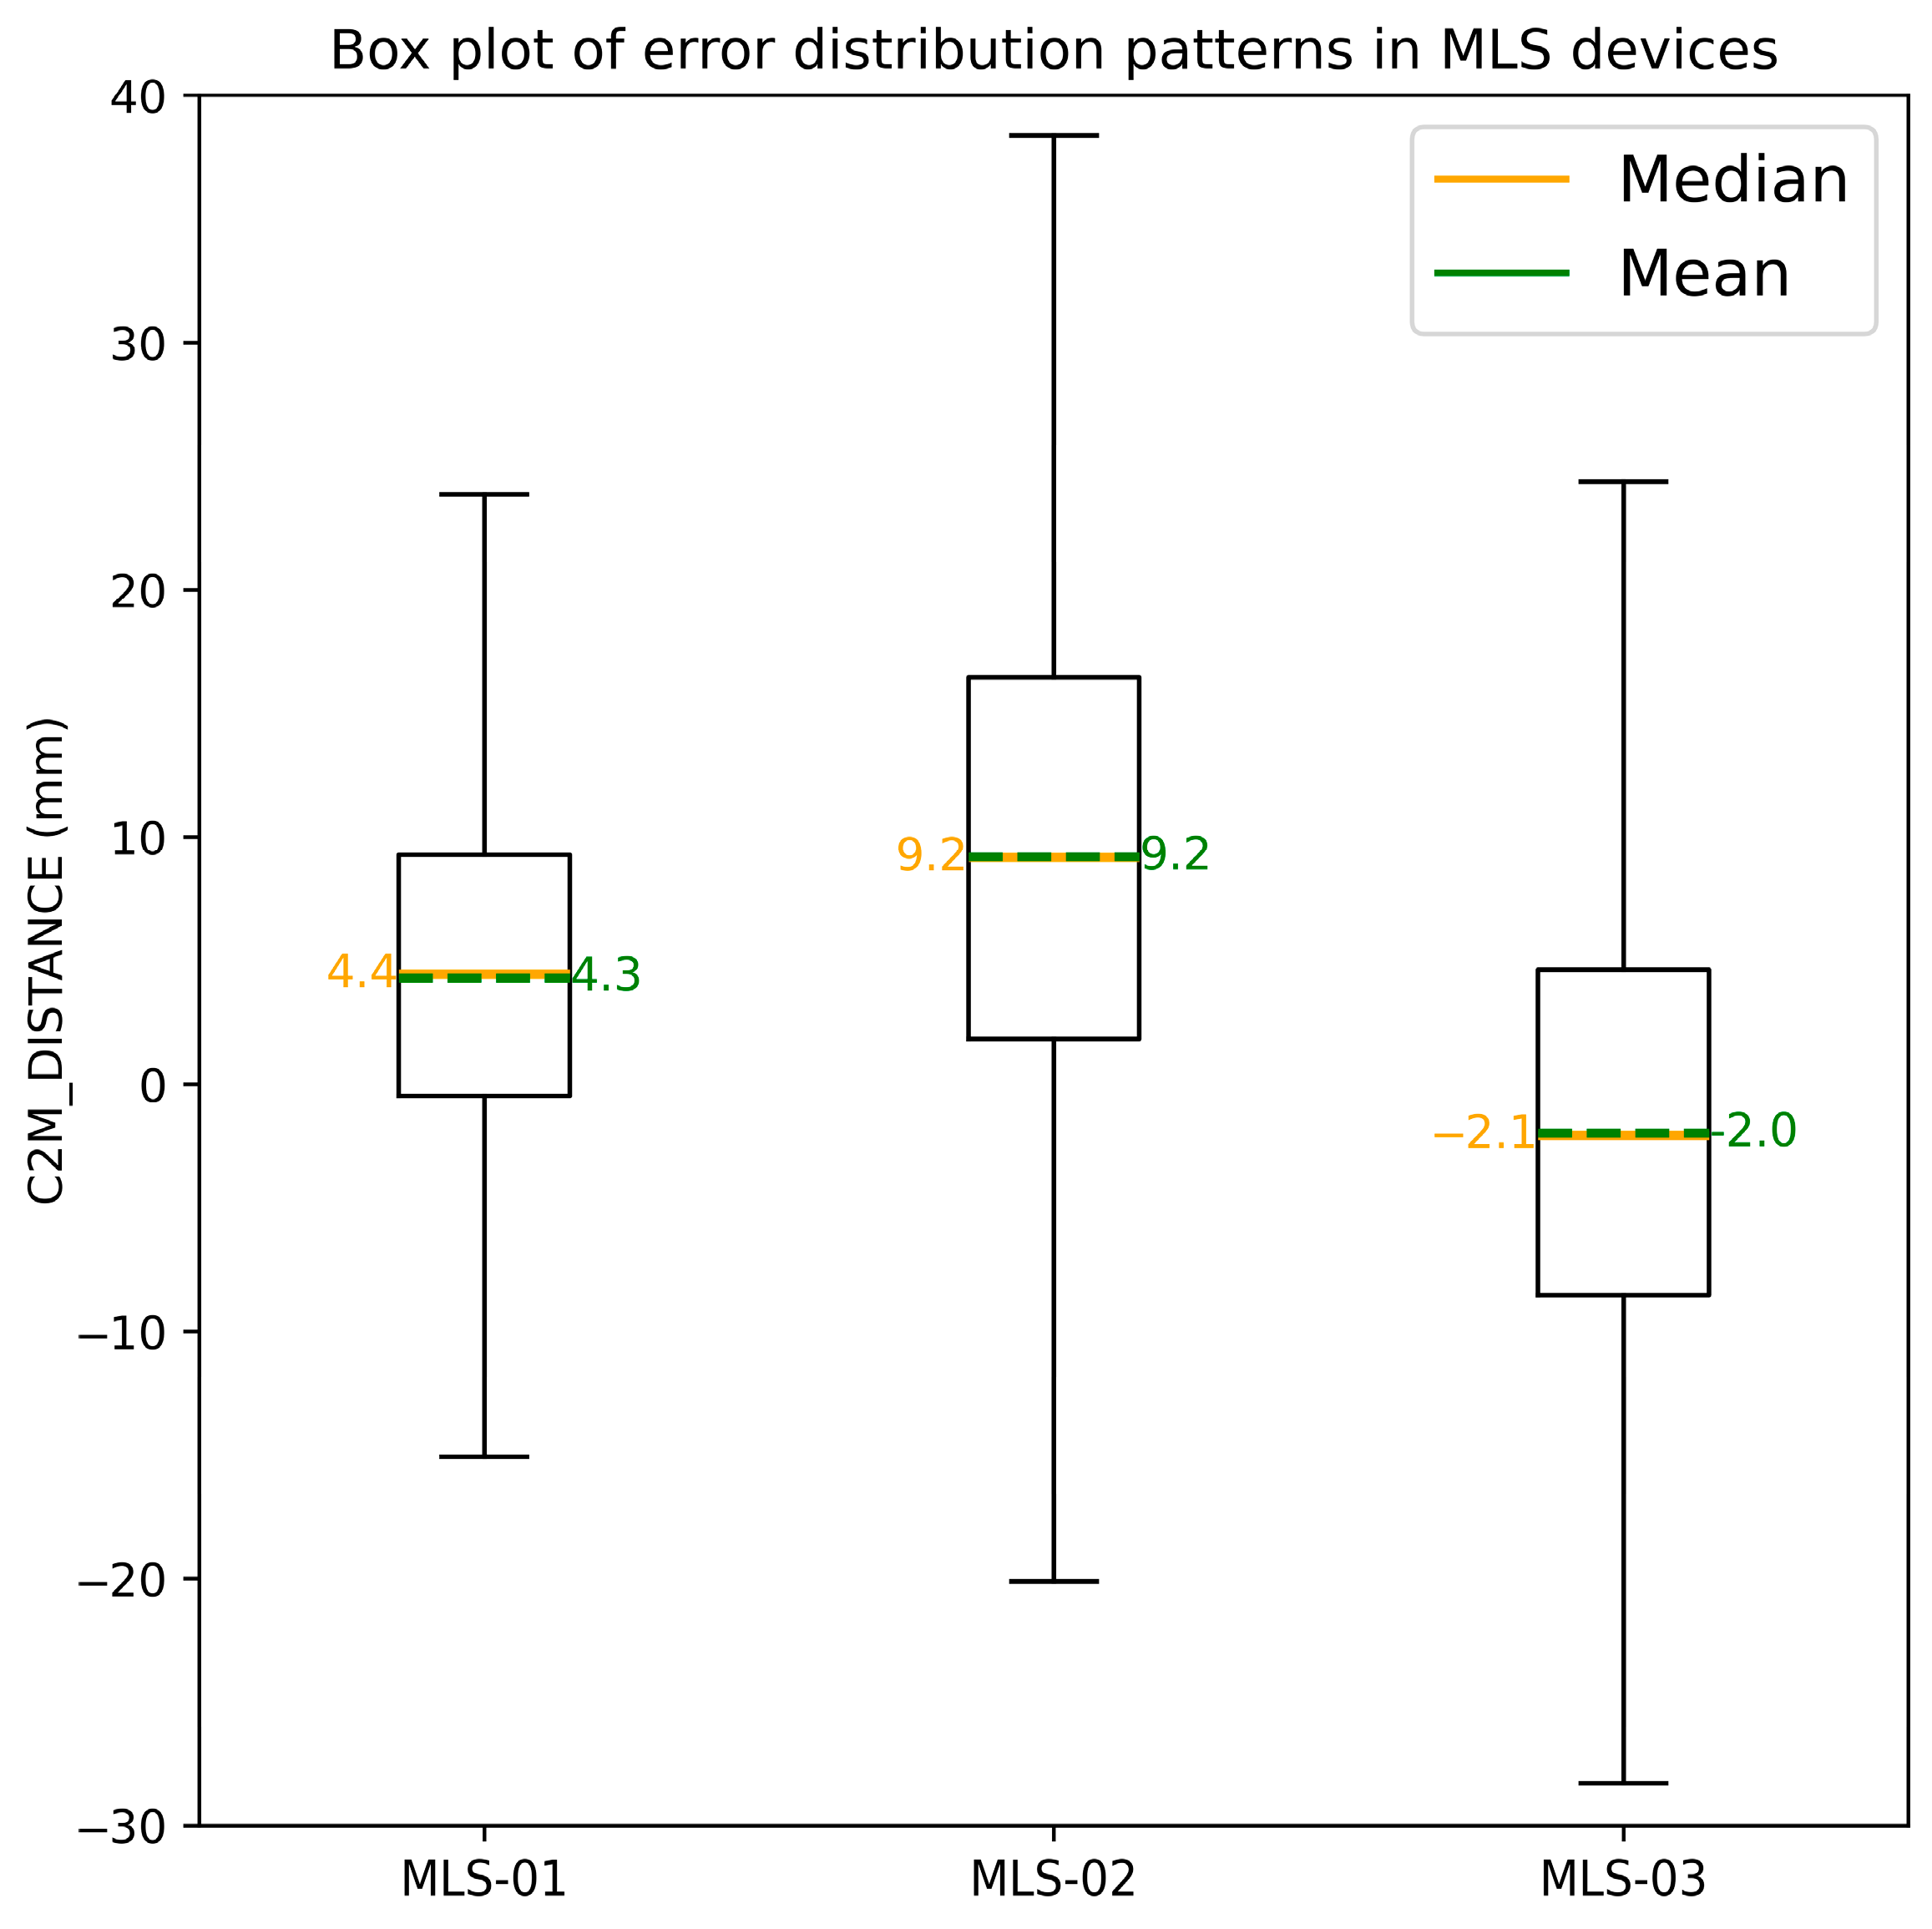
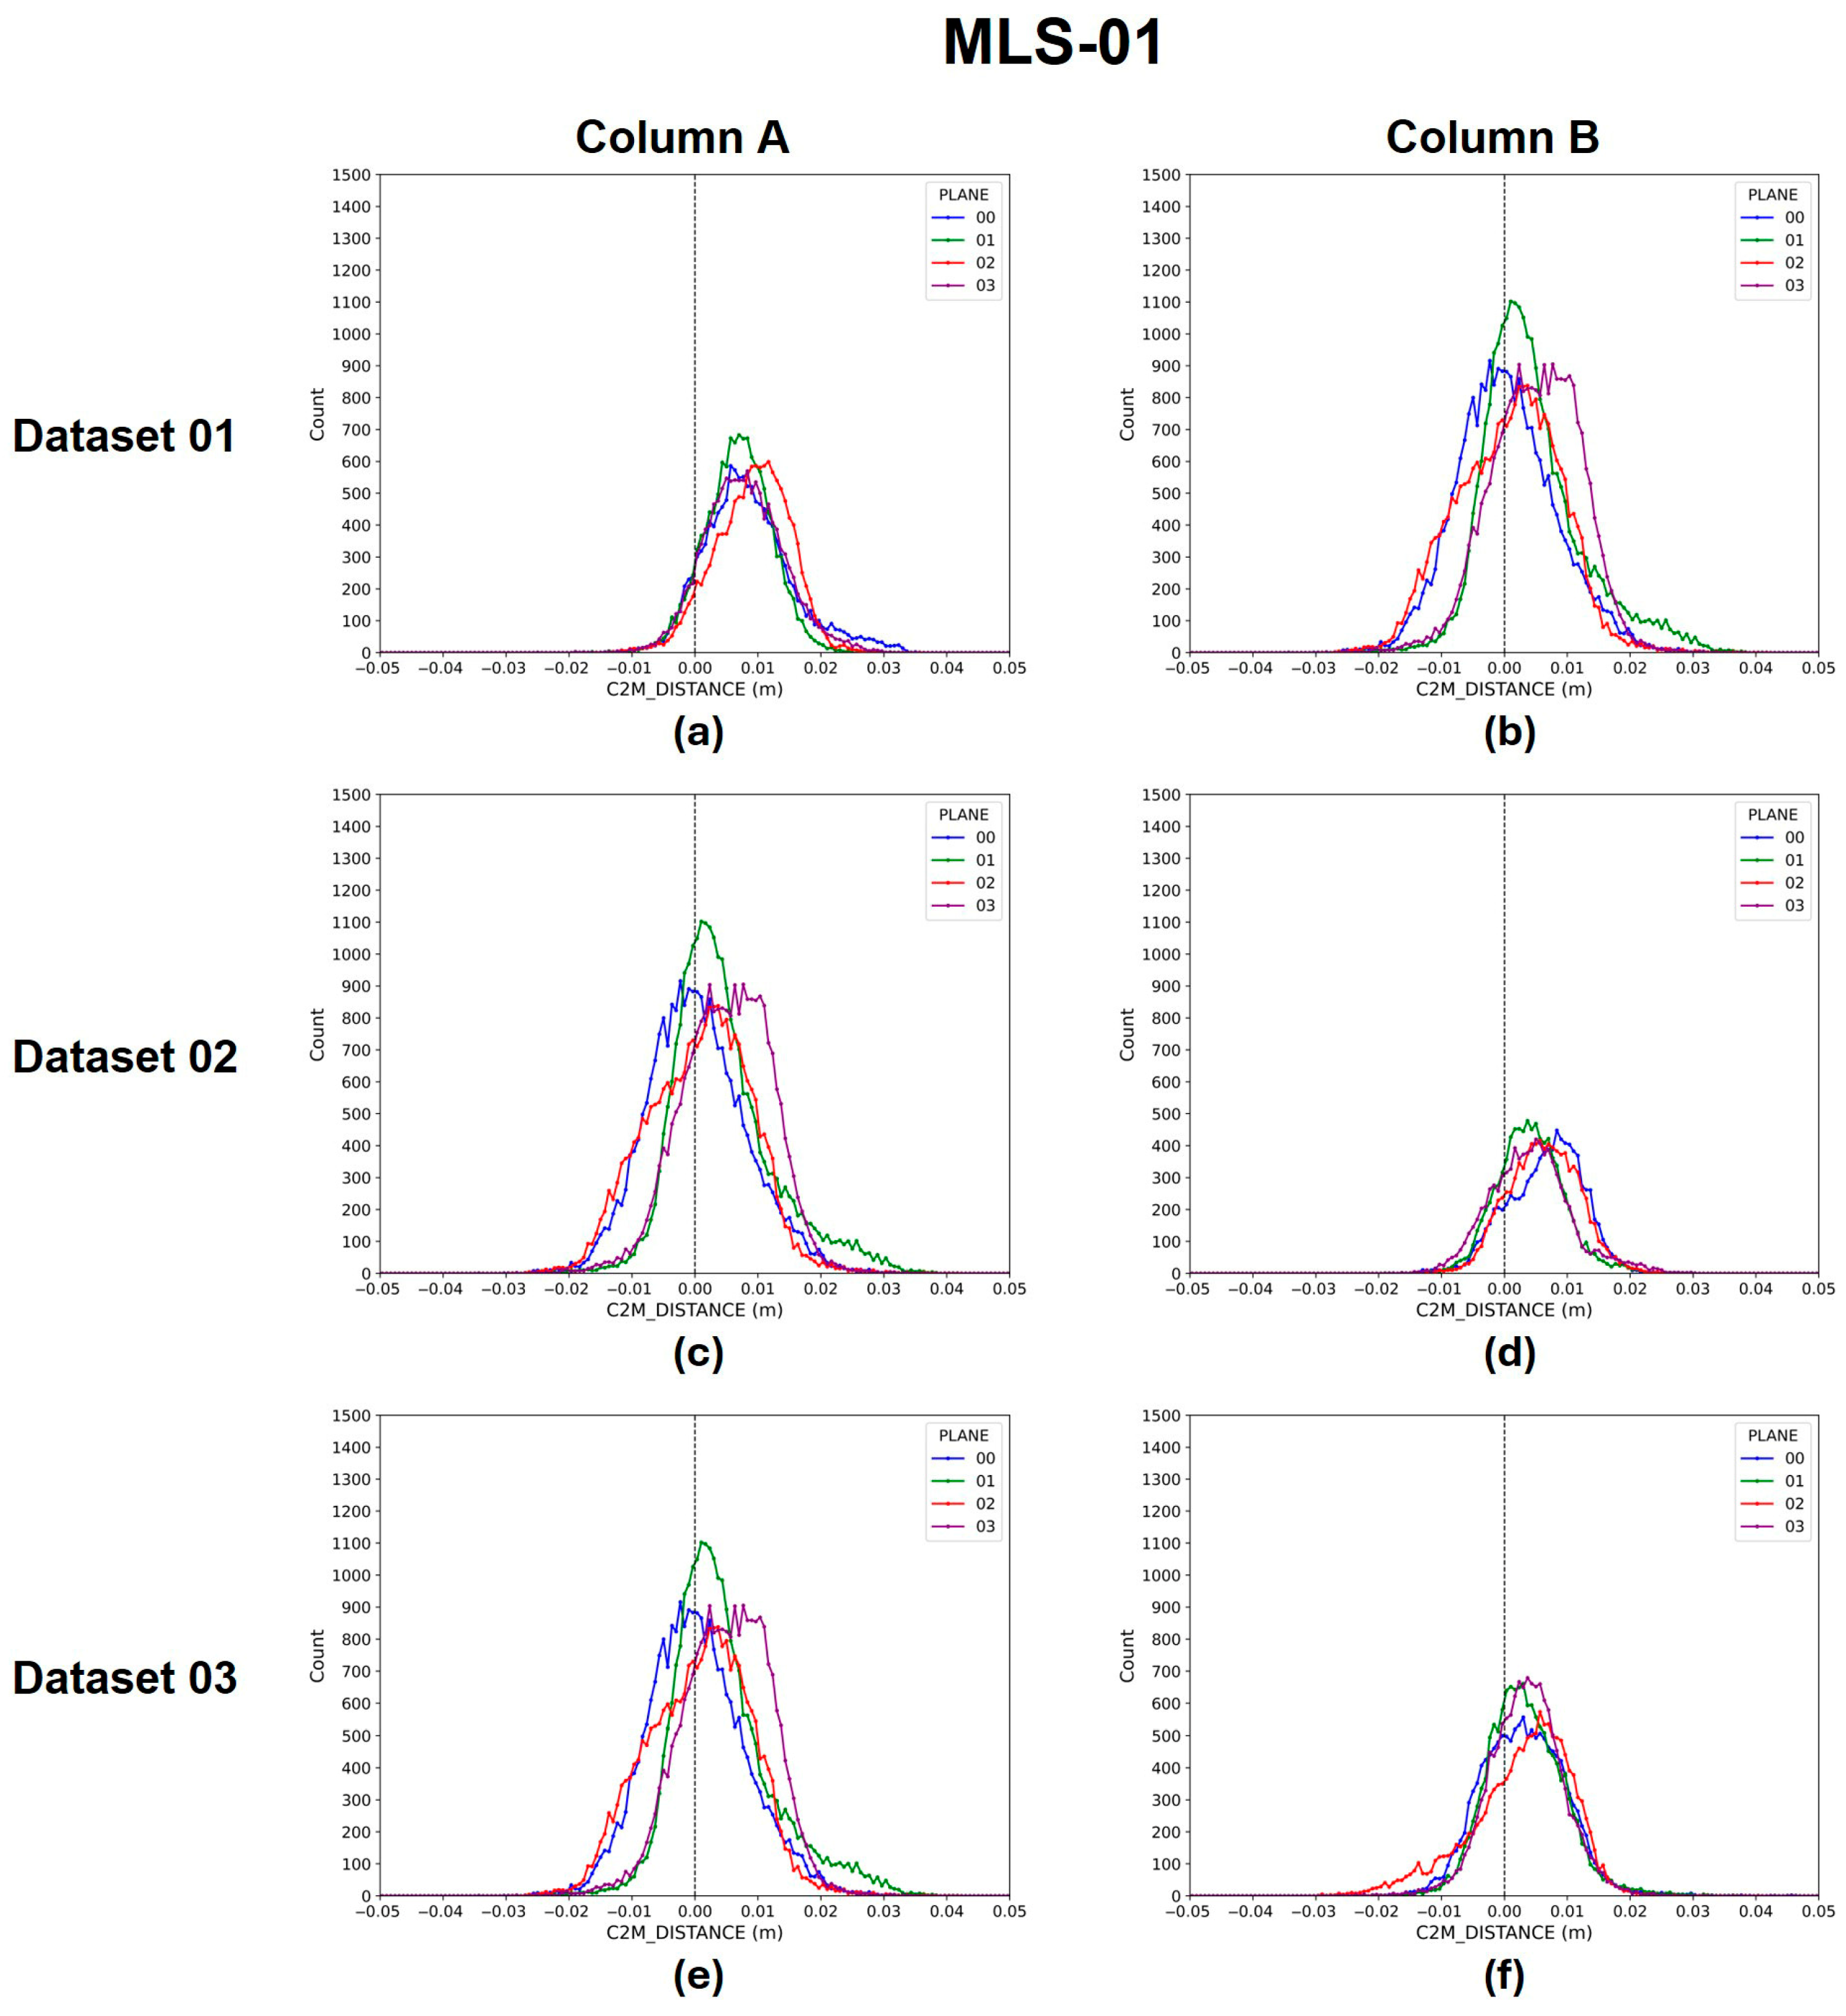
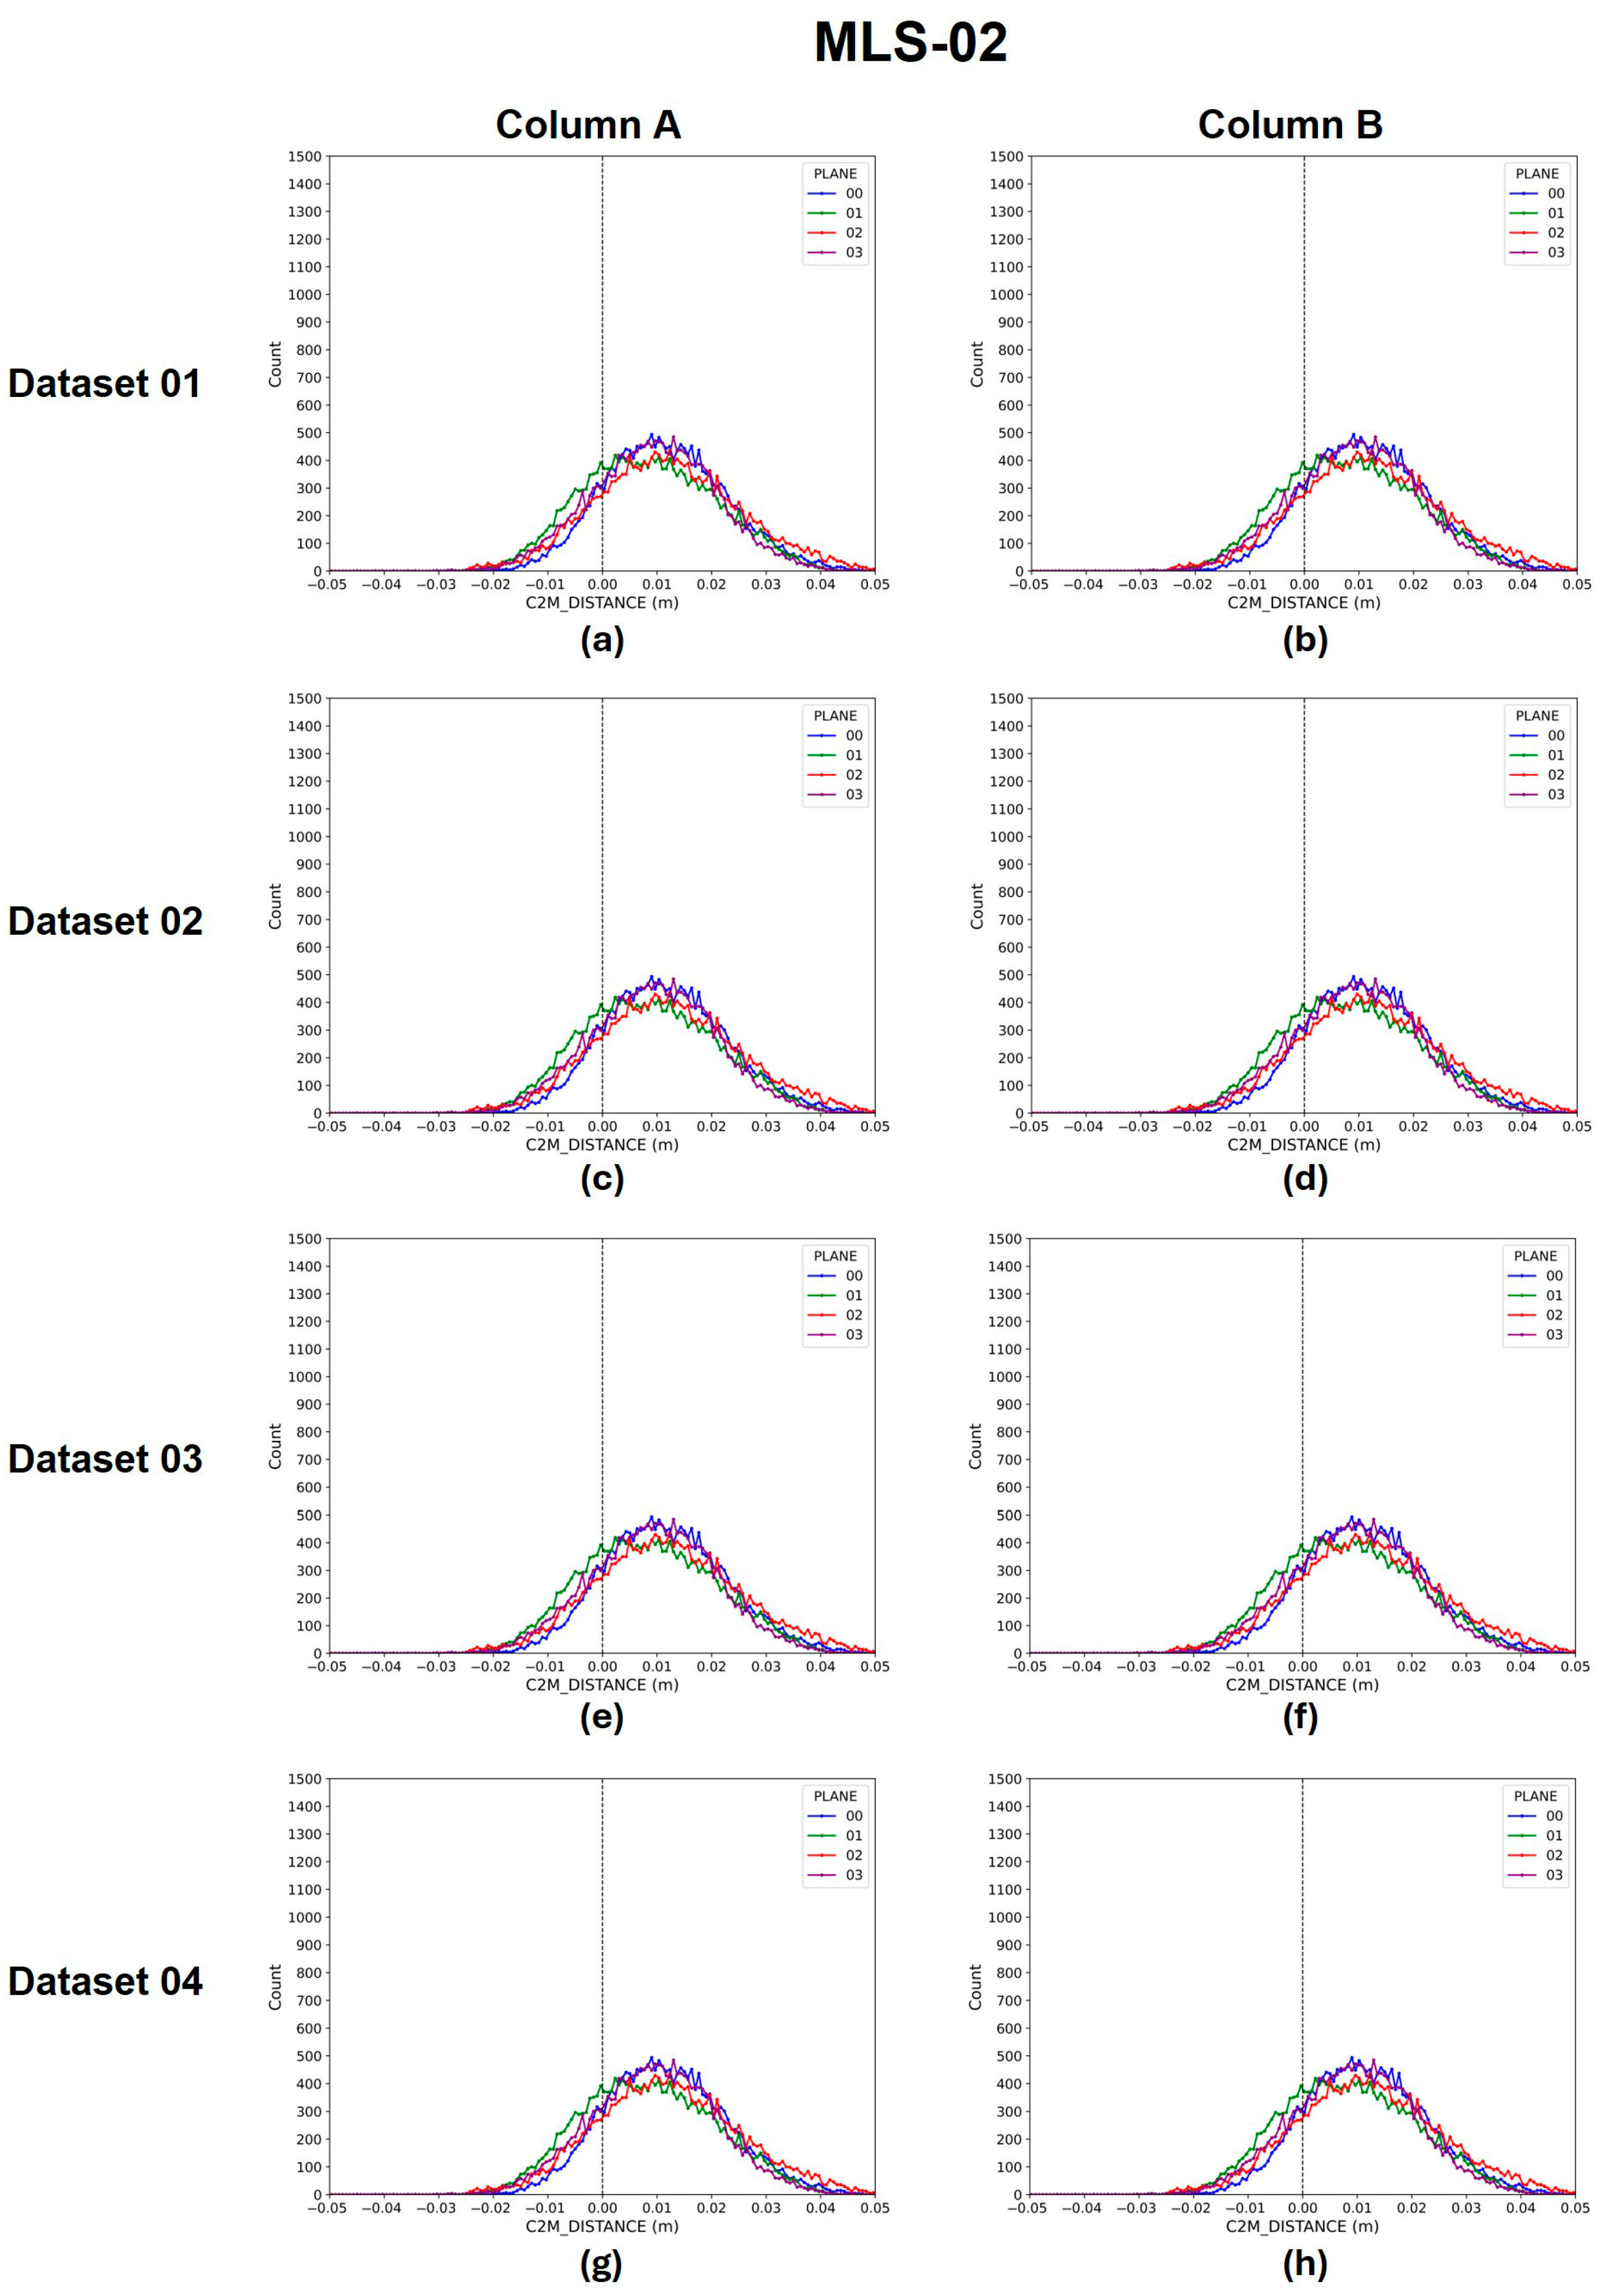
4.3. Error Distribution Patterns in MLS Devices
4.4. Verification of Dimensional Correction Using Error Distribution Patterns
5. Discussion
5.1. Appropriateness of the Experimental Design and Analysis
5.2. Directional Bias in MLS Devices
- MLS-01 point clouds exhibit an outward bias in error relative to the Column surface, with a representative mean error of +4.3 mm, standard deviation of 7.6 mm.
- MLS-02 point clouds exhibit an outward bias in error relative to the Column surface, with a representative mean error of +9.2 mm, standard deviation of 10.8 mm.
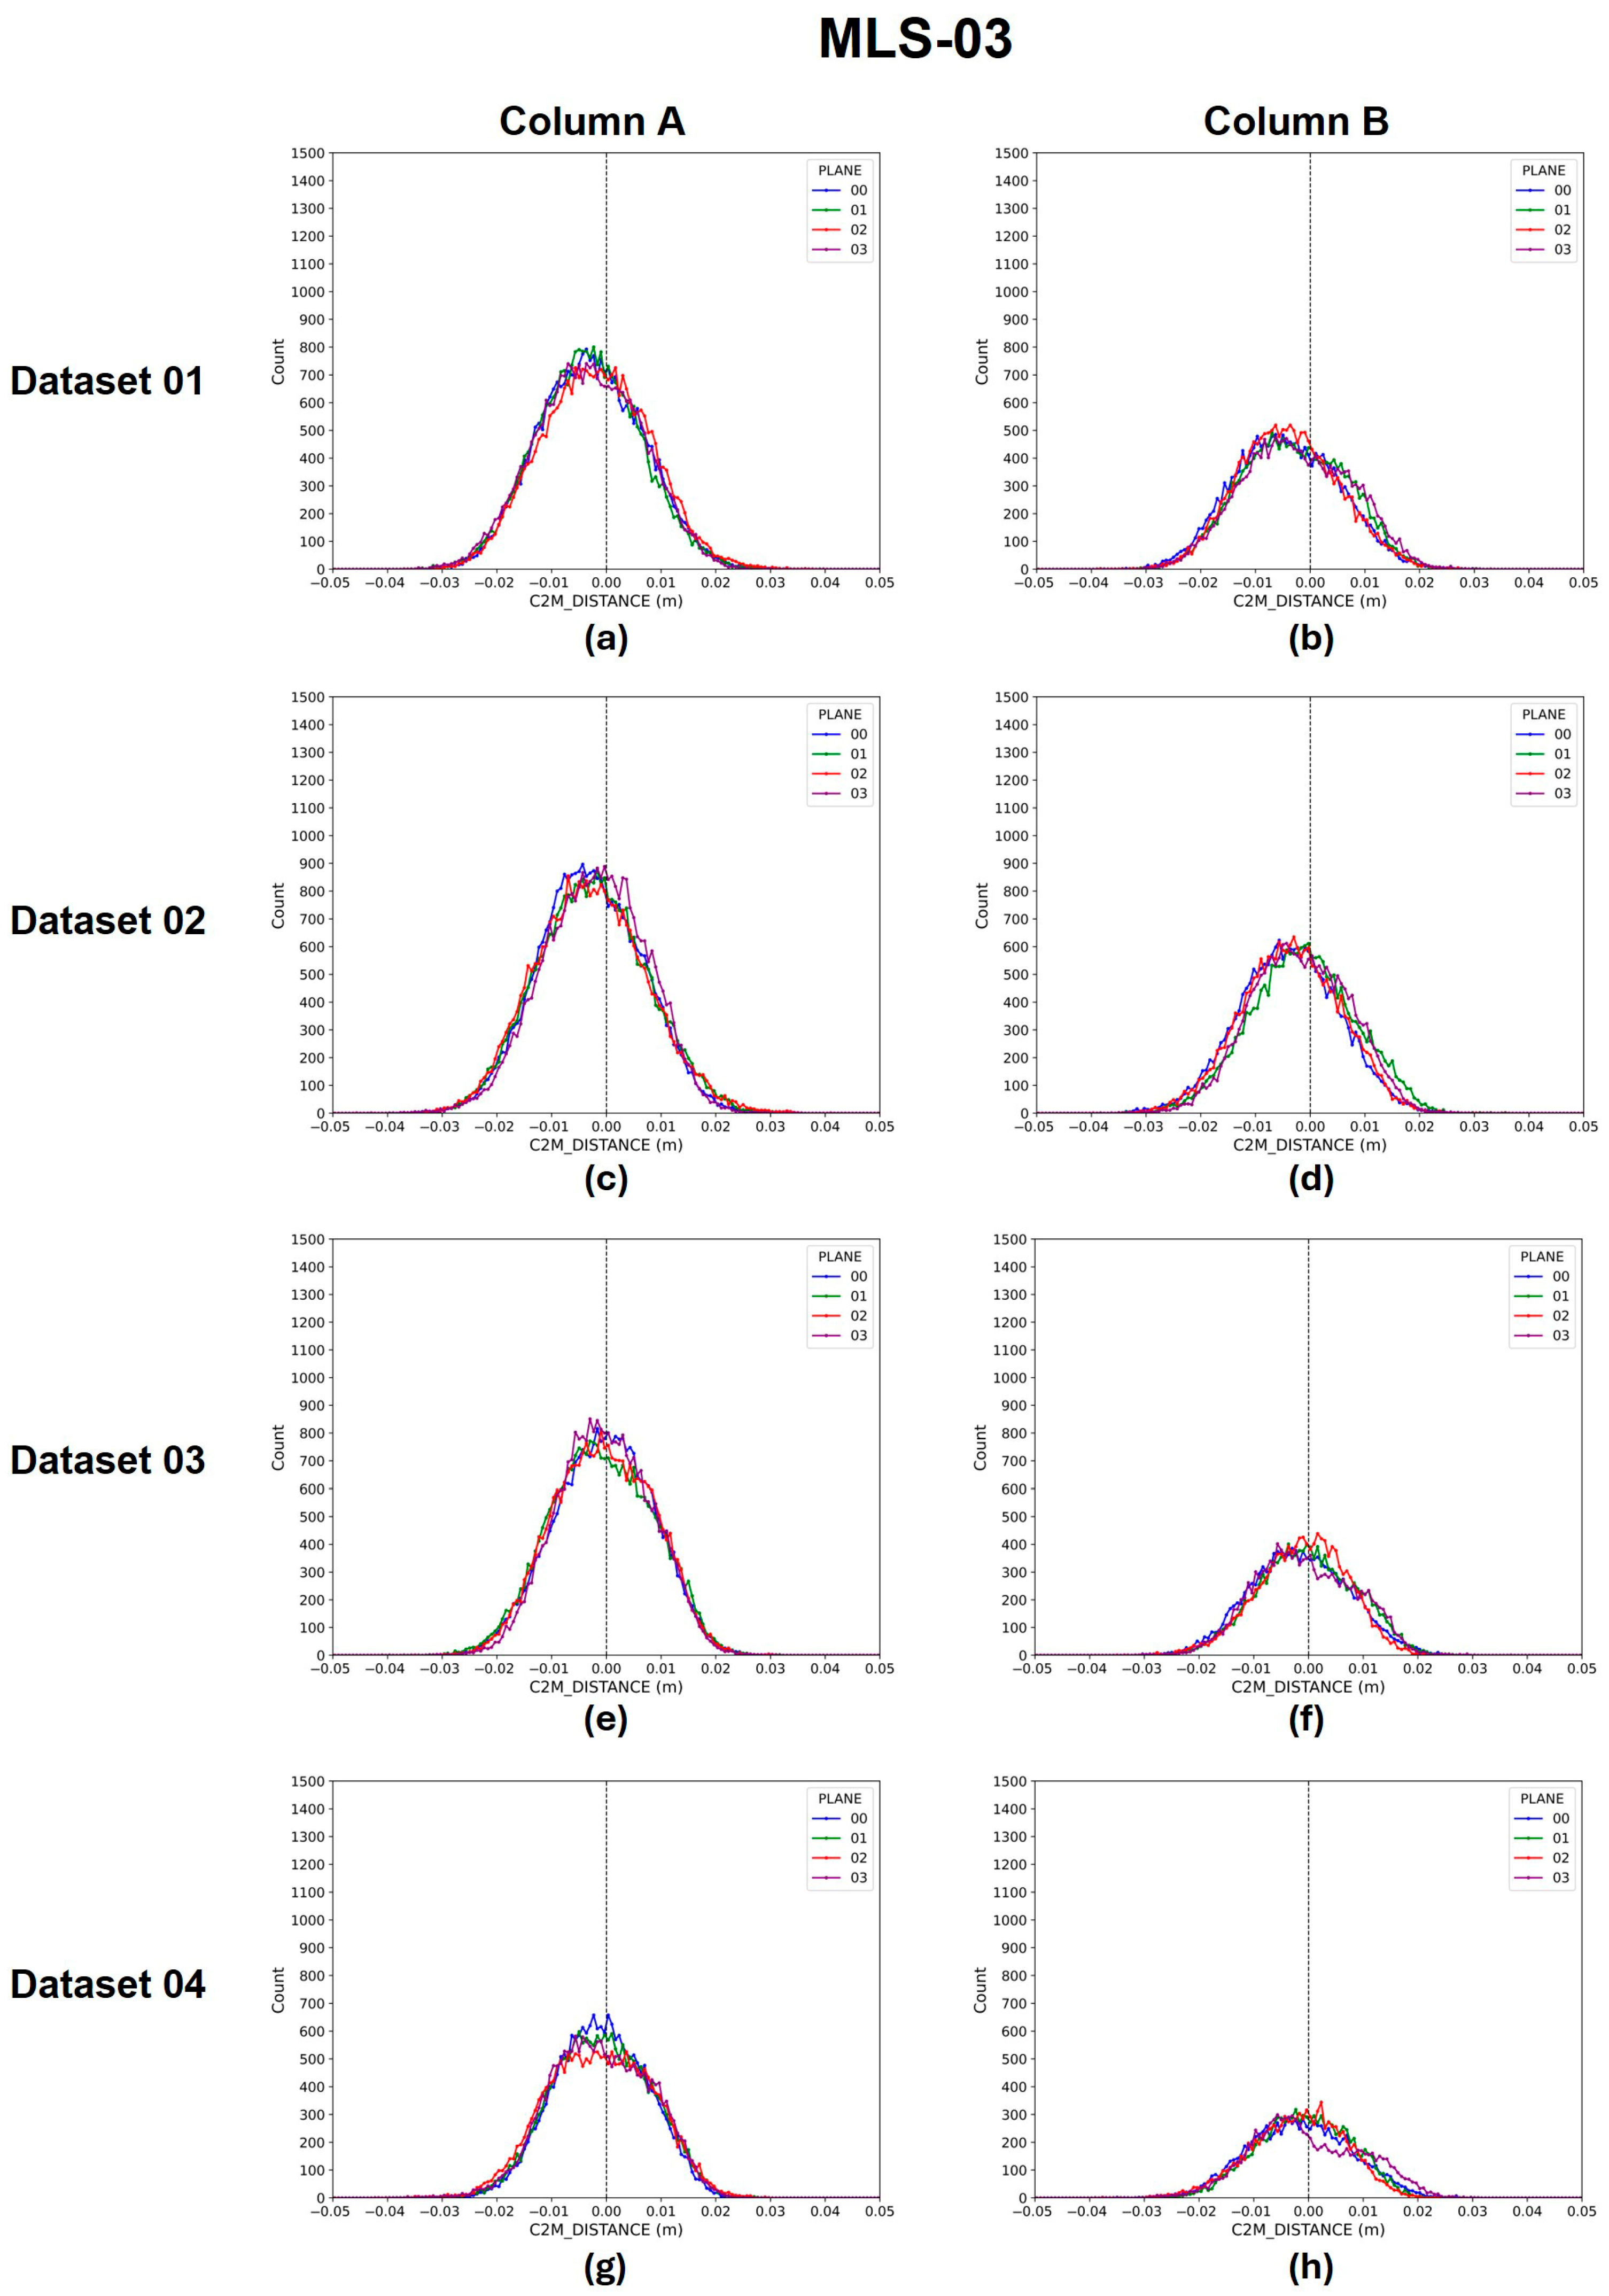
- MLS-03 point clouds exhibit an inward bias in error relative to the Column surface, with a representation mean error of −2.0 mm, standard deviation of 9.3 mm.
5.3. Discussions on the Impact of Downsampling Methods on Error Pattern
5.4. Contributions and Implications for BIM Applications
6. Conclusions
- Point clouds from each MLS device exhibited distinct error distribution patterns, with errors biased either inward or outward relative to the actual surface. Notably, two devices of the same model demonstrated opposite error directions (Assumption 1 is satisfied).
- Representative values derived from the identified error patterns were effective in enhancing the dimensional accuracy of reconstructed BIM components (Assumption 2 is satisfied).
7. Limitations and Future Work
Author Contributions
Funding
Institutional Review Board Statement
Informed Consent Statement
Data Availability Statement
Conflicts of Interest
Appendix A

| Dataset | Column | Plane | Mean Error (mm) | Standard Deviation (mm) |
|---|---|---|---|---|
| 01 | A | 01 | 8.47 | 7.24 |
| 02 | 6.86 | 5.27 | ||
| 03 | 9.13 | 5.90 | ||
| 04 | 7.79 | 6.32 | ||
| B | 01 | 6.52 | 5.93 | |
| 02 | 4.11 | 5.29 | ||
| 03 | 6.20 | 5.57 | ||
| 04 | 4.10 | 6.46 | ||
| 02 | A | 01 | 0.32 | 7.91 |
| 02 | 4.53 | 8.05 | ||
| 03 | 0.66 | 8.22 | ||
| 04 | 5.01 | 7.05 | ||
| B | 01 | −0.09 | 8.24 | |
| 02 | 3.96 | 8.38 | ||
| 03 | −0.63 | 9.03 | ||
| 04 | 4.09 | 7.23 | ||
| 03 | A | 01 | 7.32 | 5.67 |
| 02 | 4.32 | 6.79 | ||
| 03 | 7.68 | 8.18 | ||
| 04 | 4.58 | 5.76 | ||
| B | 01 | 3.08 | 6.75 | |
| 02 | 3.38 | 6.08 | ||
| 03 | 2.68 | 8.05 | ||
| 04 | 3.45 | 5.85 |
| Dataset | Column | Plane | Mean Error (mm) | Standard Deviation (mm) |
|---|---|---|---|---|
| 01 | A | 01 | 11.59 | 11.05 |
| 02 | 8.46 | 12.18 | ||
| 03 | 11.85 | 13.21 | ||
| 04 | 9.31 | 11.31 | ||
| B | 01 | 10.28 | 10.93 | |
| 02 | 8.15 | 11.90 | ||
| 03 | 10.82 | 12.81 | ||
| 04 | 8.21 | 9.98 | ||
| 02 | A | 01 | 11.19 | 10.47 |
| 02 | 5.96 | 10.63 | ||
| 03 | 10.67 | 10.47 | ||
| 04 | 5.84 | 11.06 | ||
| B | 01 | 10.06 | 10.99 | |
| 02 | 5.94 | 10.11 | ||
| 03 | 10.54 | 11.08 | ||
| 04 | 5.76 | 10.42 | ||
| 03 | A | 01 | 10.36 | 10.12 |
| 02 | 8.32 | 10.16 | ||
| 03 | 11.08 | 10.25 | ||
| 04 | 8.65 | 9.82 | ||
| B | 01 | 9.90 | 9.37 | |
| 02 | 8.21 | 9.77 | ||
| 03 | 10.09 | 10.17 | ||
| 04 | 7.99 | 9.70 | ||
| 04 | A | 01 | 11.05 | 10.62 |
| 02 | 7.42 | 9.79 | ||
| 03 | 11.18 | 10.74 | ||
| 04 | 7.76 | 10.62 | ||
| B | 01 | 10.28 | 10.80 | |
| 02 | 6.99 | 9.97 | ||
| 03 | 10.32 | 10.78 | ||
| 04 | 6.36 | 9.88 |
| Dataset | Column | Plane | Mean Error (mm) | Standard Deviation (mm) |
|---|---|---|---|---|
| 01 | A | 01 | −2.74 | 9.39 |
| 02 | −3.18 | 9.41 | ||
| 03 | −1.90 | 9.80 | ||
| 04 | −3.21 | 9.59 | ||
| B | 01 | −4.42 | 9.49 | |
| 02 | −3.02 | 9.47 | ||
| 03 | −4.06 | 9.13 | ||
| 04 | −2.42 | 9.77 | ||
| 02 | A | 01 | −2.93 | 9.38 |
| 02 | −2.56 | 9.92 | ||
| 03 | −2.80 | 10.13 | ||
| 04 | −2.10 | 9.30 | ||
| B | 01 | −4.02 | 9.11 | |
| 02 | −1.45 | 9.46 | ||
| 03 | −3.56 | 9.01 | ||
| 04 | −1.86 | 8.82 | ||
| 03 | A | 01 | −0.42 | 8.88 |
| 02 | −0.88 | 9.33 | ||
| 03 | −0.57 | 9.01 | ||
| 04 | −0.35 | 8.47 | ||
| B | 01 | −1.67 | 8.91 | |
| 02 | −0.33 | 8.75 | ||
| 03 | −1.09 | 8.08 | ||
| 04 | −0.66 | 8.92 | ||
| 04 | A | 01 | −0.93 | 8.32 |
| 02 | −0.91 | 8.84 | ||
| 03 | −1.29 | 9.56 | ||
| 04 | −1.08 | 9.15 | ||
| B | 01 | −1.61 | 9.28 | |
| 02 | −0.81 | 8.35 | ||
| 03 | −1.98 | 8.57 | ||
| 04 | −0.35 | 10.04 |
References
- Pal, A.; Lin, J.J.; Hsieh, S.-H.; Golparvar-Fard, M. Automated Vision-Based Construction Progress Monitoring in Built Environment through Digital Twin. Dev. Built Environ. 2023, 16, 100247. [Google Scholar] [CrossRef]
- Wang, Q.; Kim, M.-K. Applications of 3D Point Cloud Data in the Construction Industry: A Fifteen-Year Review from 2004 to 2018. Adv. Eng. Inform. 2019, 39, 306–319. [Google Scholar] [CrossRef]
- Wang, Q.; Tan, Y.; Mei, Z. Computational Methods of Acquisition and Processing of 3D Point Cloud Data for Construction Applications. Arch. Comput. Methods Eng. 2020, 27, 479–499. [Google Scholar] [CrossRef]
- Kim, H.; Kim, C. 3D As-Built Modeling from Incomplete Point Clouds Using Connectivity Relations. Autom. Constr. 2021, 130, 103855. [Google Scholar] [CrossRef]
- Park, J.; Kim, J.; Lee, D.; Jeong, K.; Lee, J.; Kim, H.; Hong, T. Deep Learning–Based Automation of Scan-to-BIM with Modeling Objects from Occluded Point Clouds. J. Manag. Eng. 2022, 38, 04022025. [Google Scholar] [CrossRef]
- Wang, C.; Hou, S.; Wen, C.; Gong, Z.; Li, Q.; Sun, X.; Li, J. Semantic Line Framework-Based Indoor Building Modeling Using Backpacked Laser Scanning Point Cloud. ISPRS J. Photogramm. Remote Sens. 2018, 143, 150–166. [Google Scholar] [CrossRef]
- Yuan, X.; Smith, A.; Moreu, F.; Sarlo, R.; Lippitt, C.D.; Hojati, M.; Alampalli, S.; Zhang, S. Automatic Evaluation of Rebar Spacing and Quality Using LiDAR Data: Field Application for Bridge Structural Assessment. Autom. Constr. 2023, 146, 104708. [Google Scholar] [CrossRef]
- Shi, B.; Bai, Y.; Zhang, S.; Zhong, R.; Yang, F.; Song, S.; Li, G. Reference-Plane-Based Approach for Accuracy Assessment of Mobile Mapping Point Clouds. Measurement 2021, 171, 108759. [Google Scholar] [CrossRef]
- Zoller + Fröhlich GmbH Z + F FLEXSCAN. Available online: https://www.zofre.de/en/laser-scanners/3d-laser-scanner/z-f-flexscan-22 (accessed on 26 June 2025).
- RIGEL RIGEL VZ-600i Datasheets. Available online: http://www.riegl.com/nc/products/terrestrial-scanning/produktdetail/product/scanner/78/ (accessed on 26 June 2025).
- FARO Technical Specifications Sheet for ZEB Horizon. Available online: https://knowledge.faro.com/Hardware/GeoSlam/ZEB_Horizon_and_Horizon_RT/Technical_Specifications_Sheet_for_ZEB_Horizon (accessed on 26 June 2025).
- Ibrahimkhil, M.H.; Shen, X.; Barati, K.; Wang, C.C. Dynamic Progress Monitoring of Masonry Construction through Mobile SLAM Mapping and As-Built Modeling. Buildings 2023, 13, 930. [Google Scholar] [CrossRef]
- FARO Technical Specifications Sheet for ZEB REVO. Available online: https://knowledge.faro.com/Hardware/GeoSlam/ZEB_Revo_and_Revo_RT/Technical_Specifications_Sheet_for_ZEB_Revo (accessed on 26 June 2025).
- Cui, Y.; Li, Q.; Yang, B.; Xiao, W.; Chen, C.; Dong, Z. Automatic 3-D Reconstruction of Indoor Environment With Mobile Laser Scanning Point Clouds. IEEE J. Sel. Top. Appl. Earth Obs. Remote Sens. 2019, 12, 3117–3130. [Google Scholar] [CrossRef]
- Sgrenzaroli, M.; Ortiz Barrientos, J.; Vassena, G.; Sanchez, A.; Ciribini, A.; Mastrolembo Ventura, S.; Comai, S. Indoor mobile mapping systems and (bim) digital models for construction progress monitoring. Int. Arch. Photogramm. Remote Sens. Spat. Inf. Sci. 2022, XLIII-B1-2022, 121–127. [Google Scholar] [CrossRef]
- Gexcel HERON MS TWIN Color Tech Sheet. Available online: https://www.gexcel.it/images/soluzioni/HERON/HERON-MS-TWIN-Color_32-32ch_120m_TechSheet.pdf (accessed on 26 June 2025).
- Hillemann, M.; Weinmann, M.; Mueller, M.S.; Jutzi, B. Automatic Extrinsic Self-Calibration of Mobile Mapping Systems Based on Geometric 3D Features. Remote Sens. 2019, 11, 1955. [Google Scholar] [CrossRef]
- Tang, T.Y.; Yoon, D.J.; Pomerleau, F.; Barfoot, T.D. Learning a Bias Correction for Lidar-Only Motion Estimation. In Proceedings of the 2018 15th Conference on Computer and Robot Vision (CRV), Toronto, Canada, 8–10 May 2018; pp. 166–173. [Google Scholar]
- Kalvoda, P.; Nosek, J.; Kuruc, M.; Volarik, T.; Kalvodova, P. Accuracy Evaluation and Comparison of Mobile Laser Scanning and Mobile Photogrammetry Data. IOP Conf. Ser. Earth Environ. Sci. 2020, 609, 012091. [Google Scholar] [CrossRef]
- Sepasgozar, S.M.E.; Forsythe, P.; Shirowzhan, S. Evaluation of Terrestrial and Mobile Scanner Technologies for Part-Built Information Modeling. J. Constr. Eng. Manag. 2018, 144, 04018110. [Google Scholar] [CrossRef]
- Lin, Y.; Hyyppä, J.; Kaartinen, H.; Kukko, A. Performance Analysis of Mobile Laser Scanning Systems in Target Representation. Remote Sens. 2013, 5, 3140–3155. [Google Scholar] [CrossRef]
- Toschi, I.; Rodríguez-Gonzálvez, P.; Remondino, F.; Minto, S.; Orlandini, S.; Fuller, A. Accuracy evaluation of a mobile mapping system with advanced statistical methods. Int. Arch. Photogramm. Remote Sens. Spat. Inf. Sci. 2015, XL-5-W4, 245–253. [Google Scholar] [CrossRef]
- Al-Durgham, K.; Lichti, D.D.; Kwak, E.; Dixon, R. Automated Accuracy Assessment of a Mobile Mapping System with Lightweight Laser Scanning and MEMS Sensors. Appl. Sci. 2021, 11, 1007. [Google Scholar] [CrossRef]
- Yiğit, A.Y.; Gamze Hamal, S.N.; Ulvi, A.; Yakar, M. Comparative Analysis of Mobile Laser Scanning and Terrestrial Laser Scanning for the Indoor Mapping. Build. Res. Inf. 2023, 52, 402–417. [Google Scholar] [CrossRef]
- Tucci, G.; Visintini, D.; Bonora, V.; Parisi, E.I. Examination of Indoor Mobile Mapping Systems in a Diversified Internal/External Test Field. Appl. Sci. 2018, 8, 401. [Google Scholar] [CrossRef]
- Maset, E.; Scalera, L.; Beinat, A.; Visintini, D.; Gasparetto, A. Performance Investigation and Repeatability Assessment of a Mobile Robotic System for 3D Mapping. Robotics 2022, 11, 54. [Google Scholar] [CrossRef]
- Moyano, J.; Justo-Estebaranz, Á.; Nieto-Julián, J.E.; Barrera, A.O.; Fernández-Alconchel, M. Evaluation of Records Using Terrestrial Laser Scanner in Architectural Heritage for Information Modeling in HBIM Construction: The Case Study of the La Anunciación Church (Seville). J. Build. Eng. 2022, 62, 105190. [Google Scholar] [CrossRef]
- Fryskowska, A.; Wroblewski, P. Mobile Laser Scanning Accuracy Assessment for the Purpose of Base-Map Updating. Geod. Cartogr. 2018, 67, 35–55. [Google Scholar] [CrossRef]
- De Geyter, S.; Vermandere, J.; De Winter, H.; Bassier, M.; Vergauwen, M. Point Cloud Validation: On the Impact of Laser Scanning Technologies on the Semantic Segmentation for BIM Modeling and Evaluation. Remote Sens. 2022, 14, 582. [Google Scholar] [CrossRef]
- Teo, T.-A.; Yang, C.-C. Evaluating the Accuracy and Quality of an iPad Pro’s Built-in Lidar for 3D Indoor Mapping. Dev. Built Environ. 2023, 14, 100169. [Google Scholar] [CrossRef]
- Tang, S.; Li, X.; Zheng, X.; Wu, B.; Wang, W.; Zhang, Y. BIM Generation from 3D Point Clouds by Combining 3D Deep Learning and Improved Morphological Approach. Autom. Constr. 2022, 141, 104422. [Google Scholar] [CrossRef]
- Singh, S.K.; Raval, S.; Banerjee, B. A Robust Approach to Identify Roof Bolts in 3D Point Cloud Data Captured from a Mobile Laser Scanner. Int. J. Min. Sci. Technol. 2021, 31, 303–312. [Google Scholar] [CrossRef]
- Pouraghdam, M.H.; Saadatseresht, M.; Rastiveis, H.; Abzal, A.; Hasanlou, M. Building Floor Plan Reconstruction from Slam-Based Point Cloud Using Ransac Algorithm. ISPRS-Int. Arch. Photogramm. Remote Sens. Spat. Inf. Sci. 2019, 4218, 483–488. [Google Scholar] [CrossRef]
- Ochmann, S.; Vock, R.; Wessel, R.; Klein, R. Automatic Reconstruction of Parametric Building Models from Indoor Point Clouds. Comput. Graph. 2016, 54, 94–103. [Google Scholar] [CrossRef]
- Previtali, M.; Díaz-Vilariño, L.; Scaioni, M. Indoor Building Reconstruction from Occluded Point Clouds Using Graph-Cut and Ray-Tracing. Appl. Sci. 2018, 8, 1529. [Google Scholar] [CrossRef]
- Ochmann, S.; Vock, R.; Klein, R. Automatic Reconstruction of Fully Volumetric 3D Building Models from Oriented Point Clouds. ISPRS J. Photogramm. Remote Sens. 2019, 151, 251–262. [Google Scholar] [CrossRef]
- Zhang, F.; Kong, Q.; Yuan, C.; Li, P. Automatic Generation of Architecture Drawings from Point Clouds. Comput.-Aided Civ. Infrastruct. Eng. 2024, 39, 3477–3488. [Google Scholar] [CrossRef]
- Mahmoud, M.; Chen, W.; Yang, Y.; Li, Y. Automated BIM Generation for Large-Scale Indoor Complex Environments Based on Deep Learning. Autom. Constr. 2024, 162, 105376. [Google Scholar] [CrossRef]
- Babacan, K.; Jung, J.; Wichmann, A.; Jahromi, B.A.; Shahbazi, M.; Sohn, G.; Kada, M. Towards Object Driven Floor Plan Extraction from Laser Point Cloud. ISPRS-Int. Arch. Photogramm. Remote Sens. Spat. Inf. Sci. 2016, 49B3, 3–10. [Google Scholar] [CrossRef]
- Gao, X.; Yang, R.; Tan, J.; Liu, Y. Floor Plan Reconstruction from Indoor 3D Point Clouds Using Iterative RANSAC Line Segmentation. J. Build. Eng. 2024, 89, 109238. [Google Scholar] [CrossRef]
- Mahmoud, M.; Zhao, Z.; Chen, W.; Adham, M.; Li, Y. Automated Scan-to-BIM: A Deep Learning-Based Framework for Indoor Environments with Complex Furniture Elements. J. Build. Eng. 2025, 106, 112596. [Google Scholar] [CrossRef]
- Nguyen, H.L.; Belton, D.; Helmholz, P. Planar Surface Detection for Sparse and Heterogeneous Mobile Laser Scanning Point Clouds. ISPRS J. Photogramm. Remote Sens. 2019, 151, 141–161. [Google Scholar] [CrossRef]
- Jung, J.; Stachniss, C.; Kim, C. Automatic Room Segmentation of 3D Laser Data Using Morphological Processing. ISPRS Int. J. Geo-Inf. 2017, 6, 206. [Google Scholar] [CrossRef]
- Xiao, Y.; Taguchi, Y.; Kamat, V.R. Coupling Point Cloud Completion and Surface Connectivity Relation Inference for 3D Modeling of Indoor Building Environments. J. Comput. Civ. Eng. 2018, 32, 04018033. [Google Scholar] [CrossRef]
- Wu, H.; Yue, H.; Xu, Z.; Yang, H.; Liu, C.; Chen, L. Automatic Structural Mapping and Semantic Optimization from Indoor Point Clouds. Autom. Constr. 2021, 124, 103460. [Google Scholar] [CrossRef]


| Specifications | TLS | MLSs | |
|---|---|---|---|
| TLS-01 | MLS-01 | MLS-02 and MLS-03 | |
| Point (range) accuracy | ±1 mm | 10 mm | 10–30 mm |
| 3D accuracy | 2 mm @ 10 m, 3.5 mm @ 25 m | - | - |
| Relative accuracy | - | ≤10 mm | Up to 6 mm |
| MLS Point Clouds | Title 2 | Title 3 | |||
|---|---|---|---|---|---|
| Column A | Column B | ||||
| Individual Plane | Total (Four Planes) | Individual Plane | Total (Four Planes) | ||
| MLS-01 | 01 | 13,000 | 52,000 | 9000 | 36,000 |
| 02 | 25,000 | 10,0000 | 13,900 | 55,600 | |
| 03 | 20,993 | 83,972 | 13,994 | 55,976 | |
| MLS-02 | 01 | 20,000 | 80,000 | 8995 | 35,980 |
| 02 | 16,000 | 64,000 | 13,000 | 52,000 | |
| 03 | 23,000 | 92,000 | 15,000 | 60,000 | |
| 04 | 18,000 | 72,000 | 11,000 | 44,000 | |
| MLS-03 | 01 | 28,000 | 112,000 | 18,000 | 72,000 |
| 02 | 32,000 | 128,000 | 21,000 | 84,000 | |
| 03 | 28,000 | 112,000 | 13,000 | 52,000 | |
| 04 | 21,000 | 84,000 | 10,000 | 40,000 | |
| MLS | Dataset | Column | Plane | -Value | ||
|---|---|---|---|---|---|---|
| 01 | 01 | A | 02 | 0.007% | 1.131% | 0.727 |
| 02 | 02 | A | 02 | 0.008% | 1.076% | 0.281 |
| 03 | 01 | A | 01 | 0.003% | 0.819% | 0.532 |
| MLS Type | Mean Error (mm) | Standard Deviation (mm) |
|---|---|---|
| MLS-01 | 4.3 | 7.6 |
| MLS-02 | 9.2 | 10.8 |
| MLS-03 | −2.0 | 9.3 |
| MLS Type | Dataset | Column | MLS-RANSAC (mm) | MLS-RANSAC with Correction (mm) | Accuracy Improvement (mm) |
|---|---|---|---|---|---|
| MLS-01 | 01 | A | 10.7 | 5.0 | 5.7 |
| B | 7.0 | 4.1 | 2.9 | ||
| 02 | A | 5.8 | 5.2 | 0.6 | |
| B | 5.5 | 4.8 | 0.8 | ||
| 03 | A | 9.0 | 4.5 | 4.5 | |
| B | 4.7 | 2.9 | 1.8 | ||
| MLS-02 | 01 | A | 11.8 | 5.8 | 6.0 |
| B | 12.8 | 2.7 | 10.1 | ||
| 02 | A | 13.4 | 4.9 | 8.5 | |
| B | 12.3 | 2.9 | 9.4 | ||
| 03 | A | 13.3 | 2.3 | 11.0 | |
| B | 12.1 | 1.9 | 10.2 | ||
| 04 | A | 14.3 | 3.0 | 11.3 | |
| B | 13.2 | 2.3 | 10.9 | ||
| MLS-03 | 01 | A | 5.4 | 3.2 | 2.2 |
| B | 6.3 | 3.7 | 2.6 | ||
| 02 | A | 4.7 | 2.6 | 2.1 | |
| B | 4.2 | 2.0 | 2.3 | ||
| 03 | A | 2.0 | 2.4 | −0.4 | |
| B | 2.6 | 2.0 | 0.6 | ||
| 04 | A | 3.0 | 2.9 | 0.1 | |
| B | 4.9 | 3.9 | 1.0 |
Disclaimer/Publisher’s Note: The statements, opinions and data contained in all publications are solely those of the individual author(s) and contributor(s) and not of MDPI and/or the editor(s). MDPI and/or the editor(s) disclaim responsibility for any injury to people or property resulting from any ideas, methods, instructions or products referred to in the content. |
© 2025 by the authors. Licensee MDPI, Basel, Switzerland. This article is an open access article distributed under the terms and conditions of the Creative Commons Attribution (CC BY) license (https://creativecommons.org/licenses/by/4.0/).
Share and Cite
Bae, S.-J.; Park, J.; Ham, J.; Song, M.; Kim, J.-Y. Error Distribution Pattern Analysis of Mobile Laser Scanners for Precise As-Built BIM Generation. Appl. Sci. 2025, 15, 8076. https://doi.org/10.3390/app15148076
Bae S-J, Park J, Ham J, Song M, Kim J-Y. Error Distribution Pattern Analysis of Mobile Laser Scanners for Precise As-Built BIM Generation. Applied Sciences. 2025; 15(14):8076. https://doi.org/10.3390/app15148076
Chicago/Turabian StyleBae, Sung-Jae, Junbeom Park, Joonhee Ham, Minji Song, and Jung-Yeol Kim. 2025. "Error Distribution Pattern Analysis of Mobile Laser Scanners for Precise As-Built BIM Generation" Applied Sciences 15, no. 14: 8076. https://doi.org/10.3390/app15148076
APA StyleBae, S.-J., Park, J., Ham, J., Song, M., & Kim, J.-Y. (2025). Error Distribution Pattern Analysis of Mobile Laser Scanners for Precise As-Built BIM Generation. Applied Sciences, 15(14), 8076. https://doi.org/10.3390/app15148076