Article

Study on Air-Cooled Structure of Direct-Drive Outer-Rotor Permanent Magnet Synchronous Generator for Wind Power Generation

1
School of Electrical and Information Engineering, Tianjin University, Tianjin 300072, China
2
Wolong Electric Nanyang Explosion Protection Group Co., Ltd., Nanyang 473008, China
3
School of Control and Mechanical Engineering, Tianjin Chengjian University, Tianjin 300384, China
4
School of Engineering and Technology, Tianjin Agricultural University, Tianjin 300384, China
*
Authors to whom correspondence should be addressed.
Appl. Sci. 2025, 15(14), 8008; https://doi.org/10.3390/app15148008
Submission received: 29 May 2025 / Revised: 4 July 2025 / Accepted: 15 July 2025 / Published: 18 July 2025

Abstract

Direct-drive permanent magnet synchronous generators (DD-PMSGs) have been widely adopted in wind power generation systems owing to their distinctive advantages, including direct-drive operation, high power density, and superior energy conversion efficiency. However, the high power density of the generator inevitably leads to heat generation issues, which affect the reliability of the generator. To address the thermal issues in the 4.5 MW direct-drive permanent magnet synchronous generator (DD-PMSG), this paper proposes a novel forced air-cooling ventilation system. Through comprehensive computational fluid dynamics (CFD) simulations and fundamental thermodynamic analysis, the cooling performance is systematically evaluated to determine the optimal width of the stator ventilation ducts. Furthermore, based on the temperature distribution of the stator and rotor, three optimization schemes for non-uniform core segments are proposed. By comparing the ventilation cooling performance under three structural schemes, the optimal structural scheme is provided for the generator. Finally, the feasibility of the heat dissipation scheme and the accuracy of the simulation calculations are verified by fabricating a prototype and setting up an experimental platform. The above conclusions and research results can provide some reference for the design of the core ventilation ducts structure of subsequent wind turbines.

1. Introduction

Due to the non-renewability and polluting nature of traditional fossil energy, wind energy has become increasingly important in energy supply with its cleanliness and renewability [1,2,3]. With the rapid development of wind power generation, the demand for power from wind turbines is increasing. However, the losses of permanent magnet synchronous generators will increase with the increase of the single-unit capacity of the generator. The increase in these losses leads to excessive temperature rise of the motor, which is the main cause of motor failure [4,5,6].
To address the heat generation issue in large motors, many scholars have conducted research on their cooling systems. Polikarpova et al. [7] conducted a thermal analysis of an 8 MW outer-rotor direct-drive wind turbine generator and employed internal coolant ducts for direct cooling of the stator windings. Song et al. [8] modeled and analyzed a high-power, high-torque-density direct-drive motor and proposed a novel winding molding method to enhance the cooling effect of the windings. Wu et al. [9] optimized the cooling system of a steam turbine generator, proposing a strategy to adjust gas parameters to suppress temperature fluctuations in the windings. Shi et al. [10] designed a cooling system combining a heat exchanger and a heat sink for a 2.5 MW permanent magnet wind turbine generator (PMSWG), addressing the issue of excessive temperature rise during operation.
The fluid–structure interaction method based on computational fluid dynamics (CFD) can achieve accurate analysis of the temperature rise distribution and flow characteristics within the motor [11,12,13]. Numerical studies of the fluid in the cooling system are of great significance. Optimizing the cooling structure based on research results is crucial for enhancing the heat dissipation efficiency of generators. Li et al. [14] conducted numerical studies on the ventilation ducts structure of a 250 MW large hydroelectric generator, exploring the variation patterns of fluid temperature distribution, velocity, and heat transfer coefficient in the ventilation ducts. Zhou et al. [15] explored the ventilation system of a novel 350 MW air-cooled steam turbine generator, conducting flow and thermal analyses based on computational fluid dynamics and proposing a multi-chamber downstream cooling path for air-cooled generators. Xiao et al. [16,17,18] took the motor driven by a high-temperature gas-cooled helium reactor as the research object and proposed a method for calculating gas friction loss using Bernoulli’s equation, analyzing the impact of ventilation ducts geometry on temperature distribution. Fan et al. [19] analyzed the ventilation and thermal performance of a radially forced air-cooled fractional-slot concentrated-winding PMSWG. The study provided insights into the impact of the number of cooling ducts and ducts width on the fluid and temperature fields of the generator. Jamshidi et al. [20] analyzed a generator equipped with ventilation ducts, predicting the flow distribution within the stator ducts and proposing geometric designs to achieve higher mass flow rates and improved flow characteristics.
At present, there have been some research results in the field of wind turbine research on optimizing the internal radial ventilation duct structure. However, further research is still needed on the optimization of radial ventilation duct structure and fluid characteristics in wind turbines, especially in the field of non-uniform core technology, where there are few research results. Further research can be conducted to improve the non-uniformity of internal cooling capacity and combined with multi physics coupling mechanisms and structural parameter collaborative optimization strategies.
This study investigates a 4.5 MW direct-drive permanent magnet synchronous generator (DD-PMSG) incorporating forced air cooling. Based on the fluid–thermal coupling theory, an internal ventilation and cooling model for the wind turbine generator is established. Using CFD finite element analysis, numerical calculations of velocity and flow rate are performed for the 19 radial ventilation ducts within the generator under different ventilation ducts widths. Through comparative analysis of the computational results, the optimal ventilation ducts width is determined. Subsequently, three different non-uniform core schemes are proposed. CFD simulations of the temperature field inside the generator are conducted to investigate the ventilation cooling performance. The optimal structural scheme for the generator is provided. Finally, the feasibility of the cooling scheme is verified by fabricating a prototype and setting up an experimental platform.

2. Establishment of the Fluid–Solid Coupling Structure for DD-PMSG

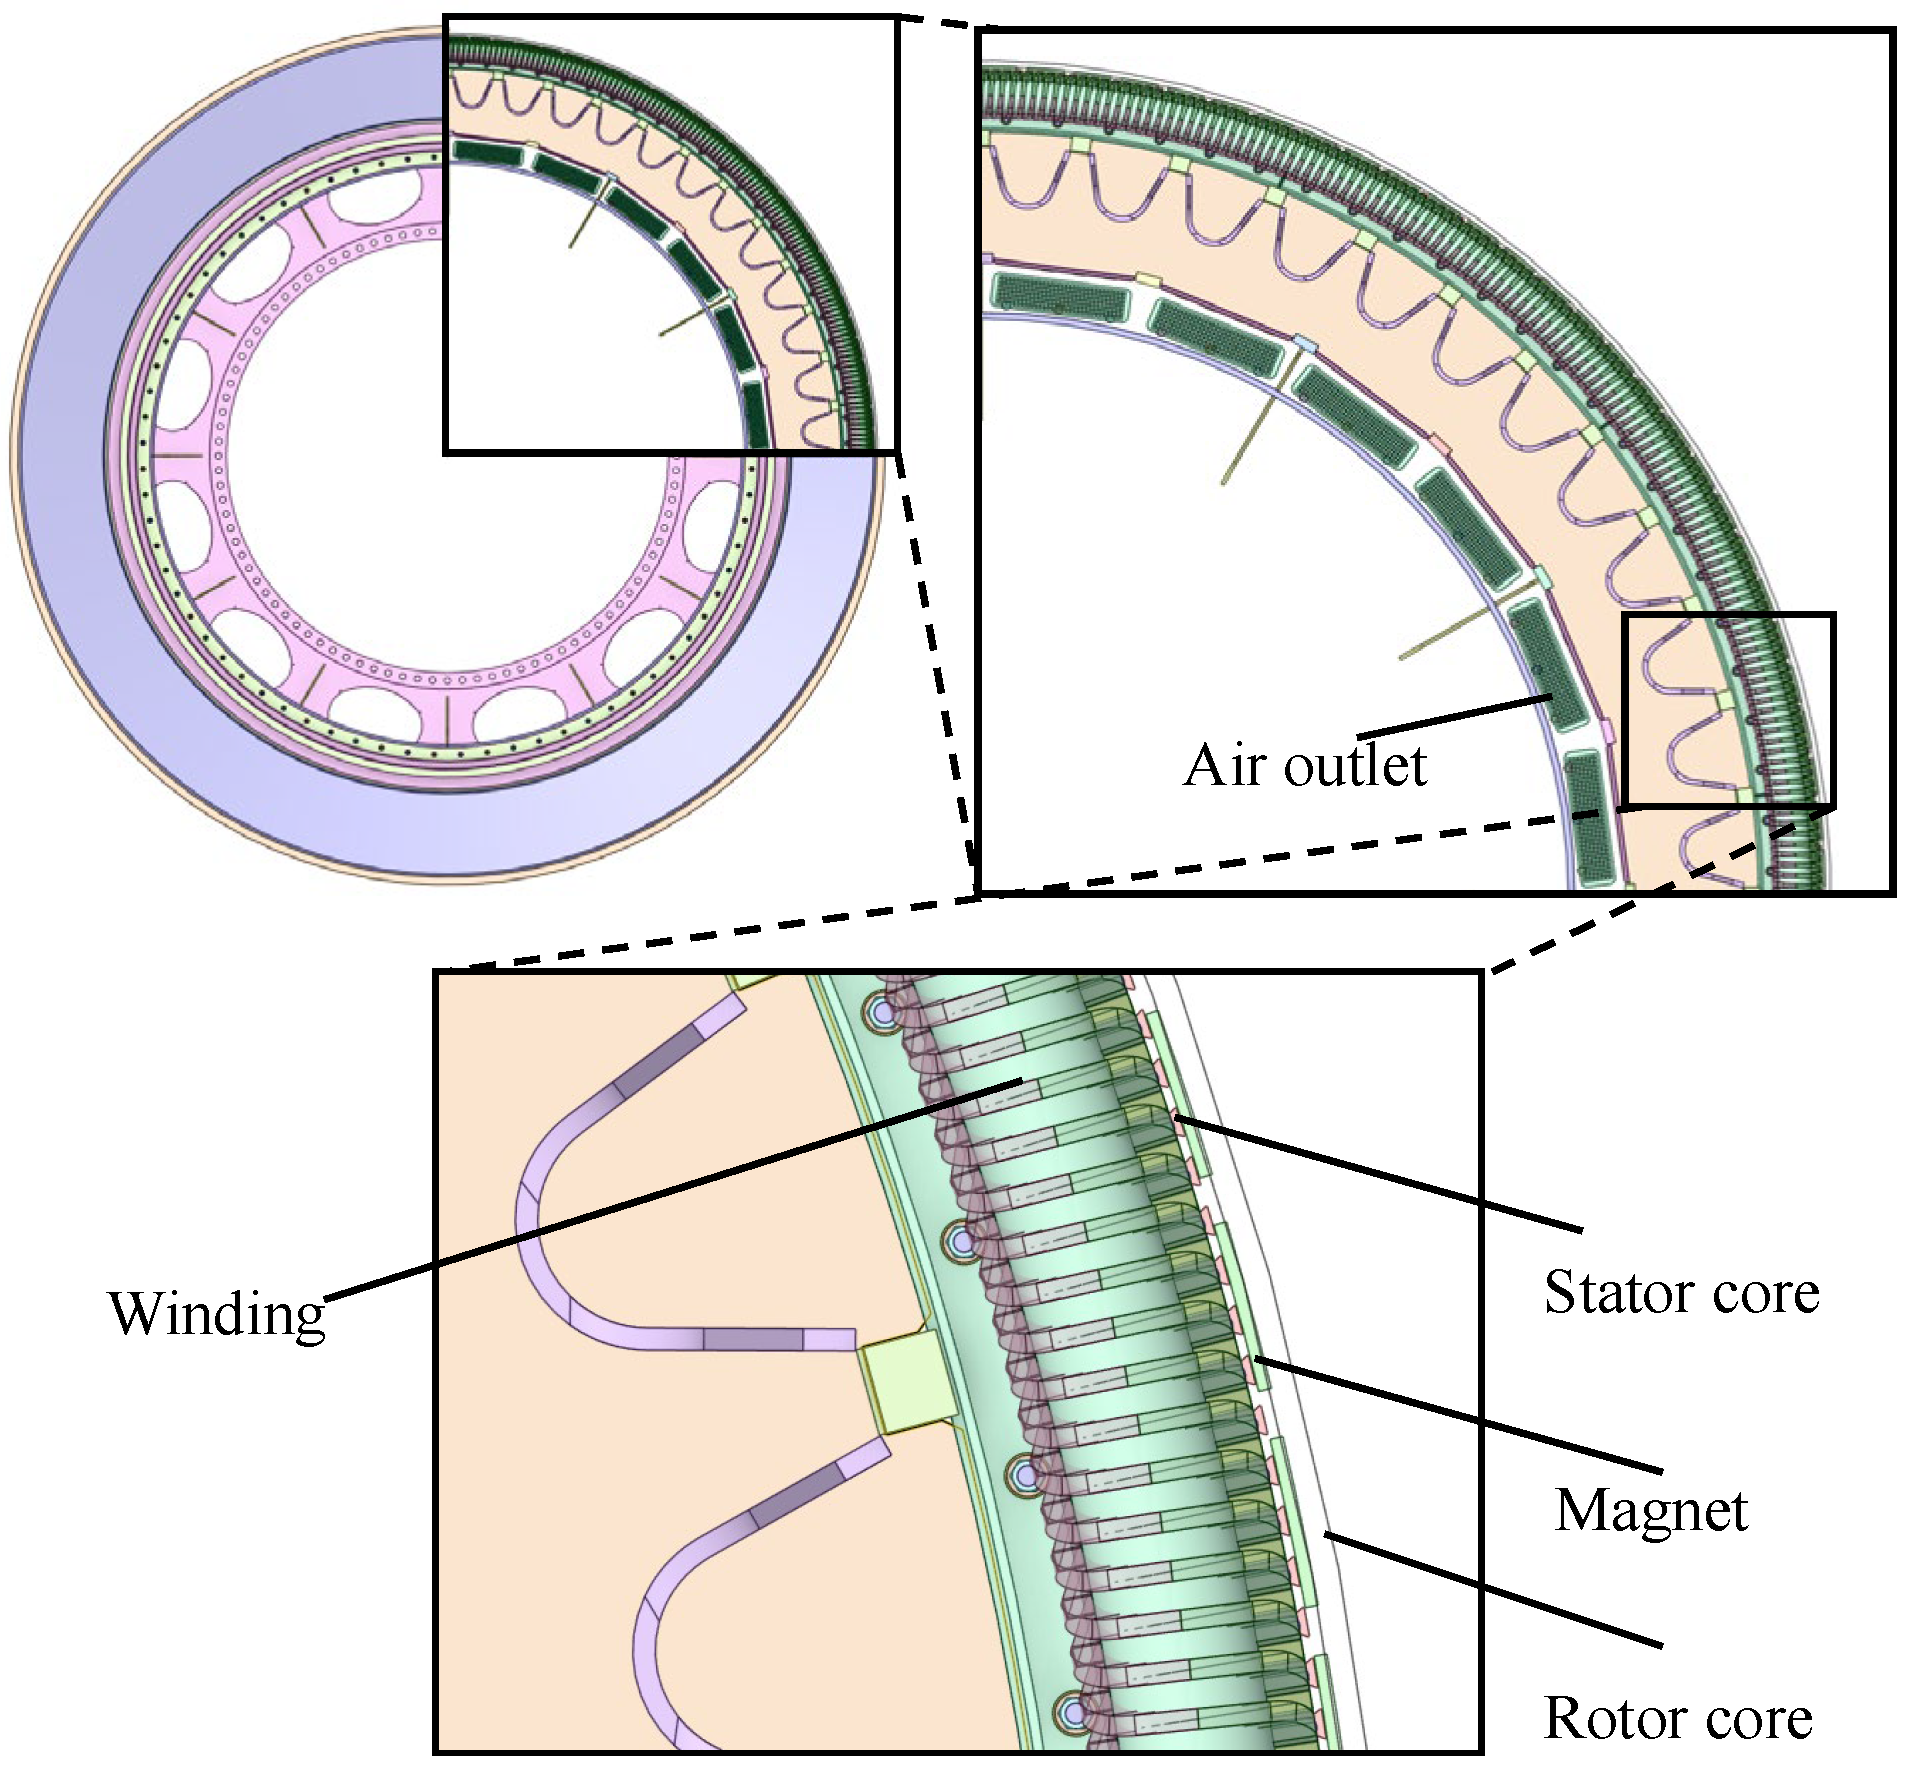
2.1. The Structure of the Wind Turbine Generator and Its Cooling System

The paper presents a 4.5 MW DD-PMSG with an external rotor structure. The stator has 480 slots, and the rotor comprises 56 pole-pair magnets. Figure 1 illustrates the permanent magnet wind turbine generator, and its basic parameters are listed in Table 1. The insulation material has a thermal class of F, allowing a maximum temperature rise of 100 K. Thus, ensuring the wind turbine’s cooling capacity, it is crucial to meet the requirements.
MW-class DDPSWSG has high torque and power. When the generator runs normally, the large rated current causes key parts (like winding and iron core) to generate a lot of heat, resulting in temperature rise and gradients. Excessive temperature rise can accelerate the aging or damage of winding insulation. And large temperature gradients may cause damage to winding insulation and mechanical components, as well as permanent structural failures. Thus, the cooling system is an essential equipment for controlling the temperature rise and gradient of wind turbines.
Currently, the cooling systems for large scale PMSG mainly adopt air cooling and water cooling. Air cooling includes natural air cooling and forced air cooling. Natural air cooling is typically used for wind turbines below 3 MW. Forced air cooling is generally applied for wind turbines ranging from 3 MW to 5 MW. If the wind turbine’s power exceeds 5 MW, it is recommended to use a water-cooled structure for cooling.
For the 4.5 MW DD-PMSG, a forced air-cooling method is proposed in the paper. The cooling air flows through two symmetrical paths inside the generator. First, it passes through the end windings of the generator and cools them. Then, it enters the air gap to cool the rotor and the stator core teeth. Finally, the air flows through the radial ventilation ducts in the core to dissipate heat from the internal winding. The fluid flow path inside the generator is shown in Figure 2.

2.2. Mathematical Modeling

The flow of the cooling medium and heat transfer within the generator must satisfy the physical conservation laws, namely the conservation of mass, the conservation of momentum, and the conservation of energy [21].
  • Conservation of mass:
ρ t + ( ρ u ) x + ( ρ v ) y + ( ρ w ) z = 0
where ρ represents the density (kg/m3); t represents time (s); and u, v, and w are the fluid velocity components in the x, y, and z directions, respectively.
2.
Conservation of energy:
( ρ Τ ) t + ( ρ u T ) x + ( ρ v T ) y + ( ρ w T ) z = x λ C p T x + y λ C p T y + z λ C p T z + S T
where T represents the temperature (°C); λ represents the thermal conductivity of the fluid (W/(m·K)); Cp represents the specific heat capacity (J/(kg·°C)); and ST represents the heat generated by internal heat sources within the fluid and the conversion of fluid mechanical energy into thermal energy (W).
3.
Conservation of momentum:
( ρ u ) t + ( ρ u u ) x + ( ρ u v ) y + ( ρ u w ) z = p x + τ xx x + τ yx y + τ zx z + F x ( ρ v ) t + ( ρ v u ) x + ( ρ v v ) y + ( ρ v w ) z = p y + τ xy x + τ yy y + τ zy z + F y ( ρ w ) t + ( ρ w u ) x + ( ρ w v ) y + ( ρ w w ) z = p z + τ xz x + τ yz y + τ zz z + F z
where p represents the pressure on the fluid element; τxx, τxy, and τxz represent the viscous stress components on the surface of the fluid element in the x, y, and z directions, respectively; and Fx, Fy, and Fz represent the body force components acting on the fluid element in the x, y, and z directions (n), respectively.
x λ x T x + y λ y T y + z λ z T z = q T n = 0 λ T n = α T T F
where T represents the temperatures of the generator’s respective components (°C); λx, λy, and λz represent the thermal conductivities of the materials of the solid components in the x, y, and z directions (W/(m·K)); q represents the heat source density within the solid components of the generator (W/m3); α represents the heat transfer coefficient of the cooling surfaces of the solid components (W/(m2·K)); and TF represents the temperature of the fluid surrounding the cooling surfaces of the solid components of the generator (°C).
Due to the conservation of energy, the heat entering the controlled object from the inside and outside at the same moment is equal to the heat input from the external heat source to the system. The work done by the system on the external environment is equal to the work done by the fluid within the controlled object. The heat input from the external heat source to the system is equal to the energy difference between the inlet and outlet over a unit of time. For the ventilation system within the generator, by calculating the energy difference between the inlet and outlet and considering the heat conducted through the fluid–solid contact surface, the work done by the fluid on the external environment can be determined, which is equivalent to the fluid friction loss [16,17].
W ¯ = e + v 2 2 + g z + p ρ in m ¯ i n e + v 2 2 + g z + p ρ out m ¯ out + Q
Q = k A Δ T
e + p ρ = C p T
z = ρ ξ 2 A 2
A = 10 6 π D L
where W ¯ represent the wind friction loss (W); m ¯ i n and m ¯ out represent the mass flow rates of the fluid flowing in and out per unit time, respectively; e denotes the internal energy of the fluid (W); p represents the pressure (Pa); ρ represents mass density of the fluid; gz denotes the gravitational potential energy per unit mass of the fluid; v 2 / 2 denotes the kinetic energy per unit mass of the fluid; Q is the heat energy by external sources per unit time; k represents the thermal conductivity between the fluid and the external heat source (W/(m2·°C)); A is the cross-sectional area perpendicular to the direction of heat flow(m2); ΔT represents the average temperature difference of the fluid (°C); z is the ventilation resistance (n·s2/m8); ξ is the local resistance coefficient; L is the width of the generator core ventilation duct (mm); and D is the outer diameter of the generator stator (mm).

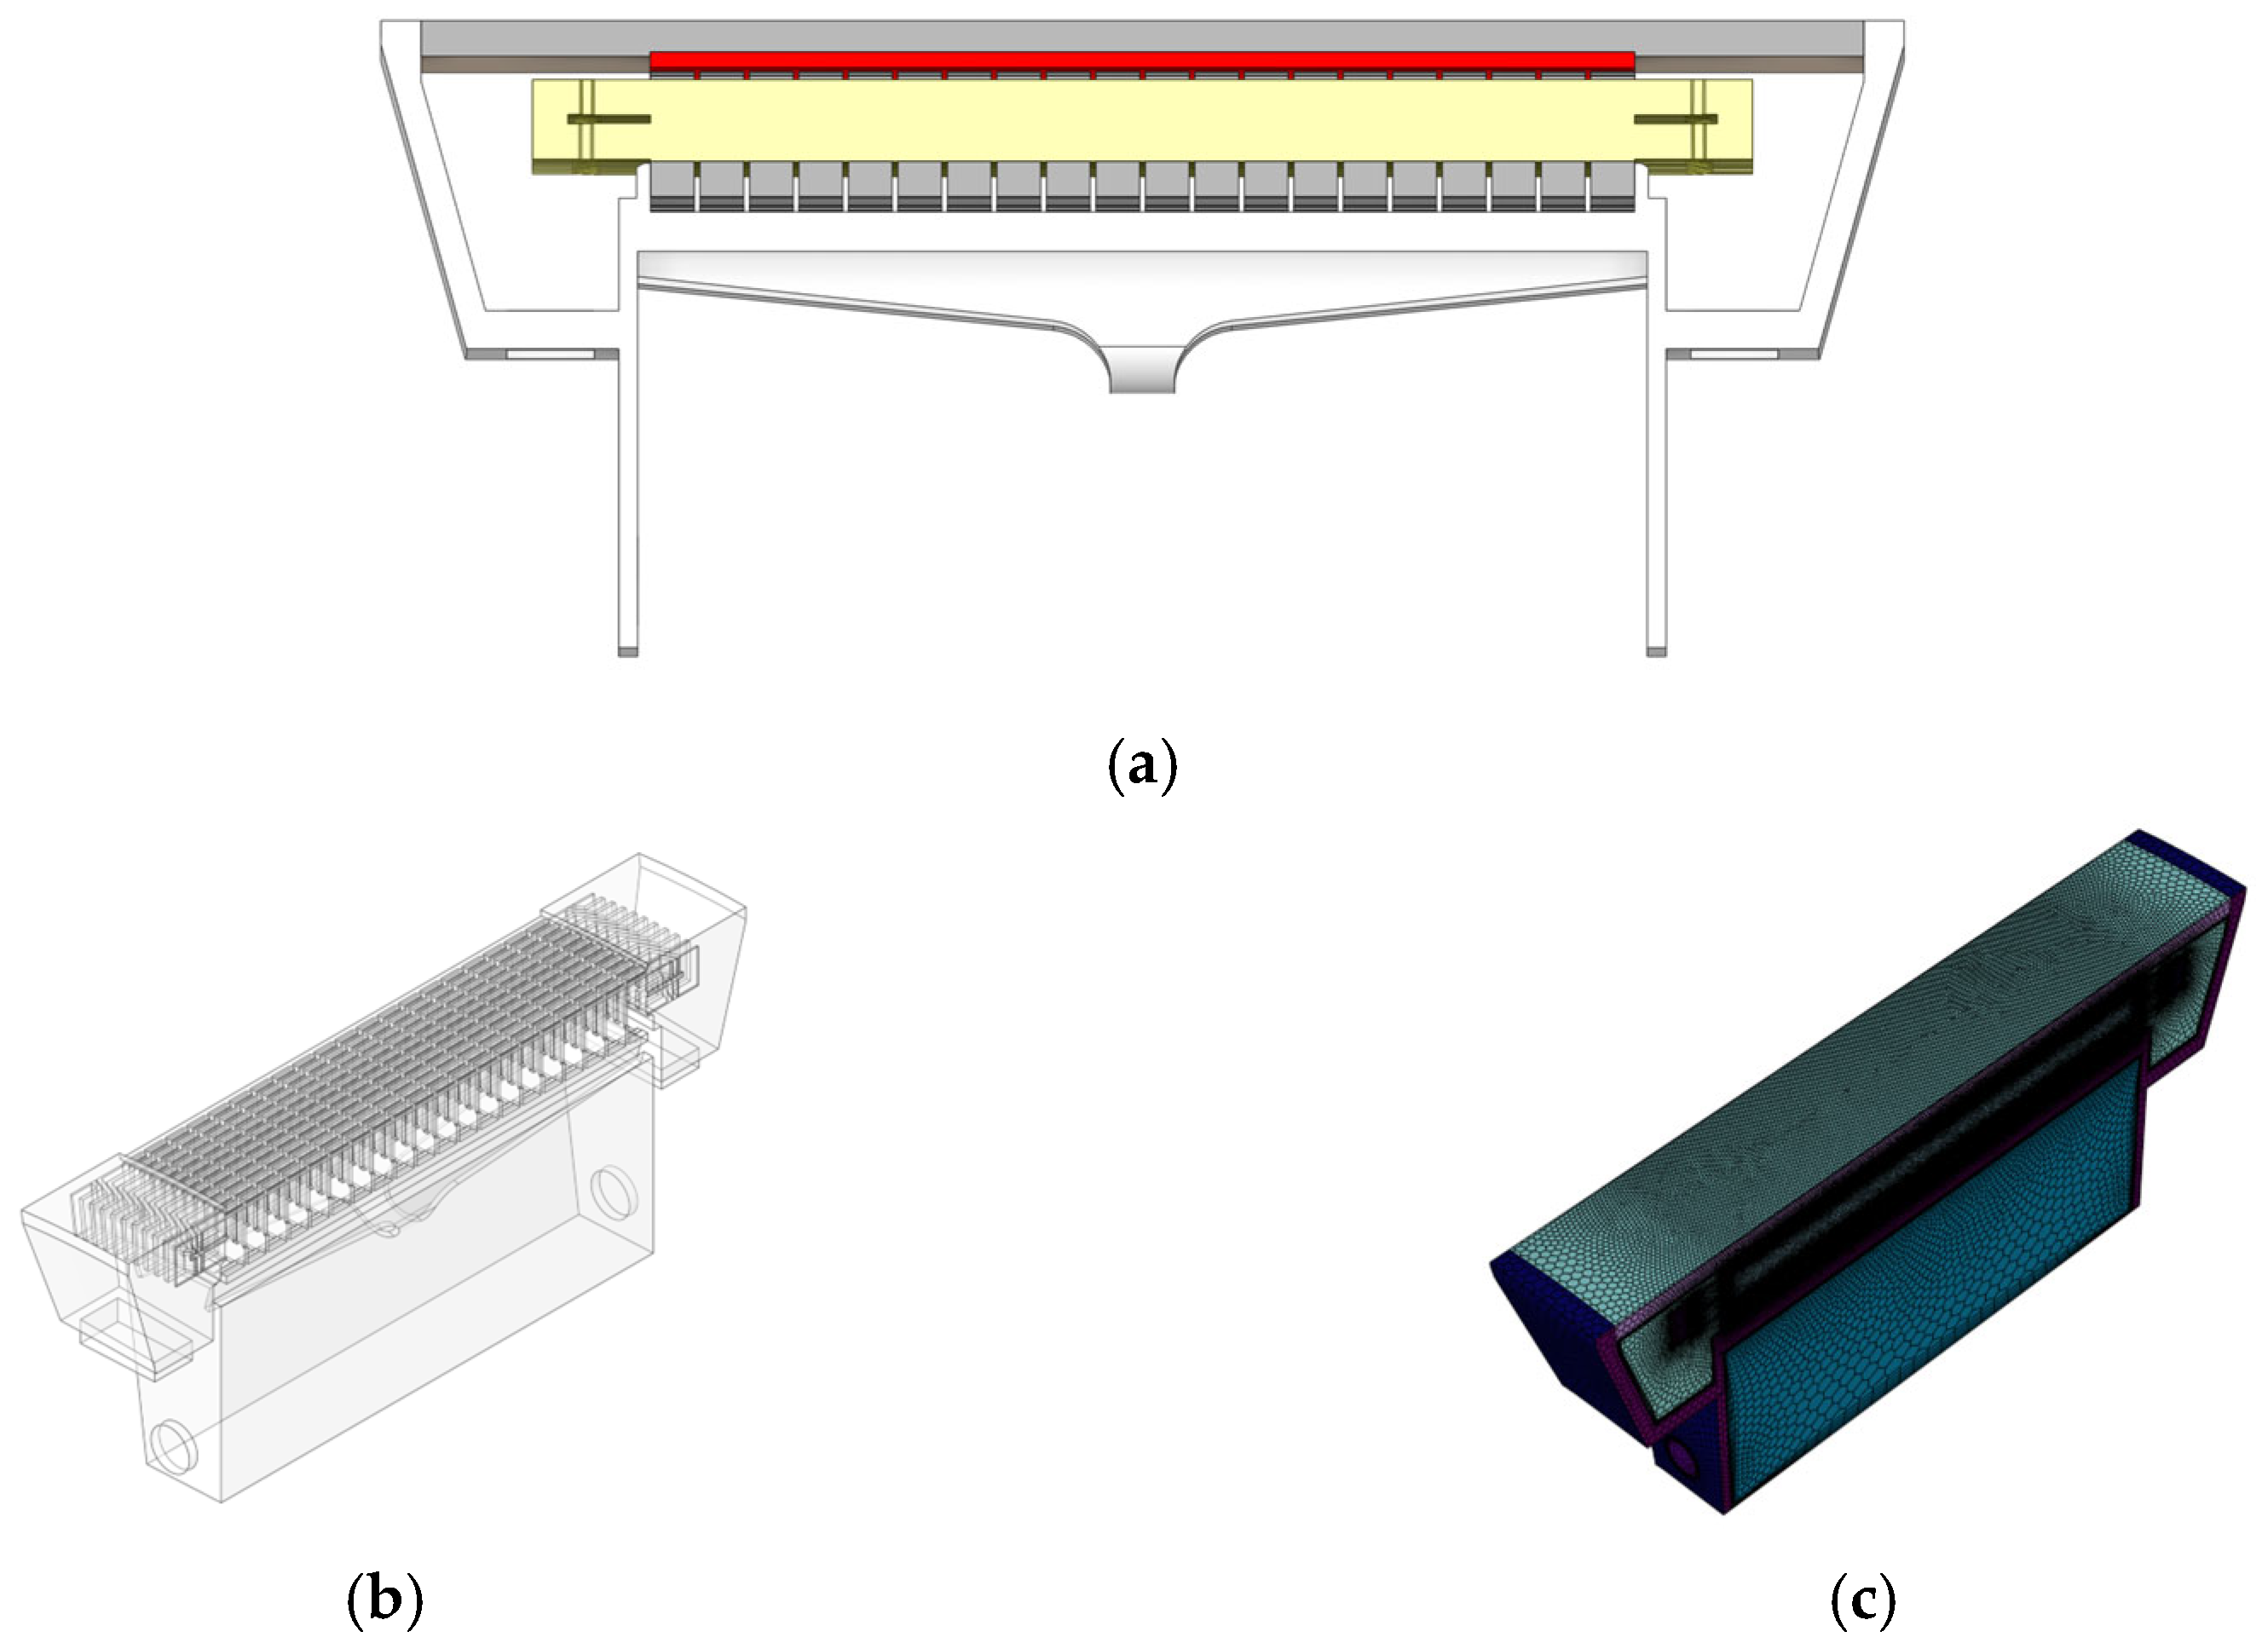
2.3. Assumptions and Boundary Condition Settings

DD-PMSG is a large-scale model, and simulating full-scale models is time-consuming. In order to improve the efficiency of computer simulation, the generator model is simplified by utilizing its circumferential symmetry. As shown in Table 2, the simplified and original models are compared in terms of simulation accuracy and computation time. The results showed that the simulation error was within 1.5%, but the computation time of the 1/48 scale model was reduced by 93.75%. Therefore, the 1/48-scale model is adopted as the simplified one. Figure 3a,b presents the 1/48-scale generator model.
In order to further discuss the sensitivity of results to mesh density and element types, this paper conducts the mesh convergence research on the model and investigates its rules. To ensure computational accuracy and adaptability to complex boundary conditions, the solution domain is meshed with hexahedral grids, maintaining a minimum orthogonal quality of 0.15, as Figure 3c mesh model. The sensitivity of results to mesh indicates that the maximum temperature of the generator increases with the increase of the mesh number, as shown in Figure 4. Once the grid count exceeds 9,734,550, the temperature change is very small (less than 1%). Thus, a grid count of at least 9,734,550 is selected for the analysis.
Based on heat transfer theory, the following assumptions are made for the solution model [16,17,18]:
  • The fluid motion is complex, with a high Reynolds number (Re > 2300). Therefore, the flow field in the generator is calculated using a turbulent flow model (SST-k-omega model);
  • Copper losses are uniformly distributed in the stator windings, while iron losses are uniformly distributed in the core;
  • Since the air flow velocity is much lower than the speed of sound, air is considered as an incompressible fluid;
  • The influence of gravity on fluid flow is neglected.
The boundary conditions of the model are set as follows:
  • Set the cooling air inlet as velocity inlet with an entrance velocity of 3 m/s, and the outlet as pressure outlet.
  • Due to the circumferential symmetry of the model, the axial surfaces on both sides are set as periodic boundaries.
  • The materials are specified as follows: the fluid is air, the stator is silicon steel, and the windings are copper.

3. Analysis of Fluid–Solid Coupled Heat Transfer on Different Radial Ventilation Ducts Structure

The structural configuration of radial ventilation ducts exerts a multifaceted influence on the thermal management characteristics of wind turbine generators. To enhance their operational efficiency and reliability, it is vital to explore how the ventilation ducts width affects internal airflow and temperature distribution, and conduct precise calculations based on fluid mechanics and heat transfer theory. Determining the optimal ventilation ducts width through comprehensive analysis and simulation can significantly improve heat dissipation, optimize temperature distribution, reduce hot-spot risks, and refine thermal management.

3.1. The Radial Ventilation Ducts Structure of the Stator Core

To enhance the heat dissipation efficiency of the wind turbine generator, this paper proposes a novel radial ventilation duct design for the stator core. Figure 5 shows a schematic diagram of the stator ventilation duct. Without increasing the volume or weight of the generator, the heat dissipation characteristics can be effectively improved by this cooling method. The radial ventilation ducts enhance the uniformity of air flow inside the generator, increasing the contact area between the air and various components of the generator, thereby improving the heat dissipation efficiency. The width of the ventilation ducts affects the airflow performance inside the generator. Therefore, when designing the ventilation ducts for the wind turbine generator core, it is necessary to comprehensively analyze the coupled numerical results of the fluid field and temperature field in the cooling system to determine the optimal width of the ventilation ducts.

3.2. Simulation Analysis of Fluid Field in the Internal Cooling System of a Generator

Through the investigation of fluid motion within the cooling structure of wind turbines, the heat dissipation capabilities of each component of the wind turbine generator can be inferred. This analysis can provide a theoretical basis and data support for the subsequent optimization of the ventilation ducts.

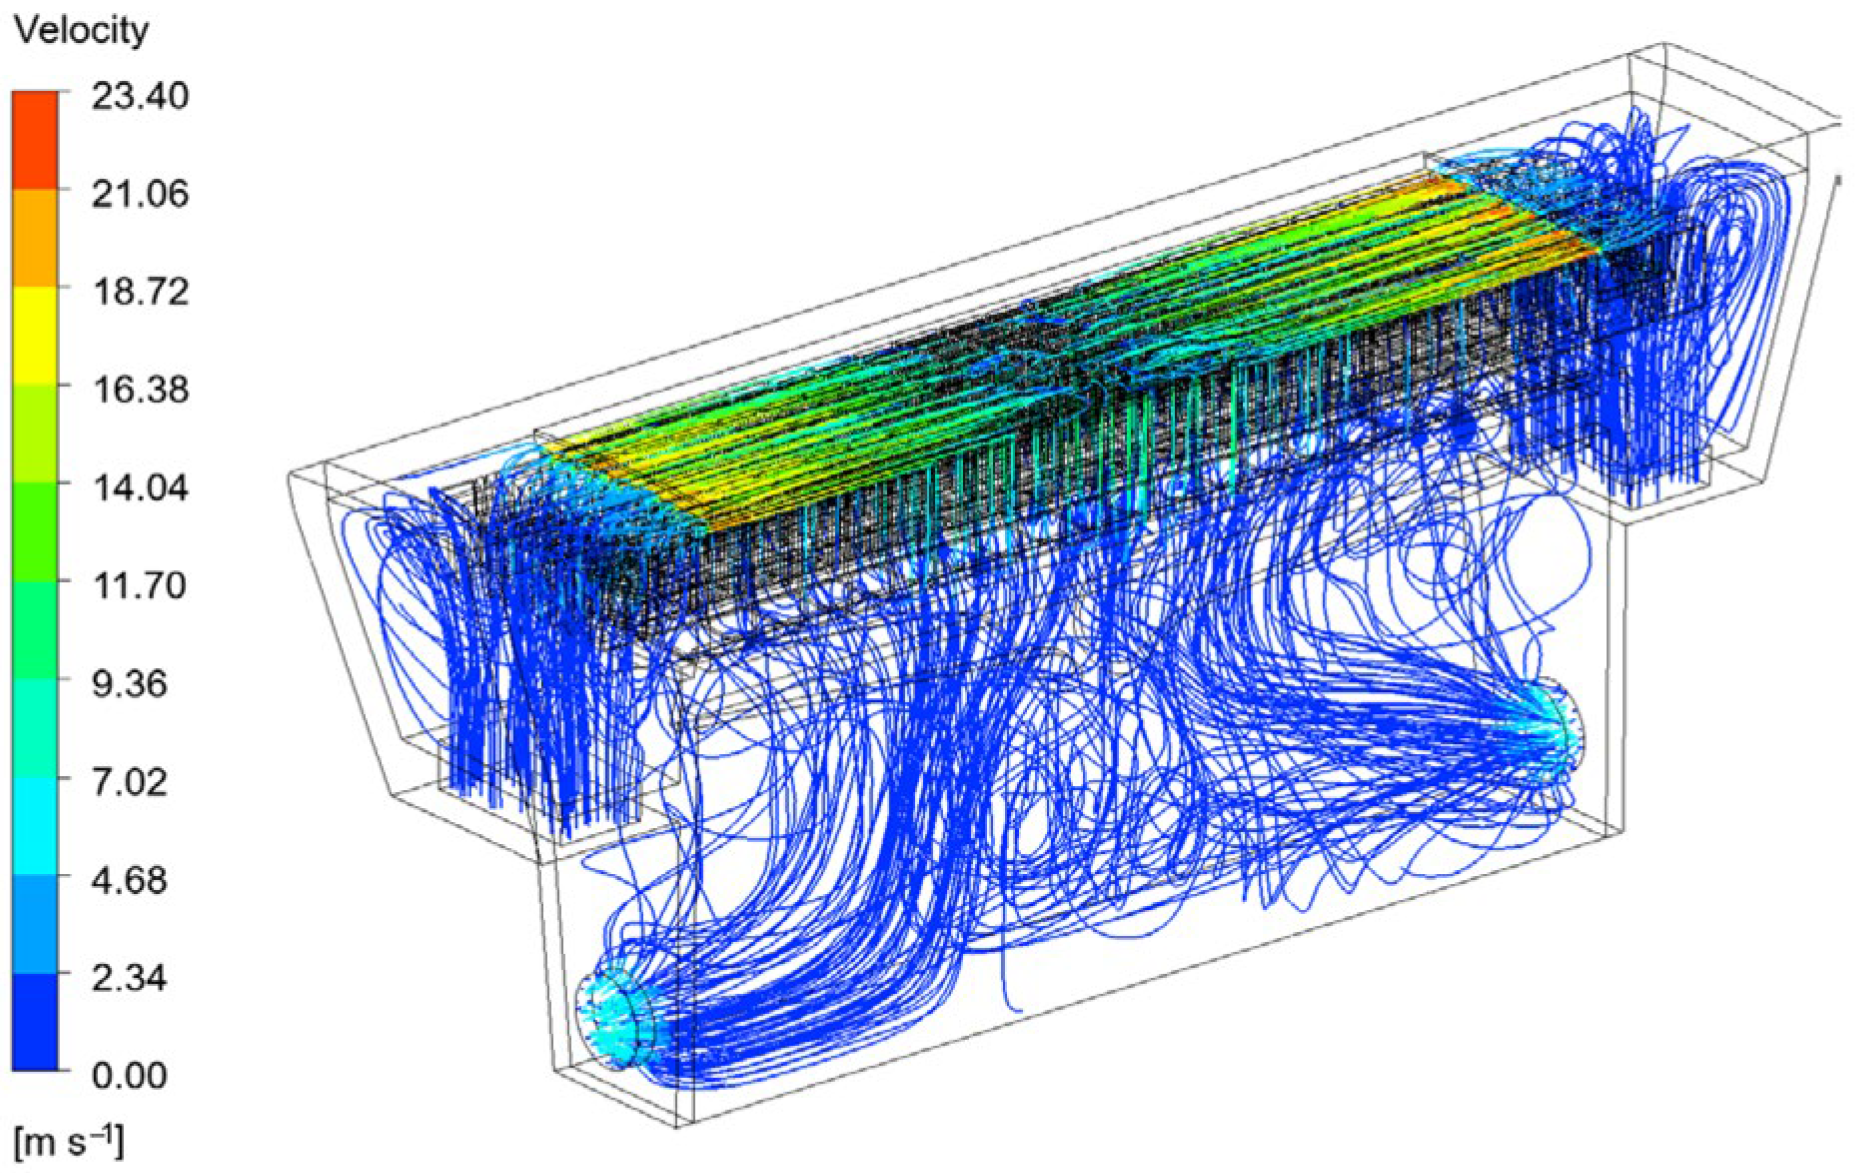
3.2.1. Fluid Field Analysis of the Model

By performing coupled solution of the temperature field and fluid field for the physical model, the CFD fluid field distribution within the solution domain is obtained. The velocity field of the internal cooling structure of the generator in this paper is shown in Figure 6.
As shown in Figure 6, air enters the generator from both axial sides and first flows through the end windings. In this region, the airflow is turbulent and relatively slow. Subsequently, the air passes through the air gap of the generator and into the ventilation ducts. Due to increased flow resistance, the air velocity distribution in the air gap is characterized by higher velocities at the sides and a lower velocity in the middle. Conversely, the air velocity in the ventilation ducts is higher in the middle and lower at the sides. This phenomenon occurs due to the convergence of cooling airflows from both sides in the central region of the air gap, which accelerates the airflow in the middle section of the ventilation ducts. Meanwhile, the opposing directions of the converging airflows cause some cancellation of velocity in the middle of the air gap, resulting in a lower velocity there.

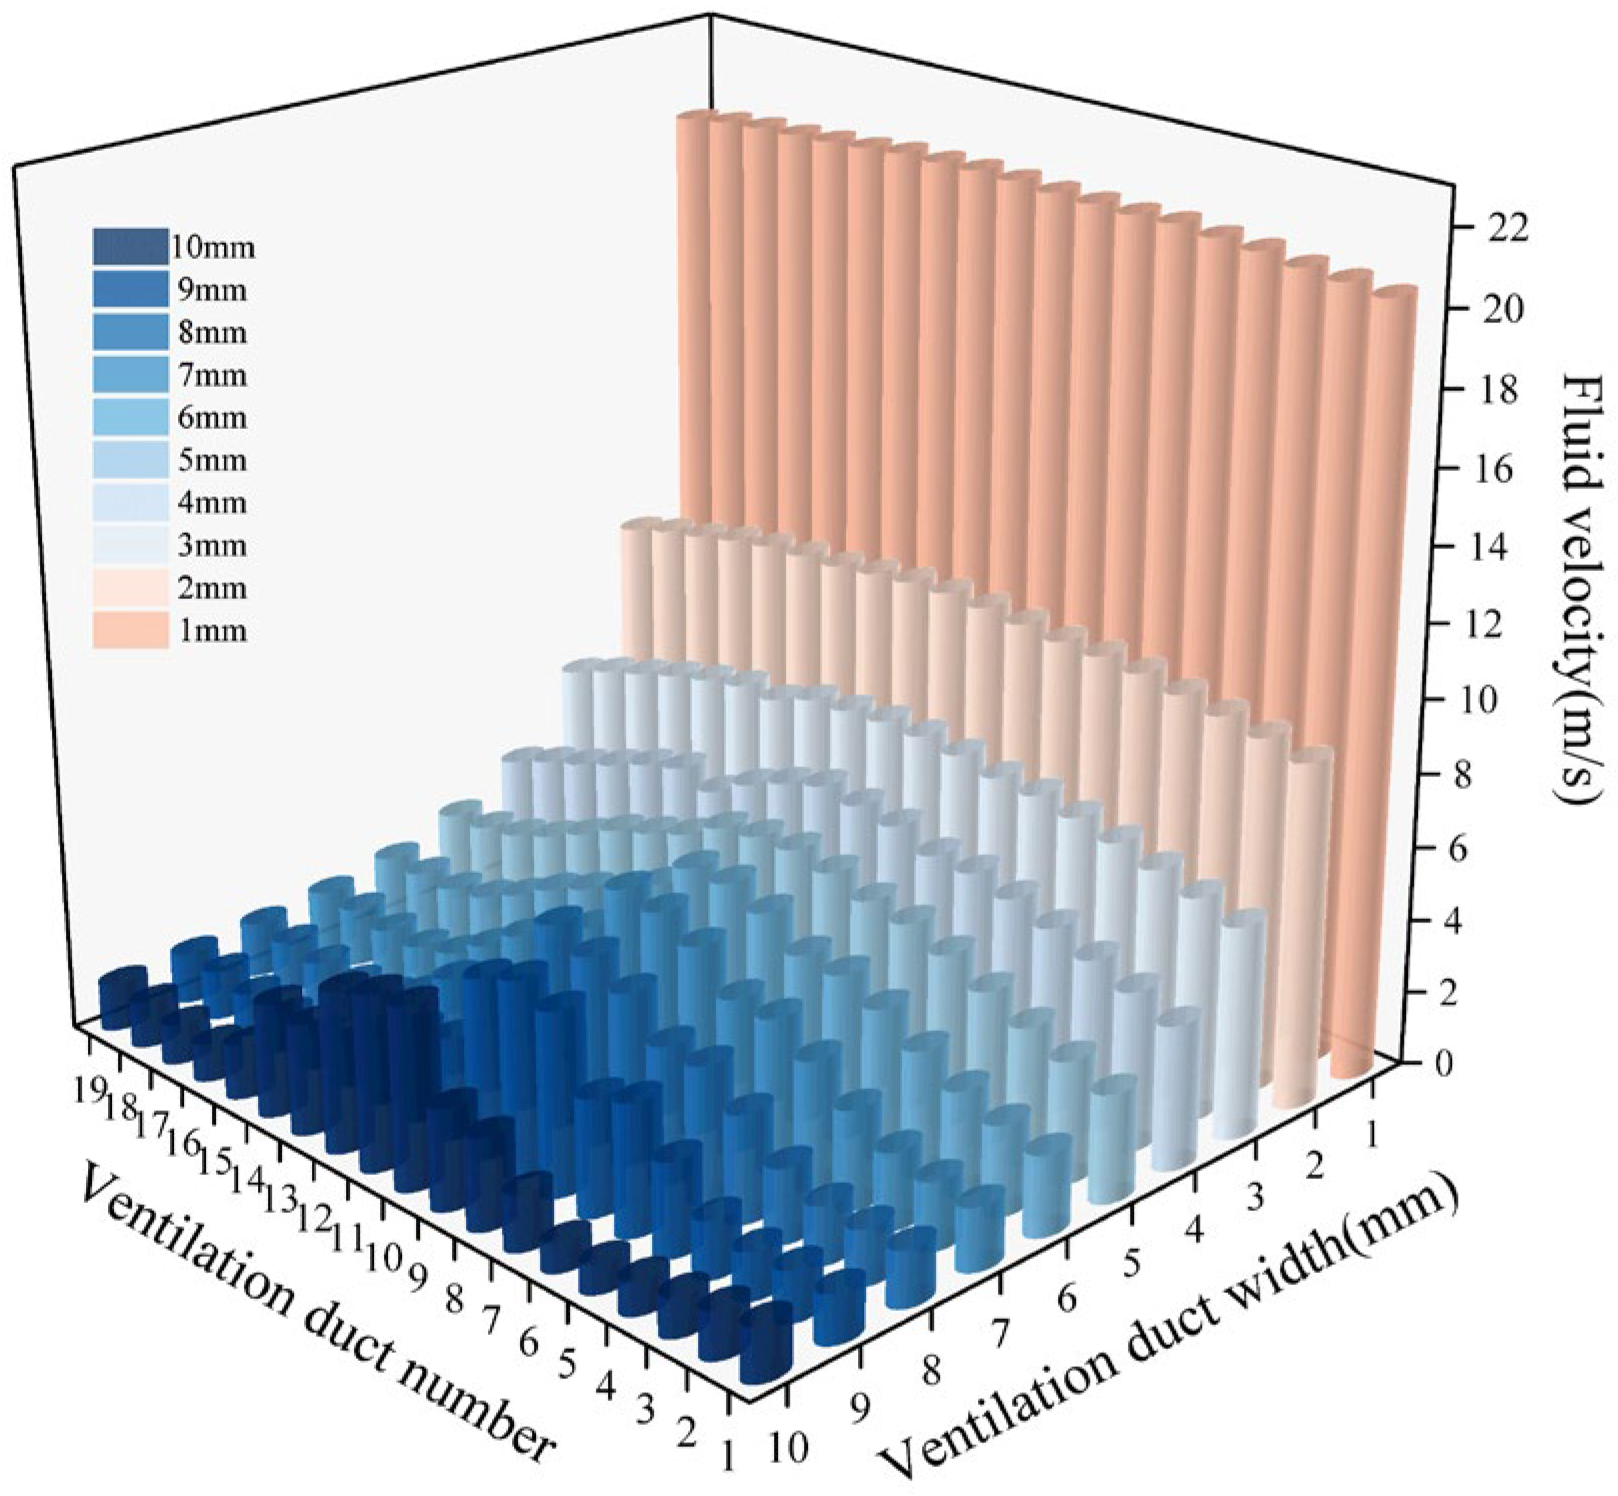
3.2.2. Numerical Study of the Fluid Field in Radial Ventilation Ducts with Different Widths

To investigate the impact of the radial ventilation ducts width, CFD finite element modeling is employed to perform numerical calculations on the wind turbine generator cooling system within the ventilation width range of [1–10 mm]. The results show the velocity and flow rate within 19 radial ventilation ducts of different widths, as illustrated in Figure 7 and Figure 8.
According to CFD fluid theory, convective heat transfer is closely related to fluid velocity. Therefore, analyzing the fluid flow within the radial ventilation ducts of the stator and rotor is crucial for optimizing the ventilation structure.
Based on the analysis of Figure 7 and Figure 8, the following conclusions are drawn:
(1)
The velocity of the airflow within the radial ventilation ducts increases as the width of the ducts decreases, with more significant increases observed for narrower ducts.
(2)
When the ventilation ducts width is larger, the velocity and flow rate distribution along the axial direction of the 19 ducts generally show lower values on the sides and higher values in the middle.
(3)
Although the cross-sectional area of the radial ventilation ducts decreases with the reduction in ducts width, the overall flow rate does not decrease. Instead, the distribution of the flow rate becomes more uniform.
According to theoretical Formulas (5)–(9), as the velocity increases, the wind friction loss also increases accordingly. The reduction of the ventilation ducts width increases the inlet velocity of the ducts, thereby increasing the overall wind friction loss. To investigate the impact of different ventilation ducts widths on wind friction loss, CFD simulation is used to obtain the distribution of wind friction loss, as shown in Figure 9.
As shown in Figure 9, when the ventilation duct width is 1 mm, the wind friction loss is 24 kW. As the width increases, the wind friction loss shows an exponential downward trend. When the width reaches 5 mm, the friction loss stabilizes at around 2 kW. When the width ranges from 5 mm to 10 mm, the friction loss remains almost unchanged. The average interpolation method is used to fit the FEM results, from which the relation between wind friction loss and ventilation duct width is derived:
W ¯ fr = 13 . 39 L 4 408.25 L 3 + 4556.51 L 2 22057.05 L + 40931.05
where W ¯ fr represent the wind friction loss of the generator (W) and L is the width of the generator core ventilation duct (mm); the value range of L is 1 to 10 mm.

3.3. Simulation Analysis of the Temperature Field in the Internal Cooling System of a Generator

3.3.1. Temperature Field Analysis of the Model

By performing coupled solutions of the temperature field and fluid field for the physical model, the CFD temperature field distribution within the solution domain is obtained, as shown in Figure 10. As shown in Figure 10, the maximum temperature point of the rotor within the generator is located in the stator, with the maximum temperature reaching 56.85 °C. As analyzed in Section 3.2, the non-uniform distribution of fluid velocity within the generator leads to different heat transfer efficiencies, which in turn affect the cooling capacity. Ultimately, this results in a temperature distribution in the generator that is higher on the sides and lower in the middle.

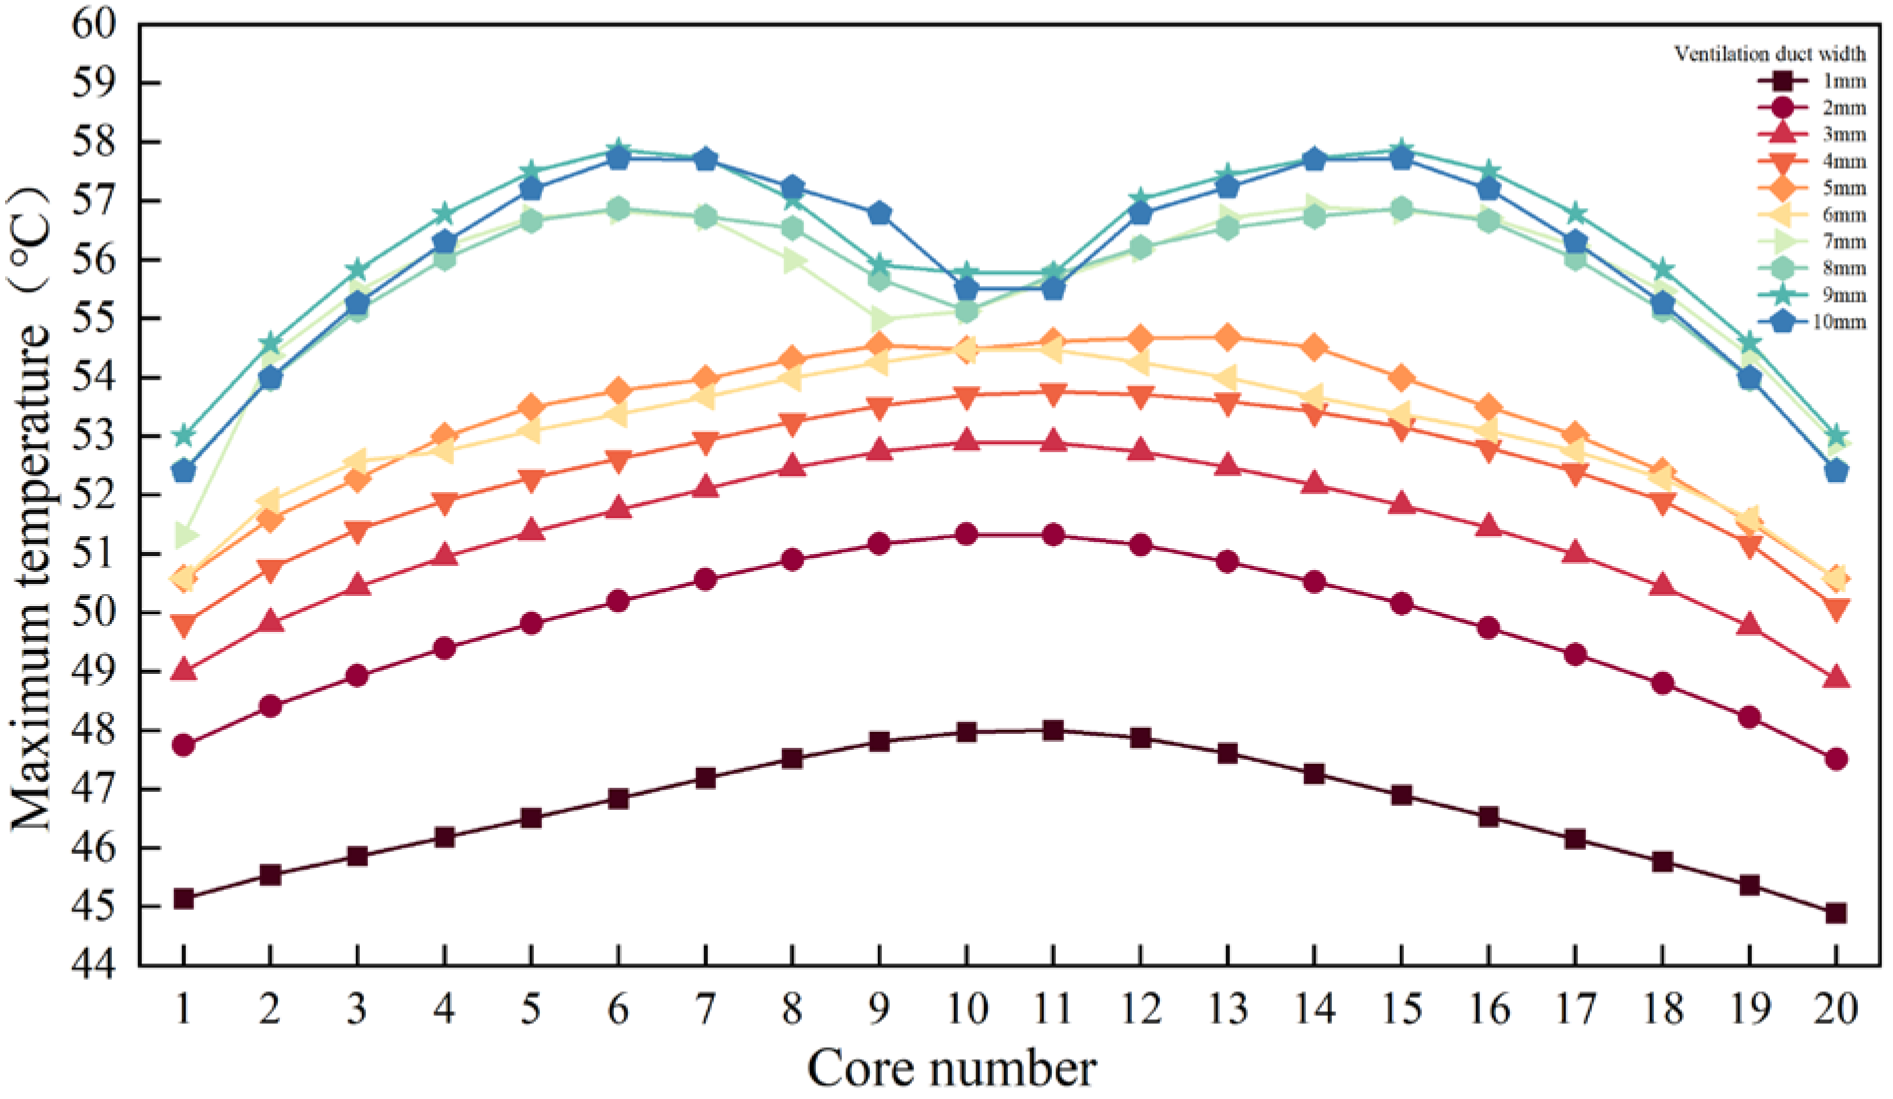
3.3.2. Numerical Influence of Temperature Field Under Different Widths of Radial Ventilation Ducts

To analyze the impact of ventilation ducts width on cooling performance, a coupled simulation method was employed to calculate the thermal results within the range of width [1–10 mm]. The calculation results are shown in Figure 11 and Figure 12. Figure 10 illustrates the maximum temperature distribution curves of the generator under different ventilation ducts widths. Figure 11 shows the corresponding temperature distribution curves of stator core under different ventilation ducts widths.
The flow velocity of the cooling gas inside the generator is closely linked to heat transfer efficiency. As shown in Section 2.1, with the increase in the width of the radial ventilation ducts, the flow velocity within the ducts gradually decreases, leading to a reduction in heat exchange efficiency. Consequently, the maximum internal temperature of the generator gradually rises with the widening of the ventilation ducts. To investigate the impact of the radial ventilation ducts width on the generator’s maximum internal temperature, the average interpolation method is employed to fit the results obtained from CFD simulation of Figure 11. The relationship equation between the maximum temperature of the generator and the width of the radial ventilation duct is derived as follows:
T max = 0.096 L 2 + 2 L + 47.24
where Tmax represents the maximum internal temperature of the generator (°C) and L is the width of the generator core ventilation duct (mm); the value range of L is 1 to 10 mm.
The following conclusions are drawn from the thermal analysis Figure 12:
(1)
When the width of the ventilation ducts exceeds 6 mm, lower airflow and velocity appear in the center of the half section, which reduces the heat dissipation capacity of the ducts. Therefore, the maximum temperatures in the stator occur at these locations (Core Segments 6 and 15), with a “hump shaped” distribution.
(2)
Conversely, when the ventilation ducts width is within 6 mm (including 6 mm), the air flow and velocity are evenly distributed across all ducts. Here, the heat dissipation of the ventilation ducts mainly depends on the length of the heat dissipation path. At this point, the temperature distribution in the stator is higher in the middle and lower at the winding ends.
By analyzing the variation trend of fluid–solid coupling field under different ventilation ducts widths, balancing the wind friction loss and maximum temperature of the generator, the optimal width of the stator ventilation ducts is chosen as 6 mm.

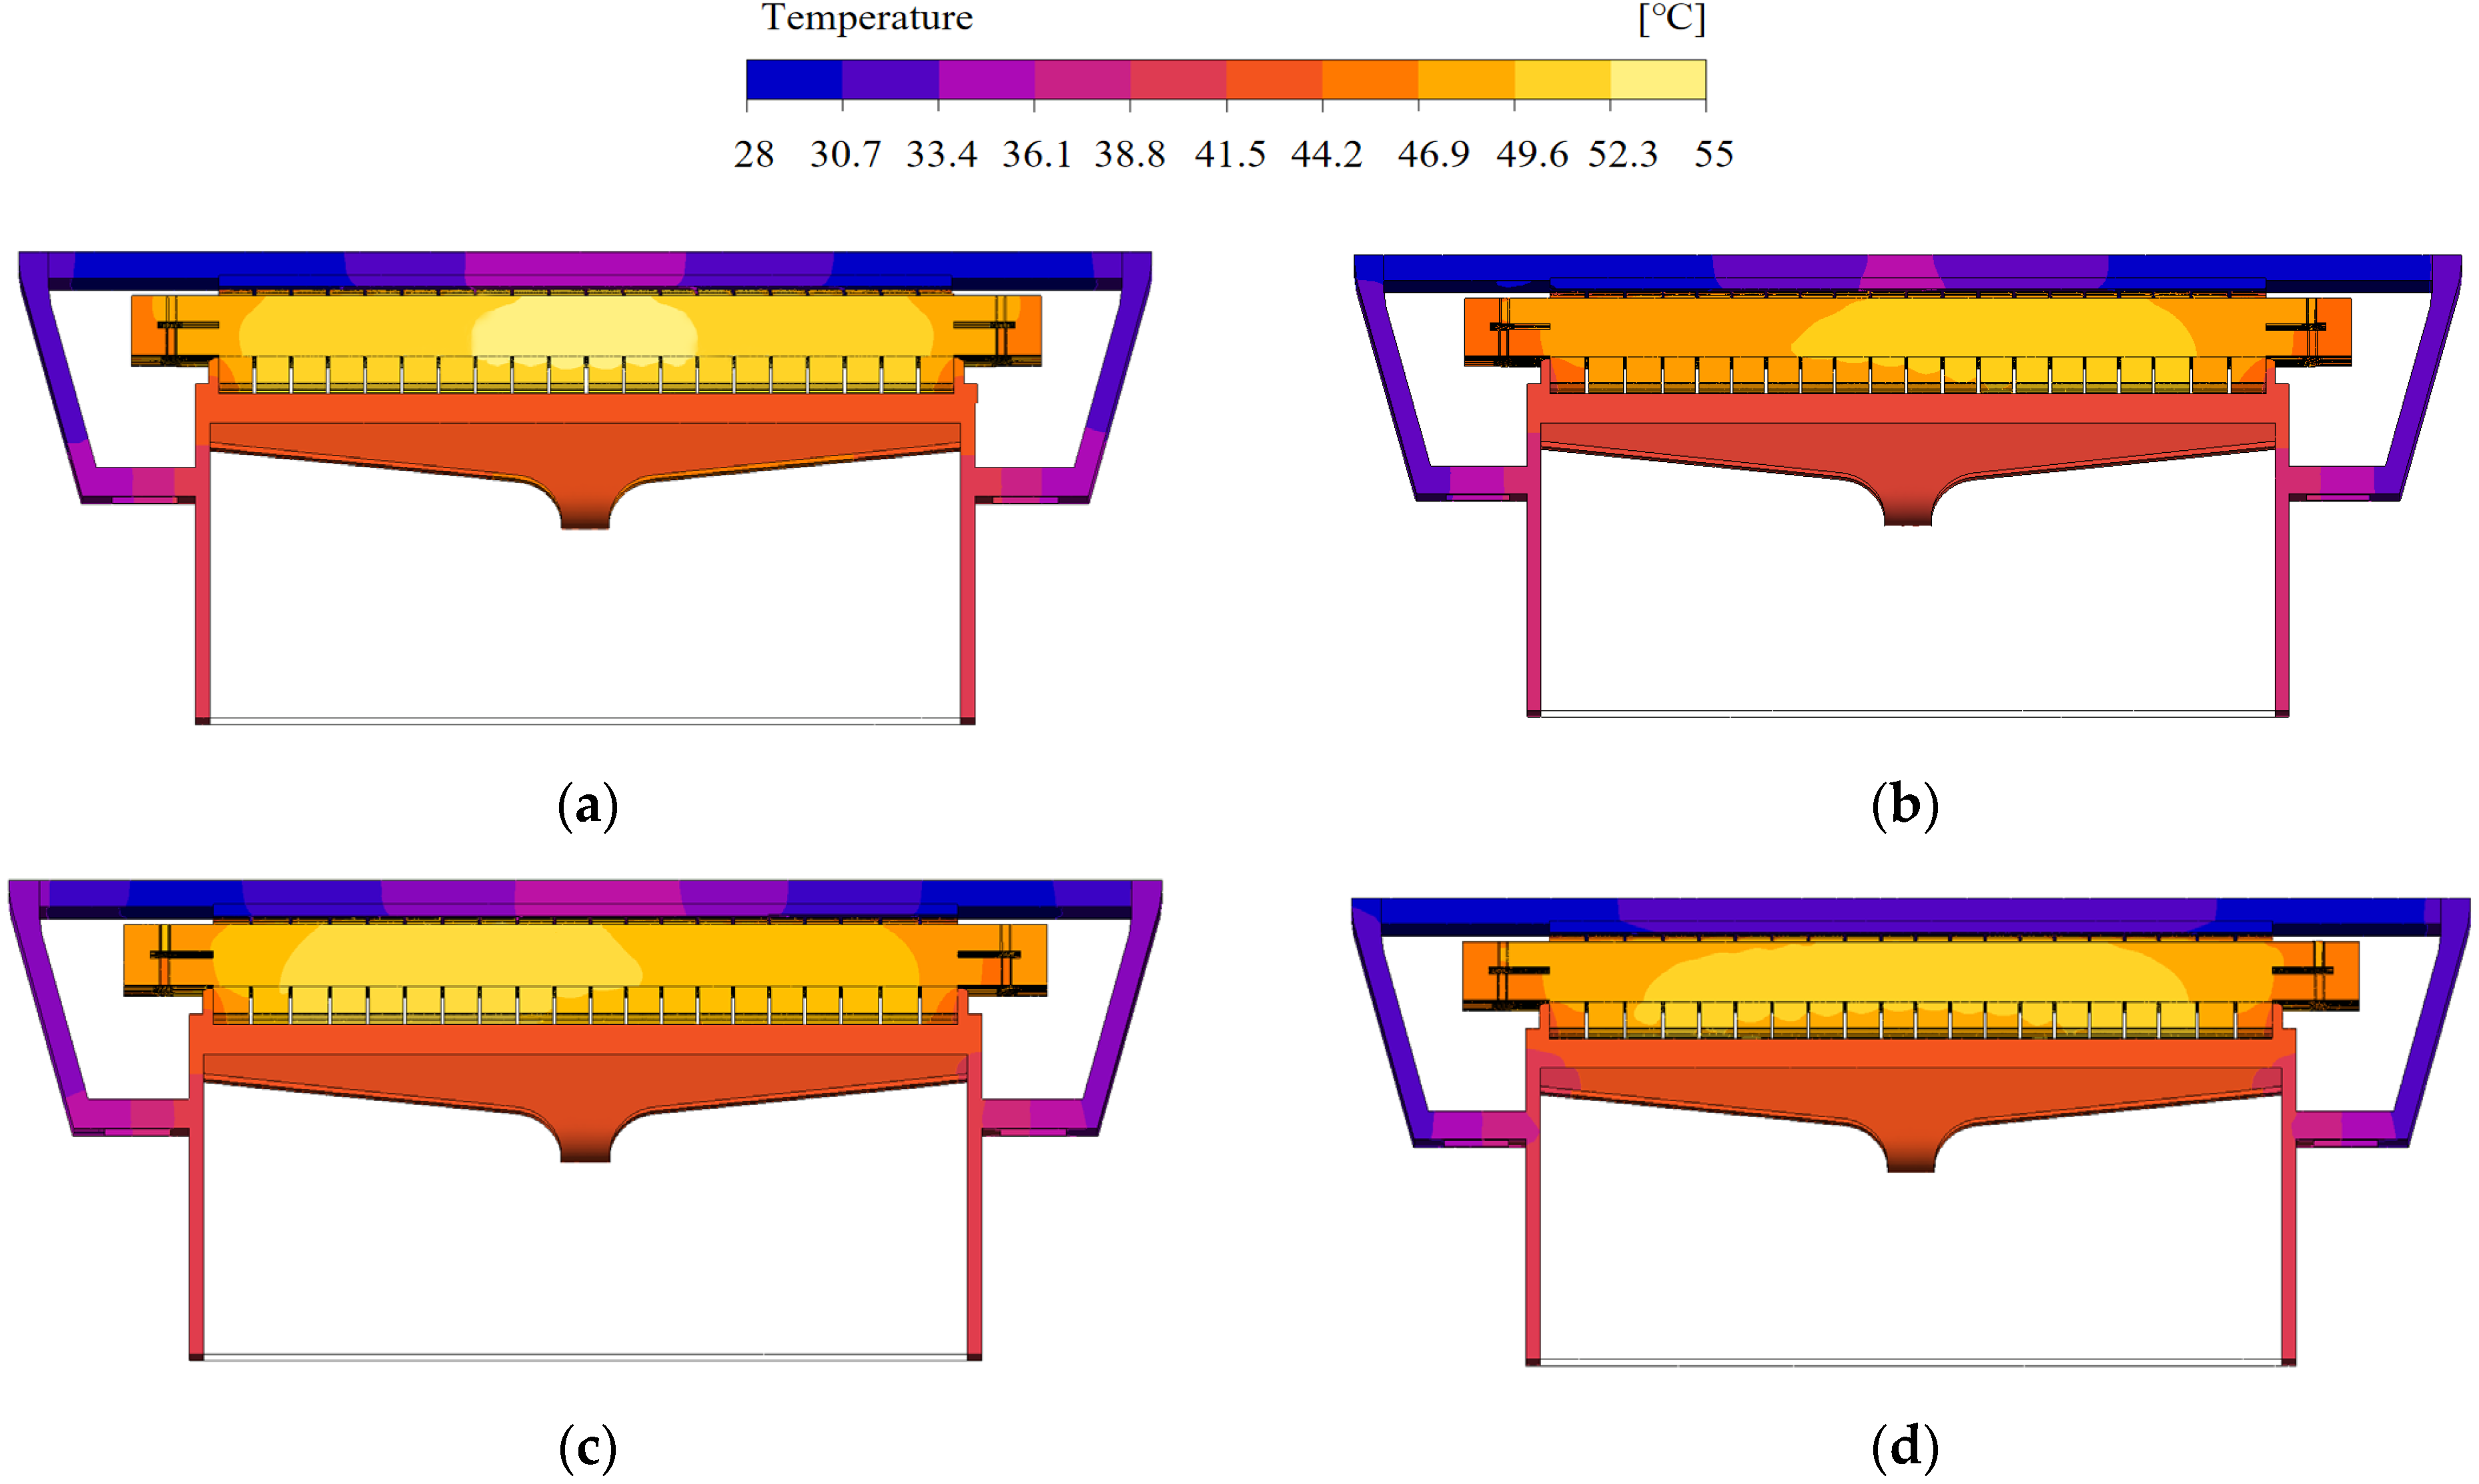
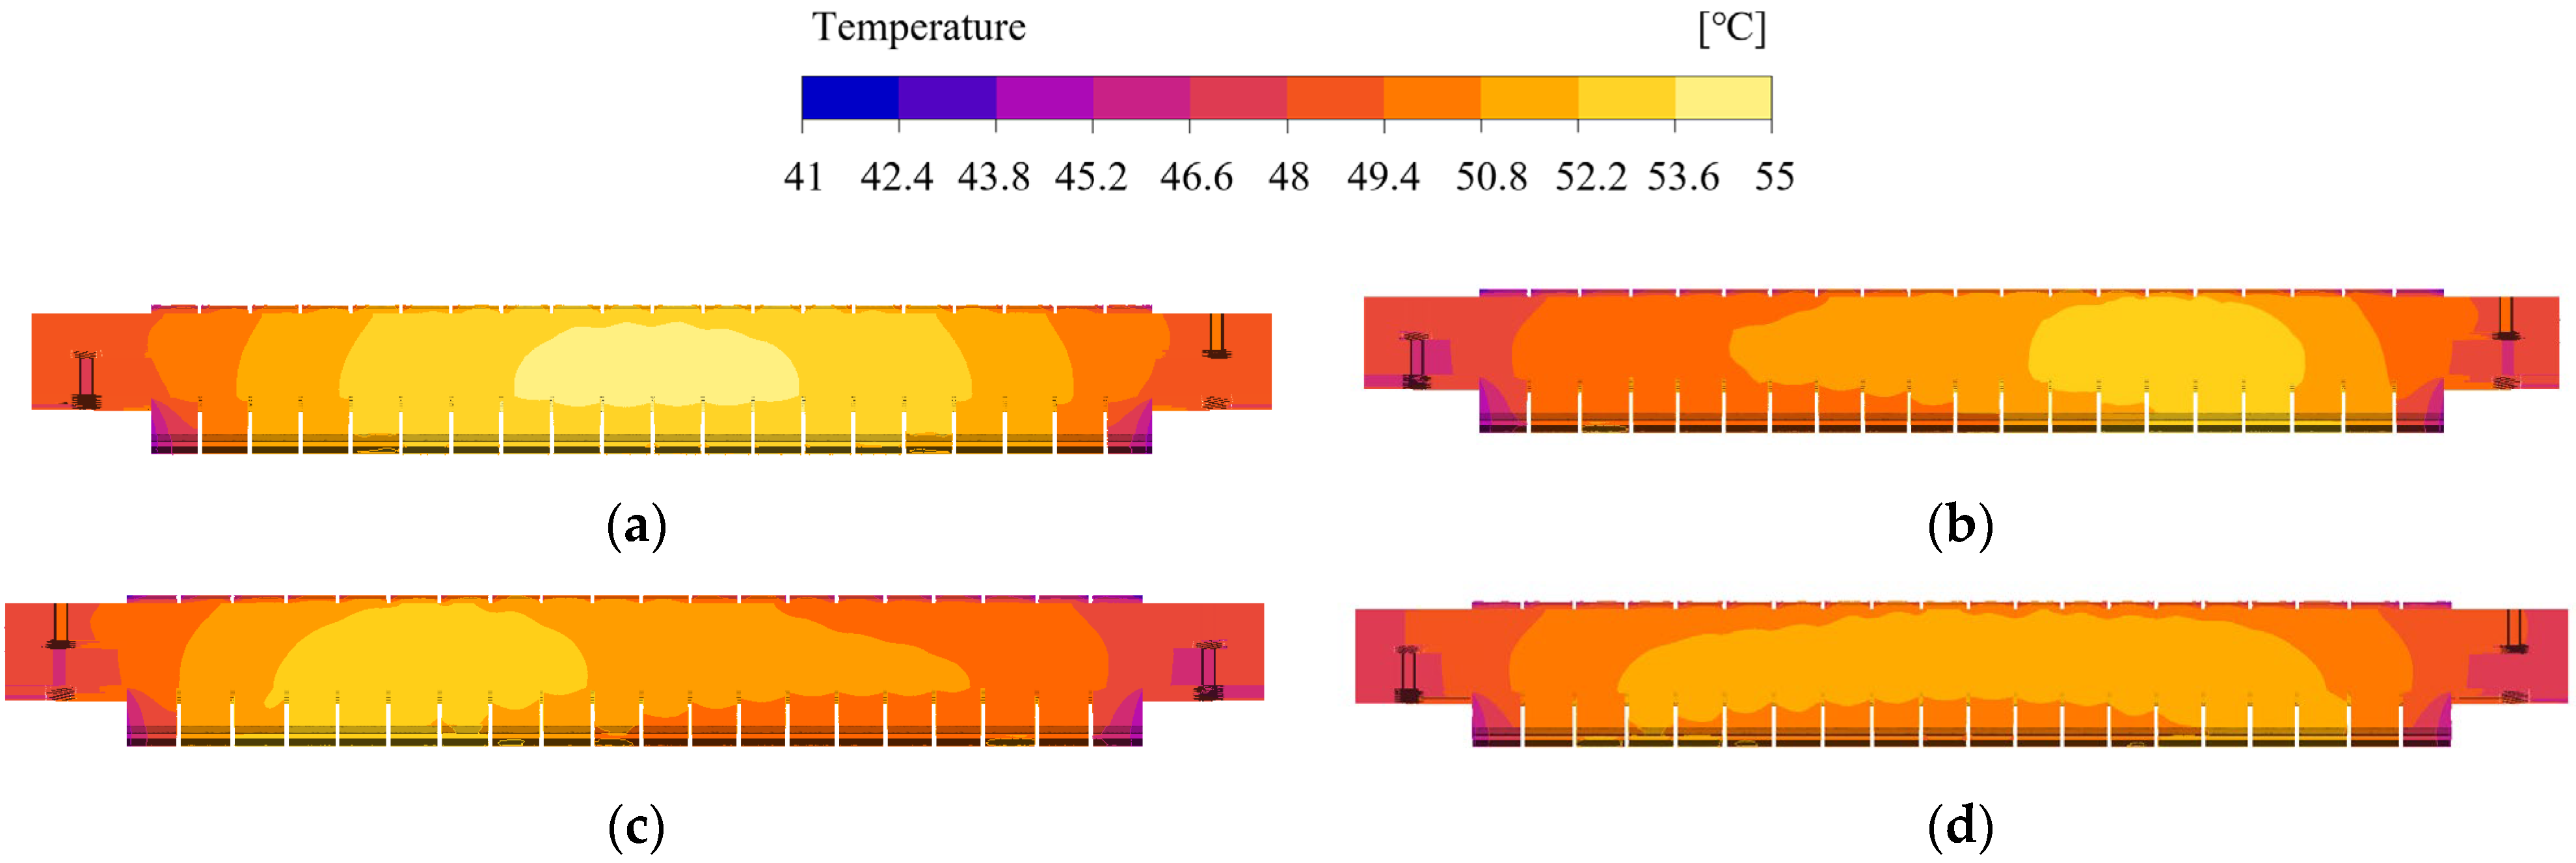
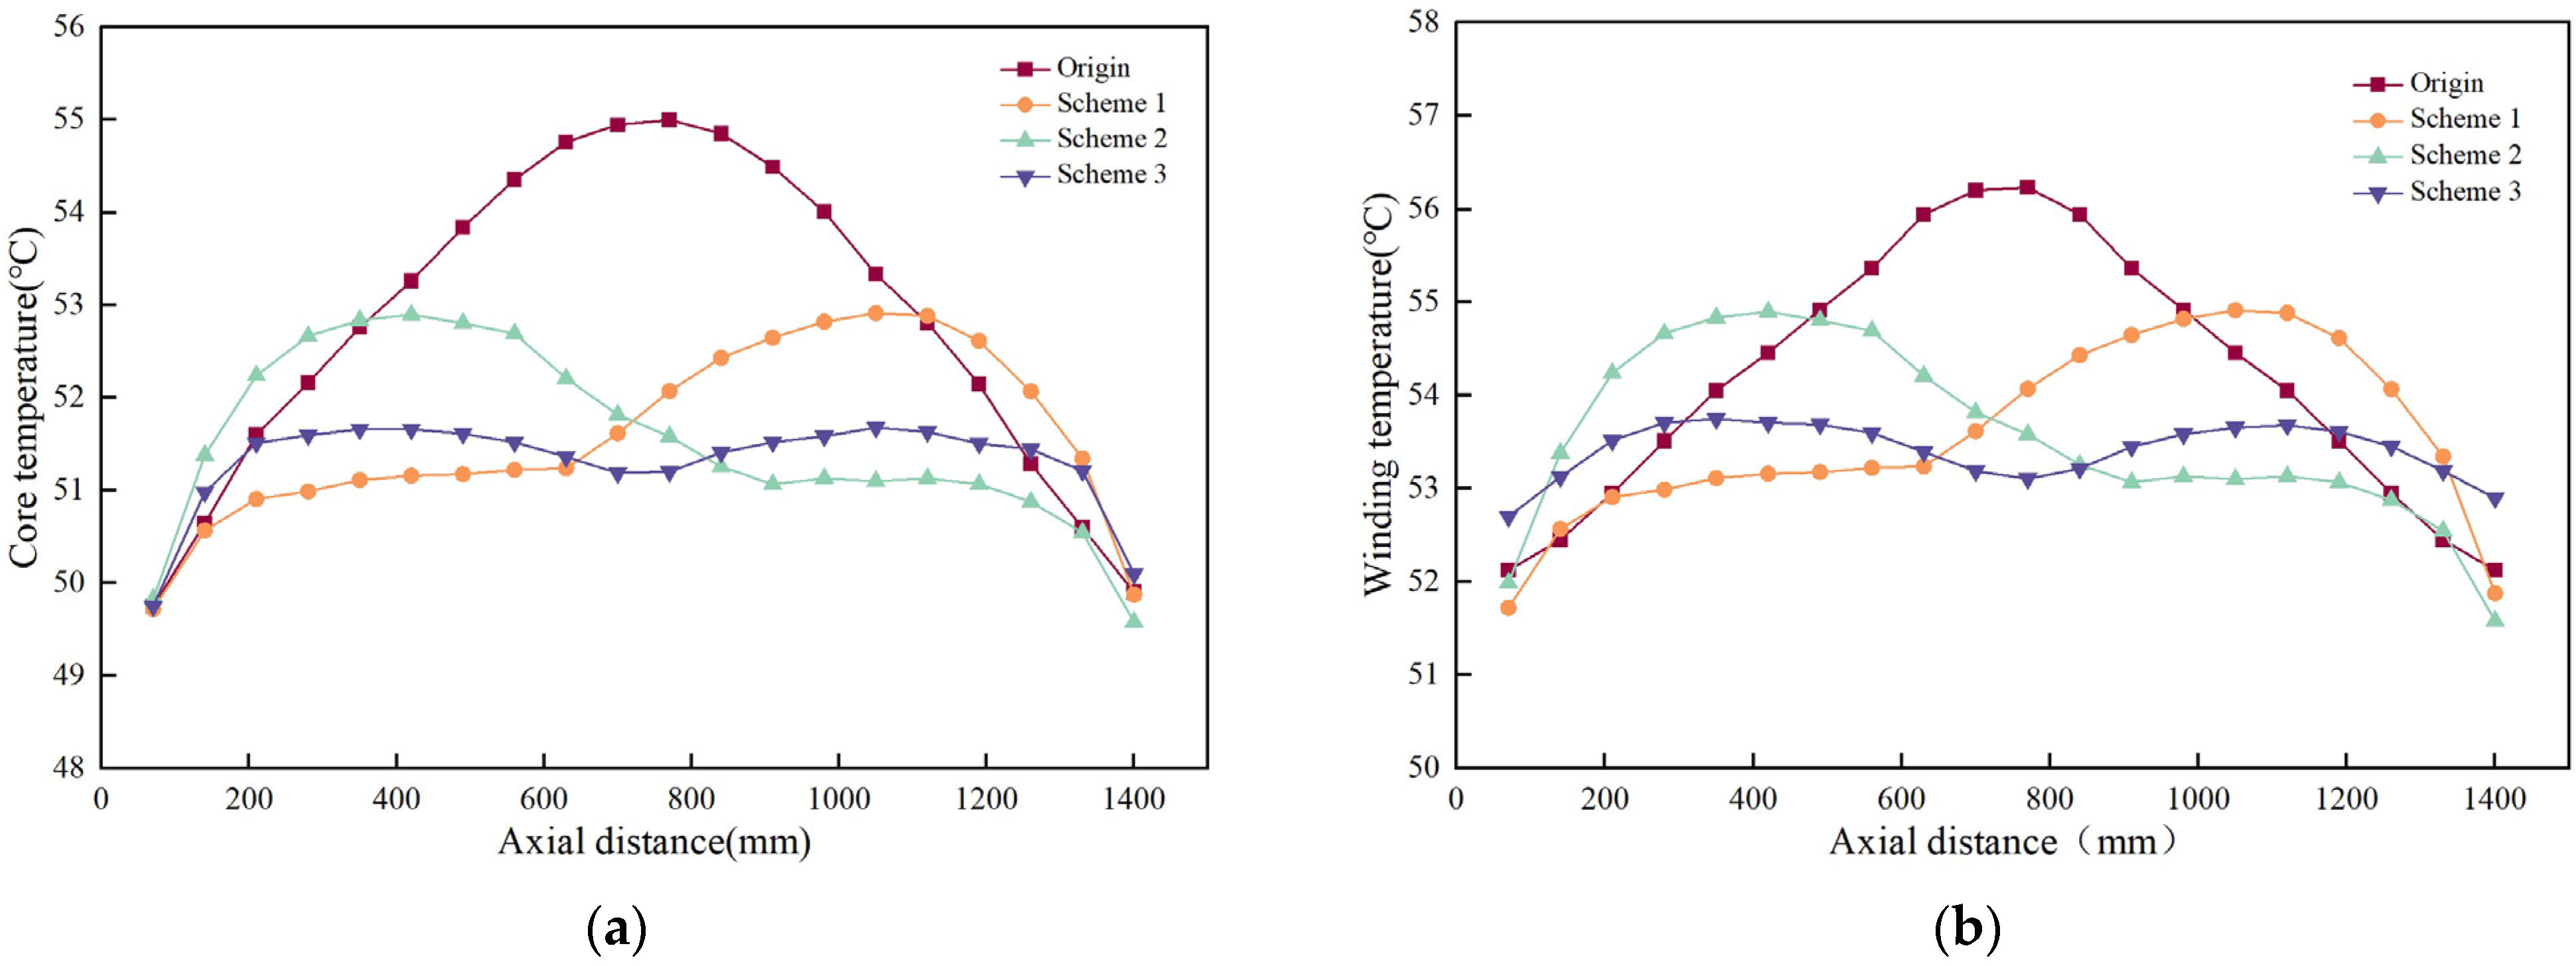
4. Ventilation Cooling Optimization Schemes with Non-Uniform Core Segments

The uneven distribution of flow velocity and flow rate in the ventilation ducts leads to inconsistent temperatures in various parts of the generator, resulting in the temperature gradient. Therefore, optimization schemes with non-uniform core segments are proposed in the paper to alter the temperature distribution trend, achieving better heat dissipation effects.

4.1. Optimized Design of Non-Uniform Core Segments

In the paper, CFD is used to simulate the thermal field of the generator with a radial ventilation ducts width of 6 mm, as shown in Figure 13. It indicates that the maximum temperature difference of the generator stator is 13.97 °C. The reason is there are differences in air velocity and temperature distribution along the cooling path. When the generator is operating, heat generation is concentrated in the stator winding area, causing its temperature to be higher than other parts, reaching the maximum temperature of 54.97 °C.
The areas with the highest temperatures inside the generator are mainly on the stator, and the temperature distribution within the stator is uneven. This paper optimizes the temperature distribution of the stator. The specific method is to perform non-uniformly treatment on the core, change the thickness of the core segments, and arrange and combine core segments of different thicknesses to explore the impact on the internal heating of the generator.
The total length of the stator core is 1382 mm, consisting of 20 core segments and 19 ventilation ducts. While keeping the ventilation ducts width of 6 mm constant, the 20 core segments are divided into three groups: Group A has six core segments with a width of 67.4 mm, Group B has six core segments with a width of 63.4 mm, and Group C has eight core segments with a width of 60.4 mm. The six thickest core segments in Group A are fixed on both sides, while the positions of the eight thinnest core segments in Group C are changed, placing them on the left side, right side, and in the middle, respectively. Three optimized schemes are proposed and compared with the original scheme where the core segments have a uniform ventilation ducts width of 6 mm. The distribution schemes of the non-uniform core segments are shown in Table 3.

4.2. CFD Simulation Analysis

Based on Table 2, the solution models for the above three schemes are established. The CFD finite element method is used to solve and calculate the fluid–thermal coupling model, as Figure 13 and Figure 14. The original design and three optimization schemes are further analyzed. By comparing the finite element results of different schemes, the performance of each scheme is evaluated, and the optimal scheme is selected from them.
Figure 14 and Figure 15 show the temperature distributions of the generator’s stator and whole structure, respectively, under different non-uniform core segment arrangements. After changing the arrangement, the stator side temperature changes significantly. The three schemes feature a marked drop in the highest temperature and a more even heat distribution, especially in Scheme 3.
By observing the temperature distribution of the stator core, it is evident that the size of the core has an impact on the temperature of the stator core, as shown as Figure 16. Figure 16 compares the axial temperature distribution curves of the windings and core for the three optimized schemes versus the original scheme. In the original design, the stator core’s temperature is lower on both ends and higher in the middle, with the peak temperature occurring between Core Segments 8 and 12. In Scheme 1 and Scheme 2, the thinner C-group core segments are placed on the left and right sides respectively. In Scheme 1, the maximum temperature appears on the right side of the stator, while in Scheme 2, it appears on the left side. The maximum temperature in Scheme 1 is 52.79 °C, a decrease of 2.18 °C (about 3.97%) compared to the original one. In Scheme 2, the maximum temperature is 52.81 °C, a decrease of 2.15 °C (about 3.91%). Although both schemes lower the overall temperature, the temperature difference on both sides of the core remains significant. In Scheme 3, placing the C-group core segments in the center position significantly reduces the temperature peak. The maximum temperature is 51.56 °C, a decrease of 3.41 °C (about 6.4%) compared to the original one. This arrangement also makes the temperature distribution more uniform, proving effective in suppressing the temperature peak.
For the winding, the axial temperature distribution is similar to that of the core segments, but the overall temperature of the winding is higher than that of the core. Scheme 1 and Scheme 2 can respectively reduce the temperature on the left and right sides, while Scheme 3 can balance the disadvantage of the middle section in heat dissipation capacity, reducing the temperature gradient, and thereby mitigating the potential risks to generator operation caused by thermal stress. Considering all factors, Scheme 3 was chosen as the final optimized scheme.

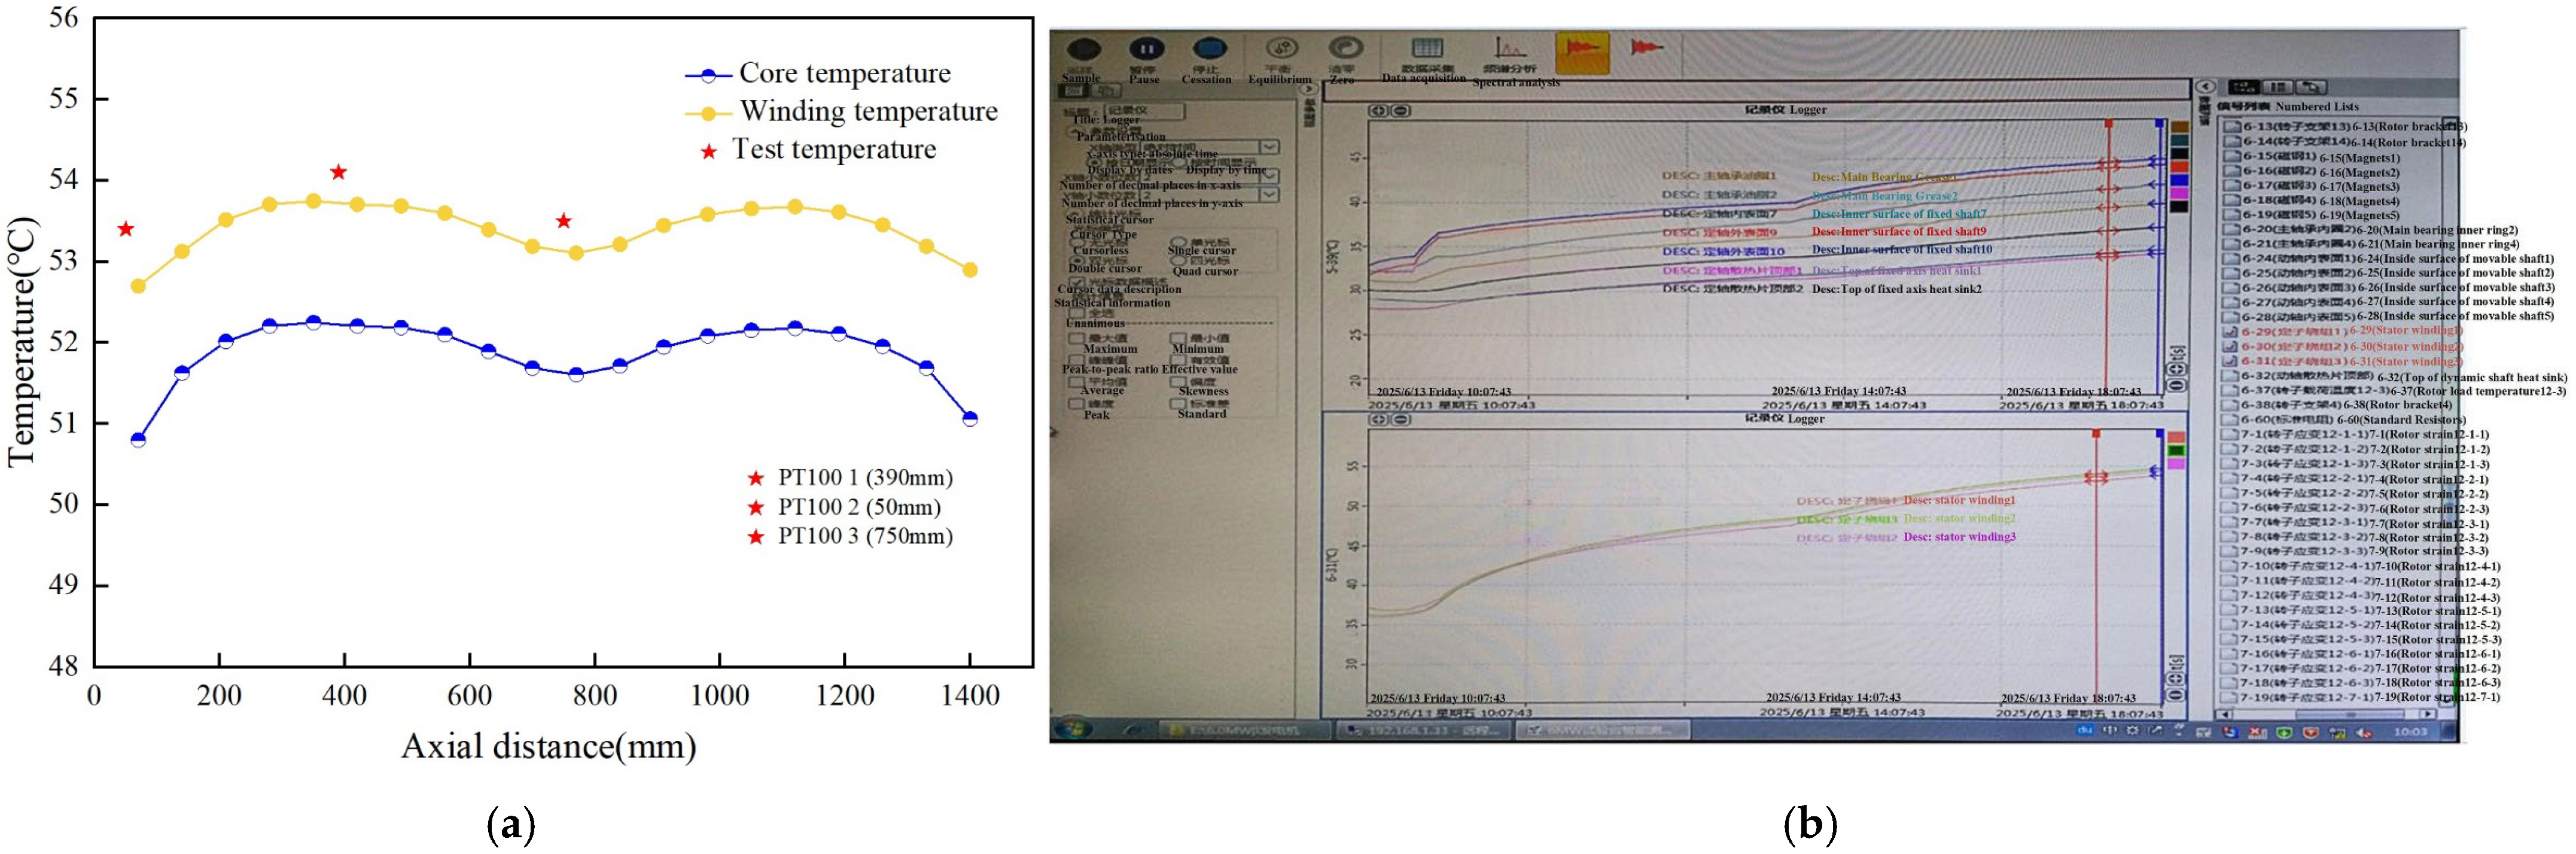
5. Experimental Verification

Based on the DD-PSMG model, a coupled simulation of fluid field and temperature field was conducted, revealing the distribution laws of internal fluid motion and temperature field in the generator, which provides a theoretical reference for the safe operation of wind turbine generator sets.
To verify the reliability of the simulation results, a prototype was made for the optimal solution of 4.5 MW, and temperature rise experiments were conducted at a rated load. The experimental environment was consistent with the actual operating environment of the generator, with the ambient temperature maintained at 25 °C. Figure 17 illustrates the temperature measurement experimental platform and the specific installation positions of temperature-sensors (PT100) elements in the generator. Three PT100 temperature sensors were respectively arranged at the winding end, winding slot between the 5th and 6th cores, and winding slot between the 10th and 11th cores, to measure the temperature at different positions of the winding. The accuracy of the simulation calculation and the rationality of the optimization method in this paper was verified.
Figure 18 displays the comparison results between the simulated winding temperature distribution data (Scheme 3) and the actual steady-state measurements of three PT100. The temperature values of the experimental test points were in good agreement with the simulation results, with a maximum error of 1.5%. In Figure 18, the simulation results of winding temperature and iron core temperature are displayed simultaneously, indirectly verifying the accuracy of the iron core simulation results. Therefore, it has been verified that the optimization design described in this article is reasonable, and the simulation results are accurate.

6. Conclusions

This study focuses on the air-cooled structure design of a 4.5 MW DD-PMSG for wind power generation, employing CFD and fluid–thermal coupling analysis to optimize the cooling system. The outcomes are summarized as follows:
  • With the stator core’s effective length constant, reducing the ventilation ducts width increases the fluid velocity inside the ducts and equalizes the flow distribution.
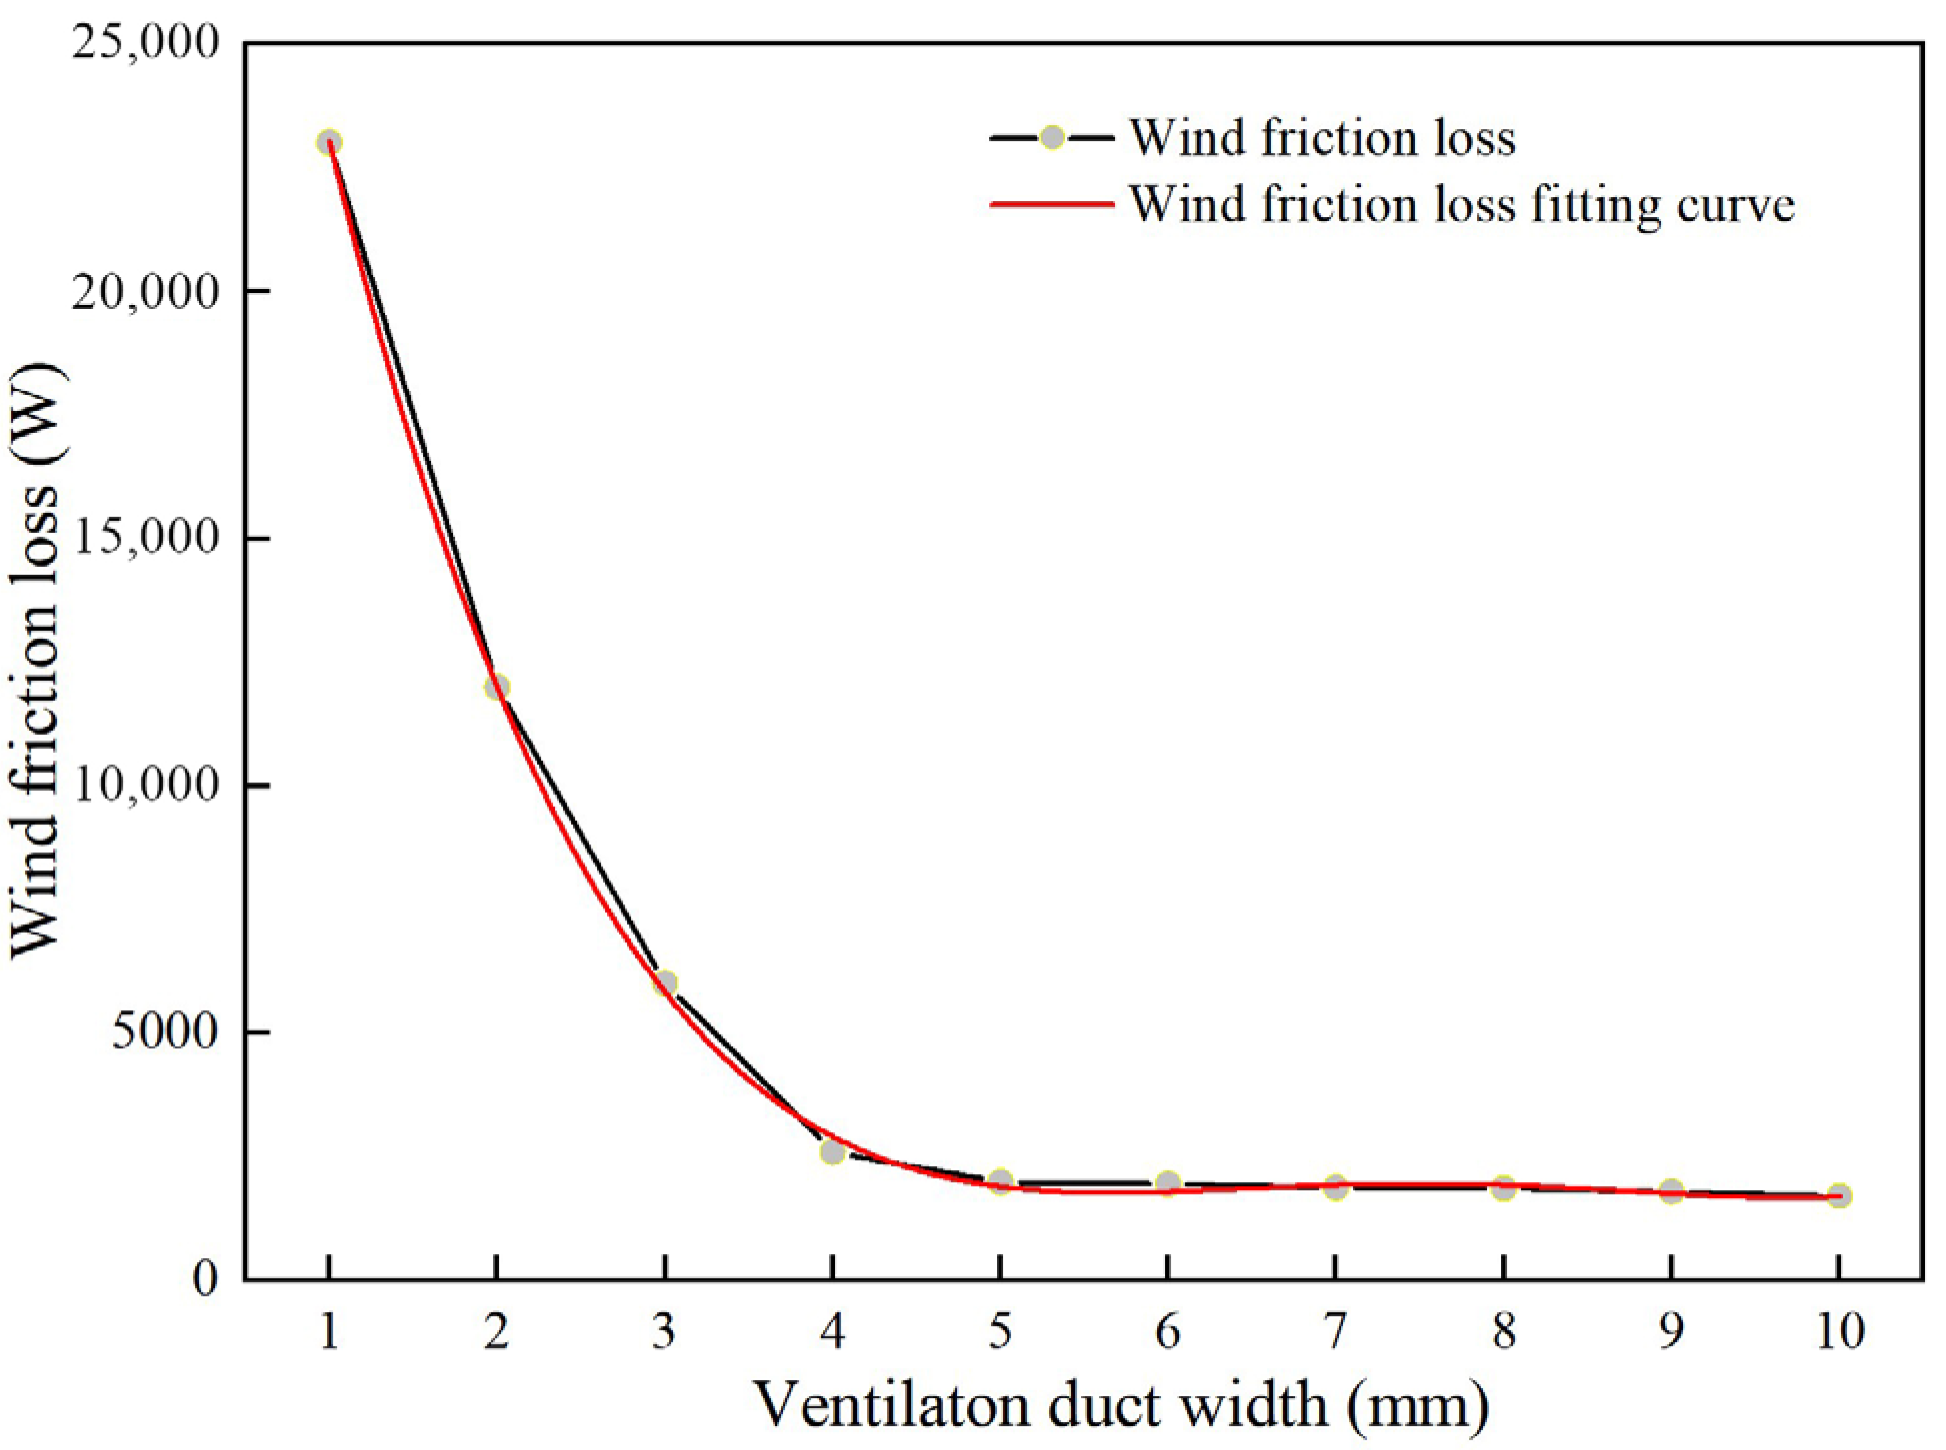
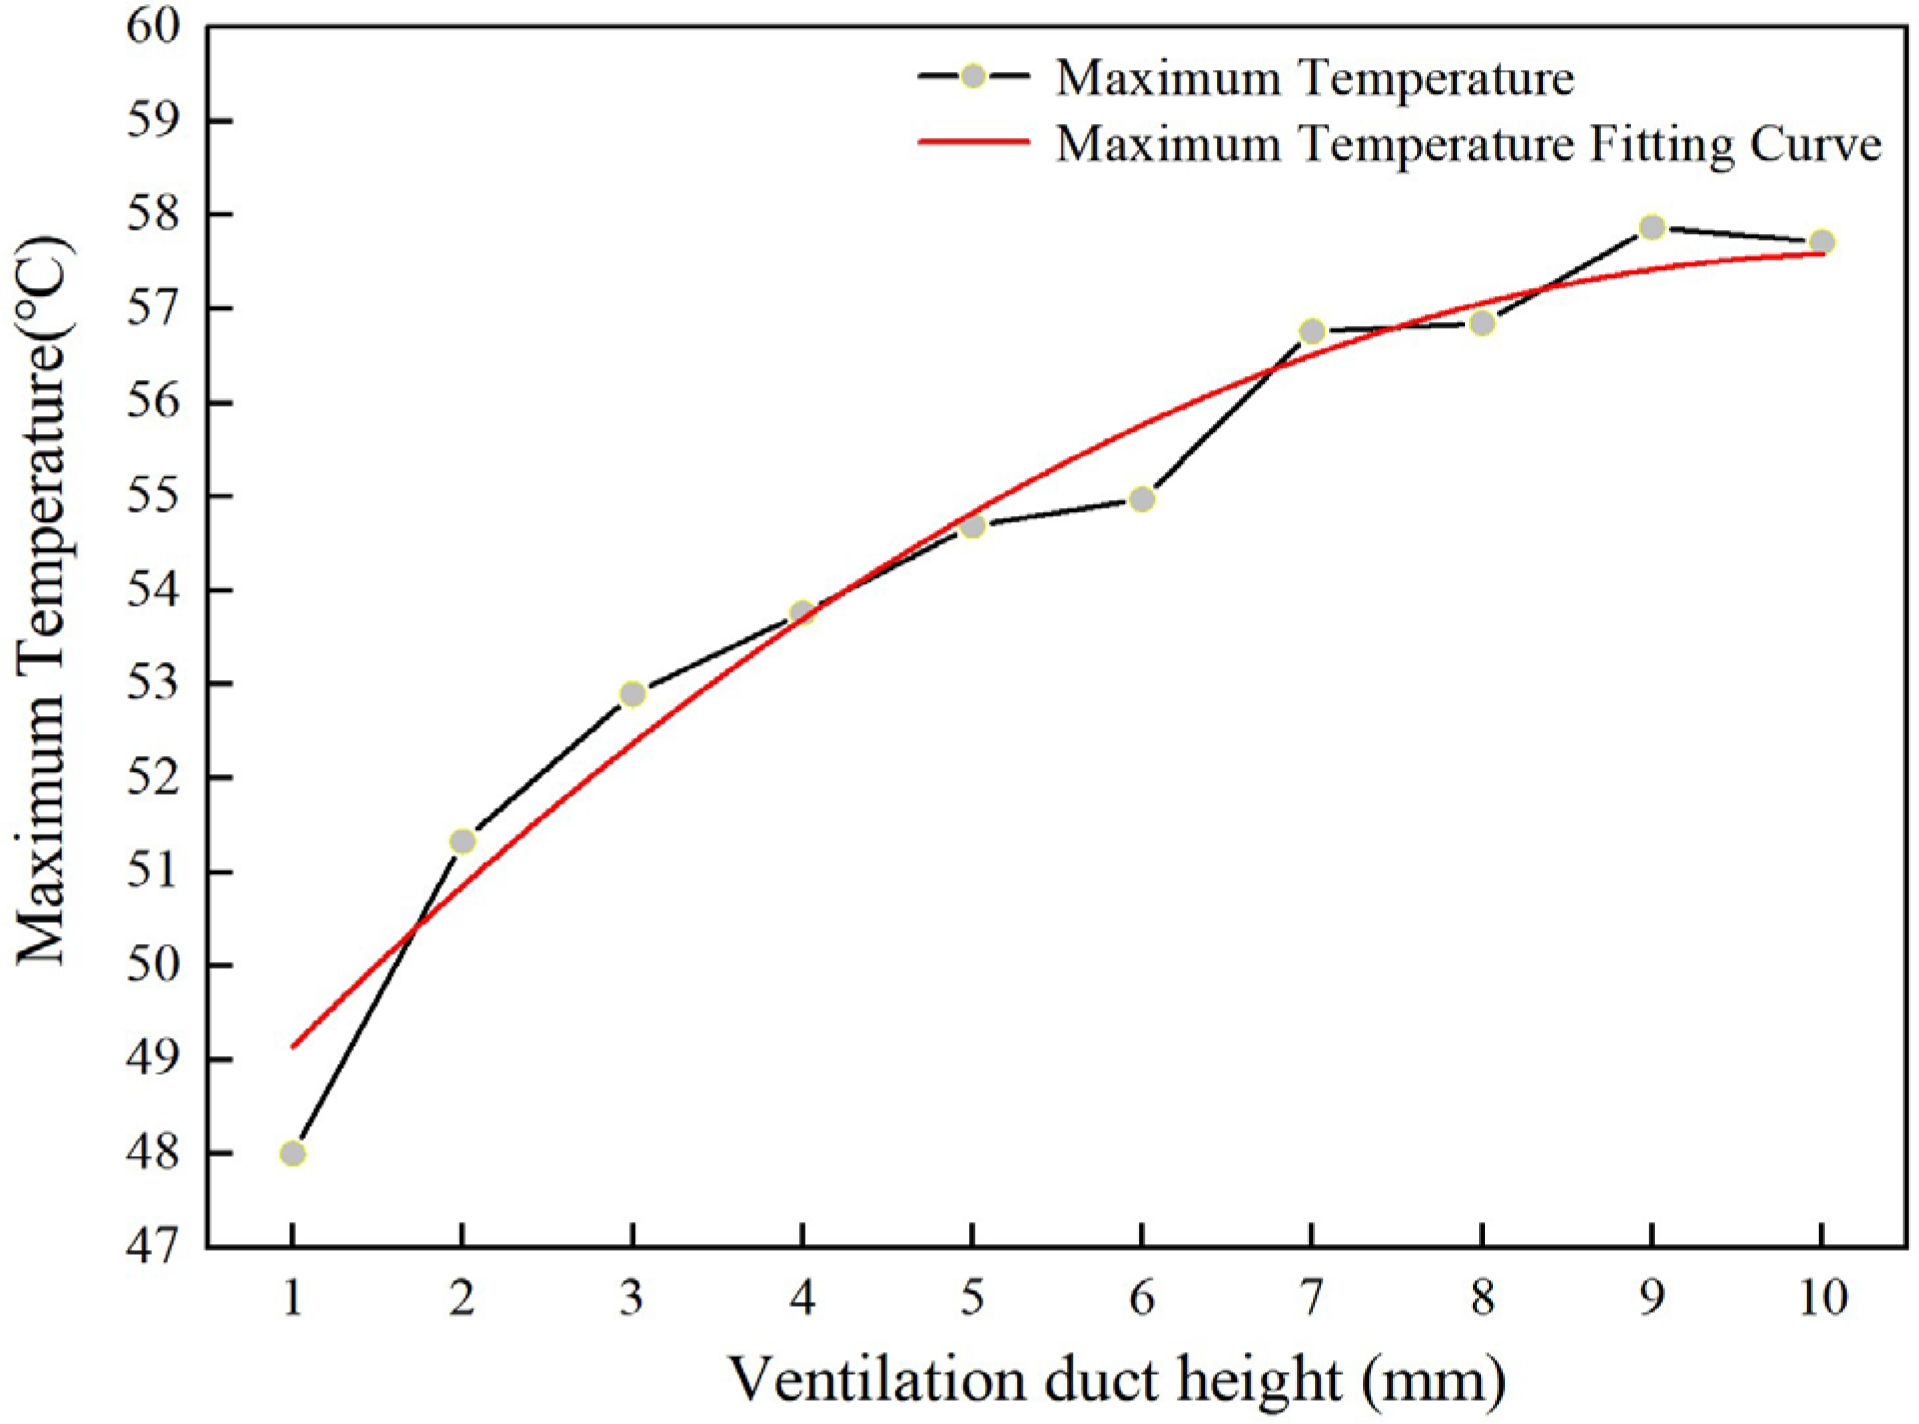
  • Within the range of 1 mm to 10 mm, for every 1 mm reduction in the width of the ventilation ducts, the maximum temperature of the generator decreases by 3%, but it increases wind friction loss.
  • This paper introduces a non-uniform stator core. Comparing three non-uniform cores with the original design, it was found that non-uniform cores effectively alter the motor’s internal temperature distribution and reduce the maximum temperature. The optimal scheme cuts the maximum temperature by 6.4% and reduces stator temperature differences.
  • This study provides a quantitative relationship between ventilation width, temperature, and friction loss, demonstrates that non-uniform core design is superior to uniform structures in temperature control, and offers practical references for core ventilation design in large-scale wind turbines.

Author Contributions

Conceptualization, X.Y., K.L. and J.D.; Methodology, X.Y., H.L. and K.L.; Software, J.D., X.Y., H.L. and K.L.; Formal analysis, Y.C.; Investigation, Y.C.; Writing—original draft preparation, X.Y., J.D., H.L. and K.L.; Writing—review and editing, J.D., X.Y., K.L. and Y.C.; Supervision, Y.C. and J.D. All authors have read and agreed to the published version of the manuscript.

Funding

This work was supported in part by Henan Province Key Science and Technology Program of China under Grant No.141100211200.

Institutional Review Board Statement

Not applicable.

Informed Consent Statement

Not applicable.

Data Availability Statement

The data presented in this study are available upon request from the Wolong Electric Nanyang Explosion Proof Group Co., Ltd. The data are not publicly available.

Acknowledgments

Thanks are extended to Chengshuo Wang and Yin Xing from Wolong Electric Nanyang Explosion Protection Group Co., Ltd., for their valuable assistance during the experimental process.

Conflicts of Interest

Author Xudong Yang was employed by the company Wolong Electric Nanyang Explosion Protection Group Co., Ltd. The remaining authors declare that the research was conducted in the absence of any commercial or financial relationships that could be construed as a potential conflict of interest.

Abbreviations

The following abbreviations are used in this manuscript:
DD-PMSGdirect-drive permanent magnet synchronous generator
CFDcomputational fluid dynamics
PMSWGpermanent magnet synchronous wind turbine generator

References

  1. Wang, G.; Bai, L.; Chao, Y.; Chen, Z. How do solar photovoltaic and wind power promote the joint poverty alleviation and clean energy development: An evolutionary game theoretic study. Renew. Energy 2023, 218, 119296. [Google Scholar] [CrossRef]
  2. Liu, T.; Chen, Z.; Xu, J. Empirical evidence based effectiveness assessment of policy regimes for wind power development in China. Renew. Sustain. Energy Rev. 2022, 164, 112535. [Google Scholar] [CrossRef]
  3. Nomandela, S.; Mnguni, M.E.S.; Raji, A.K. A Case Study on the Validation of Renewable Energy Grid Code Compliance for a Large-Scale Wind Power Plant Grid-Connected Mode of Operation in Real-Time Simulation. Appl. Sci. 2025, 15, 5521. [Google Scholar] [CrossRef]
  4. Liu, H.; Wang, Y.Z.; Zeng, T.; Wang, H.; Chan, S.; Ran, L. Wind turbine generator failure analysis and fault diagnosis: A review. IET Renew. Power Gener. 2024, 18, 3127–3148. [Google Scholar] [CrossRef]
  5. Singh, G.; Matuonto, M.; Sundaram, K. Impact of imbalanced wind turbine generator cooling on reliability. In Proceedings of the 2019 10th International Renewable Energy Congress (IREC), Sousse, Tunisia, 26–28 March 2019; IEEE: Piscataway, NJ, USA, 2019; pp. 1–6. [Google Scholar]
  6. Cen, Y.; Shen, H.; Wang, X.; Wu, Y.; Du, J. Multi-Objective Optimization Analysis of Electromagnetic Performance of Permanent Magnet Synchronous Motors Based on the PSO Algorithm. Energies 2024, 17, 4637. [Google Scholar] [CrossRef]
  7. Polikarpova, M.; Ponomarev, P.; Röyttä, P.; Semken, S.; Alexandrova, Y.; Pyrhönen, J. Direct liquid cooling for an outer-rotor direct-drive permanent-magnet synchronous generator for wind farm applications. IET Electr. Power Appl. 2015, 9, 523–532. [Google Scholar] [CrossRef]
  8. Song, Y.; Zhang, Y.; Jin, S.; Xu, Z.; Zhang, F. Investigation of winding cooling enhancement and thermal modelling of large-power high-torque-density direct-drive PMSM. IET Electr. Power Appl. 2023, 17, 1401–1410. [Google Scholar] [CrossRef]
  9. Wu, Y.; Guo, Y. Study on the suppression effect of variable hydrogen parameters on the temperature rise of the turbo-generator rotor under deep peak regulation. IET Electr. Power Appl. 2023, 17, 1524–1534. [Google Scholar] [CrossRef]
  10. Shi, N.; Wei, M.; Zhang, L.; Hu, X.; Song, B. Design and research of cooling system for 2.5 MW permanent magnet wind turbine. Renew. Energy 2021, 168, 97–106. [Google Scholar] [CrossRef]
  11. Watson, B.; Venkiteswaran, V.K. Universal cooling of data centres: A cfd analysis. Energy Procedia 2017, 142, 2711–2720. [Google Scholar] [CrossRef]
  12. Calautit, J.K.; O’Connor, D.; Sofotasiou, P.; Hughes, B.R. CFD simulation and optimisation of a low energy ventilation and cooling system. Computation 2014, 3, 128–149. [Google Scholar] [CrossRef]
  13. Liu, W.; Chen, J.; Zhang, C.; Cui, Z.-Q.; Wang, X. Ventilation system design and rotor air friction loss of high-speed permanent magnet machines. In Proceedings of the 2017 IEEE International Conference on Cybernetics and Intelligent Systems (CIS) and IEEE Conference on Robotics, Automation and Mechatronics (RAM), Ningbo, China, 19–21 November 2017; IEEE: Piscataway, NJ, USA, 2017; pp. 310–315. [Google Scholar]
  14. Li, W.; Li, D.; Li, J.; Zhang, X. Influence of rotor radial ventilation ducts number on temperature distribution of rotor excitation winding and fluid flow state between two poles of a fully air-cooled hydro-generator. IEEE Trans. Ind. Electron. 2017, 64, 3767–3775. [Google Scholar] [CrossRef]
  15. Zhou, G.H.; Han, L.; Fan, Z.N.; Zhang, H.-B.; Dong, X.-C.; Wang, J.; Sun, Z.; Zhang, B.-D. Ventilation cooling design for a novel 350-MW air-cooled turbo generator. IEEE Access 2018, 6, 62184–62192. [Google Scholar] [CrossRef]
  16. Xiao, X.; Baojun, G.; Dajun, T.; Jichao, H.; Likun, W. 3D temperature field of high-temperature gas cooled reactor cooling medium drive motor and ventilation structure improvement. IET Electr. Power Appl. 2018, 12, 1020–1026. [Google Scholar] [CrossRef]
  17. Ge, B.; Xu, X.; Tao, D.; Han, J.; Wang, L. Gas friction loss in stator ventilation ducts of the drive motor for the cooling medium in a high-temperature gas-cooled reactor. IEEE Trans. Ind. Electron. 2018, 66, 114–123. [Google Scholar] [CrossRef]
  18. Xu, X.; Ge, B.; Tao, D.; Han, J.; Wang, L. Effect of helium on temperature rise of helium blower drive motor in high-temperature gas-cooled reactor. Appl. Therm. Eng. 2019, 159, 113888. [Google Scholar] [CrossRef]
  19. Fan, X.; Qu, R.; Li, J.; Li, D.; Zhang, B.; Wang, C. Ventilation and thermal improvement of radial forced air-cooled FSCW permanent magnet synchronous wind generators. IEEE Trans. Ind. Appl. 2017, 53, 3447–3456. [Google Scholar] [CrossRef]
  20. Jamshidi, H.; Nilsson, H.; Chernoray, V. CFD-based design and analysis of the ventilation of an electric generator model, validated with experiments. Int. J. Fluid Mach. Syst. 2015, 8, 113–123. [Google Scholar] [CrossRef]
  21. Xie, Y.; Zhao, X.; Cai, W.; Qi, G.; Wang, Z.; Zhang, Y.; Yang, Y. Design and optimisation of oil injection pipe cooling structure for permanent magnet synchronous motors in hybrid electric vehicles. IET Electr. Power Appl. 2024, 18, 345–355. [Google Scholar] [CrossRef]
Figure 1. Structural diagram of proposed wind turbine generator.
Applsci 15 08008 g001
Figure 2. Schematic diagram of internal ventilation system flow of proposed generator.
Applsci 15 08008 g002
Figure 3. Simplified structure of the (a) solution domain; (b) fluid domain; (c) mesh generation.
Applsci 15 08008 g003
Figure 4. Variation of maximum generator temperature with mesh.
Applsci 15 08008 g004
Figure 5. Stator ventilation structure of proposed wind turbine generator.
Applsci 15 08008 g005
Figure 6. Velocity field of internal cooling structure.
Applsci 15 08008 g006
Figure 7. Comparison of airflow velocity in 19 radial ventilation ducts with different widths.
Applsci 15 08008 g007
Figure 8. Comparison of circumferential cross-sectional flow rate in radial ventilation ducts with different widths.
Applsci 15 08008 g008
Figure 9. Curve of wind friction loss with different widths in radial ventilation ducts.
Applsci 15 08008 g009
Figure 10. Generator temperature distribution.
Applsci 15 08008 g010
Figure 11. Curve of maximum temperature of generator with different widths in radial ventilation ducts.
Applsci 15 08008 g011
Figure 12. Stator core maximum temperature under different ventilation widths.
Applsci 15 08008 g012
Figure 13. Thermal field distribution of generator with radial ventilation ducts width of 6 mm: (a) overall thermal distribution; (b) thermal distribution of stator core and windings.
Applsci 15 08008 g013
Figure 14. Temperature comparison of different schemes: (a) origin; (b) scheme 1; (c) scheme 2; (d) scheme 3.
Applsci 15 08008 g014
Figure 15. Comparison of winding and core temperatures under different schemes: (a) origin; (b) scheme 1; (c) scheme 2; (d) scheme 3.
Applsci 15 08008 g015
Figure 16. Temperature distribution along axial direction for different schemes: (a) core; (b) winding.
Applsci 15 08008 g016
Figure 17. Schematic diagram of experimental platform.
Applsci 15 08008 g017
Figure 18. Temperature rise curve of simulation and experimental data: (a) comparison curves simulation data with three-point experimental data; (b) Temperature rise test curve of generator.
Applsci 15 08008 g018
Table 1. DD-PMSG parameters.
Generator ParametersValueUnitGenerator ParametersValueUnit
Rated power/PN4500kWNumber of slots/Q480
Rotational speed/n9.5r·min−1Rotor outer diameter/D25498mm
Air-gap flux density/Bδ0.8TCore length/L1382mm
Power factor/cosφ0.86 Insulation classF class
Number of pole-pairs/p56 PM gradeN45H
Table 2. Analysis of results before and after simplification.
Maximum Generator TemperatureComputational ErrorSimulation Time Required
Full-model57.31 °C0160 h
Simplified 1/12 model56.85 °C0.80%60 h
Simplified 1/24 model56.62 °C1.3%25 h
Simplified 1/48 model56.51 °C1.40%10 h
Table 3. Non-uniform core design schemes.
Structural SchemeCore Segment
(Axial Length (mm) × Number)
Radial Ventilation Ducts
(Axial Length (mm) × Number)
Origin63.4 × 206 × 19
Scheme 1 67.4 × 3 + 60.4 × 8 + 63.4 × 6 + 67.4 × 36 × 19
Scheme 2 67.4 × 3 + 63.4 × 6 + 60.4 × 8 + 67.4 × 36 × 19
Scheme 3 67.4 × 3 + 63.4 × 3 + 60.4 × 8 + 63.4 × 3 + 67.4 × 36 × 19
Disclaimer/Publisher’s Note: The statements, opinions and data contained in all publications are solely those of the individual author(s) and contributor(s) and not of MDPI and/or the editor(s). MDPI and/or the editor(s) disclaim responsibility for any injury to people or property resulting from any ideas, methods, instructions or products referred to in the content.

