Article

Smart Routing for Sustainable Supply Chain Networks: An AI and Knowledge Graph Driven Approach

Sustainable Manufacturing Lab, Industrial Engineering and Automation (IEA), Faculty of Engineering, Free University of Bozen-Bolzano, Europastr. 9, 39031 Bruneck, Italy
*
Authors to whom correspondence should be addressed.
Appl. Sci. 2025, 15(14), 8001; https://doi.org/10.3390/app15148001
Submission received: 19 June 2025 / Revised: 10 July 2025 / Accepted: 15 July 2025 / Published: 18 July 2025

Abstract

Featured Application

The approach can help logistics or supply chain teams in manufacturing companies to close data gaps in route planning, compare transport scenarios, and prepare emissions data for sustainability reporting. The prototype is based on a supply chain network graph, implemented AI tools, and optimization algorithms.

Abstract

Small and medium-sized enterprises (SMEs) face growing challenges in optimizing their sustainable supply chains because of fragmented logistics data and changing regulatory requirements. In particular, globally operating manufacturing SMEs often lack suitable tools, resulting in manual data collection and making reliable accounting and benchmarking of transport emissions in lifecycle assessments (LCAs) time-consuming and difficult to scale. This paper introduces a novel hybrid AI-supported knowledge graph (KG) which combines large language models (LLMs) with graph-based optimization to automate industrial supply chain route enrichment, completion, and emissions analysis. The proposed solution automatically resolves transportation gaps through generative AI and programming interfaces to create optimal routes for cost, time, and emission determination. The application merges separate routes into a single multi-modal network which allows users to evaluate sustainability against operational performance. A case study shows the capabilities in simplifying data collection for emissions reporting, therefore reducing manual effort and empowering SMEs to align logistics decisions with Industry 5.0 sustainability goals.

1. Introduction

The two most important global megatrends shaping present-day industry and society are digital transformation and environmental sustainability. Manufacturing companies are increasingly aligning digital transformation initiatives with sustainability objectives, driving convergence between Industry 4.0 and green manufacturing paradigms [1,2]. This integration has positioned sustainability as a core element of production planning and operations, requiring companies to develop practices that enhance environmental performance while maintaining productivity [3]. Such convergence requires companies to design production processes and supply-chain networks that maximize efficiency and resource usage while minimizing resource consumption, pollution, and waste. Advanced digital technologies, such as artificial intelligence (AI), big data, or the Internet of Things (IoT), can help to achieve this goal by enabling more effective process optimization, resource usage tracking, and decision making on operational and strategic levels [3,4]. Thus, the twin pursuits of digital innovation and sustainability jointly push the development of leaner, smarter, and more eco-efficient manufacturing systems [2,5].
However, regulatory and market forces are intensifying the demand for comprehensive emission (carbon) reporting. The EU’s Corporate Sustainability Reporting Directive (CSRD), for example, requires companies to measure and disclose greenhouse-gas emissions across their full value chains, explicitly including indirect (Scope 3) emissions from upstream and downstream activities [6]. Although the CSRD applies only to large, listed firms, its effects cascade down supply chains. Large OEMs and retailers now demand that their suppliers (often SMEs) supply cradle-to-gate emission data. In practice, companies must therefore account for emissions from suppliers, product use, and, notably, transportation. These requirements have proven especially challenging for SMEs, which often lack the staff, capital, and data infrastructure to assemble detailed emissions inventories and analysis [7,8]. In short, emissions (carbon) reporting is no longer an option: stakeholders (investors, regulators, and customers) expect granular footprint data, and failure to provide it can harm competitiveness and access to markets and finance [9].
The significance of transportation-related emissions becomes particularly evident when conducting lifecycle assessments (LCAs). According to ISO 14040 [10] and ISO 14044 [11], which define the principles and framework of LCAs, transport activities represent a mandatory part of the life cycle inventory (LCI). Here, all inputs and outputs within the system boundaries of a product must be systematically identified and quantified [10,11]. This includes fuel consumption, emissions output (e.g., CO2, NOx, and particulate matter), and the precise definition of spatial system boundaries across cradle-to-gate or cradle-to-grave scopes [12,13]. Based on empirical evidence from conducted LCA studies, transport emissions typically represent 5–10% of total product carbon footprints in automotive manufacturing.
On the technological side, SMEs are faced with missing or non-existent digital tools that focus on tracking transport activities. Many SMEs lack, e.g., dedicated transportation management systems (TMSs) or tracking platforms due to cost, a lack of necessity, and/or complexity [14]. Without a TMS, logistics data is often siloed into spreadsheets or disparate legacy systems. Manual data entry and the use of disconnected software tools often result in fragmented and inconsistent transport emissions data, making it difficult for organizations to obtain a complete or reliable picture of their carbon footprint. This issue is particularly severe in modern multimodal supply chains, where shipments typically span multiple transport modes (road, rail, sea, and air), each involving different carriers, systems, and data formats. At every modal transition or carrier hand-off, there is a risk of data loss, inconsistency, or missing metadata (e.g., fuel type, vehicle class, and exact distances). These challenges are especially critical in logistics and transport emissions accounting. When detailed route- or mode-specific data is unavailable due to lack of interoperability, non-cooperation by carriers, or missing telematics, companies are often forced to rely on generic emission factors or assumptions, which significantly reduces the precision and validity of their Scope 3 calculations.
Such workarounds undermine both the accuracy and comparability of emissions reporting. The effort required to collect consistent freight data “across multiple journeys” frequently becomes a major operational bottleneck. In summary, manufacturing SMEs in particular face significant barriers when trying to quantify transport-related emissions using current tools, standards, and available resources [15].
Current existing LCAs and carbon-tracking tools offer only a partial solution and fail to adequately solve these problems. Most commercial LCA software can model process or vehicle emissions based on average per-kilometer factors, but do not incorporate detailed routing or automated enterprise data preparation. For example, standard LCA workflows typically require users to input shipment distances manually and apply default emission factors, rather than calculating emissions based on actual road networks or delivery plans [16]. Similarly, many carbon calculators lack interfaces to company enterprise systems such as enterprise resource planning (ERP) or transportation management systems (TMSs), so the data must be aggregated and entered by hand. In global-acting SMEs in the automotive industry, the supply chain can easily have up to 1000 locations, including suppliers, plants, and customers. Based on the assumption that all the goods could be transported between all these locations, it would result in approximately 500,000 potential primary routes. Finally, each route requires transport data to be identified and analyzed [17]. In practice, this means current tools are neither integrated nor scalable for complex logistics scenarios. A manufacturer might extract order details from its ERP and estimate emissions in an external LCA tool, but each shipment or mode change often requires manual intervention. There is little capacity to automatically reoptimize routes or recalculate emissions in response to changing conditions. Thus, current systems can provide static or periodic carbon reports, but they do not support continuous, high-fidelity freight emission accounting. The reliance on spreadsheets and disconnected software not only consumes time but also increases the risk of errors and omissions.
The discussion above highlights a critical need for integrated technological solutions that automate the generation and optimization of transport route data for carbon footprint calculations. By leveraging advanced analytics and enterprise data flows, such a system could address the mentioned limitations effectively. For example, machine learning models can enhance the accuracy and timeliness of carbon footprint calculations by identifying patterns in operational data [18].
Previous efforts to dynamically integrate life cycle inventory (LCI) and ERP in an Industry 4.0 environment have shown promising potential [19]. Tight ERP integration can ensure that activity data (such as production volumes, vehicle logs, and fuel invoices) continuously feed into the supply chain model without manual intervention. Additionally, emerging case studies indicate that AI-driven data collection can reduce reporting burdens and support more effective carbon neutrality strategies [18].
To address this problem, in a previous preliminary work, Felder et al. [17] introduced an ERP-integrated, Python-based routing tool. This approach enabled the automated identification of transport distances between supply chain actors, marking an important step toward automating transport data acquisition for LCAs. Nevertheless, this and many other existing solutions either focus on static, spreadsheet-based data aggregation or provide only partial support for multimodal routing. These solutions lacks the ability to dynamically generate and select transport route chains from inconsistent information. No existing framework systematically combines the generative reasoning capabilities of LLMs, the network structuring power of KGs, and the optimization potential of graph technology to autonomously complete, benchmark, and update complex multimodal routes for manufacturing SMEs. The present work introduces a modular Python (v3.13.2) application that integrates KG-based modeling, generative AI, and real-world transport APIs to automate and optimize transport route completion for emission assessment in SMEs to close this gap. The main research question addressed in this study is as follows: How can generative AI and knowledge graph-based optimization be integrated to autonomously complete and optimize multimodal transport routes for sustainable supply chain planning?
To address this, we propose a solution called an “Intelligent Automated Enrichment System” (IAES). Regarding the structure of this paper, it is organized as follows. Section 2 presents a recap of previous work and existing integration approaches. In Section 3, the proposed concept, the system architecture, and the designed KG ontology are described. After this, in Section 4, a case study is conducted using the application. Section 5 includes a critical discussion, pointing out the advantages and possible limitations of the proposed approach, and also gives a short outlook for further research. Finally, the conclusion closes the paper in Section 6.

2. Theoretical Foundations and Research Gap

This section presents a literature review to identify current research about LCAs, SCM based on the technologies of KGs, graph databases (GDBs), and LLMs. The research aimed to study the current applications of these technologies for enhancing transport data quality and sustainability assessments, and advanced supply chain analytics. The Scopus database search used a keyword-based approach with the following search string: (TITLE-ABS-KEY(“Supply Chain” AND “Knowledge Graph”)) OR (TITLE-ABS KEY((“LCA” OR “Life Cycle Assessment”) AND “Knowledge Graph”)) OR (TITLE-ABS-KEY(“Supply Chain” AND “LLM”)) OR (TITLE-ABS-KEY(“Graph Database” AND “Supply Chain”)).
The search was limited to English peer-reviewed journal articles and excluded review papers. This selection resulted in a total number of 74 documents. Analysis of the existing literature revealed a predominant focus on supply chain risk assessment and financial modeling, particularly within pharmaceutical and high-risk industrial domains (e.g., Eberhardt et al. 2023 [20], Kosasih & Brintrup. 2022, [21]). To narrow down these areas, the final review focused on contributions that deal with the following:
  • The use of KGs or GDBs to model transport chains, product flows, LCAs, or the LCI
  • The application of LLMs to automate route generation, enrich incomplete SCM or LCA data
An overview of the final selected studies with their technological approach, methodology, and application domain is listed in Table 1.
Saad et al. (2023) [22] developed a semantic GDB for the LCI, enabling a “queryable, scalable, intelligible, and exchangeable” data format that supports “expressive and instantaneous queries in real-time over a considerable amount of LCI data”. This graph-based LCI model represents products, processes, and flows as connected data points, which makes it easier to combine different LCA datasets and enables real-time recommendations. Wu et al. (2024) [23] addressed the necessity for effective carbon emission tracking in manufacturing industries. The authors proposed KG modeling methods to quantify and predict carbon emissions in complex manufacturing supply chains. Their framework (CarbonKG) integrates intelligent technologies (e.g., process mining) to analyze the carbon footprint across the entire life cycle of a product. This approach is especially relevant given the complexities associated with the long supply chains typically encountered in manufacturing environments. By facilitating carbon traceability, the framework aids manufacturers in understanding their emissions pathways to promote more informed decision-making. Saidi et al. (2025) [24] developed a KG model to enable sustainable reconfiguration of supply chains 5.0. Their system formalizes supply chain entities, activities, resources, and constraints while embedding sustainability indicators (e.g., costs, emissions) directly into the decision logic. The graph structure supports the evaluation of alternative configurations based on environmental, economic, and social performance criteria. This graph-based approach provides transparency and promotes trade-offs between efficiency and environmental impact.
Peng et al. (2024) [25] introduced a KG method to automate LCA modeling. Their system recommends background processes and flow datasets to build automatic LCA models. In a case study, the approach achieved a top-10 flow recommendation precision of ~79.5% (4× higher than conventional search) and 2.45× faster retrieval. The KG also ranks processes by geography to help define system boundaries and functional units. This information is finally fed into the software OpenLCA for calculation. Chen et al. (2024) [26] described a novel workflow that combines LLMs with a computational geometry engine to automate building LCAs. Their system uses the cognitive capabilities of LLMs for processing unstructured data (e.g., material names, quantities from text) together with a parametric design framework called COMPAS. The LLM components extract material data and link it to LCI databases. Through testing on a real building project, it was shown that this method can significantly reduce the manual work needed to combine data from different sources. These studies demonstrate that LLMs can greatly simplify LCA data preparation by automatically processing text-based information that was previously time-consuming to handle manually. Gu et al. (2025) [27] created the CECA method to automatically calculate embodied carbon in construction projects. Their system uses an LLM to read building specifications and automatically match materials and equipment to the correct emission factors from databases, eliminating manual lookups. The LLM-based approach achieved 84% matching accuracy and calculated carbon footprints with only 13% error compared to traditional LCA methods, while being 216 times faster than manual processes. This shows how LLMs can efficiently process unstructured data like material lists and BIM data and connect them to LCA databases, essentially automating the data compilation process.
The GDB framework by Greif et al. (2024) [28] integrates “synthetic data generated through language models” into an LCA-KG to close data gaps. In their application, the LLM was used to generate plausible missing data for a 3D printing LCA use case. This hybrid approach improved the coverage of early-stage LCA models and highlighted relationships between engineering decisions and environmental impacts.
Oladeji & Mousavi (2023) [29] presented a KG (E-liability) for supply chain carbon accounting. Their approach uses AI to turn unstructured corporate reports and shipping records into a dynamic emissions graph. Their system uses GPT to automatically identify supply chain connections from text documents, creating and updating a comprehensive database for emissions tracking.
The review reveals two dominant paradigms: (1) GDBs for supply chain emissions data structuring (e.g., Saad’s LCI [22], Wu’s CarbonKG [23]), and (2) LLMs automating unstructured data (e.g., Chen’s BIM parsing [26], Gu’s CECA [27]). Notably, Greif et al. [28] and Oladeji & Mousavi [29] pioneered hybrid approaches, using LLMs to populate GDBs, but neither addresses dynamic route optimization. While these approaches address key challenges in LCA and supply chain modeling, none of them offer a unified, dynamic solution for multimodal transport emissions analysis.

Need for Further Investigation

The synthesis of the recent literature shows a significant methodological gap: no existing framework dynamically integrates (a) generative AI with (b) graph-based modelling/optimization to (i) autonomously resolve incomplete transport routes and (ii) compute multimodal emissions. GDBs enhance LCA data interoperability [22,23,24,25,28] but lack generative capabilities to infer missing logistics connections. LLMs can effectively automate unstructured data parsing [26,27,29,30] but cannot contextualize outputs within supply chain networks or perform optimization.
Current applications exhibit three critical deficiencies: (1) existing GDB-centric approaches (e.g., Greif et al. [28]) rely on static network representations that cannot dynamically detect missing or outdated logistic data; (2) most systems depend on narrow modal coverage, such as road-only APIs that are incompatible with global supply chains inherently intermodal nature [31,32]; and (3) current architectures operate as open-loop systems where route generation, enrichment, and optimization remain disconnected, as demonstrated by hybrid methods like Oladeji & Mousavi’s NLP-extracted emissions graph [29].
This gap necessitates a unified system that integrates LLMs’ generative reasoning with GDBs’ analytical functionalities for sustainable optimization. The required application must enable generative route planning where LLMs suggest complete multimodal routes (e.g., “Supplier A → Port X (Road) → Port Y (Sea) → Plant B”), intelligent data augmentation through LLMs combined with specialized tools for validation, network optimization via graph algorithms that identify optimal routes within the network, and dynamic network analytics.

3. Methodology

This section describes the design and methodological foundation of the proposed IAES based on the concept of Direct and Waypoint Routing explained in Felder et al. [17]. It builds upon a dual conceptual basis: (i) transforming isolated routing records into a connected network representation, and (ii) leveraging LLMs and KG data technologies to enrich and optimize logistics data. The following sections detail the underlying conceptual framework (Section 3.1), the system architecture (Section 3.2), and the semantic KG ontology (Section 3.3), providing the technical foundation for the case study presented in Section 4.

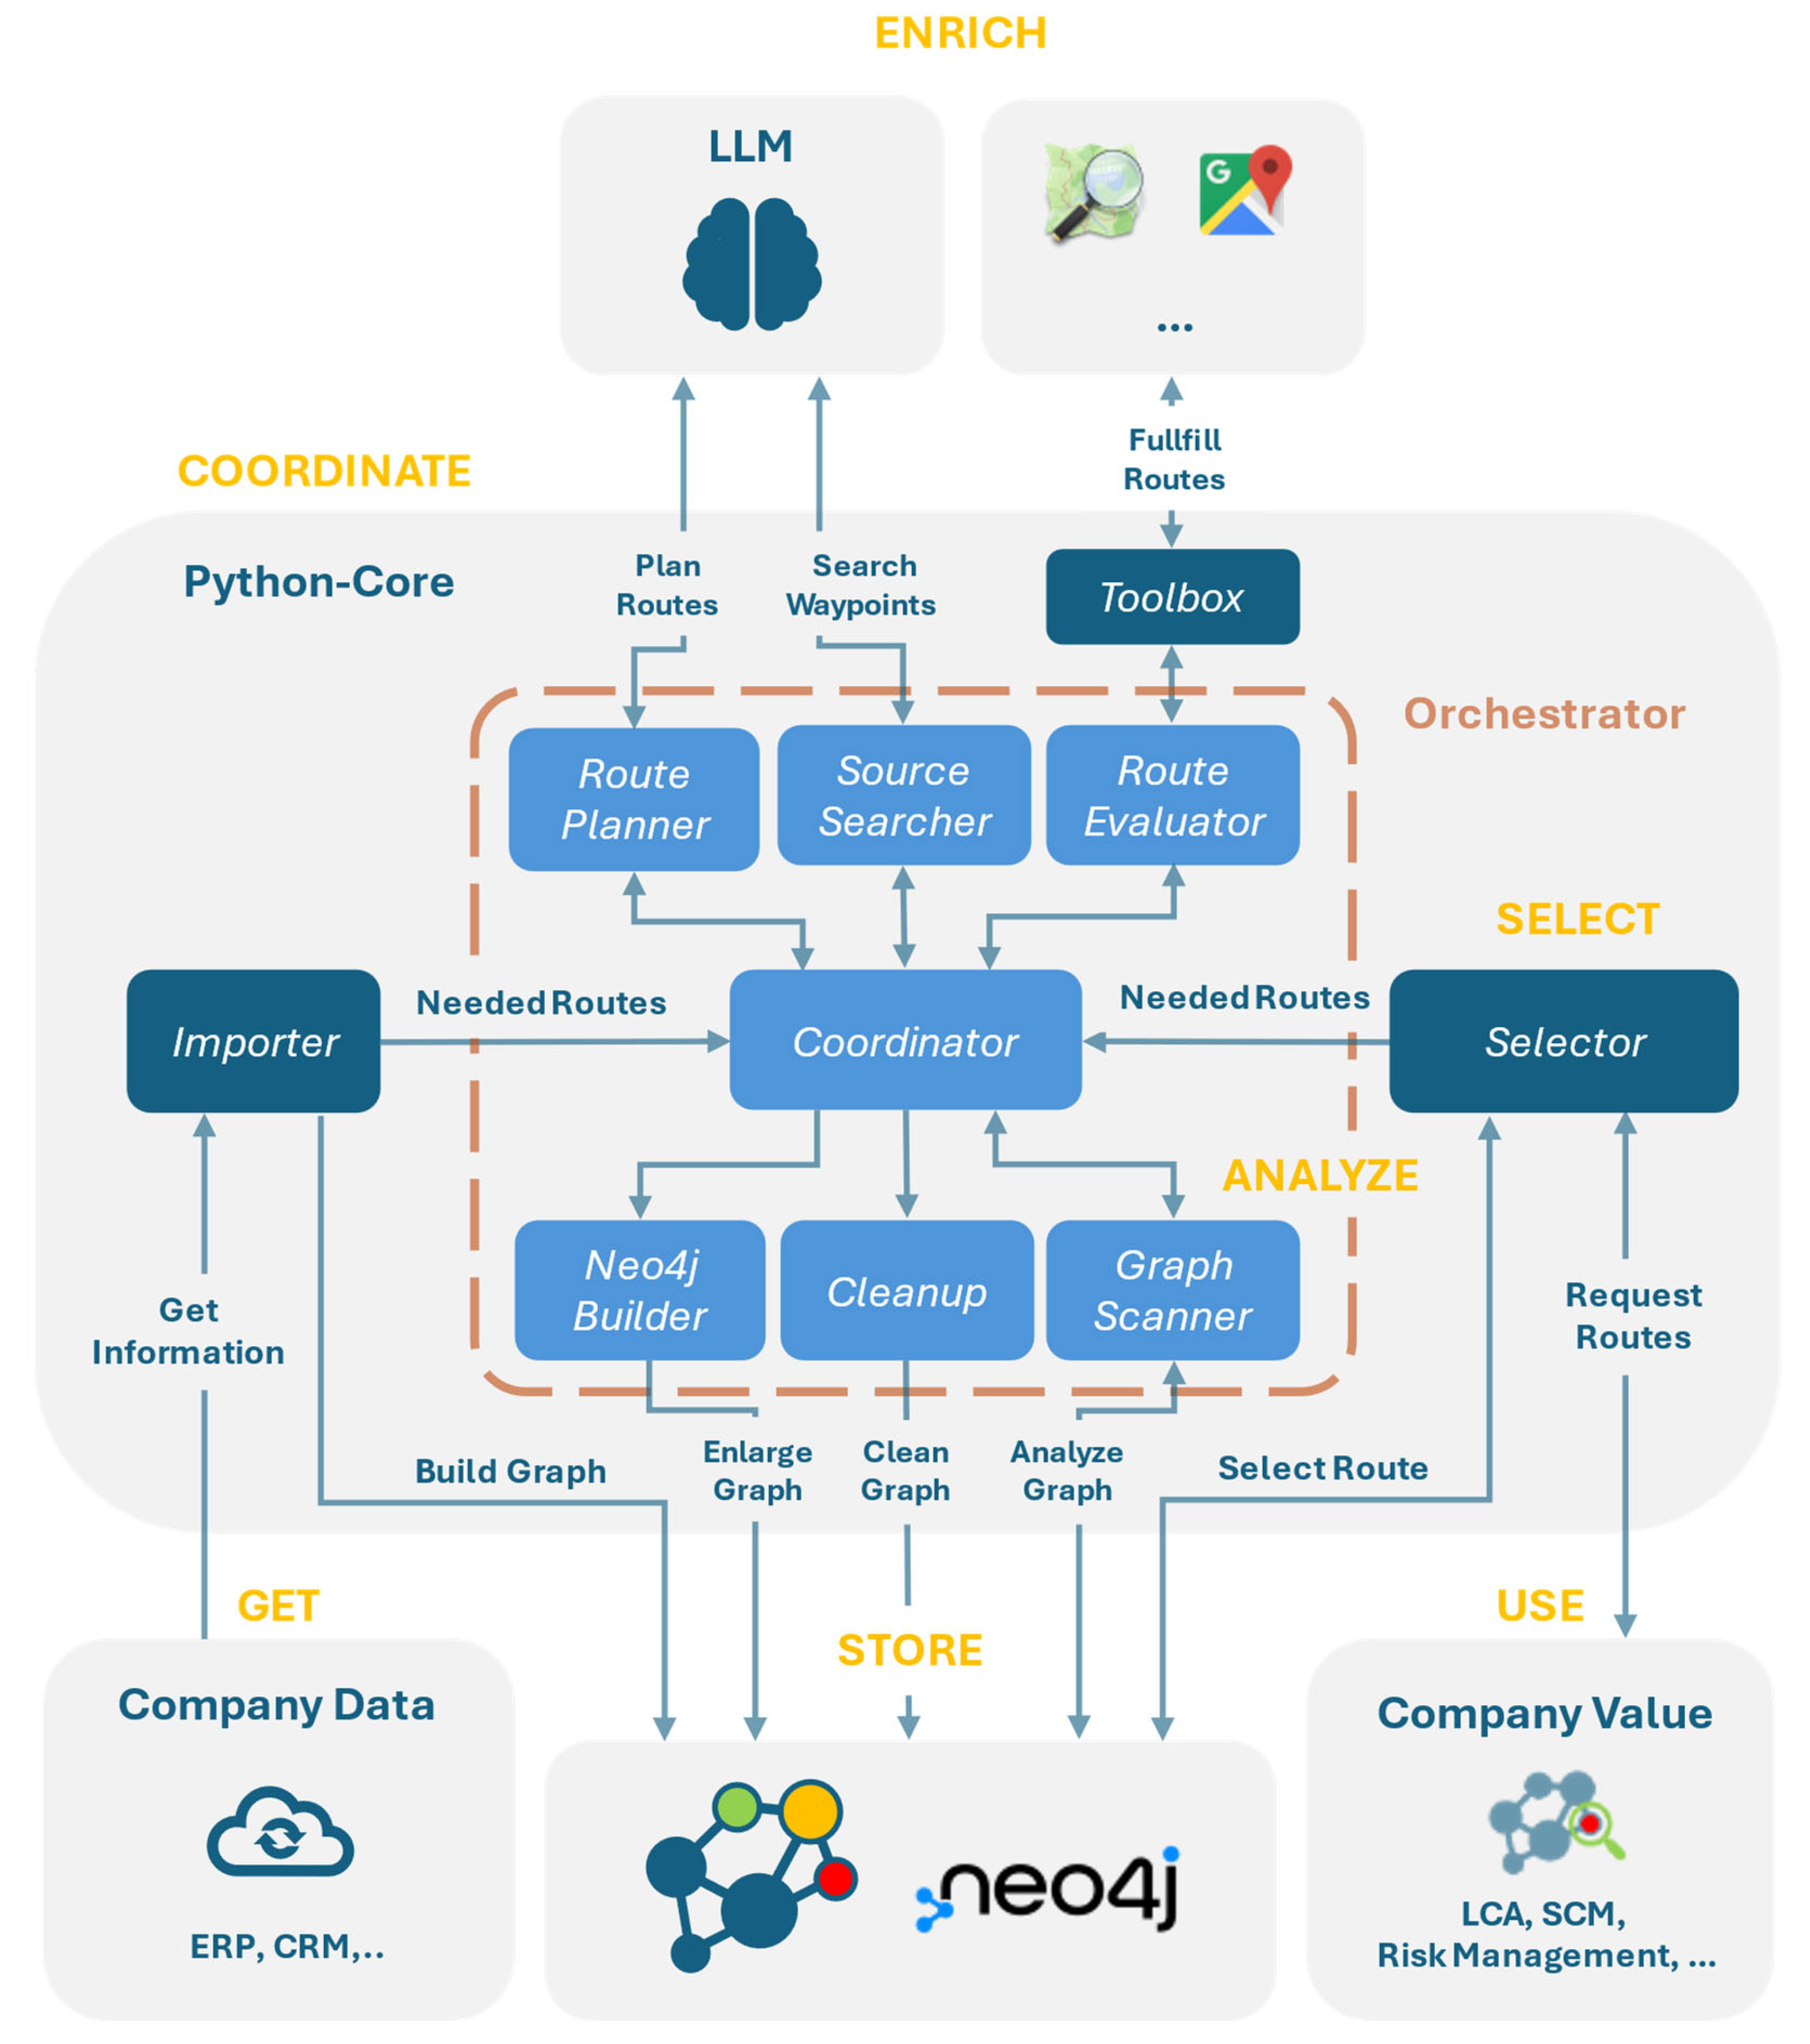
3.1. Conceptual Framework: Combining Generative AI with Graph-Based Optimization

Traditional supply chain applications in SMEs typically store transport routes as isolated, disconnected records within spreadsheets or relational database tables. This fragmentation creates a fundamental limitation: the absence of contextual connectivity supporting network-level analysis and the optimization of transport flows. The IAES addresses this challenge through a paradigm shift from linear (relational) representations toward a network-based property graph model, where all logistical entities and their interactions are represented as nodes and relationships.
This transformation enables each transport relation (e.g., Supplier A to Plant B) to become a part of a connected and queryable supply chain KG. This KG provides three important capabilities: (i) the inference of plausible intermediate steps, allowing the system to deduce typical cargo hubs or multimodal terminals based on network topology and connectivity patterns, (ii) the reuse of shared waypoints, where common infrastructure elements (ports, terminals) are utilized across multiple routes, and (iii) global optimization, enabling advanced pathfinding algorithms to identify optimal transport solutions based on customizable criteria.
To operationalize this conceptual model, the IAES utilizes a hybrid architecture that combines the generative reasoning capabilities of LLMs with the structured analytical power of GDBs. Specifically, the application integrates OpenAI GPT-4 with Neo4j Desktop version 5.26.5 to achieve the complementary functionalities mentioned before. The LLM is employed for the semantic interpretation of unstructured logistics information, generating plausible routes and inferring missing waypoints. The property KG serves as the structured repository for all relevant supply chain elements, where nodes represent logistics actors (plants, suppliers, and terminals) and relationships capture transport routes. Each route and node is enriched with essential data properties such as the transport mode, the vehicle type, emissions, or costs. Daios et al. [33] underlines that using this AI contextual knowledge enhances decision-making in supply chain management. Empirical research also highlights that graph databases demonstrate superior performance compared to traditional relational databases in scenarios requiring relationship identification, traversal operations, or pattern detection [34]. Neo4j was therefore selected due to its flexible data storage capabilities, built-in graph algorithms, efficient Cypher querying language, and integrated visualization features. The included functionalities support powerful graph traversal and path-matching capabilities, which are necessary for multimodal planning [35]. Furthermore, the Neo4js graph data science library, with algorithms such as Dijkstra, is used to detect optimization potential and identify the best routes. From the conceptual model and requirements analysis, the core tasks and functionalities of the IAES were defined.
The tasks were systematically organized into a modular workflow, which performs the transformation of the raw data into actionable insight. Table 2 provides an overview of this principle, which forms the foundation of the technical realization.

3.2. Prototype Architecture: Modular Agent-Based Design

The architecture of the IAES is implemented as a Python-based pipeline of cooperating agents backed by the Neo4j GDB for storing the network data. It is designed to fulfill the following main tasks: Get, Analyze, Coordinate, Enrich, Store, Select, and Use, as mentioned in Section 3.1. The combination of tasks, process flows, and executing modules is illustrated in Figure 1.
In the first step, the Importer (GET) imports raw data from external sources such as enterprise ERP, MES, and systems, and maps them into a Neo4j property graph. At the same time, a list of required transport connections (NeededRoutes) is extracted and handed to the Coordinator, which triggers the route planning and enrichment cycle as part of the Orchestrator. In the IAES architecture, the term Orchestrator refers to the overall control structure that governs the interaction between all agents for executing the ANALYZE, ENRICH, STORE, and COORDINATE tasks. This orchestration is technically realized through the central Coordinator agent, which sequentially invokes specialized sub-agents (GraphScanner, RoutePlanner, SourceSearcher, RouteEvaluator, Neo4jBuilder, and Cleanup), while also managing data and task exchanges between them. The Coordinator thus acts as the execution core of the Orchestrator logic, supported by additional Python modules listed in Table 3.
The GraphScannerAgent serves as the analytical entry point in the orchestrator pipeline. It systematically inspects the state of the supply chain KG to identify structural gaps and outdated data. The agent utilizes Cypher queries to extract all nodes by label (e.g., Plant, Customer, Waypoint) and all route relationships, including metadata. To detect missing routes, it compares the set of required node pairs (in the present case, imported from an Excel file named “NeededRoutes.xlsx”) with the actual relationships in the graph. The agent searches for both direct paths and indirect paths, using the integrated breadth-first search traversal algorithm provided by Neo4j. Outdated routes are identified by evaluating the last update date property of each route against a user-defined threshold. Incomplete routes are detected by checking the respective property (availability = 1). All of these steps are modularly implemented, leveraging efficient batch operations and optimized Cypher queries to ensure high performance, even for large graphs. At the end of each scan, the agent compiles a structured and aggregated report. The result of the scans is then passed back to the CoordinatorAgent, which uses it to trigger the other connected agents, as illustrated in Figure 1.
The RoutePlannerAgent serves as the conceptual engine of the Orchestrator pipeline. Its function is to generate (suggest) plausible and logistically multimodal transport routes between two nodes, which are requested through the GraphScanner scan report. The agent leverages an LLM-specific GPT-4 from OpenAI to synthesize feasible transport chains composed of one or more intermediate segments.
To initiate a route plan, the agent receives a pair of node identifiers corresponding to the start and end locations with the associated information. This information is embedded into a prompt template aimed at guiding the LLM. The prompt imposes strict constraints to ensure the output reflects realistic cargo transport patterns. Only four transport modes are permitted: road, rail, sea, and air. Intermediate hubs are limited to logistics-relevant entities such as seaports, cargo airports, freight rail terminals, or truck terminals. The prompt explicitly forbids the use of passenger routes or abstract location types. The exact wording and structure of the prompt used is provided in Appendix A.1. The LLM answer shown as an example in Figure 2 is parsed into a sequence of steps, where each step contains a source node, a destination waypoint, and the intended mode of transport.
These steps serve as a blueprint for downstream agents to fulfill the route. It is important to note that the RoutePlannerAgent does not verify the existence of the waypoints in the KG. This is the task of the SourceSearcherAgent, which will match, create, or enrich these entities. Its primary function is to search, match, or suggest waypoints using a combination of LLM-based suggestions, geospatial filtering, and graph-matching techniques. Upon receiving a list of route segments, the agent processes them step by step. For each intermediate waypoint, it constructs a query prompt (see Appendix A.2), asking it to return a single realistic and valid logistics hub, such as seaports, freight airports, train hubs, or truck terminals located in the target region and suited to the specified transport mode. The prompt restricts the response to a JSON structure that must include specific fields such as the name, latitude, longitude, type, and country code (see the example in Figure 3).
The agent then parses the response and checks whether a similar node already exists in the KG. To avoid duplication, the agent applies a dual filter: first, a spatial filter (within a 2 km radius) and second, a fuzzy text matching algorithm (with a string similarity above 0.8). If a near identical node is found, this node will be used; otherwise, a new waypoint node is created.
The RouteEvaluatorAgent is responsible for the quantitative enrichment and validation of transport routes. For every route relationship with availability = 1 (the placeholder state), it calculates the distance and transit time, and estimates the transport cost and emissions. To perform its task, the agent verifies the presence and validity of geospatial coordinates for the start and end nodes using the appropriate mode transport evaluation method based on specialized functions. Currently, only road-based segments utilize real-world route data retrieved dynamically via the ORS API. The integrated evaluation method performs API calls to determine routable paths based on heavy goods vehicle profiles, returning actual driving distances and estimated travel durations. In cases where coordinates are not directly routable, a fallback mechanism is applied that snaps both endpoints to the nearest reachable point within a defined radius. This two-step approach ensures that road connections reflect infrastructure-aware routing rather than idealized geometric paths.
For all other transport modes (sea, air, and rail), the application falls back to simplified geodesic estimations based on great-circle distances (the Haversine formula). These approximations are combined with mode-specific average speeds to estimate durations, and with fixed coefficients to derive emissions and cost metrics. For road transport, emission factors of 0.08 kg CO2 per kilometer and cost coefficients of 0.05 EUR/km are applied, reflecting standard assumptions for long-distance truck operations. Sea transport is approximated using an average speed of 35 km/h for container ships and an emission factor of 0.015 kg CO2/km. Air transport assumes a speed of 800 km/h for cargo aircraft, with a high emission intensity of 0.45 kg CO2/km. Rail transport is evaluated with a speed of 60 km/h and an emission factor of 0.02 kg CO2/km, reflecting the comparatively low environmental impact of freight trains.
These values currently serve as provisional estimates and are intended to be replaced by more sophisticated methods or empirical datasets in future development. If a route segment cannot be evaluated, it retains its incomplete status and is so flagged for further processing.
To complete the list of agents, the Neo4jBuilderAgent and CleanupAgent are responsible for the STORE tasks. The Neo4jBuilderAgent executes Cypher queries to merge newly created nodes and relationships into the KG or update existing ones with enriched attributes. In parallel, the CleanupAgent ensures data integrity by removing incomplete routes. After completing the orchestration run, the multimodal supply chain network is ready for interaction and analysis. At this stage, the SELECT and USE tasks come into action.
The SELECT task executed by the Selector enables the identification of optimal transport routes. At its core, the application uses Dijkstra’s shortest path algorithm, based on the Neo4j graph data science library procedure gds.shortestPath.dijkstra.stream [36]. The algorithm is executed on dynamic graph projections, which are generated to represent only the relevant needed subgraphs. Each projection is tailored to the selected optimization criterion: a costGraph minimizes the total transport cost, a timeGraph minimizes the total travel time, an emissionGraph minimizes transport emissions, and a multiGraph supports weighted combinations of multiple criteria and user-defined constraints.
The multiGraph provides the maximum optimization configurability. Users can define custom weights (from 0 to 1) for cost, time, and emissions, prioritize specific transport modes, and exclude countries (e.g., due to risk or regulation). In practice, for each possible route, the algorithm calculates a combined score by summing the weighted values for cost, time, and emissions, plus an additional penalty if a non-preferred mode is included, as described by Equation (1). The score for each route is calculated as follows:
s c o r e = w c o s t s · c o s t s + w d u r a t i o n · d u r a t i o n + w e m i s s i o n s · e m i s s i o n s + w m o d e · p e n a l t y
where wcosts, wduration, wemissions, and wmode are user-defined weights for the respective criteria. Penalty reflects the predefined cost of using a non-preferred transport mode. This weighted cost function aggregates all relevant factors into a single scalar value per route, enabling comprehensive trade-off analysis. Each execution produces both a step-by-step route trace of the selected path and a summary of cumulative impact metrics. It is important to note that the explained approach is only one possible realization of the SELECT task.
The USE task is highly context-dependent and refers to how an organization integrates the prepared KG into business processes to generate operational or strategic value. In this study, a dedicated Streamlit dashboard, illustrated in Figure 4, was developed to demonstrate user interaction.
The dashboard not only visualizes the current state of the supply chain KG, but it also enables key functionalities that support data-driven logistics decision-making; the following are examples:
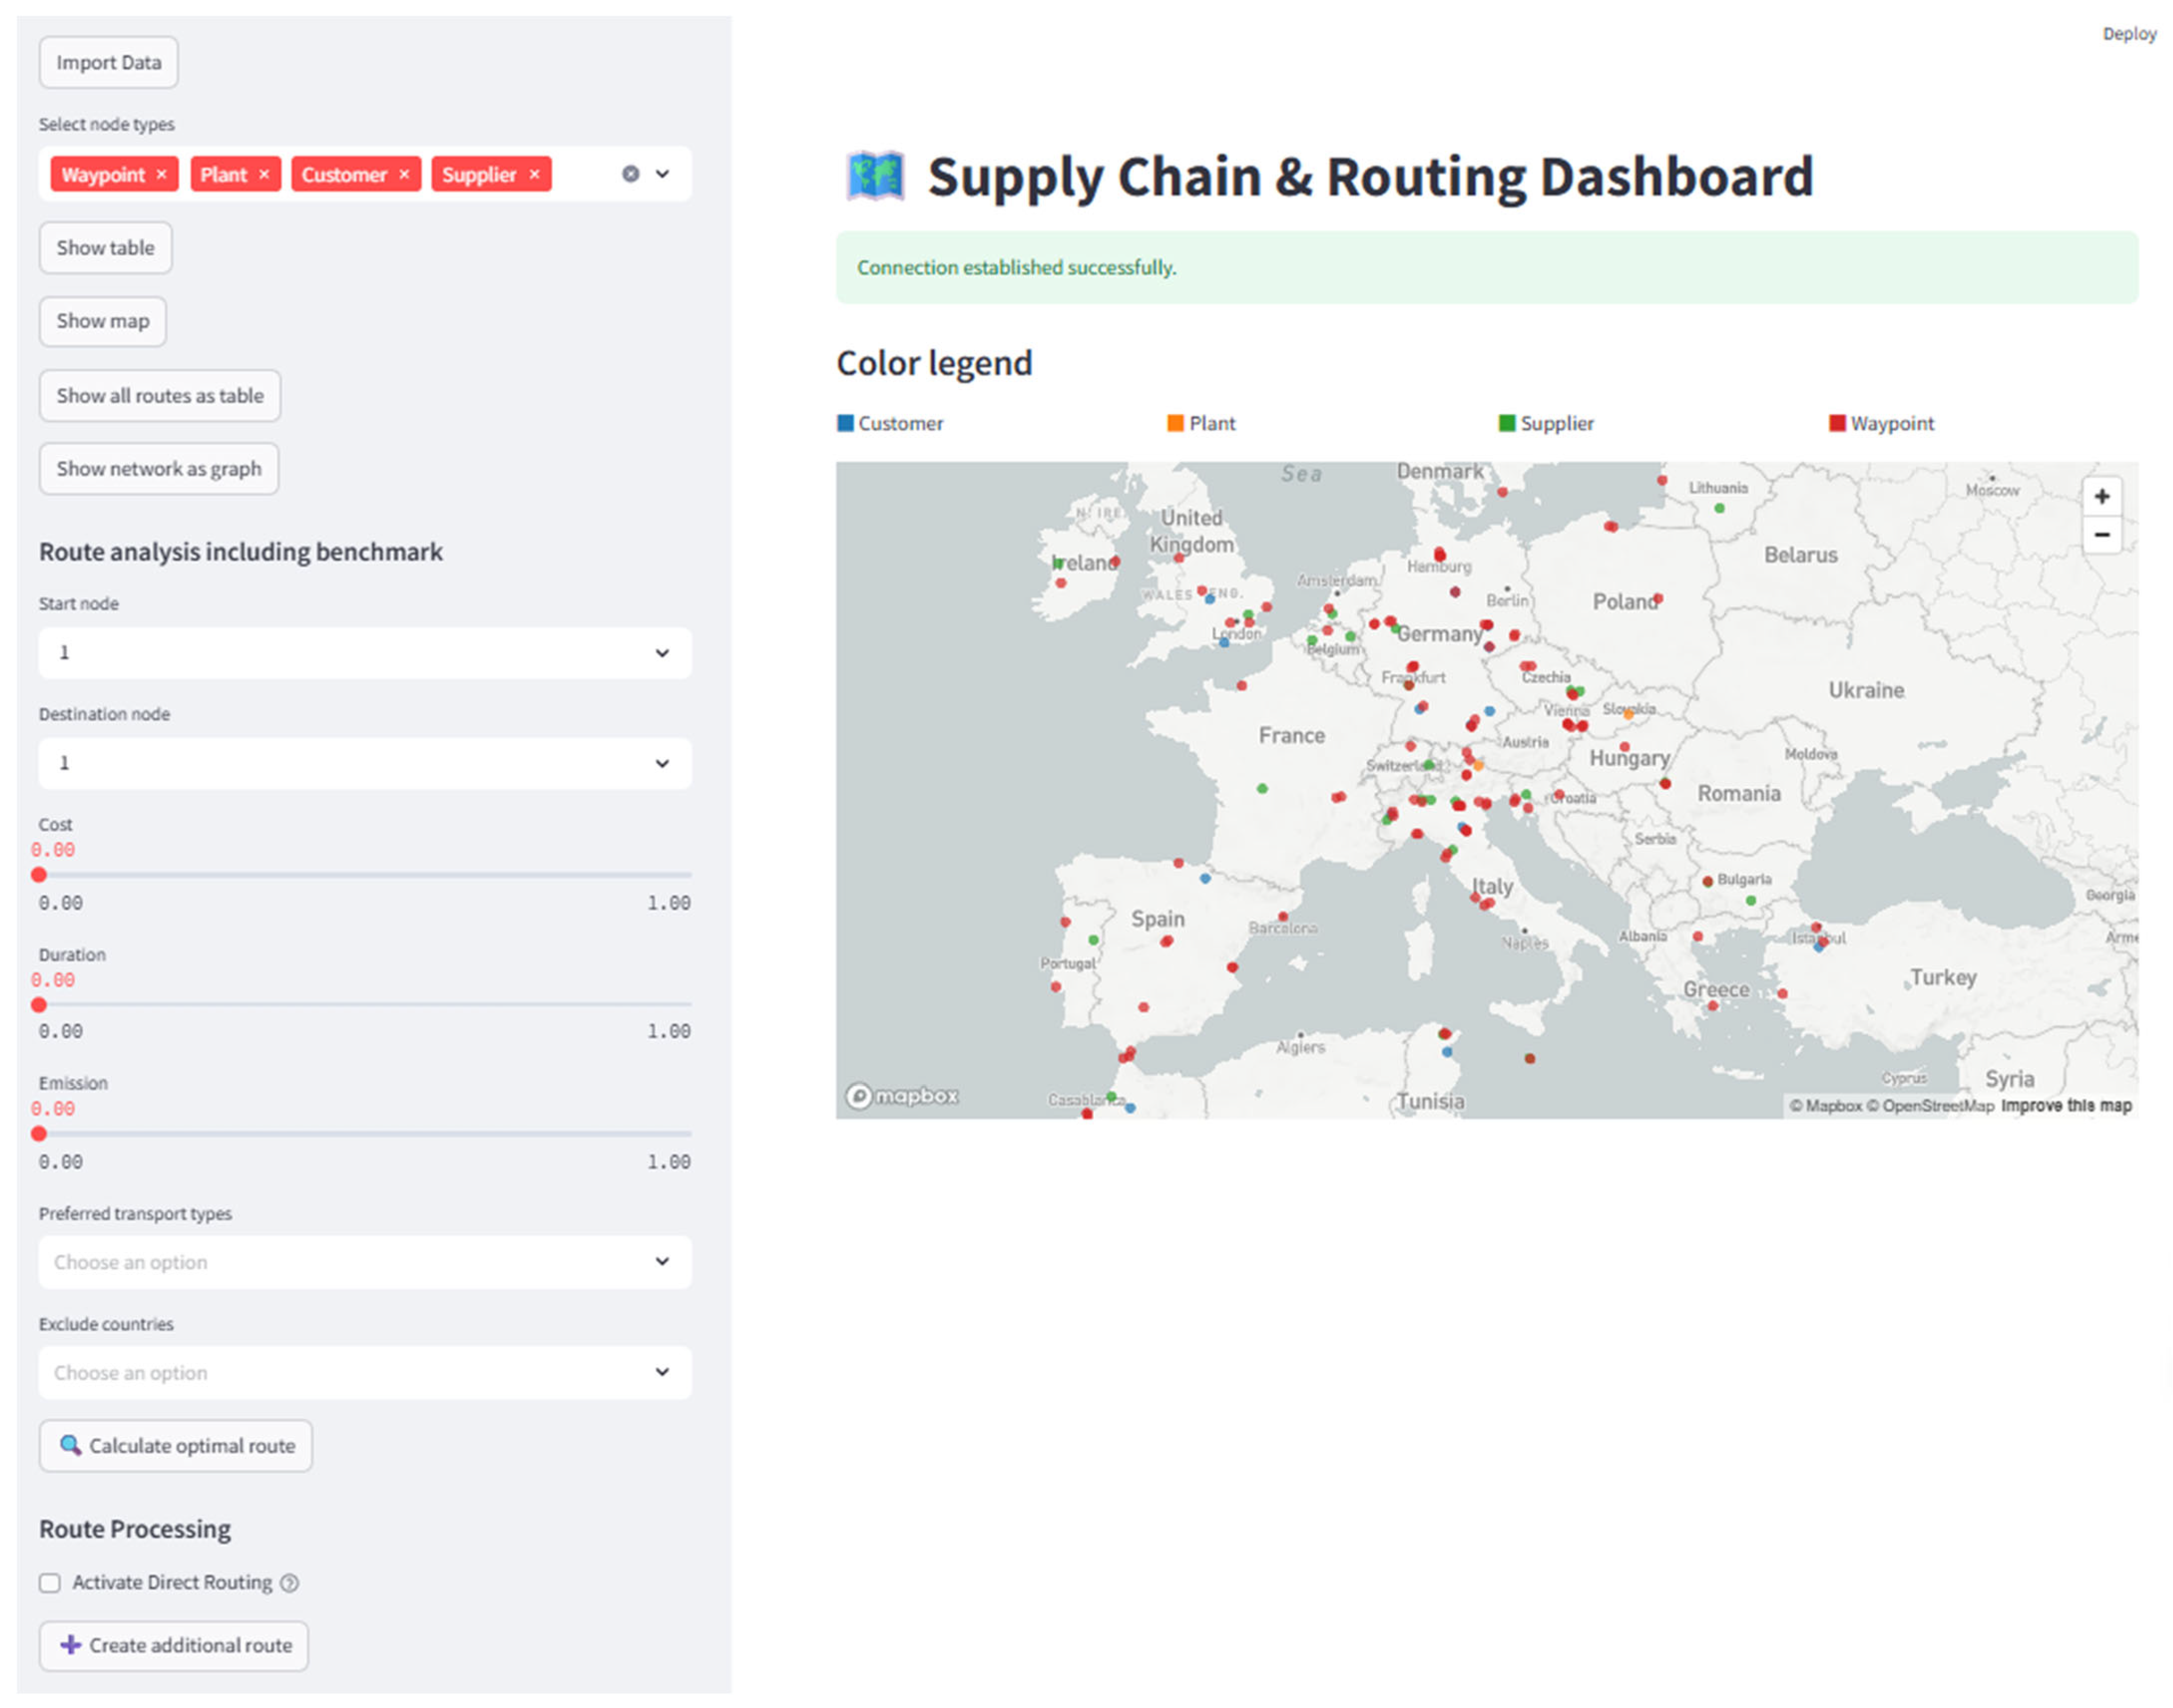
  • Import data enables the mass import of nodes, relationships, and predefined routing demands. The user can trigger the full orchestration process with a single action.
  • Create additional routes that allow on-demand route creation for a user-specific start–end combination, using the orchestration process.
  • Visualize graph content offers both a dynamic network graph and a georeferenced map to explore entities and transport connections.
  • Route analysis and benchmarking leverage the SELECT task to find the best route between two selected nodes. Users can define custom preferences (e.g., exclude nodes in specific countries, prioritize certain transport modes) and compare routing alternatives across criteria such as cost, time, and emissions.
This interactive dashboard operationalizes the IAES concept by demonstrating how the enriched transport graph data can be made visible, actionable, and decision-relevant.

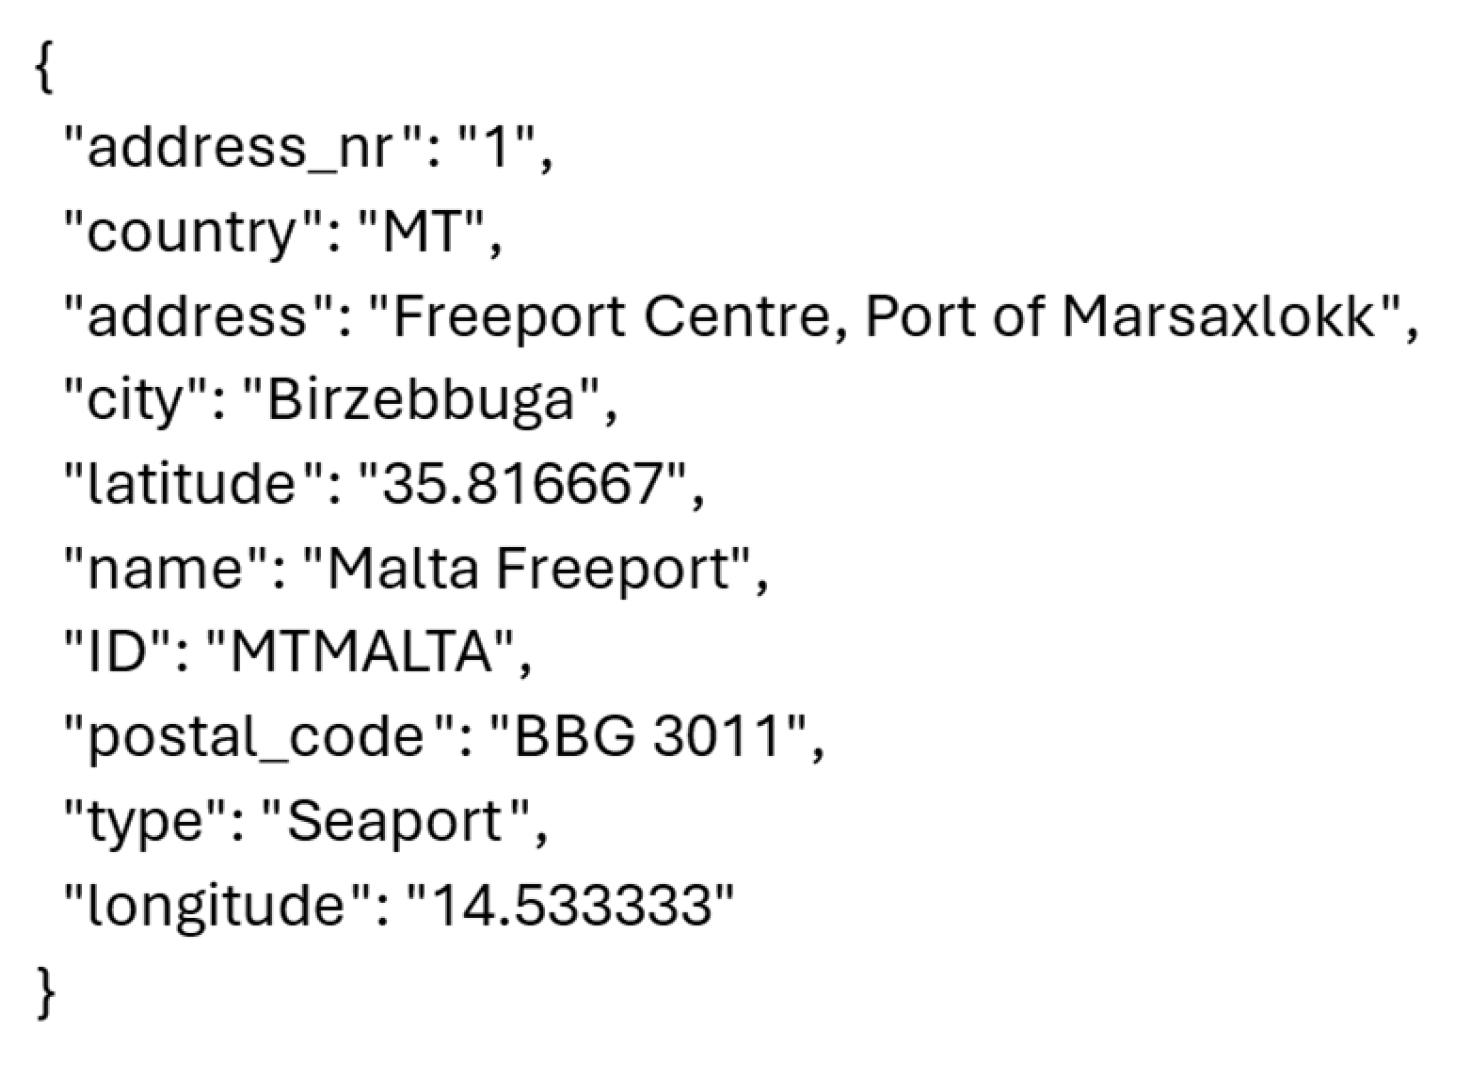
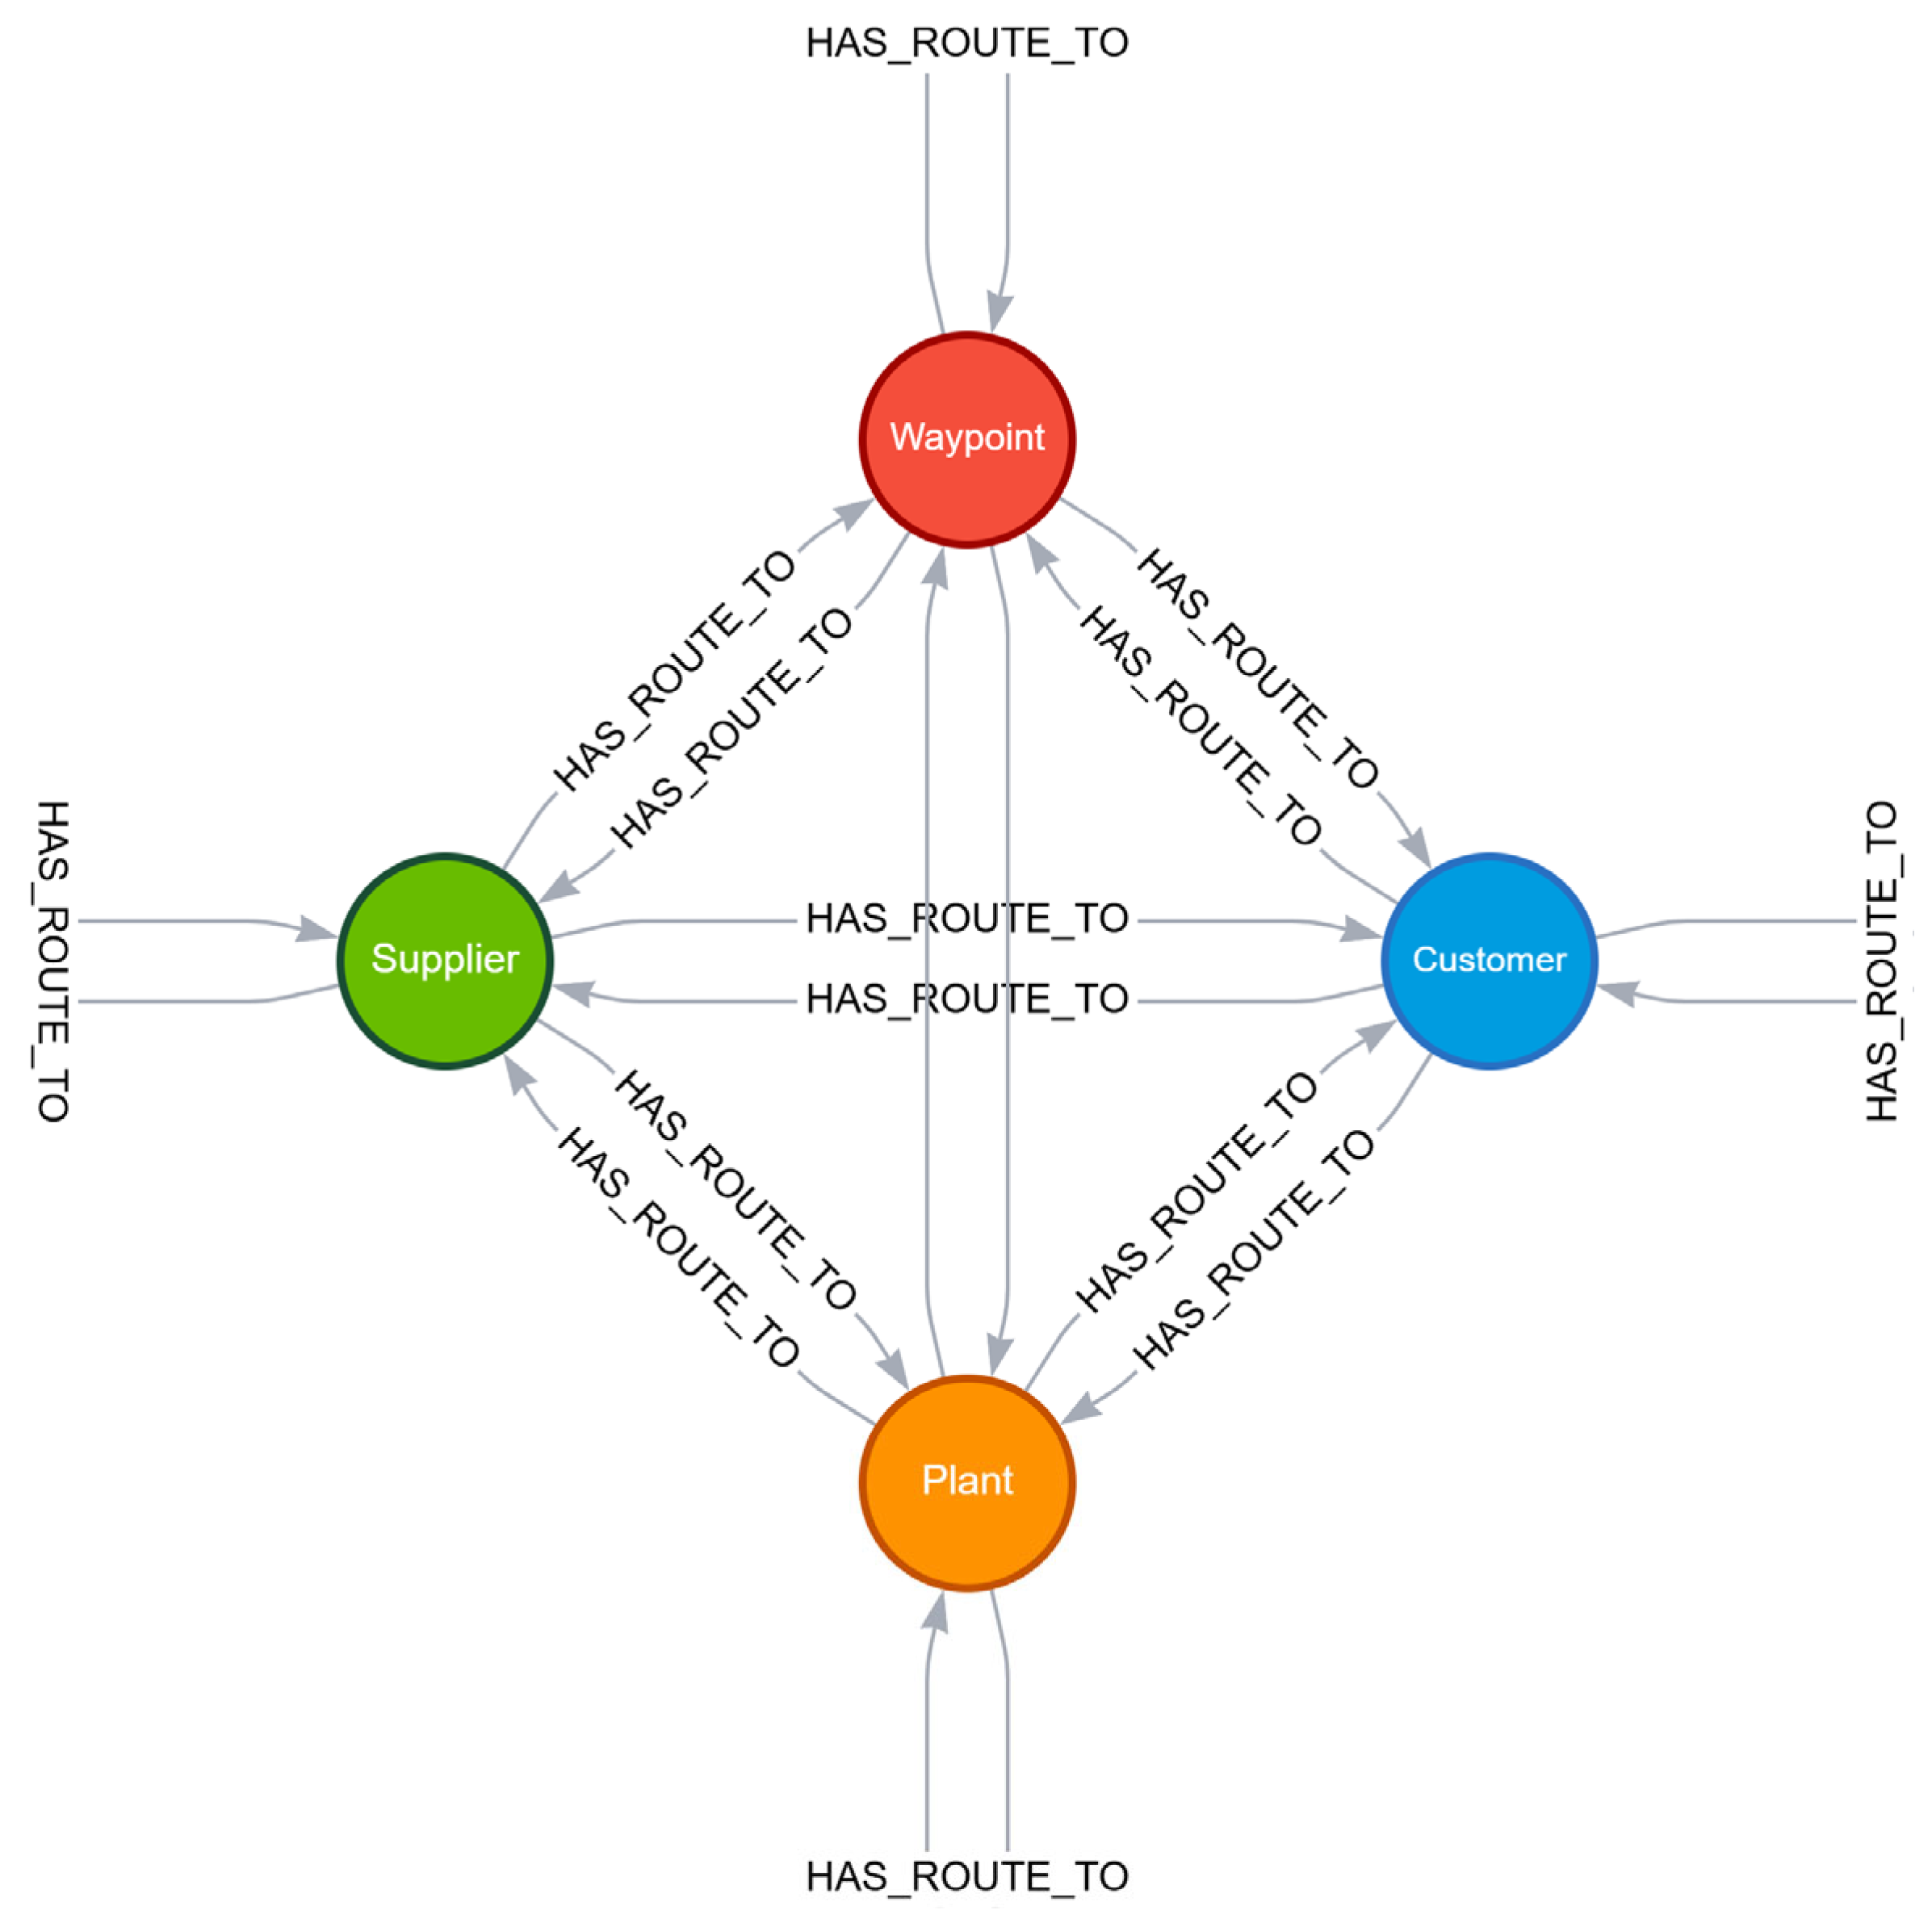
3.3. Knowledge Graph Ontology

To enable dynamic, connected multimodal supply chain routing, the IAES employs a property graph ontology within the Neo4j GDB. This ontology serves as the semantic foundation for representing logistical entities, their relationships, and the transport characteristics required for analysis and/or optimization. The ontology models the supply chain as a directed KG (schema visualized in Figure 5), where the following is relevant:
  • Nodes represent logistical entities (e.g., plants, suppliers, customers, and waypoints).
  • Relationships (HAS_ROUTE_TO) represent directional transport links between these nodes, enriched with logistical and environmental metadata.
The ontology defines a set of core node labels, each representing a category of logistical roles within the supply chain. Table 4 summarizes the node labels used in the actual ontology.
Each node contains standardized descriptive and geospatial attributes called properties, outlined in Table 5:
Each directed relationship (route) between two nodes captures a transport connection and includes the properties shown in Table 6.
This semantic structure enables the application to reason over the network, identify missing or suboptimal links, and calculate logistics performance metrics. Moreover, the ontology is extensible, supporting additional dimensions such as customs clearance times, load types, and multimodal dependencies. The KG-based ontology serves as the backbone of the IAES, linking route segments to specific entities and enabling automated routing and LCA evaluation at a high level of granularity. The ontology is inherently extensible, enabling the future inclusion of additional factors such as customs clearance times, handling constraints, goods types, or company-specific logistics rules. The ontology thus provides the structural foundation for automated supply chain modeling, performance analysis, and emission tracking.

4. Use Case

To empirically validate the IAES prototype, a semi-synthetic dataset based on a representative case study company from the automotive supply chain sector was used. The scenario was carefully anonymized and generalized to preserve confidentiality while maintaining technical relevance. This use case demonstrates the IAES’s capability to resolve incomplete multimodal routing problems in global logistics networks. The goal of this evaluation is to assess the application’s ability to generate structurally valid and contextually plausible multimodal routing chains using generative AI.

4.1. Experimental Setup

The test environment replicates the supply chain network of a multinational automotive components manufacturer specializing in small-sized automotive plastic parts. The starting configuration comprises the following:
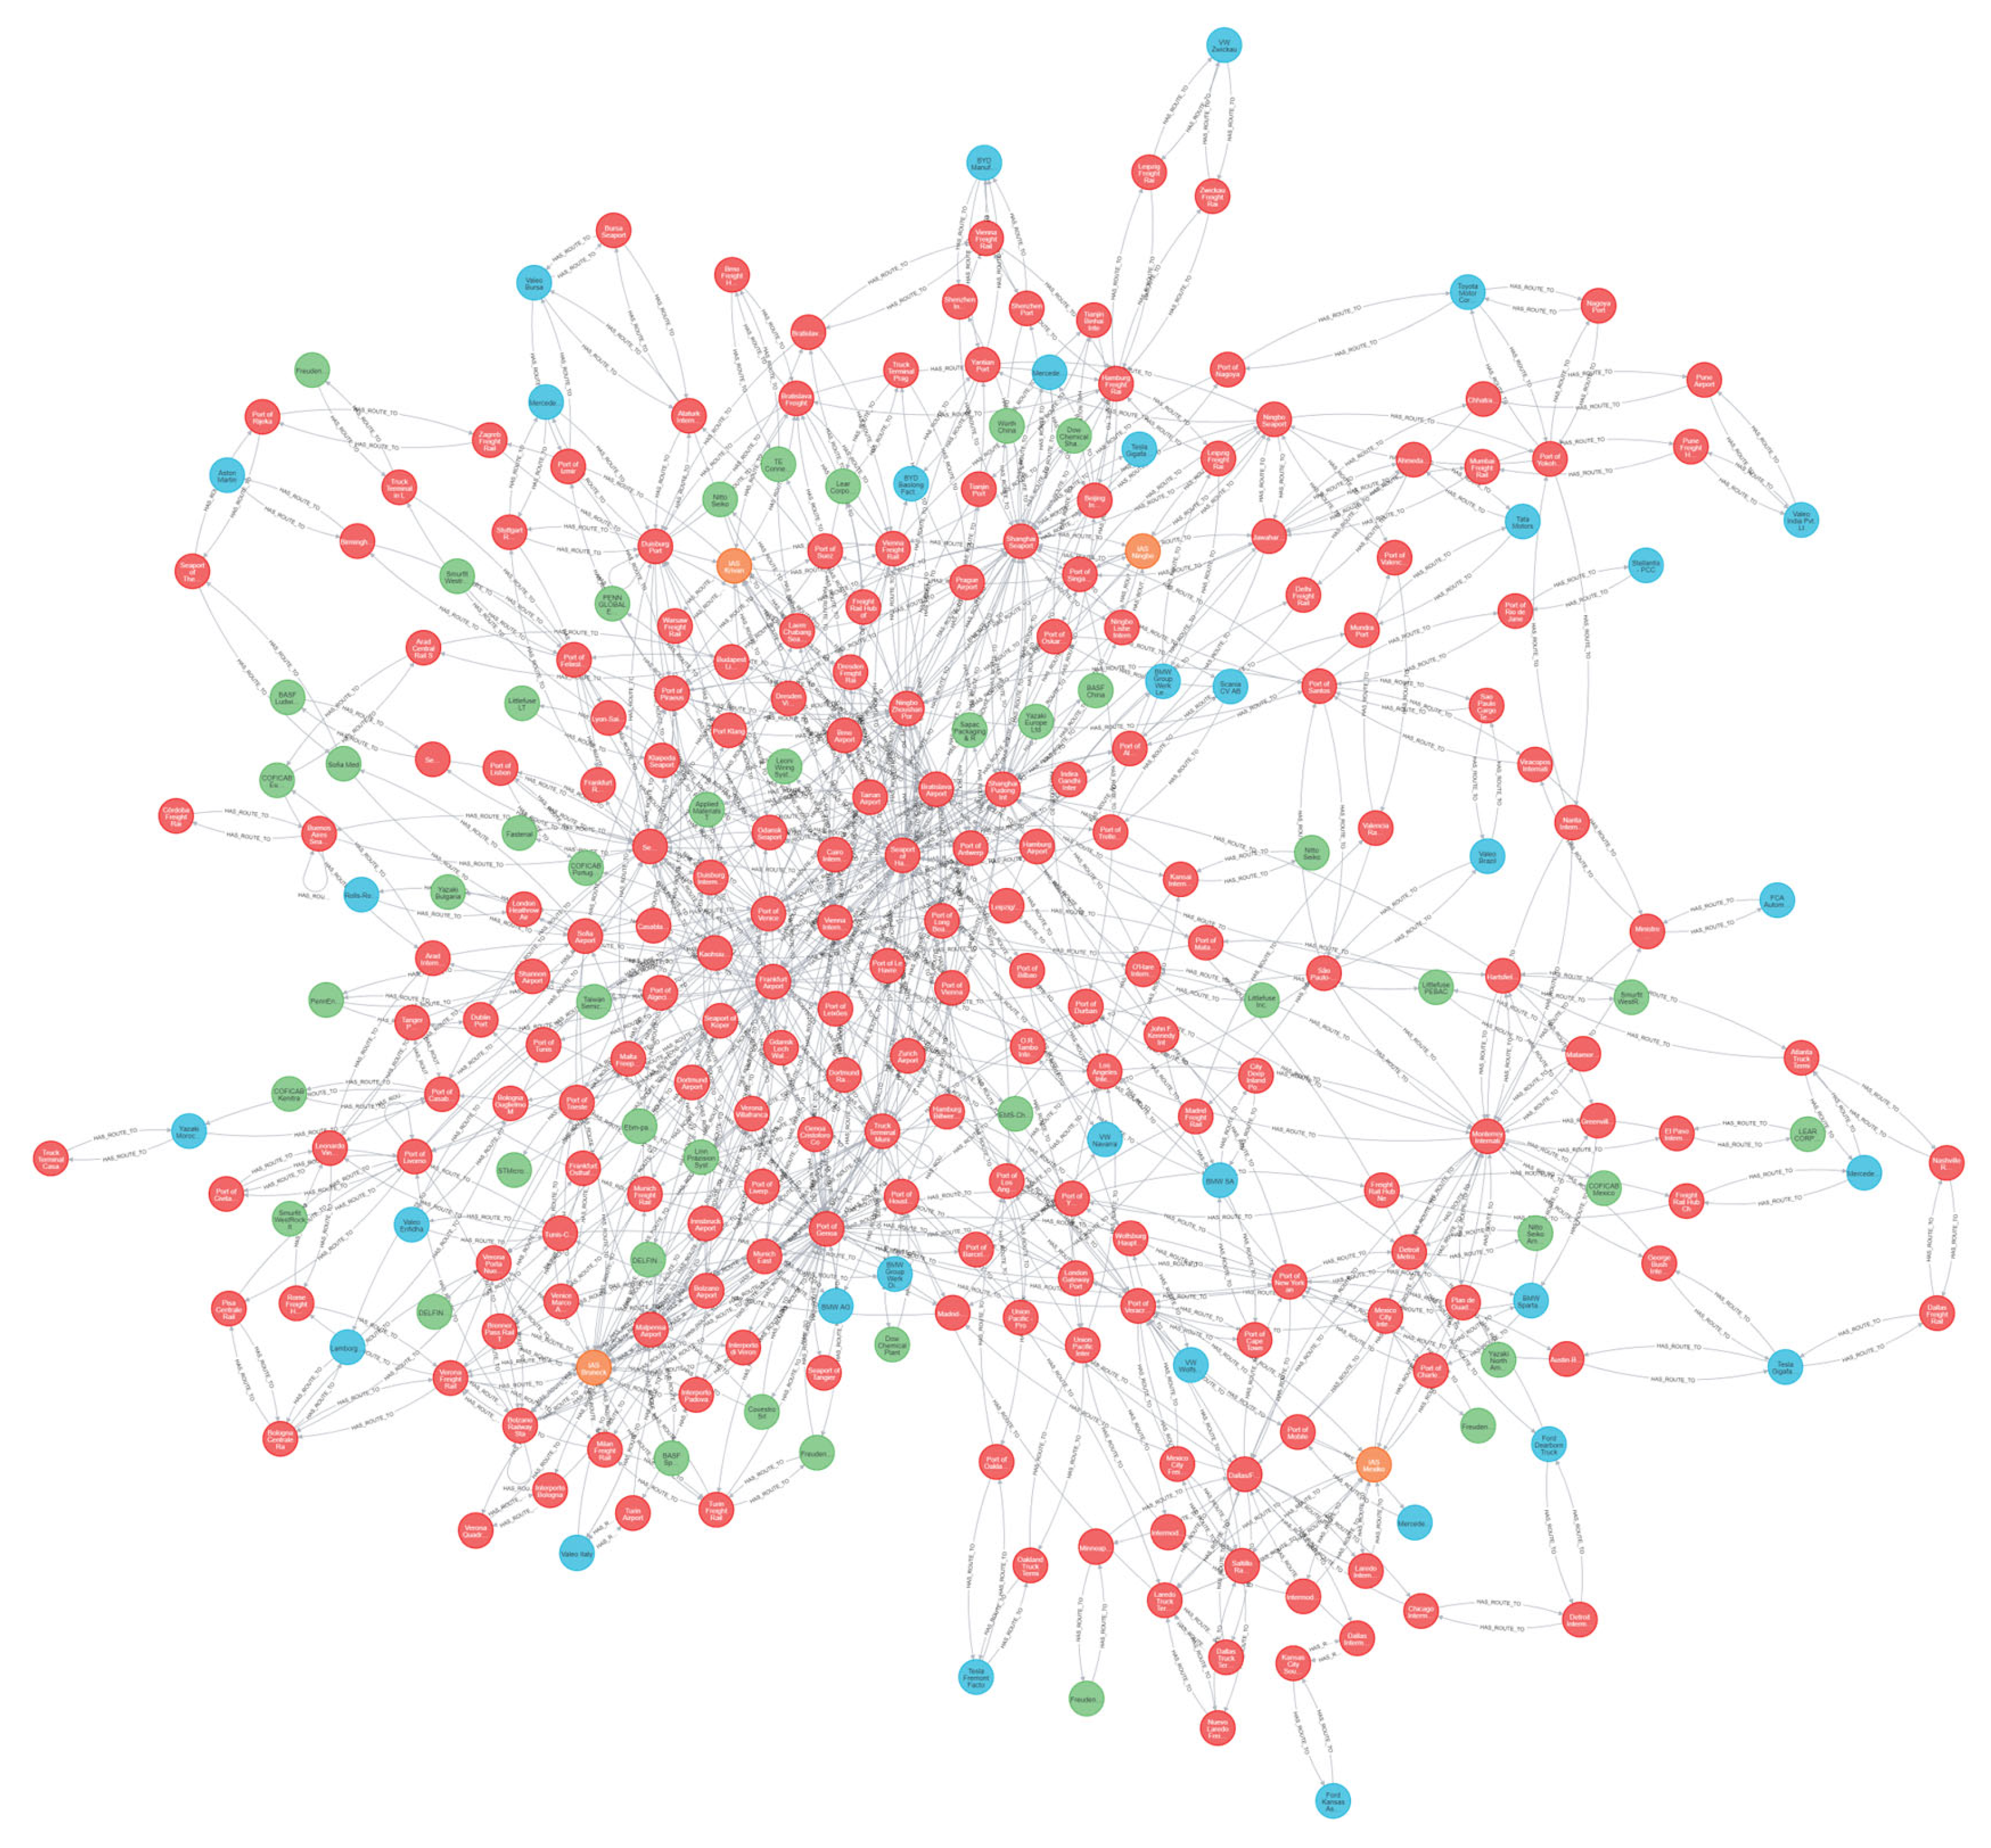
  • Four production plants located in Mexico, Italy, Slovakia, and China.
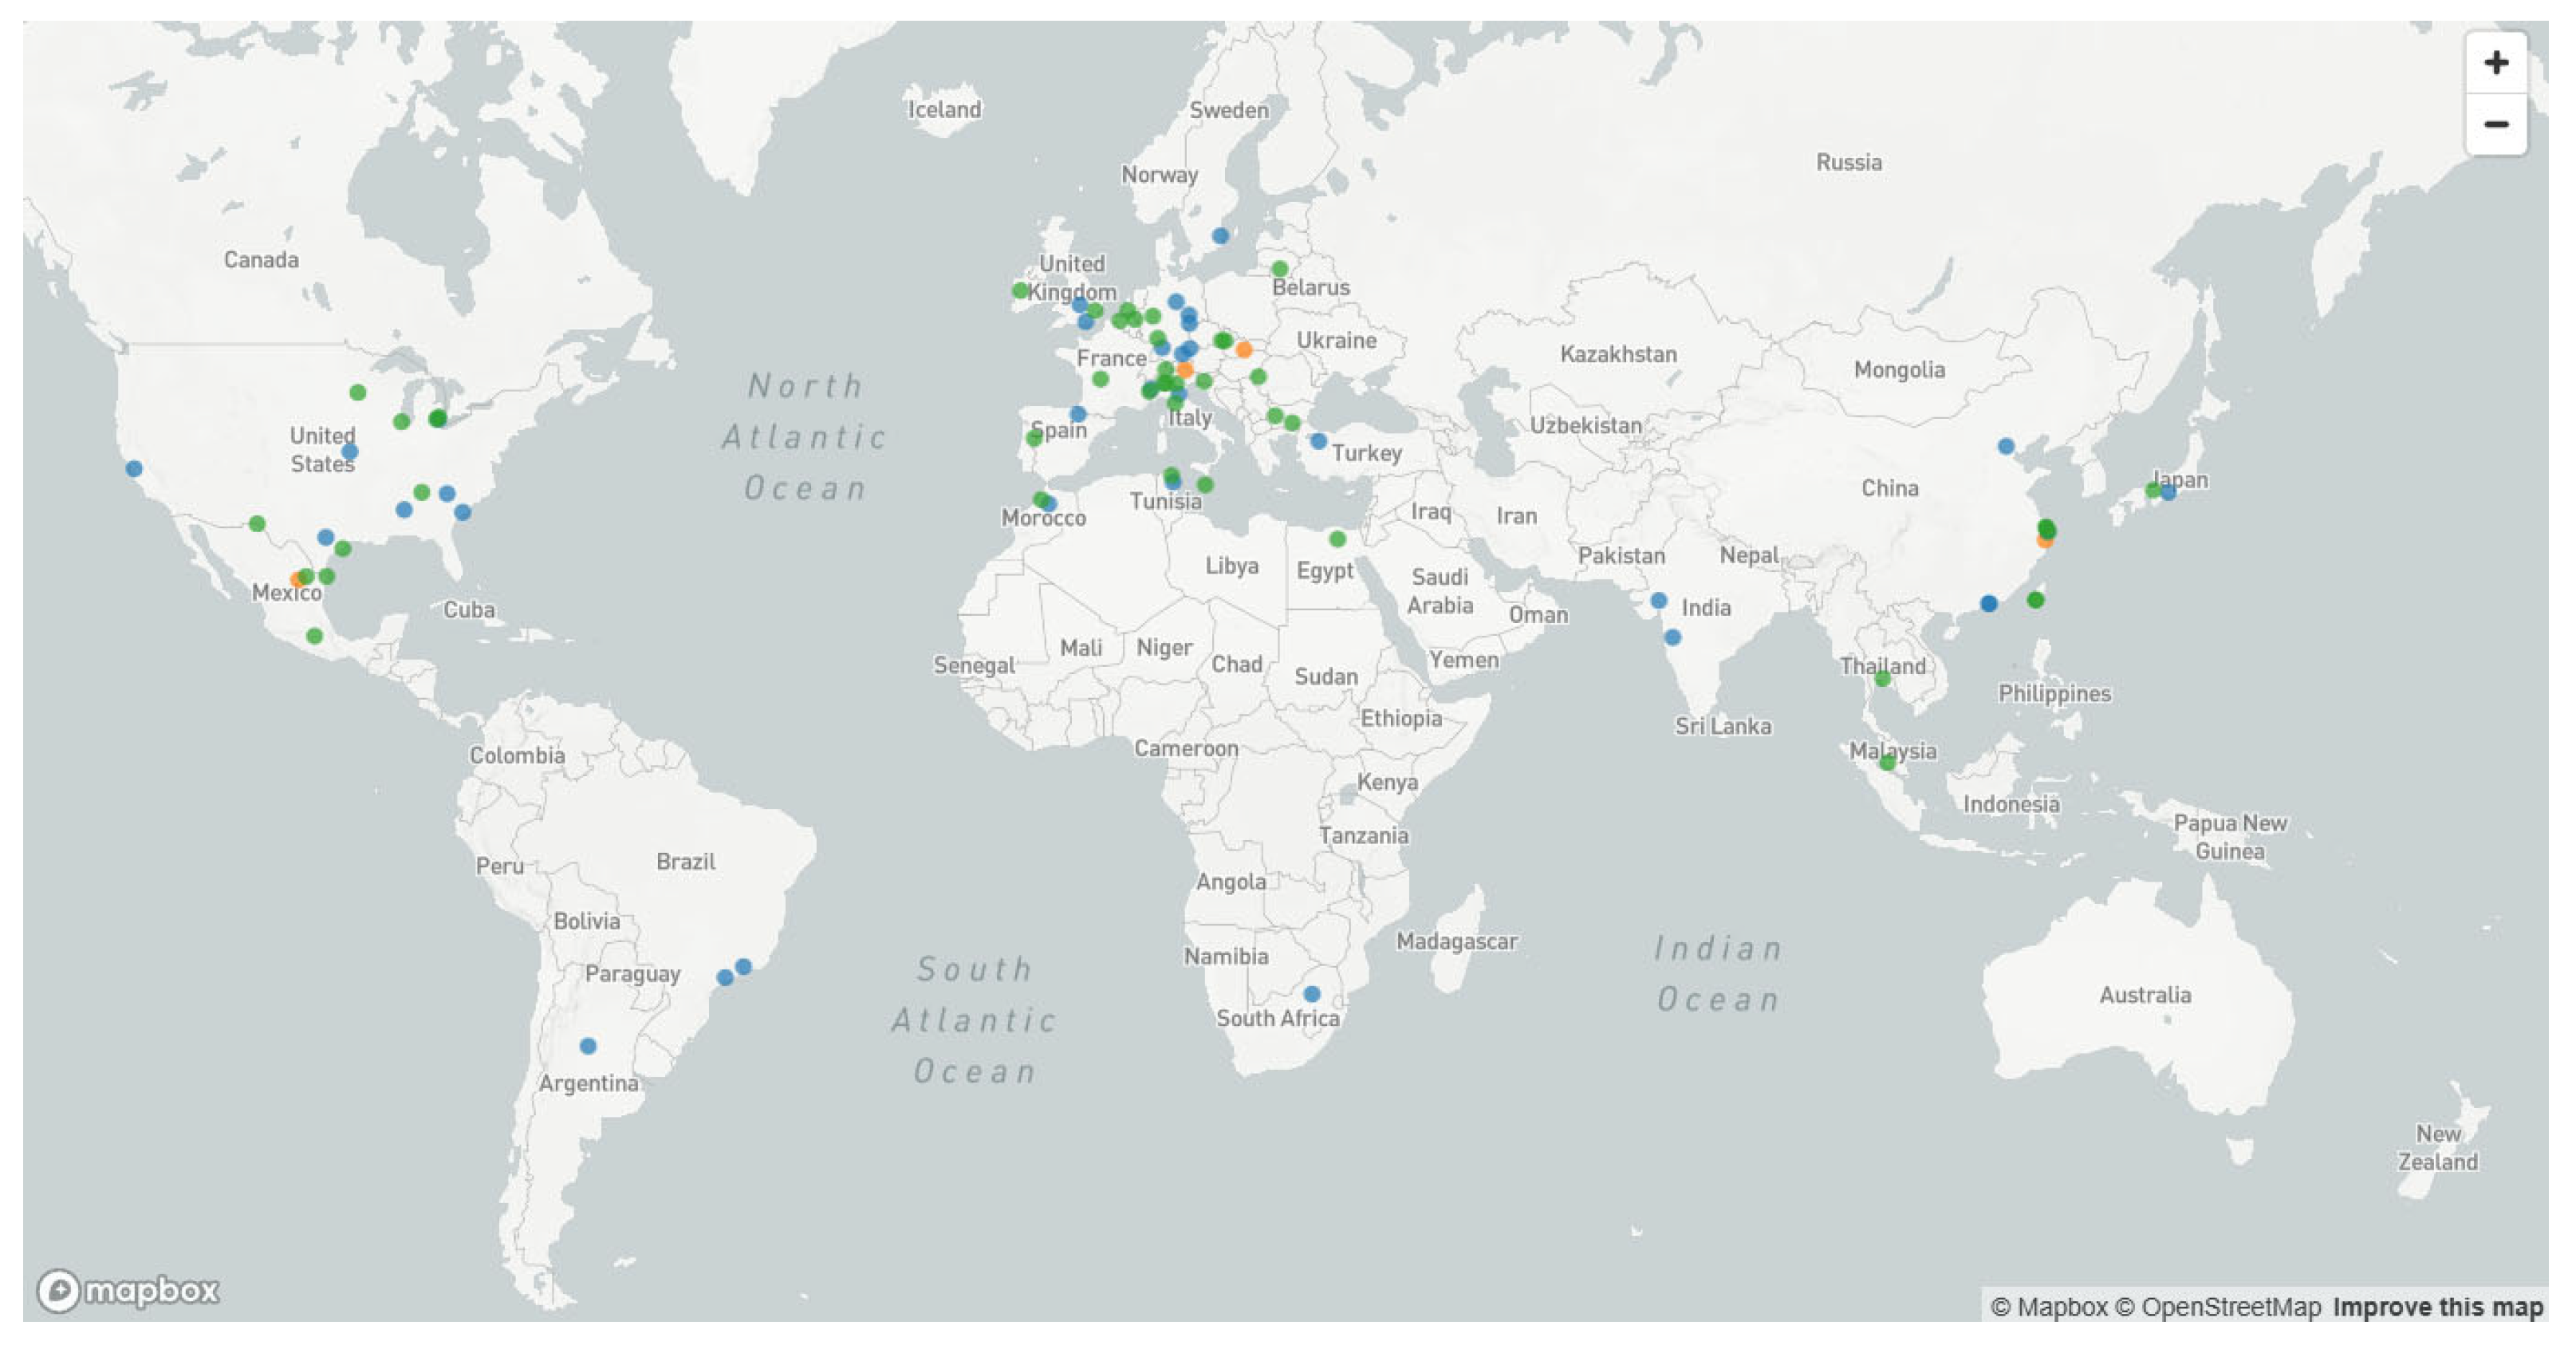
  • A total of 77 supply chain entities (suppliers and customers) spread across North America, Europe, Africa, and Asia, as visualized in Figure 6.
  • A total of 200 needed routes representing logistical connections required for optimal supply chain operation between plants, suppliers, and customers.
  • Two waypoints to give the LLM an idea of how the waypoints should look.
  • Two routes to give the LLM an idea of how the routes should look.
The dataset was prepared utilizing standardized Excel templates and was subsequently imported through the application’s GET module interface. The complete data enrichment pipeline, comprising three sequential phases (ANALYZE → ENRICH → STORE), was initiated via the dashboard interface. The import procedure employed a batch processing methodology to ensure systematic data integration. Each processing cycle incorporated 25 newly generated route pairs, with the complete dataset processed across eight discrete execution runs (200 total routes). This batch-based approach was implemented to the facilitate comprehensive monitoring and validation of the enrichment process at manageable intervals. As specified in Section 3.2, the automated evaluation framework was exclusively implemented for the road transportation mode. The primary objective of this implementation focuses on validating the core conceptual framework rather than assessing the precision of individual route metrics generated by the RouteEvaluator component. This approach allows for proof-of-concept validation while maintaining analytical focus on the fundamental application architecture and data processing capabilities.

4.2. Results and Validation

The IAES prototype was executed in a controlled test scenario simulating the multimodal transport network of an anonymized automotive supplier. A total of 200 missing transport routes were provided as the input, and the full enrichment pipeline was applied. All required route requests were fulfilled successfully, with no direct routing applied. The prototype, as shown in Figure 7, dynamically generated 996 routes (accounting for both A → B and B → A paths), connecting 281 supply chain nodes.
The validation of the generated waypoint nodes was conducted through a manual review using geographic maps and internet research. Each node was evaluated against two criteria:
  • Existence: whether the proposed logistics facility is a real, identifiable location suitable for cargo transport.
  • Location accuracy: whether the coordinates place the node within a valid proximity (defined as ≤1 km) of its official location.
Table 7 summarizes the results across the main waypoint categories: airport, seaport, freight rail hub, and truck terminal. Only nodes generated by the application (excluding fixed supplier, customer, or plant entries) were included in the evaluation.
The prototype demonstrated excellent accuracy for airport infrastructure, with all 61 nodes correctly matched both in terms of existence and location. This result reflects the high availability and clarity of airport-related data in public databases and the LLM’s strong ability to interpret such structured sources. In contrast, seaport nodes, while also exhibiting a high existence validation rate (97.1%), showed significantly lower spatial accuracy. Only 50.7% of the ports were geolocated within the 1 km threshold. This discrepancy is likely due to the complex geographic boundaries of port areas, which may span wide waterfront zones with multiple terminals. The lowest positional accuracy was observed among freight rail hubs, where only 11.5% of valid entries were located correctly. Although 80.3% of these nodes were confirmed to exist, the high spatial deviation suggests a limitation in the LLM’s ability to resolve rail-specific logistics sites—potentially due to inconsistent naming schemes or sparse public datasets on inland rail terminals. Truck terminals presented a mixed outcome: 77.8% of generated nodes corresponded to real locations, yet none were within the desired accuracy threshold. This suggests either imprecise geocoding by the LLM or poor distinguishability of logistics-related truck facilities in urban areas. Despite these limitations, it is noteworthy that all evaluated nodes were placed in the correct city and country, which confirms the semantic reliability of the LLM-enriched routing application. Most errors were related to intra-urban coordinate placement rather than broader geographic misclassification.
The IAES prototype generated a diverse set of intermediate waypoints across the globe. An analysis of node centrality (the number of inbound and outbound route connections) reveals a strong concentration around key multimodal hubs. As shown in Figure 8, the top 15 most-connected waypoints acted as major intermodal transit points, often bridging continents or modes.
This distribution supports the hypothesis that the LLM-generated network structure adheres to real-world multimodal transport hierarchies. It also validates the IAES application’s ability to reuse shared waypoints across routes, thereby reducing redundancy and improving connectivity.
As mentioned before, the IAES application generated a total of 996 transport routes. The modal split of the enriched routes illustrates the IAES’s capacity to generate plausible multimodal chains. As expected, road transport dominated the dataset, serving as the default fallback in the absence of a viable intermodal infrastructure. However, the prototype successfully inferred 226 sea routes, 190 air connections, and 143 rail routes, highlighting its capability to match context-sensitive modal options based on geographic and infrastructural cues.

4.3. Observed Anomalies

Beyond quantitative metrics, a qualitative evaluation of the enriched transport routes was performed to identify typical system-level errors, modality mismatches, and correction patterns. The IAES application exhibited some edge cases during route enrichment, which were analyzed in detail for future improvements:
  • Structural anomalies: A total of six self-loop routes were identified, where the starting and ending nodes were identical (A → A). These are typically unintended and indicate either a geocoding fallback failure or incorrect source-to-destination mapping. These routes do not negatively affect subsequent graph operations.
  • Mode-to-node mismatches: Several semantic mismatches between the mode and waypoint type were detected. Twelve bidirectional air routes were incorrectly initiated from locations classified as seaports. A prominent example is the case of the Port of Newark, where the generated waypoint shares coordinates with New York International Airport. While the geographic location is technically accurate due to the spatial overlap of port and airport facilities in major logistics hubs like New York, the assigned waypoint type was semantically incorrect. The LLM classified the node as a seaport, yet assigned air as the transport mode. This mismatch illustrates the need for more precise type validation logic beyond coordinate proximity alone. Additionally, two bidirectional rail routes originating from customer nodes were identified as using rail transport. Upon manual verification using Google Maps, this assignment appears valid, as the customer locations indeed have direct railway connections.
  • Incorrect node reuse and name-based confusion: In 12 cases (pairs), routes were assigned between one incorrectly named and classified waypoint (e.g., “Truck Terminal Munich” was in reality “Airport of Munich”). This problem is based on incorrect localization by the LLM for road waypoints, which in the SourceSearcher later matched with the wrong location due to a proximity-based distance match.
  • Planner-based correction for modality conflicts: In two notable cases (pairs), the route planner suggested the mode “River” for inland nodes (e.g., “Bratislava Seaport”). In this case, the RoutePlanner suggested the mode correctly after the SourceSearcher (LLM) recognized that Slovakia is a landlocked country and responded that no valid waypoint could be generated and changed the mode type to river.
  • Location-based filtering: Another 12 routes pairs were removed due to coordinate errors, typically when the generated node could not be geolocated within a valid proximity to known transport infrastructure. These were flagged and discarded during the post-enrichment validation step.

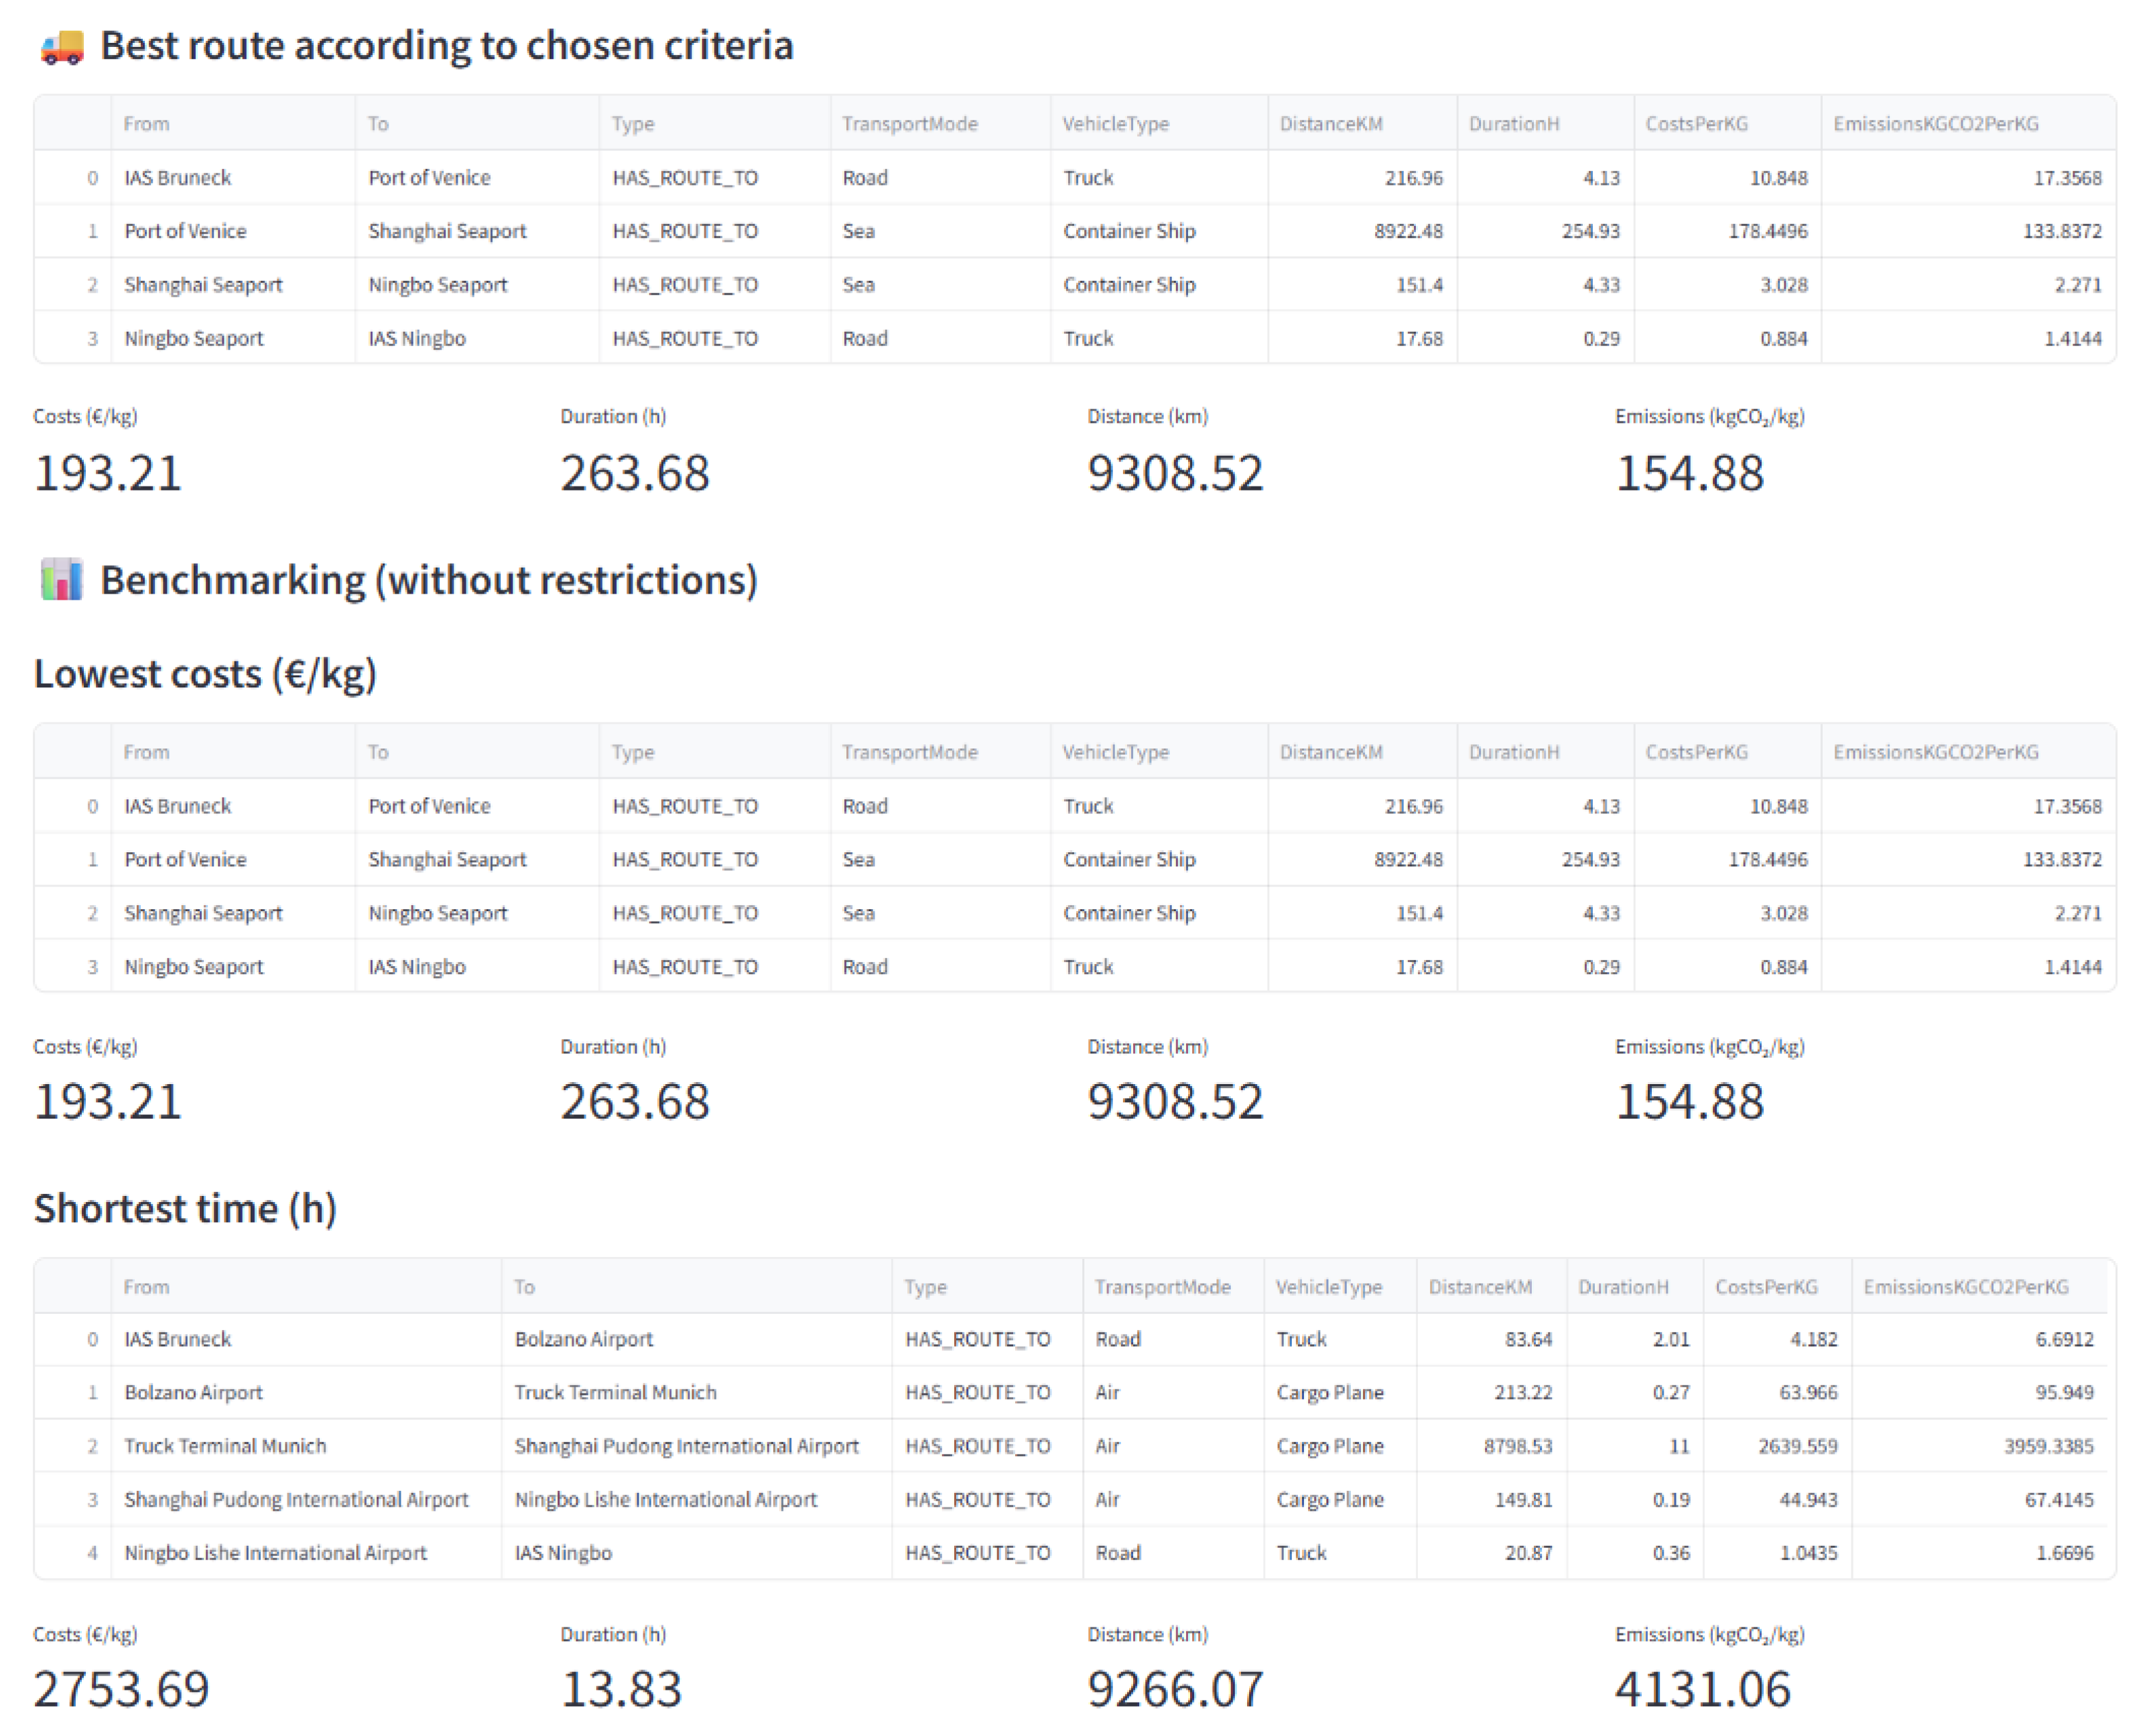
4.4. Strategic Benchmarking of Sustainability Options

To demonstrate the strategic decision-support capabilities of the IAES application, the enriched KG was queried to identify the best route between two production plants. The benchmark analysis focused on three scenarios: (1) the minimization of carbon emissions, (2) the minimization of costs, and (3) the minimization of duration.
As illustrated in Figure 9, the route optimized for cost and emissions (154.88 kgCO2/kg) followed a classic intermodal configuration: road → sea → sea → road. This path represents a plausible, low-carbon option leveraging high-volume maritime transport. In contrast, the fastest route utilized an air-focused multimodal chain, achieving a total duration of only 13.83 h. However, this gain in time came at a significant cost: 2753.69 EUR/kg in transport cost and 4131.06 kgCO2/kg in associated emissions. However, the input data used for this test case was based on semi-realistic values.

5. Discussion

The hybrid IAES prototype demonstrates effectively how generative AI and KG-based modelling and optimization can be combined to create supply chain networks. This hybrid application can dynamically and autonomously construct a transport network from fragmented inputs. The enriched KG is decision-ready, and optimal routes can be selected. Additionally, the application effectively demonstrates the powerful collaboration between the methods of AI and Operations Research (OR). From the AI side, LLMs (GPT4) were used to generate plausible intermediate waypoints and routes, which are then stored in a GDB (Neo4j). Finally, KG-based optimization algorithms such as Dijkstra help to identify the best paths according to the chosen criteria (e.g., cost, emissions, or duration). In this configuration, the LLM supplies creative solutions, while OR provides precision, making their combination well-suited for logistics applications. In effect, the application separates “creation” from “selection”: one component generates route options, the other identifies the optimal solution based on the requested context.
The results illustrate how IAES enables explicit trade-offs in strategic sustainable routing. In the example dashboard below, the carbon-optimal path (road → sea → sea → road) emitted only 154.9 kgCO2/kg, whereas the fastest path took 13.8 h at a much higher cost (2753.69 EUR/kg) and emitted 4131 kgCO2. These results align with prior studies like Bayramoğlu et al. [37] and show that the prototype can automatically benchmark and compare emission-, cost-, and time-optimized alternatives. In our automotive case study, processing 200 missing transport demands produced 996 enriched legs connecting 281 graph nodes. The assembled network included 437 road, 226 sea, 190 air, and 143 rail connections (a plausible modal split), and node-centrality analysis confirmed that the 15 most-connected waypoints were major global hubs (large seaports or airports). Through this, the application empowers decision-makers to simulate different logistics scenarios, such as prioritizing low-carbon rail segments, excluding specific countries due to geopolitical risk, or additionally minimizing mode-switching to reduce delays. By quantifying these differences, IAES makes trade-offs visible and actionable for SME’s, which helps to increase both sustainability and resilience [32]. In summary, the IAES not only completes missing routes via LLM prompts but also builds them into a coherent network that can be queried under varied constraint sets.
Another important finding is that the KG grows organically over repeated use, like assembling a LEGO structure piece by piece. Each request for a new route could contribute new waypoints or new links. As more requests are processed, the supply chain KGs become increasingly more complete, but also more reusable and robust. Additionally, nodes representing new suppliers, customers, or plants can easily be docked onto the existing structure, and previously added routes can be reused or reoptimized. This cumulative growth makes the IAES not only a planning tool but also a knowledge base of transport connections. Even previously unused routes or unused intermediate points, enriched by the LLMs, can become part of a new optimized connection. For example, a seaport that was only part of one route in the beginning may later serve as an intermediate waypoint in completely different transport paths. This validates the conceptual framework: the static ERP-derived nodes are transformed into a dynamic supply chain KG, where each additional connection is akin to adding another LEGO block to the structure. Over time, even a modest number of queries built a sizeable multimodal network, enabling complex, emergent routes. The LLM also showed strong capability to deal with unreal inputs. When asked to create a route from a node to itself, it responded appropriately: “Since the start and destination points are the same, no transport is needed. The cargo is already at its destination.” This demonstrates that the combination of prompt design and model capability can deliver meaningful context-aware responses and offer a highly flexible and adaptable alternative to hardcoded logics [38].
Nevertheless, several limitations were identified, starting with the LLM’s waypoint quality varied by the transport mode. Airport waypoints were perfect (100% existed and were correctly placed), but seaport waypoints often had errors (only 50.7% were accurately geolocated, even though 97.1% corresponded to real ports). Inland hubs were worse: freight-rail suggestions were 80.3% valid but only 11.5% correct in position and truck-terminal suggestions were 77.8% valid but 0% correct. This issue not only affects accuracy but also has an impact on the route logic. Incorrectly placed or mismatched terminals can lead to implausible mode sequences (e.g., air freight from an inland village) or also self-loop paths (A → A). It was also observed that the LLM’s outputs lacked diversity. Identical prompts often returned very similar answers, which indicates low variability (LLM parameter temperature = 0.3) in the planning step. Increasing the temperature or altering prompts could improve variety, but on the other hand, could also increase the risk for hallucinations and the generation of implausible outputs [39,40]. Repeated LLM responses can limit the expansion of the network and reduce flexibility in route benchmarking. Prompt engineering or validation could help to increase the variety without sacrificing, even when keeping the same parameters. Another practical limitation is that the prototype only integrates a true routing API for the road mode. Sea, air, and rail segments currently use heuristic calculations, so the values for distances, costs, and time are only approximate. Finally, the current application treats all cargo generically. It does not account for product-specific constraints (e.g., refrigeration, dangerous-goods restrictions) or carrier-specific rules, which would be needed for a fully realistic deployment.
The limitations demonstrate that there are clear points for improvement. Integrating authoritative mode-specific routing services would enhance accuracy. For example, a marine route API or airline schedule database could supply real ocean/air distances and emissions. It is also planned to leverage structured integration protocols to guide the LLM. For instance, implementing the open Model Context Protocol (MCP) would let the LLM query direct with databases or geographic information (e.g., waypoint information direct from Google Maps or OSR) in real time, grounding its answers [41,42]. In the current design, each LLM query is independent, so valuable feedback from previous queries is lost. A feedback loop could incorporate knowledge of the existing KG state into the prompts (or use reinforcement learning from graph rewards) so that the LLM becomes informed by what is already known, reducing redundancy or avoiding known invalid suggestions. On the KG side, additional automatic analytics could identify network gaps or critical nodes: for example, computing connected components or betweenness centrality would reveal dead ends or bottlenecks. Over time, this accelerates the LEGO-like growth but also the quality of the network. The domain model should be enriched by including vehicle types and carrier constraints (fleet capacities, container sizes, shipping-line routes, etc.) so that planned scenarios respect real-world operational limits. Exception handling and error recovery also remain as ongoing priorities. Planned enhancements include direct feedback from the Evaluator to the LLM using retrieval-augmented generation (RAG) architectures, as well as human-in-the-loop route suggestion validation to further improve data quality and the learning capabilities of the application.
Strategically, the IAES enables advanced sustainability and resilience analyses for supply chain networks. The enriched multimodal KG can feed directly into LCA and regulatory reporting. Here, the IAES can automate the most laborious part by generating detailed shipment routes and their associated carbon footprints. In addition, the IAES opens the possibility for scenario-based simulations (e.g., “what if we shift 30% of shipments from air to rail?”) and can assist with risk assessment (e.g., route changes due to sanctions or port closures). It can also support logistics teams in strategic sourcing, such as comparing regional suppliers not just by cost but also by environmental impact or transport resilience. In essence, the IAES not only bridges data gaps but also becomes an interactive decision-support system for green supply-chain planning and policy evaluation.
This hybrid AI-KG framework demonstrates a scalable method for automating transport-route enrichment and optimization with sustainability objectives. By fusing generative LLM reasoning with KG-based optimization, the IAES effectively “bootstraps” a multimodal transport network from sparse inputs and quantifies trade-offs among cost, time, and emissions. The prototype results suggest that such an application could greatly reduce manual effort in logistics data collection and provide rich insights for sustainable decision-making in complex manufacturing SME supply chains.

6. Conclusions

This paper introduces the IAES, a hybrid Python prototype for the autonomous enrichment of multimodal transport networks in supply chain applications that combines LLMs with KGs and graph-based optimization. In order to facilitate sustainable decision-making processes, the technique converts disjointed ERP inputs into logical, queryable transport knowledge graphs.
The prototype’s capacity to create more than 900 enriched transport linkages connecting international suppliers, manufacturing sites, and consumers was illustrated by an anonymous case study with data from the automotive industry. High accuracy for ports and airport waypoints was demonstrated by the validation findings. Nevertheless, limits in interior logistics infrastructure, specifically for freight rail and truck terminals, were exposed. The benchmarking validated THE IAES’s capacity to facilitate explicit trade-offs between economic and ecological objectives.
By automating realistic route data, the IAES methodology provides significant benefits for supply chain digitization, especially for LCA calculations. The lack of constraint integration specific to products or carriers, limited mode-specific API support, and decreased route diversity due to deterministic LLM outputs were identified as limitations. These constraints will be addressed in future work by expanding the domain ontology, integrating more specific data sources, and implementing additional technology such as MCP or RAG architecture. Adaptive LLM responses based on current graph states may be made possible via learning-based feedback systems. These advancements establish the IAES as a crucial component of AI-assisted applications that promote robust, resilient, and sustainable manufacturing SME supply chains.

Author Contributions

Conceptualization, M.F.; methodology, M.F.; software, M.F.; validation, M.F.; formal analysis, M.F.; investigation, M.F.; resources, M.F.; data curation, M.F.; writing—original draft preparation, M.F.; writing—review and editing, E.R.; visualization, M.F.; supervision, P.D.; project administration, M.D.M.; funding acquisition, M.D.M. All authors have read and agreed to the published version of the manuscript.

Funding

This research was co-funded by the Italian Ministry of Enterprises and Made in Italy under the measure “Development Contracts” (DM 31/12/2021), grant number: F/310087/01-05/X56 (START—SusTainable dAta dRiven manufacTuring).

Institutional Review Board Statement

Not applicable.

Informed Consent Statement

Not applicable.

Data Availability Statement

The data presented in this study are available on request from the corresponding authors. The data are not publicly available due to confidentiality agreements and the semi-synthetic modeling of operational scenarios. Access is possible for research purposes upon reasonable request and is subject to NDAs.

Conflicts of Interest

The authors declare no conflicts of interest.

Appendix A

Appendix A.1

This prompt template instructs the LLM in the RoutePlannerAgent:
“You are a logistics expert for global supply chains. Your task is to generate a realistic cargo goods transport route from location {start_label} to {end_label}. The route should be the most used, plausible, realistic, and feasible for cargo transport.
The route may include multiple segments and intermediate waypoints, but only the following are allowed as intermediate points: Seaports (Seaport), Airports (Airport—Cargo Hub), Freight Rail Terminals (Freight Rail Hub), Truck Terminals (Truck Terminal). Other types of waypoints must not be used. The waypoints may include real places, even if they are not currently in the Neo4j database. Changing the mode is time-consuming and should be minimized. Not all of the modes must be used.
Focus exclusively on cargo transport (no passenger routes). Each leg of the route must specify a transport mode (choose from: Air, Sea, Rail, Road).
Do not include vehicle types—that will be handled by a separate Route Evaluator Agent.
Answer format:
1.<Start> → <Waypoint1>: Mode = <>,
2.<Waypoint1> → <Waypoint2>: Mode = <>,
No point at the end of the last line.”

Appendix A.2

This prompt template instructs the LLM in the SourceSearcherAgent:
“You are a logistics and supply chain expert. Your goal is to find the realistic and true data from ONE logistics waypoint (JSON format) that would serve as an intermediate node named {end_label} located IN {city_country}.
The waypoint must match the current mode {mode_current}, and be suitable for cargo logistics. Allowed types: {types}.
The next leg of the route will be by mode {mode_next}, so your suggested waypoint must support a logical transition.
Return the result as a JSON object with these exact fields: {properties_template}.
Country must be ISO (e.g., DE, US, IT).
The name should be the official name without informations in brackets ().
Use plausible and official names and accurate geo data.”

References

  1. Adel, A. Future of Industry 5.0 in Society: Human-Centric Solutions, Challenges and Prospective Research Areas. J. Cloud Comput. 2022, 11, 40. [Google Scholar] [CrossRef]
  2. Spaltini, M.; Acerbi, F.; De Carolis, A.; Terzi, S.; Taisch, M. Toward a Technology Roadmapping Methodology to Enhance Sustainable and Digital Transition in Manufacturing. Prod. Manuf. Res. 2024, 12, 2298572. [Google Scholar] [CrossRef]
  3. Goel, A.; Masurkar, S.; Pathade, G.R. An Overview of Digital Transformation and Environmental Sustainability: Threats, Opportunities, and Solutions. Sustainability 2024, 16, 11079. [Google Scholar] [CrossRef]
  4. Javaid, M.; Haleem, A.; Singh, R.P.; Suman, R.; Gonzalez, E.S. Understanding the Adoption of Industry 4.0 Technologies in Improving Environmental Sustainability. Sustain. Oper. Comput. 2022, 3, 203–217. [Google Scholar] [CrossRef]
  5. He, B.; Bai, K.-J. Digital Twin-Based Sustainable Intelligent Manufacturing: A Review. Adv. Manuf. 2021, 9, 1–21. [Google Scholar] [CrossRef]
  6. European Sustainability Reporting Standards. Available online: https://finance.ec.europa.eu/news/commission-adopts-european-sustainability-reporting-standards-2023-07-31_en (accessed on 30 June 2024).
  7. Mazhar, M.U.; Domingues, A.R.; Yakar-Pritchard, G.; Bull, R.; Ling, K. Reaching for Net Zero: The Impact of an Innovative University-led Business Support Programme on Carbon Management Strategy and Practices of Small and Medium-sized Enterprises. Bus. Strategy Environ. 2024, 33, 6940–6960. [Google Scholar] [CrossRef]
  8. Afolabi, H.; Ram, R.; Hussainey, K.; Nandy, M.; Lodh, S. Exploration of Small and Medium Entities’ Actions on Sustainability Practices and Their Implications for a Greener Economy. J. Appl. Account. Res. 2023, 24, 655–681. [Google Scholar] [CrossRef]
  9. Zhang, Z.; Guan, D.; Wang, R.; Meng, J.; Zheng, H.; Zhu, K.; Du, H. Embodied Carbon Emissions in the Supply Chains of Multinational Enterprises. Nat. Clim. Change 2020, 10, 1096–1101. [Google Scholar] [CrossRef]
  10. ISO 14040:2006; Environmental Management—Life Cycle Assessment—Principles and Framework. International Organization for Standardization: Geneva, Switzerland, 2006.
  11. ISO 14044:2006; Environmental Management—Life Cycle Assessment—Requirements and Guidelines. International Organization for Standardization: Geneva, Switzerland, 2006.
  12. Rebitzer, G.; Ekvall, T.; Frischknecht, R.; Hunkeler, D.; Norris, G.; Rydberg, T.; Schmidt, W.-P.; Suh, S.; Weidema, B.P.; Pennington, D.W. Life Cycle Assessment. Environ. Int. 2004, 30, 701–720. [Google Scholar] [CrossRef]
  13. Hauschild, M.Z.; Rosenbaum, R.K.; Olsen, S.I. (Eds.) Life Cycle Assessment: Theory and Practice; Springer International Publishing: Cham, Switzerland, 2018; ISBN 978-3-319-56474-6. [Google Scholar]
  14. Market.us. Logistics 2.0: Transportation Management Software Industry to Skyrocket to USD 77.0 Billion by 2033! Global Trade Magazine. 2024. Available online: https://www.globaltrademag.com/logistics-2-0-transportation-management-software-industry-to-skyrocket-to-usd-77-0-billion-by-2033/ (accessed on 27 May 2025).
  15. The Complexity of Quantifying Freight Emissions|Insights & Sustainability|Climatiq. Available online: https://www.climatiq.io/blog/complexity-of-quantifying-freight-emissions (accessed on 27 May 2025).
  16. Kiemel, S.; Rietdorf, C.; Schutzbach, M.; Miehe, R. How to Simplify Life Cycle Assessment for Industrial Applications—A Comprehensive Review. Sustainability 2022, 14, 15704. [Google Scholar] [CrossRef]
  17. Felder, M.; Bataleblu, A.A.; Grünbacher, G.; Rauch, E. Development of an ERP-Integrated Direct Routing and Way-Point Routing for Increasing Automation of LCAs in Supply Chains. Procedia Comput. Sci. 2025, 253, 2674–2683. [Google Scholar] [CrossRef]
  18. Yurtay, Y. Carbon Footprint Management with Industry 4.0 Technologies and Erp Systems in Sustainable Manufacturing. Appl. Sci. 2025, 15, 480. [Google Scholar] [CrossRef]
  19. Ferrari, A.M.; Volpi, L.; Settembre-Blundo, D.; García-Muiña, F.E. Dynamic Life Cycle Assessment (LCA) Integrating Life Cycle Inventory (LCI) and Enterprise Resource Planning (ERP) in an Industry 4.0 Environment. J. Clean. Prod. 2021, 286, 125314. [Google Scholar] [CrossRef]
  20. Eberhardt, K.; Schwärzel, A.; Klaus Kaiser, F.; Rosenberg, S.; Schultmann, F. Leveraging Knowledge Graphs in Pharmaceutical Supply Chains: Insights into Key Drivers of Drug Shortages. Int. J. Prod. Res. 2025, 59, 1–24. [Google Scholar] [CrossRef]
  21. Kosasih, E.E.; Brintrup, A. Towards Trustworthy AI for Link Prediction in Supply Chain Knowledge Graph: A Neurosymbolic Reasoning Approach. Int. J. Prod. Res. 2025, 63, 2268–2290. [Google Scholar] [CrossRef]
  22. Saad, M.; Zhang, Y.; Tian, J.; Jia, J. A Graph Database for Life Cycle Inventory Using Neo4j. J. Clean. Prod. 2023, 393, 136344. [Google Scholar] [CrossRef]
  23. Wu, T.; Li, J.; Bao, J.; Liu, Q.; Jin, Z.; Gao, J. CarbonKG: Industrial Carbon Emission Knowledge Graph-Based Modeling and Application for Carbon Traceability of Complex Manufacturing Process. J. Comput. Inf. Sci. Eng. 2024, 24, 081001. [Google Scholar] [CrossRef]
  24. Saidi, C.; Hamani, N.; Benaissa, M.; Rolf, B.; Reggelin, T.; Lang, S. Modeling Reconfigurable Supply Chains Using Knowledge Graphs: Towards Supply Chain 5.0. Prod. Eng. Res. Devel. 2025. [Google Scholar] [CrossRef]
  25. Peng, T.; Gao, L.; Agbozo, R.S.K.; Xu, Y.; Svynarenko, K.; Wu, Q.; Li, C.; Tang, R. Knowledge Graph-Based Mapping and Recommendation to Automate Life Cycle Assessment. Adv. Eng. Inform. 2024, 62, 102752. [Google Scholar] [CrossRef]
  26. Chen, L.; Silvennoinen, H.; Wolf, C.D.; Hall, D.; Mele, T.V.; Block, P. Towards Automated Building Life Cycle Assessments: A Novel Approach Using Large Language Models and the COMPAS Framework. In Proceedings of the IASS 2024 Symposium, Zürich, Switzerland, 26–30 August 2024. [Google Scholar]
  27. Gu, X.; Chen, C.; Fang, Y.; Mahabir, R.; Fan, L. CECA: An Intelligent Large-Language-Model-Enabled Method for Accounting Embodied Carbon in Buildings. Build. Environ. 2025, 272, 112694. [Google Scholar] [CrossRef]
  28. Greif, L.; Hauck, S.; Kimmig, A.; Ovtcharova, J. A Knowledge Graph Framework to Support Life Cycle Assessment for Sustainable Decision-Making. Appl. Sci. 2024, 15, 175. [Google Scholar] [CrossRef]
  29. Oladeji, O.; Mousavi, S.S. Leveraging AI-Derived Data for Carbon Accounting: Information Extraction from Alternative Sources. AAAI Fall Symp. Ser. 2024, 2, 135–139. [Google Scholar] [CrossRef]
  30. Huang, Z.; Shi, G.; Sukhatme, G.S. Can Large Language Models Solve Robot Routing? arXiv 2024, arXiv:2403.10795. [Google Scholar]
  31. Kurdve, M.; Fransson, K.; Jonsson, P. Availability and Need for Climate Footprint and Resilience Data from Suppliers in Automotive Supply Chains. In Advances in Transdisciplinary Engineering; Andersson, J., Joshi, S., Malmsköld, L., Hanning, F., Eds.; IOS Press: Amsterdam, The Netherlands, 2024; ISBN 978-1-64368-510-6. [Google Scholar]
  32. Negri, M.; Cagno, E.; Colicchia, C. Building Sustainable and Resilient Supply Chains: A Framework and Empirical Evidence on Trade-Offs and Synergies in Implementation of Practices. Prod. Plan. Control 2024, 35, 90–113. [Google Scholar] [CrossRef]
  33. Daios, A.; Kladovasilakis, N.; Kelemis, A.; Kostavelis, I. AI Applications in Supply Chain Management: A Survey. Appl. Sci. 2025, 15, 2775. [Google Scholar] [CrossRef]
  34. Robinson, I.; Webber, J.; Eifrem, E. Graph Databases: New Opportunities for Connected Data, 2nd ed.; O’Reilly: Beijing, China; Boston, UK; Farnham, UK; Sebastopol, CA, USA; Tokyo, Japan, 2015; ISBN 978-1-4919-3089-2. [Google Scholar]
  35. Kotiranta, P.; Junkkari, M.; Nummenmaa, J. Performance of Graph and Relational Databases in Complex Queries. Appl. Sci. 2022, 12, 6490. [Google Scholar] [CrossRef]
  36. Dijkstra Single-Source Shortest Path—Neo4j Graph Data Science. Available online: https://neo4j.com/docs/graph-data-science/2.18/algorithms/dijkstra-single-source/ (accessed on 28 May 2025).
  37. Bayramoğlu, K.; Çelikoğlu, Ş.; Turan, İ. An Examination of the Emissions, Cost, and Time of Intermodal Transportation. Sustainability 2025, 17, 2368. [Google Scholar] [CrossRef]
  38. Brown, T.B.; Mann, B.; Ryder, N.; Subbiah, M.; Kaplan, J.; Dhariwal, P.; Neelakantan, A.; Shyam, P.; Sastry, G.; Askell, A.; et al. Language Models Are Few-Shot Learners. arXiv 2020, arXiv:2005.14165. [Google Scholar]
  39. API Reference—OpenAI API. Available online: https://platform.openai.com (accessed on 28 May 2025).
  40. Holtzman, A.; Buys, J.; Du, L.; Forbes, M.; Choi, Y. The Curious Case of Neural Text Degeneration. arXiv 2019, arXiv:1904.09751. [Google Scholar]
  41. Introducing the Model Context Protocol. Available online: https://www.anthropic.com/news/model-context-protocol (accessed on 27 May 2025).
  42. Hou, X.; Zhao, Y.; Wang, S.; Wang, H. Model Context Protocol (MCP): Landscape, Security Threats, and Future Research Directions. arXiv 2025, arXiv:2503.23278. [Google Scholar]
Figure 1. IAES technical application architecture: a schematic representation of the modular workflow, illustrating the execution of main tasks, agent interactions, integration with external data sources, and the Neo4j knowledge graph. The figure highlights the orchestrator logic, enrichment cycle, and the flow of information from raw company data to an actionable supply chain value.
Applsci 15 08001 g001
Figure 2. An example output generated by the RoutePlannerAgent for a requested route from supplier S25 to plant P2320.
Applsci 15 08001 g002
Figure 3. An example output generated by the SourceSearcherAgent for the suggested waypoint “Malta Freeport (Seaport)”.
Applsci 15 08001 g003
Figure 4. Streamlit-based dashboard for interacting with enriched supply chain KG.
Applsci 15 08001 g004
Figure 5. The ontology-based supply chain structure. Each node represents a key supply chain entity, and relationships indicate transport routes between them.
Applsci 15 08001 g005
Figure 6. The geographic distribution of the 77 predefined supply chain entities (plants: orange dots, suppliers: green dots, and customers: blue dots) used in the test scenario.
Applsci 15 08001 g006
Figure 7. The resulting transport KG after executing the IAES. The graph contains 281 nodes connected by 996 directed transport edges. Nodes are categorized as 4 plants (orange), 44 suppliers (green), 30 customers (blue), and 200 intermediate waypoints (red).
Applsci 15 08001 g007
Figure 8. The top 15 waypoints by the number of connected routes: the diagram illustrates the centrality of major waypoints, based on the number of connected inbound and outbound routes.
Applsci 15 08001 g008
Figure 9. A screenshot from the Streamlit-based dashboard demonstrating the comparative benchmarking of alternative logistics routes. The IAES prototype evaluates multiple routing scenarios, allowing users to select optimization criteria. The results are generated using semi-realistic data.
Applsci 15 08001 g009
Table 1. Literature review overview: integration of GDBs and LLMs in SCM and/or LCAs.
Authors
(Year)
LCASCMMethodologyTechnologyApplication
Domain
Saad et al.
(2023) [22]
X Semantic graph
for LCI
GDBLCI
management
Wu et al.
(2024) [23]
XXKG-based
carbon flow analysis
GDBCarbon emission tracking in manufacturing
Saidi et al.
(2025) [24]
XXKG with
multicriteria decision
GDBSupply chain reconfiguration
Peng et al.
(2024) [25]
XXAutomated LCA
with GDB
GDBProduct LCA
(electronics)
Chen et al.
(2024) [26]
X LLM for BIM parsing and LCA automationLLMBuilding LCA (architecture/engineering)
Gu et al.
(2025) [27]
X LLM for BIM parsing
and LCA automation
LLMEmbodied carbon in construction
Greif et al.
(2024) [28]
X KG-based LCA
with AI enrichment
GDB,
LLM
Product LCA
(3D printing case)
Oladeji & Mousavi
(2023) [29]
XXNLP-driven
emissions graph
GDB,
LLM
Supply chain carbon footprint tracking
Table 2. The main tasks and functionalities of the IAES.
TasksFunctionality
GetCapturing raw logistics data from ERP, MES, e.g., systems, like suppliers, plants, customers, and needed or known routes
AnalyzePerforming network analysis to detect gaps, incomplete paths, and optimization potential
CoordinatePrioritizes missing routes and orchestrates agent-based enrichment workflows
EnrichEmploys LLM agents and external APIs (e.g., OpenRouteService ORS, geolocation) to infer and propose new waypoints, create routes, enrich the new entities with information, and evaluate plausibility
StoreIntegrating enriched data back into the KG model for future access and optimization
SelectPerforming route selection, benchmarking, and optimization using Dijkstra’s algorithm from the graph data science library
UseEnables downstream applications such as LCA calculation, dashboarding, and strategic planning.
Table 3. The main agents and modules of the IAES architecture, their assigned tasks, core methods, and key parameters. The table provides an overview of the primary software agents and modules implemented in the IAES, mapping each to its corresponding functional task, role in the workflow, and central methodological features.
Agent/ModulesTaskRoleCore MethodeParameters/API
Coordinator
Agent
COORDINATEManages the overall workflow
in sequential phases
State machine logic
GraphScanner
Agent
ANALYZEIdentifies graph properties,
missing and incomplete routes
Cypher queries,
graph traversal
RoutePlanner
Agent
ENRICHSuggests plausible multimodal cargo routesLLM (GPT-4),
custom prompt
Temperature = 0.3
SourceSearcher
Agent
ENRICHGeocodes planner output,
resolves or creates waypoints
LLM (GPT-4),
distance, and
fuzzy name matching
Temperature = 0.1
Radius = 2 km
Name similarity ≥ 0.8
RouteEvaluator
Agent
ENRICHQuantifies route segments
Values by the chosen requested toolbox methodology
Mode-specific
toolbox
OSR,
static methods
Neo4jBuilder
Agent
STOREWrites or updates nodes and routes into Neo4jCypher queries
Cleanup
Agent
STORERemoves incomplete dataRule-based
validation
SelectorSELECTSelects optimal routes for
defined criteria
Dijkstra (Neo4j)Custom weights, mode preferences, and country filters
Table 4. Node labels in the supply chain ontology.
Node LabelsDescription
PlantManufacturing site where goods are produced
SupplierSource of raw materials, components, etc.
CustomerRecipient of the produced goods
WaypointLogistical hub such as a seaport, airport, rail, or truck terminal
Note: The node labels are extensible and can be adapted to model additional supply chain entities such as logistics providers, customs checkpoints, or consolidation centers. In the current configuration, the “Plant” node type also serves as the anchor point, representing the focal company using the IAES application.
Table 5. Node properties and example values.
PropertyDescriptionExample
nameOfficial namePort of Hamburg
typeFacility classificationSeaport
countryISO 2-letter country codeDE
cityCity locationHamburg
postal_codePostal code20457
addressStreet and street Nr.Am Standtorkai 60
latitudeLatitude coordinate53.551086
longitudeLongitude coordinate9.993682
Table 6. Properties of relationships (routes).
PropertyDescriptionExample
modeTransport type (road, sea, rail, and air)Road
vehicle_typeSpecific vehicle usedTruck
distance_kmTotal distance in kilometers1300 km
duration_hEstimated transport time15 h
emissions_kgco2_kgCO2 emissions
per kilogram transported
140 kgCO2/kg
costs_e_kgCost per kg transported100 €/kg
availabilityStatus flag
(0 = not available, 1 = incomplete, 2 = valid)
2
update_dateLast update timestamp20 May 2025
sourceData source (e.g., LLM+API, ERP, manual)Manual
Note: Both cost and emissions are calculated based on the total route distance and depend on the selected mode and vehicle type. The underlying calculation models are integrated in the Route Evaluator module of the IAES (see Section 3.1).
Table 7. The validation results of the LLM-generated waypoint nodes. The table summarizes existence and accuracy for each node category.
Node TypeTotal NodesValid ExistingCorrect LocationValid (%)Correct Location (%)
Airport616161100.00%100.00%
Seaport69673597.10%50.70%
Freight Rail Hub6149780.30%11.50%
Truck Terminal97077.80%0.00%
Disclaimer/Publisher’s Note: The statements, opinions and data contained in all publications are solely those of the individual author(s) and contributor(s) and not of MDPI and/or the editor(s). MDPI and/or the editor(s) disclaim responsibility for any injury to people or property resulting from any ideas, methods, instructions or products referred to in the content.

