Article

Strength Training vs. Aerobic Interval Training: Effects on Anaerobic Capacity, Aerobic Power and Second Ventilatory Threshold in Men

by
Aleksander Drwal
* and
Marcin Maciejczyk
*
Department of Physiology and Biochemistry, University of Physical Education, 31-571 Kraków, Poland
*
Authors to whom correspondence should be addressed.
Appl. Sci. 2025, 15(14), 7953; https://doi.org/10.3390/app15147953
Submission received: 12 May 2025 / Revised: 4 July 2025 / Accepted: 16 July 2025 / Published: 17 July 2025
(This article belongs to the Special Issue Recent Research on Biomechanics and Sports)

Abstract

The purpose of this non-randomized study was to determine the effect of strength training and aerobic interval training on the anaerobic and aerobic power and endurance of young men (assessed by determination of the second ventilatory threshold (VT2)) in non-trained men. Participants (n = 45) were recruited into three groups of 15 each. The first group performed strength training (ST), the second performed aerobic interval training (AIT), and the third group was the control group (CON). In each group, somatic measurements and tests of aerobic (graded test with VT2 determination) and anaerobic capacity (Wingate test) were performed twice (before and after the exercise intervention in the training groups). In the graded test, the level of maximal load (Pmax), maximal oxygen uptake (VO2max) and intensity and oxygen uptake at VT2 were determined. In the Wingate test, peak power (PP) and mean power (MP) were determined. The exercise intervention in the ST and AIT groups lasted 6 weeks, with three workouts per week. Training in the ST and AIT groups resulted in significant increase in absolute Pmax (p < 0.001, ES = 0.52 and p < 0.05, ES = 0.36), VO2max (p < 0.001, ES = 0.50 and p = 0.02, ES = 0.55) in the participants. Only AIT was significantly effective in improving oxygen uptake at VT2 (p < 0.04, ES = 0.64), and ST in improving PP. Strength training can be an effective training method in training aerobic and anaerobic capacity (significantly increases Pmax, VO2max, and PP), while it does not significantly affect work intensity at VT2. Our results suggest that, particularly in anaerobic–aerobic sports, strength training may be a training method that can simultaneously improve both anaerobic power and maximal oxygen uptake. It can also complement endurance training.

1. Introduction

High-intensity strength training (ST) has traditionally been used to improve anaerobic (phosphagen and glycolytic) capacity and to improve muscle strength, speed and power, as well as to improve tolerance of acid–base disturbances [1,2]. Strength training based on anaerobic exercises performed with external resistance is a kind of training that affects the nervous and muscular systems, among other things, by increasing the activation of motor units [3,4] or increasing the physiological cross-section of muscle fibers [5]. Strength training is gaining increasing interest in sports to improve aerobic capacity. Previous studies [6,7,8] have shown that ST (>70% of one repetition maximum (1RM) intensity) training increases not only maximal strength and peak power, but can increase maximal oxygen uptake (VO2max) and improve cyclists’ running economy [9]. In other studies, improvements in endurance, as assessed by running economy, were observed after resistance training [10,11,12,13]. Another study [7] showed that strength training using free weights improved both aerobic and anaerobic capacity in female soccer players. Lower lactate concentration was also observed after such training in comparison to aerobic training [8]. It has also been proven that 20-week ST has the effect of increasing blood indices, such as mean red blood cell volume, hematocrit and red blood cell count [14]. The authors [14] suggest that resistance training affects fluctuations in blood morphology parameters, causing an increase in red blood cell-related indices. It may counteract sports anemia, which often occurs among people who perform endurance training. Another study [15] showed that ST significantly improves, in a similar way to long-term aerobic training, cardiovascular function in obese individuals; after training, there was not only a significant increase in VO2max, but also improved endothelial function in blood vessels, an increase in PGC-1α, a protein responsible for regulating liver function during gluconeogenesis or mitochondrial biogenesis, and increased transport of calcium ions involved in muscle contraction. In addition, a decrease in LDL lipoprotein levels was noted in the subjects [15]. The above-reported changes occurring under the influence of strength training may also have a beneficial effect on aerobic capacity and suggest that strength training may also be at least a complement or alternative to endurance training.
One of the physiological indicators of aerobic endurance is VO2max, the intensity of work at metabolic thresholds (first and second ventilatory threshold: VT1 and VT2), maximal steady state and economy of movement [16,17,18]. As intensity increases to maximal, energy metabolism changes. Once the first ventilatory threshold is exceeded, compensated metabolic acidosis occurs [19]. Increasing exercise intensity causes the next metabolic threshold to be exceeded, which is the second ventilatory threshold (VT2), an important indicator in assessing aerobic endurance [20,21]. Exceeding VT2 causes hyperventilation and the development of uncompensated metabolic acidosis [22]. Aerobic capacity is usually trained using submaximal, continuous or interval aerobic efforts, usually performed over an extended period of time. The changes observed under the influence of endurance training mainly concern the functioning of the circulatory and respiratory systems and blood parameters, which result in improved oxygen transport to cells. Therefore, if similar changes (i.e., an increase in the number of erythrocytes) were observed after strength training [14], this may suggest that strength training may also have an impact on aerobic performance.
Most sports have a mixed energy background (aerobic–anaerobic or anaerobic–anaerobic), and thus, most often require two distinct training methods: one aimed at improving aerobic capacity, the other at improving anaerobic capacity. For practitioners, it is important to optimize training methods in order to maximize training effects. They seek either new training methods or combinations of several different methods to ensure maximum training effectiveness, especially when there is a short preparation period for a competition or a set goal. Previous studies [6,7,8] suggest that ST can also improve aerobic endurance and thus may prove to be a versatile training method, affecting both aerobic and anaerobic capacity. In this study, we compared the effectiveness in improving physical performance of two distinct training methods, aerobic and anaerobic, i.e., methods that produce different physiological and biochemical effects. The first, strength training, targeted improvements in muscle strength and anaerobic capacity. The second, AIT, targeted improving aerobic capacity. The purpose of the study was to determine the effectiveness of strength training in training aerobic endurance in young men, as assessed by maximal power, maximal oxygen uptake and second ventilatory threshold. It was hypothesized that strength training would be as effective in improving endurance capacity as traditional aerobic interval training.

2. Materials and Methods

The study involved 45 young men, who were recruited into three groups of 15 participants each. The first group performed strength training, the second performed aerobic interval training, and the third group was without intervention (control—CON). In each group, somatic measurements, the Wingate test and aerobic capacity test were performed twice (before and after the exercise intervention). The preliminary tests were conducted prior to the intervention, followed by 6 weeks of intervention and a post-test within 1 week of the last training session. In addition, declared physical activity was determined in each participant. The exercise intervention in the ST and AIT groups lasted for 6 weeks, with three workouts per week. The CON group was without intervention for this period. Participants were instructed not to change their diet or physical activity during the intervention. Prior to the intervention, participants were familiarized with exercise testing procedures. One familiarization session was held, during which participants learned about the technique of cycling on an ergometer (AIT) or the technique of performing specific strength exercises (ST); they had the opportunity to try out the exercises planned for the first week of the intervention. The safety rules for performing the exercises were also explained to them. At the end of each week of the intervention (ST), the instructor presented new exercises to be introduced the following week.
On the first day of the study, participants took somatic measurements and then performed a graded test to assess aerobic capacity. The next day they performed the Wingate test. Participants had to refrain from eating for 2 h before the exercise tests and were asked not to participate in any intense exercise for 24 h before the exercise tests and to hydrate during this time. They were not allowed to consume alcohol or caffeinated beverages before the performance tests. All tests were conducted at the same time of day starting at 8 a.m., after the participants had consumed a light meal. The workouts took place under the supervision of a sports/motor training instructor. Exercise tests and workouts took place under similar conditions, with an ambient temperature of about 21 °C and humidity of about 40%.
This study was not randomized. For organizational reasons, the study was conducted in stages, i.e., group by group. After completing the measurements/interventions in one group, participants were recruited for the next group. A total of 68 men were recruited for the study, 3 of whom were excluded due to failure to meet the inclusion criteria. Young healthy men, declaring good health and without contraindications to high-intensity exercise, were recruited for the study. The following inclusion criteria were adopted: age (19–27 years), declared good general health (no chronic diseases, inflammation, history of fractures, surgery in the 6 months before the start of the project), no training in the 6 months before the start of the project. Exclusion criteria were regular physical activity (sports training), obesity or overweight, history of chronic conditions, injuries, cardiac contraindications to exercise.
All participants gave written consent to participate in the study and were informed about the purpose of the study and the scope of the study. Approval for the study was obtained from the Bioethics Committee of the Regional Medical Chamber in Kraków (187/KBL/OIL/2022).

2.1. Participants

The study recruited young healthy men aged 19 to 27 years who did not participate in sports and their declared spontaneous, varied physical activity at a low to moderate intensity. The average age and somatic build of participants before the intervention are shown in Table 1.

2.2. Somatic Measurements

Body height was measured using an anthropometer (Seca 217, Seca, Hamburg, Germany) to the nearest 0.1 cm. Body weight and body composition were determined using a body composition analyzer (IOI 353, Jawon Medical, Seoul, Republic of Korea). In the measurement, body weight (BM), body mass index (BMI), lean body mass (LBM), body fat mass expressed in kilograms and percentages (FM) were determined.

2.3. Physical Activity

The seven-day Physical Activity Recall (PAR) questionnaire was used to assess participants’ self-reported physical activity [23,24]. The subjects were instructed on how to complete the questionnaire and it was completed in the presence of the researchers, who clarified any doubts that arose. Physical activity was presented as total weekly energy expenditure in the period before the training intervention.

2.4. Anaerobic Capacity

The Wingate test [25] was conducted on a bicycle ergometer (E834, Monark, Varberg, Sweden). The bicycle ergometer was connected to a computer and used software (MCE, JBA Staniak, Warsaw, Poland) to calculate the following indices: peak power (PP), mean power (MP), fatigue index (power decrease) (FI). After adjusting the saddle height, the subject began a 5 min warm-up with a load of 120 watts and a cadence of 60 revolutions per minute, during which the participant performed two (in the 2nd and 4th minute) maximum accelerations lasting about 5–6 s. Between the warm-up and the test was a 5 min recovery break, during which the participant stretched for 4 min. The main effort consisted of a 30 s sprint with a load of 7.5% of body weight. The test had a stationary start [26], and the participant’s task was to reach maximum pedaling speed (revolutions per minute) as fast as possible and then maintain it until the end of the test (an all-out effort). Throughout the test, each participant was vigorously and loudly encouraged by two test supervisors to perform supramaximal effort. During the test, the participant had to be in a sitting position.

2.5. Aerobic Capacity and Second Ventilatory Threshold

Maximal oxygen uptake was measured by a direct method using a graded test. Based on the results of this test, the first (VT1) and second (VT2) ventilatory thresholds were also determined for each subject individually. The test was performed on a bicycle ergometer (Ergoline Ergoselect 100, GE, Bitz, Germany). Breath-by-breath gas analysis was performed using a Metalyzer 3B ergospirometer (Cortex, Leipzig, Germany). Each time before the test, the ergospirometer was calibrated, according to the manufacturer’s requirements (volume and gas calibration). The test began with a resting recording of the indicators tested for two minutes and then the subjects performed a 4 min warm-up with a load of 60 watts and a cadence of 60 revolutions per minute. Then, every 2 min, the exercise power was increased by 30 watts until a subjective volitional exhaustion. During the test, the participant was vigorously verbally cheered on. The following indices were measured in the test: heart rate (HR), oxygen uptake (VO2), pulmonary ventilation (VE), minute carbon dioxide production (VCO2), respiratory rate (RER), percentage of oxygen in exhaled air (FEO2), percentage of carbon dioxide in exhaled air (FECO2), ventilation equivalents for oxygen (VE/VO2) and carbon dioxide (VE/VCO2), and exercise power (P). After the test, the data obtained were analyzed; maximum oxygen uptake (VO2max) and ventilation thresholds (VT1 and VT2) were determined. The following criteria were used to determine VO2max: RER > 1.1, HR close to the age-predicted HRmax (±5 beats/minute), and no increase in VO2 despite increasing load (plateau in VO2). All participants met the first two criteria. If no plateau was observed, but the other criteria were met, VO2peak was taken as VO2max [27]. Based on changes in measured physiological indices with increasing exercise power, ventilatory thresholds were determined. Ventilatory thresholds were determined using the respiratory equivalents method [28,29]. The second ventilatory threshold was determined at the intensity at which VE/VCO2 reached a minimum value and FECO2 reached a maximum value, and a second breakdown of the linearity of pulmonary ventilation was observed.

2.6. Strength Training

Resistance training was aimed at increasing strength and was performed in the gym using free weights (barbells) and body weight. Participants in the ST group performed exercises (squats, Bulgarian squats, deadlifts) at a controlled pace. The pace of the exercise was presented in seconds and describes the time of eccentric contraction, the pause between the eccentric and concentric phases, the time of concentric contraction, and the time of pauses after the end of the movement, e.g., 3/0/1/0. The recovery time between sets was 3–5 min, depending on the intensity of the effort. The frequency of training units was 3 times a week. On the first training unit, 1 repetition maximum (1 RM) was set for each participant for subsequent selection of exercise intensity. The load was increased until the subject was unable to perform the next repetition once. 1RM was determined only before the intervention and was not re-estimated during the intervention. Selection of training intensity (number of repetitions, percentage of maximum weight) was determined using Charles Poliquin’s table [30], depending on the established training goal. A detailed description of the strength training is shown in Table 2.

2.7. Aerobic Interval Training

AIT was sub-maximal in intensity, and the intensity of the effort was individually matched against VT1 and VT2. The selection and control of the load was based on the results of a graded test, and the power during training corresponded to the power at ventilation thresholds. The training was performed on bicycle cycloergometers (Wattbike, UK) in the form of interval training. Each workout lasted 60 min, consisted of a 6 min warm-up with power at VT1, then participants performed a 6 min effort with power at VT2. Between efforts there was an active rest of 3 min with power at VT1 (the ratio of effort to rest was therefore 2:1). In total, the participants performed six such series over the course of 60 min, i.e., 6 min of effort and 3 min of active rest (one series).

2.8. Statistical Analysis

The sample size was calculated a priori using G*Power 3.1.9.7 (Germany). The following data were entered into the software: test family = f tests; statistical test = ANOVA with repeated measures, within-between interaction; type of power analysis = calculation of the required sample size-with assumed α, power, and effect size. The parameters entered into the software were as follows: effect size f: 0.25; error probability α: 0.05; power: 0.80; number of groups: 3; number of measurements: 2; correlation between measurements: 0.5; non-sphericity correction: 1.0. The required total sample size was 42 participants. Due to possible dropouts from the study, we decided to recruit 45 participants (15 per group). All participants obtained a complete set of data.
The mean and standard deviation were calculated for each variable. The Shapiro–Wilk test was used to test the distribution of the data, and Levene’s test was used to assess homogeneity of variance. Analysis of variance (ANOVA) with repeated measures or one-way ANOVA was used to detect differences between groups, differences between test points (change over time), to determine interactions between main effects, and to assess effect size (partial eta square-ηp2). Effect size (ηp2) was interpreted as small (0.01), medium (0.06) or large (0.14) [31]. If the ANOVA results were significant, the Tukey test was used for post hoc analysis. Bonferroni’s correction for multiple comparisons was applied. In addition, if the results of the post hoc analysis were significant (p < 0.05), the effect size (ES) was further determined between the baseline and post-training values using Cohen’s d. ES was interpreted as small (0.20), medium (0.40) or large (0.80) [31]. STATISTICA 13 (StatSoft, Inc., Tulsa, Oklahoma, United States) was used for statistical analysis. Differences were considered significant when p < 0.05.

3. Results

3.1. Physical Activity

Physical activity did not differ significantly between groups (f = 1.06, p = 0.35, ηp2 = 0.48). Total energy expenditure per week was CON: 20,804 ± 2972 kcal/week, ST: 23,179 ± 3311 kcal/week, AIT: 21,487 ± 3069 kcal/week.

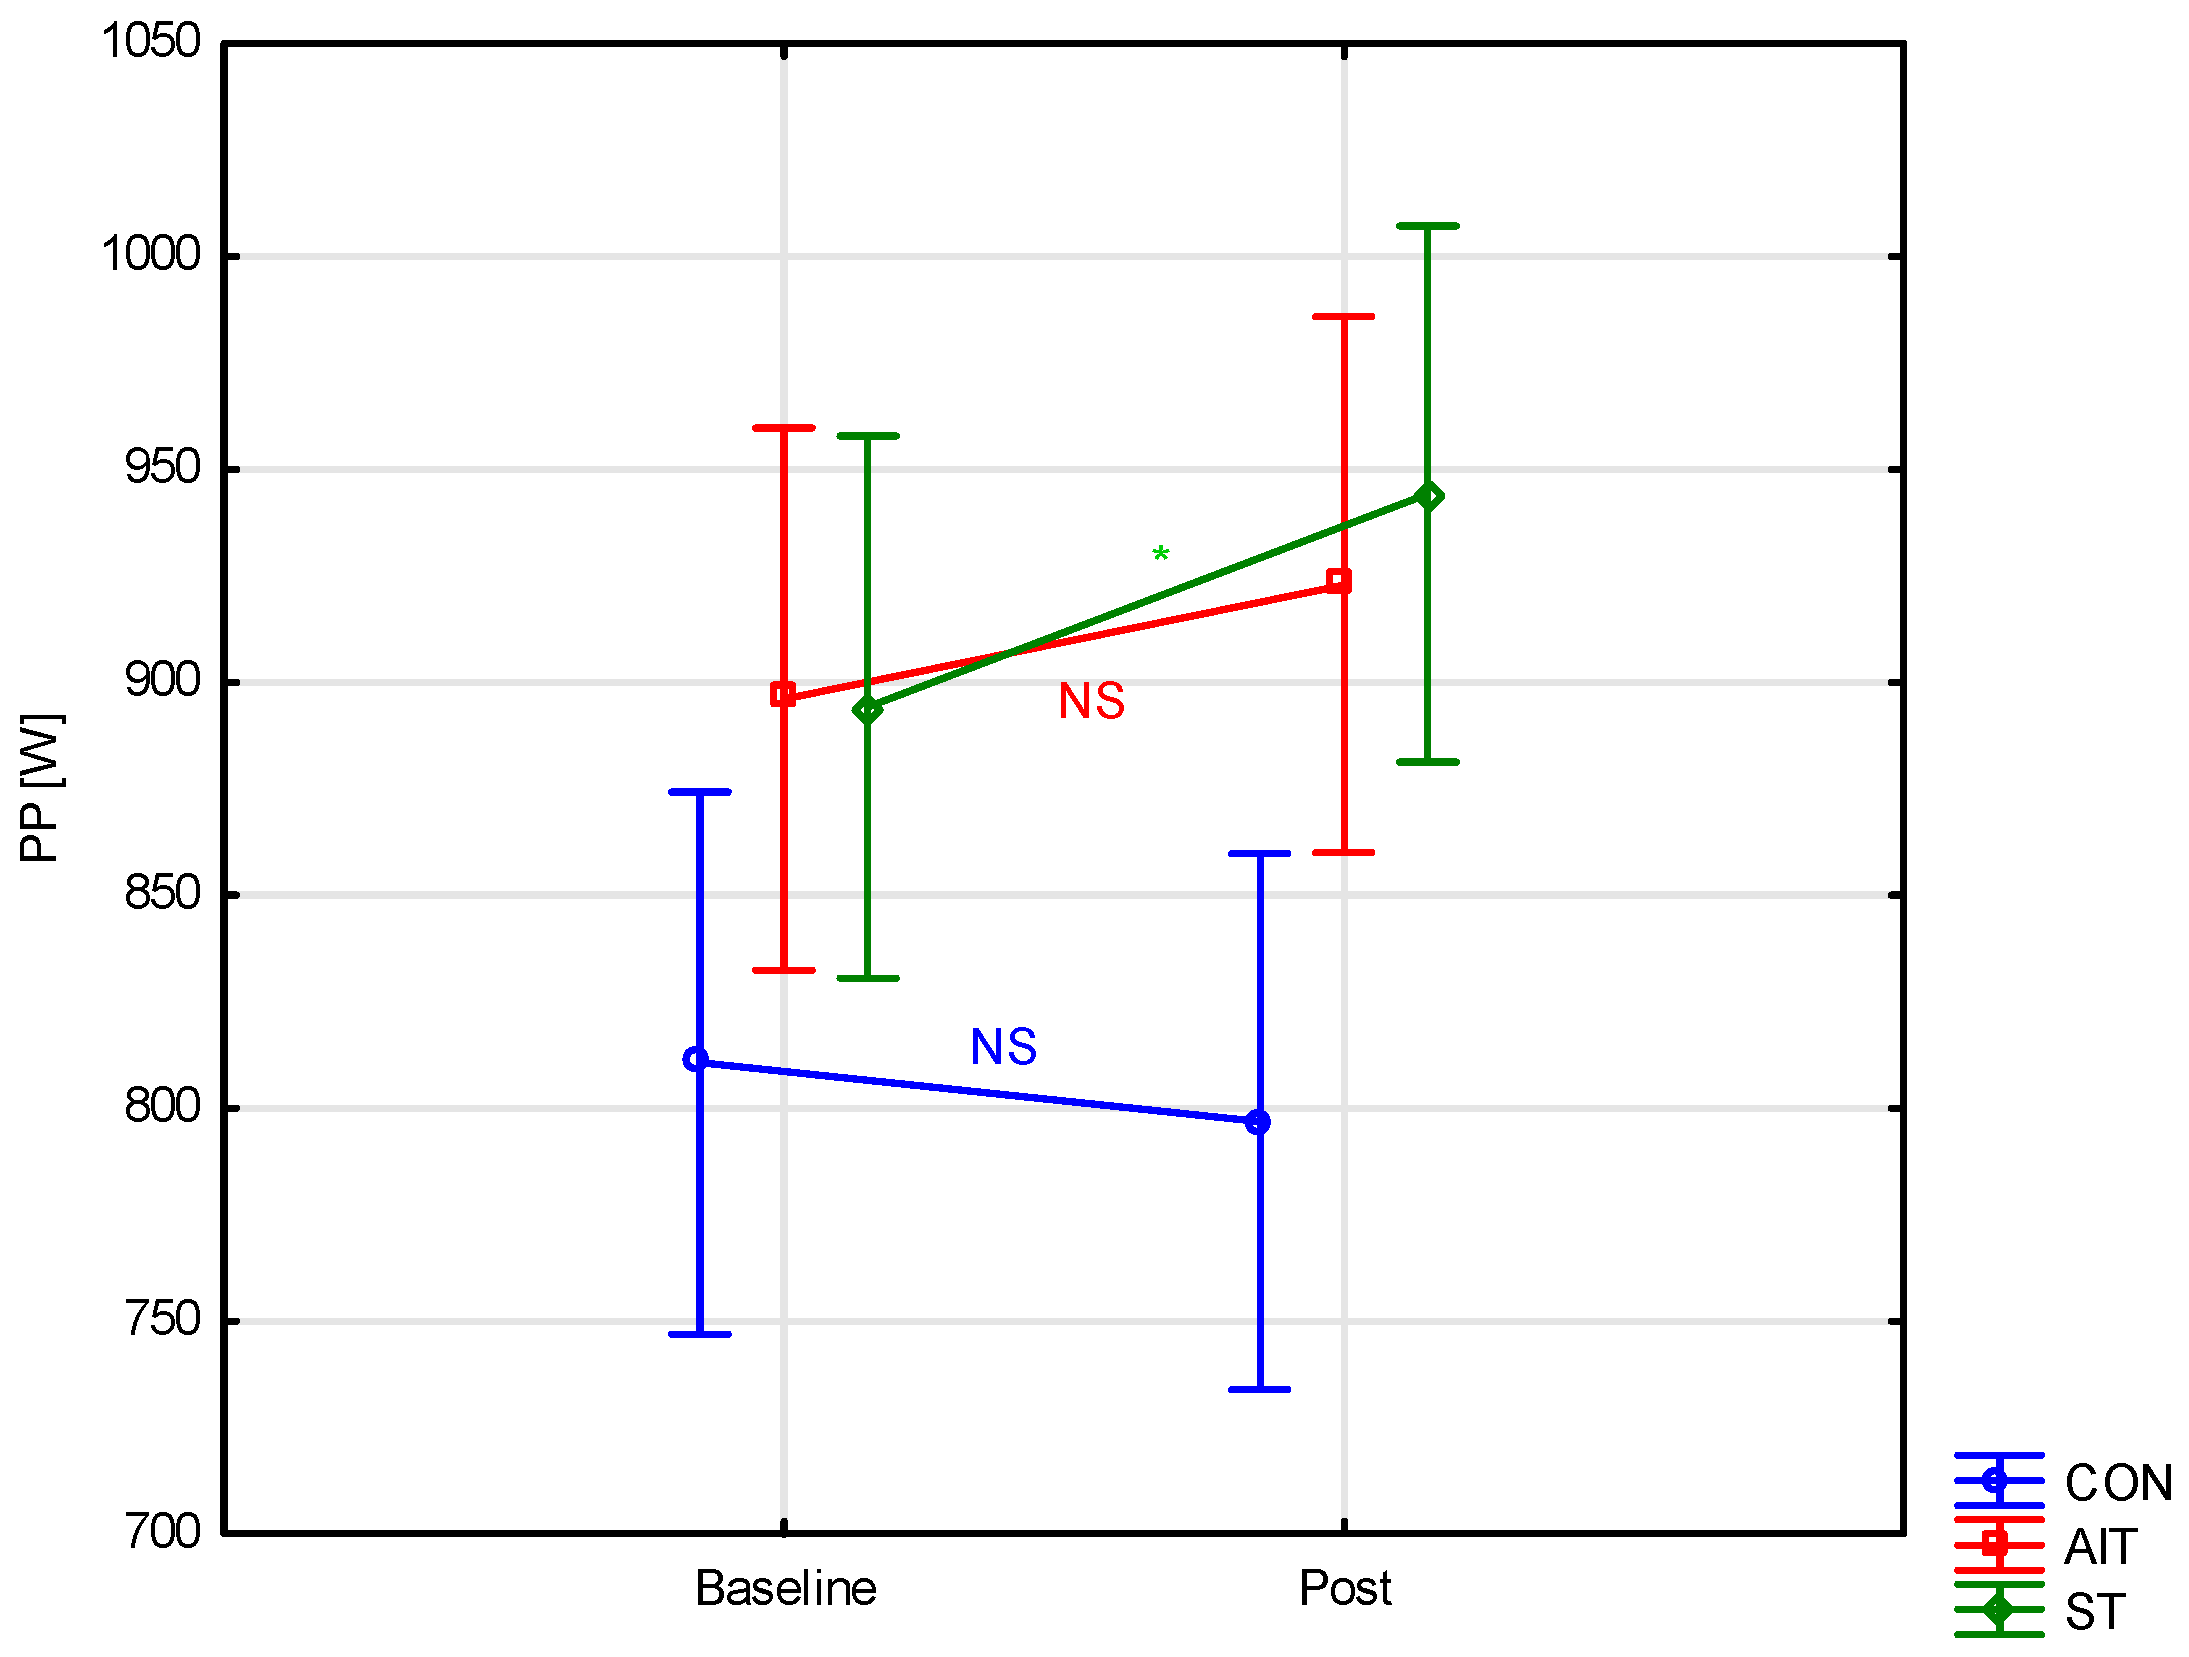
3.2. Anaerobic Capacity

Training in the ST group resulted in a significant increase in absolute PP (p < 0.001, ES = 0.44; Figure 1, Table 3). Relative peak power also significantly increased (p < 0.001, ES = 0.53) after training in the ST group (Table 3). Absolute mean power significantly increased only in the ST group (p < 0.002, ES = 0.32) (Table 3). In the AIT and CON groups, there were no significant changes in the level of the variables tested in the Wingate test.

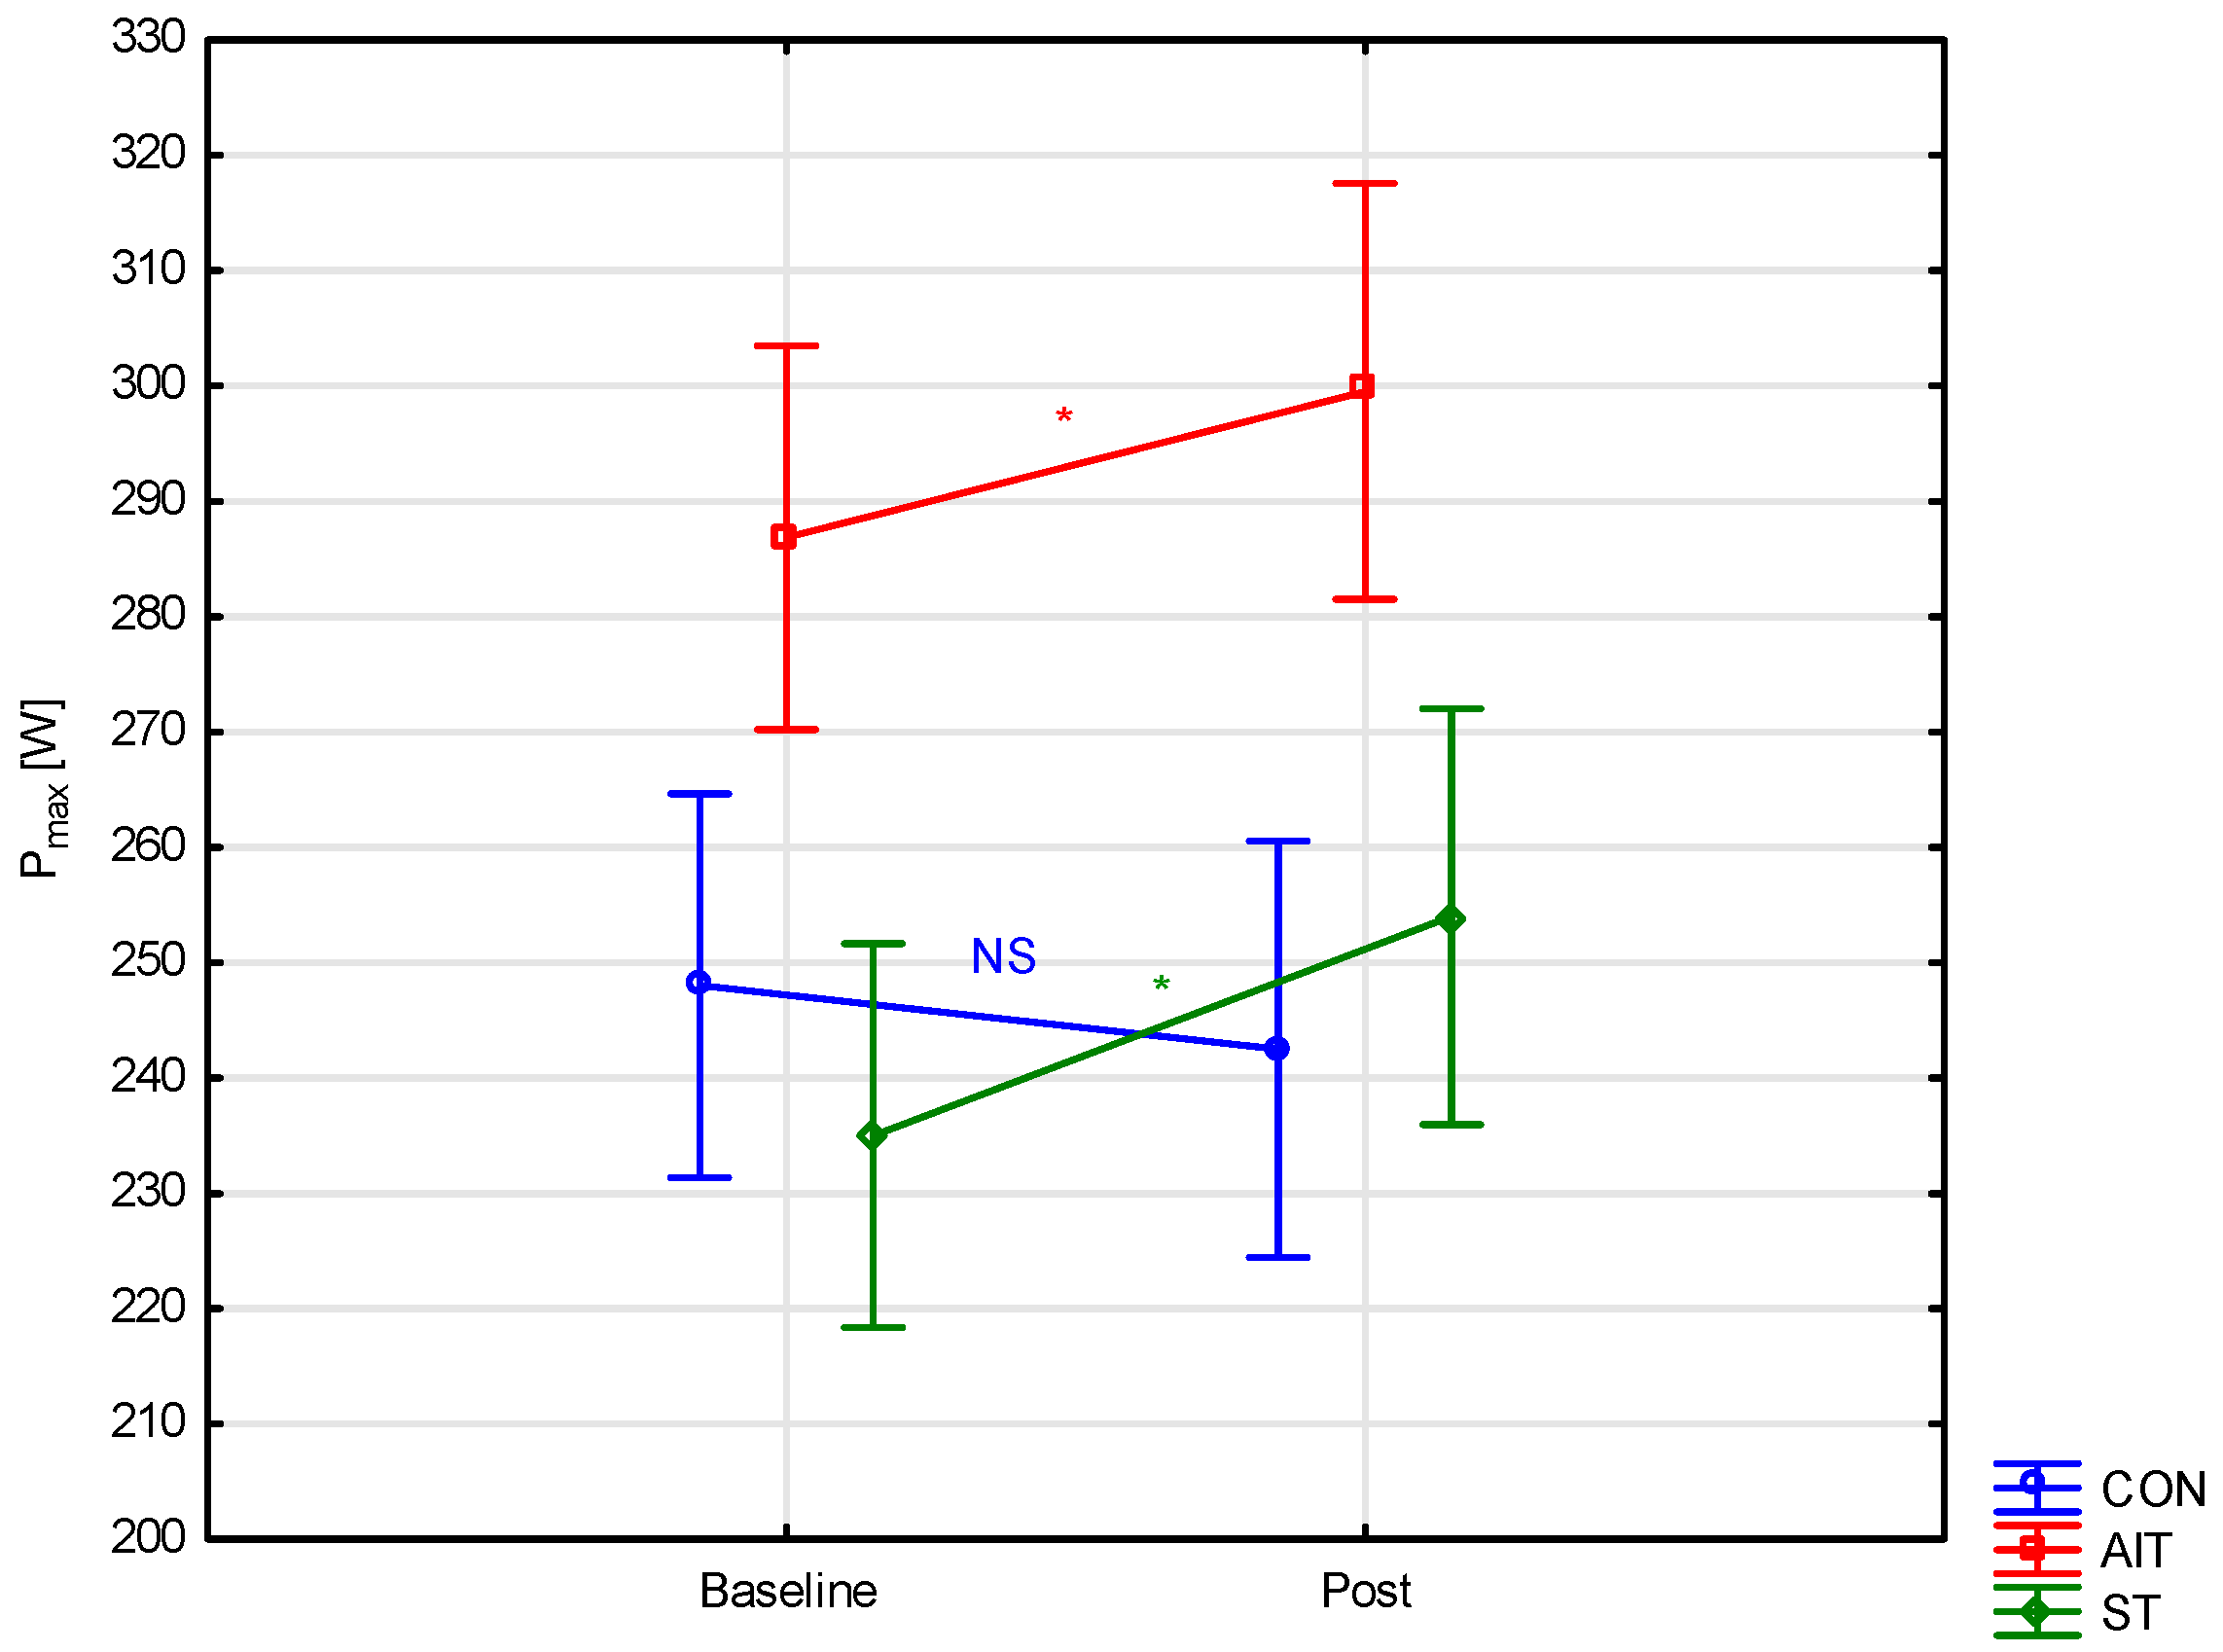
3.3. Aerobic Capacity and Second Ventilatory Threshold

Training in the ST and AIT groups resulted in a significant increase in absolute VO2max (p < 0.001, ES = 0.50 and p = 0.02, ES = 0.55, Figure 2, respectively). Relative maximal oxygen uptake increased after training in the ST and AIT groups (p < 0.02, ES = 0.35 and p < 0.03, ES = 0.42, Table 4). Absolute maximal power increased significantly in the ST group (p < 0.001, ES = 0.52; Figure 3). Comparing the ST and AIT groups, significant changes in relative maximal power were observed only in the ST group (p < 0.01, ES = 0.05) (Table 4).
The applied training increased absolute VO2 at VT2 only in the AIT group (p < 0.04; ES = 0.64) and this was a moderate effect (Table 5). No significant changes were observed in the other groups.

4. Discussion

This study evaluated whether strength training would be as effective in improving anaerobic capacity, aerobic power and endurance as aerobic interval training. It was hypothesized that strength training could be as effective in improving physical fitness as traditional aerobic interval training. The data obtained partially support the hypothesis. Strength training showed effectiveness in improving anaerobic capacity, and increases in PP (+5.59%) and MP (+3.90%) were observed. ST training, as well as AIT, proved effective in improving maximal oxygen uptake (+9.15% and +5.58%, respectively). It was shown that in all training groups, there was a significant increase in absolute VO2max; the effect size in the ST group was (p < 0.001, ES = 0.50), and in the AIT group it was (p = 0.02, ES = 0.55). An increase in VO2max of 5–9% as a result of AIT and ST for healthy people is practically imperceptible. This does not mean that a healthy, untrained population should not engage in such training. Any physical activity, despite the lack of noticeable training effects, is recommended and can prevent disease and promote good health. However, among athletes, such an increase can be decisive in winning and therefore may be important from a competitive point of view. In addition, our data can be helpful in modifying and optimizing training plans to maximize training effects. In people with low aerobic capacity (e.g., VO2max: 15–20 mL/kg/min), such an increase can be very noticeable and determine independent mobility. Our data may be particularly important for people whose physical capacity limits their mobility and ability to walk or ride a bike, but allows them to perform strength training. In addition, the two training methods resulted in an increase in the maximal power obtained in the graded test (+8.08% (ST) and 4.41% (AIT)). The magnitude of the recorded effect was moderate in both groups. The results indicate that the applied strength training was at least as effective in improving the indices measured in the graded test as interval aerobic training. However, the applied strength training only induced significant changes in the indicators studied at the maximal intensity level (Pmax and VO2max), while it did not affect their submaximal level, i.e., the second ventilation threshold. Only AIT training had a significant effect on increasing oxygen uptake at VT2. Thus, it can be concluded that ST did not significantly affect endurance capacity assessed by ventilation thresholds and only the maximum level of the variables tested in the graded test.
The effect of strength training on anaerobic capacity is not surprising and the data obtained confirm previous data [6,7,8], in which strength training was shown to increase peak power during the Wingate test. Sporiš et al. [7] showed that a 2.7% increase in anaerobic capacity was recorded after 12 weeks of resistance training. It is likely that the improvement in peak power in the Wingate test is most likely due to an increase in muscle strength in the ST group. Although a previous study [7] has also reported a positive effect of strength training on VO2max, the undoubted novelty of this study is the demonstration that strength training does not affect the submaximal level of the indicators tested (i.e., at VT2), but only their maximal level. Only AIT significantly affected oxygen uptake at VT2. The present data contradicts previously reported results. Maté-Muñoz et al. [32] did not show that strength training affects intensity at VT2 and thus does not contribute to improving aerobic endurance, as assessed by ventilation thresholds.
According to a study by Sporiš et al. [7], 12 weeks of resistance training at an intensity of 70–80% of 1RM increased VO2max by 4.3%. Unfortunately, this study did not evaluate other physiological parameters whose changes could explain the mechanism leading to the change in VO2max. Interesting data was reported in another study [14], which showed that 20-week ST training significantly increased blood indicators such as mean red blood cell volume, hematocrit and red blood cell count. The authors [14] suggested that resistance training affects blood morphology by causing an increase in red blood cell-related indices. Incorporating such training into endurance training, according to the authors, may counteract the sports anemia that can occur among endurance trainees. Aerobic capacity depends largely on the efficiency of oxygen transport by the blood, so strength training could have improved aerobic capacity for this reason. In turn, improved neuromuscular efficiency translates into improved running economy (i.e., coordination and stride efficiency), but in our study we did not observe a significant effect of ST at submaximal intensity (VT2), perhaps because the training was relatively short or because of the different form of exercise (cycling not running). In another study [15], the authors reported that ST training significantly improved VO2max, in a similar manner to high-intensity interval training or prolonged aerobic training. The results of the present study are consistent with previously published studies [6,7,8,9,33], which showed an increase in maximal oxygen uptake after anaerobic training. However, this effect is not conclusive. Nakao et al. [34] showed no improvement in VO2max in a group training weightlifting at a frequency of 5 times a week for 3 years in combination with endurance training. Cantrell et al. [35] came to similar conclusions, proving in their study that high-intensity anaerobic training did not improve aerobic capacity as measured by maximal oxygen uptake.
The main difference between AIT and ST training is the intensity of the effort. AIT training was aerobic–anaerobic training, while ST training was anaerobic training with maximal or submaximal intensity defined by %1RM. The difference between AIT and ST training is primarily the external resistance used in the form of free weights or machines, and the technique used to perform the exercises. Load selection in ST training is not based on cardiovascular or respiratory indicators, but on external weight, speed of movement execution, etc. ST is anaerobic training, affecting the nervous and muscular systems by, among other things, activating motor units [3,4] and increasing the physiological cross-section of muscles [5]. Its effect on endurance capacity is most likely due to improved economy of movement [10,11,12,13,33,36].
Hoff et al. [9] proved that the use of high-intensity 85%1RM strength training in cross-country skiers improved running economy by as much as 20.5%. According to the authors, the improvement in endurance occurred as a result of improved economy of movement, and this due to neuromuscular adaptations that improve muscle strength. Similar findings were presented by Østerås et al. [11]. Heggelund et al. [36], in their study, also demonstrated that 8 weeks of strength training improved economy on a bicycle ergometer. Participants were divided into two groups; the first performed training 3x a week with a volume of three series of ten repetitions and an intensity of 50–60% of 1RM. The second group performed maximal strength training amounting to three series of five repetitions with an intensity of 85% 1RM. The higher-intensity physical training was followed by a 31% improvement in work economy, while the lower-intensity exercise group improved by only 18%. The findings suggest that higher-intensity training is more effective in building endurance through the development of maximal muscle strength. Referring to a study by Loveless et al. [10], ST training with a slightly different volume (four series of five repetitions), intensity of 85% 1RM and frequency of 3x per week also improved cycling economy. The authors suggest that the improvement in running economy occurred through neuromuscular adaptations, as cardiovascular and respiratory indices did not change, and lean body mass did not change either. Støren et al. [13] proved in their study that 8 weeks of maximal strength training improves running economy (equivalent to 70% VO2max) by 5%.

Limitation of the Study, Practical Applications

It should be kept in mind that the use of other training protocols may result in different training efficiencies. In future studies, it seems necessary not only to examine the effectiveness of two separate protocols (ST vs. AIT), but also the simultaneous combination of both protocols. Our training protocol was relatively short; it would be additionally advisable to increase the duration of the training mesocycle from 6 weeks to 8 or 12 weeks, testing whether and how these training modifications would affect the variables studied. AIT was performed on cycle ergometers; other forms of activity may yield different results. Our training interventions lasted 6 weeks, during which we did not modify the loads (e.g., we did not verify 1RM (ST) and power at VT1 and VT2 (AIT)). This could have affected the magnitude of progress in the measured performance indicators, as the loads could have become less effective over time due to training adaptation. However, re-testing would have required interrupting training for several days, which would have disrupted the entire training intervention. Manipulation of parameters in ST training, such as the number of repetitions (three to five repetitions were used in this study), to eight or twelve could also have other effects, such as in other studies [10,11,12,13,33,36] that reported improved work economy. The study involved non-trained men, so the effectiveness of the applied training in trained individuals may be different. It also seems necessary to verify the effectiveness of these interventions in women. This study also did not investigate the physiological and biochemical mechanisms underlying the observed changes, but only evaluated the acute effects of training on aerobic and anaerobic capacity in young, untrained men. It therefore also seems necessary to assess the long-term effects. Our results suggest that, particularly in anaerobic–aerobic sports, strength training may be a training method that can simultaneously improve both anaerobic power and maximal oxygen uptake. It can also complement endurance training. Our study was not randomized. The lack of random selection of participants may have resulted in uncontrolled confounding variables also influencing the reported results.

5. Conclusions

Strength training proved to be an effective method of aerobic capacity training. After ST and AIT, the maximal oxygen uptake of the participants increased significantly, and the observed effect size was comparable in the AIT and ST groups. Aerobic endurance, assessed by ventilatory thresholds, did not change significantly under the influence of strength training. Only aerobic interval training had a favorable effect on oxygen uptake at the level of the second ventilatory threshold. The results of the present study are of great applied importance to coaches and individuals wishing to improve both anaerobic and aerobic capacity. ST may be useful if the training goal is to increase maximal power and maximal oxygen uptake, but it is not beneficial for improving VT2.

Author Contributions

Conceptualization, M.M. and A.D.; methodology, M.M. and A.D.; validation, M.M.; formal analysis, M.M.; investigation, A.D.; resources, M.M.; data curation, A.D.; writing—original draft preparation, A.D.; writing—review and editing, M.M.; visualization, A.D.; supervision, M.M.; project administration, M.M.; funding acquisition, A.D. All authors have read and agreed to the published version of the manuscript.

Funding

This research was funded by University of Physical Education, Kraków, Poland, grant number: 156/MN/INB/2022.

Institutional Review Board Statement

The study was conducted in accordance with the Declaration of Helsinki, and approved by the Ethics Committee of the Regional Medical Chamber in Kraków, Poland No. 187/KBL/OIL/2022; date: 1 July 2022.

Informed Consent Statement

Informed consent was obtained from all subjects involved in the study.

Data Availability Statement

The raw data supporting the conclusions of this article will be made available by the authors on request.

Conflicts of Interest

The authors declare no conflicts of interest.

Abbreviations

The following abbreviations are used in this manuscript:
STstrength training
AITaerobic interval training
CONcontrol group
PPpeak power
MPmean power
FIfatigue index
Pmaxmaximal power
VO2maxmaximal oxygen uptake
HRmaxmaximal heart rate
RERrespiratory exchange ratio
VTventilatory threshold

References

  1. Gastin, P.B. Quantification of anaerobic capacity. Scand. J. Med. Sci. Sports 1994, 4, 91–112. [Google Scholar] [CrossRef]
  2. Sözen, H. The effects of aerobic and anaerobic training on aerobic and anaerobic capacity. J. Int. Anatolia Sport Sci. 2018, 3, 331–337. [Google Scholar] [CrossRef]
  3. Aagaard, P. Training-induced changes in neural function. Exerc. Sport Sci. Rev. 2003, 31, 61–67. [Google Scholar] [CrossRef] [PubMed]
  4. Conwit, R.A.; Stashuk, D.; Tracy, B.; McHugh, M.; Brown, W.F.; Metter, E.J. The relationship of motor unit size, firing rate and force. Clin. Neurophysiol. 1999, 110, 1270–1275. [Google Scholar] [CrossRef] [PubMed]
  5. Jones, E.J.; Bishop, P.A.; Woods, A.K.; Green, J.M. Cross-sectional area and muscular strength: A brief review. Sports Med. 2008, 38, 987–994. [Google Scholar] [CrossRef] [PubMed]
  6. Kraemer, W.J.; Patton, J.F.; Gordon, S.E.; Harman, E.A.; Deschenes, M.R.; Reynolds, K.; Dziados, J.E. Compatibility of high-intensity strength and endurance training on hormonal and skeletal muscle adaptations. J. Appl. Physiol. 1995, 78, 976–989. [Google Scholar] [CrossRef] [PubMed]
  7. Sporiš, G.; Jovanović, M.; Krakan, I.; Fiorentini, F. Effects of strength training on aerobic and anaerobic power in female soccer players. Sport Sci. 2011, 4, 32–37. [Google Scholar]
  8. Vikmoen, O.; Ellefsen, S.; Trøen, Ø.; Hollan, I.; Hanestadhaugen, M.; Raastad, T.; Rønnestad, B. Strength training improves cycling performance, fractional utilization of VO2max and cycling economy in female cyclists. Scand. J. Med. Sci. Sports 2016, 26, 384–396. [Google Scholar] [CrossRef] [PubMed]
  9. Hoff, J.; Gran, A.; Helgerud, J. Maximal strength training improves aerobic endurance performance. Scand. J. Med. Sci. Sports 2002, 12, 288–295. [Google Scholar] [CrossRef] [PubMed]
  10. Loveless, D.J.; Weber, C.L.; Haseler, L.J.; Schneider, D.A. Maximal leg-strength training improves cycling economy in previously untrained men. Med. Sci. Sports Exerc. 2005, 37, 1231–1236. [Google Scholar] [CrossRef] [PubMed]
  11. Østerås, H.; Helgerud, J.; Hoff, J. Maximal strength-training effects on force-velocity and force-power relationships explain increases in aerobic performance in humans. Eur. J. Appl. Physiol. 2002, 88, 255–263. [Google Scholar] [CrossRef] [PubMed]
  12. Rønnestad, B.R.; Hansen, J.; Hollan, I.; Ellefsen, S. Strength training improves performance and pedaling characteristics in elite cyclists. Scand. J. Med. Sci. Sports 2015, 25, 89–98. [Google Scholar] [CrossRef] [PubMed]
  13. Støren, Ø.; Helgerud, J.N.; Støa, E.M.; Hoff, J.N. Maximal strength training improves running economy in distance runners. Med. Sci. Sports Exerc. 2008, 40, 1087–1092. [Google Scholar] [CrossRef] [PubMed]
  14. Hu, M.; Finni, T.; Sedliak, M.; Zhou, W.; Alen, M.; Cheng, S. Seasonal variation of red blood cell variables in physically inactive men: Effects of strength training. Int. J. Sports Med. 2008, 29, 564–568. [Google Scholar] [CrossRef] [PubMed]
  15. Schjerve, I.E.; Tyldum, G.A.; Tjønna, A.E.; Stølen, T.; Loennechen, J.P.; Hansen, H.E.; Wisløff, U. Both aerobic endurance and strength training programmes improve cardiovascular health in obese adults. Clin. Sci. 2008, 115, 283–293. [Google Scholar] [CrossRef] [PubMed]
  16. Beneke, R. Methodological aspects of maximal lactate steady state implications for performance testing. Eur. J. Appl. Physiol. 2003, 89, 95–99. [Google Scholar] [CrossRef] [PubMed]
  17. Coyle, E.F. Integration of the physiological factors determining endurance performance ability. Exerc. Sport Sci. Rev. 1995, 23, 25–64. [Google Scholar] [CrossRef] [PubMed]
  18. Mahood, N.V.; Kenefick, R.W.; Kertzer, R.; Quinn, T.J. Physiological determinants of cross-country ski racing performance. Med. Sci. Sports Exerc. 2001, 33, 1379–1384. [Google Scholar] [CrossRef] [PubMed]
  19. Wasserman, K.; Beaver, W.L.; Whipp, B.J. Gas exchange theory and the lactic acidosis (anaerobic) threshold. Circulation 1990, 81, 14–30. [Google Scholar]
  20. Maciejczyk, M.; Szymura, J.; Cempla, J.; Gradek, J.; Więcek, M.; Bawelski, M. Respiratory compensation point during incremental test in overweight and normoweight boys: Is it useful in assessing aerobic performance? A longitudinal study. Clin. Physiol. Funct. Imaging 2014, 34, 56–63. [Google Scholar] [CrossRef] [PubMed]
  21. Maciejczyk, M.; Wiecek, M.; Szymura, J.; Cempla, J.; Wiecha, S.; Szygula, Z.; Brown, L.E. Effect of body composition on respiratory compensation point during an incremental test. J. Strength Cond. Res. 2014, 28, 2071–2077. [Google Scholar] [CrossRef] [PubMed]
  22. Meyer, T.; Faude, O.; Scharhag, J.; Urhausen, A.; Kindermann, W. Is lactic acidosis a cause of exercise induced hyperventilation at the respiratory compensation point? Br. J. Sports Med. 2004, 38, 622–625. [Google Scholar] [CrossRef] [PubMed]
  23. Blair, S.N.; Haskell, W.L.; Ho, P.; Paffenbarger, J.R.R.S.; Vranizan, K.M.; Farquhar, J.W.; Wood, P.D. Assessment of habitual physical activity by a Seven-Day recall in a community survey and controlled experiments. Am. J. Epidemiol. 1985, 122, 794–804. [Google Scholar] [CrossRef] [PubMed]
  24. Sarkin, J.; Campbell, J.; Gross, L.; Roby, J.; Bazzo, S.; Sallis, J.; Calfas, K. Sevenday physical activity recall. Med. Sci. Sports Excerc. 1997, 29, 89–103. [Google Scholar]
  25. Inbar, O.; Bar-Or, O. Anaerobic characteristics in male children and adolescents. Med. Sci. Sports Excerc. 1986, 18, 264–269. [Google Scholar] [CrossRef] [PubMed]
  26. Coleman, S.G.S.; Hale, T.; Hamley, E.J. A comparison of power outputs with rolling and stationary starts in the Wingate Anaerobic Test. J. Sports Sci. 1985, 3, 207. [Google Scholar]
  27. Howley, E.T.; Bassett, D.R.; Welch, H.G. Criteria for maximal oxygen uptake: Review and commentary. Med. Sci. Sports Excerc. 1995, 27, 1292–1301. [Google Scholar] [CrossRef]
  28. Bhambhani, Y.; Singh, M. Ventilatory thresholds during a graded exercise test. Respiration 1985, 47, 120–128. [Google Scholar] [CrossRef] [PubMed]
  29. Binder, R.K.; Wonisch, M.; Corra, U.; Cohen-Solal, A.; Vanhees, L.; Saner, H. Methodological approach to the firstand second lactate threshold in incremental cardiopulmonaryexercise testing. Eur. J. Prev. Cardiol. 2008, 15, 726–734. [Google Scholar] [CrossRef] [PubMed]
  30. Sheppard, J.M.; Triplett, N.T.; Haf, G.G.; Triplett, N.T. Essentials of Strength Training and Conditioning. Strength Cond. J. 2016, 4, 452. [Google Scholar]
  31. Cohen, J. Statistical power analysis for the behavioral sciences. Routledge 2013, 58–59. [Google Scholar]
  32. Maté-Muñoz, J.L.; Domínguez, R.; Lougedo, J.H.; Garnacho-Castaño, M.V. The lactate and ventilatory thresholds in resistance training. Clin. Physiol. Funct. Imaging 2017, 37, 518–524. [Google Scholar] [CrossRef] [PubMed]
  33. Sunde, A.; Støren, Ø.; Bjerkaas, M.; Larsen, M.H.; Hoff, J.; Helgerud, J. Maximal strength training improves cycling economy in competitive cyclists. J. Strength Cond. Res. 2010, 24, 2157–2165. [Google Scholar] [CrossRef] [PubMed]
  34. Nakao, M.; Inoue, Y.; Murakami, H. Longitudinal study of the effect of high intensity weight training on aerobic capacity. Eur. J. Appl. Physiol. Occup. Physiol. 1995, 70, 20–25. [Google Scholar] [CrossRef] [PubMed]
  35. Cantrell, G.S.; Schilling, B.K.; Paquette, M.R.; Murlasits, Z. Maximal strength, power, and aerobic endurance adaptations to concurrent strength and sprint interval training. Eur. J. Appl. Physiol. 2014, 114, 763–771. [Google Scholar] [CrossRef] [PubMed]
  36. Heggelund, J.; Fimland, M.S.; Helgerud, J.; Hoff, J. Maximal strength training improves work economy, rate of force development and maximal strength more than conventional strength training. Eur. J. Appl. Physiol. 2013, 113, 1565–1573. [Google Scholar] [CrossRef] [PubMed]
Figure 1. Effect of strength training on peak power (PP) (*: p < 0.05; NS: non-significant; CON: control group; ST: strength training; AIT: aerobic interval training; vertical bars indicate a 0.95 confidence interval).
Applsci 15 07953 g001
Figure 2. Effect of strength training on absolute maximal oxygen uptake (VO2max) (*: p < 0.05; NS: non-significant; CON: control group; ST: strength training; AIT: aerobic interval training; vertical bars indicate a 0.95 confidence interval).
Applsci 15 07953 g002
Figure 3. Effect of strength training on maximal power output (Pmax) (*: p < 0.005; NS: non-significant; CON: control group; ST: strength training; AIT: aerobic interval training; vertical bars indicate a 0.95 confidence interval).
Applsci 15 07953 g003
Table 1. Age and body build of the participants (data are presented as mean ± SD).
VariableGroupMean ± SD
Age
[yrs]
CON22.8 ± 1.7
ST22.4 ± 3.2
AIT20.6 ± 1
BH
[cm]
CON178.1 ± 7.1
ST179.7 ± 4.3
AIT180 ± 5.7
BM
[kg]
CON73.3 ± 9.2
ST82.9 ± 8.3
AIT77 ± 8.6
LBM
[kg]
CON60.2 ± 6.4
ST66 ± 6.8
AIT63.4 ± 6.1
FM
[kg]
CON13.1 ± 4.3
ST16.9 ± 4.5
AIT13.6 ± 4.1
FM
[%]
CON17.6 ± 4.3
ST20.3 ± 4.5
AIT17.4 ± 3.9
BMI
[kg/m2]
CON23.1 ± 2.1
ST25.6 ± 2.1
AIT23.7 ± 2.2
BH: body height; BM: body mass; LBM: lean body mass; FM: fat mass; BMI: body mass index; CON: control group; ST: strength training; AIT: aerobic interval training.
Table 2. Training plan implemented by the strength group.
WeekTrainingExerciseVolume
(Series × Reps)
Intensity
[%1RM]
Pace (s)Recovery Time (s)
II1. Barbell squat5 × 570%3/0/1/0180 s
2. Push press3 × 570%3/0/1/0180 s
3. Hip thrust3 × 570%3/0/1/0180 s
4. Nordic curl3 × 3Body mass4/0/1/0180 s
II1. Deadlift3 × 570%3/1/1/0180 s
2. Bulgarian squat3 × 570%3/0/1/0180 s
3. Calf raise on leg press machine3 × 570%3/0/1/0180 s
4. Abs wheel3 × 5Body mass3/0/1/0180 s
III1. Barbell squat3 × 570%1/2/1/0180 s
2. Push press3 × 570%1/0/1/0180 s
3. Hip thrust3 × 570%1/0/1/2180 s
4. Nordic curl3 × 3Body mass4/0/1/0180 s
IIIV1. Barbell squat3 × 580%3/0/1/0240 s
2. Push press3 × 580%3/0/1/0240 s
3. Hip thrust3 × 580%3/0/1/0240 s
4. Nordic curl3 × 3Body mass4/0/1/0180 s
V1. Deadlift3 × 580%3/1/1/0240 s
2. Bulgarian squat3 × 580%1/0/1/0240 s
3. Calf raise on leg press machine3 × 580%3/0/1/0180 s
4. Abs wheel3 × 5Body mass1/0/1/2180 s
VI1. Barbell squat3 × 580%1/2/1/0240 s
2. Push press3 × 580%1/0/1/0240 s
3. Hip thrust3 × 580%1/0/1/2240 s
4. Nordic curl3 × 3Body mass3/0/1/0180 s
IIIVII1. Barbell squat5 × 580%3/0/1/0240 s
2. Push press3 × 580%3/0/1/0240 s
3. Hip thrust3 × 580%3/0/1/0240 s
4. Nordic curl3 × 4Body mass3/0/1/0180 s
VIII1. Deadlift3 × 580%3/1/1/0240 s
2. Bulgarian squat3 × 580%1/0/1/0240 s
3. Calf raise on leg press machine3 × 580%3/0/1/0180 s
4. Abs wheel4 × 5Body mass1/0/1/2180 s
IX1. Barbell squat3 × 580%1/2/1/0240 s
2. Push press3 × 580%1/0/1/0240 s
3. Hip thrust3 × 580%1/0/1/2240 s
4. Nordic curl3 × 4Body mass3/0/1/0180 s
IVX1. Barbell squat3 × 385%1/0/1/0300 s
2. Push press3 × 385%1/0/1/0300 s
3. Hip thrust3 × 385%1/0/1/0300 s
4. Nordic curl3 × 4Body mass3/0/1/0180 s
XI1. Deadlift3 × 385%1/1/1/0300 s
2. Bulgarian squat3 × 585%1/0/1/0300 s
3. Calf raise on leg press machine3 × 585%3/0/1/0180 s
4. Abs wheel4 × 5Body mass1/0/1/2180 s
XII1. Barbell squat3 × 385%1/2/1/0300 s
2. Push press3 × 385%1/0/1/0300 s
3. Hip thrust3 × 385%1/0/1/0300 s
4. Nordic curl3 × 4Body mass3/0/1/0180 s
VXIII1. Barbell squat5 × 385%1/0/1/0300 s
2. Push press3 × 385%1/0/1/0300 s
3. Hip thrust3 × 385%1/0/1/0300 s
4. Nordic curl3 × 5Body mass3/0/1/0180 s
XIV1. Deadlift3 × 385%1/1/1/0300 s
2. Bulgarian squat3 × 585%1/0/1/0300 s
3. Calf raise on leg press machine3 × 585%3/0/1/0180 s
4. Abs wheel5 × 5Body mass1/0/1/0180 s
XV1. Barbell squat3 × 385%1/2/1/0300 s
2. Push press3 × 385%1/0/1/0300 s
3. Hip thrust3 × 385%1/0/1/0300 s
4. Nordic curl3 × 5Body mass3/0/1/0180 s
VIXVI1. Barbell squat1 × 385%1/0/1/0300 s
2. Push press1 × 385%1/0/1/0300 s
3. Hip thrust1 × 385%1/0/1/0300 s
4. Nordic curl1 × 5Body mass3/0/1/0180 s
XVII1. Bulgarian squat3 × 585%1/0/1/0300 s
2. Calf raise on leg press machine3 × 585%3/0/1/0180 s
3. Abs wheel3 × 5Body mass1/0/1/0180 s
XVIII1. Barbell squat1 × 1100%1/0/1/0300 s
2. Deadlift1 × 1100%1/0/1/0300 s
3. Hip thrust1 × 1100%1/0/1/0300 s
Pace: eccentric/pause/concentric/pause.
Table 3. Effects of strength training on parameters noted at anaerobic capacity test (data are presented as mean ± SD).
VariableGroupPrePostEffect: Group
F
p
ηp2
Effect: Time
F
p
ηp2
Interaction
F
p
ηp2
Post-HocES
MP
[W]
CON639.99 ± 91.98637.92 ± 92.941.557.585.410.990.02
ST671.06 ± 86.19697.25 ± 78.830.220.0010.0010.0020.32
AIT685.44 ± 76.29691.22 ± 8.850.070.150.20.940.07
rel_MP
[W/kg]
CON8.74 ± 0.728.69 ± 0.753.022.542.480.990.07
ST8.12 ± 0.968.37 ± 0.760.060.120.10.120.29
AIT8.94 ± 0.759.01 ± 1.050.120.060.10.980.08
PP
[W]
CON810.57 ± 132.39796.79 ± 137.794.2713.6510.740.730.10
ST894.15 ± 112.28944.15 ± 116.190.02<0.001<0.001<0.0010.44
AIT896.07 ± 121.14922.91 ± 106.290.170.240.340.090.24
rel_PP
[W/kg]
CON11.06 ± 1.0710.83 ± 1.223.267.047.390.640.20
ST10.8 ± 0.9511.32 ± 1.020.050.010.002<0.0010.53
AIT11.66 ± 1.0312.02 ± 1.150.130.140.260.150.33
FI
[%]
CON21.61 ± 6.6920.39 ± 4.465.140.792.010.870.22
ST25.97 ± 4.7927.45 ± 5.870.010.380.150.750.28
AIT24.02 ± 5.9425.42 ± 40.20.020.090.780.28
FI
[W/s]
CON14.16 ± 4.1214.37 ± 3.599.385.830.80.990.05
ST18.79 ± 3.0819.92 ± 3.25<0.0010.020.460.40.36
AIT16.8 ± 4.0917.9 ± 1.990.310.120.040.420.36
MP: mean power; PP: peak power; FI: fatigue index; CON: control group; ST: strength training; AIT: aerobic interval training.
Table 4. Effects of strength training on parameters noted at maximal intensity (data are presented as mean ± SD).
VariableGroupPrePostEffect: Group
F
p
ηp2
Effect: Time
F
p
ηp2
Interaction
F
p
ηp2
Post-HocES
Pmax
[W]
CON248 ± 27.84242.5 ± 28.4411.2212.719.010.780.20
ST235 ± 33.86254 ± 38.75<0.001<0.001<0.001<0.0010.52
AIT286.87 ± 33.69299.53 ± 35.840.350.230.30.050.36
rel_Pmax
[W/kg]
CON3.38 ± 3.043.3 ± 3.1713.417.737.460.660.03
ST2.84 ± 4.063.04 ± 4.63<0.001<0.001<0.0010.010.05
AIT3.72 ± 3.933.88 ± 4.250.390.150.260.090.04
HRmax
[bpm]
CON186.33 ± 10.43184.33 ± 10.220.291.081.440.760.19
ST184.6 ± 9.47186 ± 9,770.990.970.250.930.15
AIT184.87 ± 10.88185.53 ± 14.20.010.010.060.990.05
VO2max
[L/min]
CON3.16 ± 0.413.14 ± 0.416.6919.516.630.990.05
ST3.06 ± 0.553.34 ± 0.560.002<0.0010.003<0.0010.50
AIT3.58 ± 0.363.78 ± 0.370.240.320.240.020.55
VO2max
[ml/kg/min]
CON43.87 ± 7.1943.33 ± 6.757.4211.585.230.980.08
ST37.4 ± 8.0240.07 ± 7.210.0020.001<0.0010.020.35
AIT46.93 ± 5.9149.47 ± 6.090.260.220.190.030.42
RERCON1.18 ± 0.091.14 ± 0.094.8811.980.040.320.44
ST1.19 ± 0.081.16 ± 0.090.010.0010.960.490.38
AIT1.12 ± 0.051.08 ± 0.070.190.220.0010.280.80
Pmax: maximal power output; HRmax: maximal heart rate; VO2max: maximal oxygen uptake; RER: respiratory exchange ratio; CON: control group; ST: strength training; AIT: aerobic interval training.
Table 5. Effects of strength training on parameters noted at the second ventilatory threshold (data are presented as mean ± SD).
VariableGroupPrePostEffect: Group
F
p
ηp2
Effect: Time
F
p
ηp2
Interaction
F
p
ηp2
Post-HocES
PVT2
(W)
CON136 ± 19.42136.3 ± 26.19.341.940.781.00.01
ST130 ± 37.03134 ± 33.76<0.0010.170.460.980.11
AIT164.93 ± 19.42175.53 ± 26.080.310.040.040.510.47
Pmax
[%]
CON54.7 ± 8.6256.7 ± 8.20.710.0010.980.970.24
ST55.33 ± 13.1252.6 ± 10.460.490.970.390.880.23
AIT58.07 ± 8.6259 ± 8.20.030.030.040.990.11
HRVT2
[bpm]
CON136.8 ± 13.2137.3 ± 16.653.140.160.010.990.03
ST139.33 ± 14.39141.2 ± 16.150.050.690.910.990.12
AIT148.93 ± 13.19148.8 ± 16.650.130.0030.0051.00.01
HRmax
[%]
CON72.93 ± 6.2174.73 ± 6.254.470.430.370.890.29
ST75.47 ± 7.3575.8 ± 7.930.020.510.690.990.04
AIT80.4 ± 6.2280.2 ± 6.250.170.010.020.990.03
VO2VT2
[L/min]
CON1.84 ± 0.261.87 ± 0.3311.086.671.110.990.10
ST1.78 ± 0.421.89 ± 0.38<0.0010.010.340.650.28
AIT2.19 ± 0.262.38 ± 0.330.340.140.050.040.64
VO2max
[%]
CON58.1 ± 10.160.6 ± 8.51.350.630.610.860.27
ST58 ± 8.6357.13 ± 9.570.270.430.550.990.10
AIT61.73 ± 10.0763.13 ± 8.50.060.010.030.990.15
Pmax: power output; VT2: second ventilatory threshold; HR: heart rate; VO2: oxygen uptake; CON: control group; ST: strength training; AIT: aerobic interval training.
Disclaimer/Publisher’s Note: The statements, opinions and data contained in all publications are solely those of the individual author(s) and contributor(s) and not of MDPI and/or the editor(s). MDPI and/or the editor(s) disclaim responsibility for any injury to people or property resulting from any ideas, methods, instructions or products referred to in the content.

