Article

Implementing an AI-Based Digital Twin Analysis System for Real-Time Decision Support in a Custom-Made Sportswear SME

by
Tõnis Raamets
*,
Kristo Karjust
,
Jüri Majak
and
Aigar Hermaste
Department of Mechanical and Industrial Engineering, School of Engineering, Tallinn University of Technology, Ehitajate tee 5, 19086 Tallinn, Estonia
*
Author to whom correspondence should be addressed.
Appl. Sci. 2025, 15(14), 7952; https://doi.org/10.3390/app15147952
Submission received: 9 June 2025 / Revised: 9 July 2025 / Accepted: 10 July 2025 / Published: 17 July 2025

Abstract

Small and medium-sized enterprises (SMEs) in the manufacturing sector often struggle to make effective use of production data due to fragmented systems and limited digital infrastructure. This paper presents a case study of implementing an AI-enhanced digital twin in a custom sportswear manufacturing SME developed under the AI and Robotics Estonia (AIRE) initiative. The solution integrates real-time production data collection using the Digital Manufacturing Support Application (DIMUSA); data processing and control; clustering-based data analysis; and virtual simulation for evaluating improvement scenarios. The framework was applied in a live production environment to analyze workstation-level performance, identify recurring bottlenecks, and provide interpretable visual insights for decision-makers. K-means clustering and DBSCAN were used to group operational states and detect process anomalies, while simulation was employed to model production flow and assess potential interventions. The results demonstrate how even a lightweight AI-driven system can support human-centered decision-making, improve process transparency, and serve as a scalable foundation for Industry 5.0-aligned digital transformation in SMEs.

1. Introduction

The digital transformation of manufacturing has progressed rapidly over the past decade, driven by the principles of Industry 4.0, which encompass automation, data exchange, and cyber-physical systems [1,2]. While these advancements have enabled greater efficiency and traceability in large-scale enterprises, small and medium-sized enterprises (SMEs) often encounter structural, financial, and technical obstacles that impede the adoption of advanced digital tools. SMEs involved in small-batch, order-based production frequently operate with fragmented systems, manual data collection, and limited analytical capabilities, which restrict their ability to adapt flexibly to process variations and inefficiencies [3]. The emerging paradigm of Industry 5.0 introduces a complementary perspective, highlighting human-centric, sustainable, and resilient manufacturing systems [4,5]. Instead of replacing humans with automation, Industry 5.0 aims to enhance human capabilities through digital tools that foster interpretability, collaboration, and adaptive decision-making. In this context, digital twins (DTs) have emerged as a key enabler, providing real-time representations of physical systems and establishing a foundation for simulation, optimization, and intelligent feedback through the sensors. Previous research has illustrated the potential of digital twins in high-volume manufacturing, particularly when integrated with artificial intelligence (AI) for predictive modeling and control. However, their application in SMEs remains restricted, primarily due to the complexity and cost of implementation, as well as the need for interpretable, human-aligned outputs [6]. This study is based on the principle that even lightweight, modular digital twin systems, if appropriately designed, can yield significant value in SME environments. The research was conducted as part of the AI and Robotics Estonia (AIRE) initiative, a national competence center at Tallinn University of Technology, that promotes the “test before invest” philosophy, allowing companies to experiment with digital solutions before full-scale deployment [7,8]. The case presented in this paper focuses on a small to medium-sized enterprise (SME) in Estonia that specializes in the manufacture of custom sportswear. The project aimed to implement a real-time digital twin framework built on the Digital Manufacturing Support Application (DIMUSA), enhanced with cluster-based analytics and virtual simulation [9,10]. The aim was to analyze workstation-level data, identify process bottlenecks, and assist production decisions in a format that could be easily interpreted by operators and managers. While digital twins have been widely applied in highly automated, high-volume environments, their practical use in SMEs with flexible, order-based production remains underexplored. Furthermore, this study utilizes a digital shadow, a one-way, real-time data display of production processes, rather than a full bidirectional digital twin, which is more suitable for SME conditions. This study aims to address this gap by implementing and evaluating an AI-supported digital shadow system for real-time decision-making in a custom sportswear SME. The primary objective is to identify and mitigate performance bottlenecks and to enhance responsiveness through simulation-based analysis and clustering of workstation-level performance data. The approach draws inspiration from Lean manufacturing principles and follows a DMAIC-style methodology (Define, Measure, Analyze, Improve, Control), enabling systematic analysis of production inefficiencies in a dynamic SME context [11,12]. The paper begins by outlining the methodological framework, including the system architecture, data sources, and analytical tools used in the study. This is followed by a presentation of the implementation results and insights gained from the pilot case. The discussion then examines the implications of these findings for Industry 5.0 and digitalization in small and medium-sized enterprises. The paper concludes with reflections on lessons learned and suggestions for future research.

2. Materials and Methods

To evaluate the proposed digital twin framework in a real-world production environment, a pilot implementation was carried out at a custom-made sportswear SME in Estonia. This section outlines the structure and components of the solution, including the system architecture, simulation model, data collection methods, and analytical techniques employed for process monitoring and improvement. The approach was developed collaboratively with company stakeholders to ensure minimal disruption and maximum clarity.

2.1. Overview of the Framework

The AI-based digital twin proposed integrates three main components:
(1)
real-time production data acquisition and processing,
(2)
cluster analysis to detect production patterns and anomalies, and
(3)
simulation for validating improvement scenarios and visualizing process behavior.
The solution architecture is illustrated in Figure 1. The central element of the framework is the DIMUSA platform(v1.4, 2024 release), which collects and organizes workstation-level production data via a custom-built Application Programming Interface (API). These data are enriched with contextual information (e.g., product type, shift time) and fed into a clustering module for unsupervised analysis. Simulation models are used both to explore process optimization options and to validate analytical outputs under controlled, repeatable conditions. To ensure systematic and replicable implementation, the approach draws inspiration from Lean manufacturing principles and follows a DMAIC-style methodology (Define, Measure, Analyze, Improve, Control), commonly used in Six Sigma frameworks. In the Define phase, the project scope was established in collaboration with stakeholders, focusing on production delays, idle times, and prioritization issues. During the Measure phase, real-time data on workstation utilization, cycle durations, and product flow were collected through the DIMUSA interface. The Analyze phase employed K-means clustering to classify workstation performance and identify inefficiencies. In the Improve phase, simulation experiments with Tecnomatix Plant Simulation tested improvement strategies, such as operator reassignment and task re-sequencing. Finally, the Control phase proposed real-time monitoring dashboards based on digital shadow logic, allowing operators and managers to track KPIs and detect deviations early. This structured approach supports informed decision-making and continuous improvement in dynamic SME environments.

2.2. Production Environment Description

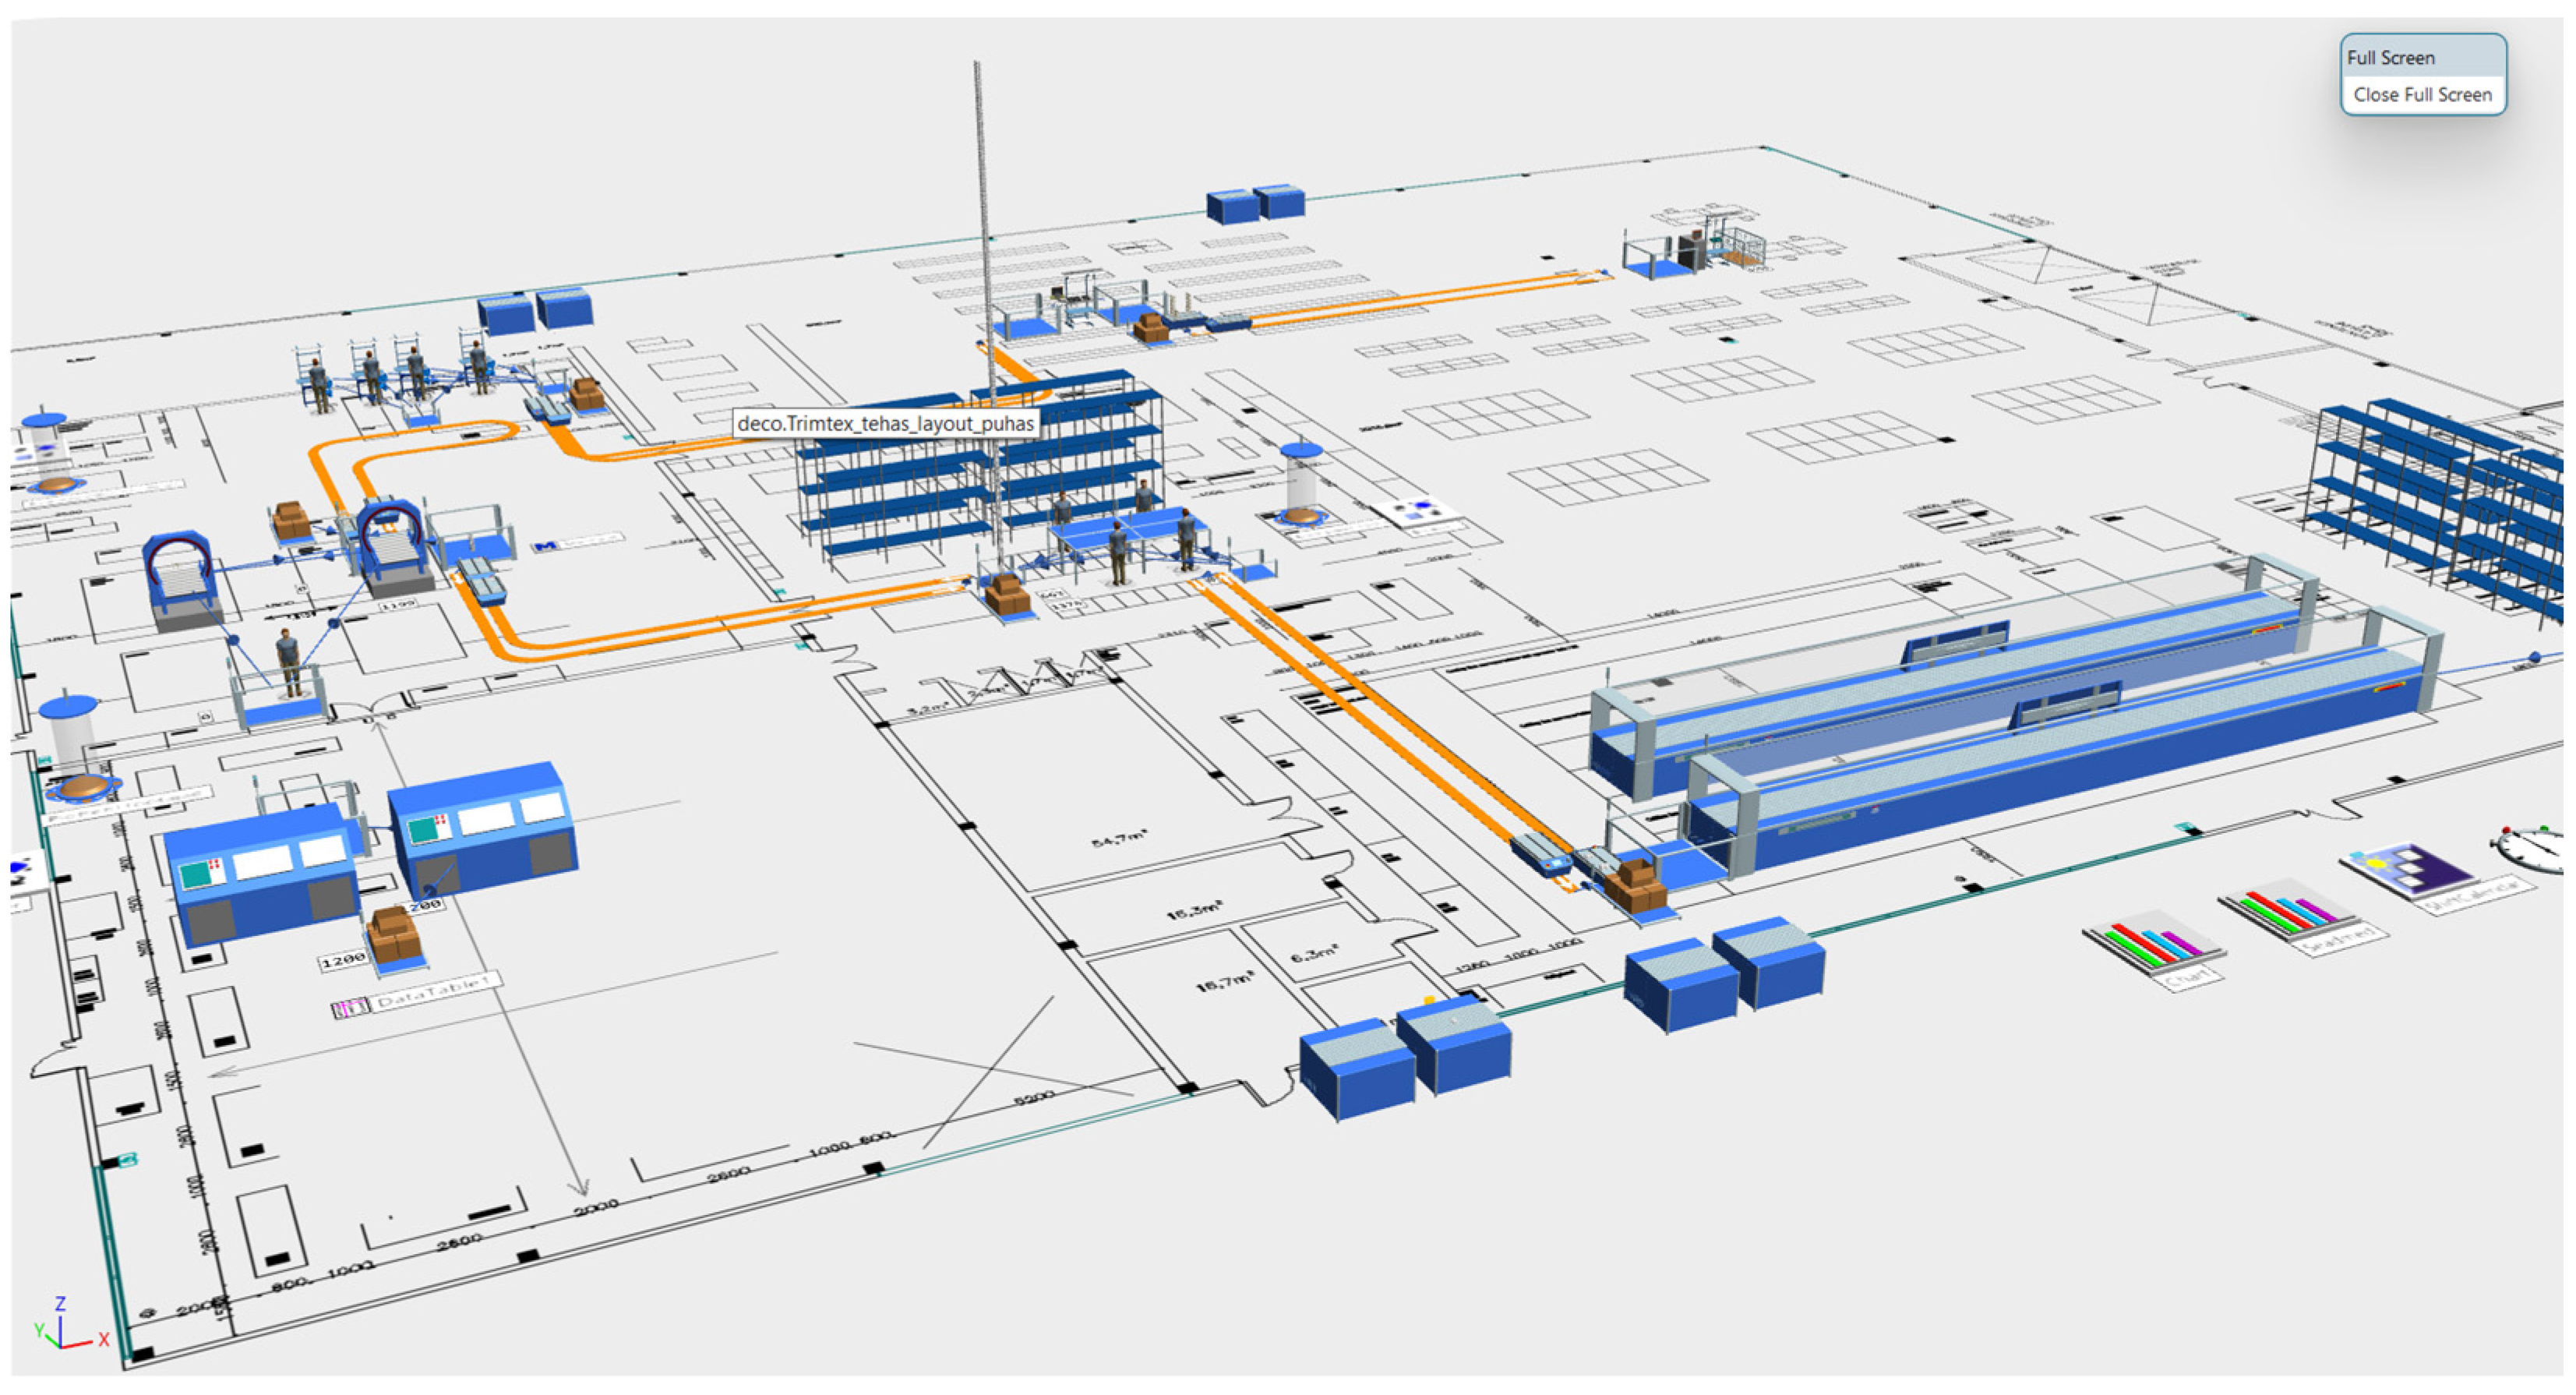
The pilot company specializes in small-batch, order-based production. Products are made-to-order, often in varying quantities and combinations, which creates a highly dynamic and variable production flow. The shop floor is divided into functional workstations, including fabric cutting, sewing, printing, and packaging. Before the pilot, the company relied heavily on manual data entry and Excel-based reporting, which limited visibility into real-time performance and made it challenging to detect inefficiencies across workstations [13]. The project aimed to implement a more automated and interpretable system for production monitoring, bottleneck detection, and decision support. The production system is structured into sequential workstation zones, each responsible for specific stages of the process. These include fabric cutting, preparation, printing, and packaging. Figure 2 illustrates the physical layout of the production area, highlighting the relative positions of the workstations involved in the pilot implementation. This layout informed sensor placement, data mapping, and the clustering logic used throughout the study.
Table 1 presents the list of workstation codes used in the pilot implementation, along with their corresponding functions and process descriptions. These stations represent the core steps in the company’s small-batch production workflow, including material handling, cutting, preparation, pressing, quality control, sewing, and packaging. The coding was used in both data collection and simulation modeling to map digital records to physical operations.

2.3. Virtual Factory Simulation

To complement and validate the analytical logic, a simplified virtual factory simulation model was developed using Siemens Plant Simulation software (2025) [14]. The simulation tested hypotheses generated from clustering analysis, such as workstation overloads, underutilization, and unexpected waiting states, by recreating similar patterns in a controlled environment. This approach allowed the team to assess the causality of observed anomalies and adjust their interpretation of data patterns accordingly. In addition to diagnostic use, the simulation environment enabled the testing of improvement scenarios. Changes such as layout reconfiguration, workstation reordering, and order sequencing modifications were evaluated for their impact on throughput, lead times, and resource balancing [15]. The model mirrored the pilot company’s production flow, incorporating dynamic order routing, buffer behavior, and empirically derived cycle time distributions. The simulation ensured that the real-time data architecture and analytics aligned with the actual process behavior before full deployment [16]. Furthermore, it served as an effective communication tool to explain complex process dynamics to non-technical personnel and facilitate decision-making discussions [17]. Figure 3 shows a screenshot of the virtual factory simulation model used during the pilot.

2.4. Data Acquisition and Integration

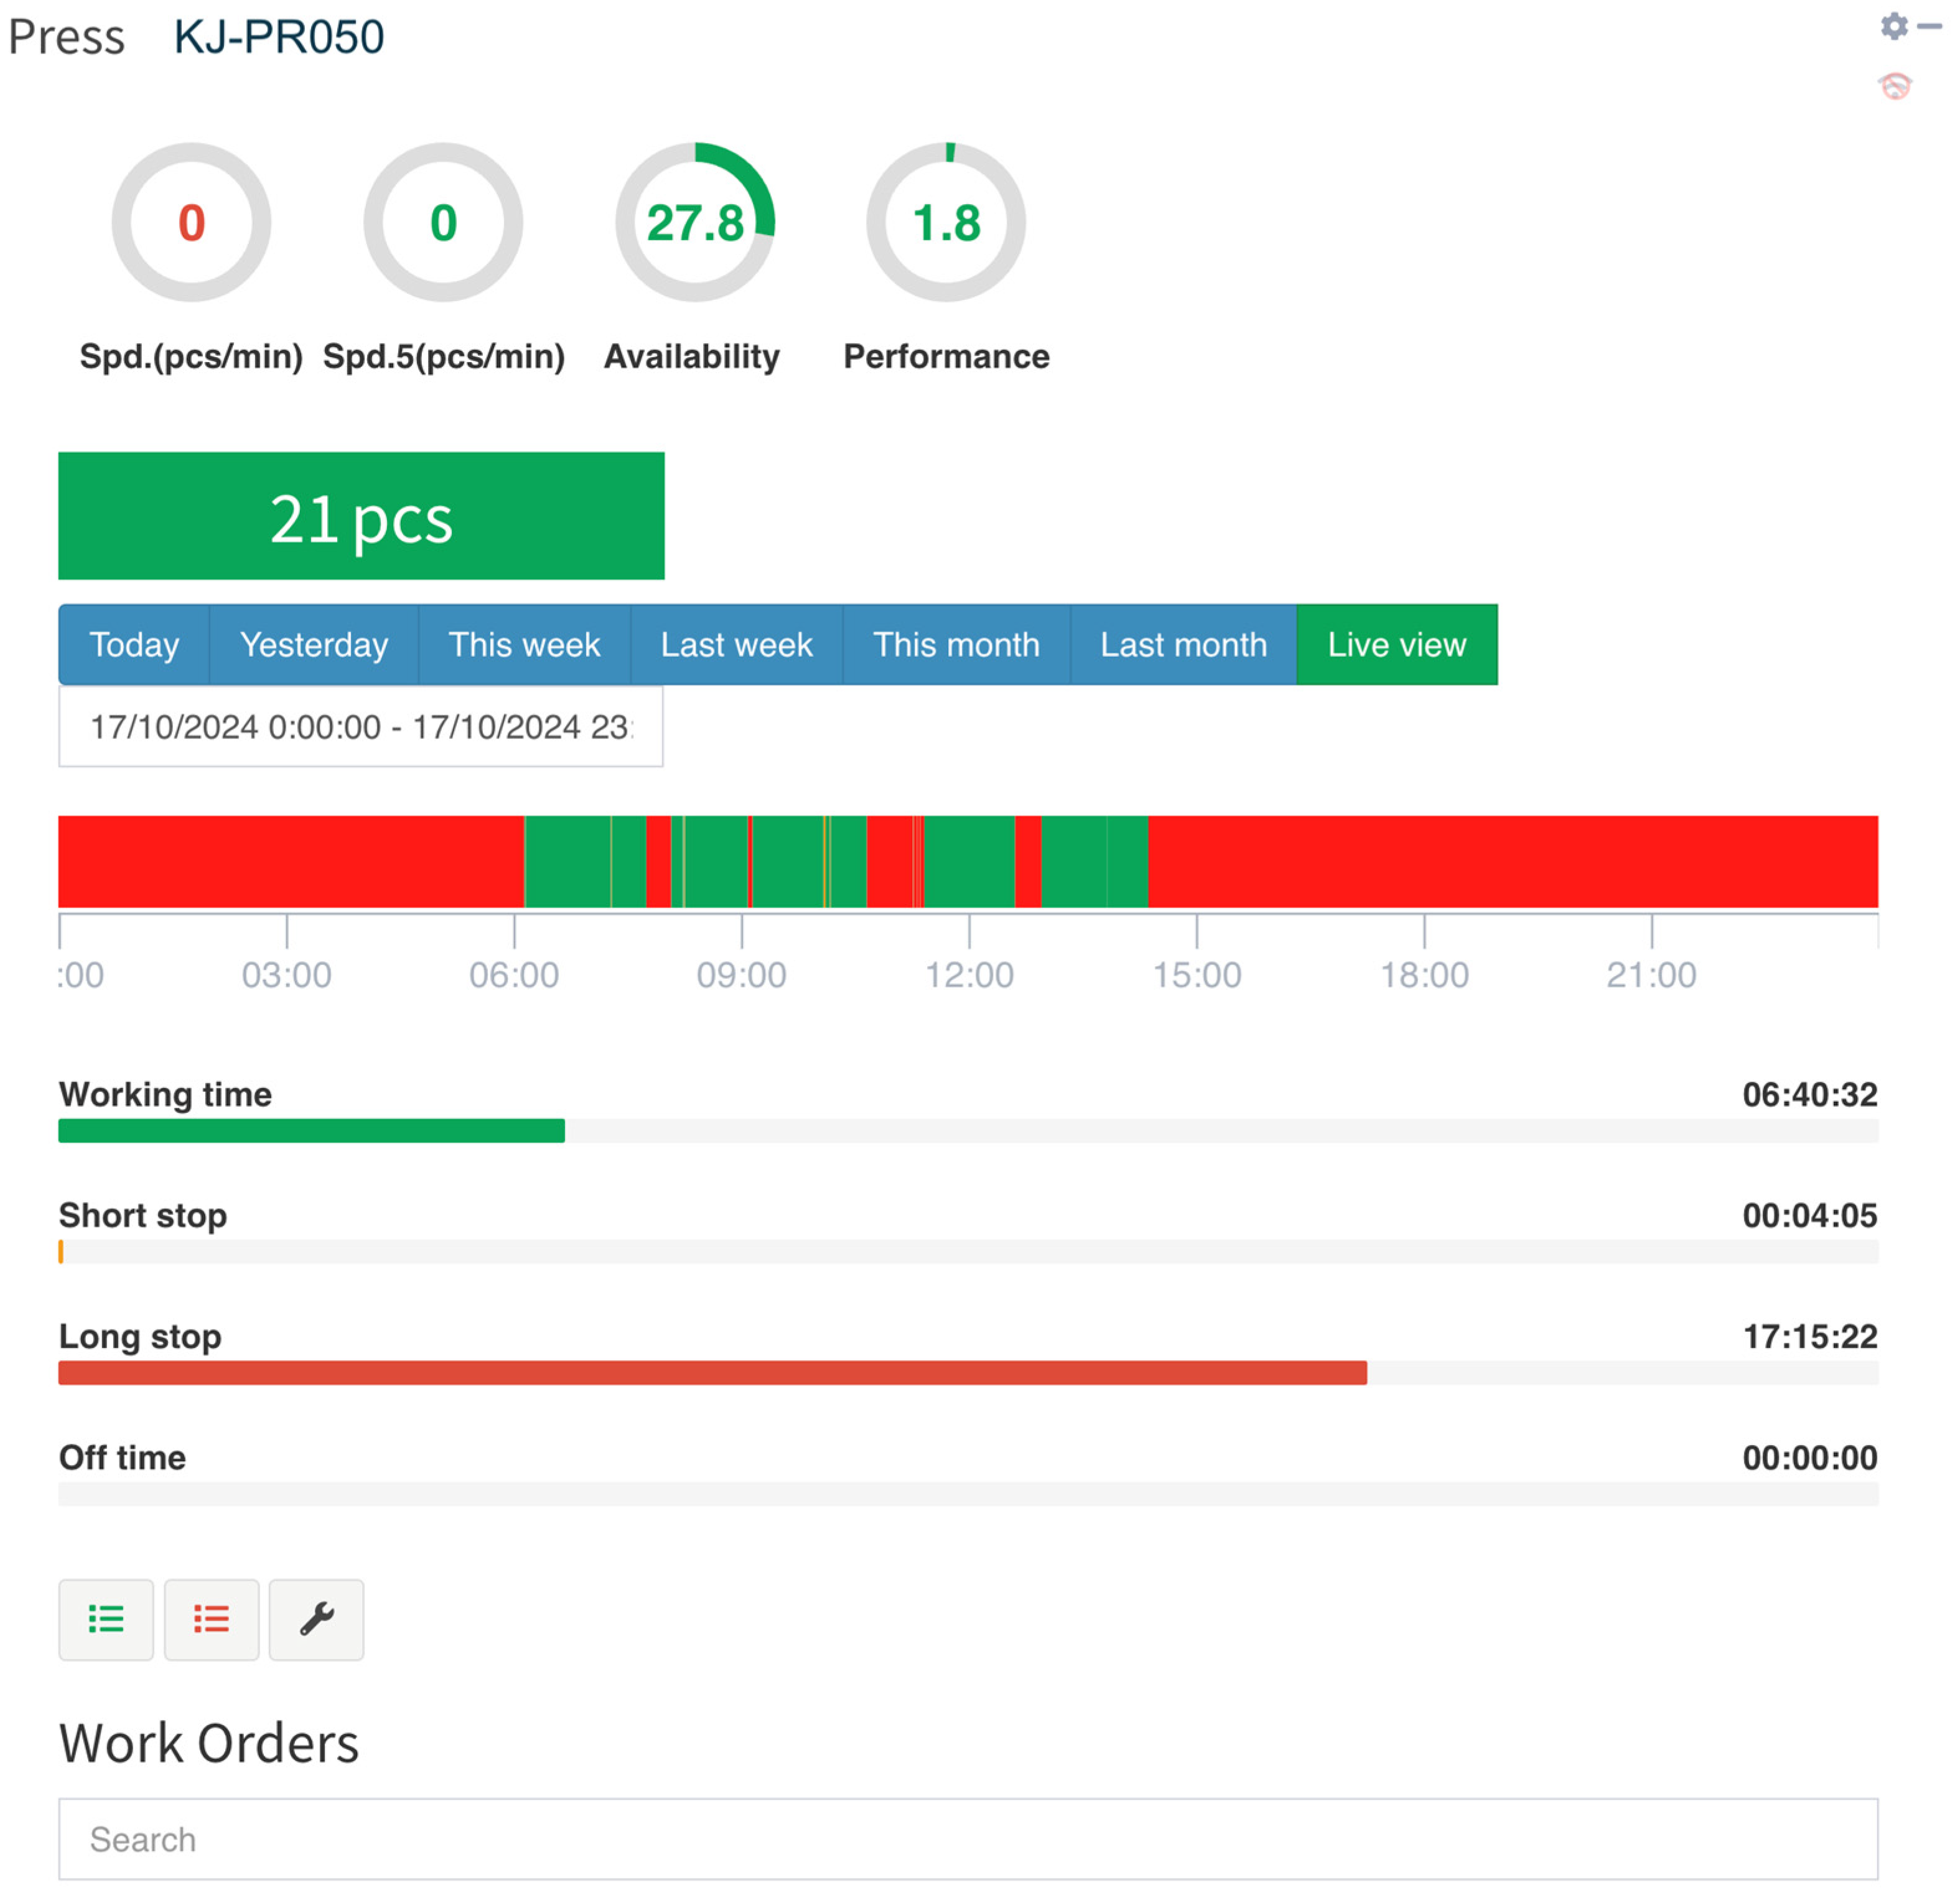
To support real-time data acquisition in the pilot project, a custom data pipeline was developed by integrating multiple existing and purpose-built components. The company’s Enterprise Resource Planning (ERP) system provided information on production orders and routing. At the same time, Microsoft Excel365 (Version 2406, Build 17726.20126), enhanced with Visual Basic for Applications (VBA) macros, was used for manual input and structured formatting. A custom-developed API enabled live data collection from shop-floor terminals and edge devices directly from workstations. All collected data were then centralized and visualized within the DIMUSA platform, serving as the primary hub for both monitoring and analysis. The data captured through this system included the order number, product ID, workstation identifier, and precise timestamps marking the start and end of operations. In cases of interruptions or abnormal events, operators manually entered reason codes and additional contextual information. These structured and timestamped records provided the analytical foundation for performance evaluation and cluster-based analysis in the subsequent stages of the project. Figure 4 illustrates the interface of the DIMUSA system platform, which is used for live monitoring and manual input. The dashboard enabled operators and supervisors to track production progress, identify and visualize the bottlenecks, and contribute relevant context during exception events, enhancing both traceability and interpretability throughout the system.

2.5. Clustering and Analysis Methods

To analyze workstation performance and identify process inefficiencies, a two-step clustering workflow was applied to the simulation data generated by the virtual factory simulation model. The first step involved outlier filtering using the DBSCAN (Density-Based Spatial Clustering of Applications with Noise) algorithm [18]. This technique was used to detect and remove anomalous data points, such as unusually long idle periods or sequences of very short cycles, which could distort cluster structure and introduce interpretation bias. In DBSCAN, a point x is considered a core point if it has at least a minimum number of neighboring points (minPts) within a specified radius (ε):
Equation (1).
N ε x = { y D | x y | ε } , and N ε x minPts
After outlier removal, K-means clustering was applied to categorize the remaining workstation-level data into interpretable operational states [19,20]. This enabled grouping of behaviors into clusters representing conditions such as “stable,” “delayed,” or “high variation.” The goal of K-means is to minimize the total intra-cluster variance:
Equation (2).
min C 1 , , C k j = 1 k x i C j | x i μ j | 2
where C j Is the set of data points in cluster j, µ j It is the centroid of cluster j, and k is the predefined number of clusters.
The clustering results were visualized to compare simulated performance across workstations over one one-month period. Figure 5 shows the Overall Equipment Effectiveness (OEE) values for each workstation over a month. This time-based view forms the basis for the next clustering analysis, which groups workstations by similar performance patterns. Each line corresponds to a specific workstation, as identified by the layout codes provided in Table 1. Additionally, this summary highlights the top five and bottom five stations based on overall efficiency, helping guide further investigation and process improvements.

3. Results

The digital twin framework was deployed in the production environment of a custom-made sportswear manufacturing SME over a six-month pilot period. During this time, data were collected from multiple workstations, processed through the DIMUSA platform, and analyzed using a combination of clustering and simulation techniques. The following sections present the key findings derived from this implementation, highlighting patterns in workstation behavior, performance bottlenecks, and the effects of proposed optimization scenarios.

3.1. Production Data Characteristics

Initial input data for the simulation model-including factory layout, selected product types, routing sequences, and partial workstation cycle times, provided by the company in Excel format based on exports from their ERP system. These data formed the baseline for constructing the virtual factory simulation. Excel also served as the company’s primary tool for production planning and operational feedback. Throughout the project, this initial dataset was iteratively refined to improve the realism and fidelity of the simulation model. To validate and enrich the simulation inputs, selected production workstations were instrumented with DIMUSA hardware for real-time monitoring. On the plotter workstation, current sensors were successfully used to detect active plotting periods, enabling an accurate view of operational cycles. However, on the heat-based press workstation, current-based monitoring proved ineffective, as the heating system remained continuously powered during the entire shift. To overcome this limitation, a part-counting sensor was installed on the press to identify the start and end of each print cycle by detecting the movement of physical materials. In addition to sensor-based monitoring, a manual reporting phase was conducted during one week of the pilot, during which operators logged task start and completion events via the DIMUSA interface. Although limited in duration, this experiment helped assess data quality and train staff on accurate input procedures. DIMUSA data were collected continuously over a six-month period from selected workstations, while simulation data covered a three-month virtual period. Bidirectional data flow was established between Excel and the DIMUSA platform. Task orders were imported into DIMUSA for execution monitoring, and actual start and end times were exported back to Excel for further analysis. Collected data included equipment usage, cycle time durations, idle intervals, and manually logged exceptions. To ensure reliability, post-processing steps were applied to filter out simulation artifacts, correct manual input errors, and align reported events with equipment-level OEE indicators [21]. Before applying cluster analysis, the dataset was cleaned to improve interpretability and accuracy. Based on the simulation and monitoring results, the plotter and press workstations were selected as focal points for deeper analysis, given their high load, complexity, and integration with both DIMUSA sensors and manual reporting channels. These workstations exhibited the highest OEE scores and output volumes during the monitoring period within one month, as shown in Table 2. Their central role in the company’s mini-batch production process, starting from plot file generation to material preparation and pressing, further justified the focus. Table 1 provides a summary of workstation-level KPIs for October 2024, highlighting the relative performance of each monitored station in terms of availability, performance, quality, OEE, Total Effective Equipment Performance (TEEP), and production results.

3.2. Cluster Analysis Results

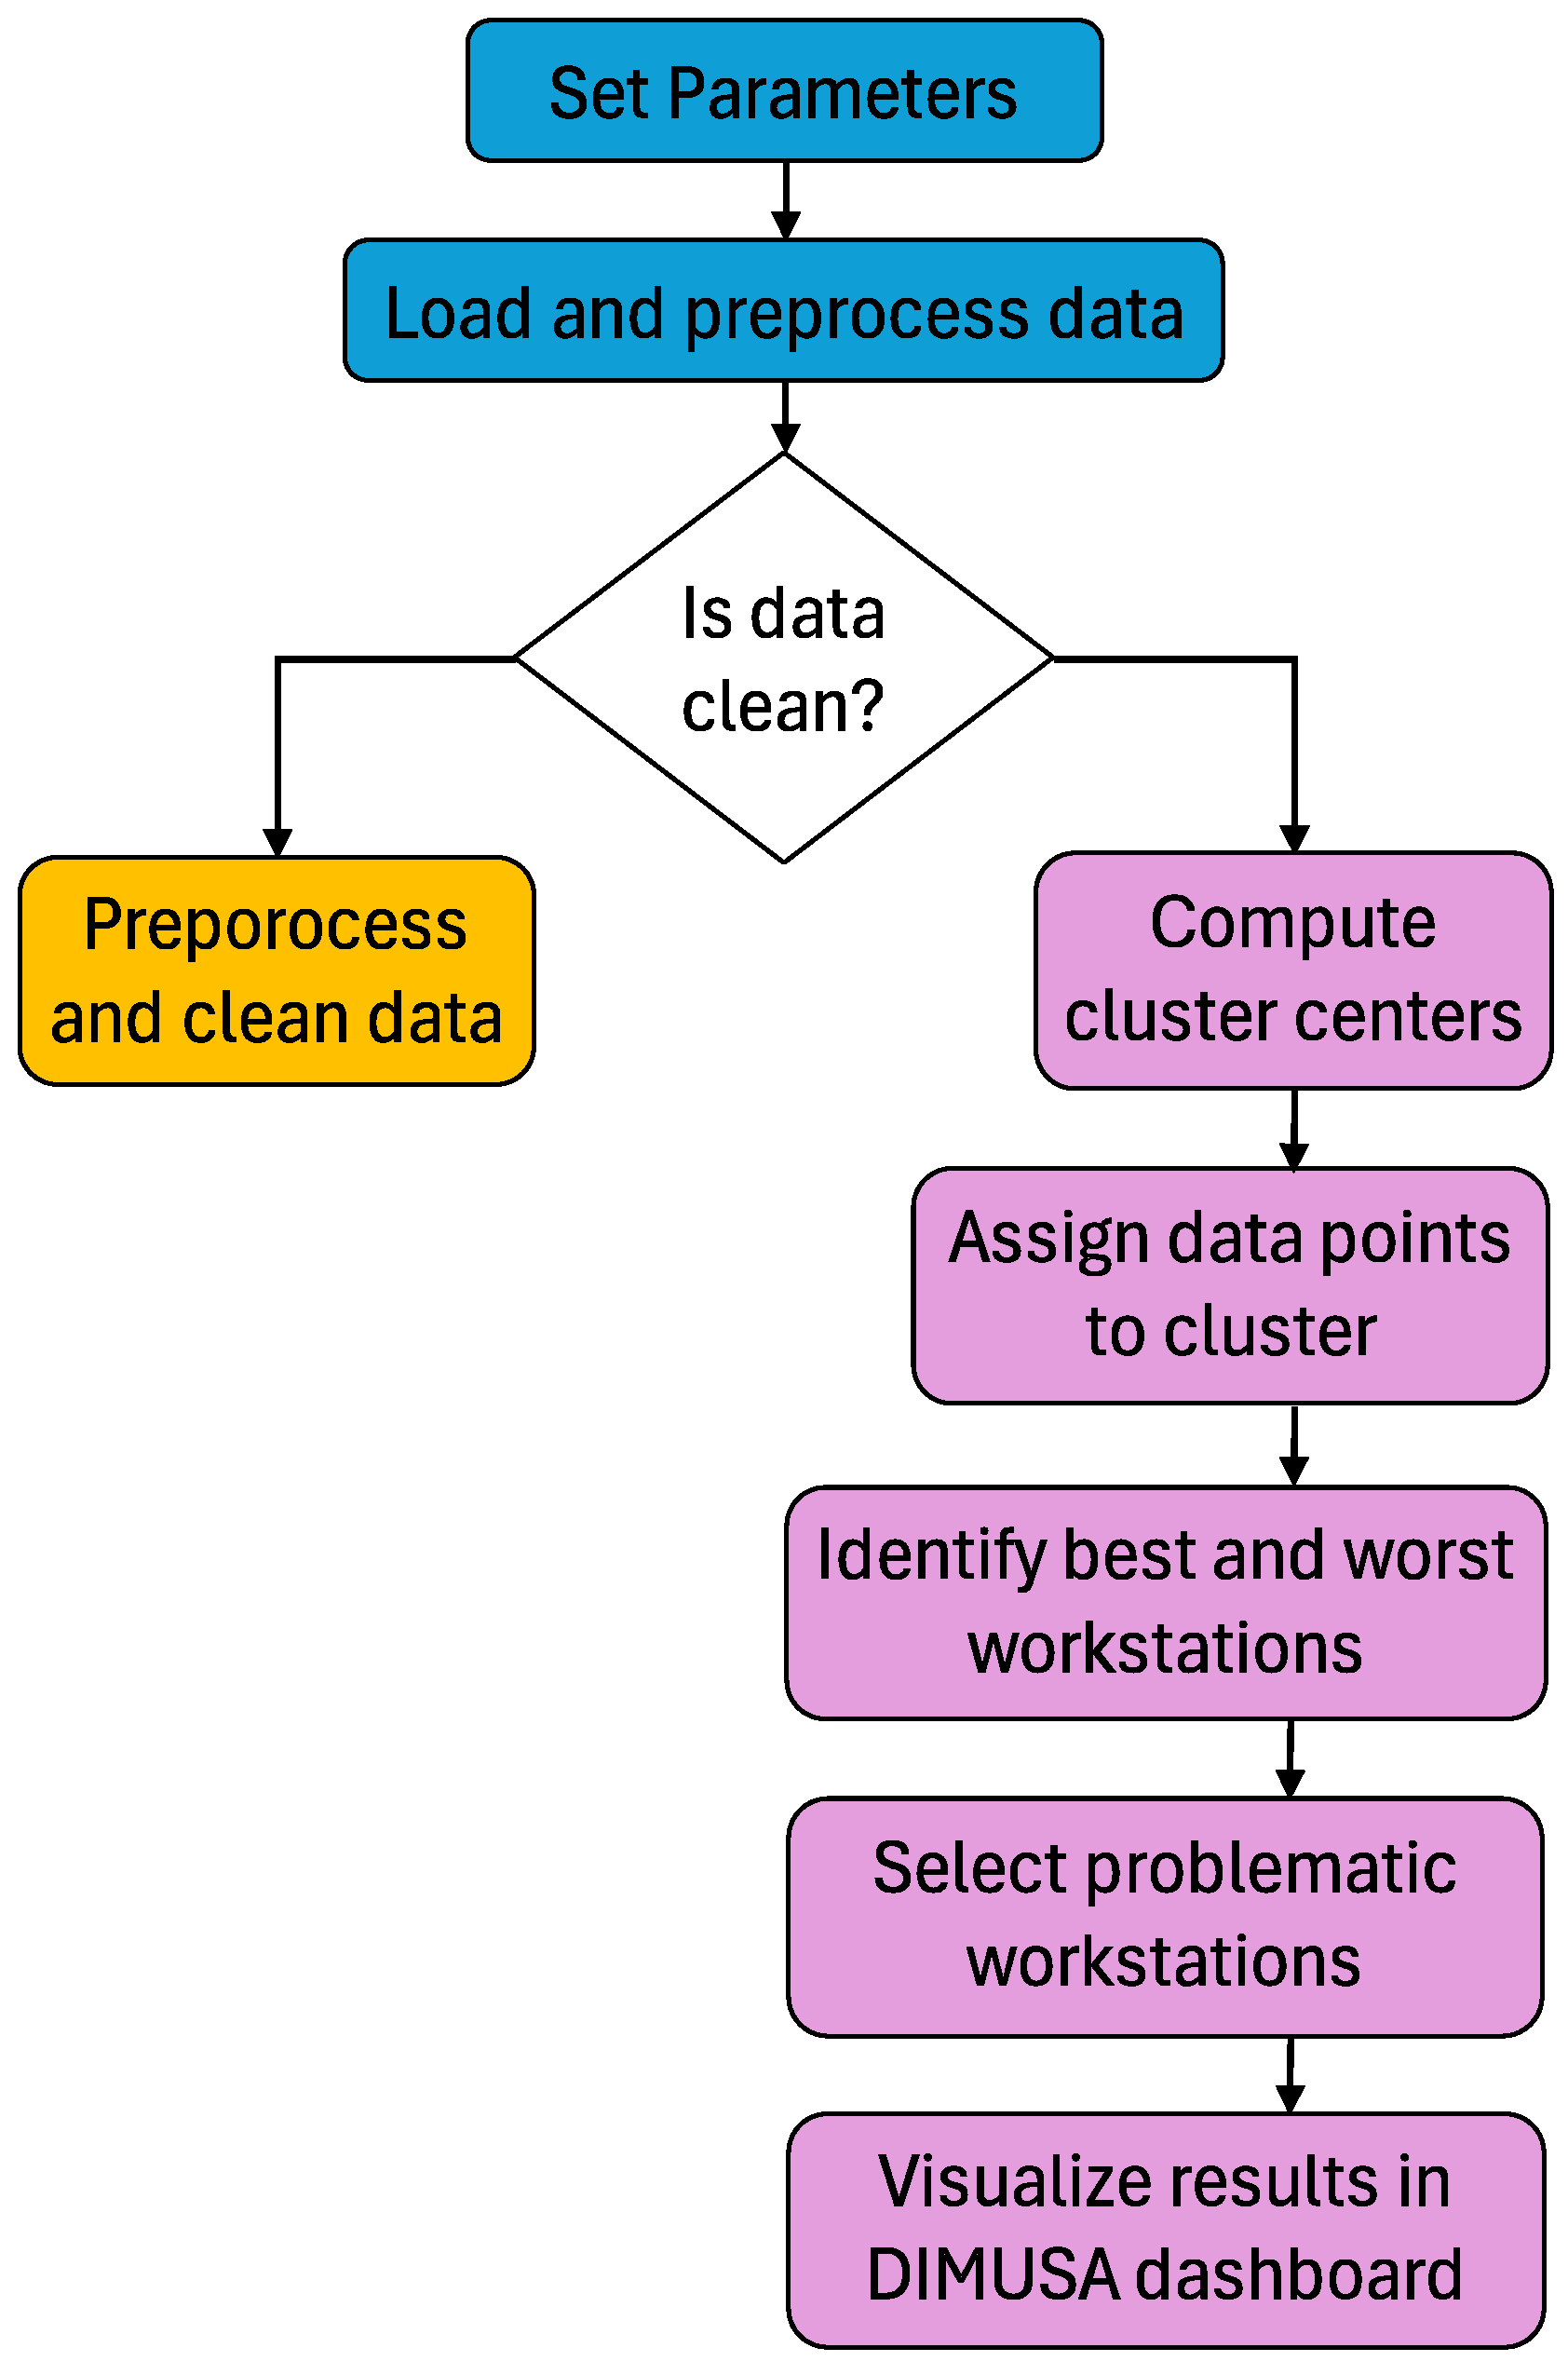
A clustering-based analytical workflow was applied to the preprocessed production dataset to identify performance patterns and anomalies across workstations. The methodology combined DBSCAN-based prefiltering with K-means clustering to enhance robustness and interpretability. The dataset was first cleaned and normalized. Key performance indicators were selected as clustering features, including OEE, availability, performance, quality, and state durations (produced, off, short, long, and working). Categorical workstation labels were encoded numerically, and timestamps were converted into a consistent datetime format. DBSCAN was used to remove noise and outliers, including negative values and unrealistic cycle durations [22]. Afterward, K-means clustering was applied with k = 5, producing five representative operational states [23]. The most representative workstation and a median timestamp were identified for each cluster to support interpretation. Cluster centroids were computed and enriched with metadata, enabling performance comparison across stations and time windows. Average OEE scores then ranked workstations to identify top and bottom performers, while problematic stations were flagged for deeper investigation. The entire process, from parameter definition to final visualization, followed a structured analysis pipeline [24]. This included feature selection, validation checks, outlier handling (e.g., logarithmic transformations), and cluster labeling. Both the DBSCAN and K-means clustering algorithms were implemented in Python (version 3.12) and integrated into the DIMUSA system as part of its analytical backend. The results were visualized through the DIMUSA dashboard as interactive time-series views and color-coded status overlays, enabling planners and supervisors to identify root-cause opportunities for improvement. The complete clustering workflow is illustrated in Figure 6, which served as the basis for implementing data-driven diagnostics in a live production setting.
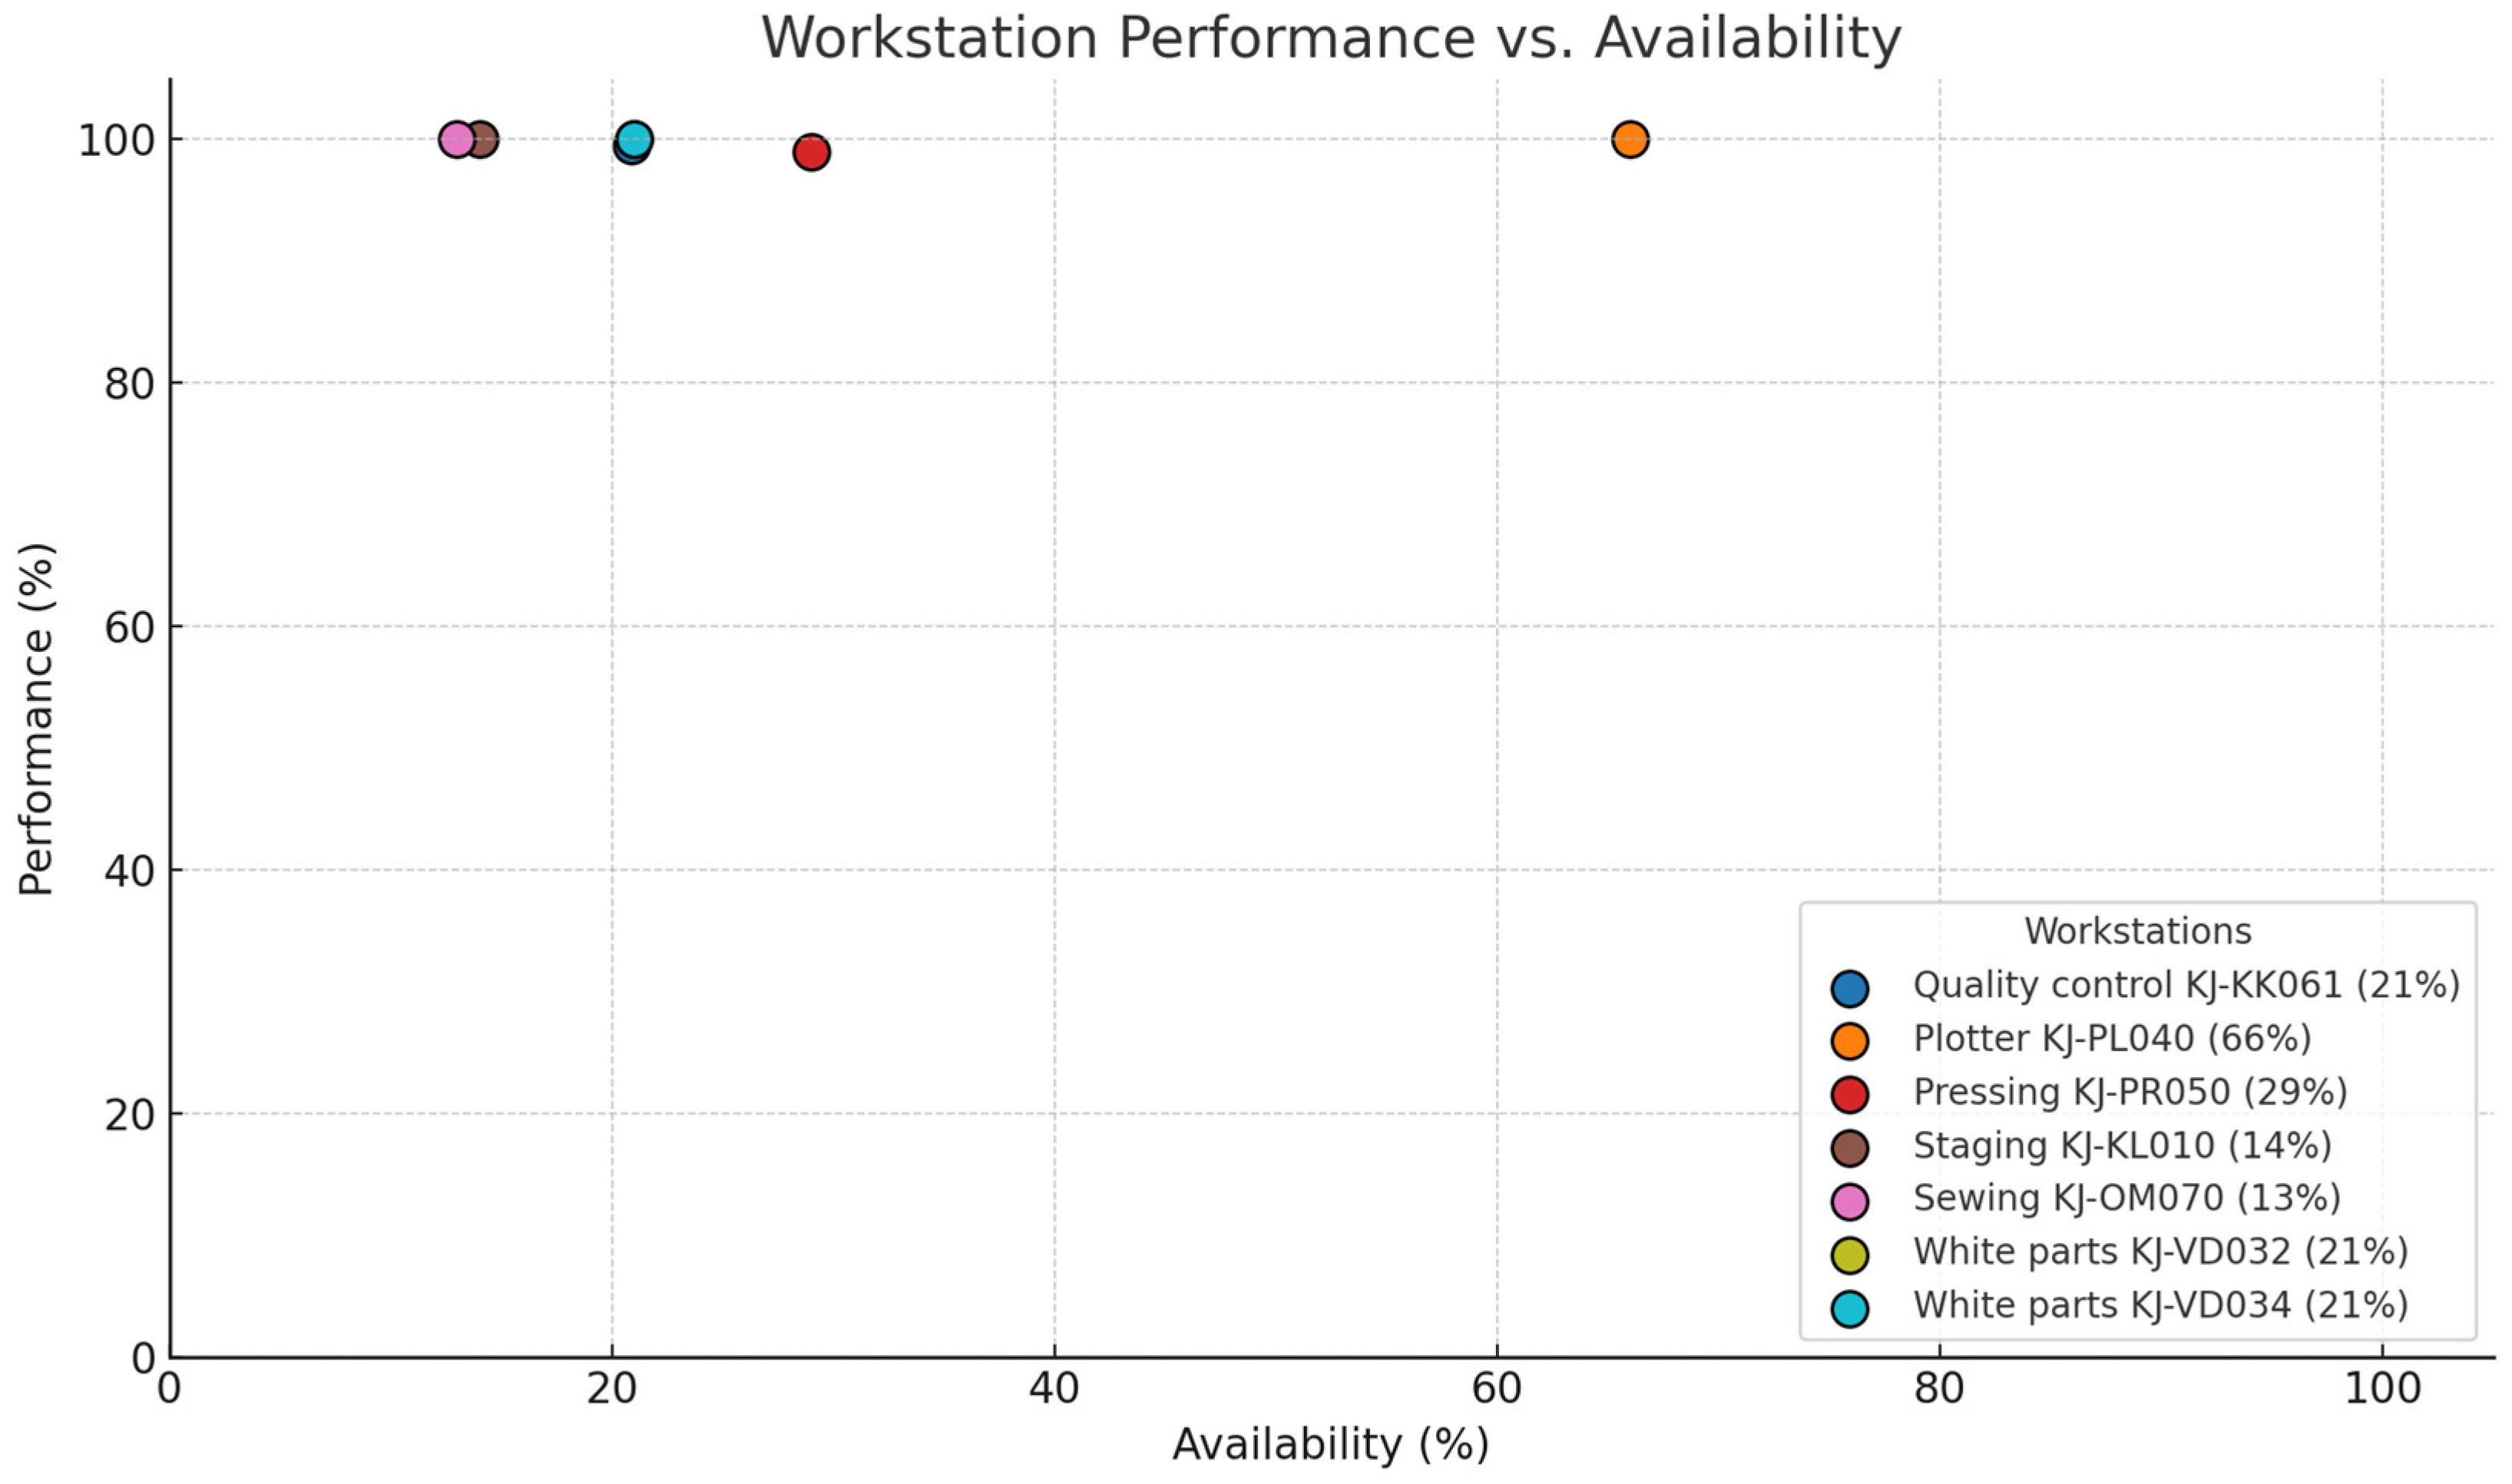
The clustering results were further visualized using a two-dimensional scatter plot to map the relationship between availability and performance across all monitored workstations. Figure 7 presents the cluster distribution based on the simulation data collected throughout October 2024. Each data point represents the aggregated performance of a workstation for a given time window, with color-coded labels indicating the different stations. The visualized output closely corresponds to the quantitative results shown in Table 1, providing a fast and intuitive overview of workstation utilization. The chart effectively highlights performance disparities, such as the consistently high workload of the plotter and press stations. When large volumes of production data are involved, this type of visual summary can significantly accelerate interpretation by production planners, enabling them to detect trends, anomalies, and bottlenecks with greater clarity and precision. The graph serves as a valuable decision-support tool in daily operations, guiding attention and improvement efforts.

3.3. Identified Bottlenecks and Insights

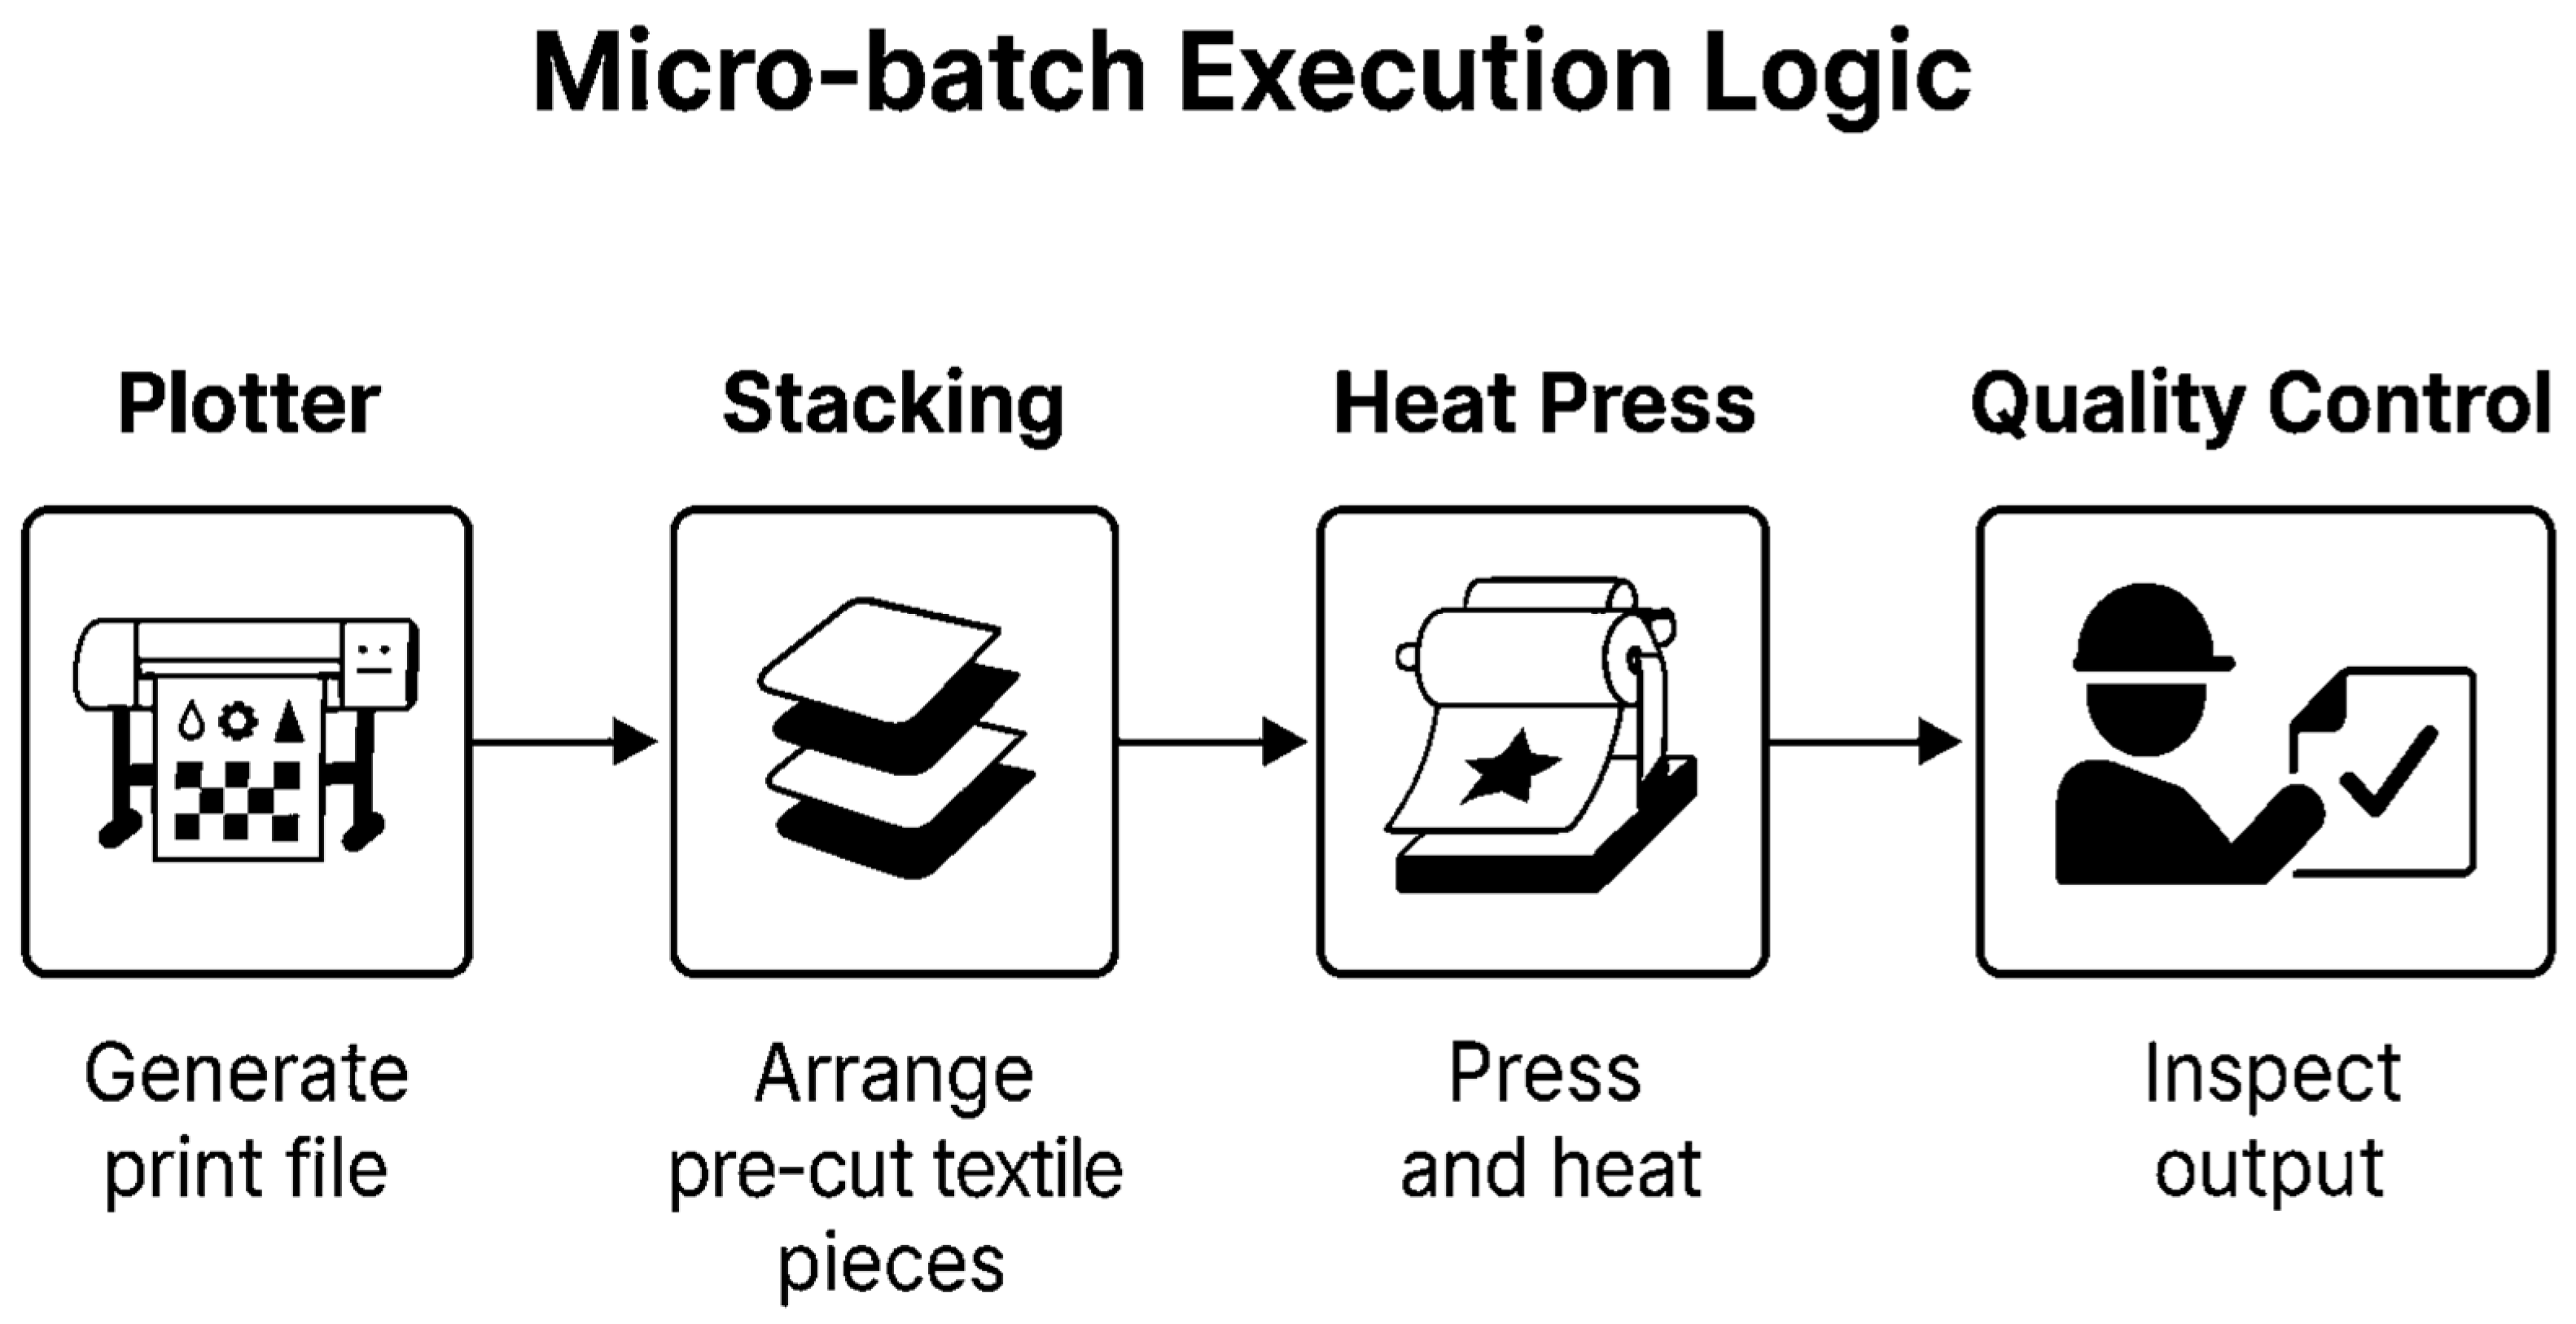
The analysis centered around the company’s use of micro-batches, which represent small, order-specific production batches organized around the output of the plotter. Each micro-batch begins when the operator aggregates a group of print jobs and generates a roll-specific print file [25]. This event initiates a tightly coupled sequence: white fabric components are prepared, aligned with the roll content, and stacked for pressing. The press then operates at a fixed technological speed, processing each roll according to predefined thermal and pressure settings. The micro-batch ends once all units are pressed and transferred to quality control. Early simulation scenarios revealed that this structure, although efficient in principle, relies heavily on precise coordination between workstations [26]. Plotter throughput sets the rhythm, while upstream and downstream stations (preparation and press) must synchronize their activities to avoid idle time or bottlenecks. In particular, white detail preparation exhibited delays in aligning material readiness with roll completion, resulting in repeated idle periods at the press. This issue was validated through real-time measurements. The press workstation exhibited stable operating parameters; however, clusters of idle states often coincided with late material delivery. Conversely, the plotter experienced workload spikes due to variable job grouping and the formation of ad hoc micro-batches. These variations amplified the inconsistency in the downstream flow. To analyze the issue holistically, simulation results were compared with real production data collected through the DIMUSA platform [27]. This cross-validation helped confirm that the observed performance gaps stemmed not from individual workstation inefficiencies but from structural misalignments in micro-batch sequencing. The cluster-based visualization made these patterns explicit, supporting root-cause discussions during daily meetings with team leaders. Overall, the findings emphasized the importance of digital support for batch logic and material readiness, particularly in environments characterized by short-run variability and manual task transitions [28]. The micro-batch logic, described below in Figure 8, illustrates the tightly coupled flow initiated by the plotter and concluded at the quality control step, underpinning the coordination issues discussed in this section.
The micro-batch process begins with aggregated order data, which is grouped at the plotter workstation into printable roll files. Each roll considers the printing material and thermal press parameters. Based on the roll content, fabric pieces are pre-cut and stacked in sequence to align with the upcoming press cycle. The thermal press applies heat and pressure to transfer the print onto each aligned fabric layer. The process ends when the printed components are transferred to quality control. This structure ensures a clear production rhythm but also introduces synchronization dependencies between the plotter, cutting, and pressing operations.

3.4. Simulation Validation

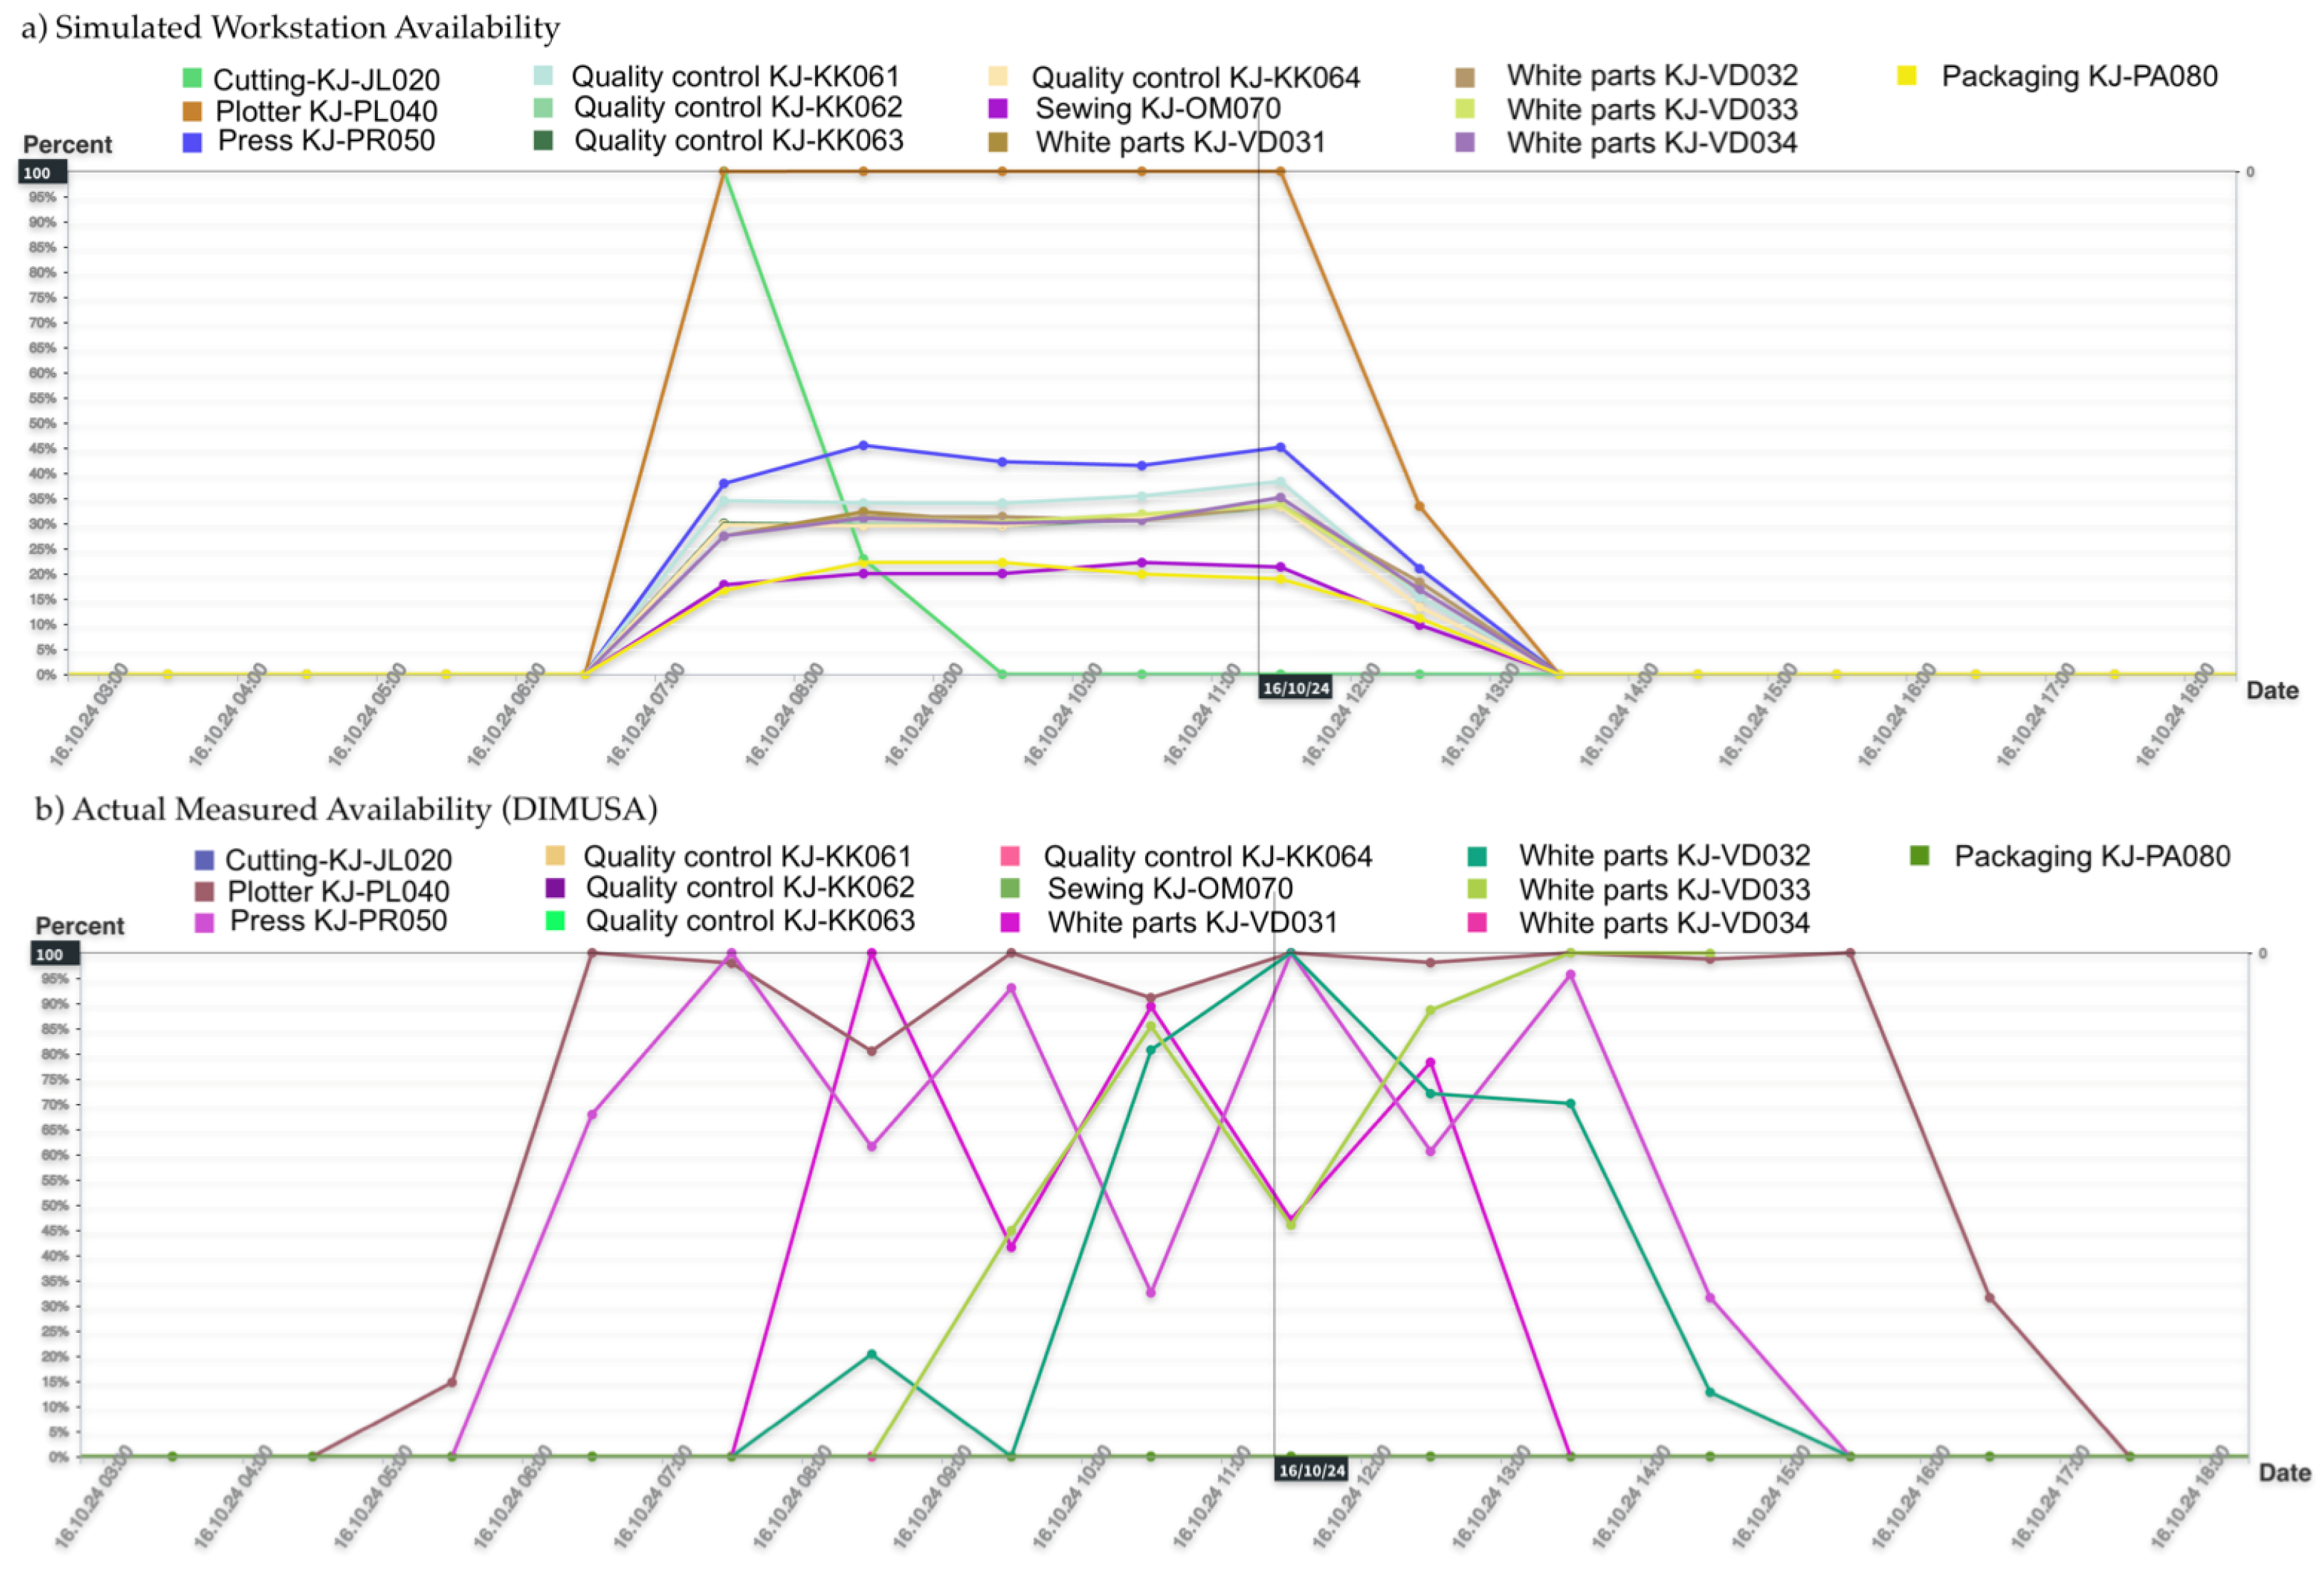
To validate the realism and predictive accuracy of the simulation model, a focused comparison was conducted between virtual factory simulation outputs and real production data collected through the DIMUSA system. The validation focused on availability metrics and aimed to identify discrepancies between simulated assumptions and real-world behavior across multiple workstations [29]. Figure 9 presents a direct visual comparison of workstation availability across one selected production day. The upper chart displays the availability values used in the simulation model, derived from baseline process assumptions. Availability represents the share of actual working time relative to a full 8-h shift (480 min), where 100% means uninterrupted operation throughout the shift. The lower chart reflects actual availability as measured by DIMUSA sensors during the same operational window. The contrast between the two layers highlights differences in timing patterns, utilization rates, and workstation coordination. This side-by-side view revealed that simulated data tended to assume more uniform availability across workstations, while real-world data showed greater fluctuation, particularly during shift transitions and material handling events. These findings informed subsequent updates to the simulation model, ensuring more accurate modeling of downtime and micro-delays.
To further contextualize these observations, the plotter and press workstations were analyzed in detail for two consecutive days-October 16th and 17th. On these days, production was structured around micro-batches, and both sensor data and operator-reported task logs were available. Table 3 and Table 4 summarize this cross-validation, comparing timestamps and durations across the simulation, DIMUSA monitoring, and manual reporting systems [30]. The analysis confirmed that while the simulation provided a solid approximation of expected process flows, it occasionally underestimated idle periods and overstated continuity. In contrast, DIMUSA sensor logs revealed nuanced interruptions, particularly in the press workstation, where material readiness and operator interactions had a greater impact than initially modeled. This three-way validation-spanning simulation, sensor feedback, and operator input proved instrumental in refining the digital twin’s predictive capacity [31]. By closing the loop between planning and execution, the simulation framework became better aligned with real production rhythms, supporting more effective forecasting and targeted optimization strategies. The methodology demonstrated here is scalable to additional workstations and process types, underscoring the importance of empirical feedback in refining digital twins.
Table 3 presents task-level data from the plotter workstation on 16 October 2024, comparing three sources: manually logged task start and end times by operators, corresponding activity durations from the simulation model, and sensor-based records collected through the DIMUSA system. While the overall timing was similar across data sources, slight deviations were observed in transition gaps between micro-batches. These gaps were better captured by DIMUSA sensors, which identified short but recurring idle periods not reflected in simulation assumptions or manual logs. This highlighted the usefulness of sensor-level granularity in exposing brief disruptions that accumulate into meaningful inefficiencies.
Table 4 presents the press workstation data from 17 October 2024, following the same structure. Unlike the plotter, the press exhibited more variation between simulated expectations and actual execution. Several micro-batches experienced delays or extended idle periods between processing steps. In some cases, operator-logged reasons included material unavailability or coordination delays. DIMUSA readings confirmed these delays through prolonged inactive states. The comparison underlined the importance of accounting for coordination dependencies and manual handling variability when calibrating the simulation model. It also reinforced the need for complementary validation layers-manual reporting, real-time monitoring, and simulation achieve an accurate representation of production behavior.

3.5. Impact

In addition to its analytical and planning benefits, the digital twin implementation provided the manufacturing SME with a structured and scalable pathway for transitioning from manual Excel-based production tracking to a real-time, AI-supported monitoring environment [32]. By integrating with the DIMUSA platform, the company gained early visibility into inefficiencies, intuitive visualization of operational states, and improved communication between technical specialists and production staff. The complementary simulation model allowed hypotheses to be tested virtually before applying process changes on the actual shop floor [33]. This reduced implementation risk and increased trust in the insights generated by the analytical pipeline. Simulation results revealed that workstation synchronization, shift transitions, and operator-induced cycle variations can significantly impact overall line performance. This hybrid approach, which combines real-time data collection, clustering-based analytics, and simulation-driven forecasting, exemplifies the AIRE initiative’s “test before invest” principle. It enabled a low-risk and phased transition from prototype evaluation to operational deployment, explicitly tailored to the needs and constraints of small-batch, human-centric production environments [34].

4. Discussion

The implementation of an AI–supported digital twin in a small–batch manufacturing environment demonstrated how advanced data analytics and simulation can enhance production understanding without requiring a full–scale digital infrastructure overhaul. While digital twins have been widely studied in high–volume manufacturing and cyber–physical systems, their application in SMEs remains limited. This study contributes to that gap by showing how modular and lightweight solutions, combined with targeted data collection and stakeholder collaboration, can unlock valuable insights without disrupting daily operations. One of the key findings was the importance of timing coordination in short–run production. Unlike traditional mass production, where variability is minimized through volume and standardization, the small–batch model relies on flexibility and human input, making process synchronization more challenging. The use of “micro–batches” as a practical structuring mechanism proved effective, but also exposed the fragility of the system when task sequencing or material preparation was delayed. Clustering revealed recurring inefficiencies that would have been difficult to identify through manual observation or standard key performance indicators (KPIs) alone. In particular, the combined use of DBSCAN and K–means clustering allowed the team to filter out noise, detect state–specific patterns, and highlight the variability in workstation performance. These insights were used to guide process discussions and test improvements virtually, reducing the need for costly trial–and–error adjustments on the production floor. Simulation results aligned with observed bottlenecks, reinforcing the validity of the analytical approach and offering a realistic preview of how even minor adjustments, such as staggered handovers or buffer size changes, could increase throughput. From a broader perspective, the results align with the goals of Industry 5.0, where human–centered decision–making and interpretability are emphasized over full automation. The data visualization features embedded in the DIMUSA platform enabled planners and operators to understand what was happening in the system and why, thereby facilitating more confident and collaborative responses to identified issues. The study also supports the relevance of the “test before invest” approach in SME settings, where experimentation capacity is limited and disruption must be minimized. By leveraging a combination of real–time monitoring and virtual validation, the team bridged the gap between abstract digital strategies and grounded operational improvements. Moreover, while the case focused on a sportswear manufacturer, the same digital twin methodology could be generalized to other domains characterized by small–batch variability, manual processes, and frequent order customization, such as artisanal production, medical device assembly, and high–mix electronics. It is also important to emphasize that this study primarily focused on assessing the conceptual applicability of the framework. While the simulation–based analysis and digital shadow system provided important insights, it is essential to note that this study mainly focused on assessing the conceptual applicability of the framework. The goal was not full operational implementation, but rather identifying critical production inefficiencies that could guide future deployment. Therefore, real–time KPIs and data visualizations were utilized to support collaborative analysis with stakeholders; however, long–term effects, such as ROI, capacity utilization, or sustained performance improvements, will require further integration and ongoing tracking. This approach aligns with the “test before invest” philosophy promoted in SME innovation environments, where experimental validation is a necessary first step toward more reliable implementation. While simulation alone can offer valuable insights into process flows and bottlenecks, its effectiveness relies heavily on predefined assumptions and manual scenario testing. In contrast, integrating AI–based clustering greatly improves this process by automatically identifying patterns, anomalies, and workstation–specific inefficiencies without needing prior hypotheses. The clustering results guided the simulation setup by highlighting where inefficiencies are most likely to happen, enabling more targeted and efficient scenario validation. This synergy between unsupervised AI analysis and simulation fosters a more systematic and data–driven approach to improvement planning. Therefore, while simulation is a powerful tool by itself, combining it with AI analytics speeds up root–cause identification and scenario prioritization, especially in cases of small–batch variability and limited operator capacity. These sectors similarly struggle with synchronization, traceability, and process visibility, making them strong candidates for the application of lightweight digital twin architectures that support human–in–the–loop optimization.

5. Conclusions and Future Work

This study explored the implementation of an AI–enhanced digital twin framework in a real–world small–batch manufacturing environment. The approach combined real–time data acquisition, clustering–based analysis, and simulation modeling to support human–centered decision–making and improve production transparency. The integration of the DIMUSA enabled the automated collection, processing, and visualization of workstation–level performance data, bridging the gap between manual practices and intelligent monitoring. By applying clustering algorithms such as K–means and DBSCAN, the system successfully identified operational states and process anomalies that traditional KPI reporting would have overlooked. These insights helped isolate inefficiencies related to cycle variation, workstation synchronization, and operator–driven fluctuations. In parallel, the use of virtual factory simulation provided a low–risk environment for validating hypotheses and exploring improvements, allowing the company to test and refine operational strategies before applying them in live production. The developed framework emphasized modularity, interpretability, and scalability factors for successful deployment in SMEs with limited digital infrastructure and technical capacity. Beyond technical performance, the solution supported collaborative learning and team engagement by offering accessible visualizations and structured feedback mechanisms. These characteristics resonate strongly with the principles of Industry 5.0, where human involvement, adaptability, and sustainable improvement are prioritized. Future development will focus on expanding system coverage across additional production areas, integrating predictive components, and refining clustering logic through the application of supervised learning techniques. Integration with enterprise systems, such as ERP and Manufacturing Execution System MES platforms, is also planned to ensure seamless data continuity and richer contextual awareness. Longer–term studies could investigate how such systems affect organizational learning, routine adaptation, and continuous improvement within SME environments. The findings of this case study reinforce the conclusion that digital twin technologies, adapted to real–world constraints and deployed incrementally, can offer measurable value even in resource–constrained industrial settings. The key is aligning technology with operational realities and empowering human decision–makers through interpretable, actionable data.

Author Contributions

Conceptualization, T.R.; methodology, T.R. and J.M.; software, J.M.; validation, T.R. and A.H.; formal analysis, T.R. and J.M.; investigation, T.R.; resources, T.R.; data curation, T.R.; writing–original draft preparation, T.R.; writing–review and editing, K.K. and J.M.; visualization, T.R.; supervision, K.K.; project administration, T.R.; funding acquisition, T.R. All authors have read and agreed to the published version of the manuscript.

Funding

This research was funded by AI and Robotics Estonia—EDIH, project number 101083677; Master of Science in Smart, Secure and Interconnected Systems (MERIT)—Development of a new pan European educational ecosystem for training of digital specialists (Co–funded by European Union under grant agreement No. 101083531); the Estonian Education and Youth Board project “Development and manufacturing of complex products” No. ÕÜF10 co–funded by the European Union; The project “Increasing the knowledge intensity of Ida–Viru entrepreneurship” is co–funded by the European Union.

Institutional Review Board Statement

Not applicable.

Informed Consent Statement

Not applicable.

Data Availability Statement

Data are contained within the article.

Conflicts of Interest

The authors declare no conflicts of interest.

References

  1. Mchirgui, N.; Quadar, N.; Kraiem, H.; Lakhssassi, A. The Applications and Challenges of Digital Twin Technology in Smart Grids: A Comprehensive Review. Appl. Sci. 2024, 14, 10933. [Google Scholar] [CrossRef]
  2. Derigent, W.; Cardin, O.; Trentesaux, D. Industry 4.0: Contributions of Holonic Manufacturing Control Architectures and Future Challenges. J. Intell. Manuf. 2021, 32, 1797–1818. [Google Scholar] [CrossRef]
  3. Masood, T.; Sonntag, P. Industry 4.0: Adoption Challenges and Benefits for SMEs. Comput. Industry 2020, 121, 103261. [Google Scholar] [CrossRef]
  4. Davila-Gonzalez, S.; Martin, S. Human Digital Twin in Industry 5.0: A Holistic Approach to Worker Safety and Well-Being through Advanced AI and Emotional Analytics. Sensors 2024, 24, 655. [Google Scholar] [CrossRef] [PubMed]
  5. Wang, B.; Zheng, P.; Wang, L.H.; Mourtzis, D. Human-Centric Smart Manufacturing Towards Industry 5.0; Springer Nature: Berlin/Heidelberg, Germany, 2025. [Google Scholar] [CrossRef]
  6. Demarchi, M.; Bonello, A.; Francalanza, E.; Rauch, E. A Digital Twin for SMEs in the Context of Industry 5.0. Procedia CIRP. 2024, 126, 242–247. [Google Scholar] [CrossRef]
  7. Raamets, T.; Karjust, K.; Hermaste, A.; Kelpman, K. Virtual Factory Model Development for AI-Driven Optimization in Manufacturing. Proc. Est. Acad. Sci. 2025, 74, 228. [Google Scholar] [CrossRef]
  8. Paavel, M.; Karjust, K.; Majak, J. PLM Maturity Model Development and Implementation in SME. Procedia CIRP. 2017, 63, 651–657. [Google Scholar] [CrossRef]
  9. Snatkin, A.; Karjust, K.; Eiskop, T. Real Time Production Monitoring System in SME. In Proceedings of the Proceedings of the 8th International Conference od DAAAM Baltic Industrial Engineering 19–21st, Tallinn, Estonia, 19–21 April 2012; Tallinna Tehnikaülikooli Kirjastus: Tallinn, Estonia, 2012; pp. 573–578. [Google Scholar]
  10. Ahmed, M.; Seraj, R.; Islam, S.M.S. The K-Means Algorithm: A Comprehensive Survey and Performance Evaluation. Electron. 2020, 9, 1295. [Google Scholar] [CrossRef]
  11. Sundar, R.; Balaji, A.N.; Satheesh Kumar, R.M. A Review on Lean Manufacturing Implementation Techniques. Procedia Eng. 2014, 97, 1875–1885. [Google Scholar] [CrossRef]
  12. Daniyan, I.; Adeodu, A.; Mpofu, K.; Maladzhi, R.; Kana-Kana Katumba, M.G. Application of Lean Six Sigma Methodology Using DMAIC Approach for the Improvement of Bogie Assembly Process in the Railcar Industry. Heliyon 2022, 8, e09043. [Google Scholar] [CrossRef] [PubMed]
  13. de Man, J.C.; Strandhagen, J.O. Spreadsheet Application Still Dominates Enterprise Resource Planning and Advanced Planning Systems. IFAC-Pap 2018, 51, 1224–1229. [Google Scholar] [CrossRef]
  14. Siemens Software. Plant Simulation Software, 2025 version; Siemens AG: Munich, Germany, 2025. Available online: https://plm.sw.siemens.com/en-US/tecnomatix/plant-simulation-software/ (accessed on 2 May 2025).
  15. Mahmood, K.; Karjust, K.; Raamets, T. Production Intralogistics Automation Based on 3D Simulation Analysis. J. Mach. Eng. 2021, 21, 102–115. [Google Scholar] [CrossRef]
  16. Longo, F.; Mirabelli, G.; Solina, V.; Alberto, U.; De Paola, G.; Giordano, L.; Ziparo, M. A Simulation-Based Framework for Manufacturing Design and Resilience Assessment: A Case Study in the Wood Sector. Appl. Sci. 2022, 12, 7614. [Google Scholar] [CrossRef]
  17. Siderska, J. Application of Tecnomatix Plant Simulation for Modeling Production and Logistics Processes. Bus. Manag. Educ. 2016, 14, 64–73. [Google Scholar] [CrossRef]
  18. Ram, A.; Jalal, S.; Jalal, A.S.; Kumar, M. A Density Based Algorithm for Discovering Density Varied Clusters in Large Spatial Databases. Int. J. Comput. Appl. 2010, 3, 1–4. [Google Scholar] [CrossRef]
  19. Cui, J.M.; Liu, J.M.; Liao, Z.Y. Research on K-Means Clustering Algorithm and Its Implementation. In Proceedings of the 2nd International Conference on Computer Science and Electronics Engineering (ICCSEE 2013), Hangzhou, China, 22–23 March 2013; Atlantis Press: Dordrecht, The Netherlands, 2013; pp. 1804–1806. [Google Scholar] [CrossRef]
  20. Ahmad, A.; Dey, L. A K-Mean Clustering Algorithm for Mixed Numeric and Categorical Data. Data Knowl. Eng. 2007, 63, 503–527. [Google Scholar] [CrossRef]
  21. Niekurzak, M.; Lewicki, W. Optimisation of the Production Process of Ironing Refractory Products Using the OEE Indicator as Part of Innovative Solutions for Sustainable Production. Sustainability 2025, 17, 4779. [Google Scholar] [CrossRef]
  22. Ester, M.; Kriegel, H.P.; Sander, J.; Xu, X. A Density-Based Algorithm for Discovering Clusters in Large Spatial Databases with Noise. In Proceedings of the Second International Conference on Knowledge Discovery and Data Mining (KDD’96), Oregon, Portland, 2–4 August 1996; pp. 226–331. [Google Scholar]
  23. MacQueen, J. Some Methods for Classification and Analysis of Multivariate Observations. In Proceedings of the 5th Berkeley Symposium on Mathematical Statistics and Probability; University of California Press: Berkeley, CA, USA, 1967; pp. 281–297. [Google Scholar]
  24. Xu, R.; Wunsch, D. Survey of Clustering Algorithms. IEEE Trans. Neural Netw. 2005, 16, 645–678. [Google Scholar] [CrossRef] [PubMed]
  25. Thames, L.; Schaefer, D. Software-Defined Cloud Manufacturing for Industry 4.0. Procedia CIRP 2016, 52, 12–17. [Google Scholar] [CrossRef]
  26. Becker, T.; Chankov, S.M.; Windt, K. Synchronization Measures in Job Shop Manufacturing Environments. Procedia CIRP 2013, 7, 157–162. [Google Scholar] [CrossRef]
  27. Jain, S.; Lechevalier, D. Standards Based Generation of a Virtual Factory Model. In Proceedings of the 2016 Winter Simulation Conference (WSC), Washington, DC, USA, 11–14 December 2016; pp. 2762–2773. [Google Scholar] [CrossRef]
  28. ur Rehman, A.; Ramzan, M.B.; Shafiq, M.; Rasheed, A.; Naeem, M.S.; Savino, M.M. Productivity Improvement Through Time Study Approach: A Case Study from an Apparel Manufacturing Industry of Pakistan. Procedia Manuf. 2019, 39, 1447–1454. [Google Scholar] [CrossRef]
  29. Skoogh, A.; Johansson, B. A Methodology for Input Data Management in Discrete Event Simulation Projects. In Proceedings of the Winter Simulation Conference, Miami, FL, USA, 7–10 December 2008; pp. 1727–1735. [Google Scholar] [CrossRef]
  30. Uhlemann, T.H.J.; Lehmann, C.; Steinhilper, R. The Digital Twin: Realizing the Cyber-Physical Production System for Industry 4. Procedia CIRP 2017, 61, 335–340. [Google Scholar] [CrossRef]
  31. Kritzinger, W.; Karner, M.; Traar, G.; Henjes, J.; Sihn, W. Digital Twin in Manufacturing: A Categorical Literature Review and Classification. IFAC-PapersOnLine 2018, 51, 1016–1022. [Google Scholar] [CrossRef]
  32. Wuest, T.; Weimer, D.; Irgens, C.; Thoben, K.D. Machine Learning in Manufacturing: Advantages, Challenges, and Applications. Prod. Manuf. Res. 2016, 4, 23–45. [Google Scholar] [CrossRef]
  33. Ferreira, L.P.; Ares, E.; Peláez, G.; Marcos, M.; Araújo, M. A Methodology to Evaluate Complex Manufacturing Systems through Discrete-Event Simulation Models. Key Eng. Mater. 2012, 502, 7–12. [Google Scholar] [CrossRef]
  34. Matt, D.T.; Modrák, V.; Zsifkovits, H. Implementing Industry 4.0 in SMEs: Concepts, Examples and Applications; Springer Nature: Berlin/Heidelberg, Germany, 2021; pp. 1–429. [Google Scholar] [CrossRef]
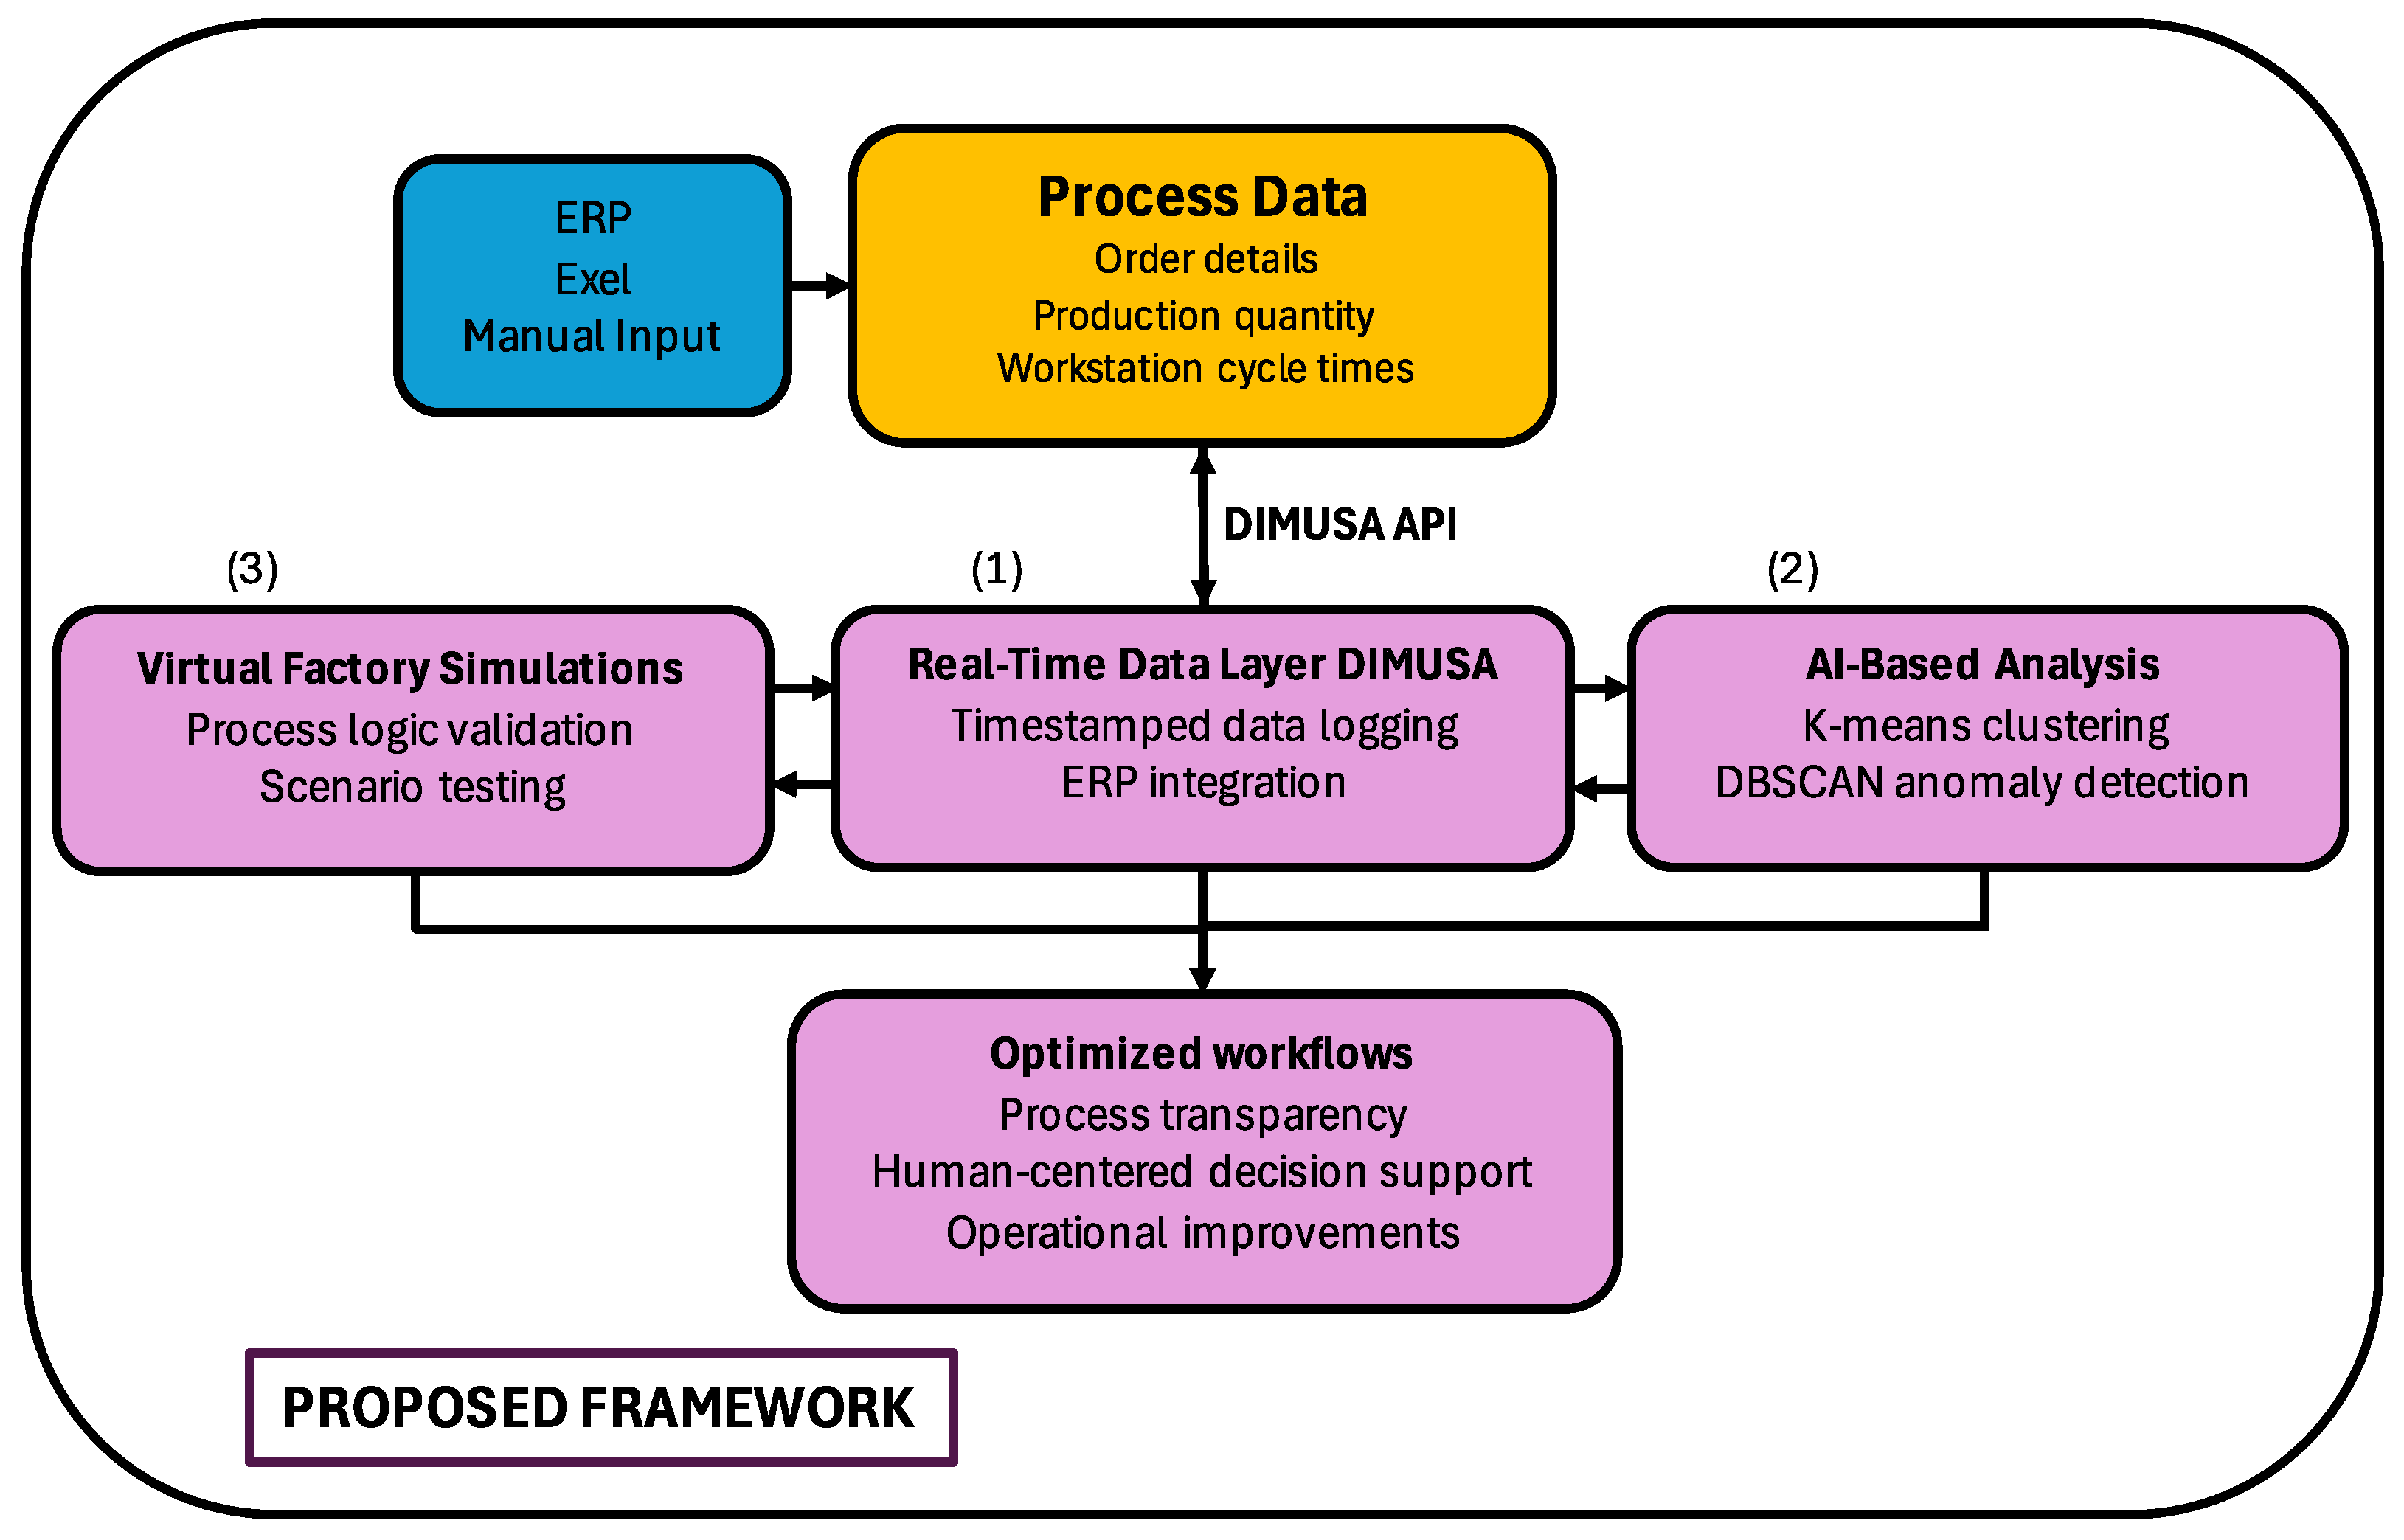
Figure 1. Digital twin framework utilized in pilot SME, integrating real-time data collection and validation, clustering analysis, and simulation for decision support.
Applsci 15 07952 g001
Figure 2. Physical layout of the production area with marked workstation zones used in the pilot implementation.
Applsci 15 07952 g002
Figure 3. Screenshot of the virtual factory simulation model created in Siemens Plant Simulation to validate data patterns and test production improvement scenarios.
Applsci 15 07952 g003
Figure 4. The DIMUSA platform interface is used for real-time workstation data monitoring and operator input collection [9].
Applsci 15 07952 g004
Figure 5. Time-series analysis of workstation OEE based on one-month virtual factory simulation data. The results serve as input for subsequent clustering analysis.
Applsci 15 07952 g005
Figure 6. Clustering workflow from data preprocessing to performance visualization.
Applsci 15 07952 g006
Figure 7. Availability vs. performance plot of clustered workstation data based on virtual factory simulation output from October 2024.
Applsci 15 07952 g007
Figure 8. Visual representation of the micro-batch production sequence.
Applsci 15 07952 g008
Figure 9. Comparison of workstation availability between (a) simulation model assumptions and (b) actual DIMUSA measurements for a single production day (16 October 2024).
Applsci 15 07952 g009
Table 1. Workstation codes, activities, and process descriptions used in the pilot SME.
CodeWorkstation/ActivityProcess Description
KJ-KL010Staging and material placementMarking and transporting material from fabric storage
KJ-JL020CuttingCutting material according to the cutting order
KJ-VD031White parts preparationPreparing white fabric parts for pressing
KJ-VD032White parts preparationPreparing white fabric parts for pressing
KJ-VD033White parts preparationPreparing white fabric parts for pressing
KJ-VD034White parts preparationPreparing white fabric parts for pressing
KJ-PL040PlotterPreparing press rollers for sublimation
KJ-PR050PressingPressing visual elements onto white parts
KJ-KK061Quality controlInspecting the quality of pressed parts
KJ-KK062Quality controlInspecting the quality of pressed parts
KJ-KK063Quality controlInspecting the quality of pressed parts
KJ-KK064Quality controlInspecting the quality of pressed parts
KJ-OM070SewingSewing product components
KJ-PA080PackagingPackaging finished products
Table 2. Summary of OEE-related performance metrics for monitored workstations (during October 2024).
DateWorkstationAvailability %Performans %Quality %OEE %TEEP %Result/pcs
2024/10Plotter KJ-PL04067%100%100%67%16%9200
2024/10Press KJ-PR05029%100%100%29%7%9200
2024/10Quality control KJ-KK06124%100%100%24%6%2300
2024/10White parts KJ-VD03122%101%100%22%5%2622
2024/10White parts KJ-VD03222%101%100%22%5%2622
2024/10White parts KJ-VD03321%101%100%22%5%2599
2024/10White parts KJ-VD03421%101%100%22%5%2599
2024/10Quality control KJ-KK06221%100%100%21%5%2300
2024/10Quality control KJ-KK06321%100%100%21%5%2300
2024/10Quality control KJ-KK06421%100%100%21%5%2300
2024/10Cutting KJ-JL02015%100%100%15%4%20,355
2024/10Sewing KJ-OM07014%100%100%14%3%9200
2024/10Packaging KJ-PA08014%100%100%14%3%9200
Table 3. Plotter workstation activity on 16 October 2024, based on manually reported task feedback, simulation data, and DIMUSA sensor logs.
Actual execution of work orders (manual input)
CodeWorkstationActual startActual stopOffShort stopLong StopWorkingQuantity/m2
Micro-batch-44-025-CAAPlotter KJ-PL04016/10/2024 5:56:0216/10/2024 7:31:2100:00:0000:01:1200:00:0001:34:07115.9 m2
Micro-batch-44-023-CAPlotter KJ-PL04016/10/2024 7:32:1816/10/2024 8:31:5800:00:0000:01:0200:03:2300:55:1473.88 m2
Micro-batch-44-034-CAAPlotter KJ-PL04016/10/2024 14:33:1116/10/2024 16:23:1800:00:0000:00:0000:05:0401:45:01148.58 m2
Micro-batch-44-032-CMPlotter KJ-PL04016/10/2024 10:26:1616/10/2024 12:36:5500:00:0000:01:0800:00:2002:09:09164.1 m2
Micro-batch-44-028-CKPlotter KJ-PL04016/10/2024 8:52:3716/10/2024 10:21:4900:00:0000:00:4800:00:0001:28:23104.03 m2
Micro-batch-44-037-CMPlotter KJ-PL04016/10/2024 12:37:2716/10/2024 14:32:5800:00:0000:00:4400:00:0001:54:46169 m2
TOTAL:00:00:000:04:550:08:499:46:43775.49 m2
Virtual factory simulation data
ShiftWorkstationStartEndOffShort stopLong StopWorkingQuantity/m2AvailabilityPerformanceOEE
17.10.2024Plotter KJ-PL04016/10/2024 7:00:0016/10/2024 15:00:0000:00:0000:00:0102:39:5905:20:0040067%100%67%
DIMUSA real-time data
ShiftWorkstationStartEndOffShort stopLong StopWorkingQuantity/m2AvailabilityPerformanceOEE
17.10.2024Plotter KJ-PL04016/10/2024 6:00:0016/10/2024 18:00:0000:00:0000:04:5501:56:1309:58:5177583%0%0%
Table 4. Press workstation activity on 17 October 2024, based on manually reported task feedback, simulation data, and DIMUSA sensor logs.
Actual execution of work orders (manual input)
CodeWorkstationActual startActual stopOffShort stopLong StopWorkingQuantity/m2
Micro-batch-44-025-CAAPress KJ-PR05017/10/2024 11:26:3117/10/2024 12:08:1000:00:0000:00:0000:00:0000:41:38115.9 m2
Micro-batch-44-023-CAPress KJ-PR05017/10/2024 12:09:2317/10/2024 12:37:2900:00:0000:00:0000:00:4000:27:2573.88 m2
Micro-batch-44-020-CAAPress KJ-PR05017/10/2024 8:34:1217/10/2024 9:06:0700:00:0000:00:0000:00:3400:31:2091.3 m2
Micro-batch-44-032-CMPress KJ-PR05017/10/2024 9:09:5117/10/2024 10:05:5400:00:0000:00:2800:00:0000:55:34164.1 m2
Micro-batch-44-037-CMPress KJ-PR05017/10/2024 13:00:3017/10/2024 13:52:5200:00:0000:00:0000:00:0000:52:22169 m2
TOTAL:00:00:000:00:280:01:153:28:21614 m2
Virtual factory simulation data
ShiftWorkstationStartEndOffShort stopLong StopWorkingQuantity/m2AvailabilityPerformanceOEE
17.10.2024Press KJ-PR05017/10/2024 7:00:0017/10/2024 15:00:0000:00:0000:00:0005:40:0002:20:0040029%99.9%29%
DIMUSA real—time data
ShiftWorkstationStartEndOffShort stopLong StopWorkingQuantity/m2AvailabilityPerformanceOEE
17.10.2024Press KJ-PR05017/10/2024 6:00:0017/10/2024 18:00:0000:00:0000:04:0505:15:2406:40:3061456%4%2%
Disclaimer/Publisher’s Note: The statements, opinions and data contained in all publications are solely those of the individual author(s) and contributor(s) and not of MDPI and/or the editor(s). MDPI and/or the editor(s) disclaim responsibility for any injury to people or property resulting from any ideas, methods, instructions or products referred to in the content.