1. Introduction
Resin composites, which allow the application of minimally invasive approaches, are now widely used in the restoration of both anterior and posterior teeth due to their acceptable aesthetic and mechanical properties [
1]. Nanotechnology, which allows the addition of nano-sized filler particles to the resin composite, has made a significant contribution to this [
2]. However, it is very difficult to achieve a colour match between these resin composites, which have different opacities and translucencies, and the dental tissues (enamel and dentin) in a way that provides harmony with the natural tooth tissues. The colour matching between the resin composite and the tooth structure is achieved using a layering technique [
3]. Numerous clinical and in vitro studies have demonstrated the ability of the layering technique to achieve shade matching [
4]. However, this technique demands precision [
5]. Attempts to reduce technical precision have led to the development of universal resin composites that exhibit a chameleon effect, which facilitates colour selection and colour matching with surrounding dental tissues [
4,
6].
The chameleon effect refers to the ability of restorative materials to match the colour of the surrounding tooth tissue owing to their optical properties, such as light transmission, diffusion, and reflection [
7,
8]. Numerous studies have reported that universal resin composites with this effect blend well with tooth tissue colour. However, these studies have also found that the effect is more successful in restorations involving less tooth tissue loss [
9]. In recent years, resin composites that match the colour of dental tissues with a single shade have been produced. These composites have been reported to better match the colour of dental tissues than multi-coloured ones. This smart chromatic effect is largely attributed to the minimization of the difference between the refractive indices of the resin matrix and filler particles. When these indices are closely matched, light scattering at the filler–matrix interface is reduced, increasing translucency and allowing the composite to effectively reflect and transmit surrounding tooth colours, thus achieving a chameleon-like adaptation [
10,
11,
12].
Despite these developments, aesthetic problems such as colour changes at the edges of restorations, secondary caries and fractures, and general deterioration of the colour match of the restoration are still encountered clinically in resin composite restorations. Colour change is the main reason for replacing restorations, particularly in the anterior region [
2]. The extent of colour change is crucial for the longevity of the restoration.
Internal colour change occurs as a result of changes in the material’s structure. This is influenced by factors such as the type of monomer used, the filler ratio, and the degree of conversion in the resin composite. External colour change, on the other hand, is mainly caused by consuming products containing dye, such as food and drink and cigarettes [
2]. It is also known that roughness of the restoration surface contributes to external colour change. Surface roughness can be measured in vitro using mechanical or optical profilometers, scanning electron microscopy (SEM), or atomic force microscopy (AFM). However, the most preferred method is measurement using a profilometer because no additional application to the samples is required for measurement and the measurements can be repeated [
13]. It has been reported that a surface roughness value (Ra) of less than 0.15 μm obtained with a profilometer reduces the adhesion of Streptococcus mutans to the surface, while a value greater than 0.2 μm creates an accessible adhesion area for bacterial plaque [
14].
Translucency is defined as the light transmission of a material that causes the background to be visible and the state between partial opacity or full opacity and full transparency [
15]. The difference in translucency of a material of uniform thickness on a black and white background is expressed as the translucency parameter (TP). Higher values for TP indicate that the material is more translucent. If the material is completely opaque, the value of this parameter is zero [
16].
Ideally, the colour and translucency of composite restorations should be consistent and remain stable over time [
17]. However, the colour and translucency of restorations tend to change over time [
18]. The change in colour and translucency of resin composite restorations can be measured using devices such as colourimeters, digital cameras, or spectrophotometers [
10]. Spectrophotometers are reported to be more sensitive than colourimeters and easier to use than digital cameras [
11]. The CIE L*a*b* colour system is currently the most widely used for analysing colour and translucency changes in resin composites using spectrophotometers. In this system, ΔE00 values are calculated from L* (white-black region), a* (red–green region), and b* (yellow–blue region) values measured at the colour coordinate [
19]. The ΔE00 value is a mathematical expression for the amount by which the L*, a*, and b* coordinates of different samples or of the same sample change over time, allowing analysis of small colour differences between dental materials. In addition, the system has some advantages such as objectivity, reproducibility, and sensitivity [
20].
Recently, detox drinks have become popular because of their health benefits. Detox drinks contain fruit and vegetables. They are, therefore, consumed as a source of vitamins and energy [
7,
8]. The use of these drinks has increased due to the lack of time for food preparation in today’s busy lifestyles [
13].
Although coffee, tea, and various fruit juices have been reported to cause changes in the colour change and translucency properties of resin composites [
10], there is little information on the effects of detox drinks on the colour change and translucency of resin composites. There are no studies on the effects of detox drinks on colour change and TP of both multi-colour and single-colour universal resin composites. Therefore, the aim of this study was to investigate the effects of red, orange, and green detox drinks on the surface roughness, colour change, and TP of four different universal resin composites. The null hypotheses of the study are as follows:
Detox drinks have no statistically significant effect on the surface roughness of universal resin composites.
Detox drinks have no statistically significant effect on the colour change (ΔE) of universal resin composites.
Detox drinks have no statistically significant effect on the translucency parameter (TP) of universal resin composites.
2. Materials and Methods
2.1. Preparation of Samples
Four different universal resin composites were used in this study. The contents of the resin composites and detox drinks used are given in
Table 1 and
Table 2.
The sample size (n = 120) was calculated using an effect size set of 1.486, α of 0.05, and power (1-β) of 0.95 using G*power software ver. 3.1.9.4 (Franz Faul, Universitat Kiel, Kiel, Germany).
A total of one hundred twenty samples were prepared, thirty for each resin composite. Teflon moulds with a diameter of 6 mm and a depth of 2 mm were used to prepare the samples. The Teflon moulds were placed on transparent tape placed on the microscope slide and the resin composite was placed in the moulds using a plastic spatula. A second transparent tape and a microscope glass were then placed over the resin composite. The polymerisation of the resin composites was performed by shining a 1000 W/cm2 LED light device (D-Light Pro, GC, Tokyo, Japan) on the slide for 20 s. The output power of the curing light was checked every ten samples using a digital radiometer (Bluephase Meter II, Ivoclar Vivadent, Amherst, NY, USA).
The upper surfaces of the polymerised samples were polished using aluminium oxide-coated polishing discs (Sof-Lex, 3M ESPE, Maplewood, MN, USA). Polishing was performed using a low-speed, water-cooled micromotor to prevent heat build-up and groove formation. After each disc was used, the samples were rinsed thoroughly with water for 10 s and dried with air for 5 s to remove any residue. To reduce variability, one operator performed all samples and procedures. Polished samples were stored separately in artificial saliva at room temperature for 24 h. The artificial saliva contained 0.7 mmol/L CaCl2, 0.2 mmol/L MgCl2·6H2O, 4 mmol/L KH2PO4, 3 mmol/L KCl, 0.3 mmol/L NaN3, and 20 mmol/L HEPES buffer, and was prepared at pH 7.11. The samples prepared from each resin composite were then randomly divided into three subgroups of ten samples, each to be exposed to different detox drinks. The study examined three different coloured detox drinks (red, green, and orange) that were commercially available (Juitox®, Istanbul, Turkey). The initial surface roughness and colour parameters of the samples in each group were measured and recorded as baseline values (T0).
The samples were then exposed to detox drinks twice a day for 15 min. The pH of each drink was measured using a pH meter (Orion 900A, Orion Research, Boston, MA, USA). Ten pH readings were taken to obtain an average pH measurement for each drink. The detox drinks were made fresh each day to prevent bacterial growth. On days 7 (T1), 14 (T2), and 28 (T3), the surface roughness and colour parameters of the samples exposed to the detox drinks were measured again.
2.2. Surface Roughness Measurement
The surface roughness of the samples in each test group was measured using a SJ-101 Mitutoyo Surfest profilometer (Kanagawa, Japan). The device’s measurement length was 0.8 mm, with a working speed of 0.05 mm/s. Three measurements were taken for each sample, the results of which were averaged (Ra). The samples were then rotated 60 degrees clockwise to ensure that the measurements were obtained from as many different surfaces as possible.
2.3. Colour Change and TP Measurement
The colour of the samples in each test group was analysed using a spectrophotometer (Vita Easyshade V, Vita Zahnfabrik, Bad Säckingen, Germany). First, L*, a*, and b* values were obtained for each sample. Measurements were taken on a white or black-and-white background, with the tip of the device perpendicular to and at the same distance from the sample surface each time, under D65 standard lighting conditions. Prior to each colour measurement, the samples were washed with distilled water and dried with absorbent paper to eliminate any residues of the detox drinks from the sample surfaces. All colour measurements were performed at the same location and time of day. Measurements were taken at three different points, starting from the centre of the sample surface. Before each measurement, the spectrophotometer was calibrated according to the manufacturer’s instructions. The colour change values (ΔE00) between the initial measurement and those taken on days 7, 14, and 28 were calculated by applying the following CIEDE 2000 formula [
21] to the obtained colour measurements:
ΔL, ΔC, and ΔH are the differences in lightness, chroma, and hue between two separate measurements. SL, SC, and SH refer to the weighting functions of colour intensity and hue.
The following CIEDE 2000 formula was used to calculate TP (ΔTP
00) [
21].
The subscripts B and W in the formula correspond to the colour coordinates of black and white backgrounds, respectively. LB-LW, CB-CW, and HB-HW denote the lightness, chroma, and hue differences of the samples on black and white backgrounds, respectively. The weighting functions SL, SC, and SH adjust the total chromatic difference for variations in the chromatic difference location on B (black) and W (white) backgrounds in L*, a*, and b* coordinates.
In both formulas, RT is the transfer function that describes the degree of interaction between colour intensity and hue differences in the blue space of the colour system. KL, KC, and KH are parametric factors used for luminance, colour intensity, and hue, respectively [
22]. In this study, the parametric factors were set to 1.
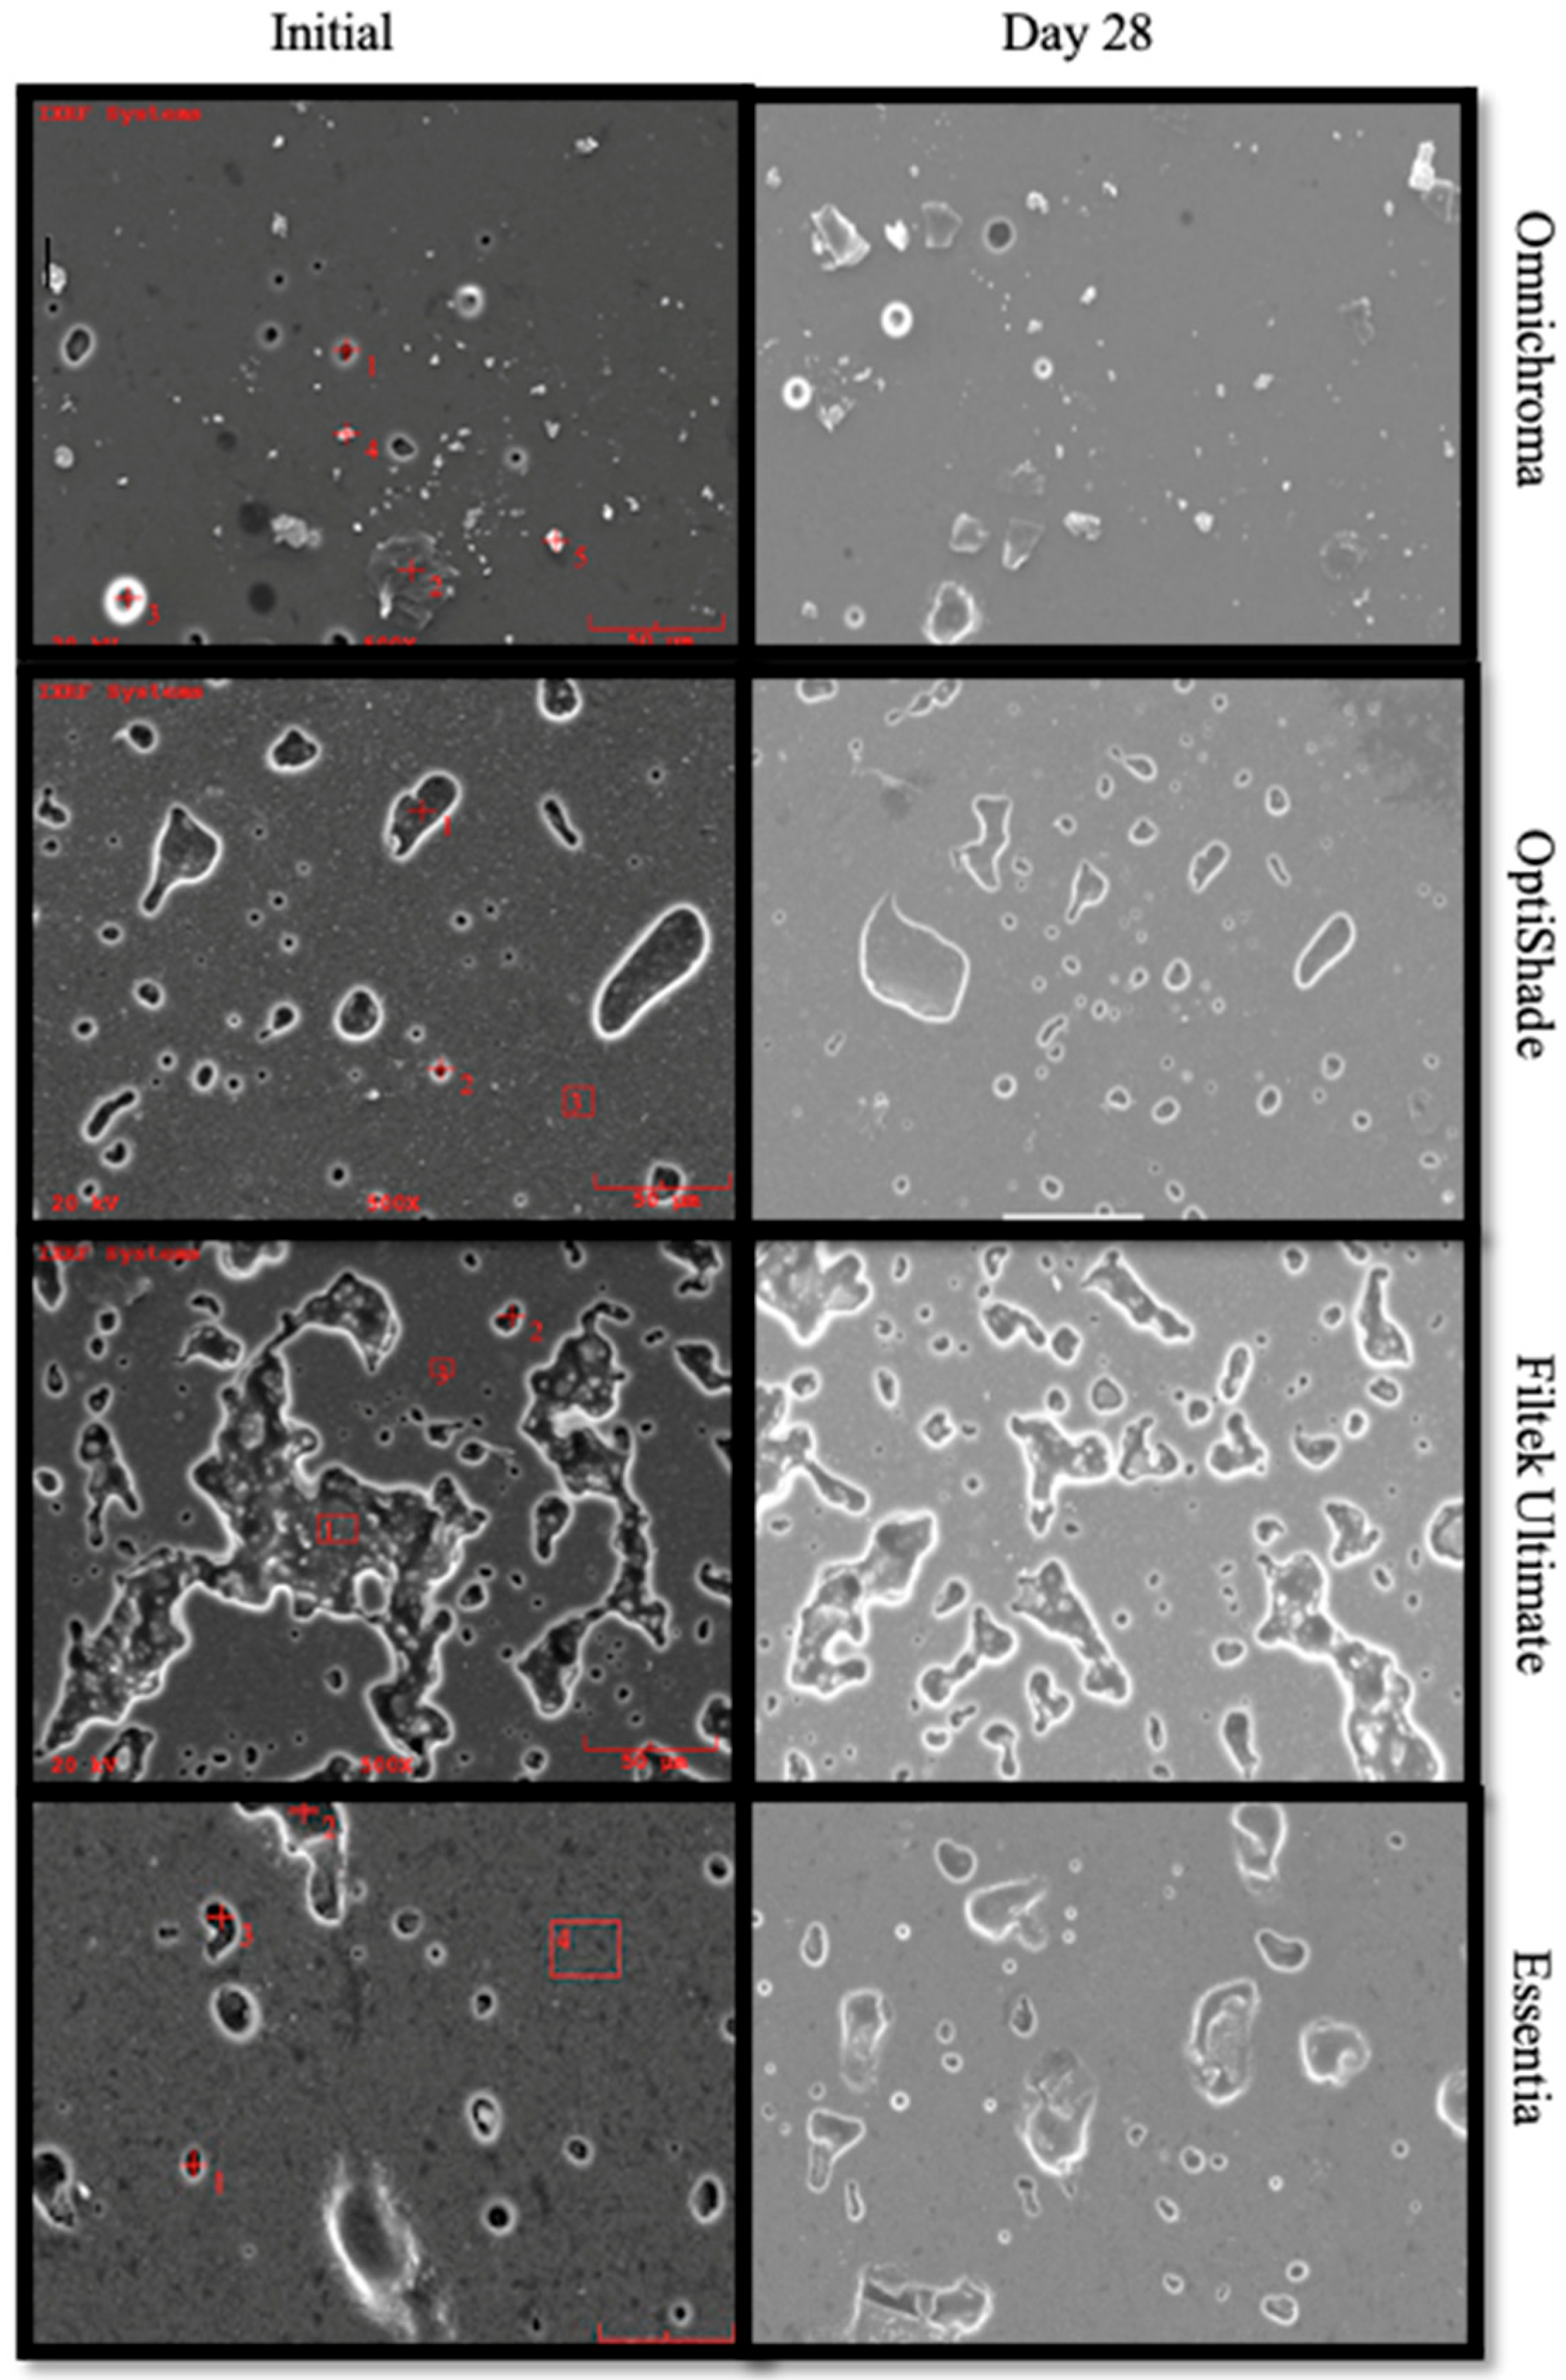
2.4. Scanning Electron Microscopy (SEM-EDS) Evaluation
A sample was randomly selected from each group and its surface was examined both before and 28 days after immersion in the detox drink. The selected samples were gold-plated for 90 s in a vacuum using a gold-plating device (Polaron Range SC7620, Quorum Technologies, West Sussex, UK). The sample surfaces were then examined using a scanning electron microscope (SEM) at 250× magnification, and images were recorded.
2.5. Statistical Analysis
IBM SPSS Statistics version 22.0 (IBM Corp., Armonk, NY, USA) was used for the statistical analysis of the findings obtained in the study. The suitability of the parameters for normal distribution was evaluated using Kolmogorov–Smirnov and Shapiro–Wilk tests, which determined that the parameters were suitable for normal distribution. To evaluate the effects of the resin composites, detox drinks, and time factors on roughness and translucency, three-way repeated measures ANOVA, post hoc Bonferroni, and Tukey tests were employed. To evaluate ∆E according to resin composites and detox drinks, a two-way ANOVA and a post hoc Tukey test were employed. Pearson’s correlation analysis was used to assess the correlation between surface roughness, colour change, and translucency. Significance was assessed at the p < 0.05 level.
3. Results
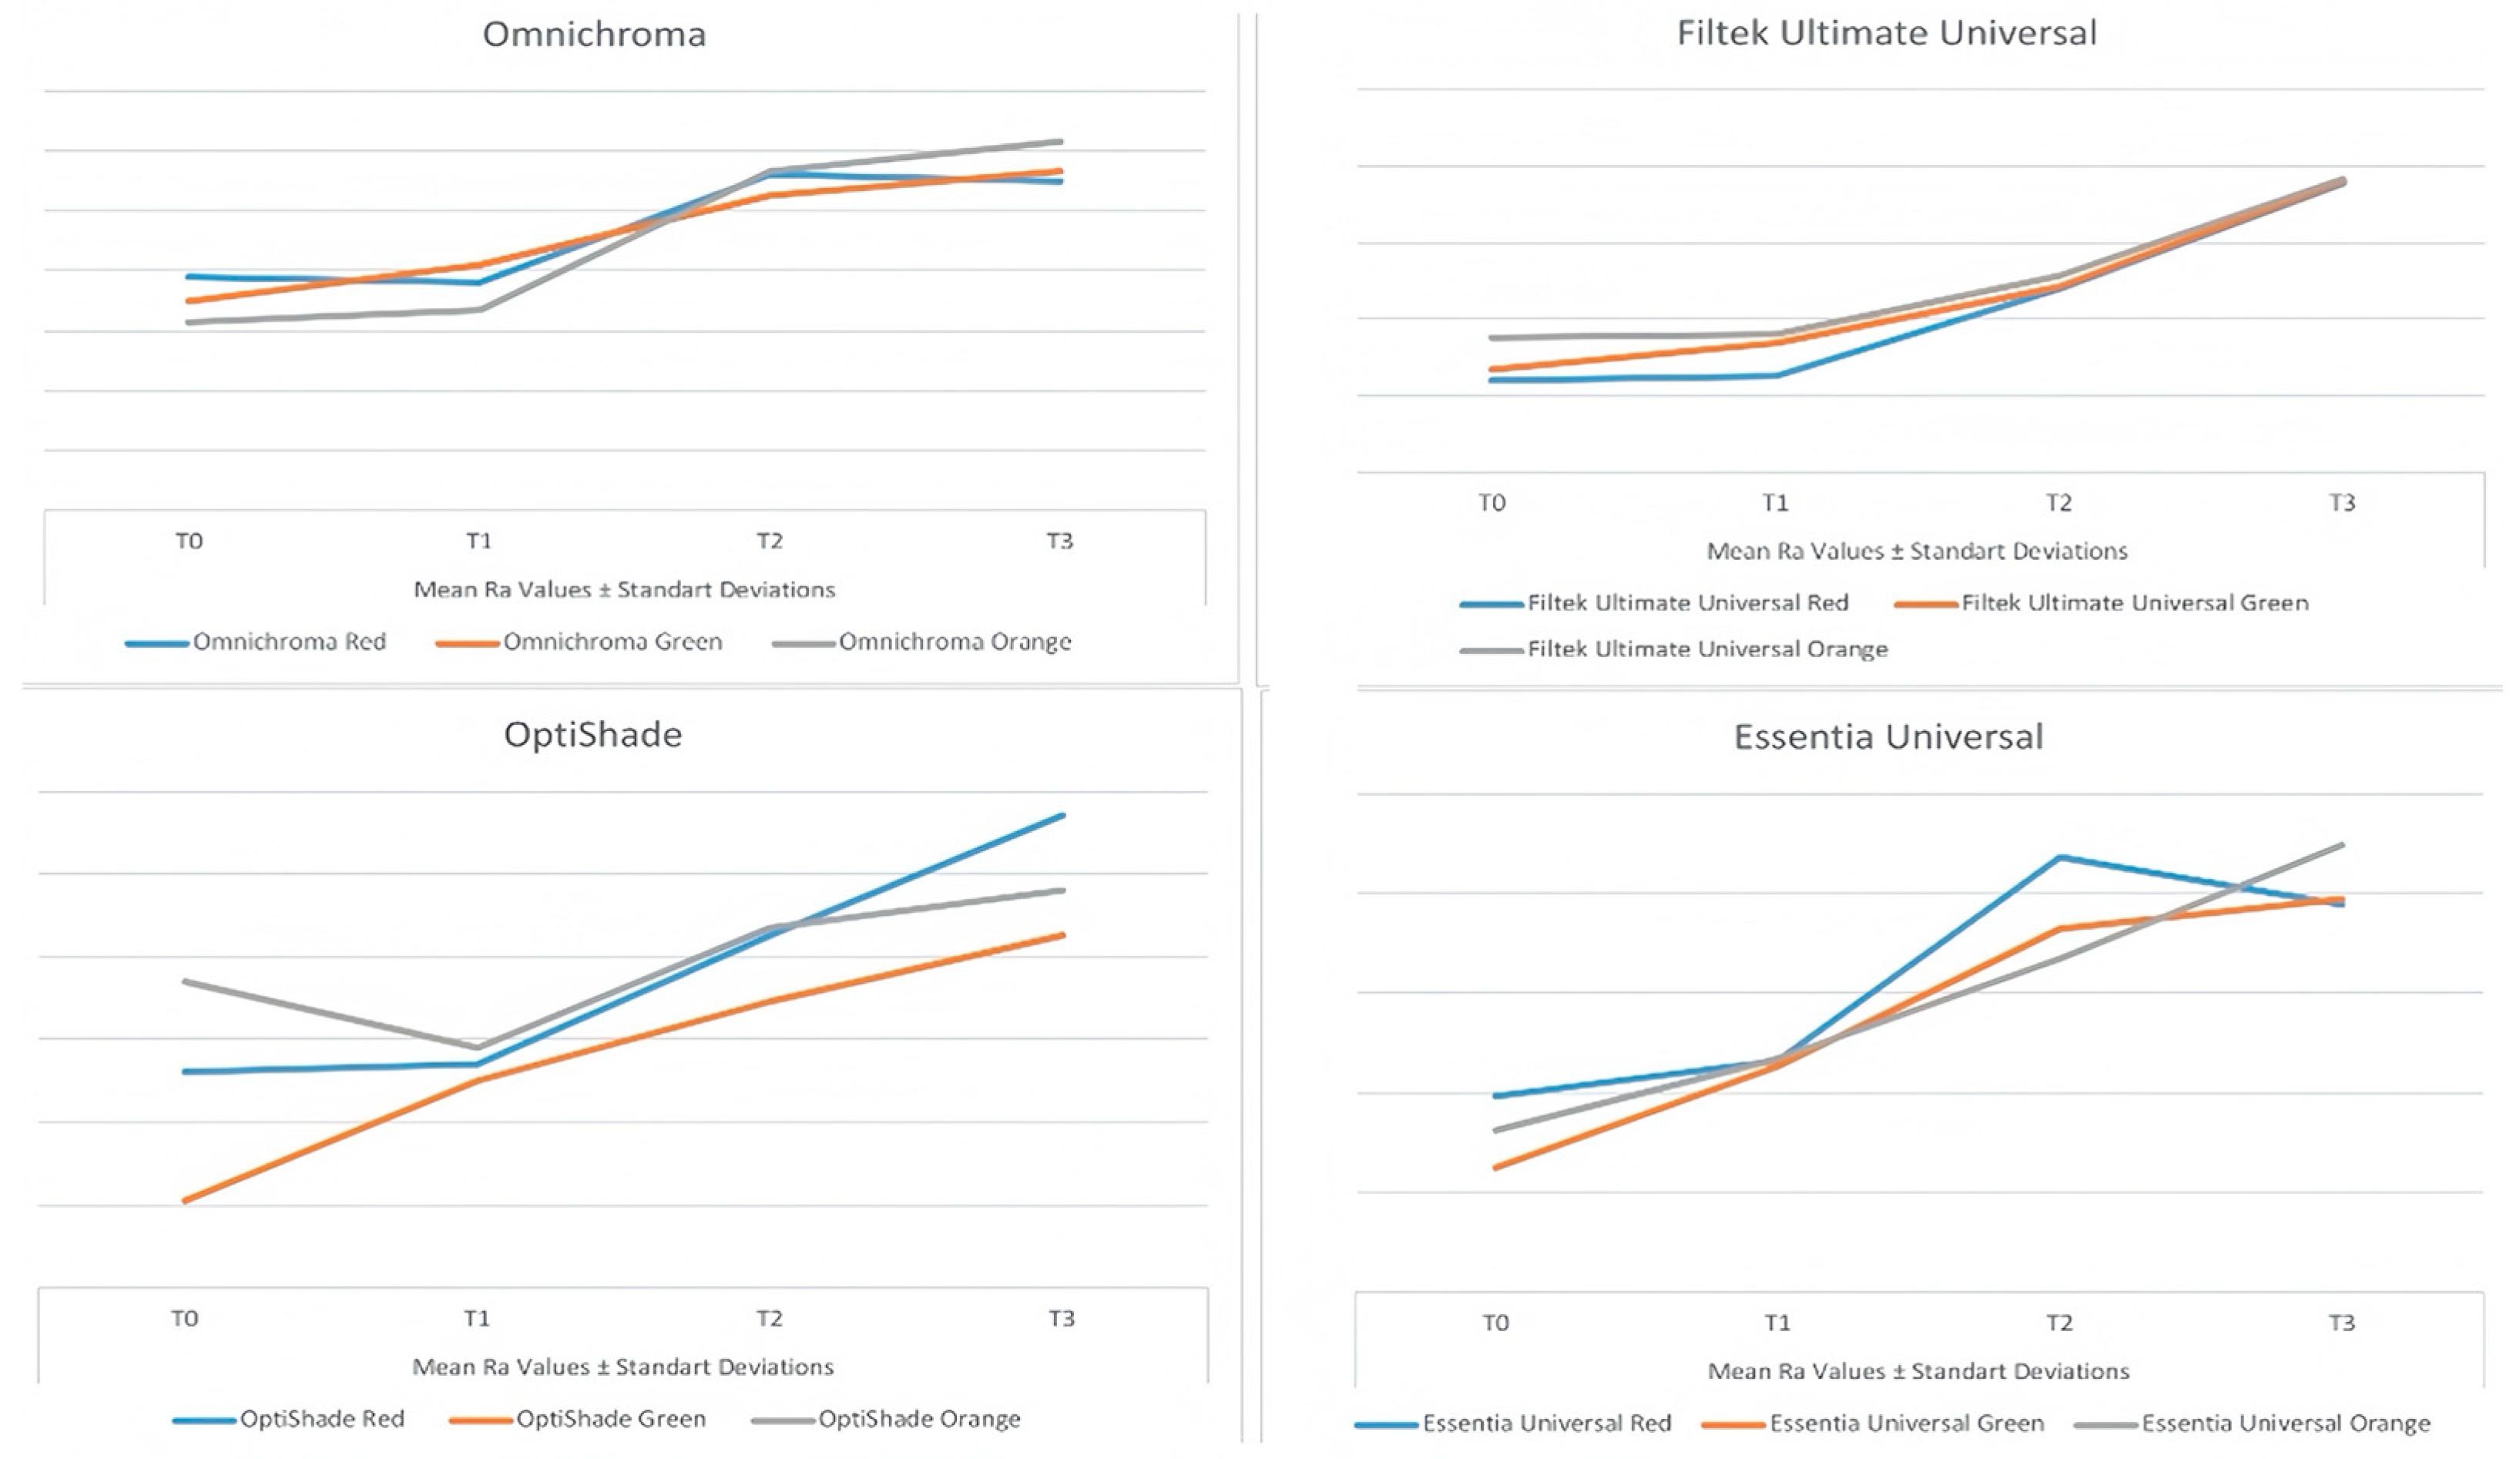
3.1. Surface Roughness
The mean surface roughness values (Ra) obtained for each of the test groups and the results of the statistical relationship between the groups are given in
Table 3 and
Figure 1.
Except for the T0 measurements of the orange detox drink, there was a statistically significant difference between the mean surface roughness values of the universal resin composites in all other groups (p < 0.05).
When the effect of different detox drinks on the surface roughness of each universal resin composite tested was examined, it was found that the mean surface roughness values with OM and OS on T1, T2, and T3 did not show a statistically significant difference between the detox drinks tested (p > 0.05). The highest mean surface roughness values with OM were obtained from the green detox drink on T1 and from the orange detox drink on T2 and T3. The highest mean surface roughness values with OS were obtained with the orange detox drink on T1 to T2 and with the red detox drink on T3. The mean surface roughness values with FU on T1 showed a statistically significant difference between the detox drinks (p < 0.05). The highest mean surface roughness values with FU at all time points were obtained with the orange detox drink. The mean surface roughness values with EU on T1 were not significantly different between the detox drinks (p > 0.05), whereas there was a significant difference in the mean surface roughness values between the detox drinks on T2 and T3 (p < 0.05). The highest mean surface roughness values with EU were obtained from the orange detox drink on T1 and T3 and the red detox drink on T2.
It was found that the mean surface roughness values of the universal resin composites tested increased over time as a result of exposure to the different detox drinks, with the highest mean surface roughness values at the T3 (except for the OM and EU groups and the red detox drink).
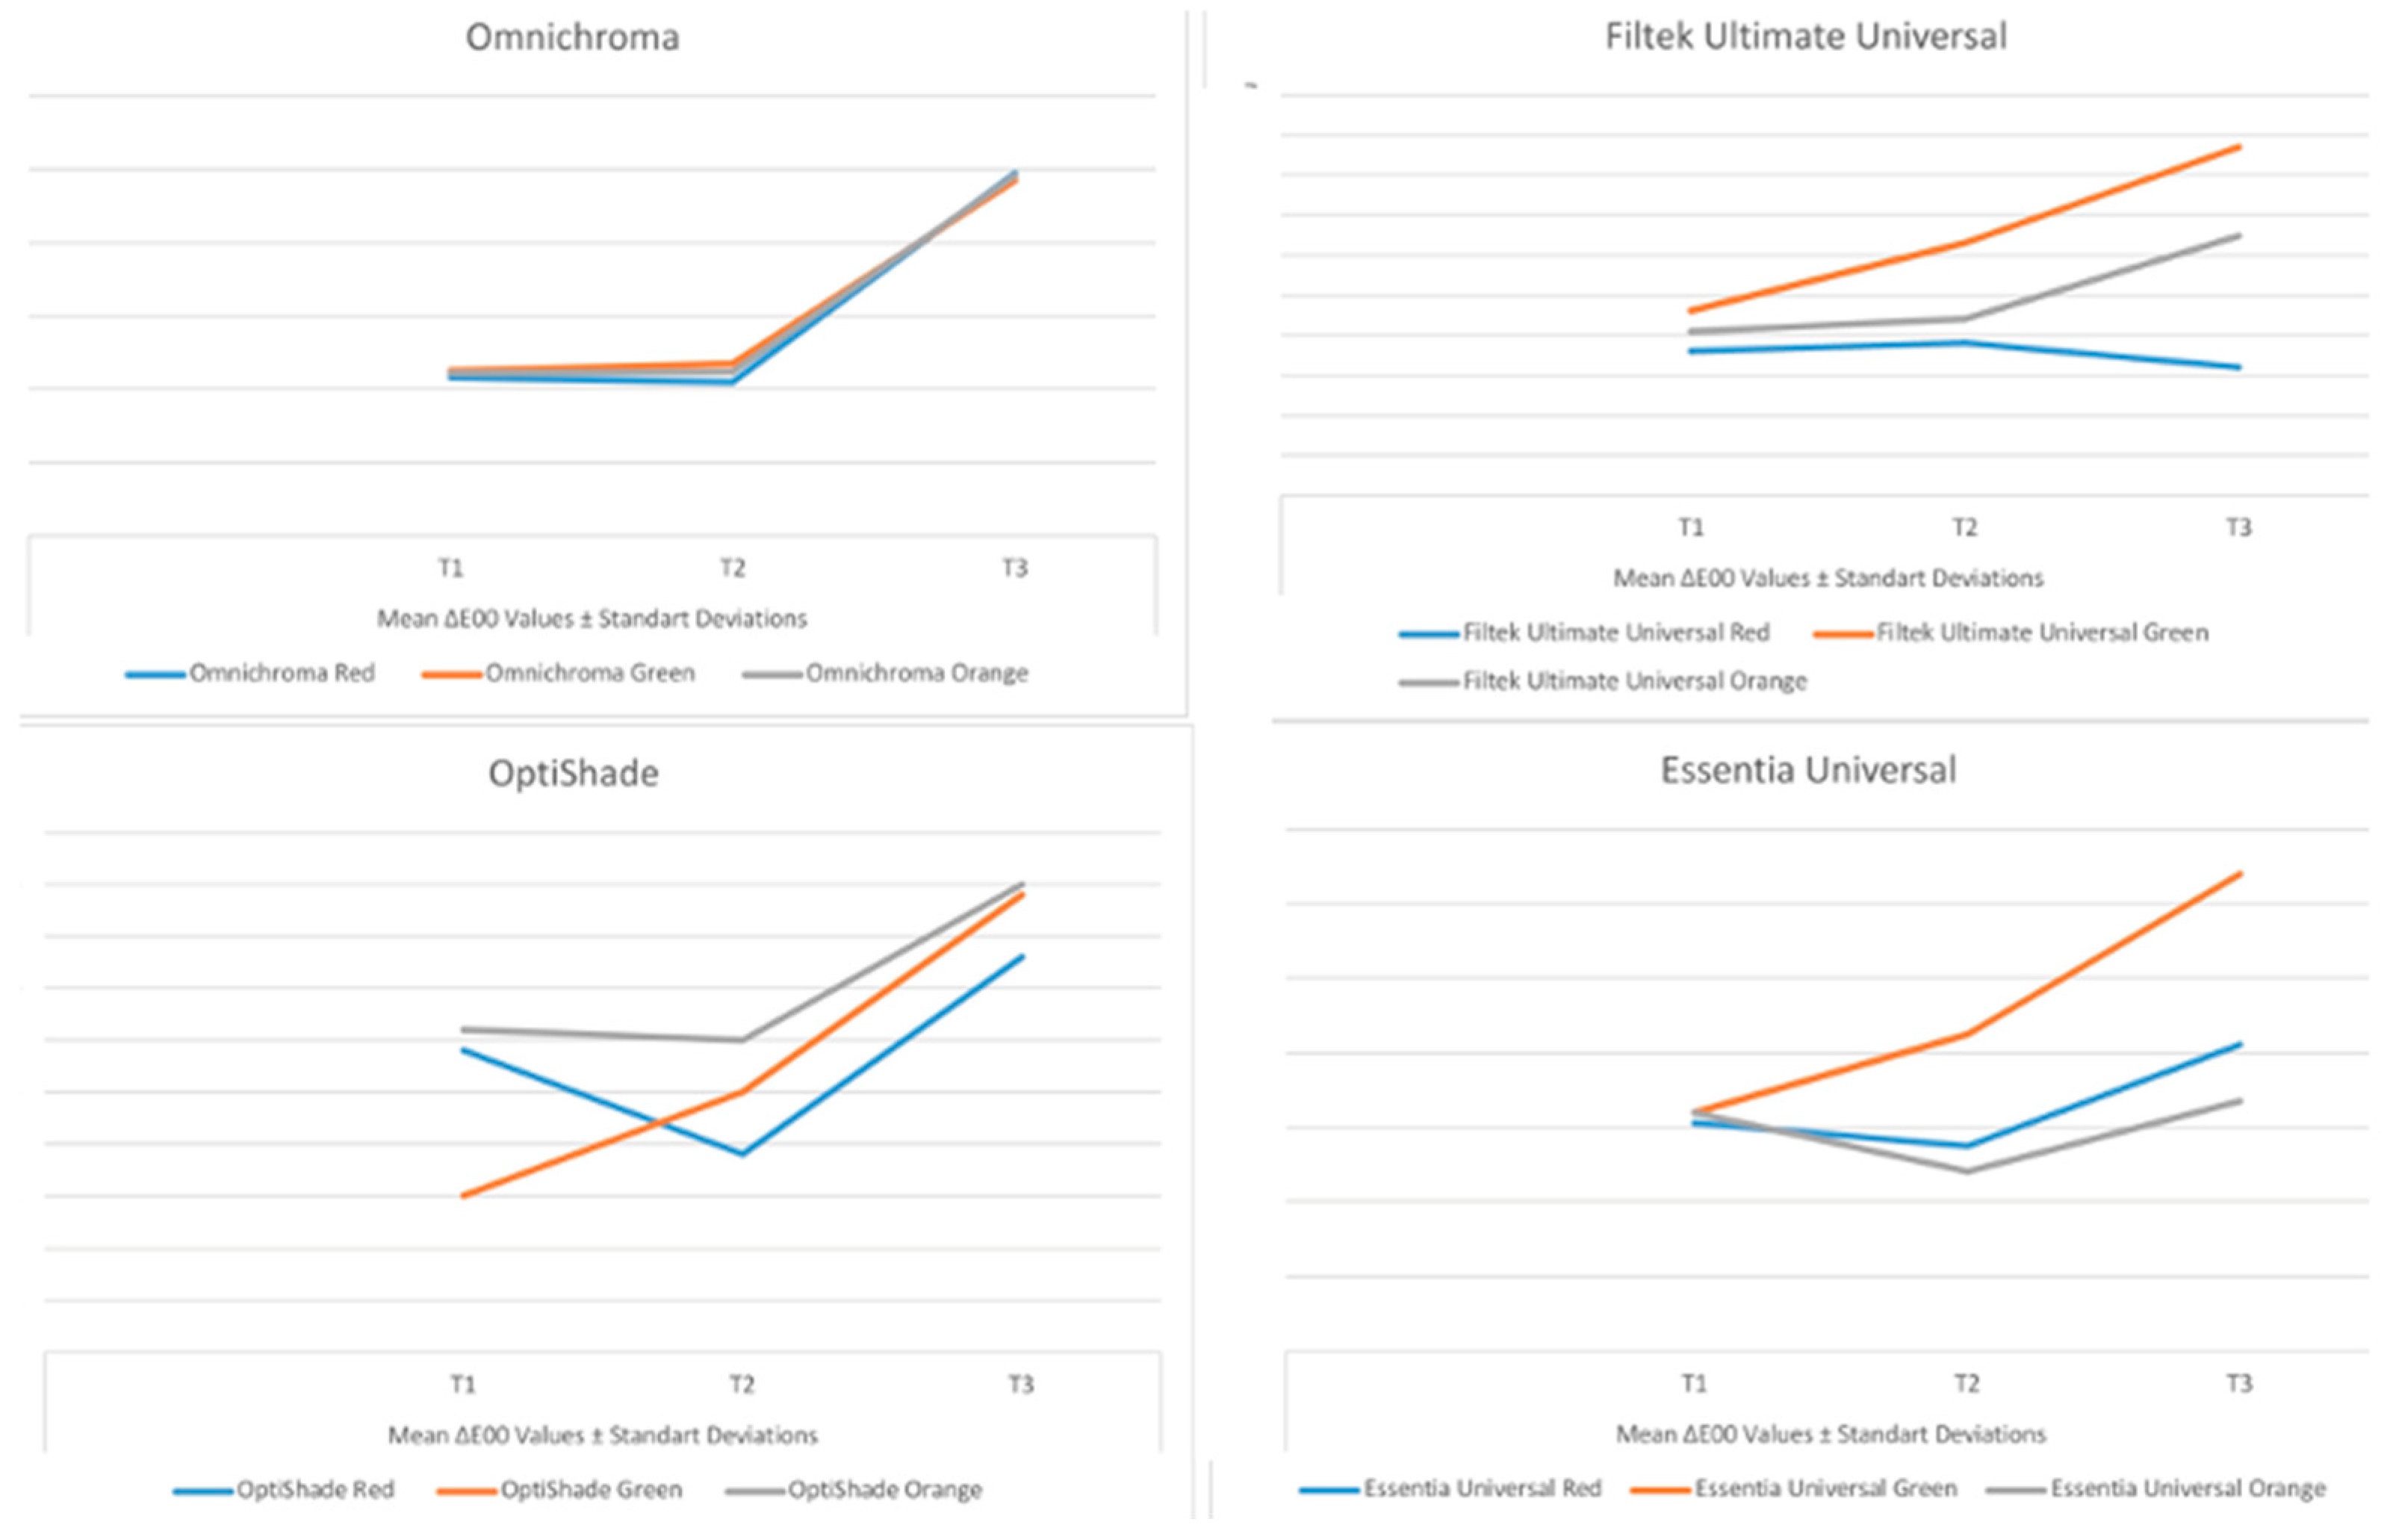
3.2. Colour Change (∆E00) Results
The mean ∆E
00 values calculated for each of the test groups exposed to detox drinks in the study and the results of the statistical relationship between the groups are shown in
Table 4 and
Figure 2.
For the samples prepared with OM, FU, and EU, the lowest mean ∆E00 values were obtained in the red detox drink, while for the samples prepared with OS, the lowest ∆E00 values were obtained in the green detox drink. When the effect of the detox drinks on the mean ∆E00 values of each universal resin composite tested was statistically analysed, it was found that there was a significant difference between the detox drinks in terms of mean ∆E00 values for all measurement periods with OM (p < 0.05). For OS, there was no significant difference in mean ∆E00 values between detox drinks at T1, T2, and T3 (p > 0.05). In the samples prepared with FU and EU, there was no significant difference in mean ∆E00 values between detox drinks except at T1 (p > 0.05).
In addition, the highest mean ∆E00 values with OM, OS, and EU were obtained at T3 for all detox drinks. For the samples prepared with FU, the highest ∆E00 values were obtained at T3 for the green and orange detox drinks, while the highest ∆E00 values were obtained at T2 for the red detox drink.
With OM, a positive, substantial correlation was found between ∆E00 and ∆TP00 in the red detox drink at T3 (66.4%, p = 0.036). In contrast, an inverse, good-level relationship was observed for the orange detox drink at T1 (70.8%, p = 0.022).
For OS, a positive, good-level correlation was observed between ∆E00 and surface roughness with the orange detox drink at T2 (75.6%, p = 0.011). At T3, ∆E00 and ∆TP00 were positively, significantly, and strongly correlated (70.9%, p = 0.022). However, with the green detox drink at T3, an inverse, good-level relationship was found between ∆E00 and ∆TP00 (69.4%, p = 0.026).
For FU, positive, good-level relationships were identified between ∆E00 and ∆TP00 with the red detox drink at both T1 and T2 (74.8% and 75.4%, p = 0.013 and p = 0.012, respectively). With the green detox drink at T2, ∆E00 showed a positive, good-level correlation with surface roughness (64%, p = 0.046). Additionally, at T1 and T3, ∆E00 was significantly correlated with ∆TP00 (67.9% and 71.3%, p = 0.031 and p = 0.021). For the orange detox drink at T2, a positive, good-level correlation between ∆E00 and roughness was also observed (70.2%, p = 0.024).
For EU, with the red detox drink at T3, ∆E
00 and ∆TP
00 demonstrated a positive, good-level correlation (75.3%,
p = 0.012). Furthermore, the orange detox drink showed positive, strong relationships between ∆E
00 and ∆TP
00 at both T2 (76%,
p = 0.011) and T3 (89.1%,
p = 0.001) (
Table 5).
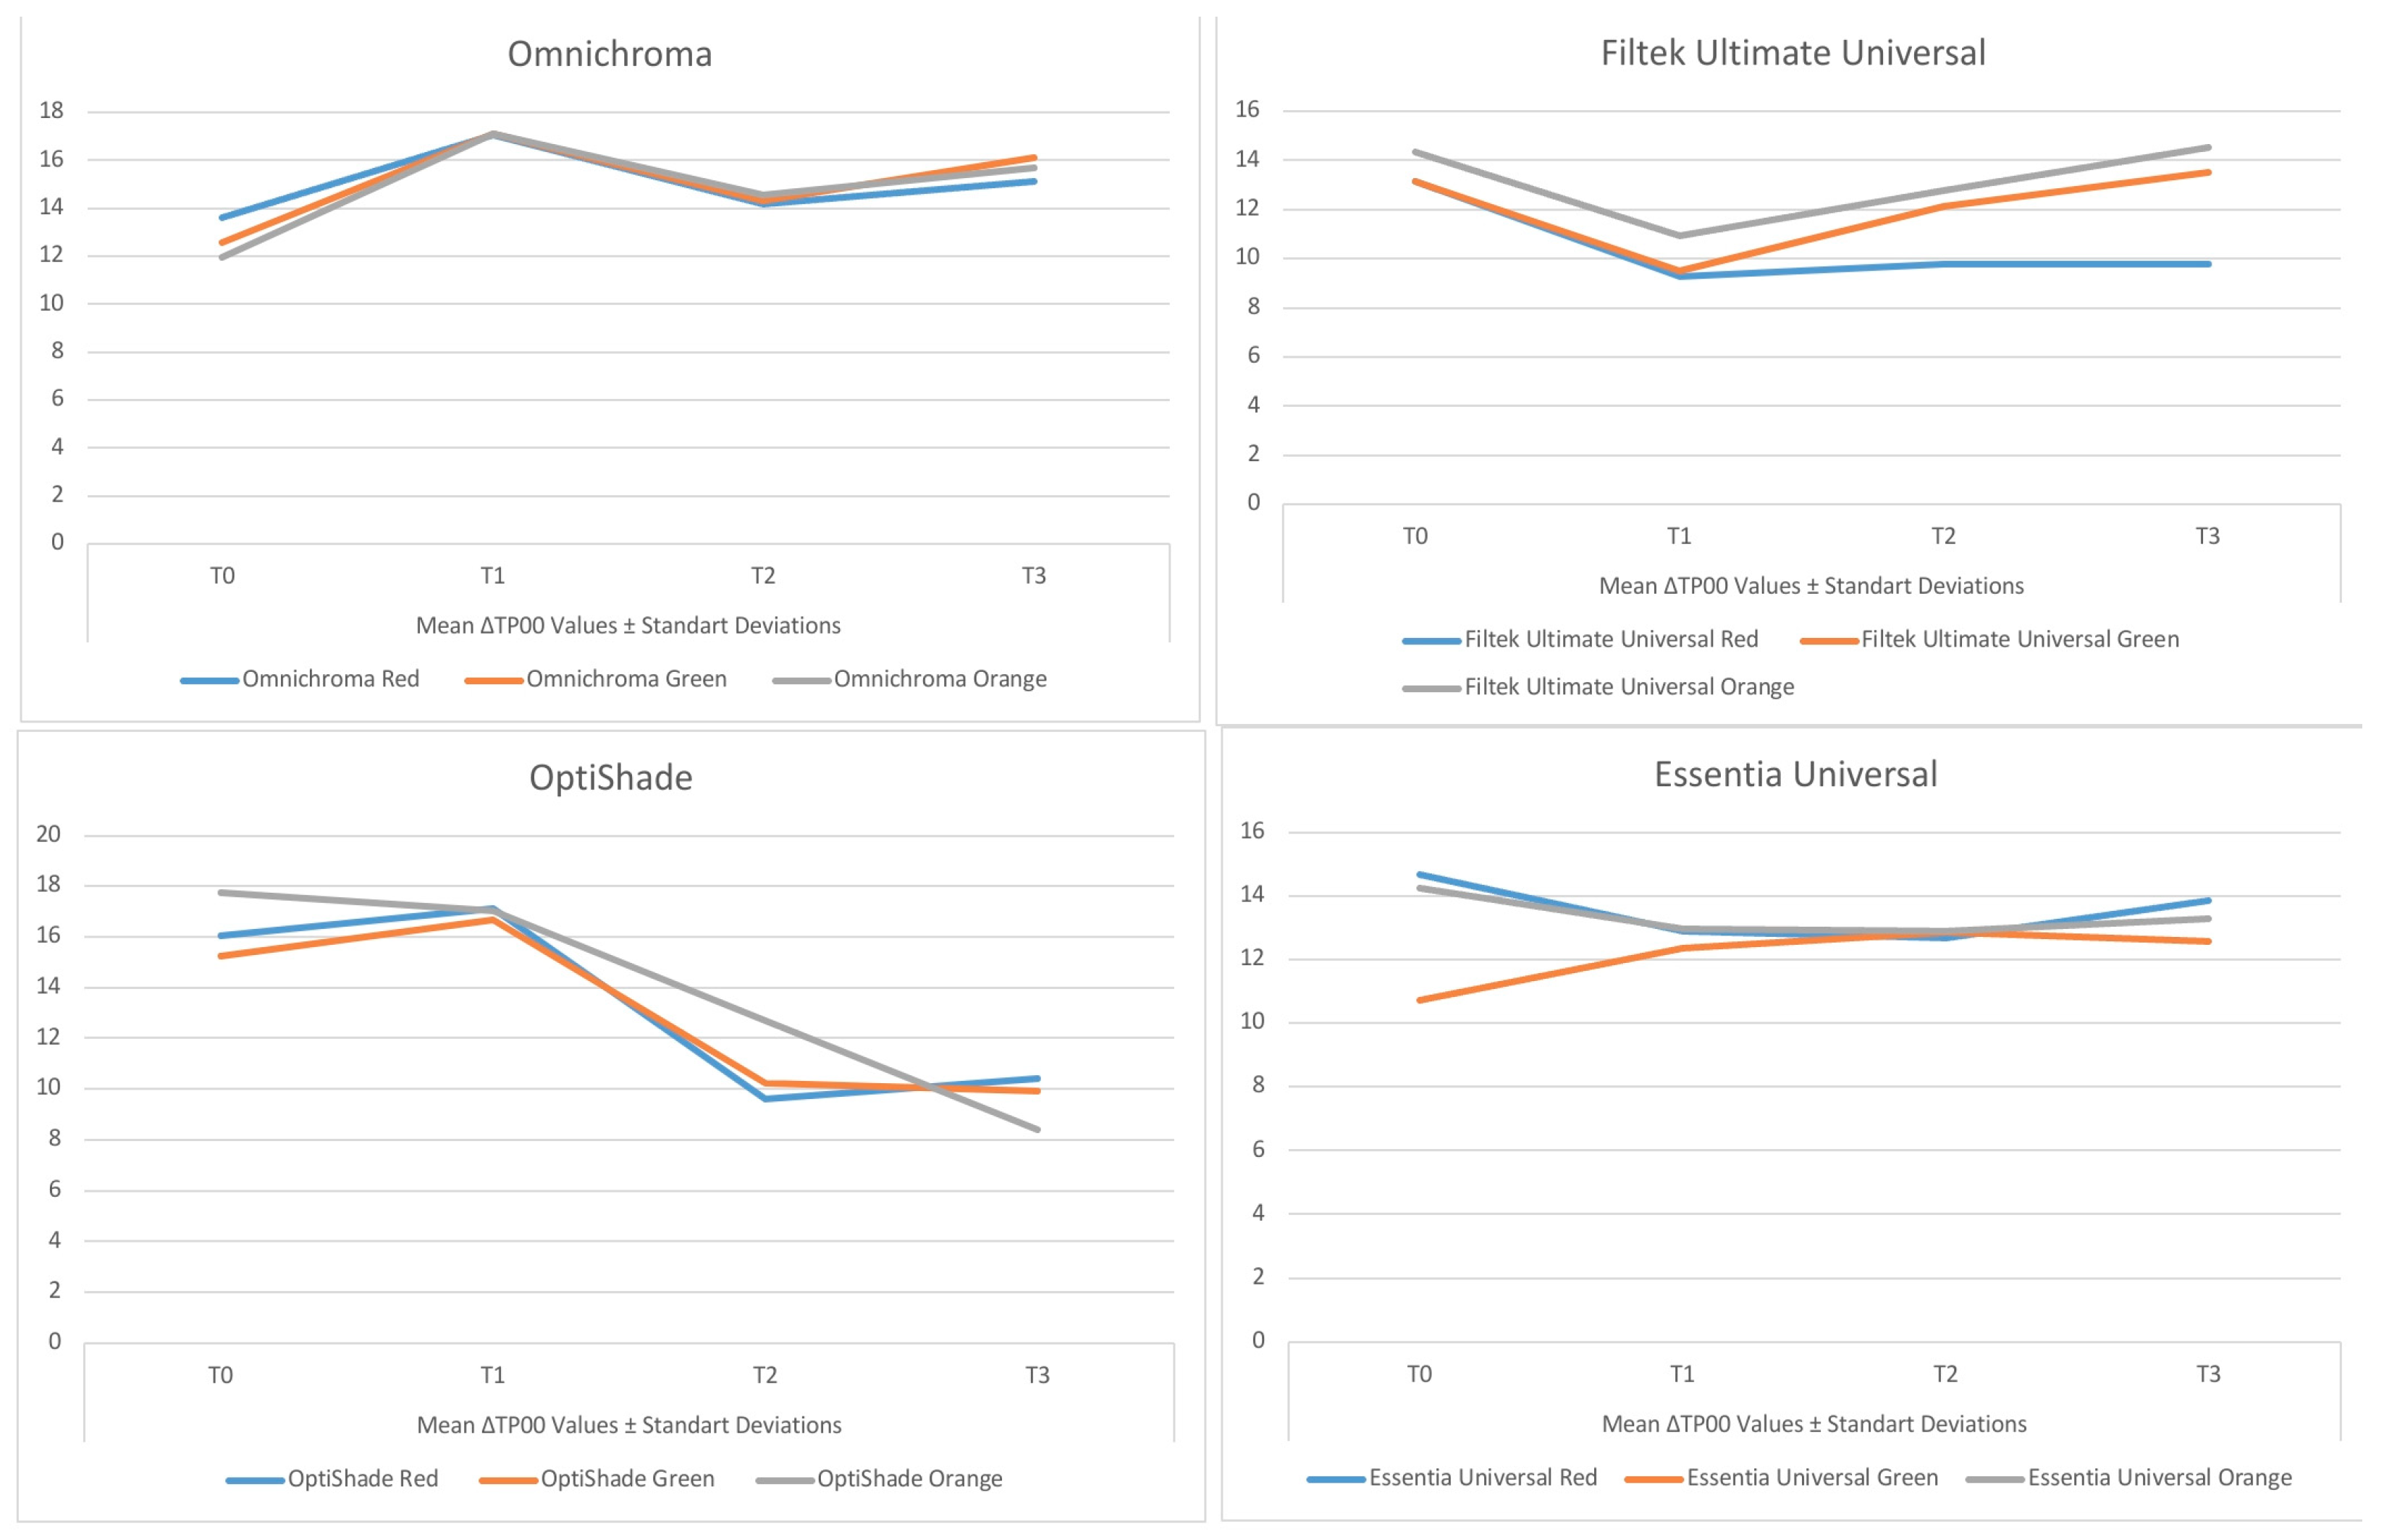
3.3. TP (ΔTP00) Results
The mean ∆TP
00 values calculated for each of the test groups exposed to detox drinks in the study and the results of the statistical relationship between the groups are shown in
Table 6 and
Figure 3.
At T1, the highest mean ∆TP00 values were obtained with OM and OS in the red detox drink and with FU and EU in the orange detox drink. At T2, the highest mean ∆TP00 values were obtained with exposure to the orange detox drink for all universal resin composites tested, and at T3, the highest mean ∆TP00 values were obtained with exposure to the green detox drink for samples prepared with OM and the red detox drink for samples prepared with OS and EU. When the effect of the detox drinks on the ∆TP00 values of each universal resin composite tested was statistically analysed, the mean ∆TP00 values obtained at all times for samples prepared with OM and EU were not significantly different between detox drinks (p > 0.05). At T2, the mean ∆TP00 values obtained with OS were significant for the orange detox drink compared to the other solutions, whereas the red detox drink was significant at T3 (p > 0.05). For FU, the ∆TP00 values obtained in all periods were significantly different between the detox drinks (p < 0.05).
Furthermore, when examining the correlations between roughness and translucency (ΔTP
00), a negative and significant correlation was found between OS and the green detox drink at T0 (r = −0.619,
p = 0.046). Additionally, a positive and significant relationship was observed between OS and the orange detox drink at T0 (r = 0.681,
p = 0.030), as well as a positive and significant correlation between OS and the red detox drink at T3 (r = 0.632,
p = 0.045). Positive and significant correlations were detected between FU and the red detox drink at T0 and T1 (r = 0.678,
p = 0.031 and r = 0.628,
p = 0.044, respectively). In EU, a very strong positive correlation was observed with the orange detox drink at T0 (r = 0.946,
p = 0.001), while a positive relationship was observed with the green detox drink at T1 (r = 0.679,
p = 0.031) (
Table 7).
3.4. SEM Observations
The SEM images of the resin composite surfaces at initial and after immersion in detox drink are shown in
Figure 4. In general, different surface topographies were observed for different resin composite combinations. Omnichroma and OptiShade resin composite showed very similar patterns in terms of surface appearance.
4. Discussion
The consumption of cold-pressed fruit and vegetable juices obtained by blending fruits and vegetables has become very popular in recent years. The colourant content and acidic nature of these drinks can affect the clinical appearance and longevity of restorations in the mouth [
7]. There is limited information in the literature about the effects of detox drinks on parameters that affect the aesthetic properties of universal resin composites (especially single-shade universal resin composites) such as surface roughness, colour change, and translucency. This study evaluated the effects of detox drinks on surface roughness, discolouration, and TP of four different universal resin composites. The mean Ra, ∆E
00, and ∆TP
00 values obtained from all groups tested in the study were found to be statistically different between the universal resin composites tested, the detox drinks, and the duration of exposure to the detox drinks. Therefore, all null hypotheses of this study were rejected.
Except for the samples prepared with EU and exposed to the orange detox drink for 28 days, the mean surface roughness values obtained from all other groups were below the threshold value of 0.2 µm. Bollen et al. [
14] reported that a surface roughness (Ra) greater than 0.2 µm increases bacterial adhesion and biofilm accumulation, potentially leading to secondary caries or gingival inflammation. Therefore, values above this threshold may necessitate restoration polishing or replacement. There is a close relationship between the surface roughness of resin composites and the type, size, amount, and manner in which filler particles are added to the resin.
In this study, it was found that there was a statistically significant difference between the mean surface roughness values of the universal resin composites tested in all measurement periods in each of the detox drinks. The highest mean surface roughness values in all measurement periods of the universal resin composites exposed to red and orange detox drinks were obtained from the samples prepared with EU. In the case of the green detox drinks, the highest surface roughness values were obtained from the samples prepared with EU for T1, T2, and T3. This may be due to the different types and sizes of filler particles and the way they are added to the tested resin in the universal resin composites. The lowest mean surface roughness values were obtained from the specimens prepared with OM and OS. This may be due to the smaller filler particle size of OM and OS compared to EU. The filler particles of OM consist of spherical silica and zirconia particles of 260 nm in size. OS contains silica, barium, and ytterbium filler particles with a mean size of 50 nm. The EU contains filler particles ranging from 0.01 to 10 μm together with prepolymerized filler particles with a size of 17 μm. It has been reported that the addition of prepolymerized filler particles increases the surface roughness of resin composites. This finding supports the results of Kedici Alp et al. [
23], who reported that higher roughness values were obtained with EU compared to OM. FU contains silica particles with a size of 20 nm and zirconium particles with a size of 4–11 nm. Although the filler size is smaller than OM and OS, the filler particle size as well as the amount of filler may have played a role in achieving higher average surface roughness values with FU than with OM and OS. In fact, when looking at the filler content of the universal resin composites tested, it can be seen that the filler content of FU is lower by weight than the other universal resin composites tested. This may result in higher mean surface roughness values for FU than for OM and OS.
When the effect of different detox drinks on the surface roughness of each tested universal resin composite was examined, it was found that the mean surface roughness values of universal resin composites were affected differently by detox drinks in each measurement period. For OM, it was found that the highest mean surface roughness values were obtained with the green detox drink at T1 and the orange detox drink at T2 and T3. For OS, the highest mean surface roughness values were obtained with the orange detox drink at T1 and T2 and with the red detox drink at T3. For FU, it was observed that the highest average surface roughness values were obtained with the orange detox drink at T1, T2, and T3. For EU, it was observed that the highest average surface roughness values were obtained with the orange detox drink at T1 and T3 and with the red detox drink at T2. This may be due to the high acidity of foods such as apple, ginger, orange, turmeric and grapefruit in the red and orange detox drinks [
22,
24].
Another finding we obtained regarding the effect of detox drinks on the mean surface roughness of universal resin composites is that the mean surface roughness values increased with time, and the highest surface roughness values were obtained at T3. (Except for the groups prepared with OM, FU, and EU and exposed to the red detox drink). This finding is consistent with the results of the study by Fahim et al. [
10].
Aesthetics and colour are very important issues in dental practice today. Colour change is defined as the mathematical expression of the difference between L*, a*, and b* values (ΔE
00) measured by a spectrophotometer in different samples or different parts of the same sample [
25]. Ideally, the colour of a material should remain stable; in other words, the ΔE
00 value should be 0. The human eye cannot detect cases where the ΔE
00 value is less than 1.5. When this value is equal to or greater than 3.3, it is possible to clinically perceive the colour difference [
25,
26]. In this study, it was observed that the ΔE
00 value was greater than 3.3 in all groups tested. Although ΔE
00 values above 3.3 indicate perceptible colour changes to the human eye, it does not always imply a need for restoration replacement. However, when values exceed 3.3 consistently over time or across multiple surfaces, it may be considered aesthetically unacceptable, especially in anterior restorations [
25,
26].
In this study it was found that the ΔE
00 values obtained at T1, T2, and T3 in each of the detox drinks showed statistically significant differences between the universal resin composites tested. In all detox drinks, the lowest ΔE
00 values were obtained with OM at both T1 and T2, while the highest ΔE
00 values were obtained with OM at T3. Lower ΔE
00 values were obtained in samples prepared with OS than in samples prepared with FU and EU. The highest ΔE
00 values were generally obtained in samples prepared with FU and EU. This may be due to the type of filler particle, the amount and the way it is added to the resin in the resin composites tested, and to the degree of surface roughness [
27,
28]. However, it has been reported that the resin matrix structure has an important effect on the colour change in resin composites. In this study, the monomer structure of the tested resin composites also differs. OM contains UDMA and TEGDMA monomers. The monomer structure of OS consists of Bis-GMA and TEGDMA monomers. FU contains Bis-GMA, UDMA, TEGDMA, and Bis-EMA monomers. The monomer structure of EU contains Bis-GMA, UDMA, TEGDMA, Bis-EMA, and Bis-MEPP monomers. The hydrophilic properties of the monomers that form the backbone of resin composites are different, and there is a close relationship between this property and the water absorption of the resin composite. The monomer with the most hydrophilic properties is TEGDMA. Bis-GMA monomer has been shown to have hydrophilic properties, although not as much as TEGDMA monomer. It has been reported that resin composites containing Bis-GMA show greater water absorption than resin composites containing UDMA and Bis-EMA [
29]. On the other hand, the water absorption of UDMA monomer is lower than that of Bis-GMA and TEGDMA monomers. In addition to its low water absorption, its low solubility also results in less colouration of resin composites containing this monomer [
2,
3]. Bis-EMA monomer has low water absorption due to the hydrophobic group in its structure. In light of this information, the lower mean ∆E
00 values obtained with OM at both the T1 and T2 measurements may be due to the UDMA monomer it contains. However, the fact that higher ∆E
00 values were obtained with this resin composite at T3 suggests that the degree of conversion as well as the monomer structure may influence the colour change. It has been reported that there is a relationship between the degree of conversion and the colour change in resin composites after polymerisation. Resin composites with a low degree of conversion exhibit poor colour properties due to residual monomers such as methacrylate remaining in their structures after polymerisation [
29]. However, as the degree of conversion of the resin composites tested in the study was not investigated, further studies are required.
When the effect of detox drinks on mean ∆E
00 values was examined, it was found that there was a significant difference between detox drinks in terms of ∆E
00 values in samples prepared with OM at all measurement periods; whereas, there was no significant difference between detox drinks in terms of mean ∆E
00 values in samples prepared with OS. For samples prepared with FU and EU, it was found that there was no significant difference between detox drinks in terms of ∆E
00 values only at T1. Based on these findings, it can be said that the structural properties of detox drinks play an important role in the effect of colour change in universal resin composites [
23,
24]. A similar finding was reported in a study by Checchi et al., which evaluated the colour stability of single-shade composites after exposure to acidic beverages such as coffee, tea, and fruit juices [
4]. The study observed progressively higher ∆E
00 values in specimens immersed in pigmented acidic solutions, with a notable increase by day 30. These results support the idea that prolonged exposure to low-pH, chromogenic beverages can accelerate colour instability in resin-based materials.
When the relationship between the exposure time of universal resin composites to detox drinks and colour change was examined, it was found that the highest colouration was obtained at T3 in all detox drinks in samples prepared with OM, OS, and EU. In samples prepared with FU, the highest ∆E00 values were obtained at T3 in the green and orange detox drinks, while it was obtained at T2 in the red detox drink. The different content and pH of the detox drinks may play a role in this finding.
With resin composite restorations, especially in the anterior region, it is desirable that the colour remains stable and the translucency is similar to that of natural teeth [
17,
30]. However, this is quite difficult to achieve, especially in Class III and Class IV restorations. In this study, the mean ∆TP
00 values of the universal resin composites tested varied between 8.38 and 17.65. The translucency property of resin composites is influenced by the composition of the resin matrix and the filler particles that comprise its structure; the size and ratio of the filler particles; the difference between the refractive indices of components such as the resin matrix, inorganic filler particles and colour pigments; and factors such as the degree of transformation [
31,
32]. Resin composites containing smaller filler particles are more translucent, while those containing larger filler particles are less translucent, resulting in a more opaque appearance. In addition, the particle size of the restorative material also affects the translucency of the material. Even if the material has large particles, if the number of particles per volume is low, this will result in less light scattering and a decrease in opacity [
33].
The amount of light absorbed, reflected, or transmitted can also vary depending on the chemical properties of the material. Therefore, even if the colours of restorative materials with different chemical structures are the same, their reflection or absorption of light may differ. This is because colour properties are a result of the properties and composition of the material [
33]. Studies investigating the relationship between resin monomer structure and translucency [
31,
33] have reported that the translucency of the Bis-GMA monomer is higher than that of the UDMA and TEGDMA monomers. In addition, it has been reported that translucency will be high if the refractive index of the resin monomer and the refractive index of the filler particles are close to each other. Examples of this can be given as Bis-GMA monomer and silica fillers. Therefore, it is expected that the translucency of resin composites consisting of these two components will be high [
2].
In this study, it was found that there was a statistically significant difference between the mean ∆TP
00 values of the universal resin composites tested in each of the detox drinks over the entire measurement period. This shows that in addition to the structural properties of the resin composites, the structural properties of the detox drinks and the exposure times to these products also have an effect on the ∆TP
00 values. It was found that the highest ∆TP
00 values were obtained from the samples prepared with OM in all detox drinks and all measurement periods. In addition to the filler particle structure of OM, the fact that it does not contain colour pigments and that its optical properties are obtained using smart colour technology may play a role in achieving this result [
34]. It was found that the ∆TP
00 values of other universal resin composites varied depending on the detox drink used and the measurement period. The change in the refractive index of the components due to the increase in the degree of transformation of the resin matrix can also change the translucency of the material. Increasing the degree of transformation results in an increase in the difference in refractive index between the resin matrix and the inorganic filler [
35].
Another finding of this study is that the mean ∆TP
00 values of the resin composites tested increased as the exposure time to the detox drinks increased. It was observed that there was a significant difference between the mean ∆TP
00 values obtained with OM and EU in all the measurement periods and between the detox drinks. In the samples prepared with OS, the statistical effect of the detox drinks on the mean ∆TP
00 values obtained was observed at T2 and T3, whereas there was no difference in the mean ∆TP
00 values between the detox drinks at T1. Studies have reported that ∆TP
00 values in resin composites decrease after aging and colouring processes [
36], while there are also studies reporting that they increase [
37,
38]. In this study, while ∆TP
00 values increased in OM after storage in detox drinks, it was observed that the mean ∆TP
00 values decreased in the other universal resin composites tested.
This study was conducted under in vitro conditions, which do not fully replicate the complex environment of the oral cavity. Therefore, the results may differ from those observed in clinical practice. The surface roughness and colour stability of universal resin composites can be significantly influenced by factors such as saliva, enzymes, fluctuations in pH, and the intake of foods and beverages at varying temperatures. Furthermore, this study did not incorporate mechanical wear simulation or thermal cycling, both of which are essential for mimicking intraoral dynamics. Given these limitations, further in vivo studies with larger sample sizes and long-term evaluations are required to accurately assess the impact of detox drinks on the surface quality and longevity of universal resin composites. Future studies should aim to simulate the dynamic and multifactorial conditions of the oral environment more accurately by incorporating mechanical loading (chewing simulation) and thermal cycling in experimental protocols. Additionally, in vivo clinical trials involving real-time exposure of resin composites to dietary factors, including detox drinks, could provide more clinically relevant data. Expanding the sample size, extending the observation period, and including microhardness and wear resistance as additional parameters would further enhance the comprehensiveness and applicability of future research in this field.


