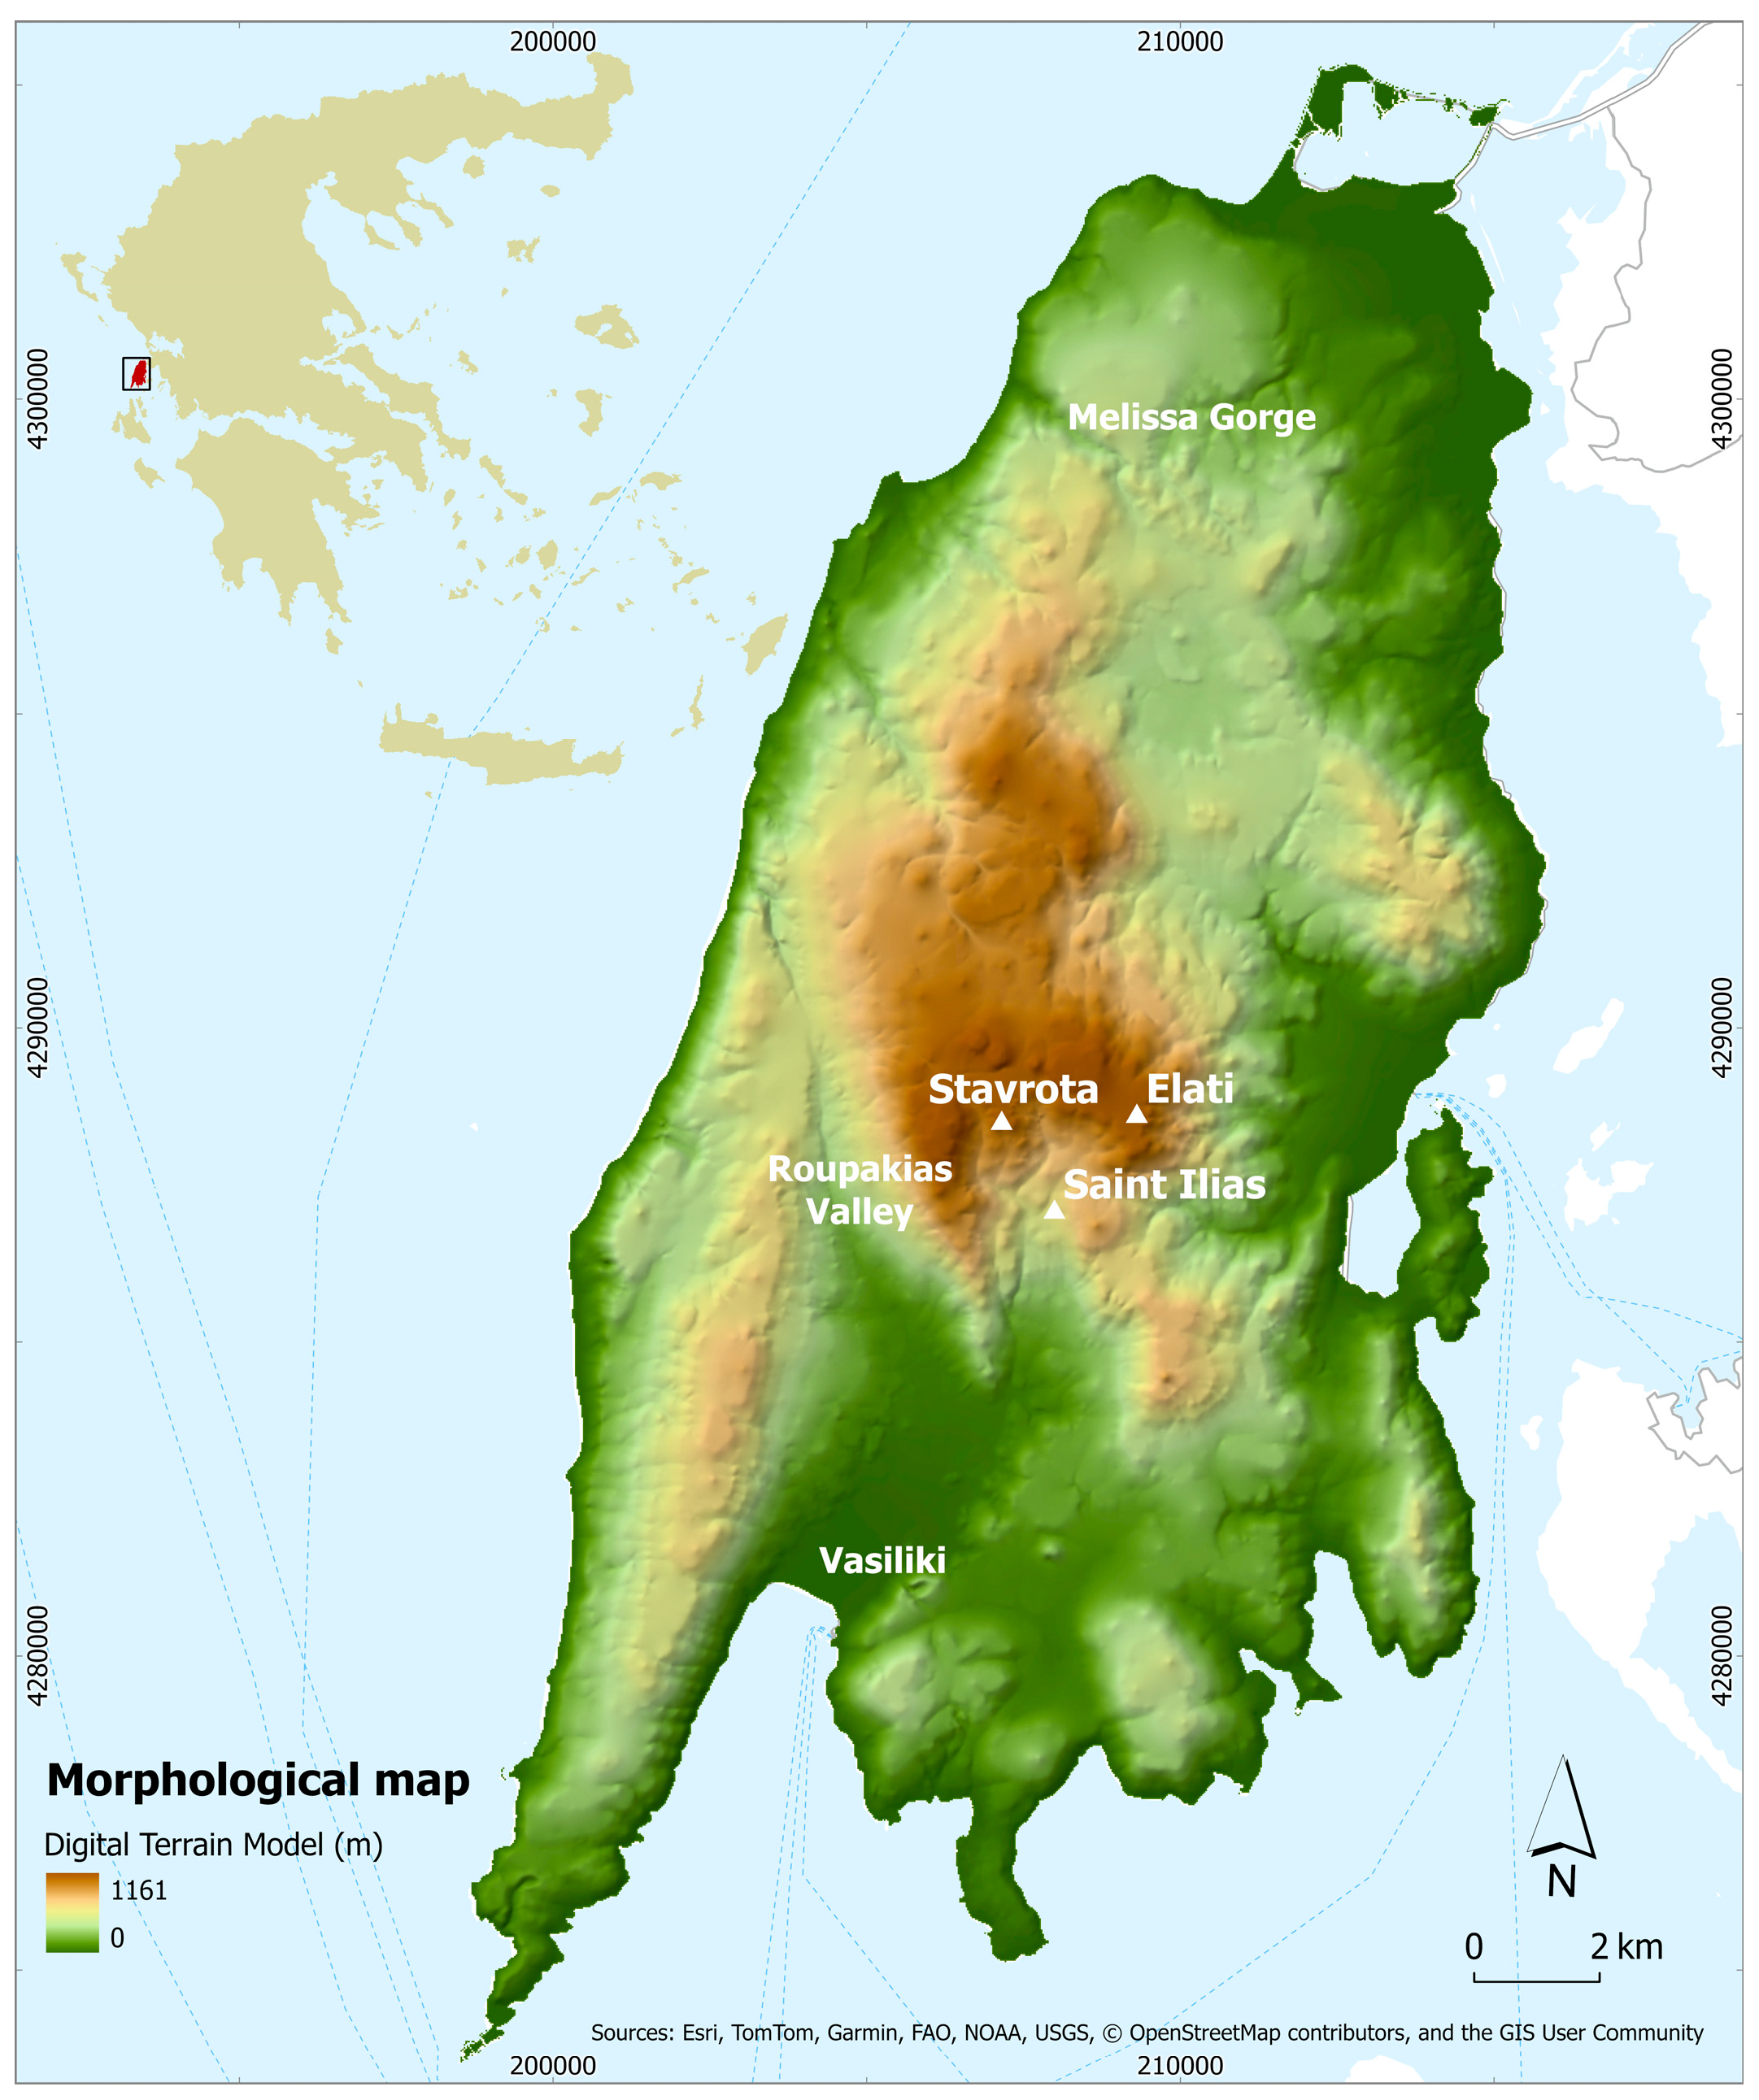
Figure 1.
Digital Terrain Model of Lefkas Island indicating the peaks, plains and deep valleys on the Island. The small map presents the geographic location of the island in Greece.
Figure 1.
Digital Terrain Model of Lefkas Island indicating the peaks, plains and deep valleys on the Island. The small map presents the geographic location of the island in Greece.
Figure 2.
(a) Morphological Slope Map of Lefkas Island and (b) Slope Aspect Map. Pie charts present the percentage of area occupied by the various categories.
Figure 2.
(a) Morphological Slope Map of Lefkas Island and (b) Slope Aspect Map. Pie charts present the percentage of area occupied by the various categories.
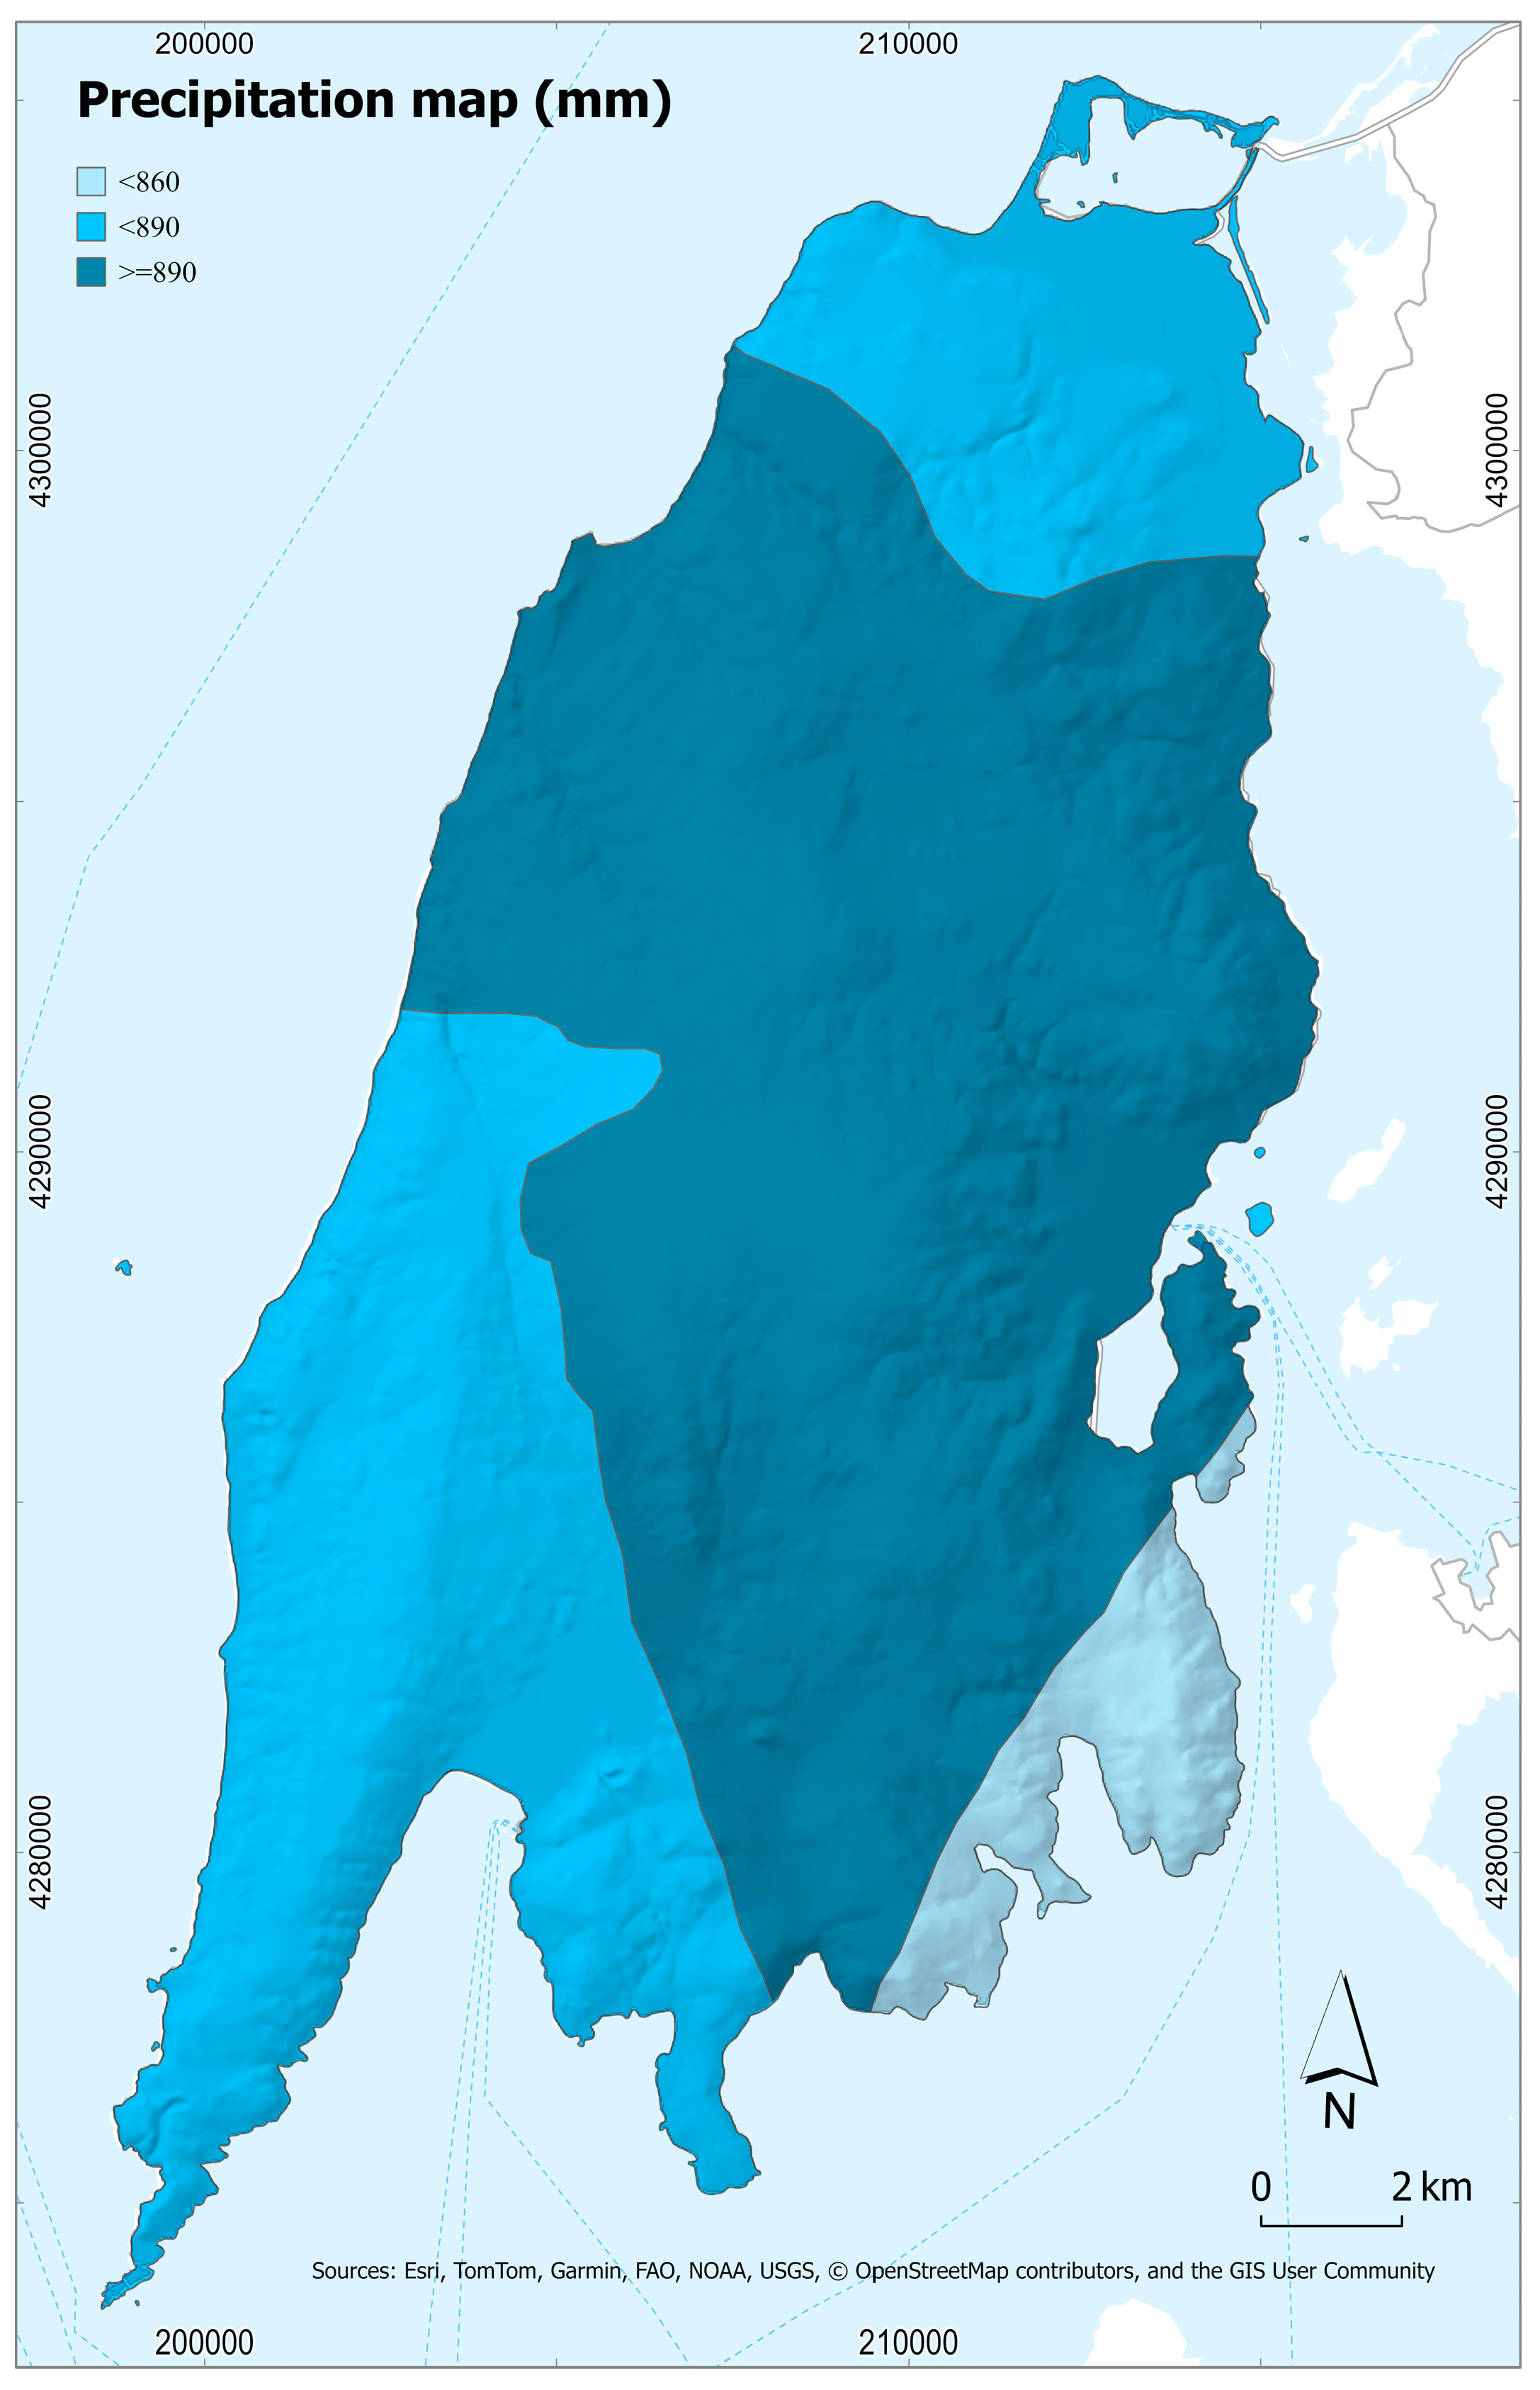
Figure 3.
Precipitation Map of Lefkas Island that was constructed with rainfall data from the meteorological stations across the region of interest using the Thiessen polygon methodology. The island experiences an average amount of precipitation of 845–918 mm, with the lowest amount occurring in the south-east part of the island.
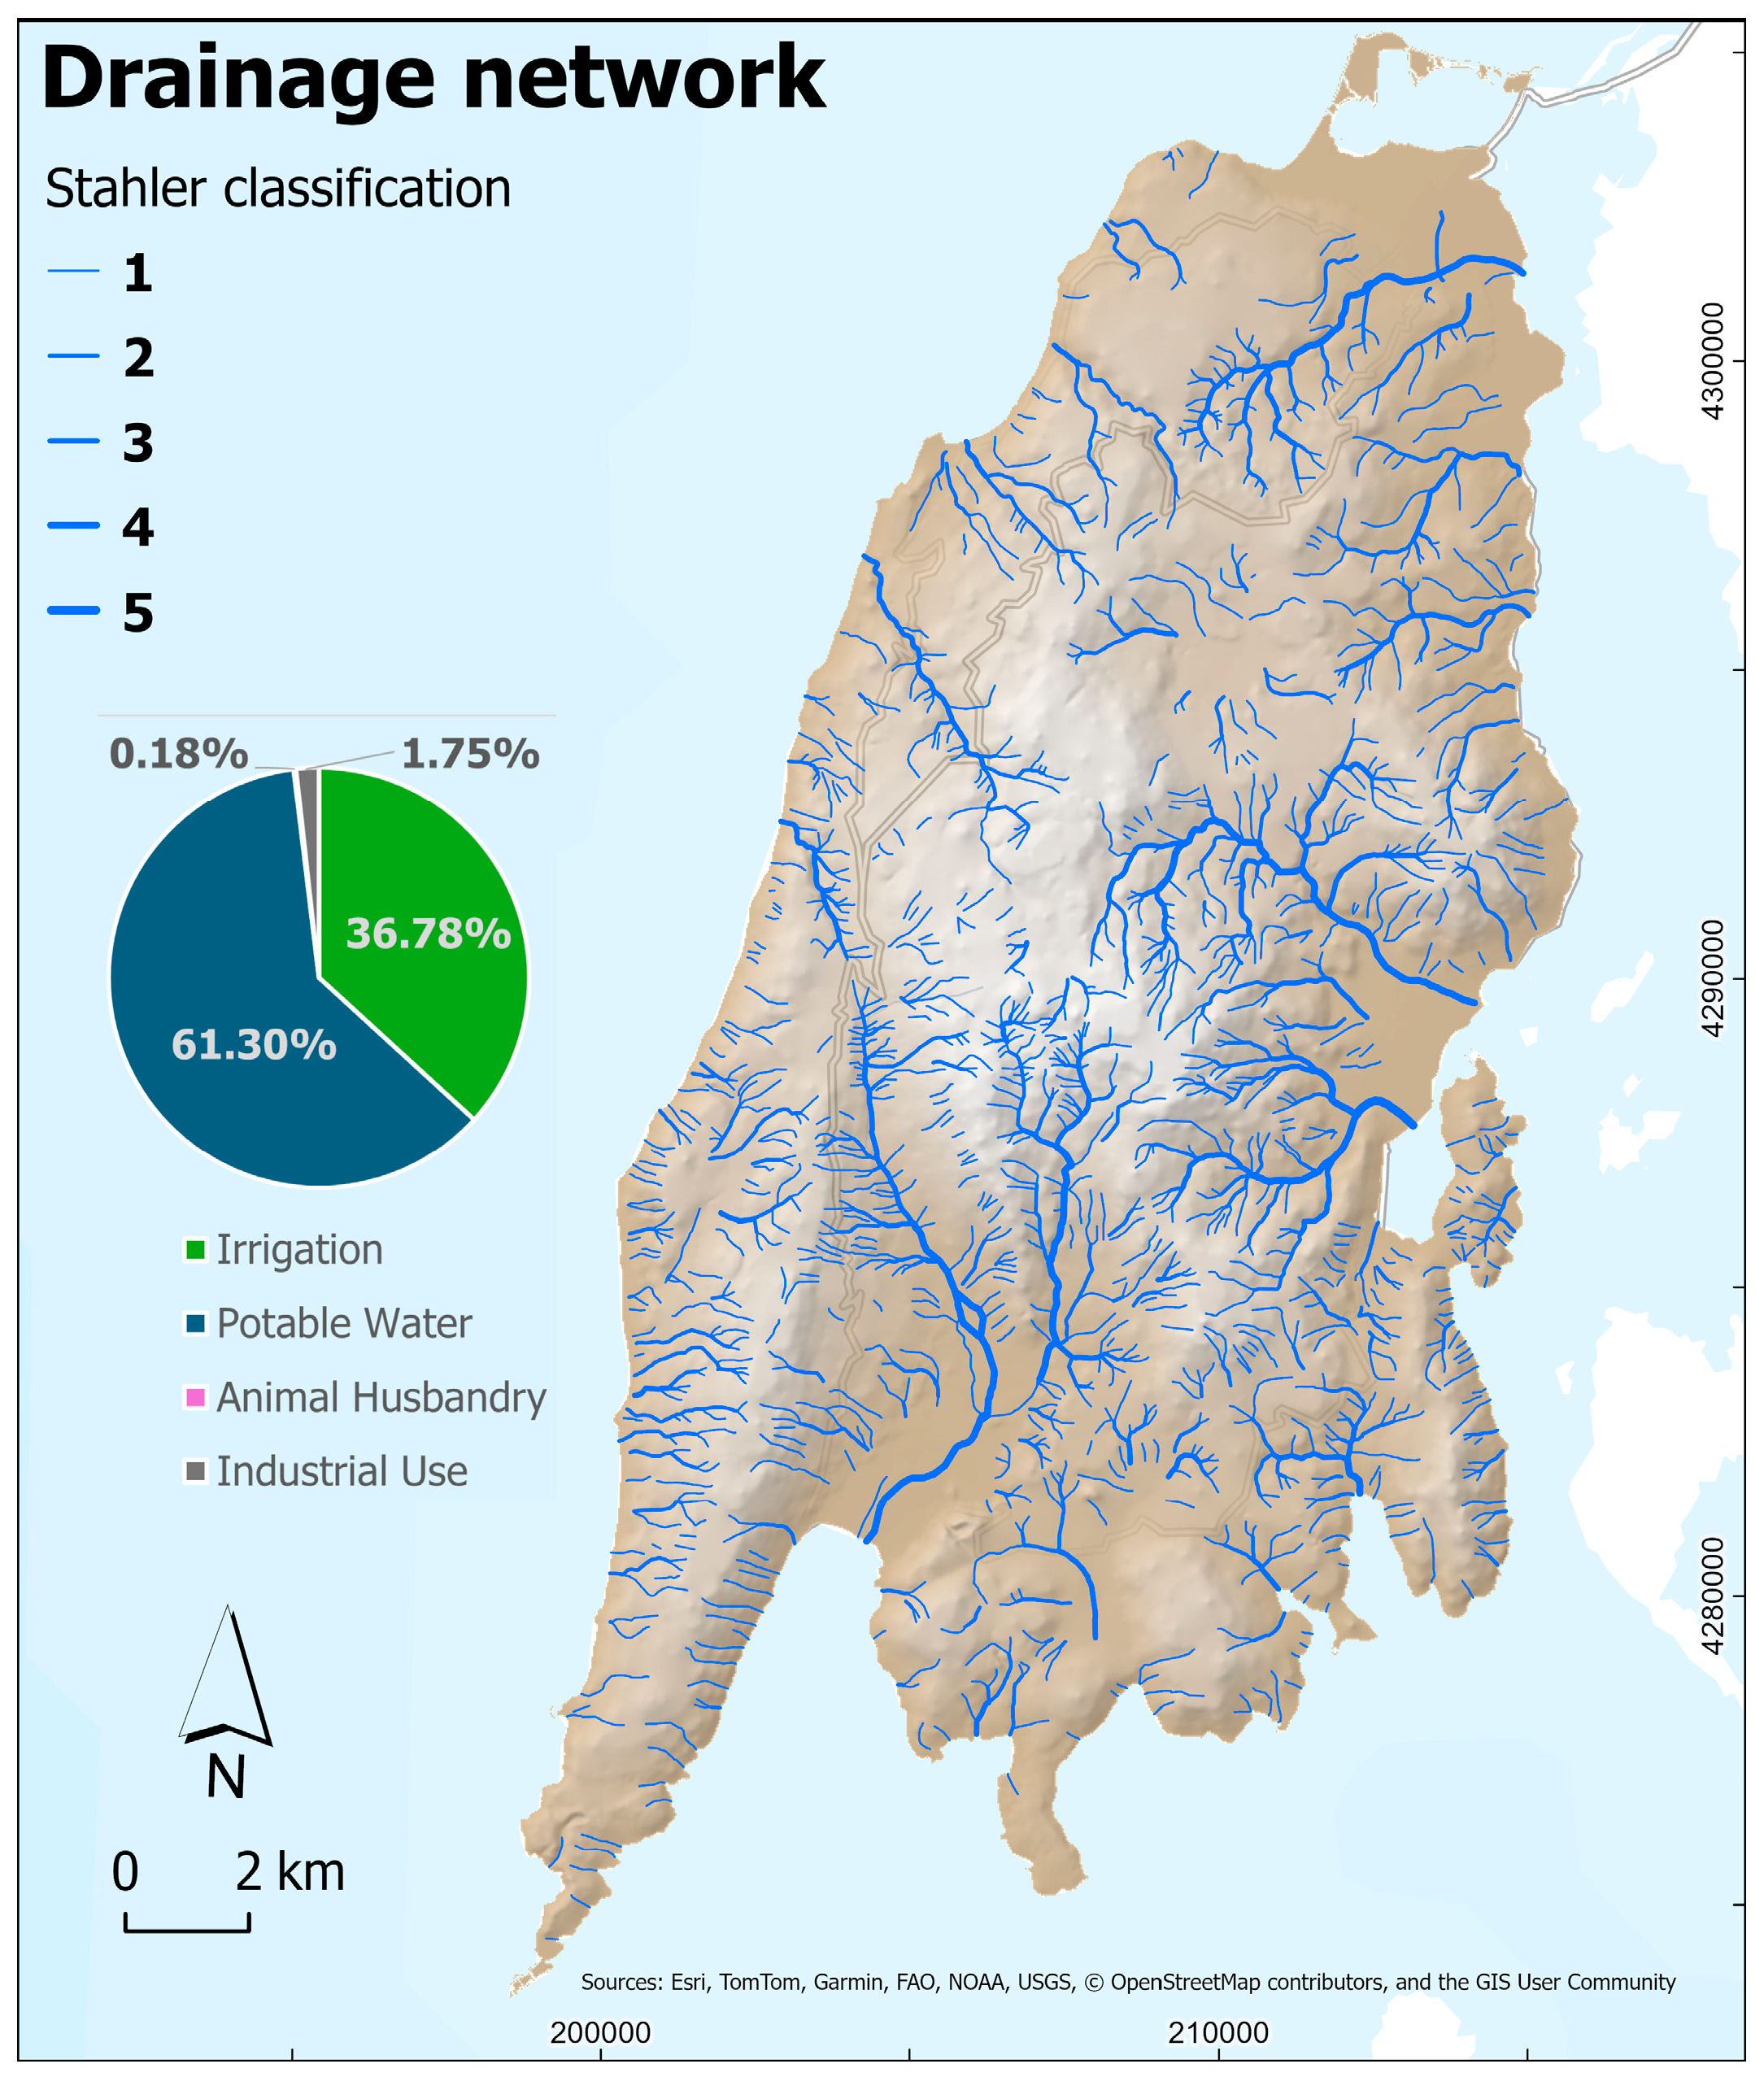
Figure 4.
Drainage network classification map of Lefkas Island according to Strahler. The chart shows the distribution of annual water withdrawals in the LAP Lefkados (EL0444) according to [
15].
Figure 4.
Drainage network classification map of Lefkas Island according to Strahler. The chart shows the distribution of annual water withdrawals in the LAP Lefkados (EL0444) according to [
15].
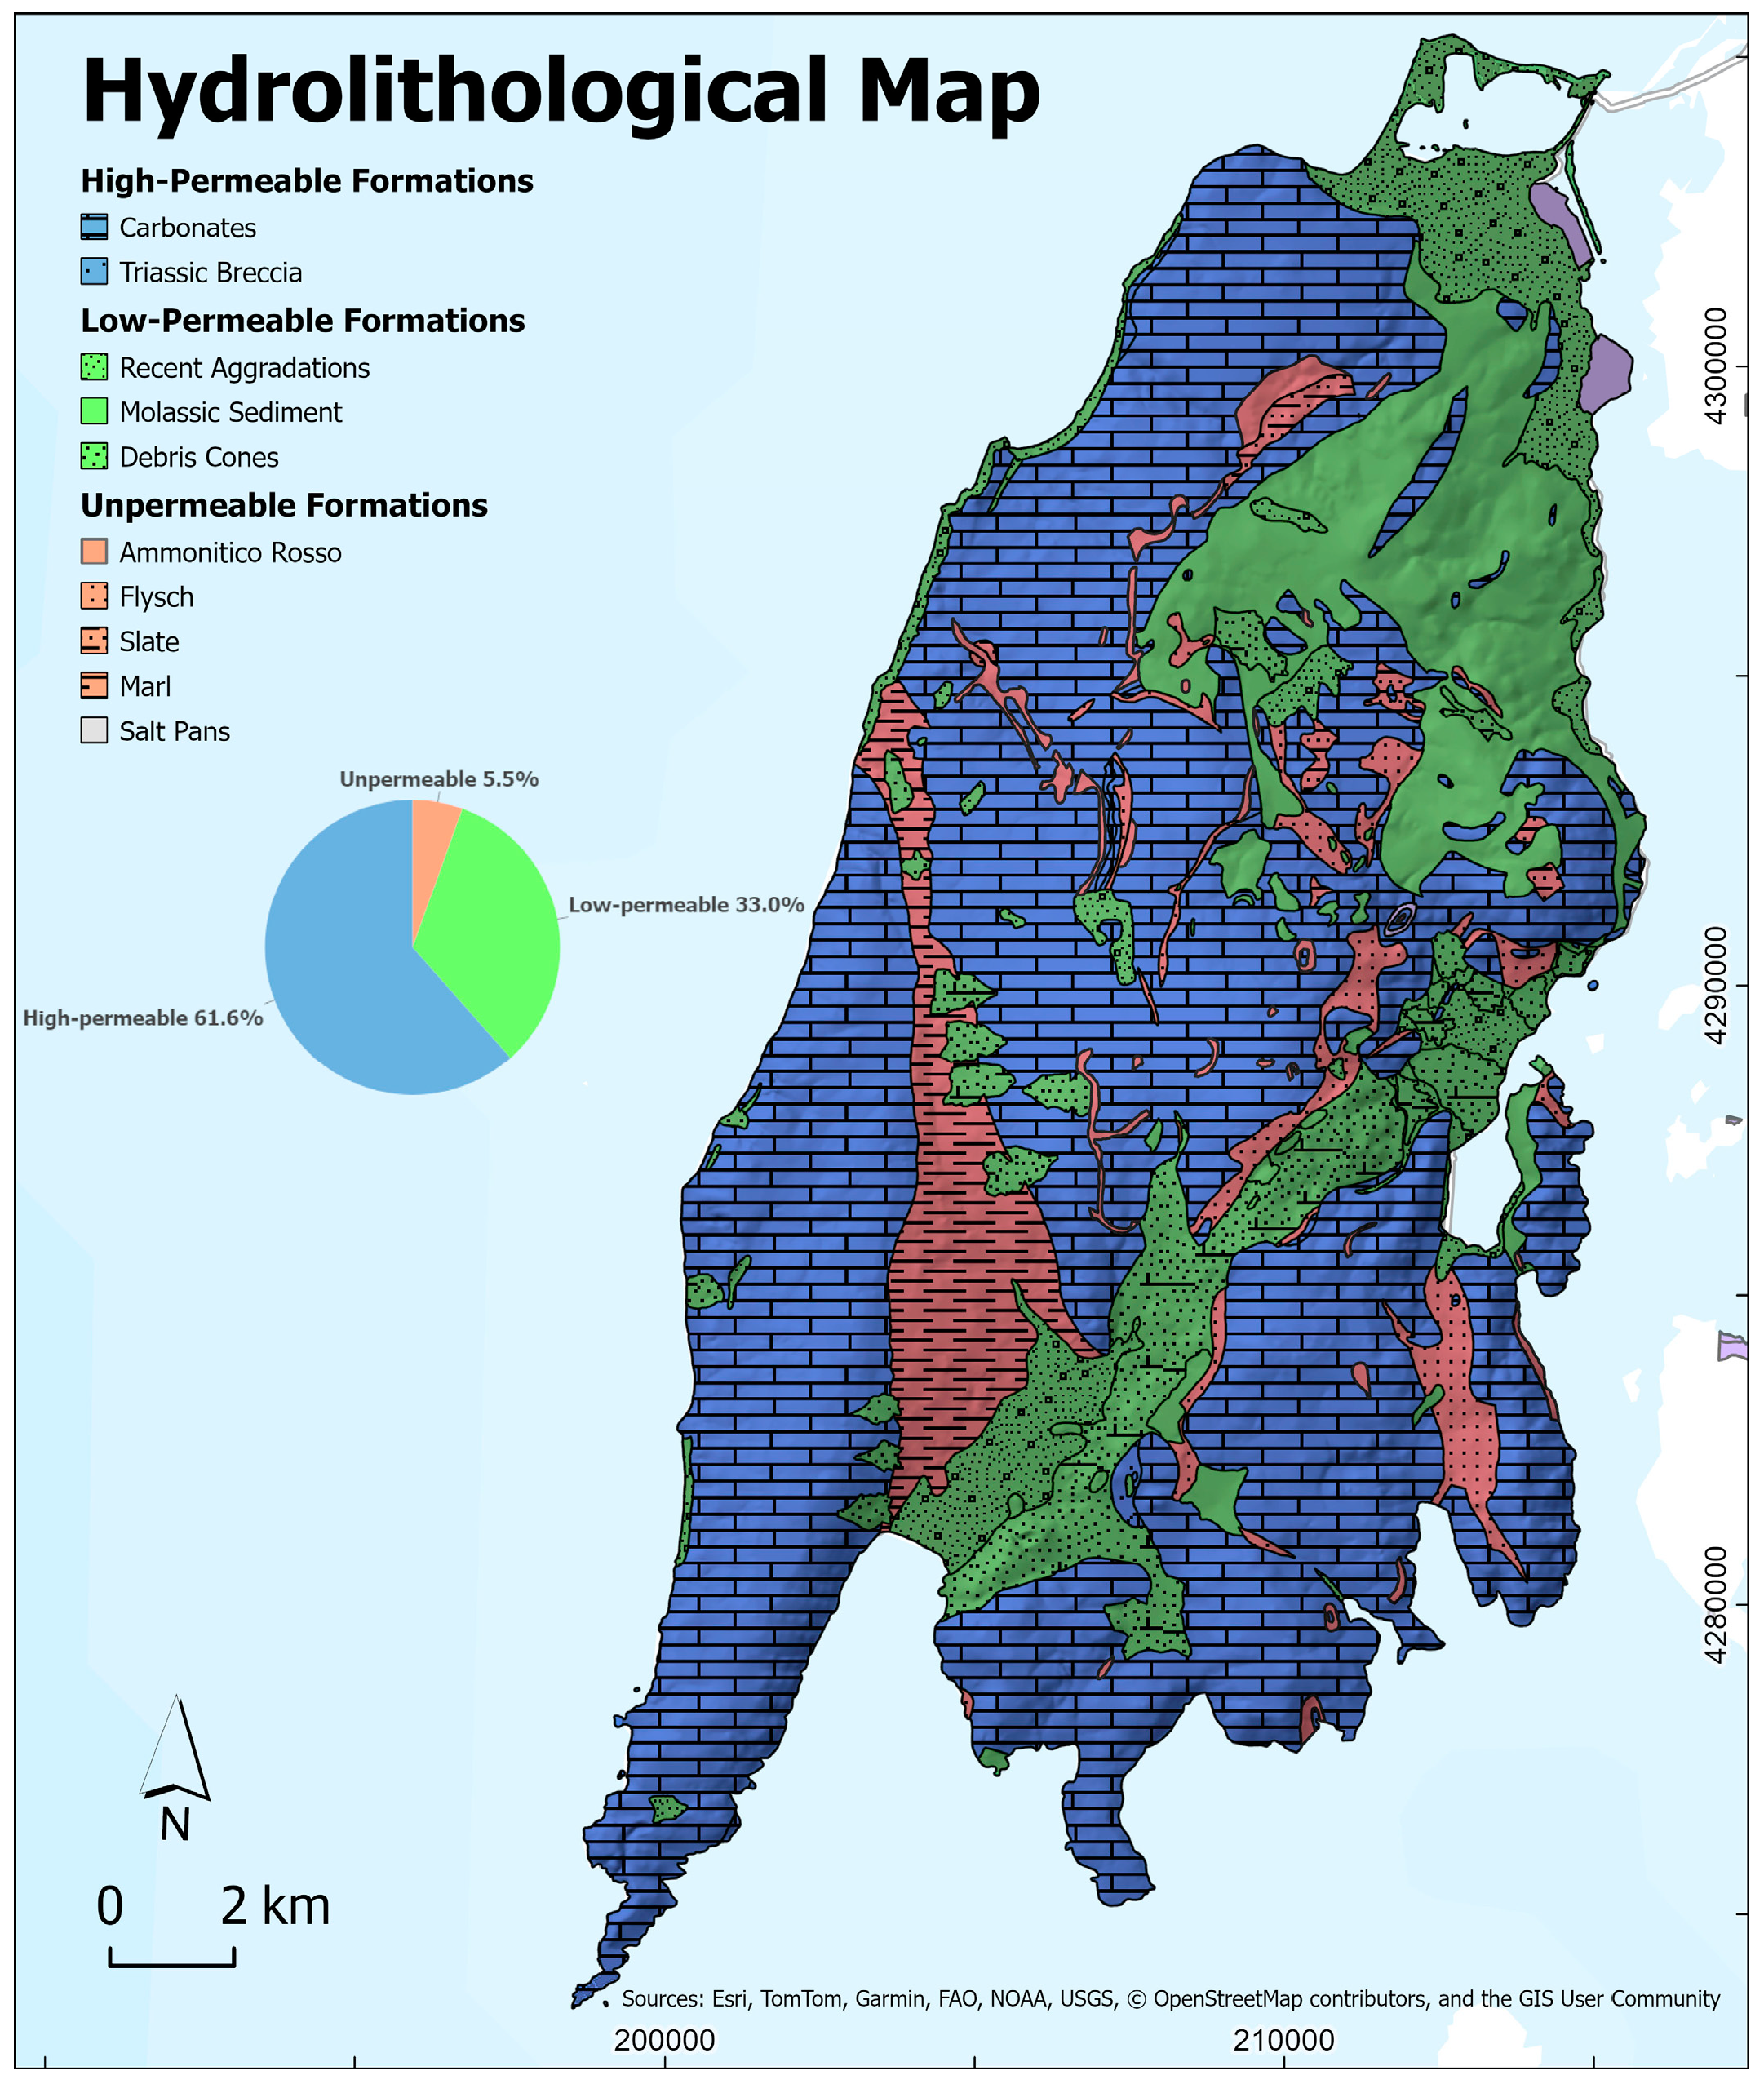
Figure 6.
Hydrolithological Map of Lefkas Island (modified from EAGME [
19]).
Figure 6.
Hydrolithological Map of Lefkas Island (modified from EAGME [
19]).
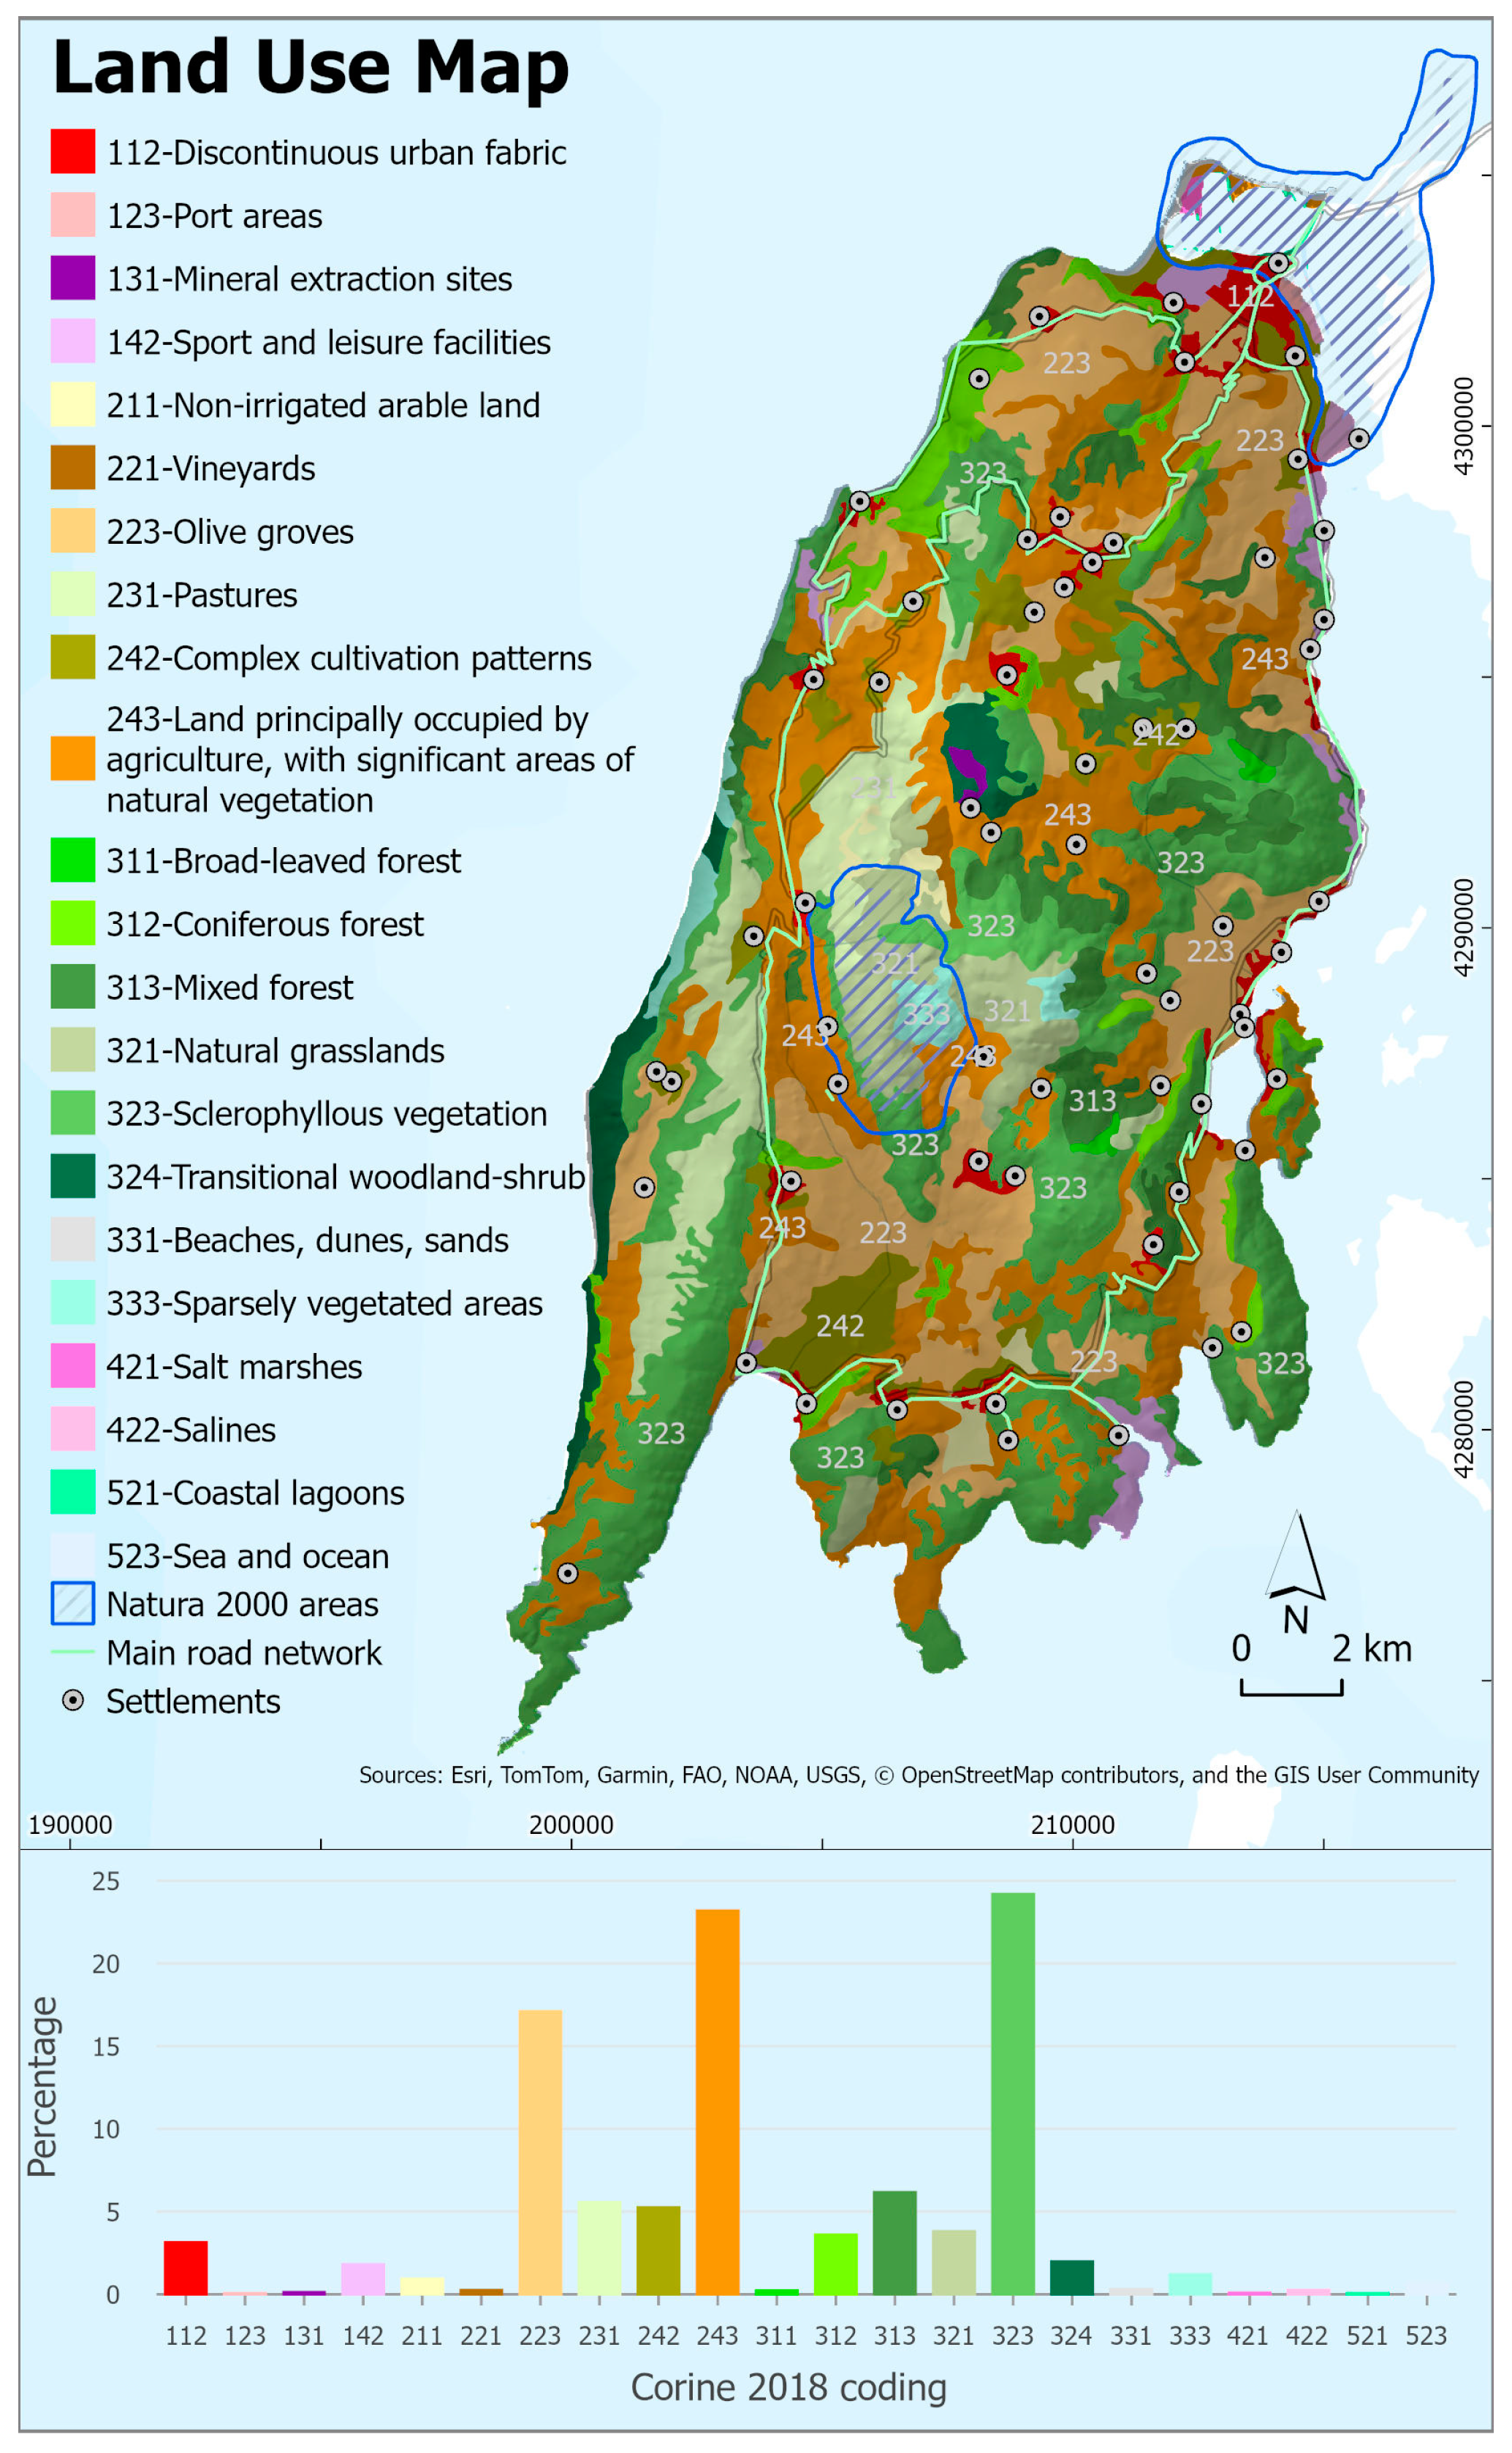
Figure 7.
Land-Use Map of Lefkas Island. Diagram presents the percentage of area occupied by the various Corine 2018 land uses.
Figure 7.
Land-Use Map of Lefkas Island. Diagram presents the percentage of area occupied by the various Corine 2018 land uses.
Figure 8.
Workflow diagram of the research process followed in this study. The analysis begins with data collection and geodatabase creation, followed by GIS-based hazard mapping for floods, landslides, wildfires, and desertification. The resulting maps are then integrated into an interactive web application, leading to the publicly accessible Lefkas Island Hazard Explorer application.
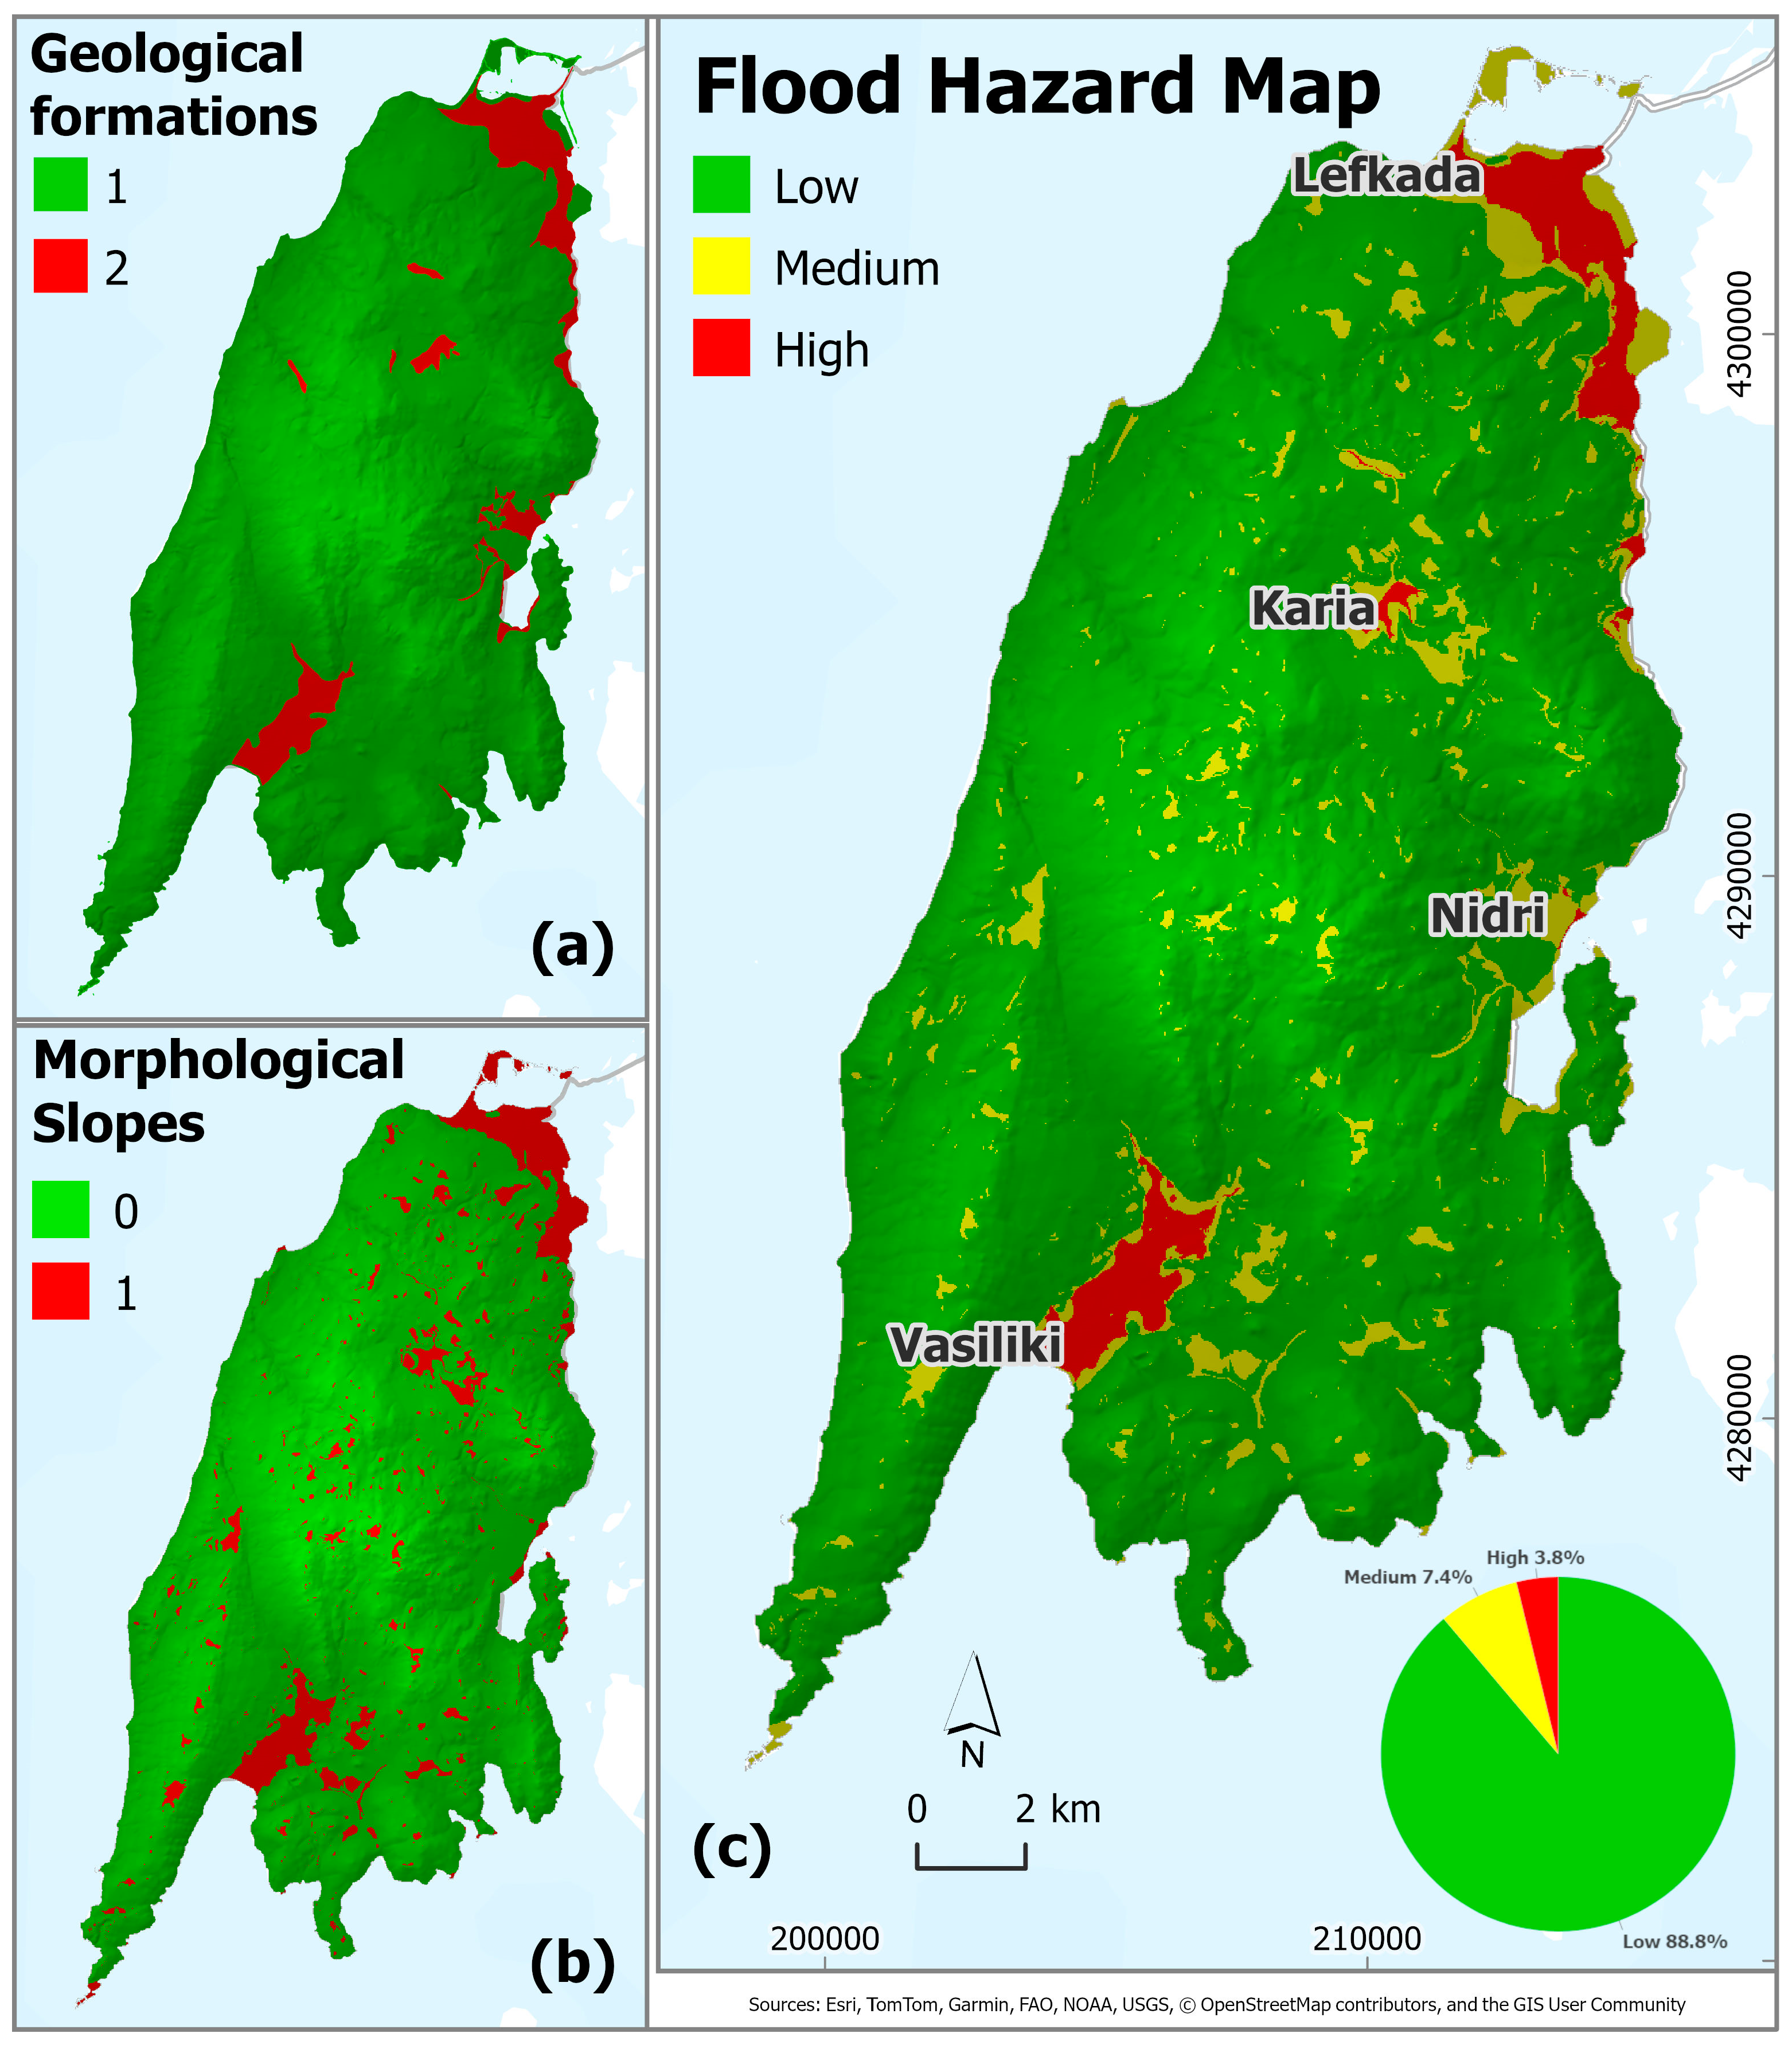
Figure 9.
Spatial distribution of parameters used to obtain Flood Hazard Map: Recent deposits (a) and morphological slopes (b) in 25 m resolution. The Flood Hazard Map of Lefkas Island (c) presents mainly areas with low hazard, where medium- and high-hazard zones cover Lefkada, Vasiliki, Karia, and Nidri areas.
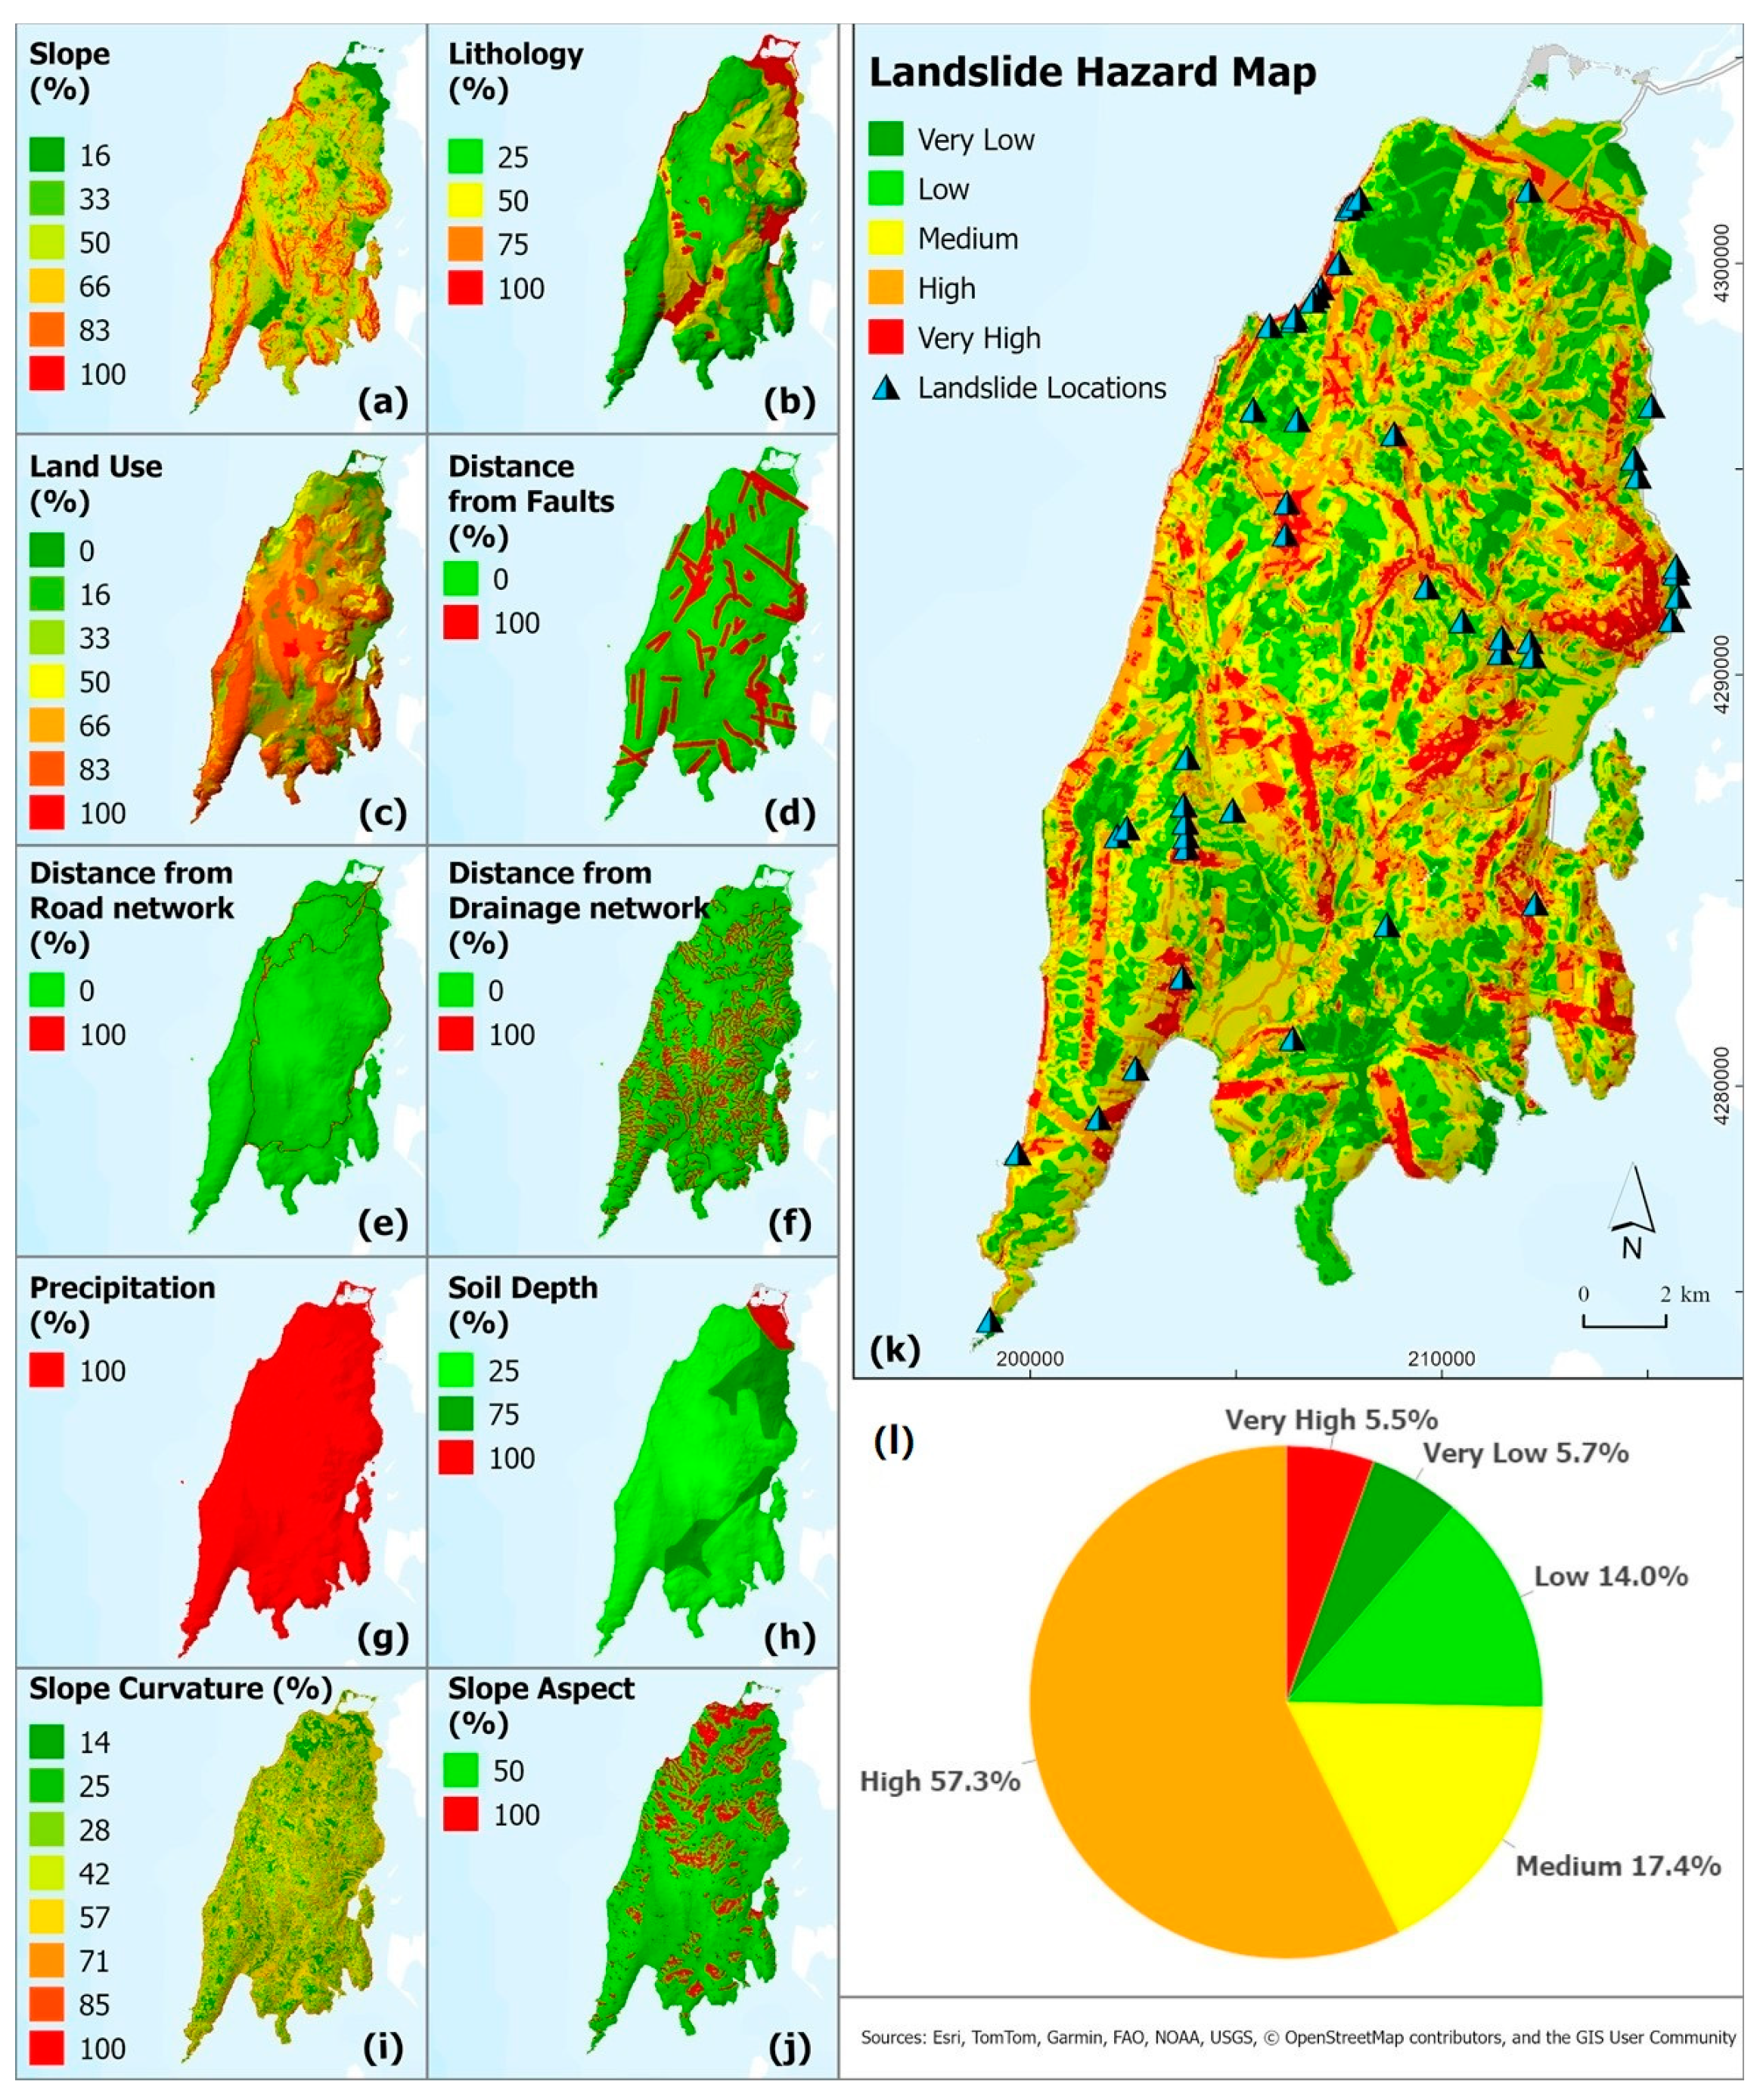
Figure 10.
Spatial distribution of normalized parameters used (a–k). The Landslide Hazard Map of Lefkas Island (l) indicates that the island falls under medium- to high-hazard categories. The map also marks the locations of past landslide events.
Figure 10.
Spatial distribution of normalized parameters used (a–k). The Landslide Hazard Map of Lefkas Island (l) indicates that the island falls under medium- to high-hazard categories. The map also marks the locations of past landslide events.
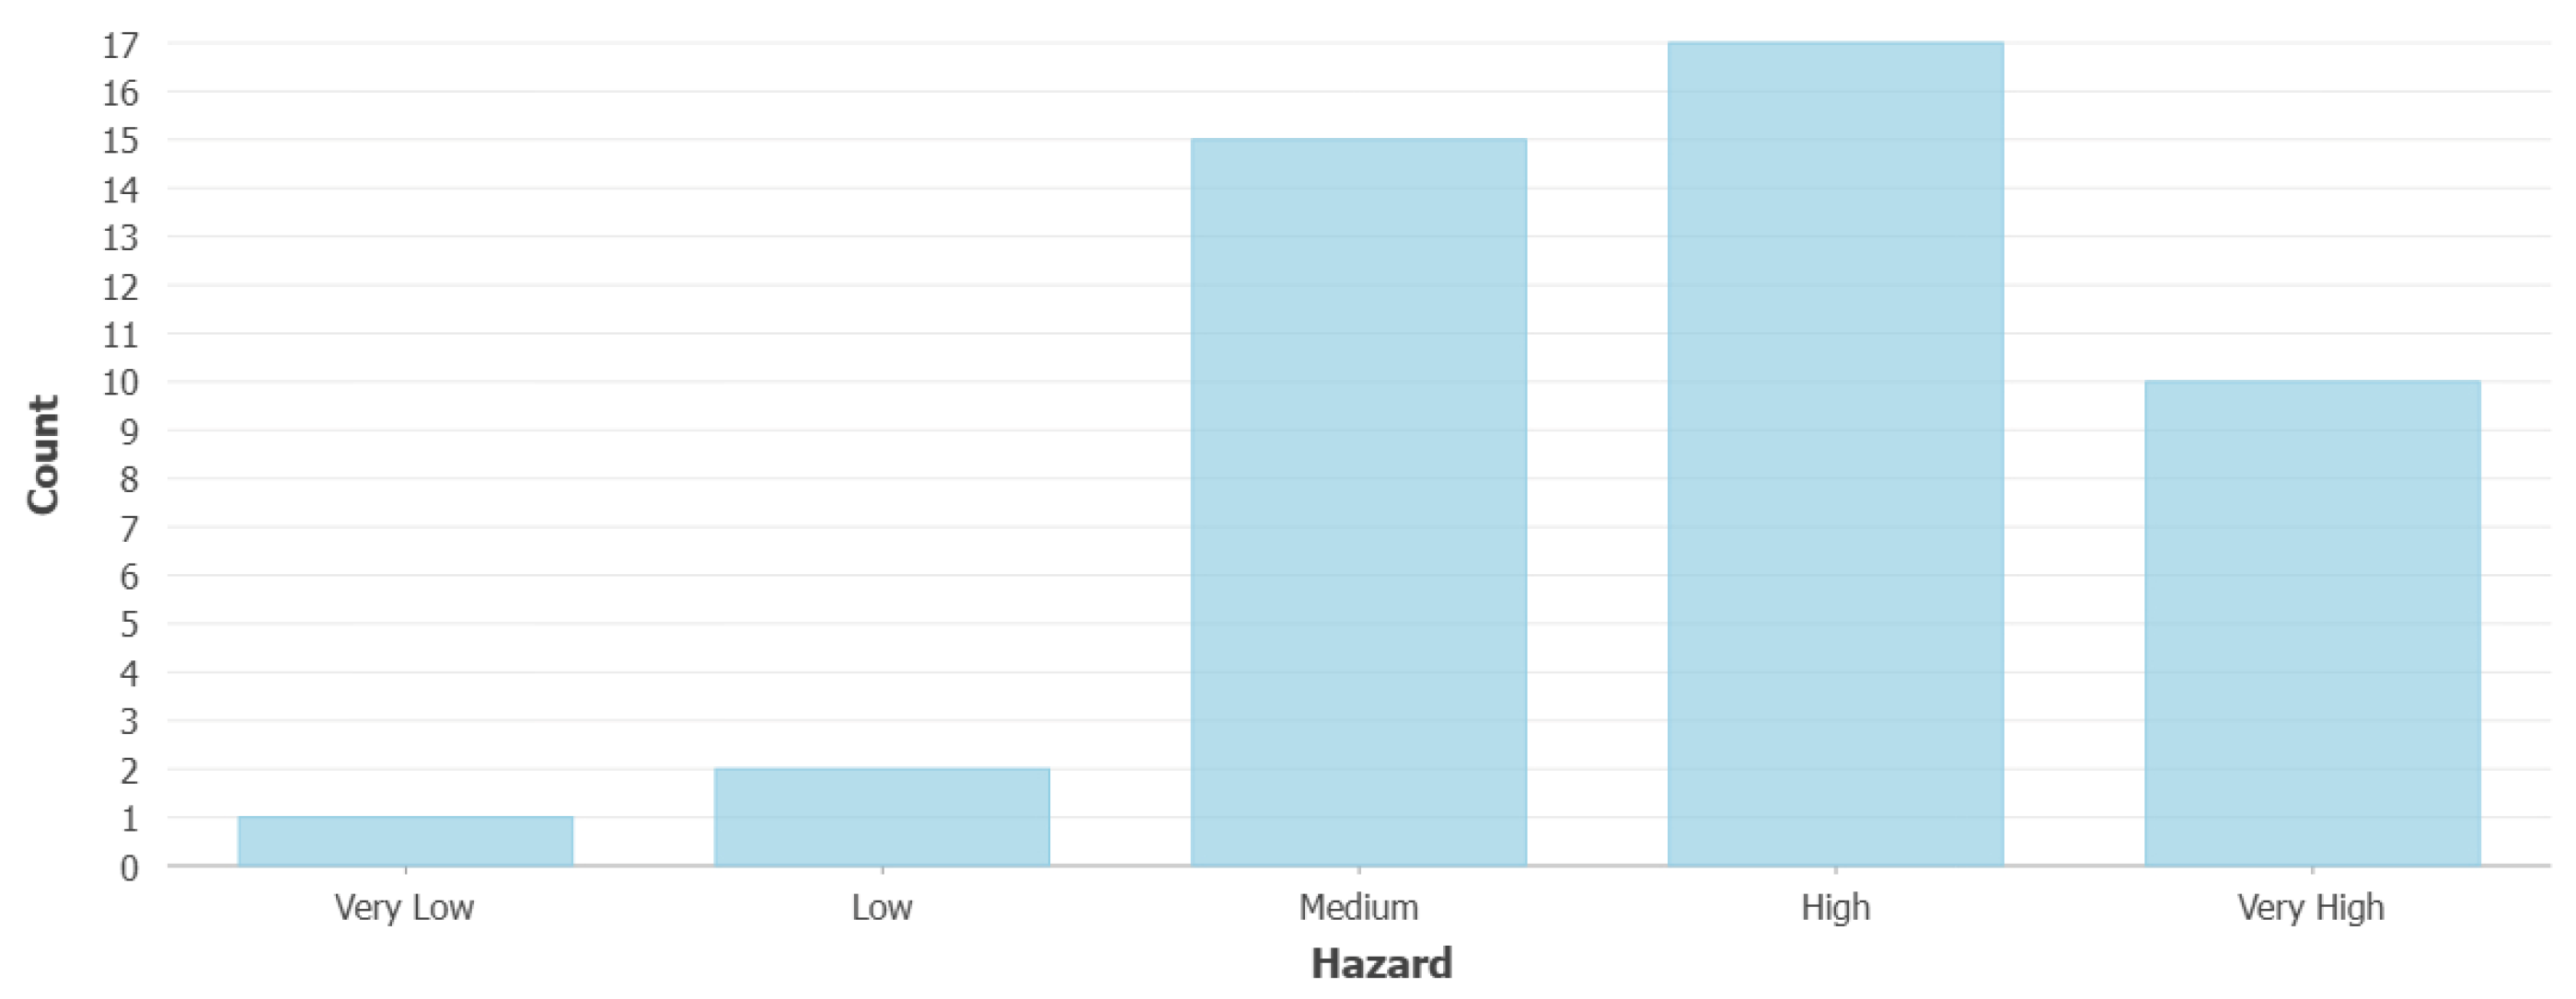
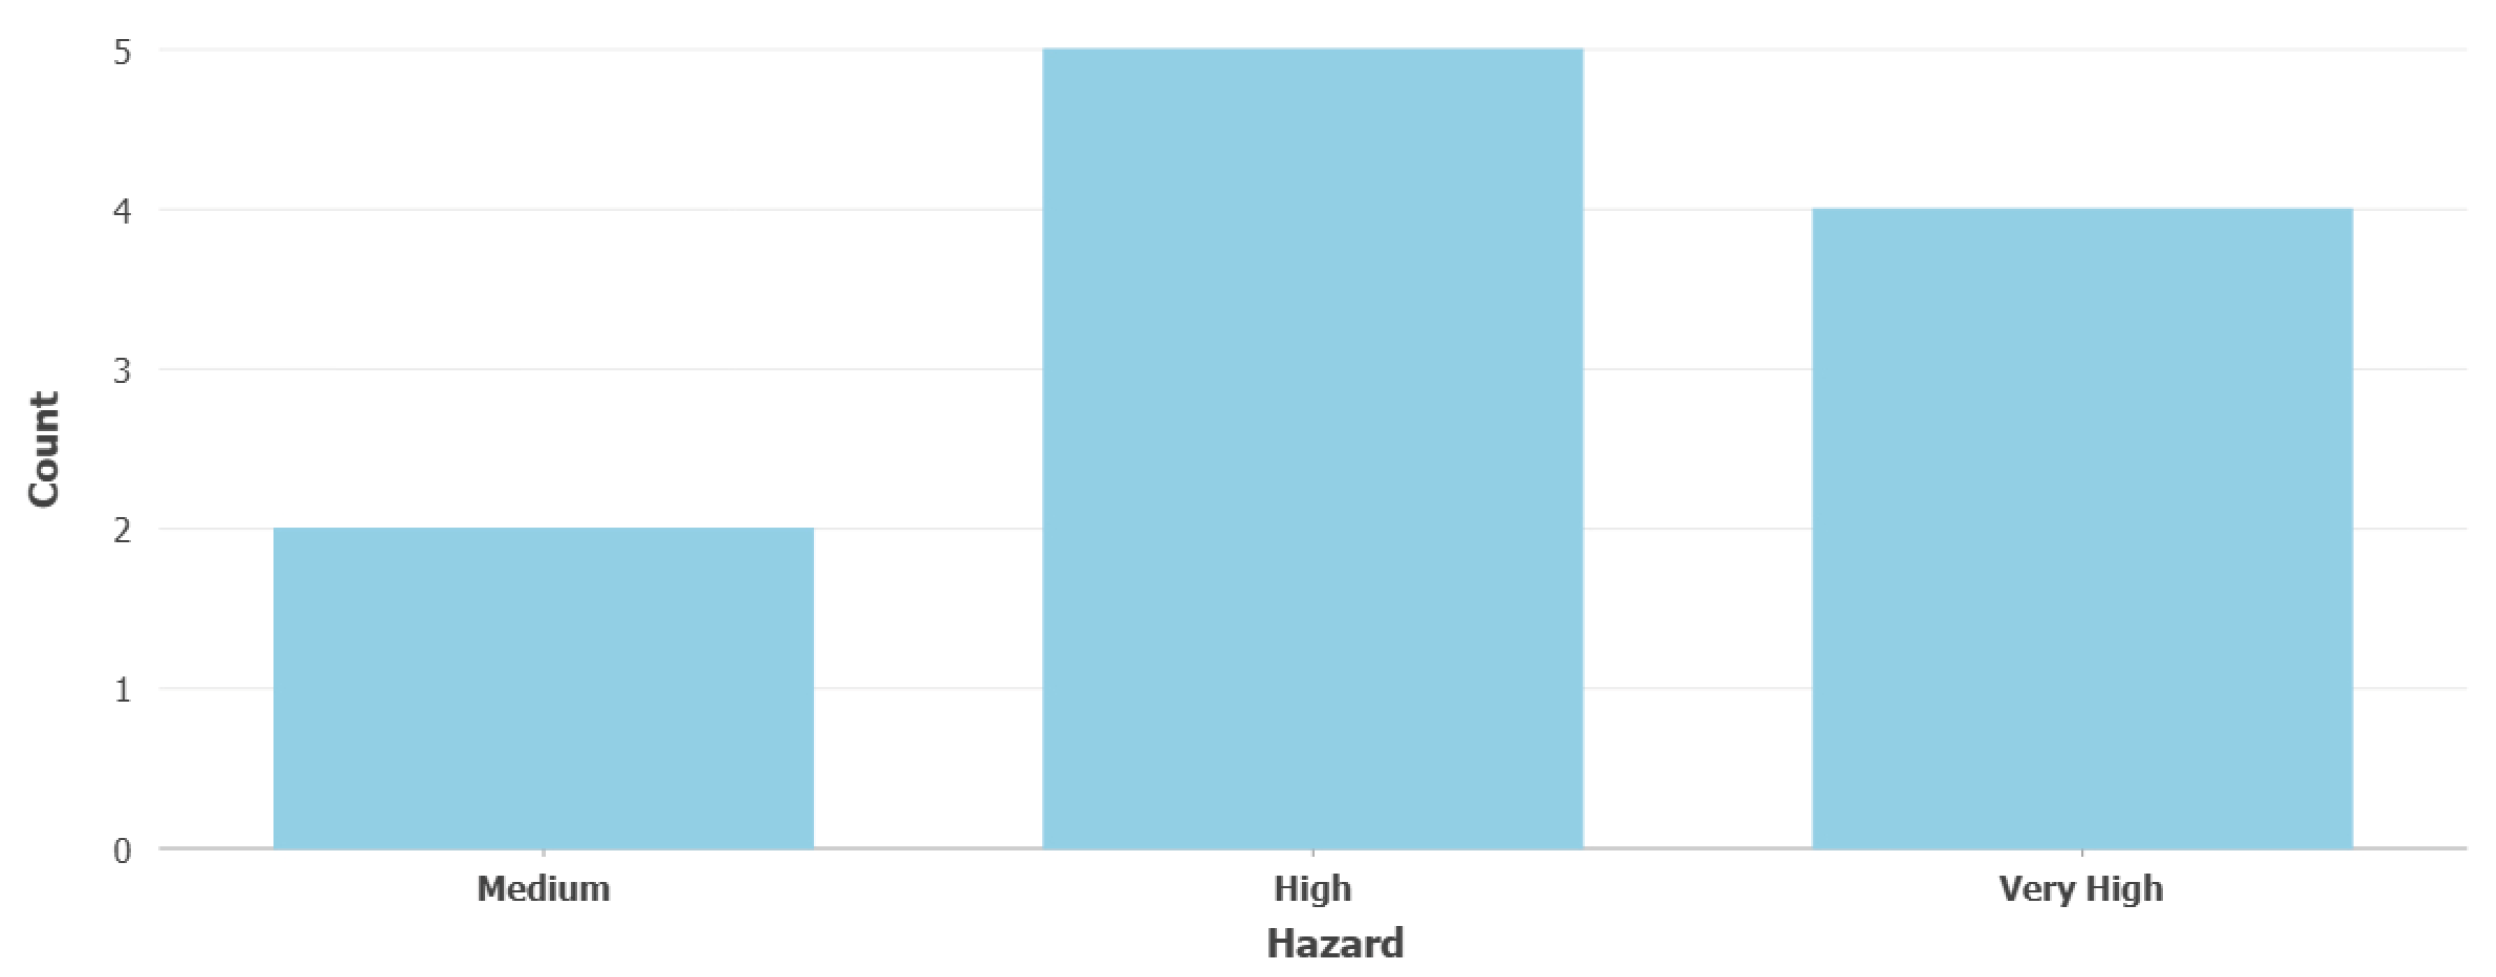
Figure 11.
Distribution of historical landslide events across hazard categories according to the Landslide Hazard Map. Most events fall within the medium- to very-high-hazard hazard zones, supporting the spatial reliability of the susceptibility model.
Figure 11.
Distribution of historical landslide events across hazard categories according to the Landslide Hazard Map. Most events fall within the medium- to very-high-hazard hazard zones, supporting the spatial reliability of the susceptibility model.
Figure 12.
Spatial distribution of the normalized parameters used (a–f). The Wildfire Hazard Map of Lefkas Island (g) shows that most areas on the island have high- to very-high-hazard levels. The map also marks the locations of past fire events.
Figure 12.
Spatial distribution of the normalized parameters used (a–f). The Wildfire Hazard Map of Lefkas Island (g) shows that most areas on the island have high- to very-high-hazard levels. The map also marks the locations of past fire events.
Figure 13.
Distribution of historical wildfire events across hazard categories according to the Wildfire Hazard Map. Most events fall within the high- to very-high-hazard zones, supporting the spatial reliability of the susceptibility model.
Figure 13.
Distribution of historical wildfire events across hazard categories according to the Wildfire Hazard Map. Most events fall within the high- to very-high-hazard zones, supporting the spatial reliability of the susceptibility model.
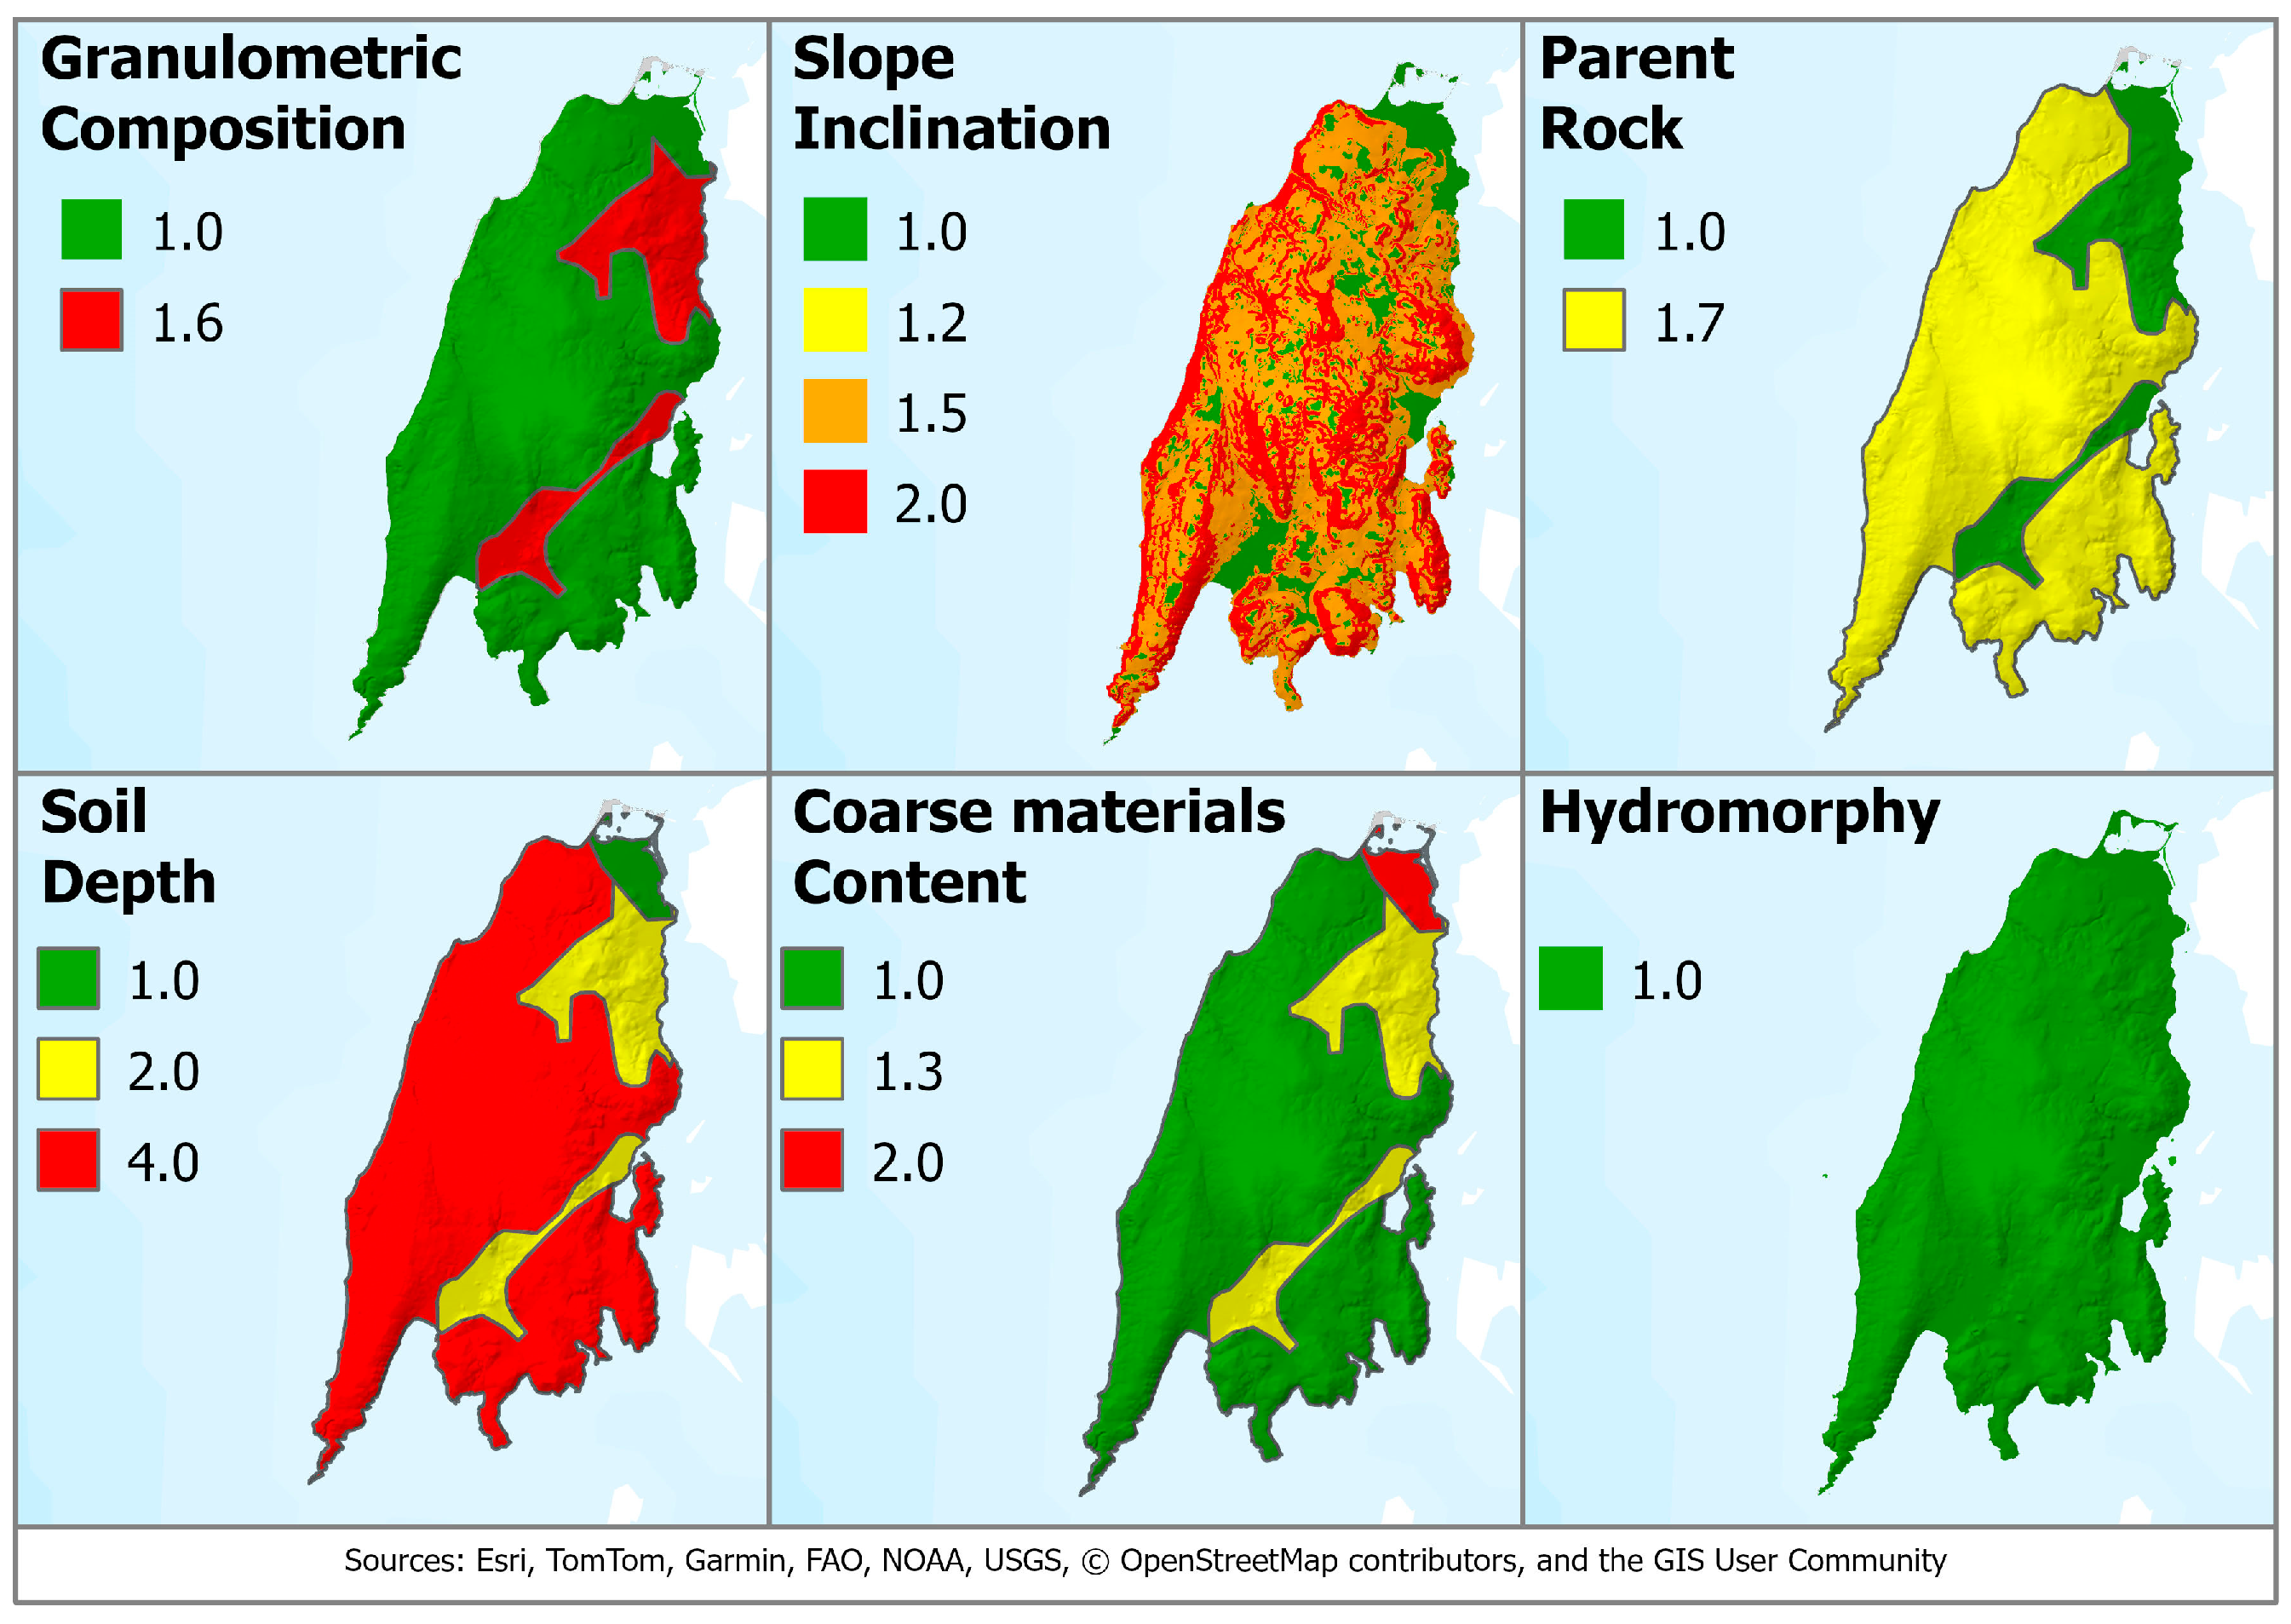
Figure 14.
Spatial distribution of factors used to evaluate the Soil Quality Index (SQI).
Figure 14.
Spatial distribution of factors used to evaluate the Soil Quality Index (SQI).
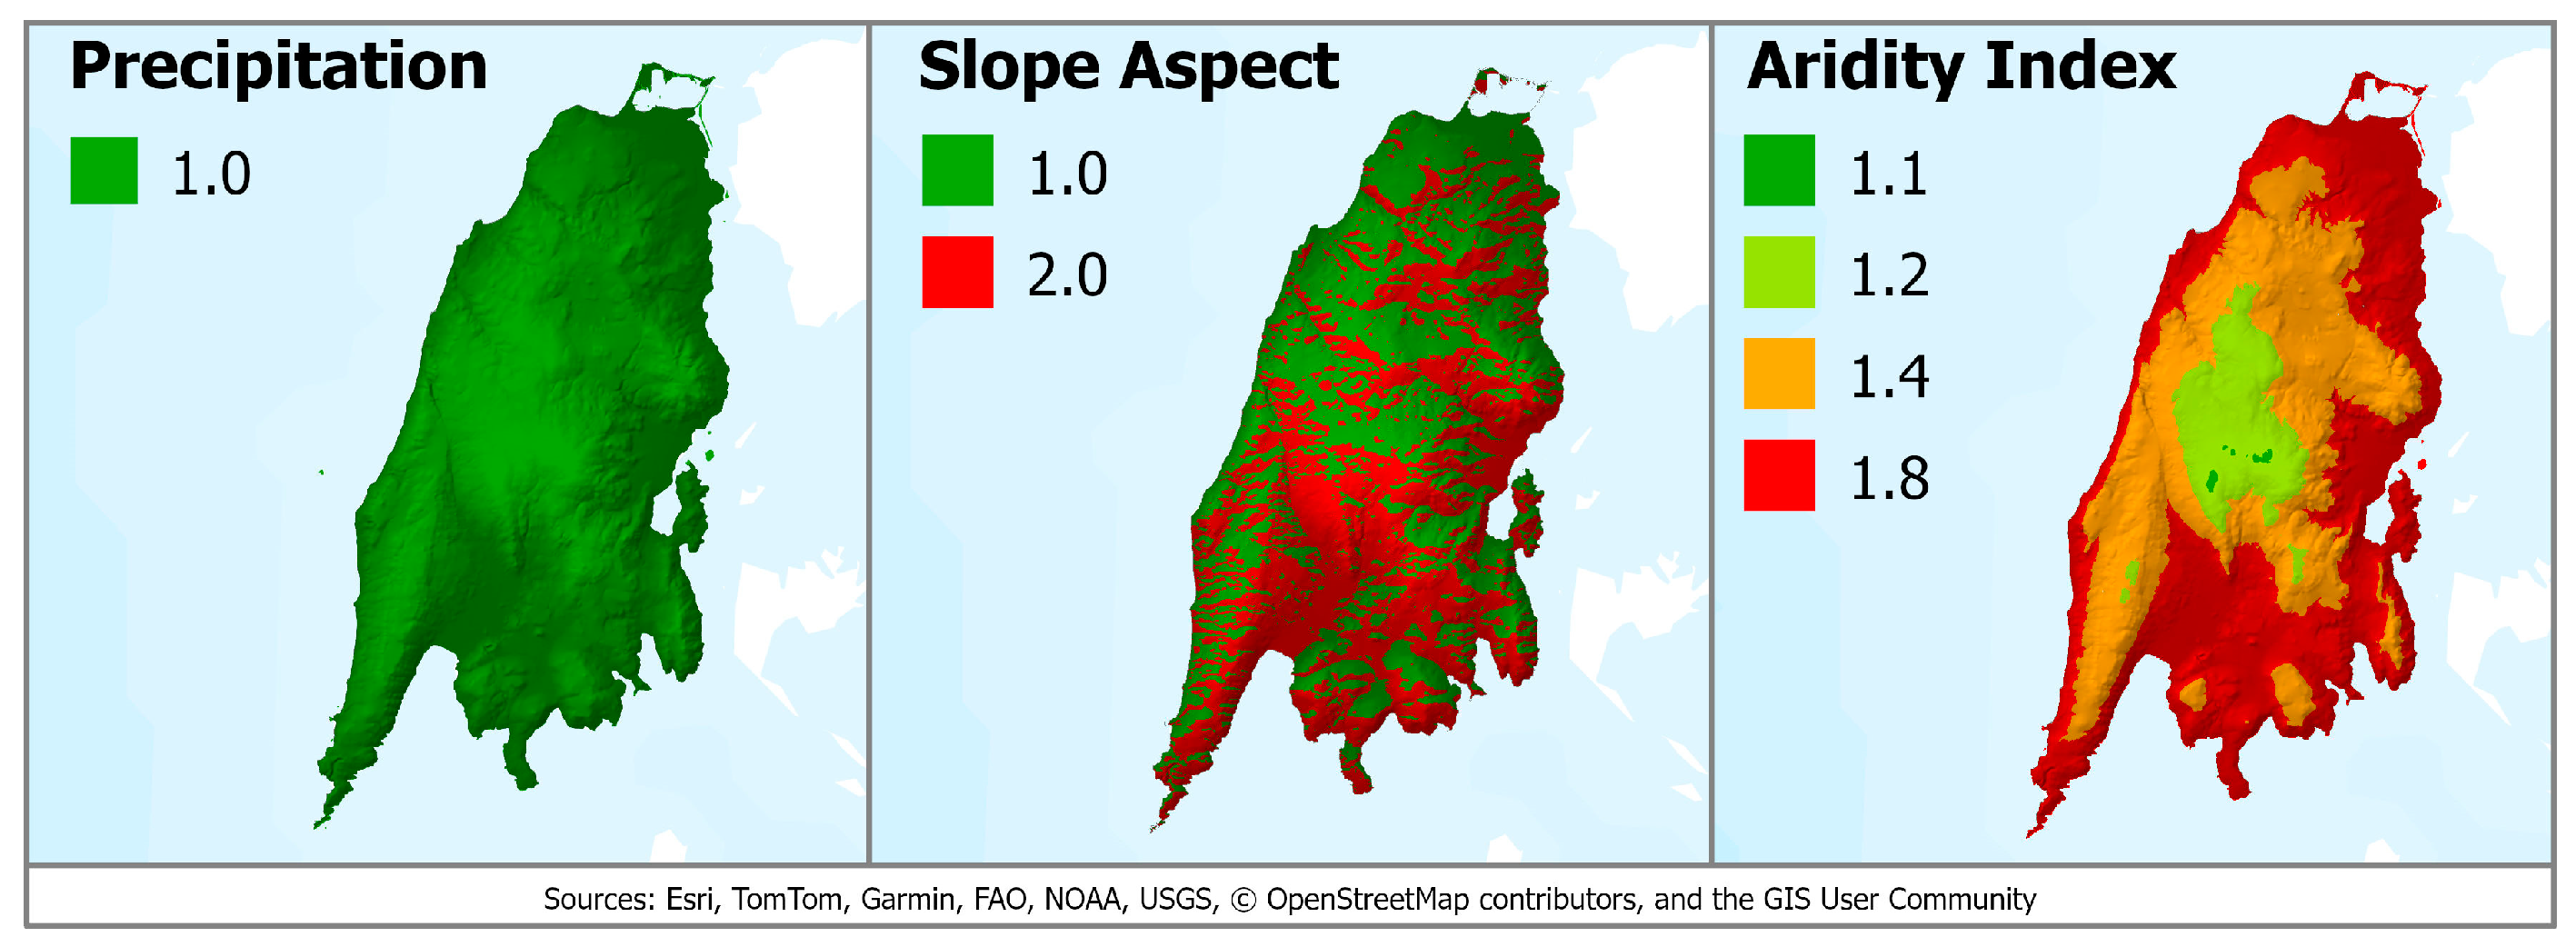
Figure 15.
Spatial distribution of factors used to evaluate the Climate Quality Index (CQI).
Figure 15.
Spatial distribution of factors used to evaluate the Climate Quality Index (CQI).
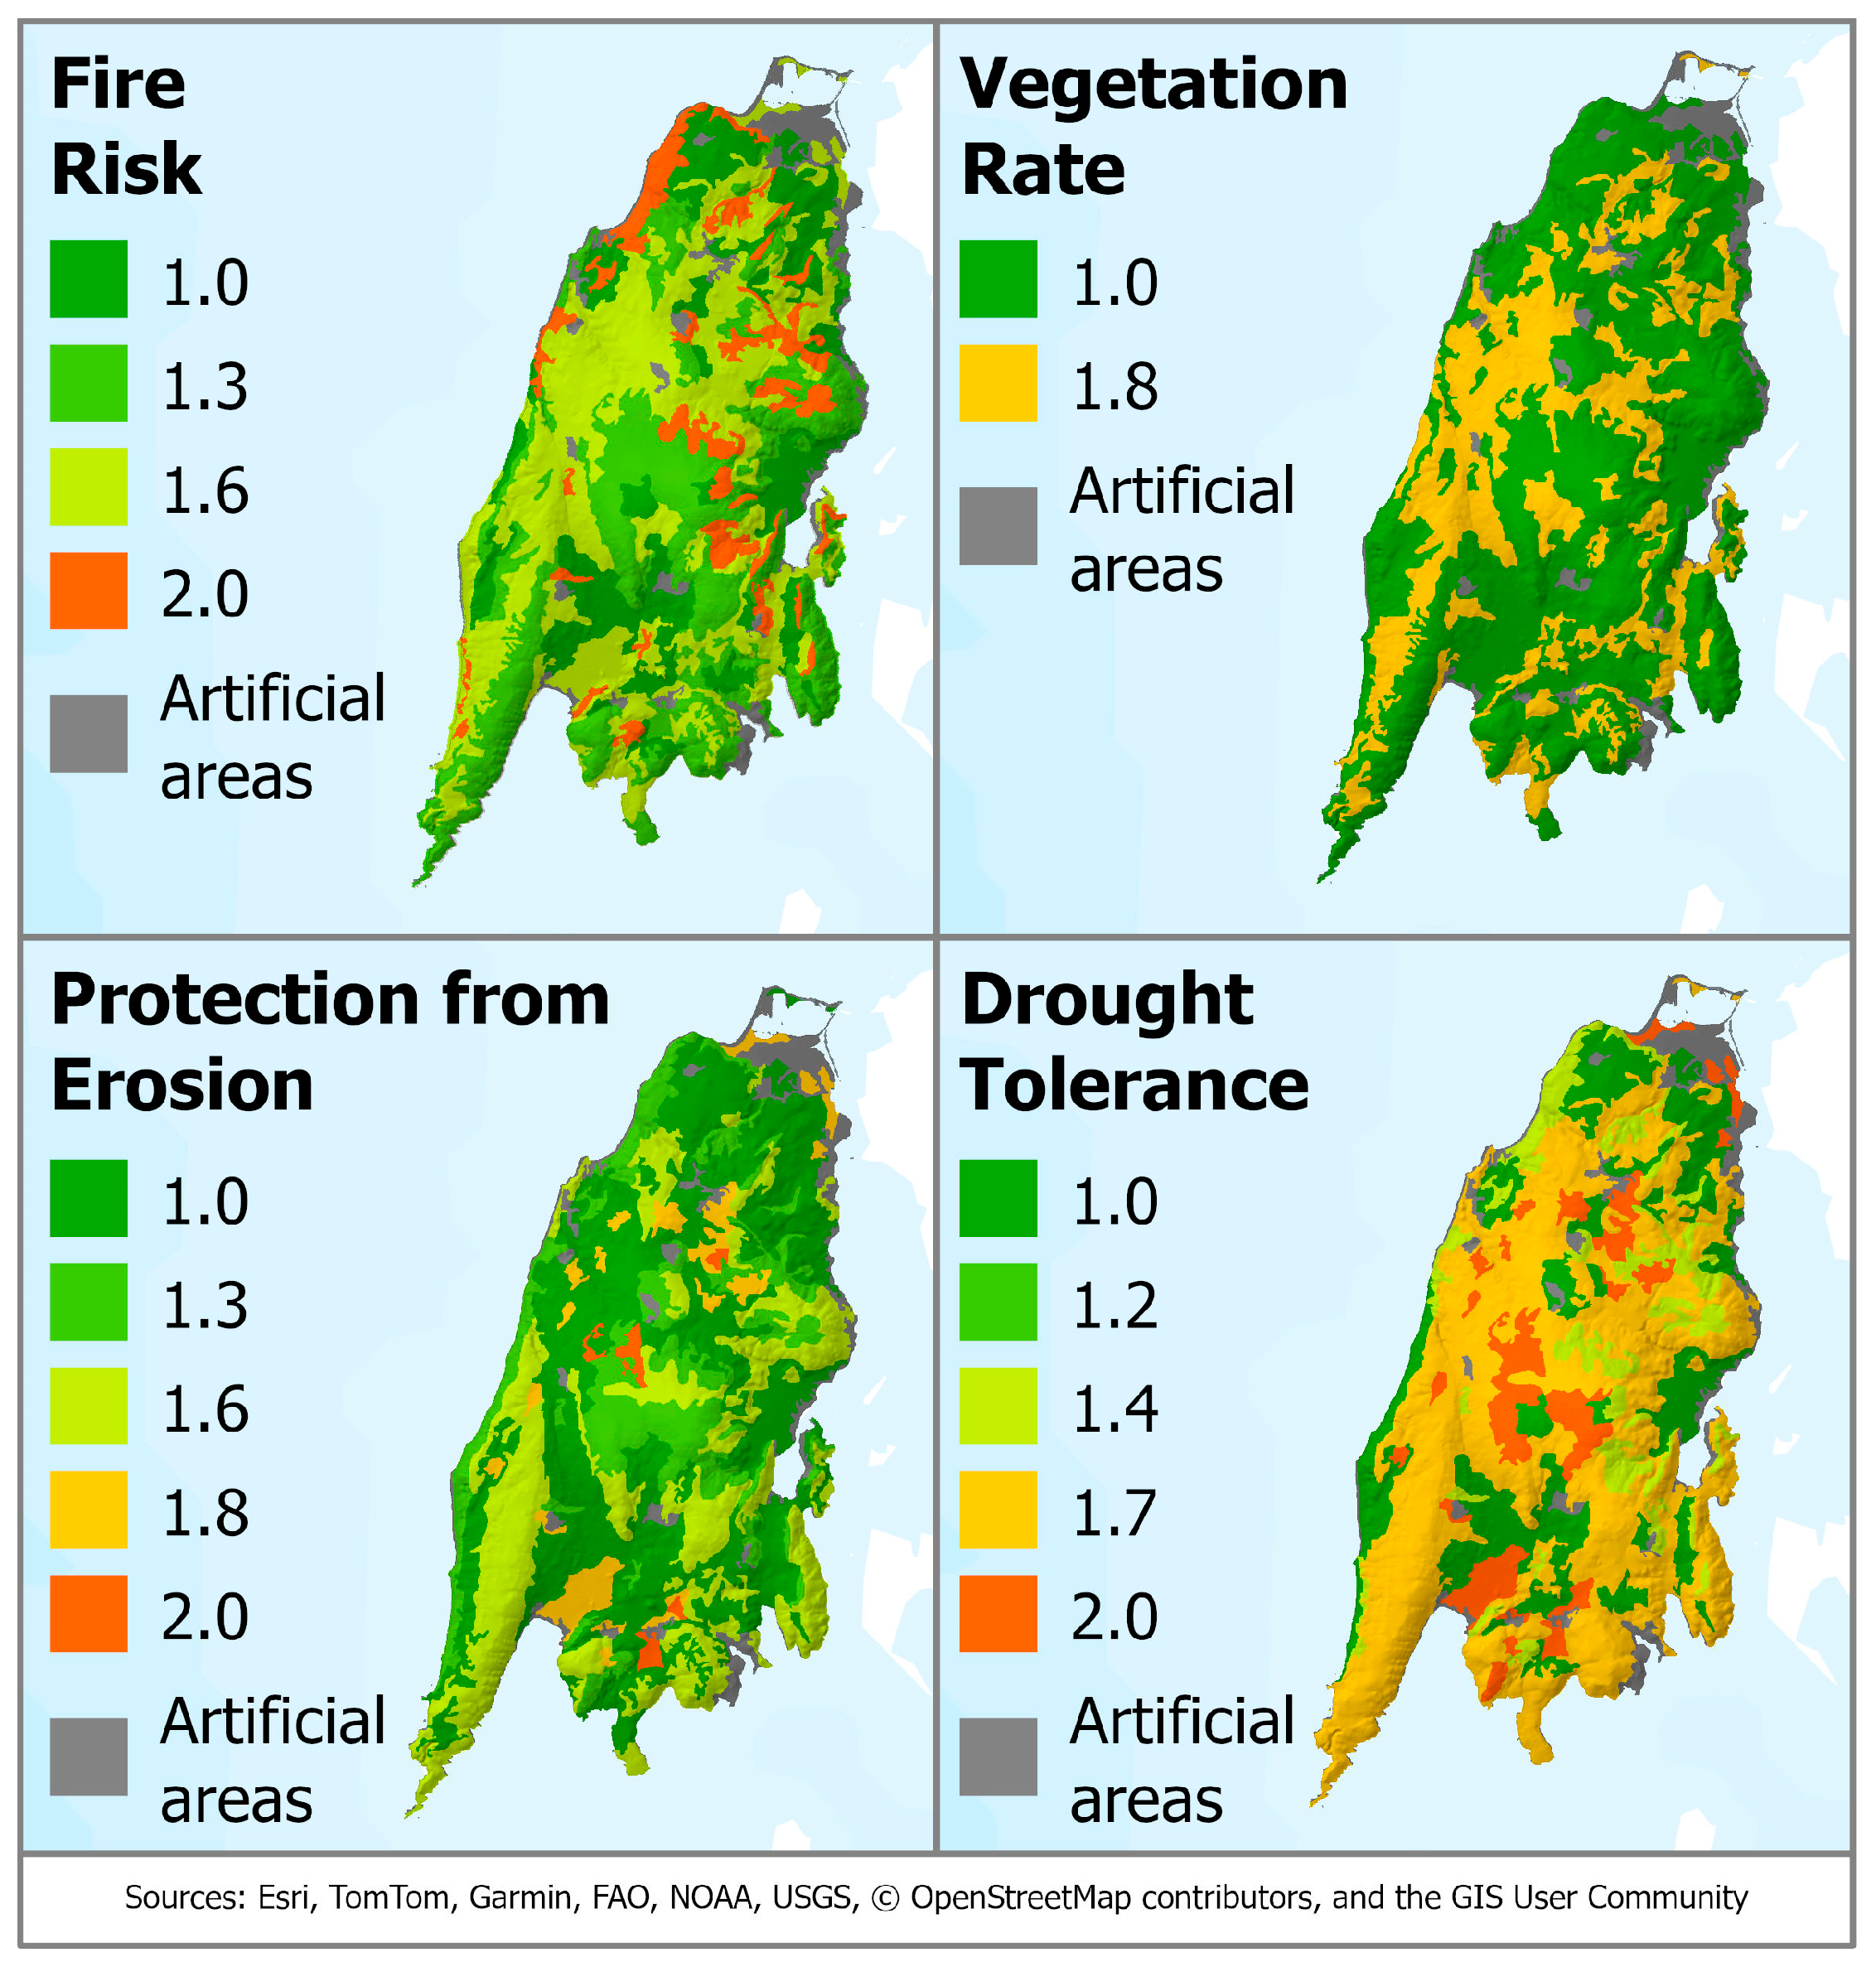
Figure 16.
Spatial distribution of factors used to evaluate the Vegetation Quality Index (VQI).
Figure 16.
Spatial distribution of factors used to evaluate the Vegetation Quality Index (VQI).
Figure 17.
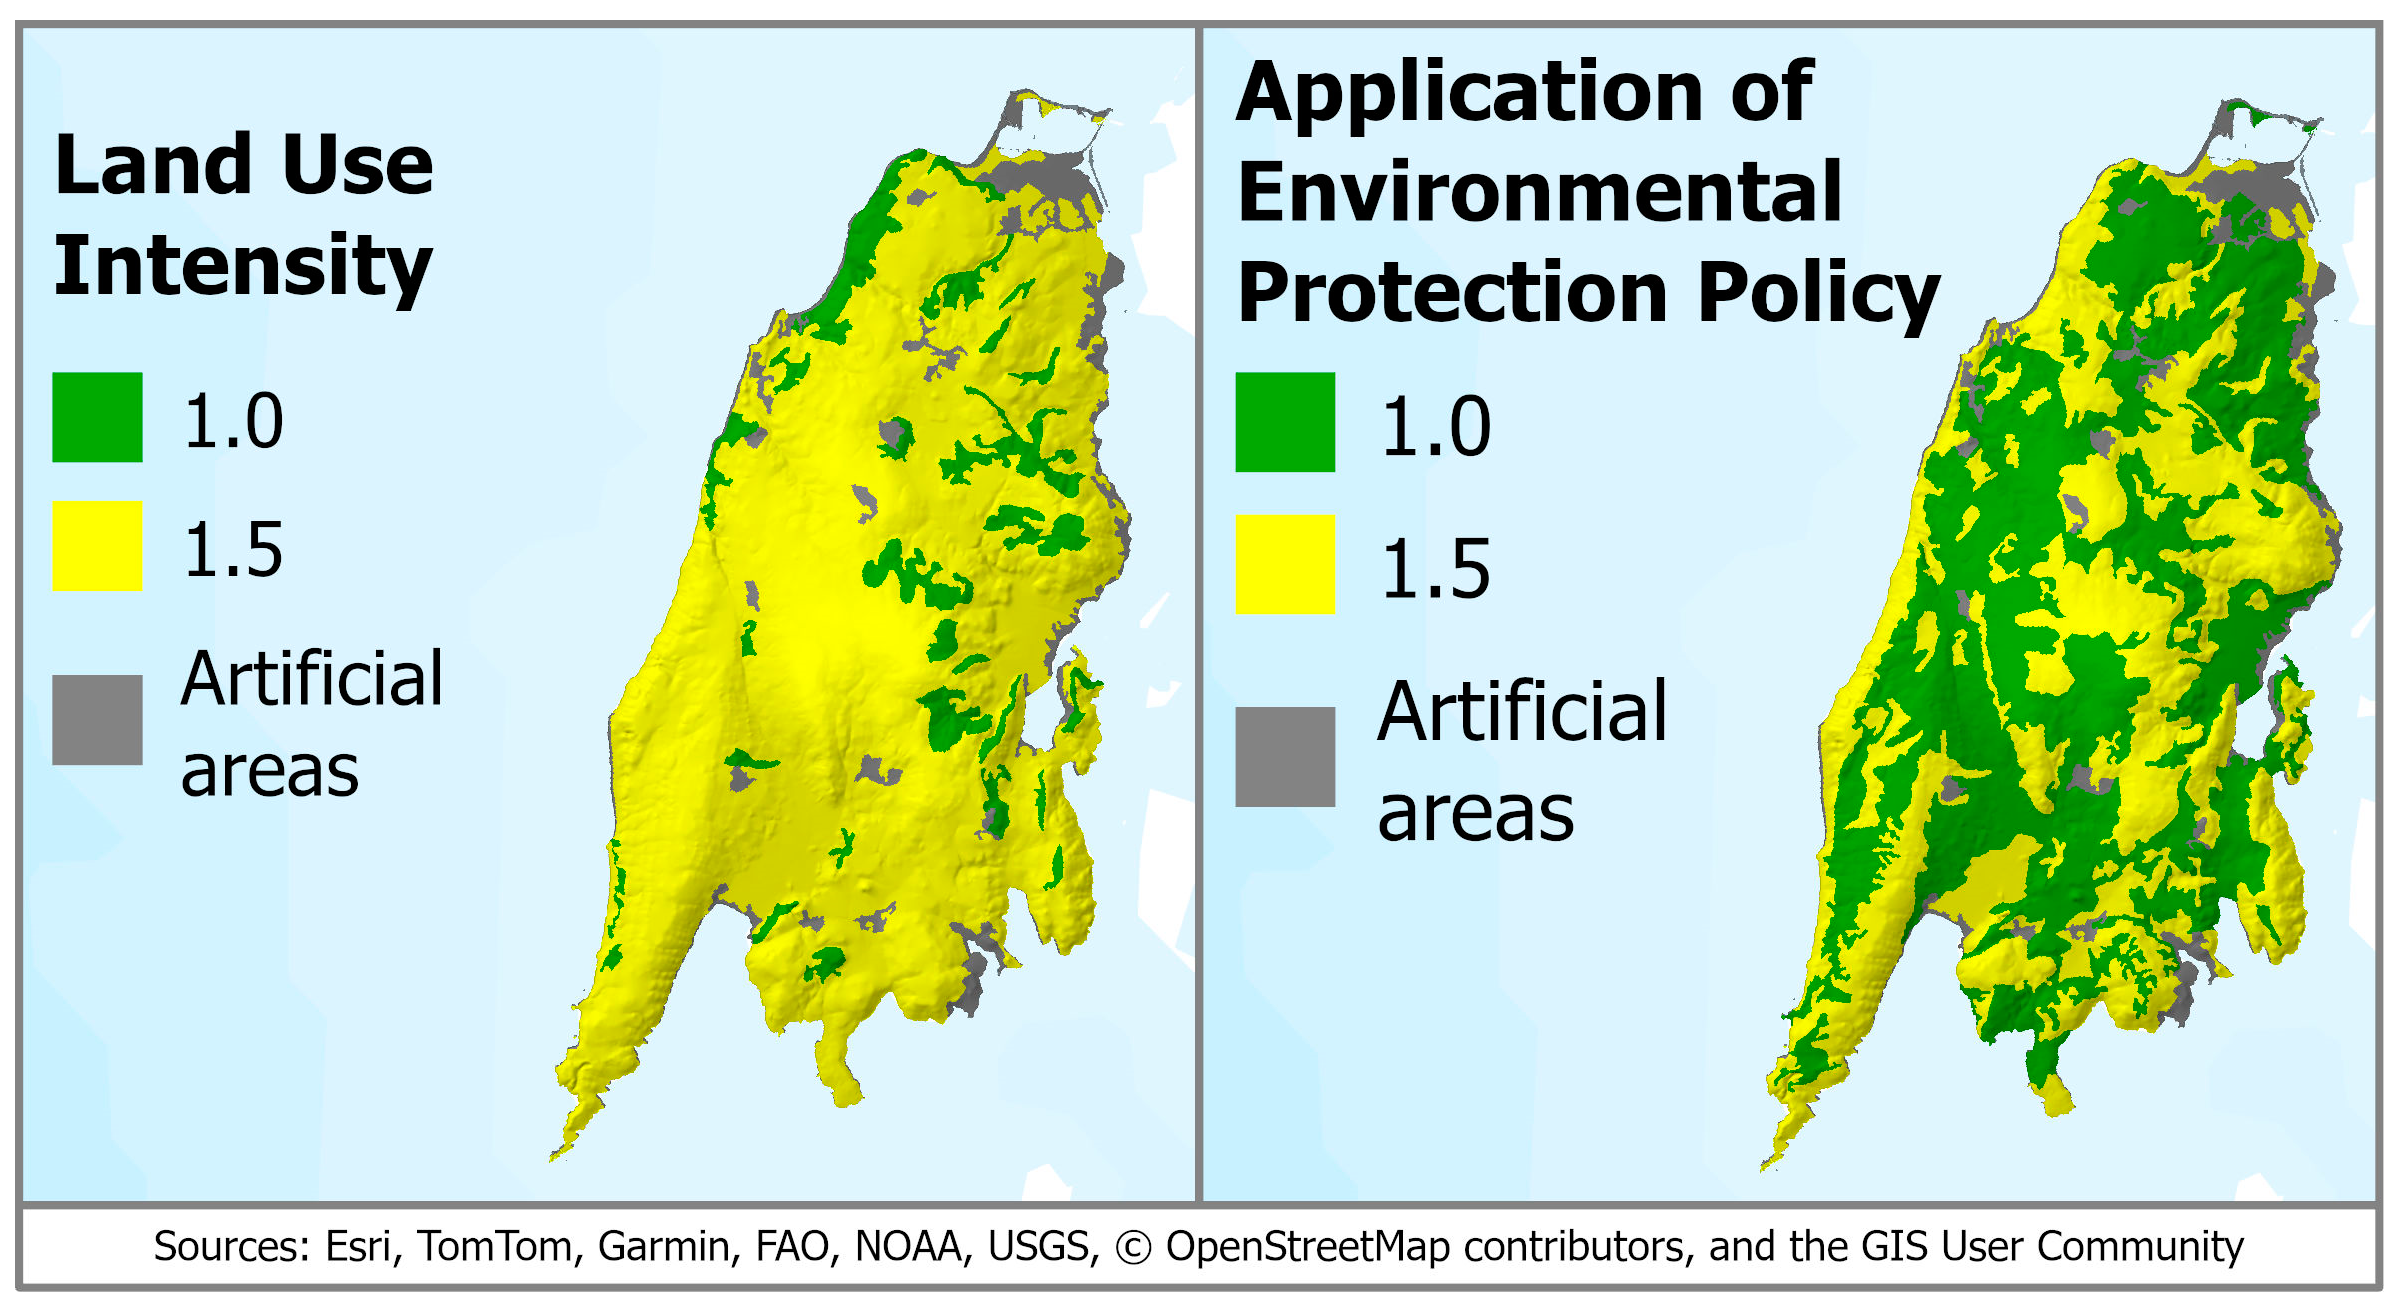
Spatial distribution of factors used to evaluate the Management Quality Index (MQI).
Figure 17.
Spatial distribution of factors used to evaluate the Management Quality Index (MQI).
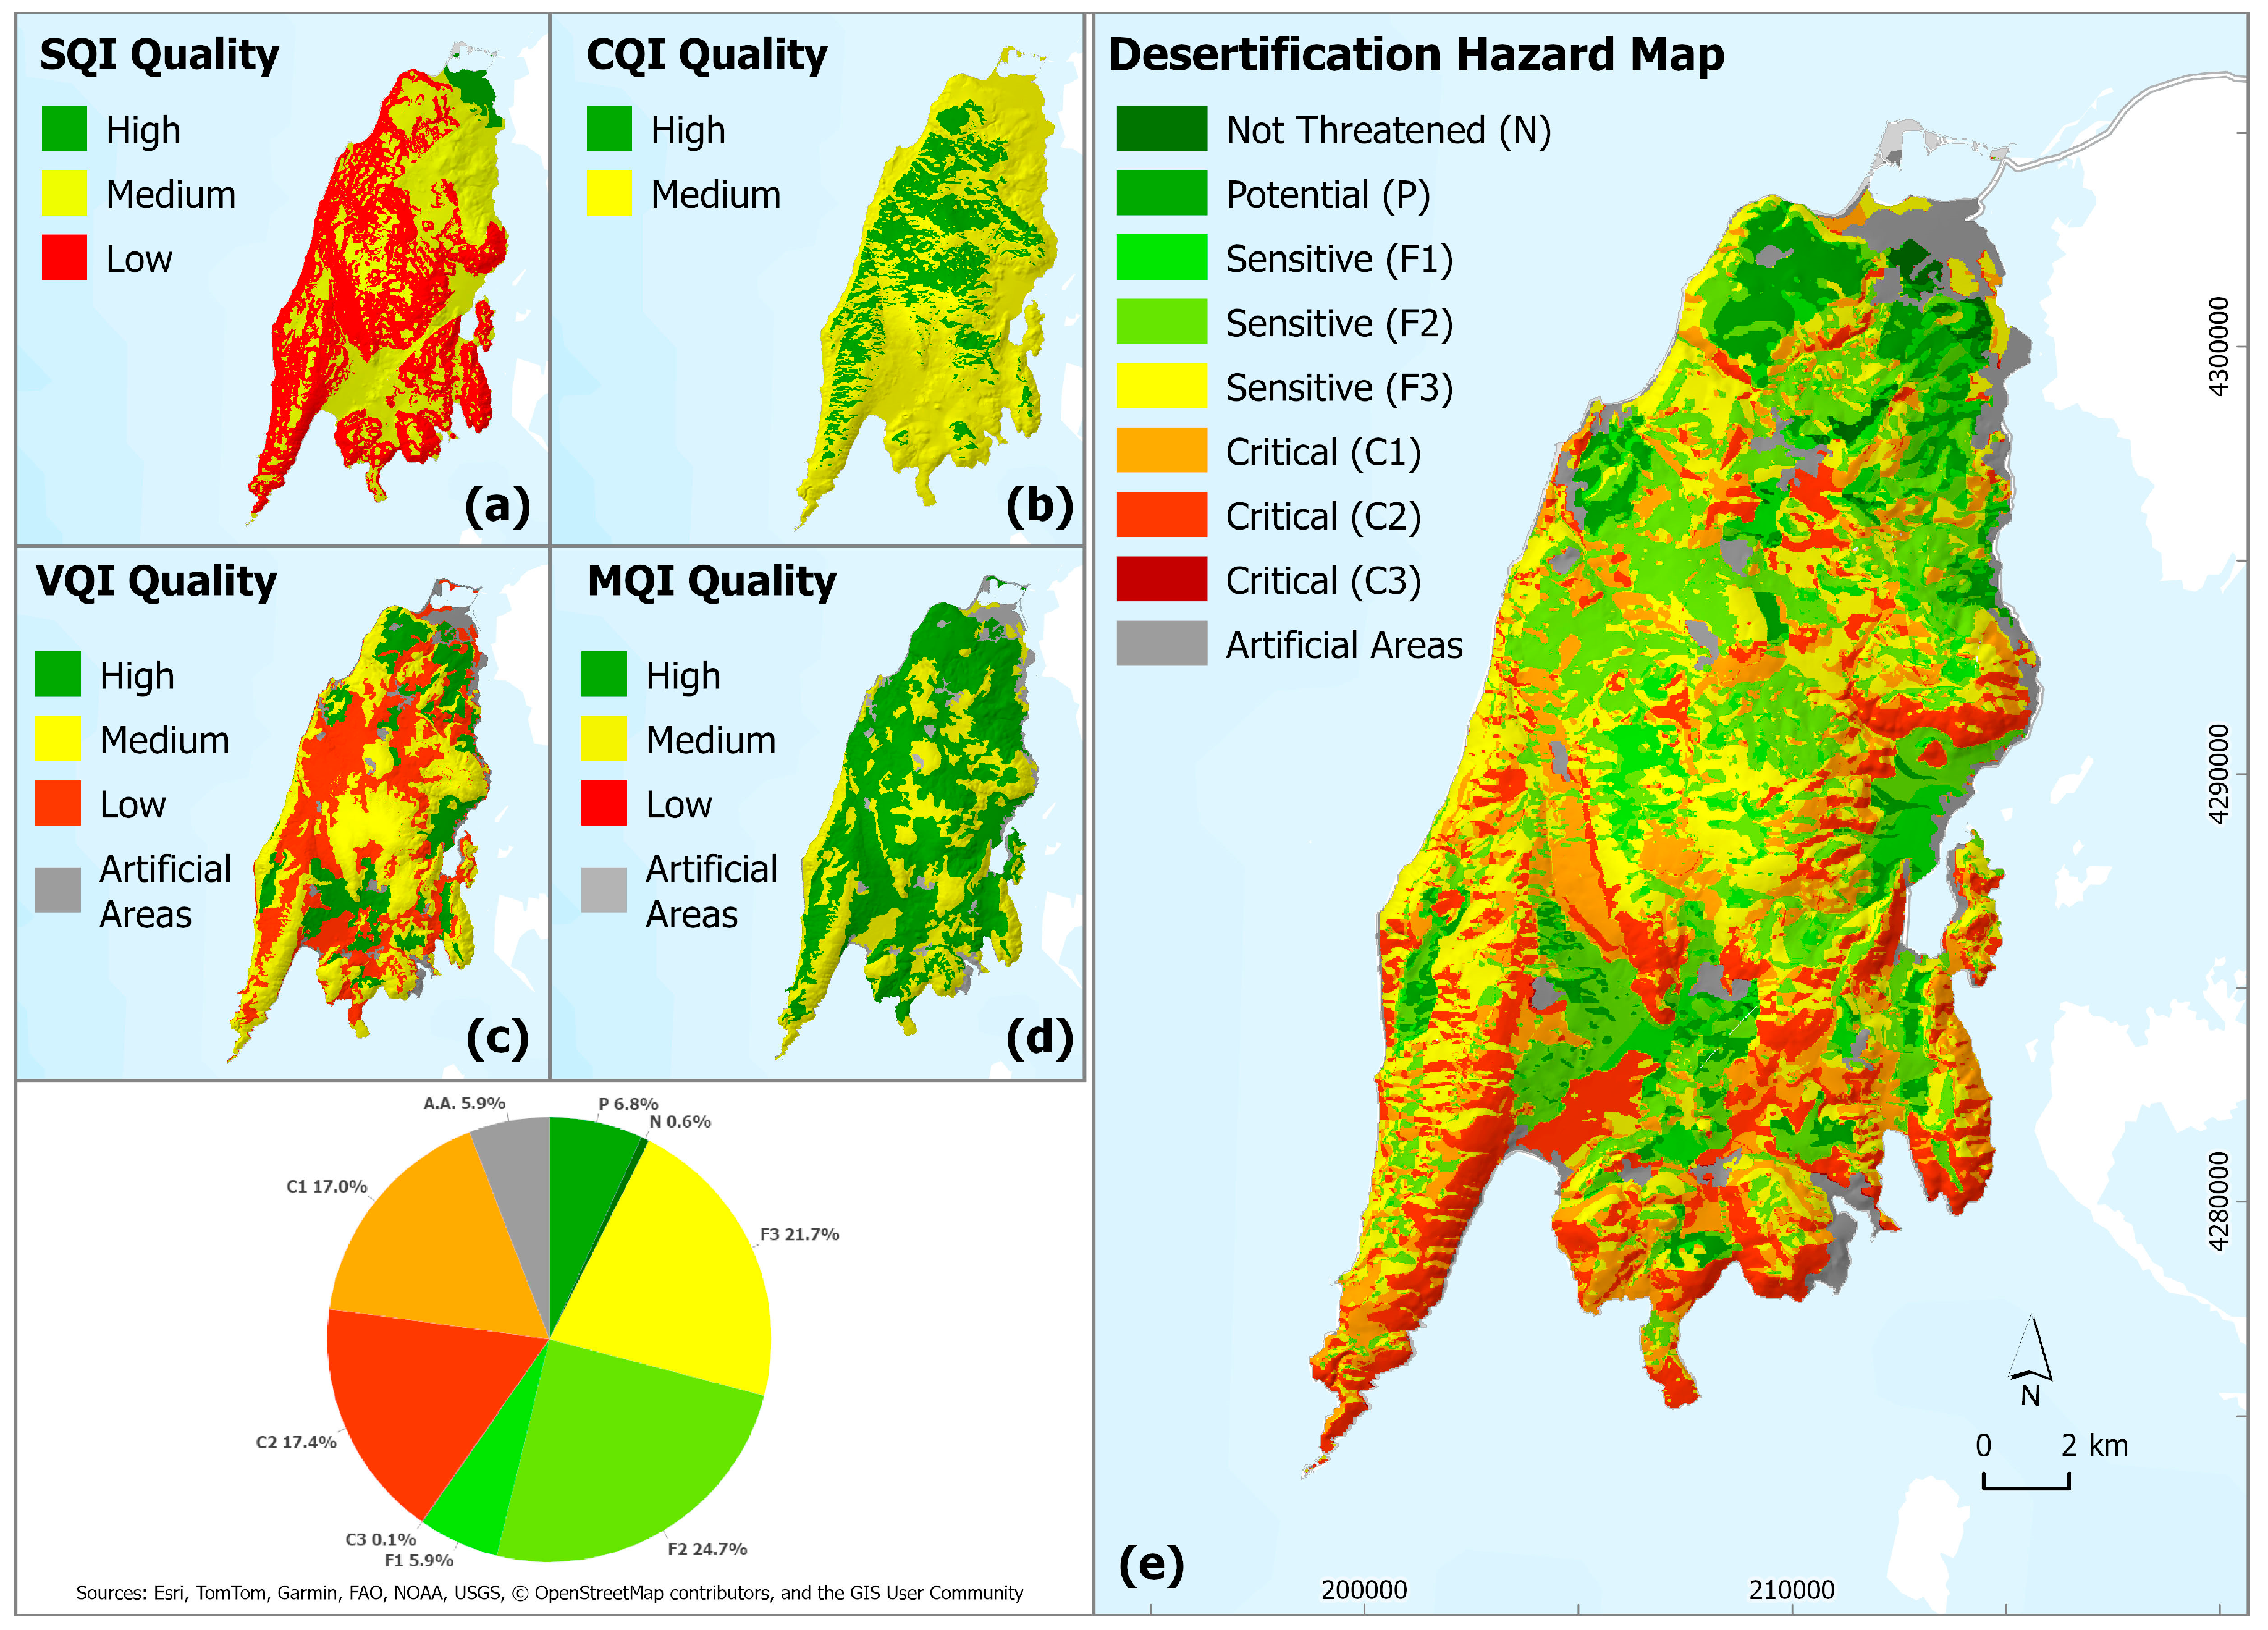
Figure 18.
Desertification Hazard Map of Lefkas Island. The main map (e) presents the ESAI classification, while the smaller inset maps (a–d) depict the spatial distribution of the contributing indices (SQI, CQI, VQI, and MQI). The ESAI assessment reveals that a significant portion of the island—approximately 34.5%—is already degraded, falling into the critical (C1, C2, and C3) categories, primarily in the southern and eastern regions. Nearly 52.3% of the island is classified as sensitive (F1, F2, and F3), indicating areas highly susceptible to further degradation if current land management practices continue. Only a small area (0.6%) is identified as Not Threatened (N), reflecting limited zones of ecological stability. Additionally, Artificial Areas, mainly urbanized zones, account for a notable share of the island’s surface.
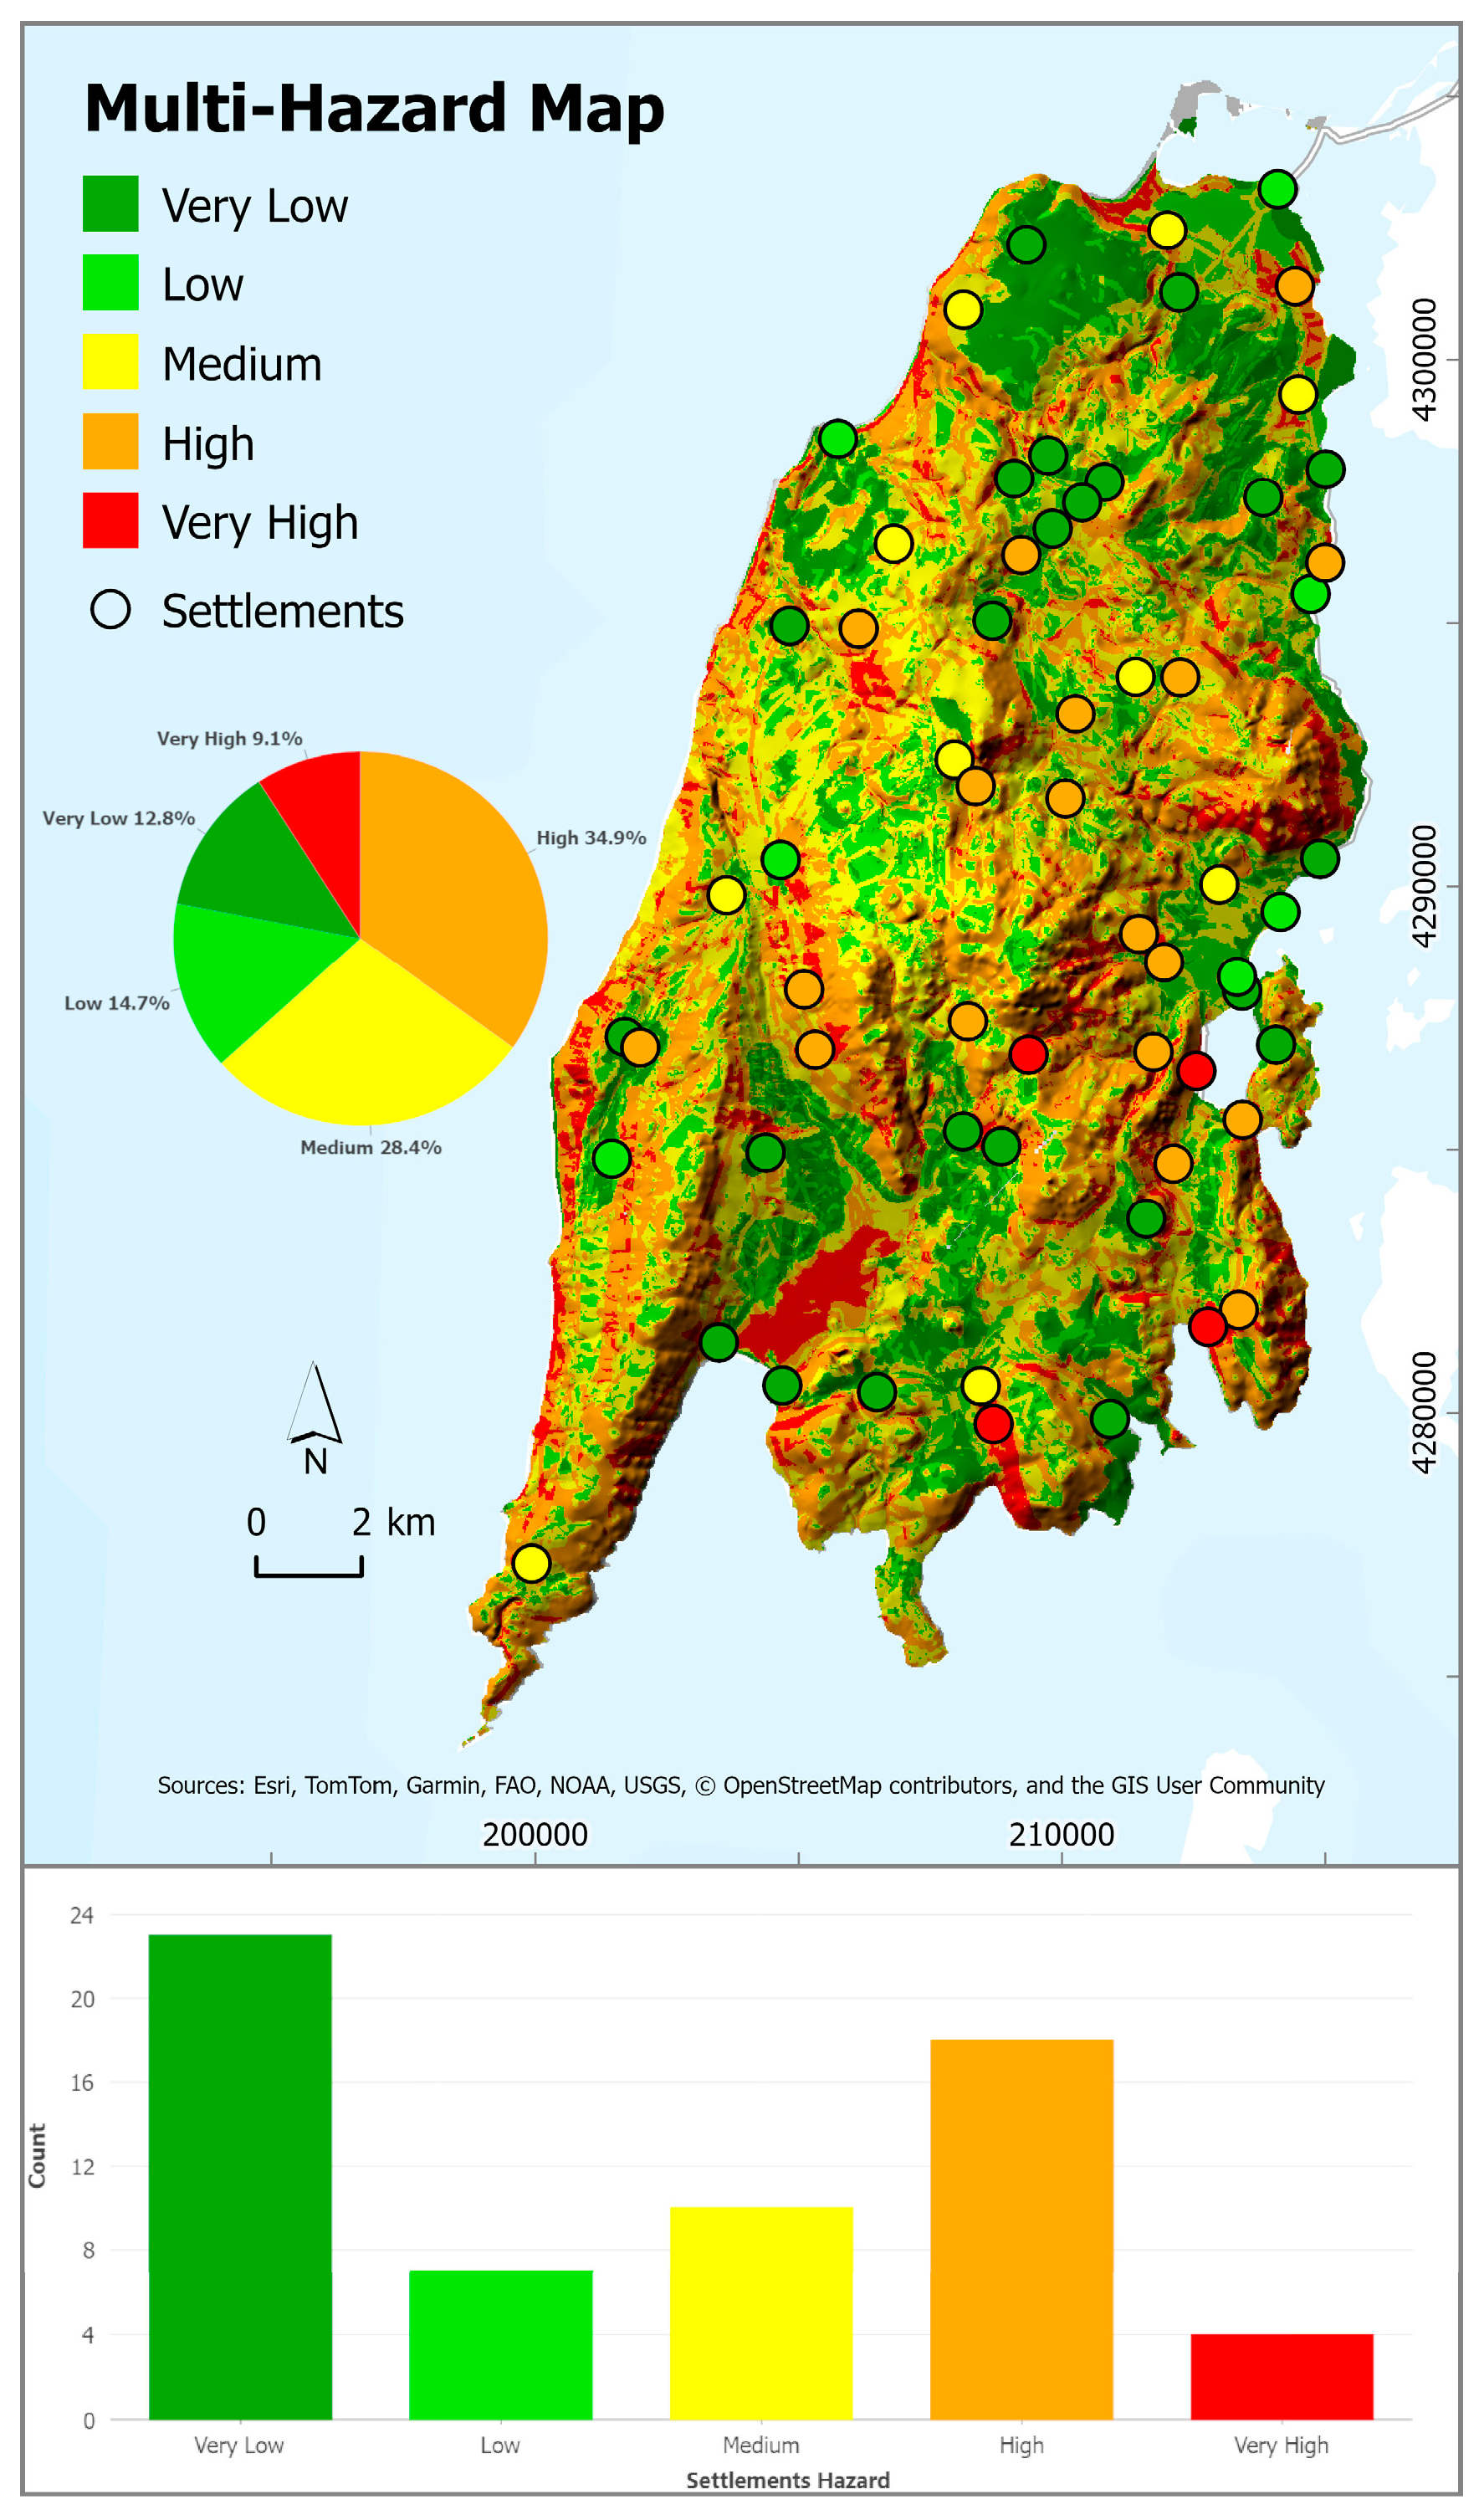
Figure 19.
Multi-Hazard Map of Lefkas Island, integrating flood, landslide, wildfire, and desertification hazards. The map illustrates the spatial distribution of hazard intensity across the island and highlights the exposure of settlements to overlapping geohazards.
Figure 19.
Multi-Hazard Map of Lefkas Island, integrating flood, landslide, wildfire, and desertification hazards. The map illustrates the spatial distribution of hazard intensity across the island and highlights the exposure of settlements to overlapping geohazards.
Figure 20.
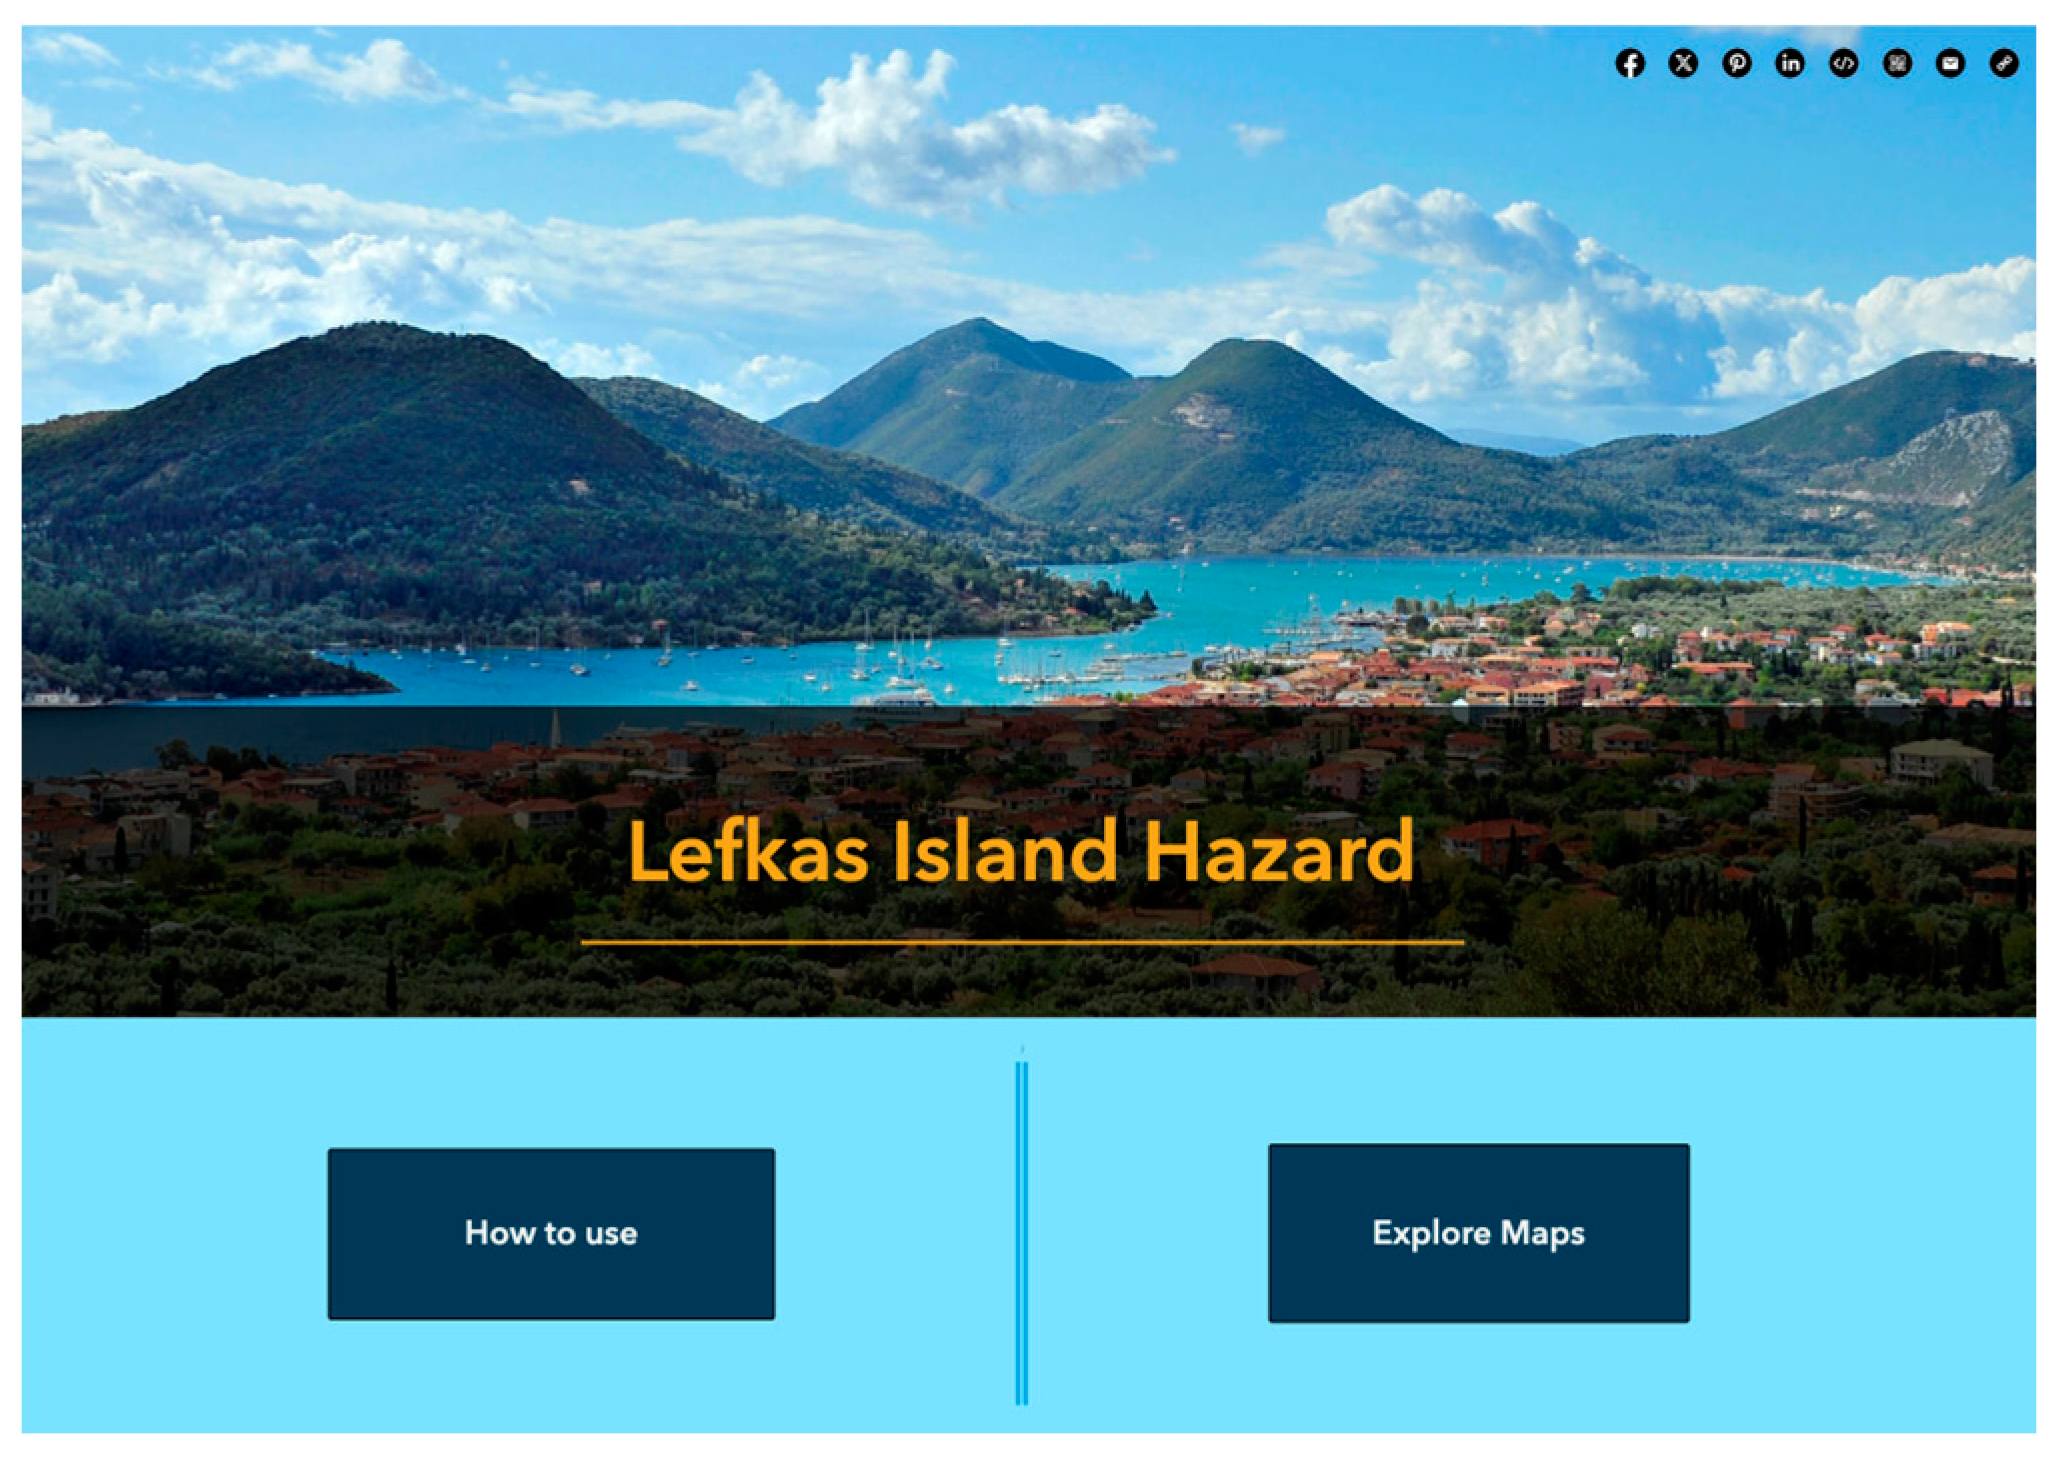
Screenshot showing the Home Page of the Lefkas Island Hazard Explorer. Users can select to see information about the web app or directly explore the hazard maps. Options to share the app are also available.
Figure 20.
Screenshot showing the Home Page of the Lefkas Island Hazard Explorer. Users can select to see information about the web app or directly explore the hazard maps. Options to share the app are also available.
Figure 21.
Screenshot showing the Home Page of the Lefkas Island Hazard Explorer. Users can select to see inform.
Figure 21.
Screenshot showing the Home Page of the Lefkas Island Hazard Explorer. Users can select to see inform.
Figure 22.
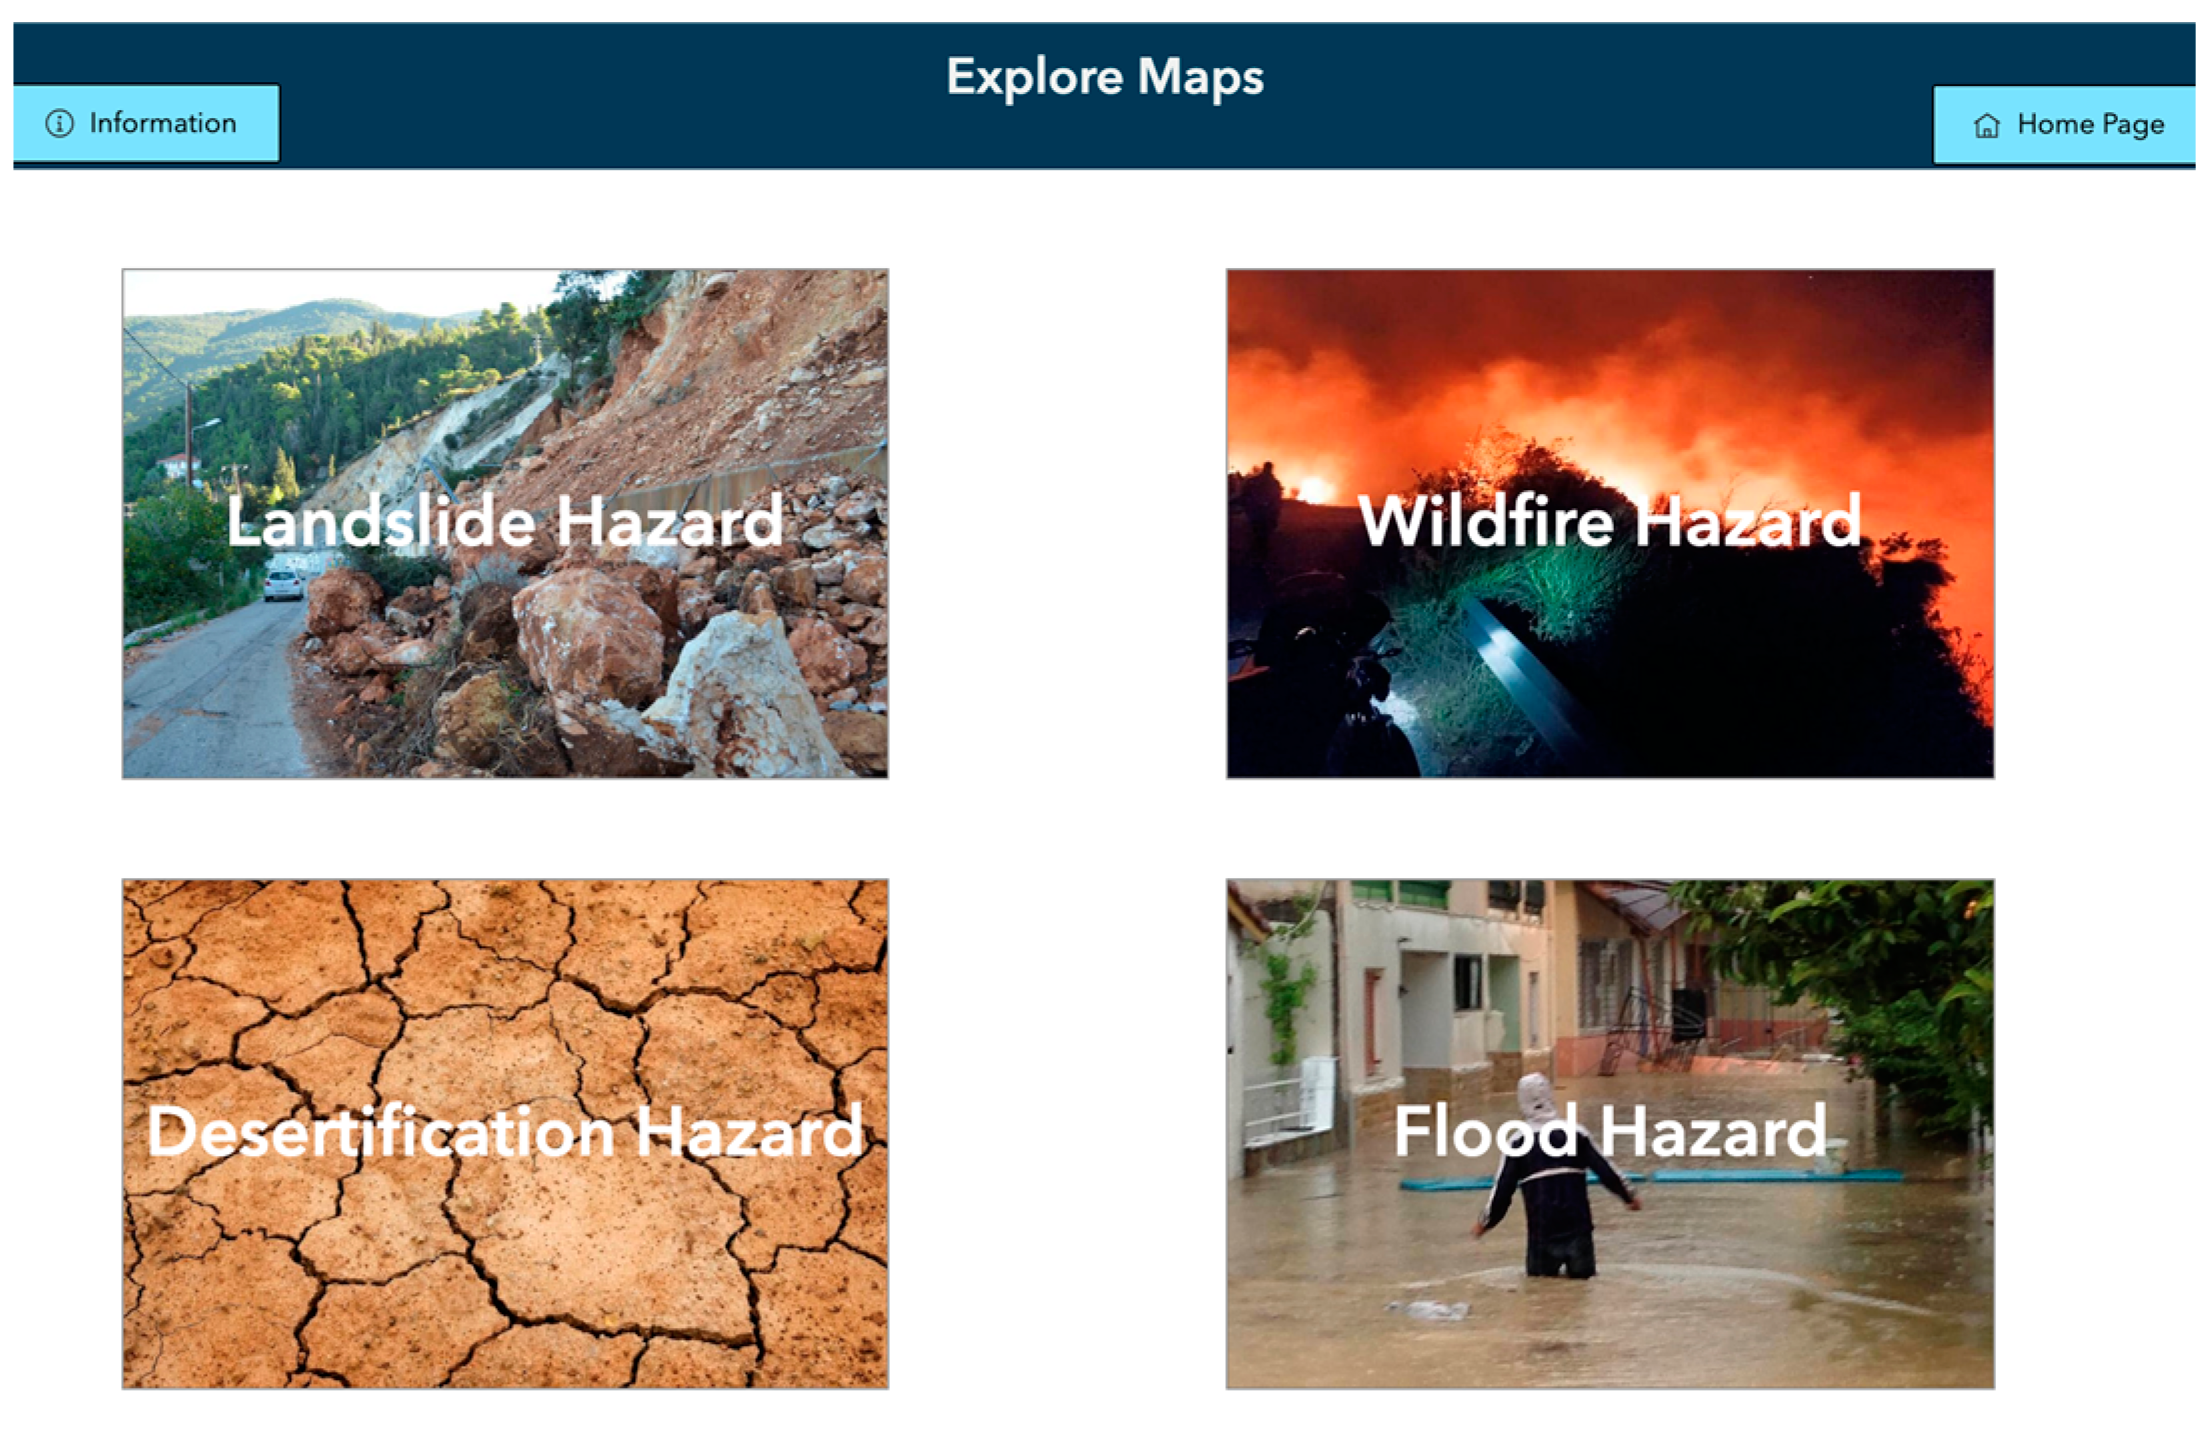
Screenshot showing a hazard page example of the Lefkada Hazard Explorer. Users can zoom in or out, pan, search for a specific location, change basemap, or toggle on-off different layers of information. They can also read the narration provided about hazard analysis and findings. The navigation panel at the upper left provides access to the other hazards and Home Page, while the info button directs to general information about the specific hazard, followed by links to the main official organizations dealing with this hazard.
Figure 22.
Screenshot showing a hazard page example of the Lefkada Hazard Explorer. Users can zoom in or out, pan, search for a specific location, change basemap, or toggle on-off different layers of information. They can also read the narration provided about hazard analysis and findings. The navigation panel at the upper left provides access to the other hazards and Home Page, while the info button directs to general information about the specific hazard, followed by links to the main official organizations dealing with this hazard.
Table 1.
Pairwise comparison matrix used in the multi-criteria analysis for landslide susceptibility assessment. A: slope, B: lithology, C: land use, D: distance from faults, E: distance from roads, F: distance from drainage network, G: precipitation, H: soil depth, I: curvature, and K: slope aspect. The numerical values in each cell indicate the degree of preference between the corresponding factors. The final column presents the calculated weights for each factor, along with the consistency ratio (CR) of the matrix.
| | A | B | C | D | E | F | G | H | I | K | Weights |
|---|
| A | 1 | 2 | 3 | 4 | 4 | 5 | 5 | 6 | 6 | 7 | 0.25449 |
| B | 0.5 | 1 | 2 | 4 | 4 | 5 | 4 | 6 | 5 | 7 | 0.19809 |
| C | 0.333 | 0.5 | 1 | 3 | 4 | 5 | 4 | 5 | 4 | 7 | 0.15603 |
| D | 0.25 | 0.25 | 0.333 | 1 | 4 | 4 | 3 | 4 | 3 | 7 | 0.11037 |
| E | 0.25 | 0.25 | 0.25 | 0.25 | 1 | 4 | 3 | 4 | 4 | 6 | 0.08869 |
| F | 0.2 | 0.2 | 0.2 | 0.333 | 0.25 | 1 | 2 | 3 | 3 | 5 | 0.05761 |
| G | 0.2 | 0.25 | 0.25 | 0.333 | 0.333 | 0.5 | 1 | 2 | 3 | 5 | 0.05027 |
| H | 0.167 | 0.167 | 0.2 | 0.25 | 0.25 | 0.333 | 0.5 | 1 | 2 | 5 | 0.03666 |
| I | 0.1667 | 0.2 | 0.25 | 0.333 | 0.25 | 0.333 | 0.333 | 0.5 | 1 | 4 | 0.03126 |
| K | 0.143 | 0.143 | 0.143 | 0.143 | 0.167 | 0.2 | 0.2 | 0.333 | 0.25 | 1 | 0.01652 |
| CR | 0.09973 |
Table 2.
Parameter ranking used to obtain the Landslide Hazard Map.
Table 2.
Parameter ranking used to obtain the Landslide Hazard Map.
| Factors | Weights (AHP) | Class | Ranking | Normalized Values (%) |
|---|
| Slope | 0.25449 | <2° | 1 | 16 |
| 2–5° | 2 | 33 |
| 5–15° | 3 | 50 |
| 15–25° | 4 | 66 |
| 25–35° | 5 | 83 |
| >35° | 6 | 100 |
| Lithology | 0.19809 | Carboniferous, Triassic siltstones | 1 | 25 |
| Neogene formations | 2 | 50 |
| Flysch, clastic | 3 | 75 |
| Recent loose and Pleistocene formations | 4 | 100 |
| Land Use | 0.15603 | No-till arable land, beaches, sand dunes, sand bars, salt flats, coastal lagoons, inland and coastal wetlands | 0 | 0 |
| Port, recreational facilities | 1 | 16 |
| Olive groves, vineyards, natural pastures, sclerophyllous vegetation, transitional shrub–forest | 2 | 33 |
| Agriculture with significant areas of natural vegetation, discontinuous urban development, broadleaf forests, coniferous forests, mixed forest | 3 | 50 |
| Pastures, complex cropping patterns | 4 | 66 |
| Mining locations | 5 | 83 |
| Sparse vegetation areas | 6 | 100 |
| Distance from Faults | 0.11037 | >200 m | 0 | 0 |
| <200 m | 1 | 100 |
| Distance from the Road Network | 0.08869 | >50 m | 0 | 0 |
| <50 m | 1 | 100 |
| Distance from the Drainage Network | 0.05761 | >50 m | 0 | 0 |
| <50 m | 1 | 100 |
| Precipitation | 0.05027 | <1000 mm | 1 | 100 |
| Soil Depth | 0.03666 | <15 m | 1 | 25 |
| 15–30 m | 2 | 50 |
| 30–75 m | 3 | 75 |
| >75 m | 4 | 100 |
| Slope Curvature | 0.03126 | >1.5 | 3 | 42 |
| 0–1.5 | 2 | 28 |
| 0 | 1 | 14 |
| −0.5–0 | 4 | 57 |
| −1.5–−0.5 | 5 | 71 |
| −2.5–−1.5 | 6 | 85 |
| <−2.5 | 7 | 100 |
| Slope Aspect | 0.01652 | Others | 1 | 50 |
| N-NW | 2 | 100 |
Table 3.
Parameter ranking used to obtain the Wildfire Hazard Map.
Table 3.
Parameter ranking used to obtain the Wildfire Hazard Map.
| Criteria | Category | Grade | Weight Factor |
|---|
| Land Use | Coniferous forest, broadleaf forest, mixed forest | 5 | 45% |
| Pastures, natural pastures, sclerophyllous vegetation, transitional forest–shrubland | 3 |
| Complex cultivation standards, agriculture with significant areas of natural vegetation | 2 |
| Olive groves, vineyards, sparse vegetation areas | 1 |
| Discontinuous urban development, harbor, mining sites, recreational facilities, uncultivated arable land, beaches, dunes, sand bars, salt flats, coastal lagoons | 0 |
| Slope | >40% | 5 | 15% |
| 13–40% | 3 |
| <13% | 1 |
| Slope Aspect | 135–270° | 5 | 5% |
| 45–135° | 3 |
| 270–315° | 3 |
| 315–360° | 1 |
| 0–45° | 1 |
| Proximity to Settlements | <400 m | 4 | 13% |
| Proximity to the Road Network | Asphalt road (<50 m) | 5 | 12% |
| Dirt road (<50 m) | 4 |
| Proximity to the PPC network | <30 m | 5 | 10% |
Table 4.
Parameter ranking used to obtain the SQI [
44].
Table 4.
Parameter ranking used to obtain the SQI [
44].
| Granulometric Composition | | |
|---|
| Ground composition | Soil Depth Index | | |
| L, SCL, SL, LS, CL | 1.0 | | |
| SC, SiL, SiCL | 1.2 | | |
| Si, C, SiC | 1.6 | | |
| S | 2.0 | | |
| Slope Inclination | |
| Slope inclination | Quality | Slope Index |
| <6% | Almost flat | 1 |
| 6–18% | Inclined | 1.2 |
| 18–35% | Steep | 1.5 |
| >35% | Very steep | 2 |
| Parent Rock |
| Parent rock | Quality | Parent Rock Index |
| Holocene alluvial deposits | Good | 1 |
| Limestones | Medium | 1.7 |
| Marl | Bad | 2.0 |
| Water surfaces | - | - |
| Soil Depth |
| Ground composition | Soil Depth (cm) | Soil Depth Index | Description | Soil Quality |
| Calcaric Cambisol; Chromic Luvisol; Rhodic Luvisol, Chromic Vestrisol, Calcaric Fluvisol | >75 | 1.0 | Deep | Medium |
| Carcaro-leptic Regosol; Calcaro-petric Cambisol; Rock outcrops | <15 | 4.0 | Very shallow | Low |
| Haplic Calcisol; inclusions of Solonchak in some cases | 30–75 | 2.0 | Medium deep | Very high |
| Coarse Materials Content | | |
| Parent rock | W.C.* Coarse materials percentage | Quality | | |
| Limestones | 1 | Very Rocky (C.M. > 60%) | | |
| Tertiary and Quaternary deposits of calcareous pebbles | 1.3 | Rocky (C.M. 20–60%) | | |
| Holocene alluvial deposits | 2 | Uncovered–Slightly Rocky (C.M. < 20%) | | |
| Water surfaces | - | - | | |
| Hydromorphy | | | |
| Description | W.C. | | | |
| Well drained | 1 | | | |
| Imperfectly drained | 1.2 | | | |
| Badly drained | 2 | | | |
Table 5.
Parameter ranking used to obtain the CQI [
44].
Table 5.
Parameter ranking used to obtain the CQI [
44].
| Precipitation |
|---|
| Precipitation (mm) | Rainfall Index |
|---|
| >650 | 1 |
| 280–650 | 2 |
| <280 | 4 |
| Slope Orientation |
| Slope Aspect | Orientation Index |
| NE-NW | 1 |
| SE-SW | 2 |
| Aridity |
| BGI | Aridity Index |
| <50 | 1 |
| 50–75 | 1.1 |
| 75–100 | 1.2 |
| 100–125 | 1.4 |
| 125–150 | 1.8 |
| >150 | 2 |
Table 6.
Land-use classification according to each factor [
44].
Table 6.
Land-use classification according to each factor [
44].
| Land Use | Against Fire | Against Erosion | Regarding Vegetation Rate | Against Drought |
|---|
| Artificial surfaces–beaches–dunes–sands | 5.0 | 5.0 | 5.0 | 5.0 |
| Non-arable land | 1.3 | 2.0 | 1.0 | 2.0 |
| Vineyards | 1.0 | 2.0 | 1.8 | 1.4 |
| Olive groves | 1.0 | 1.0 | 1.0 | 1.0 |
| Complex cultivation patterns | 1.6 | 1.8 | 1.0 | 1.7 |
| Land with significant areas of natural vegetation | 1.6 | 1.0 | 1.8 | 1.4 |
| Rural–forest Areas | 1.0 | 1.0 | 1.0 | 1.0 |
| Broad-leaved forest | 1.6 | 1.6 | 1.0 | 1.2 |
| Coniferous forest | 2.0 | 1.3 | 1.0 | 1.2 |
| Mixed forest | 2.0 | 1.3 | 1.0 | 1.2 |
| Natural grasslands | 1.3 | 1.3 | 1.0 | 1.7 |
| Sclerophyllous vegetation | 1.3 | 1.6 | 1.0 | 1.4 |
| Transitional woodland-shrub | 1.6 | 1.3 | 1.0 | 1.0 |
| Sparsely vegetated areas | 1.0 | 1.3 | 1.8 | 1.0 |
Table 7.
Parameter ranking used to obtain the VQI [
44].
Table 7.
Parameter ranking used to obtain the VQI [
44].
| Fire Risk |
|---|
| Description | Wildfire Risk Index |
| Low risk | 1 |
| Medium risk | 1.3 |
| High risk | 1.6 |
| Very high risk | 2 |
| Vegetation Rate |
| Description | Vegetation Rate Index |
| High | 1 |
| Medium | 1.8 |
| Low | 2 |
| Protection From Erosion |
| Description | Protection from Erosion Index |
| Very high | 1.0 |
| High | 1.3 |
| Medium | 1.6 |
| Low | 1.8 |
| Very low | 2.0 |
| Drought Tolerance |
| Description | Drought Tolerance Index |
| Very high | 1.0 |
| High | 1.2 |
| Medium | 1.4 |
| Low | 1.7 |
| Very low | 2.0 |
Table 8.
Land-use classification and ranking used to obtain the ΜQI [
44].
Table 8.
Land-use classification and ranking used to obtain the ΜQI [
44].
| Land Use | Land-Use Intensity | Management Policy |
|---|
| Artificial surfaces–beaches–dunes–sands | 5 | 5 |
| Non-arable land | 1.5 | 1.5 |
| Vineyards | 1.5 | 1.5 |
| Olive groves | 1.5 | 1.5 |
| Complex cultivation patterns | 1.5 | 1.5 |
| Land with significant areas of natural vegetation | 1.5 | 1 |
| Rural–forest areas | 1 | 1 |
| Broad-leaved forest | 1.5 | 1 |
| Coniferous forest | 1 | 1.5 |
| Mixed forest | 1 | 1.5 |
| Natural grasslands | 1.5 | 1.5 |
| Sclerophyllous vegetation | 1.5 | 1.5 |
| Transitional woodland-shrub | 1.5 | 1.5 |
| Sparsely vegetated areas | 1.5 | 1.5 |
Table 9.
Parameter ranking used to obtain the ΜQI [
44].
Table 9.
Parameter ranking used to obtain the ΜQI [
44].
| Land-Use Intensity |
|---|
| Description | Land-Use Intensity Index |
|---|
| High | 1 |
| Medium | 1.5 |
| Low | 2 |
| Application of Environmental Protection Policy |
| Description | Application of Environmental Protection PolicyIndex |
| Fully (>75% Protected Area) | 1.0 |
| Partially (25–75% Protected Area) | 1.5 |
| Insufficient (<25% Protected Area) | 2 |


