1. Introduction
“Where people are” is one of the basic questions asked by researchers and practitioners in many applications, like urban planning, infrastructure management, and public health and safety [
1,
2,
3]. With the emergence of location-aware technologies and the widespread availability of portable devices, big spatio-temporal data on human mobility, especially in urban areas, have been collected based using various instruments [
4]. Data-driven approaches in mobility research have been intensively employed by academic communities, with expanding topics including moving-object data acquisition, trajectory data management and processing, trajectory analytics and clustering, and deep learning for trajectory computing [
5,
6]. Fundamental studies by González et al. (2008) using mobile phone data revealed universal patterns in human mobility [
7], while Song et al. quantified the theoretical limits of mobility predictability through entropy analysis [
8]. Researchers from many fields have been working to build an integrated science of movement and further a comprehensive understanding of human mobility and related spatial dynamics [
9].
Human clustering techniques have been extended to various domains. In urban planning, clustering algorithms help in understanding pedestrian movement patterns to optimize city layouts and improve public safety [
10]. Pentland’s social physics framework (2014) demonstrates how collective mobility patterns emerge from individual interactions [
11], providing theoretical support for these applications. In marketing, the clustering of consumer behavior based on shopping patterns and visited locations enables businesses to target specific customer groups more effectively [
12]. Recent work by Dong et al. (2016) on population-weighted network efficiency provides methodological references for analyzing commercial behavior patterns [
13]. Furthermore, analyzing patient trajectories within hospital premises can enhance the management of healthcare services and improve patient care in healthcare [
14]. Among trajectory data analysis and knowledge discovery methods, trajectory clustering can help to reveal underlying spatial patterns of individual and group movements across time and space, which can further be used to conduct human activity prediction and movement simulation [
5,
6,
8,
9]. In these scenarios, trajectories are taken as proxies for locations of human individuals. Spatio-temporal characteristics of one trajectory and similarities among trajectories are used to represent human behaviors and activities, as well as for human clustering and prediction, which further generate possibilities to reconstruct spatial dynamics of social communities [
2,
9,
12].
In particular, recent studies have increasingly employed mobile phone call detail records (CDRs) to analyze human trajectories, presenting valuable insights into movement patterns, social interactions, and urban mobility at large scales [
15]. Blumenstock et al. (2015) demonstrated that mobile phone data, beyond basic mobility analysis, can be leveraged to infer an individual’s socioeconomic status and social behavior [
16]. Human groups can be identified further by clustering algorithms to contribute to informed urban planning [
17]. Taxi trajectories generated based on global navigation satellite systems (GNSSs) are another representative instrument for understanding urban dynamics by clustering vehicle behavior and transportation demands [
18]. Recent studies have mainly focused on the similarities of geometric measurements and temporal attributes of trajectories [
7]. Various algorithms, such as the edit distance on real sequence, longest common subsequence (LCS), and dynamic time warping (DTW) algorithms, have been implemented to calculate similarities among trajectories. Clustering algorithms have also been used to categorize individuals into typical groups [
15,
19]. Recently, deep learning technologies, including recurrent neural networks, convolutional neural networks, graph neural networks, and transformer-based models, together with attention mechanisms, have been introduced into trajectory data modeling, representation learning, trajectory clustering, and mobility simulation [
6,
20,
21]. These technologies have been intensively applied to improve the effectiveness of trajectory similarity measurement and classification, which show advantages in extracting latent characteristic patterns, estimating travel time, and detecting anomalies, in addition to mobility generation.
Most methodologies in available works adopt a data-driven trajectory approach to understand human mobility patterns and particular personal information. Most human movements are basically intentional movements with purposes [
5,
9]. Spaces accommodating human movements offer relevant functions that meet the requirements of these purposes [
9]. To better understand human behaviors, it is necessary to incorporate more semantic information of location and space, which accommodates required and desired activities. The built environment can act as a behavioral catalyst, suggesting that space functions may fundamentally shape mobility patterns in various disciplines across scales [
12]. This perspective necessitates deeper integration of semantic space information with traditional trajectory analysis. Based on home location estimation [
21], researchers validated the scaling law of visitation using mobile-phone data from multiple cities, which presented an inverse pattern of human travel distance relative to the frequency of trips from home. The findings supplement the gravity law and the radiation model of human mobility. Human mobility data generated in location-based social networks (LBSNs), such as those in FourSquare, empower researchers with semantically rich information in heterogeneous dimensions coupled with raw trajectory data of position and time [
22]. Semantic information can be encoded into an attribute-embedding layer in neural network models, together with stay points in trajectories. In addition, user age groups [
23] can be classified based on sparse spatial–temporal clustering and aggregation of trajectory data using machine learning algorithms [
17].
In urban contexts, intensive interactions happen directly among human individuals who share similar spatio-temporal trajectories or indirectly among those who may use spaces with the same functions at different locations. As indicated above, most research mainly considers the former cases, adopting approaches using spatio-temporal similarities of trajectories. Specific functions of spaces accommodating trajectory stay points underpin human movements, enriching spatio-temporal patterns of corresponding trajectories. Recent advances in spatio-temporal visualization, as summarized in Bach et al.’s systematic review of space-time cube operations [
24], provide methodological foundations for the decoding of complex mobility patterns through 3D geo-visual analytics. The space function of trajectory stay points and the time that human individuals spend in spaces of specific functions reflect the purpose and drivers behind their behavior and corresponding activities. Recent advancements have shown the potential of incorporating space functions to enhance human clustering accuracy. Studies have incorporated types of buildings or areas that individuals visit to improve clustering performance for individuals with similar behavior patterns [
25]. This consideration allows for a more comprehensive understanding of how individuals interact with different types of spaces. Fang et al. categorized campus life trajectories into two types based on campus access points (APs) and inferred people’s activities at different times according to the AP sets [
25]. The effectiveness of mining Wi-Fi access log data to extract activity patterns in various types of space functions using K-means clustering has been demonstrated, which can reveal a deeper understanding of the spatio-temporal behaviors of students [
26]. By incorporating a space function, it is possible to uncover more nuanced groups of individuals with similar spatio-temporal activity patterns. Incorporating space functions into human clustering has shown promising results within campus environments [
4]. By analyzing stay points within these spaces, researchers can gain valuable insights into campus inhabitants’ behavior, optimize space utilization, and improve the effectiveness of infrastructure services. Specifically, in the context of a school campus, clustering students into groups based on their presence in different spaces can help identify spatio-temporal patterns of their study habits, social interactions, and space usages.
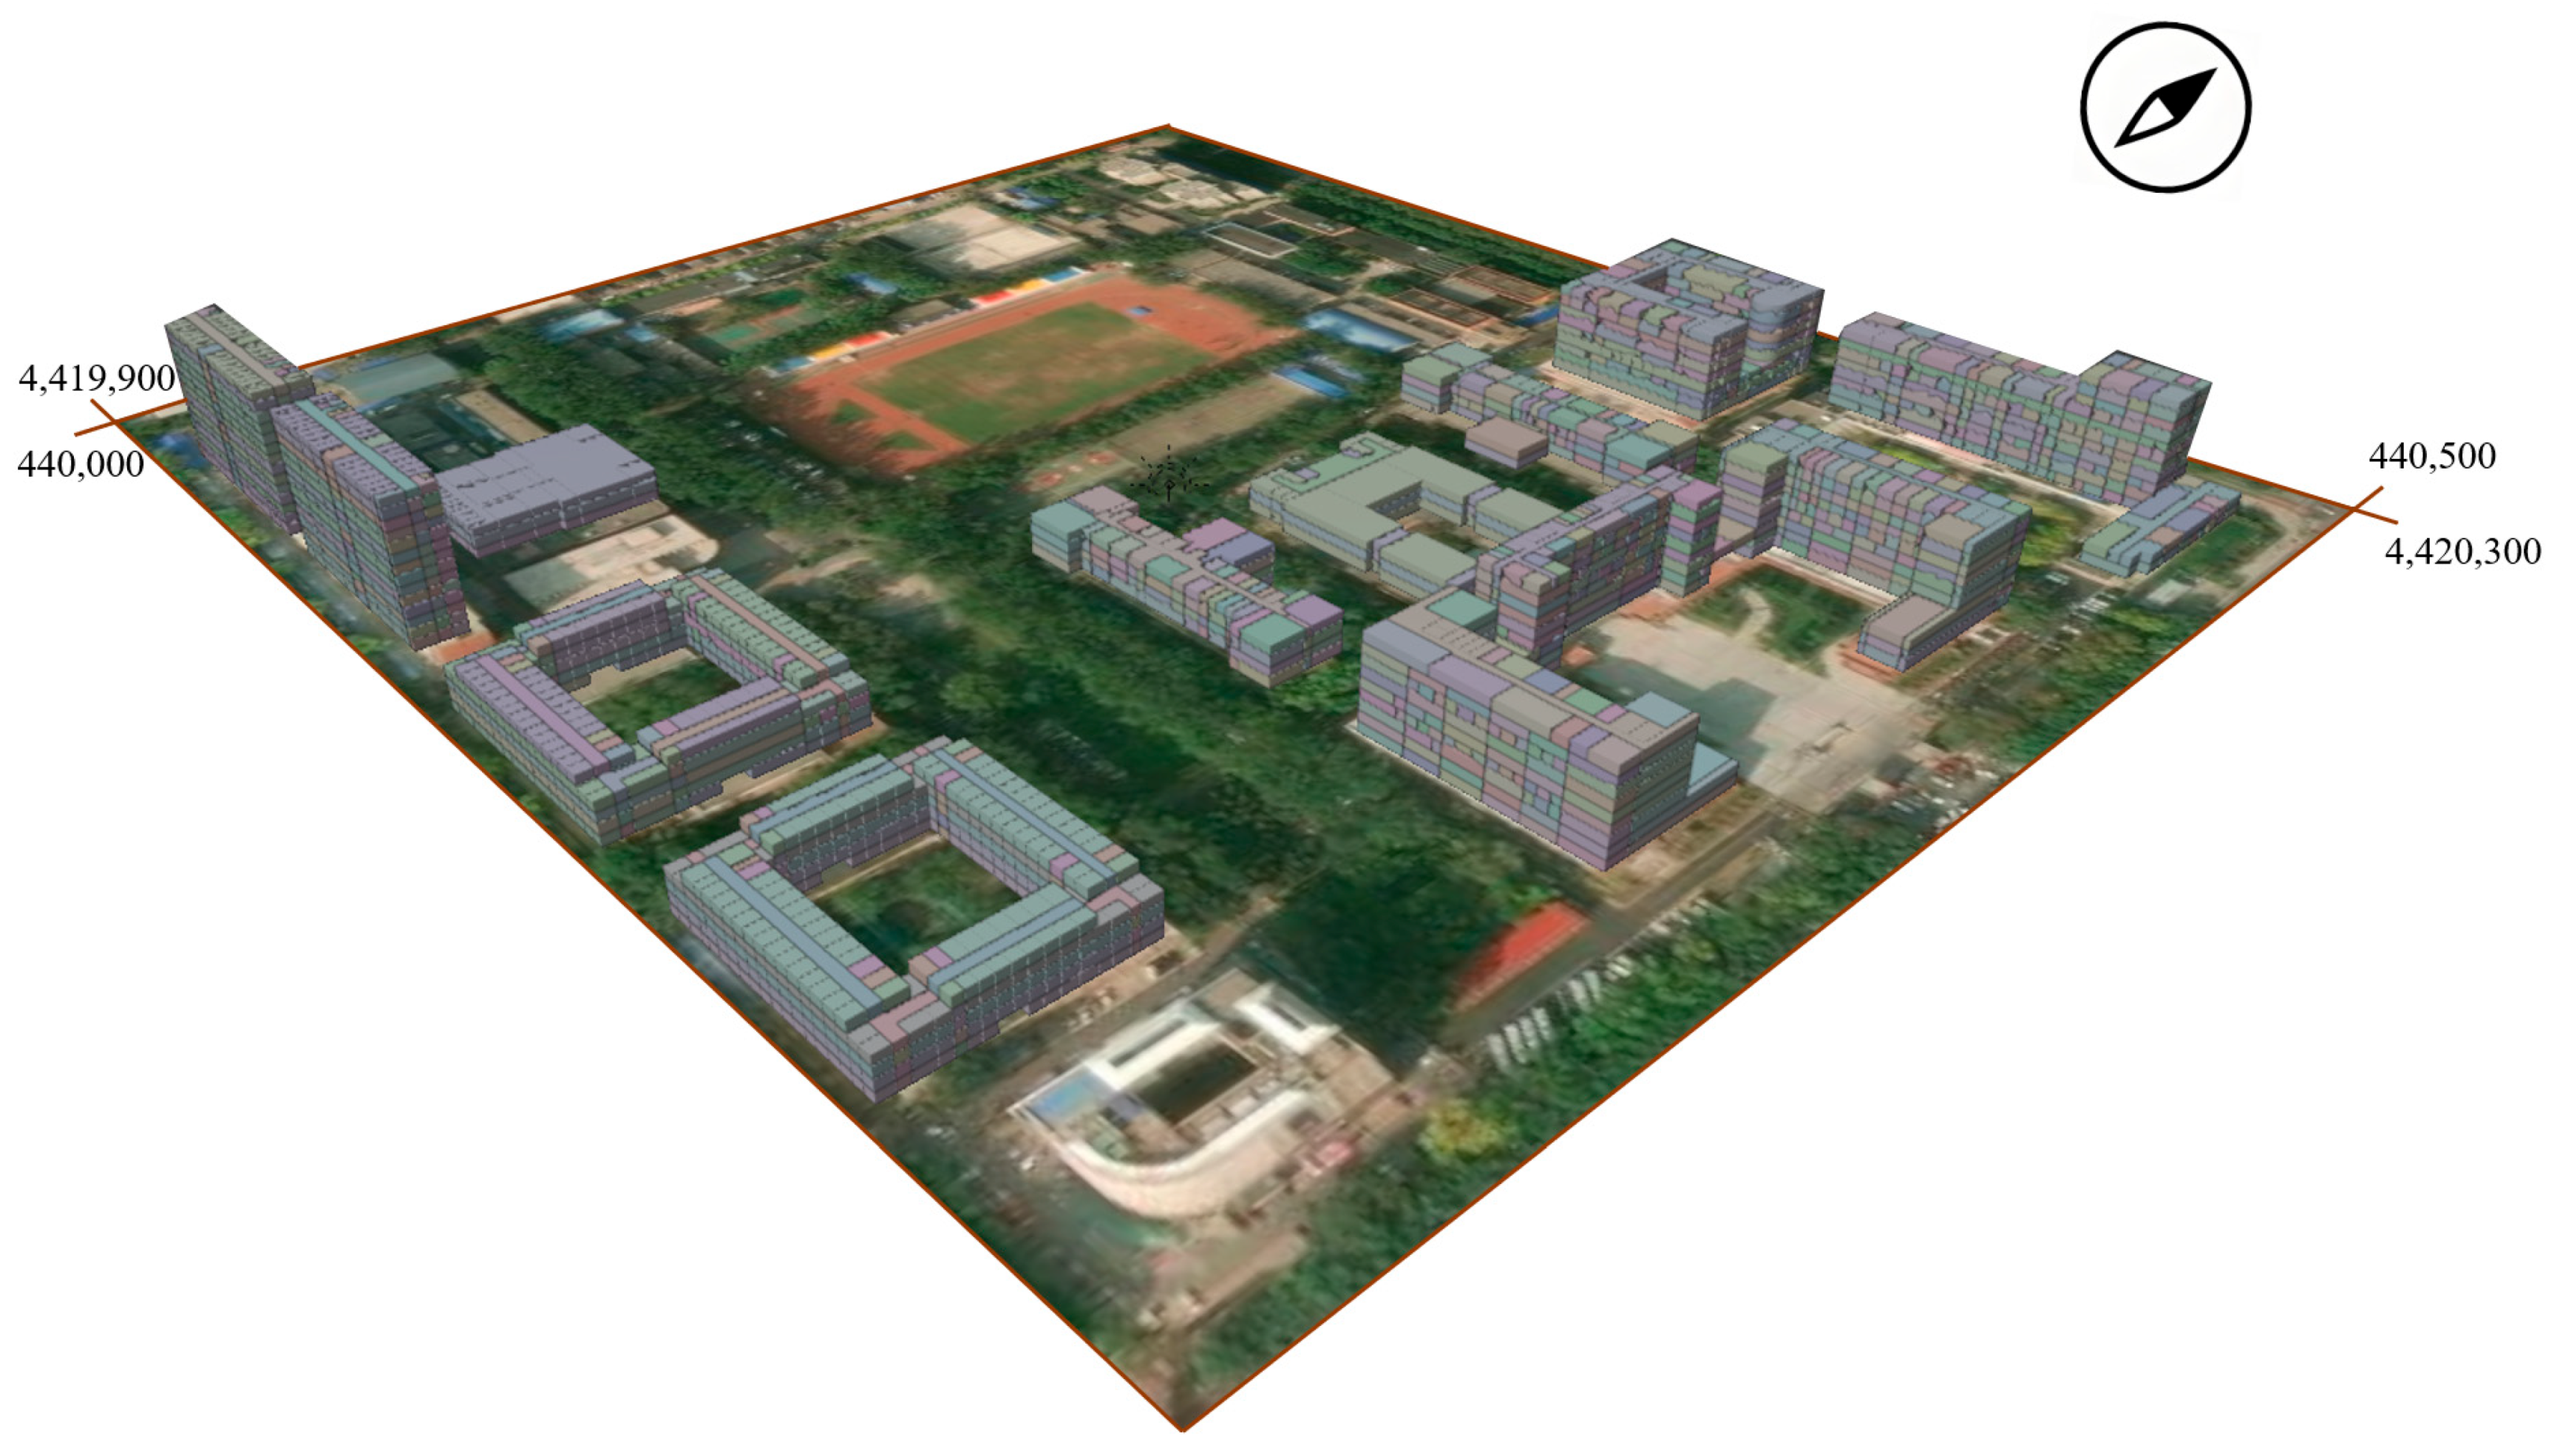
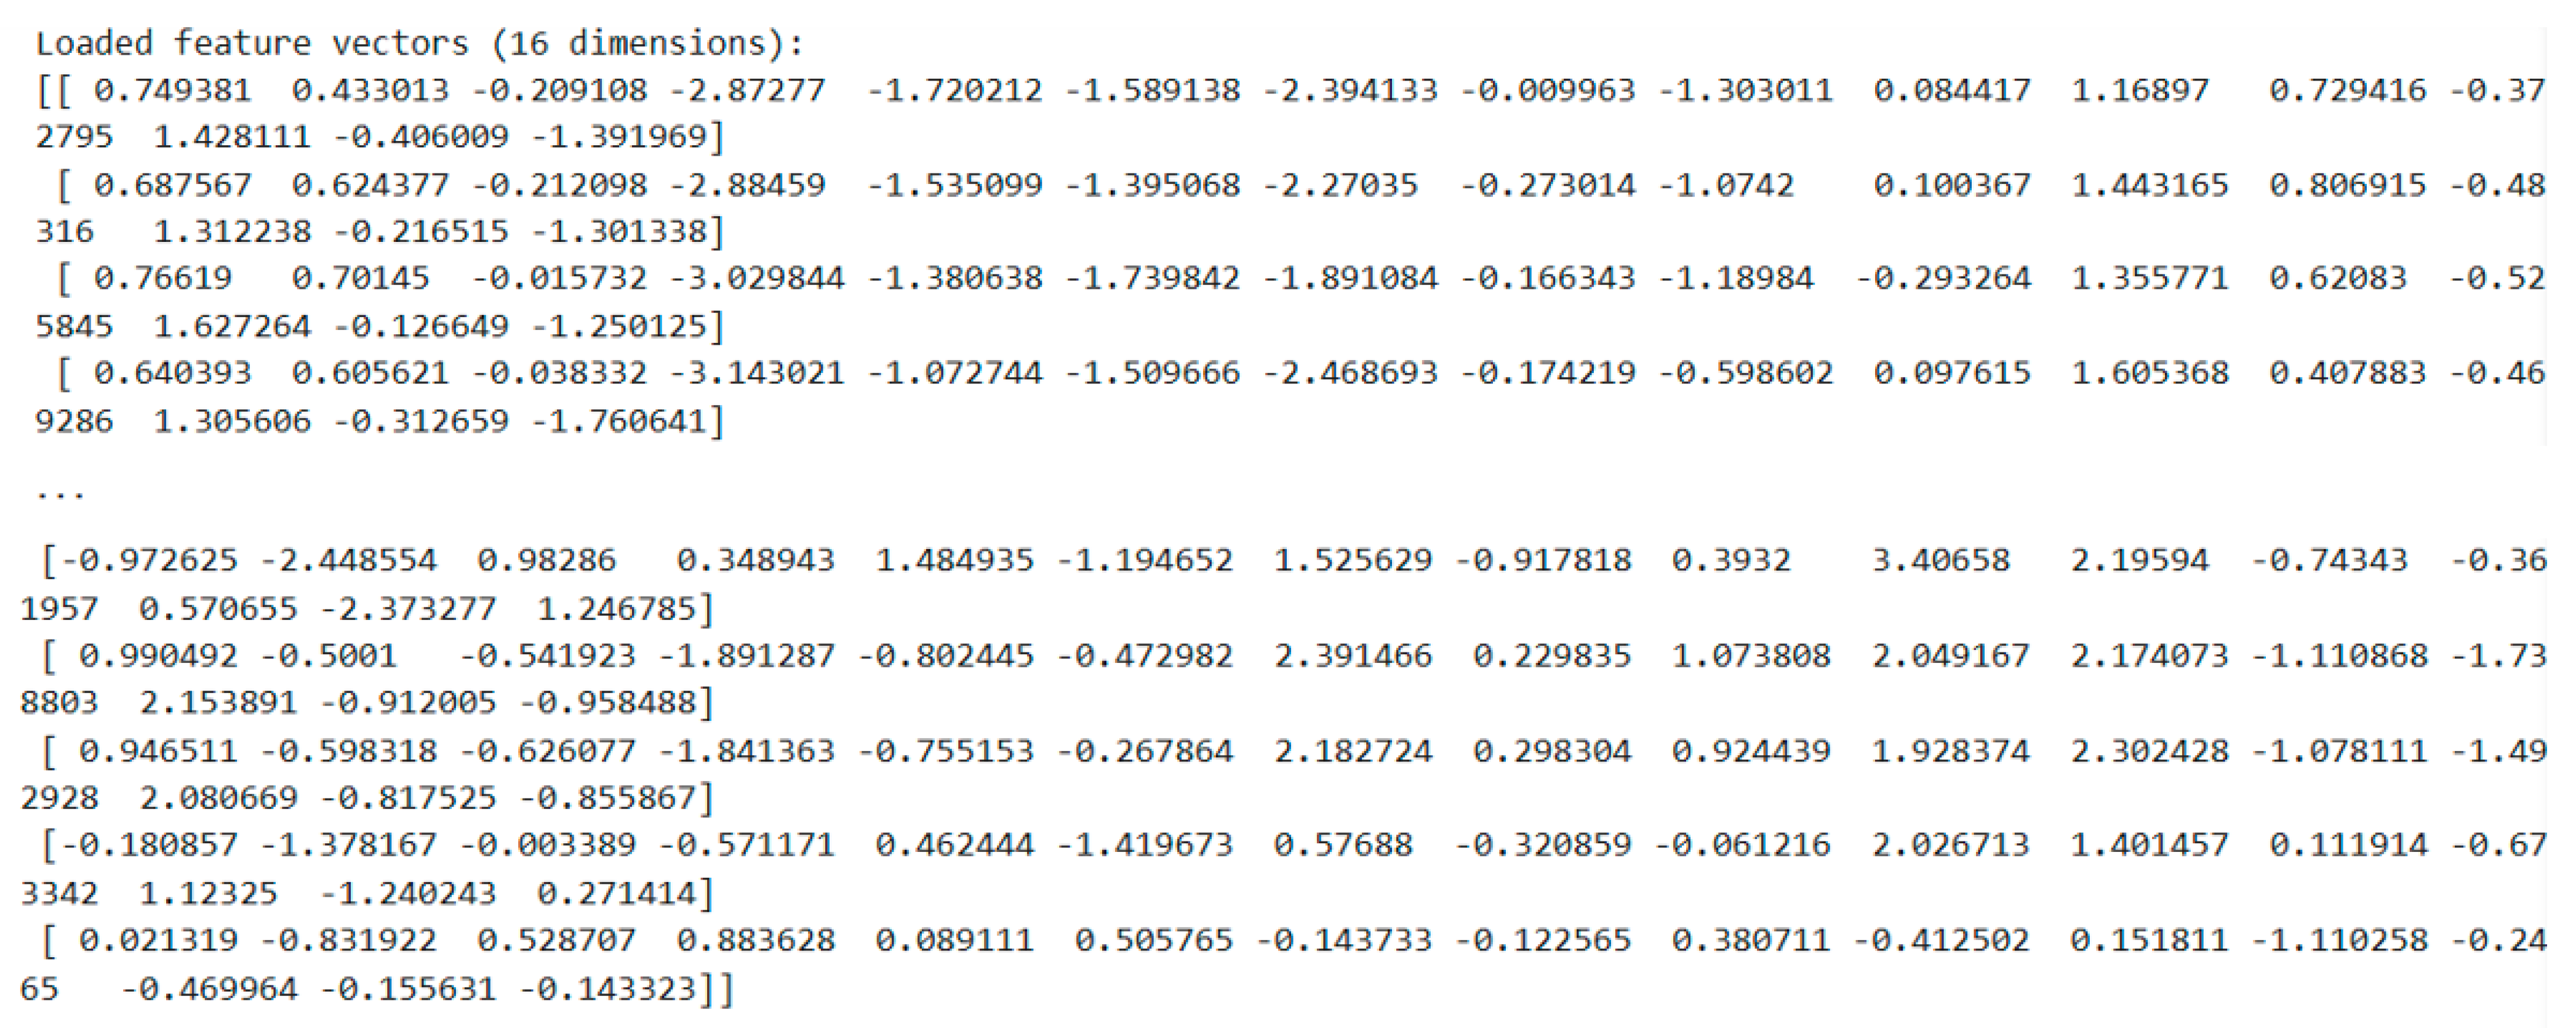
The basic objective of this research is to investigate what human clustering patterns are in view of space functions. In this paper, we present a methodology on human clustering based on space function data of human movement using graph embedding techniques. Human movement data were collected from Wi-Fi networks. Based on our previous efforts in geo-visualization of spatial occupancy on campus [
4], this work extends available research on human clustering based on the use of spatio-temporal similarities of trajectories to address human clustering based on space function similarities of stay points in movements. After the introduction in this section, we first describe the collection of human mobility data and space data with functions. Then, we present our methodology for building a network of human individuals, employ graph embedding algorithm Node2Vec to representation learning, and generate feature vectors of individual nodes of the graph. Afterwards, the clustering algorithm and the method to determine an optimal number of clusters are elaborated. In
Section 3, we present the results and conduct corresponding analysis of the clustering patterns in spaces under various scenarios. Then, discussions about our methodology and experimental results are extended. Conclusions and future research directions are summarized in the last section.
3. Results
After constructing the network, there are 2145 nodes and 1,411,634 edges with the 2 h duration, and the average and median degrees of the nodes are 1316 and 1480, respectively. Within the 4 h duration, there are 1867 nodes and 1085,636 edges, and the average and median degrees of the nodes are 1162 and 1359, respectively. Within the 24 h duration, there are 1144 nodes and 446,469 edges, and the average and median degrees of the nodes are 780 and 922, respectively. The numbers of nodes, together with the average and median node degrees, gradually decrease as the time duration increases (from 2 h to 4 h and 24 h). The numbers of edges among nodes in the network also decrease accordingly. The sizes of these networks basically agree with our common understanding that, in general, the number of individuals staying together for short periods is greater than the number of those staying together for longer periods while engaging in social activities or at particular places.
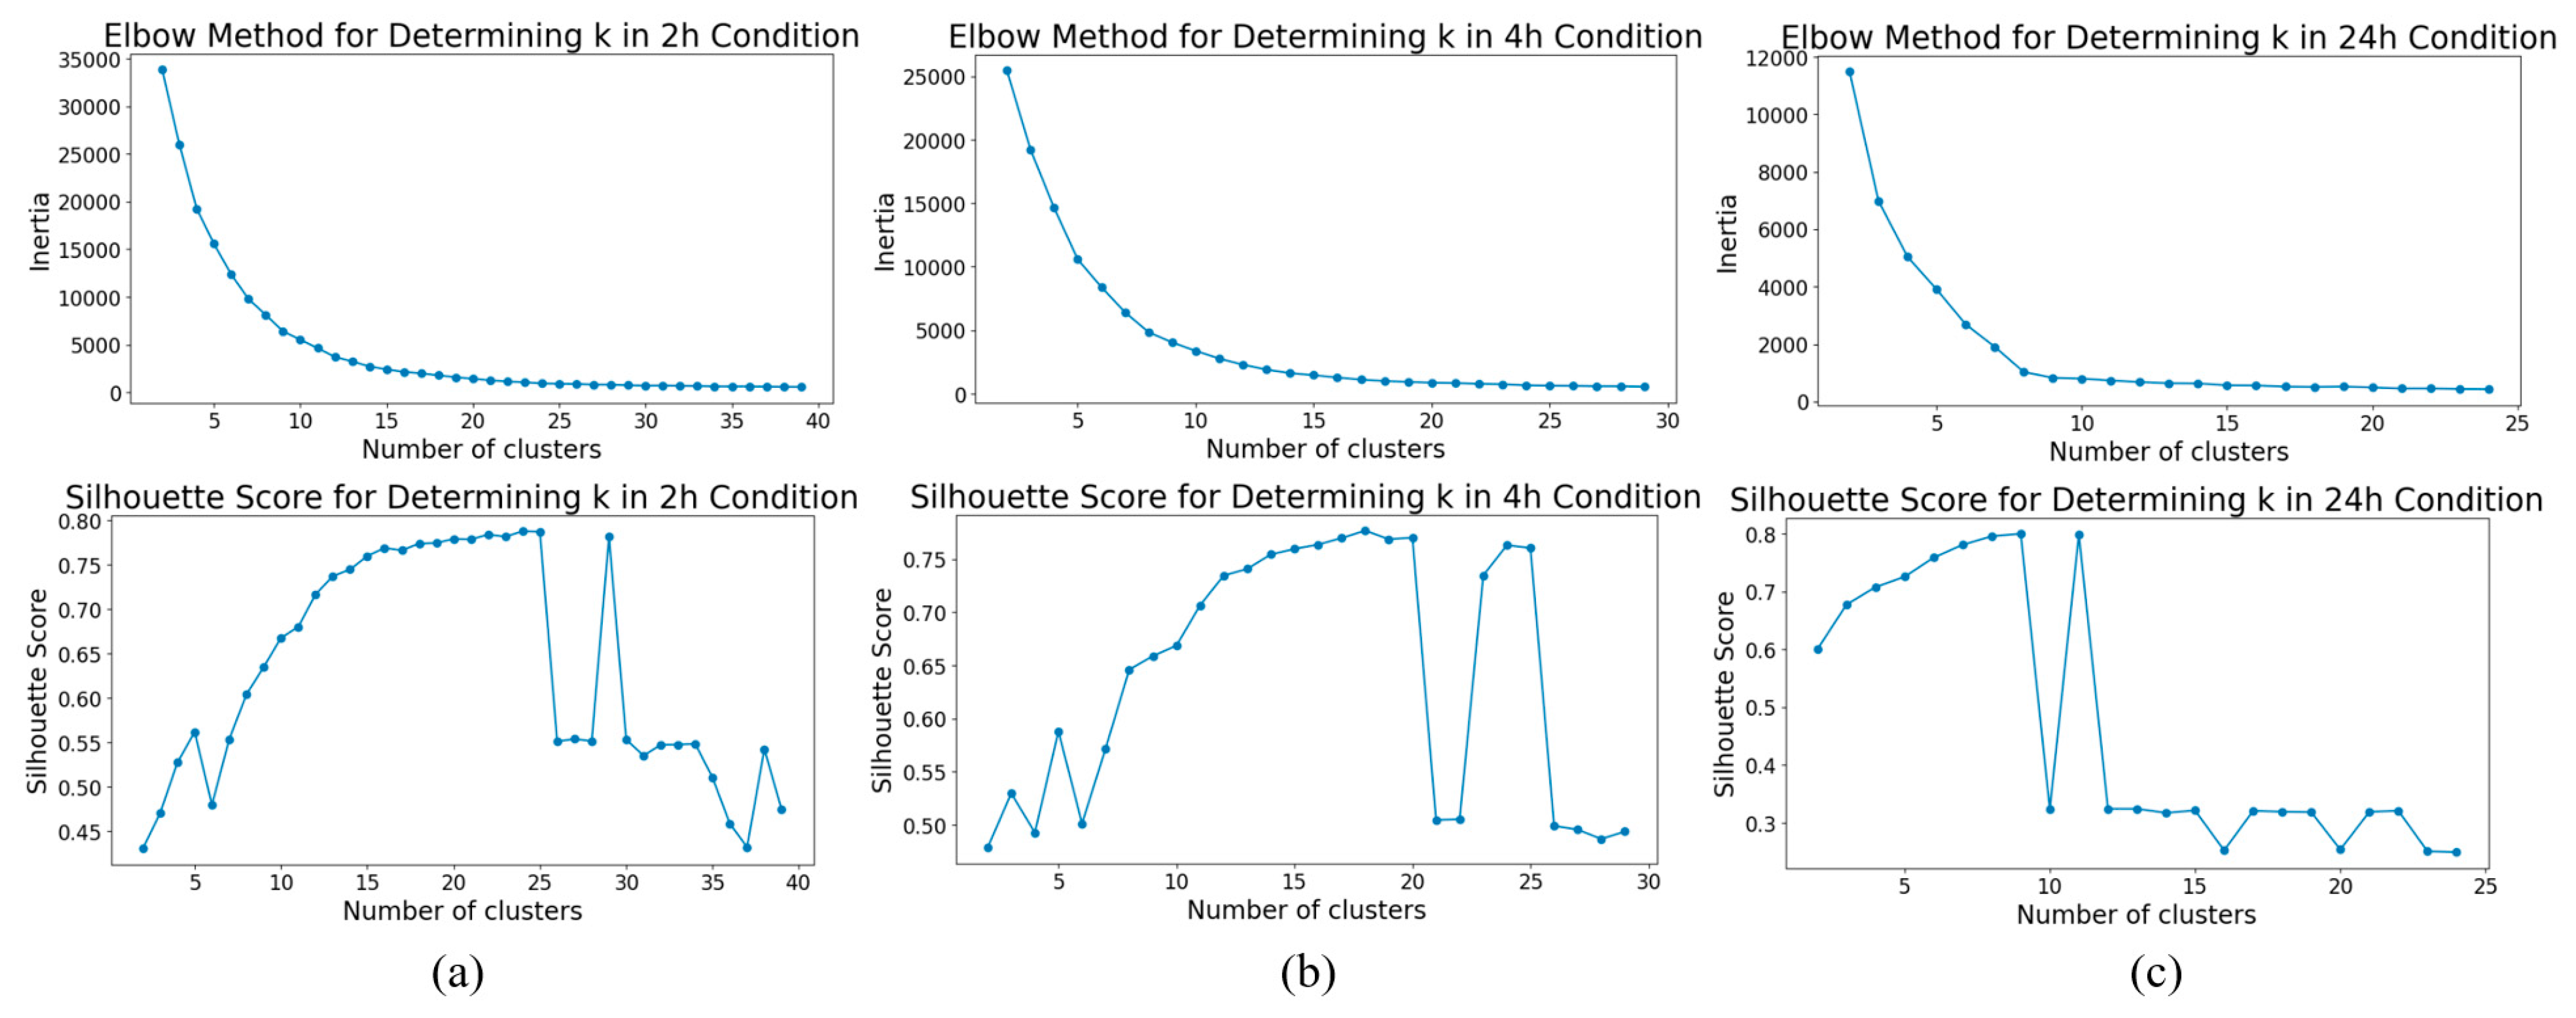
The top row of
Figure 5 below show the changes in inertia values against different clustering numbers for the 2 h, 4 h, and 24 h scenarios, from left to right. The three figures in the bottom row show the changes in silhouette score. It can be observed that the suitable number of clusters for the 2 h duration is 24, and that for the 4 h scenario is 18, while for the 24 h scenario, the suitable number is 9.
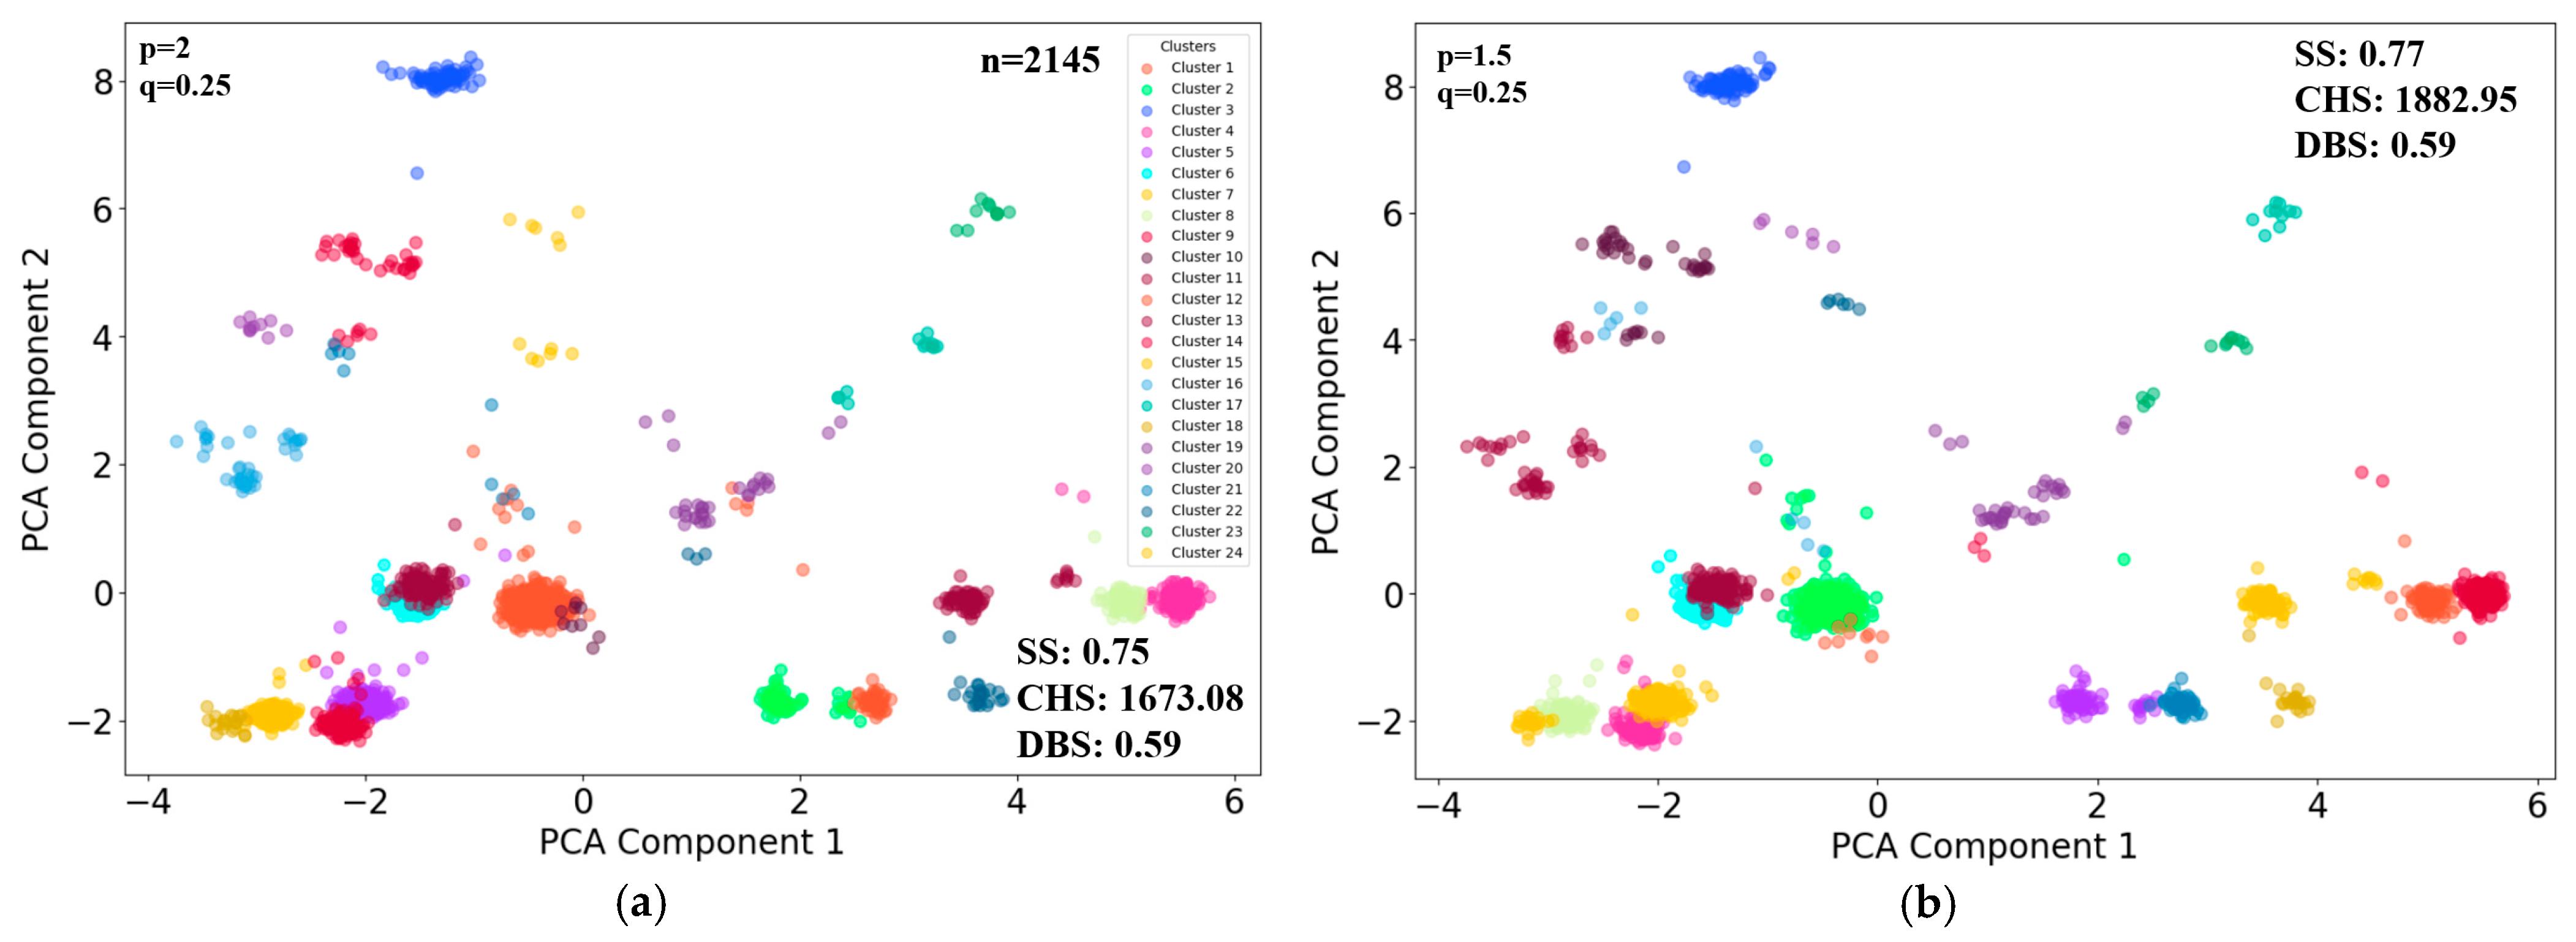
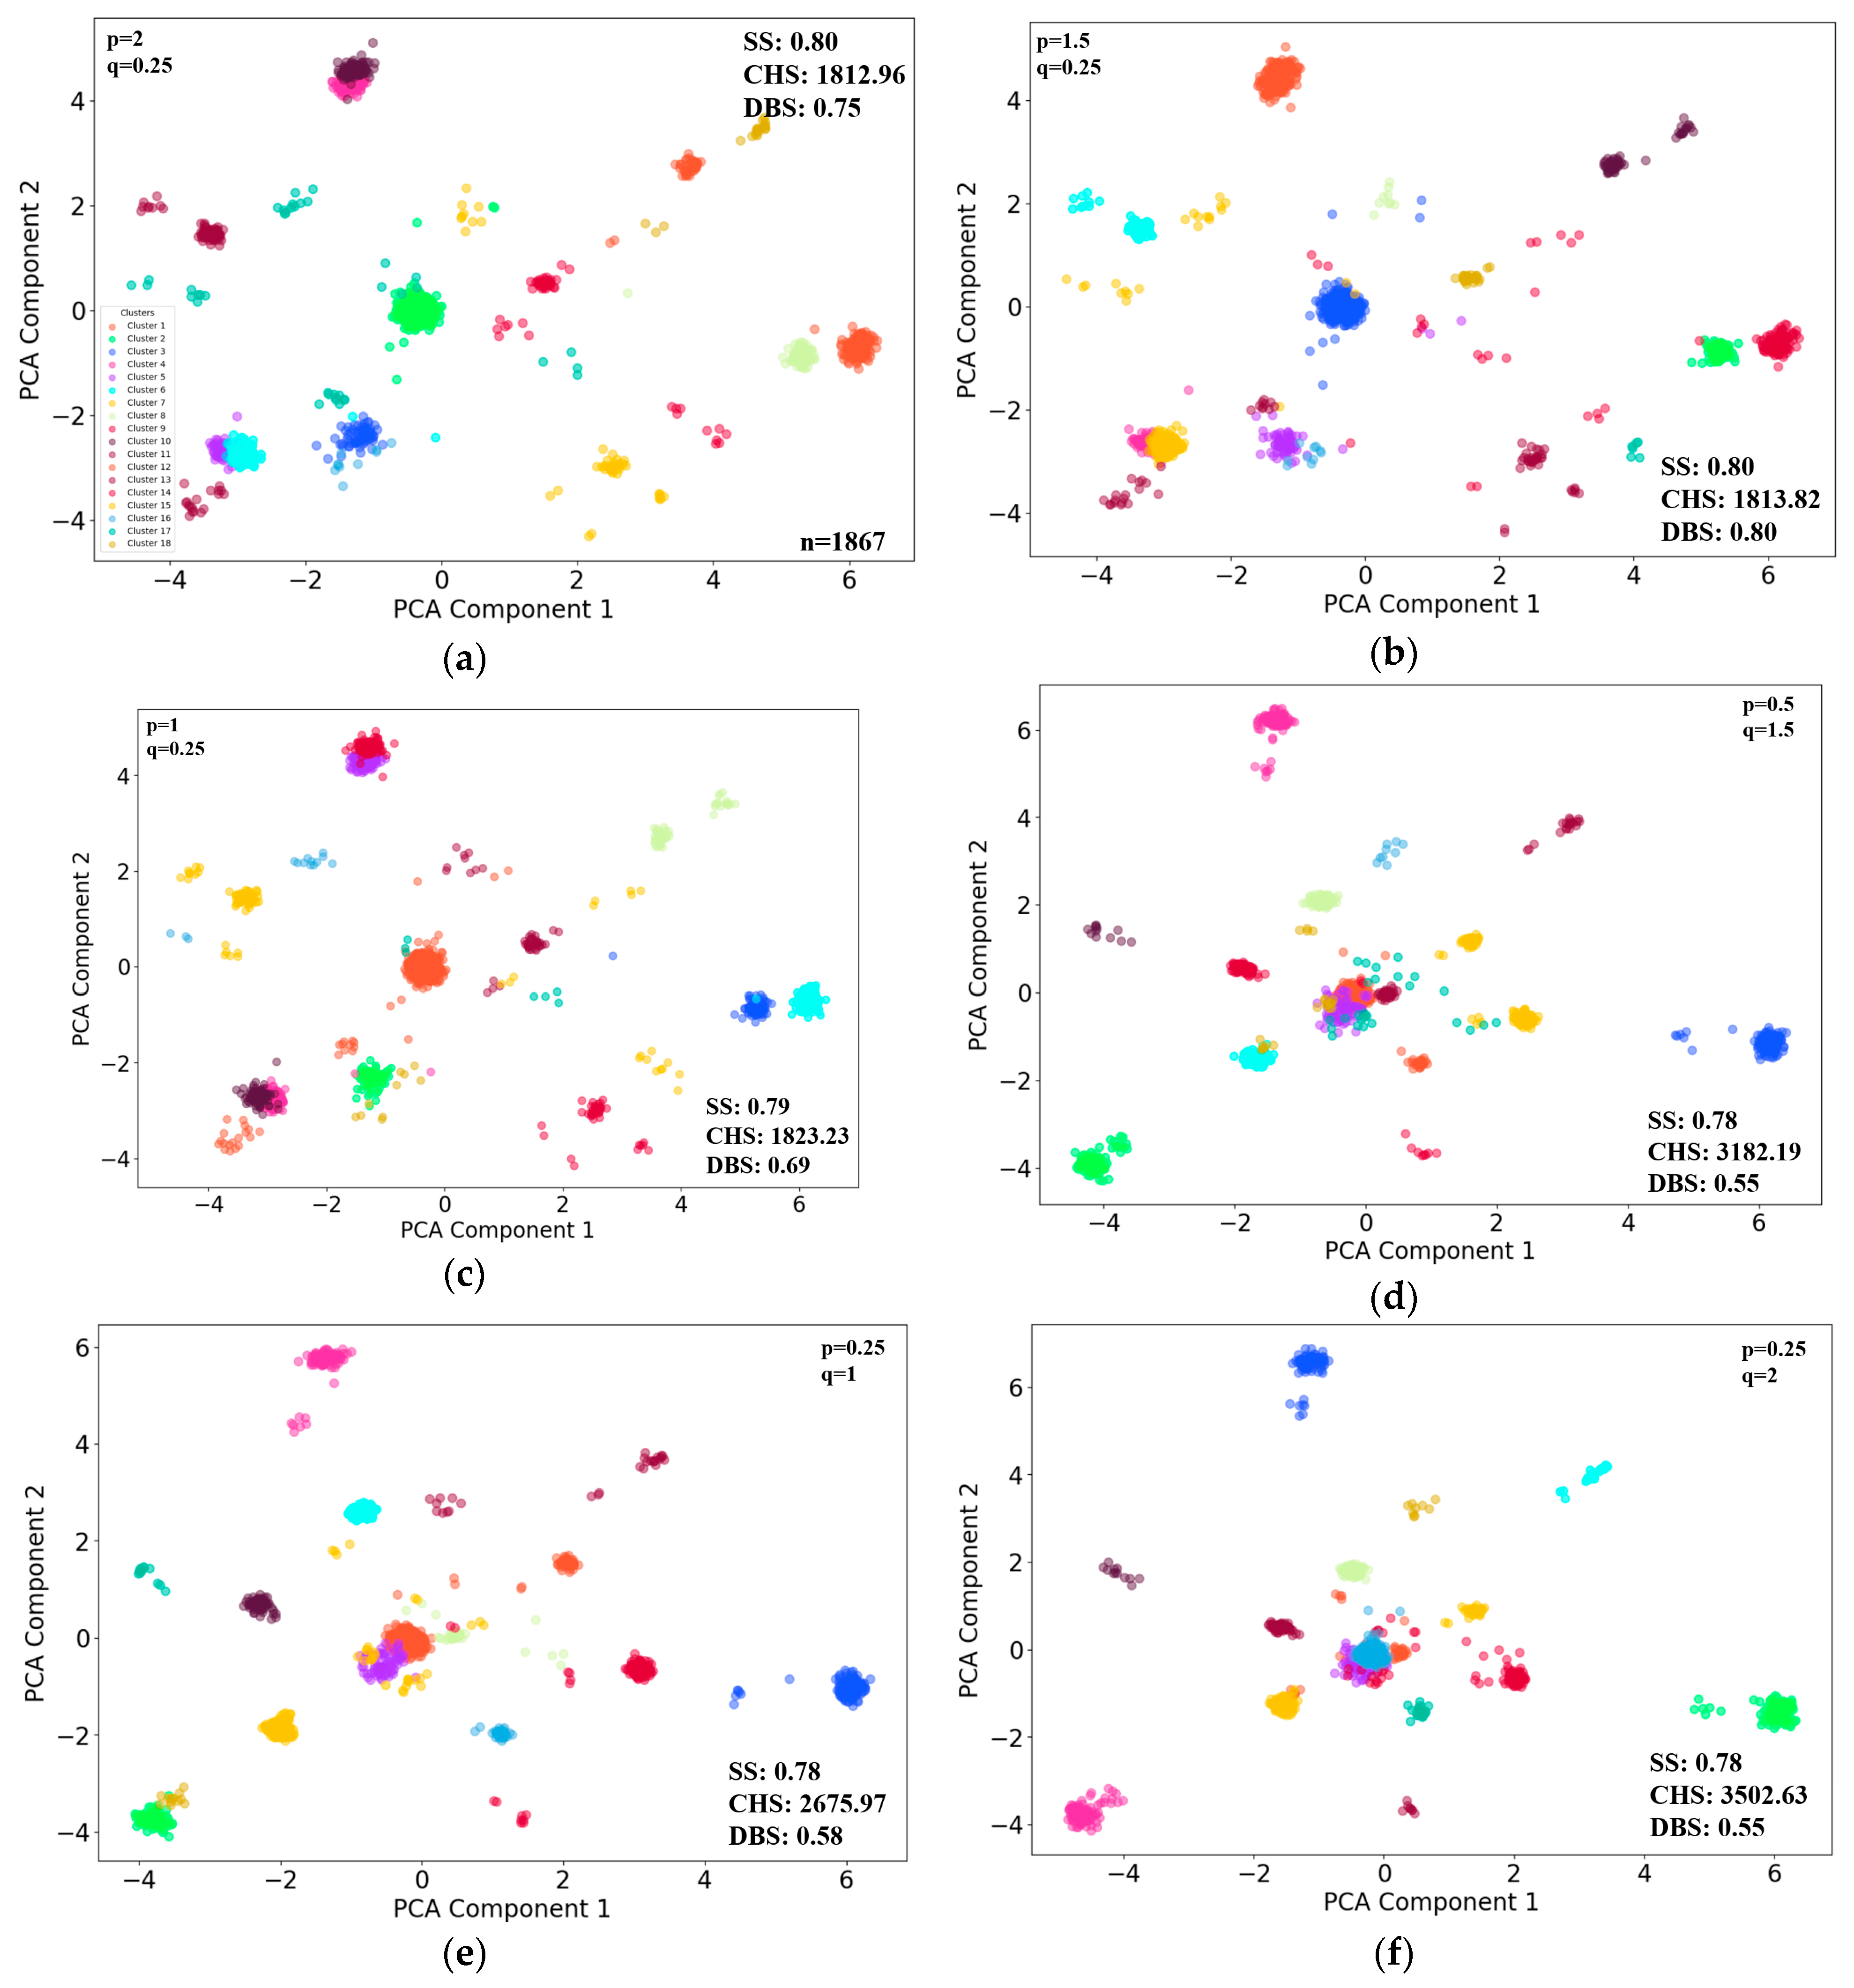
3.1. Individuals K-Means Clustering in 2 Hours
The individuals were grouped into 24 clusters based on their feature vectors withing 2 h scenarios. Six sets of typical p and q parameters [
27] were selected, considering the cluster evaluation performances of CHS and DBS, with the first three random walk strategies biased towards DFS and the last three towards BFS. The analysis explores how these biases and parameter combinations impact the clustering results, which can reveal distinct groupings that indicate diverse behavioral patterns among the individuals (
Figure 5). To better visually represent clustering results, principal component analysis (PCA) was used to reduce the number of feature vectors. The subfigures (a) to (f) in
Figure 6 correspond to different combinations of
p and
q, respectively.
Figure 6 shows the clustering results, using the first two major components as horizontal and vertical axes.
In this scenario, the clustering result in
Figure 6f presents the best overall metrics (
p = 0.25,
q = 2).
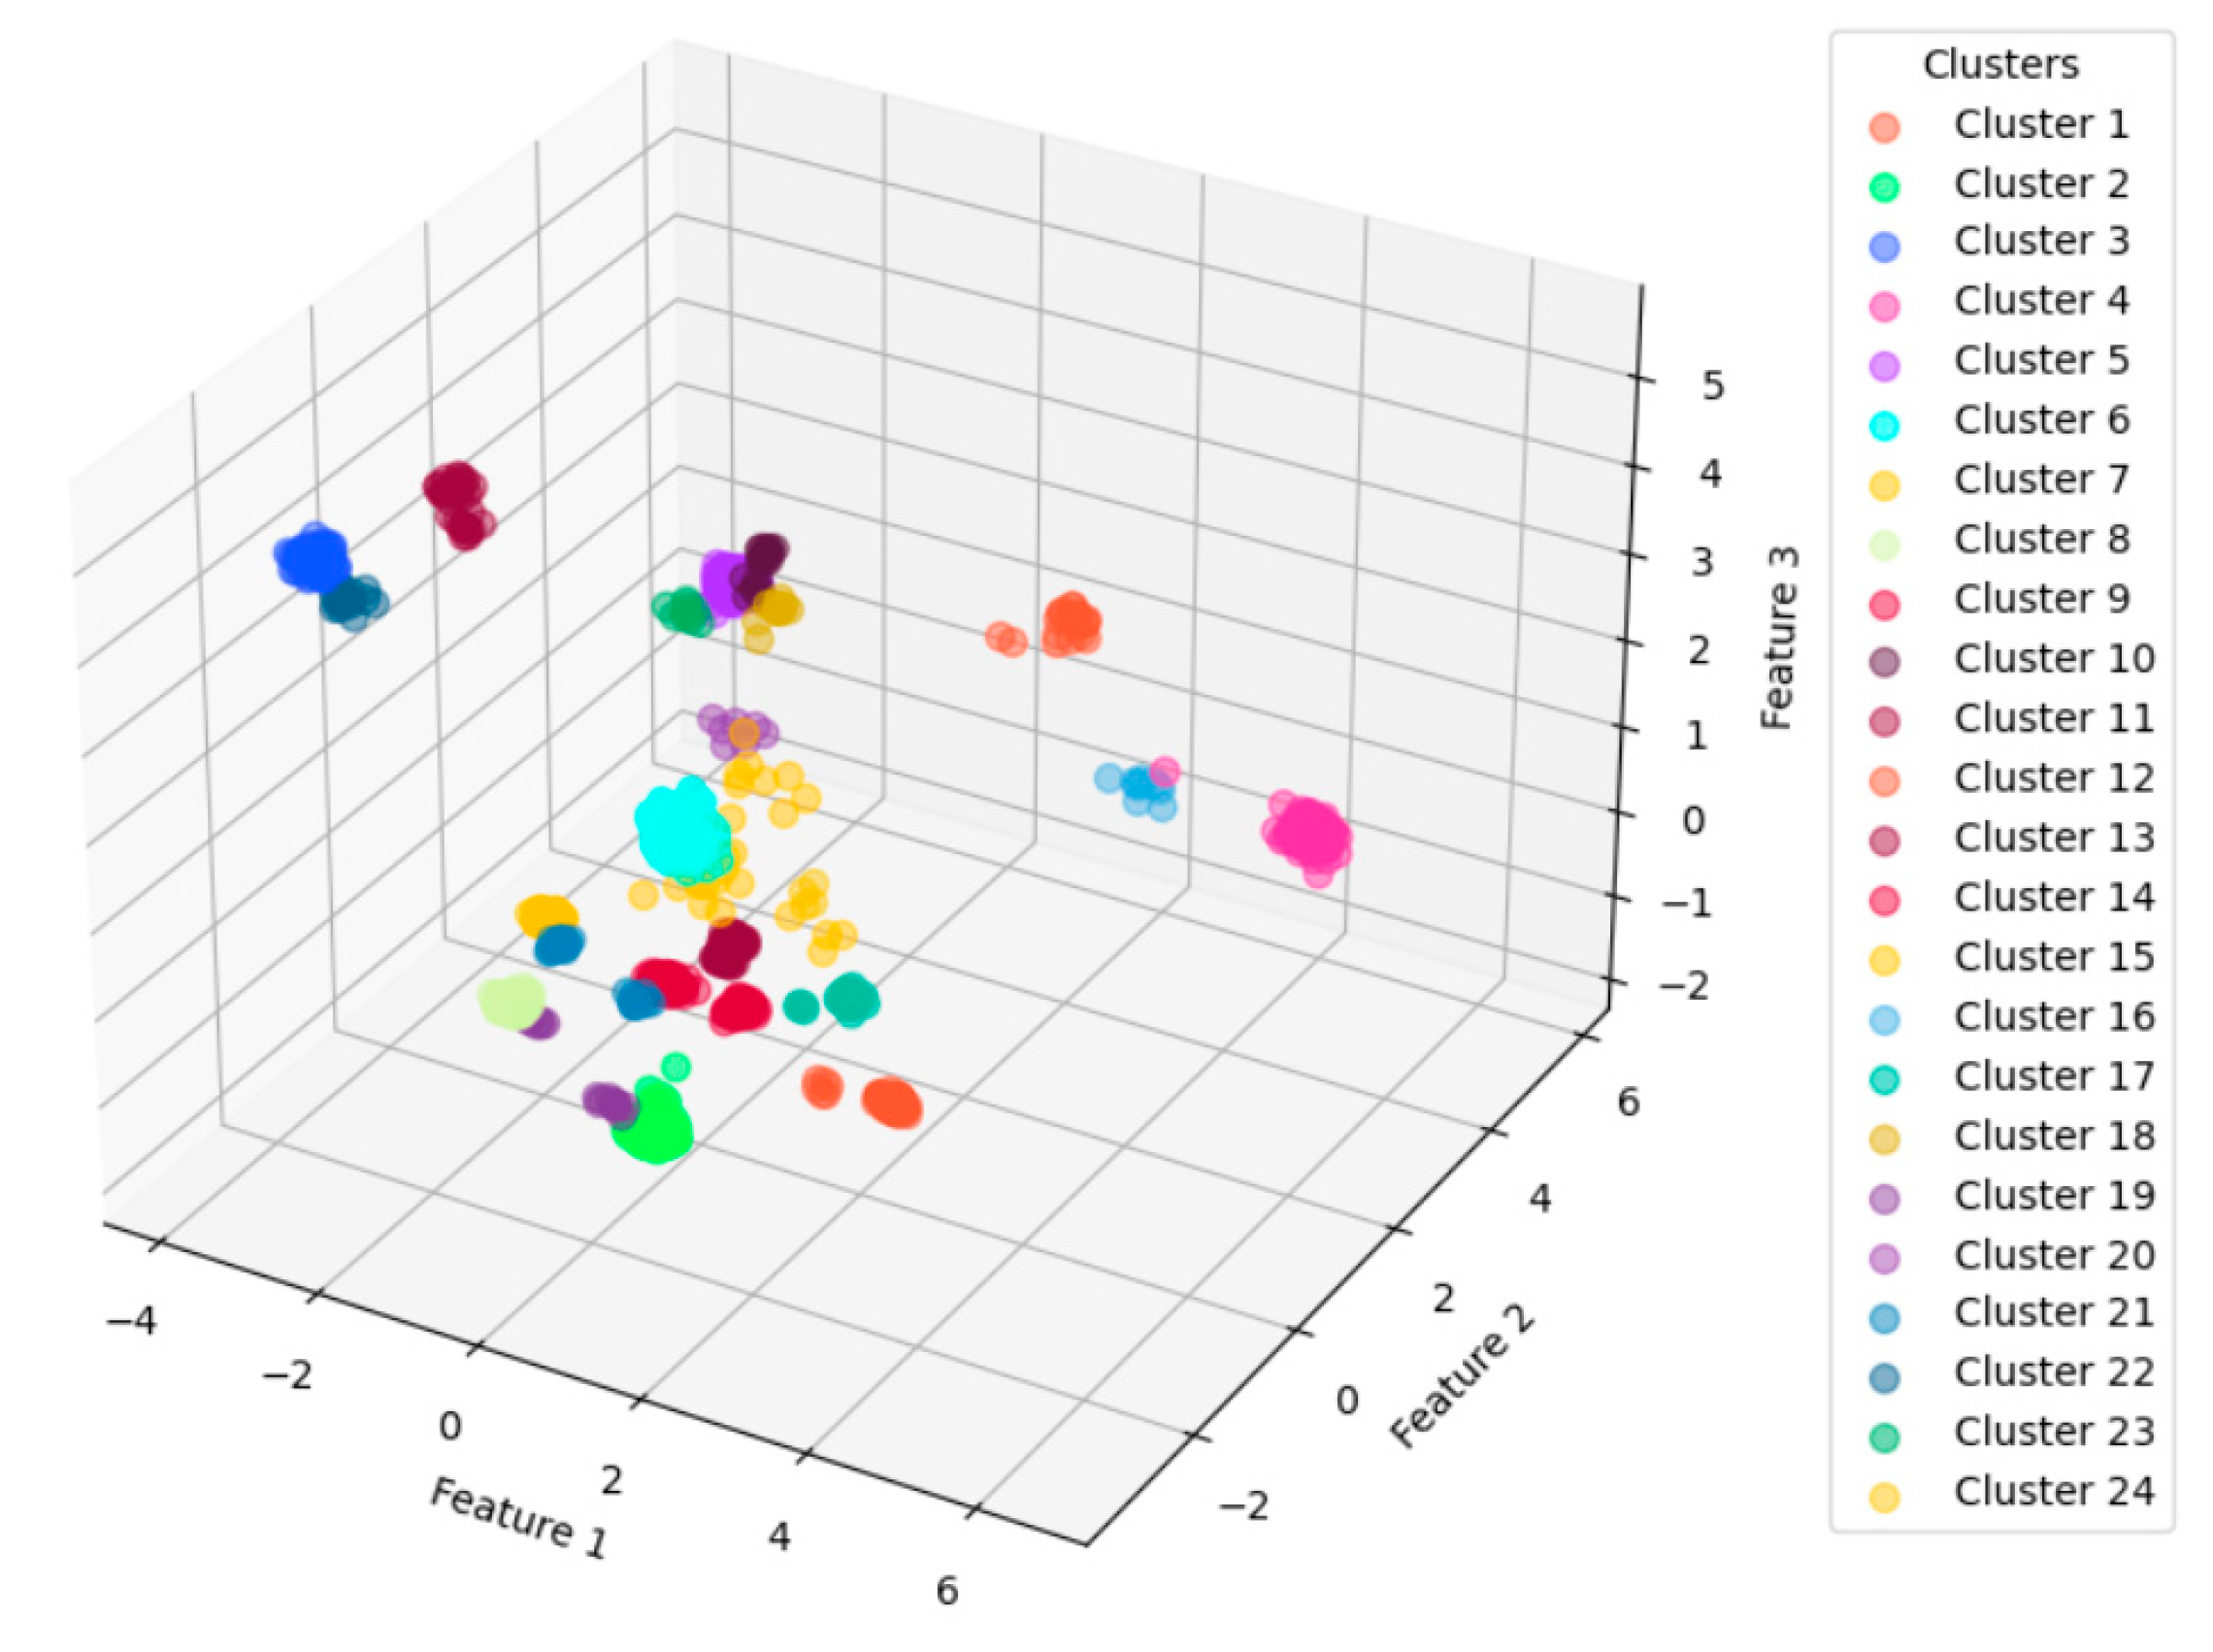
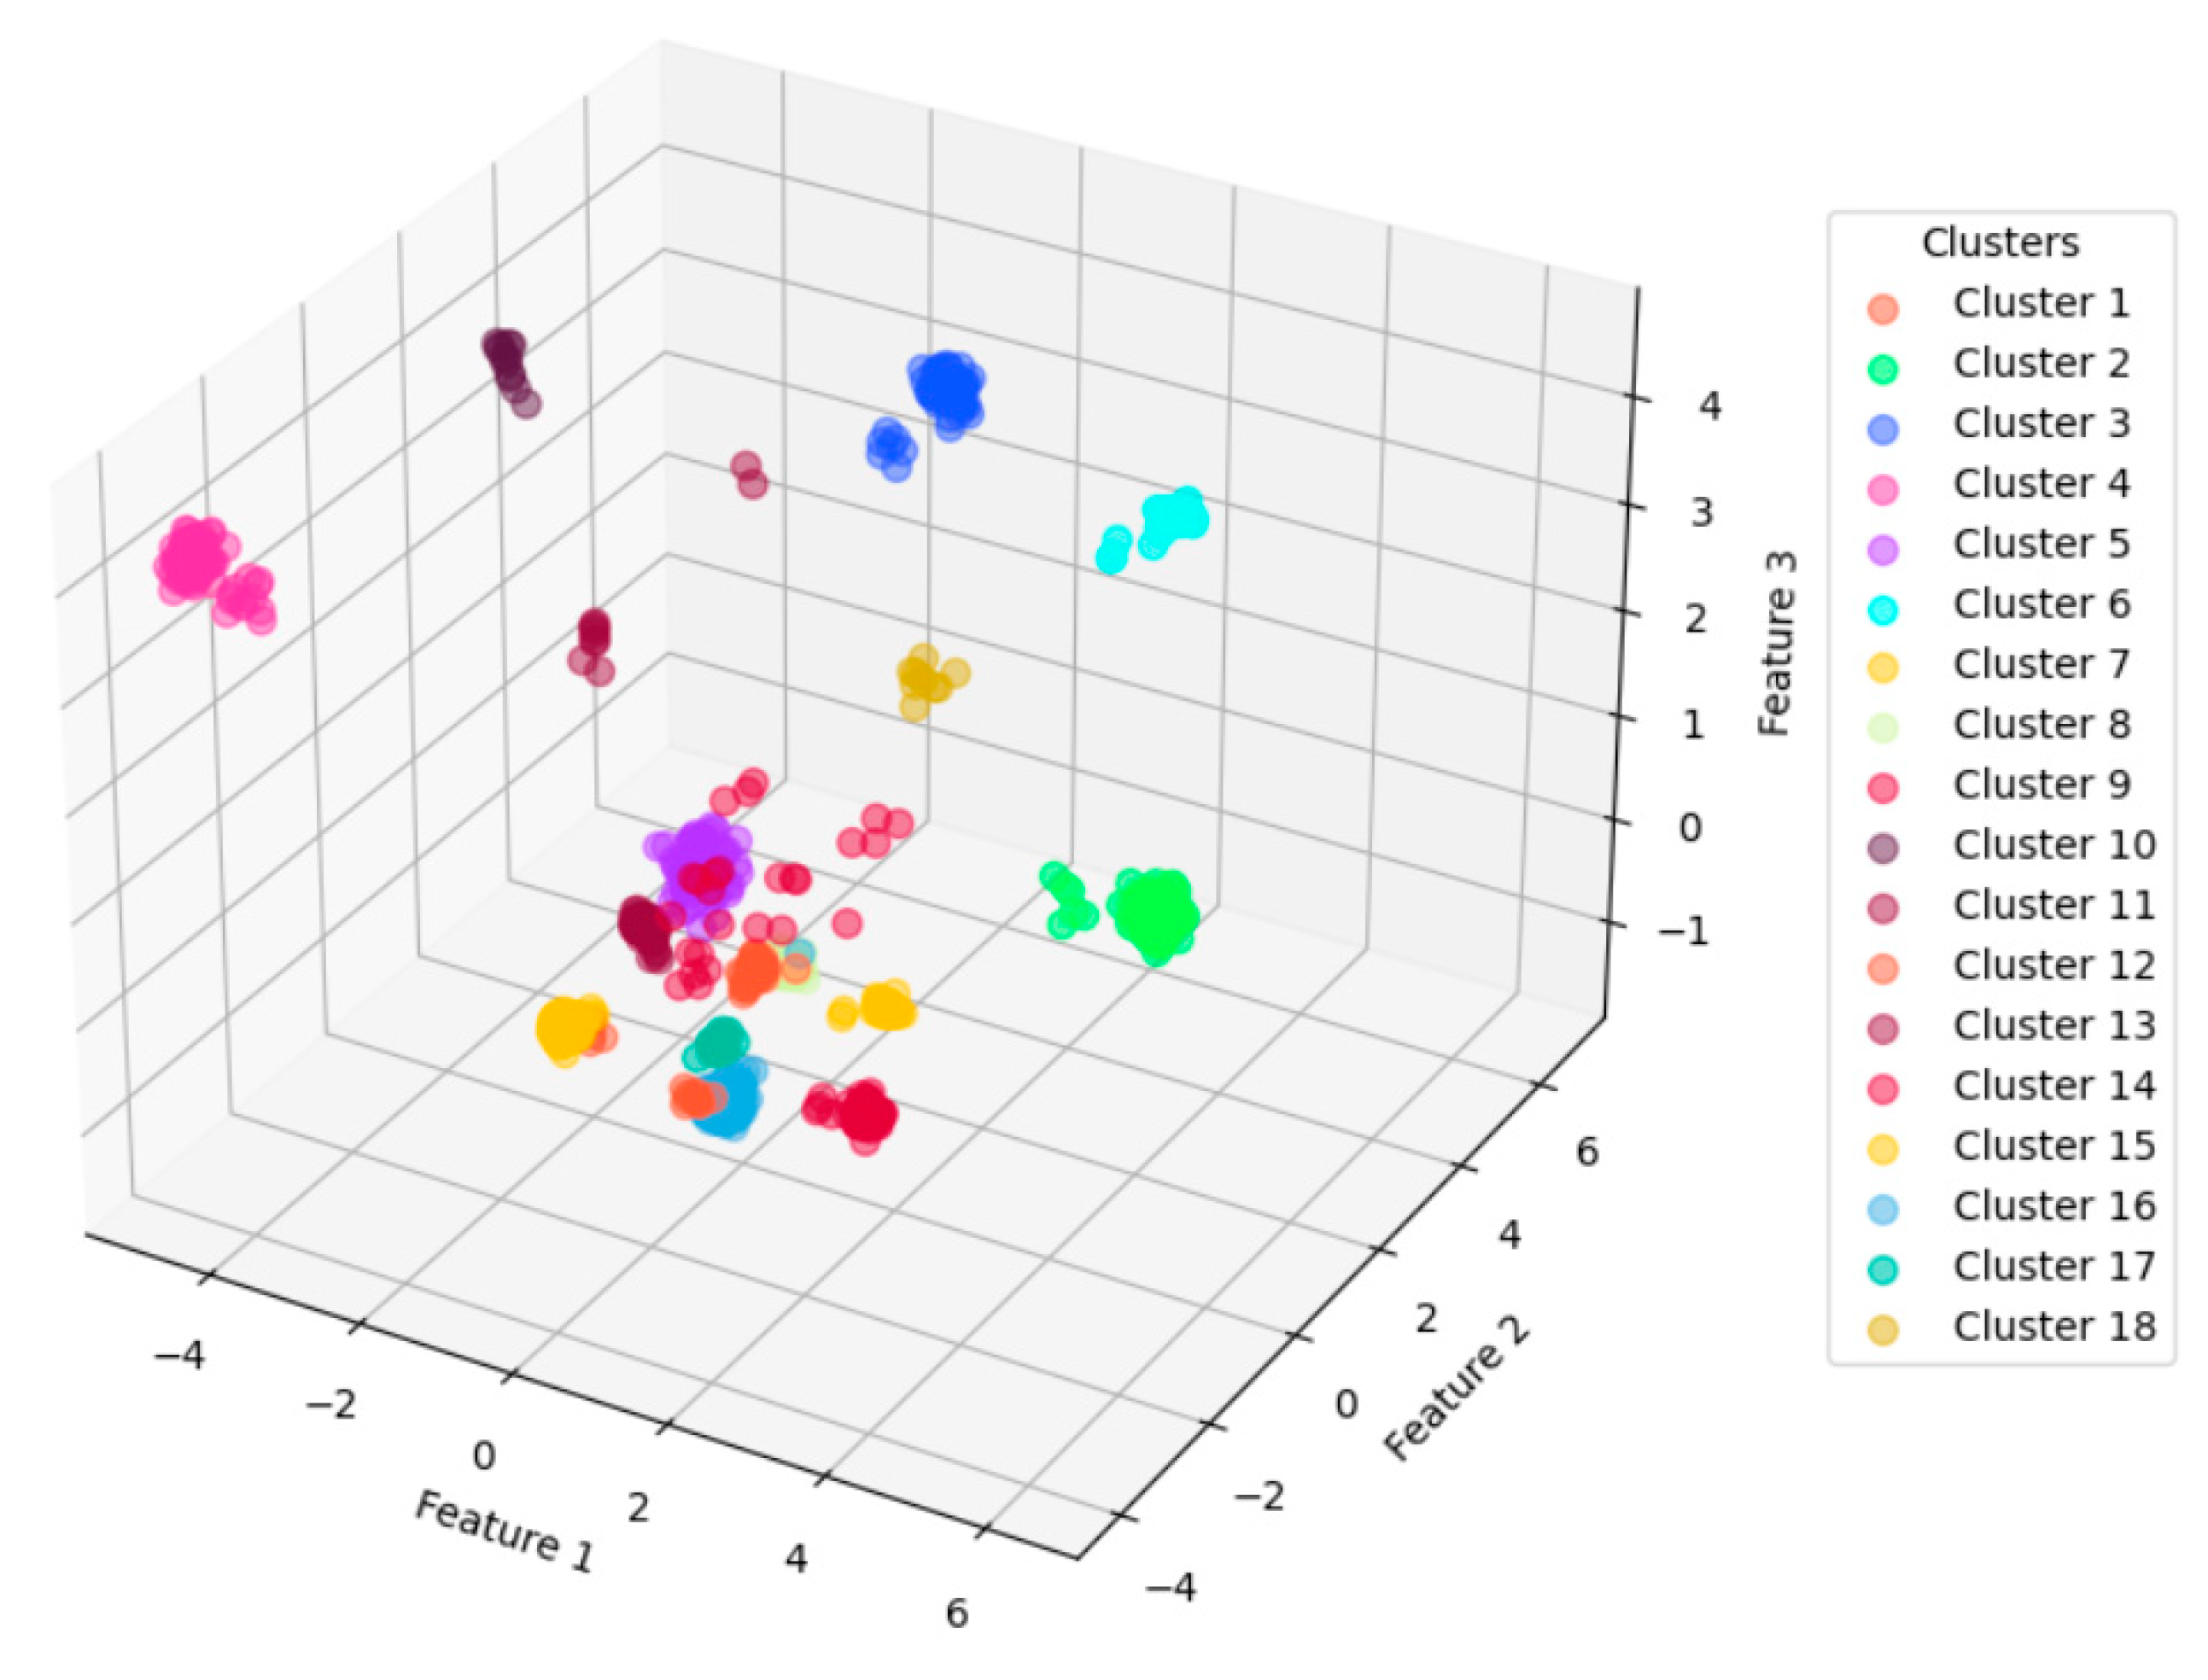
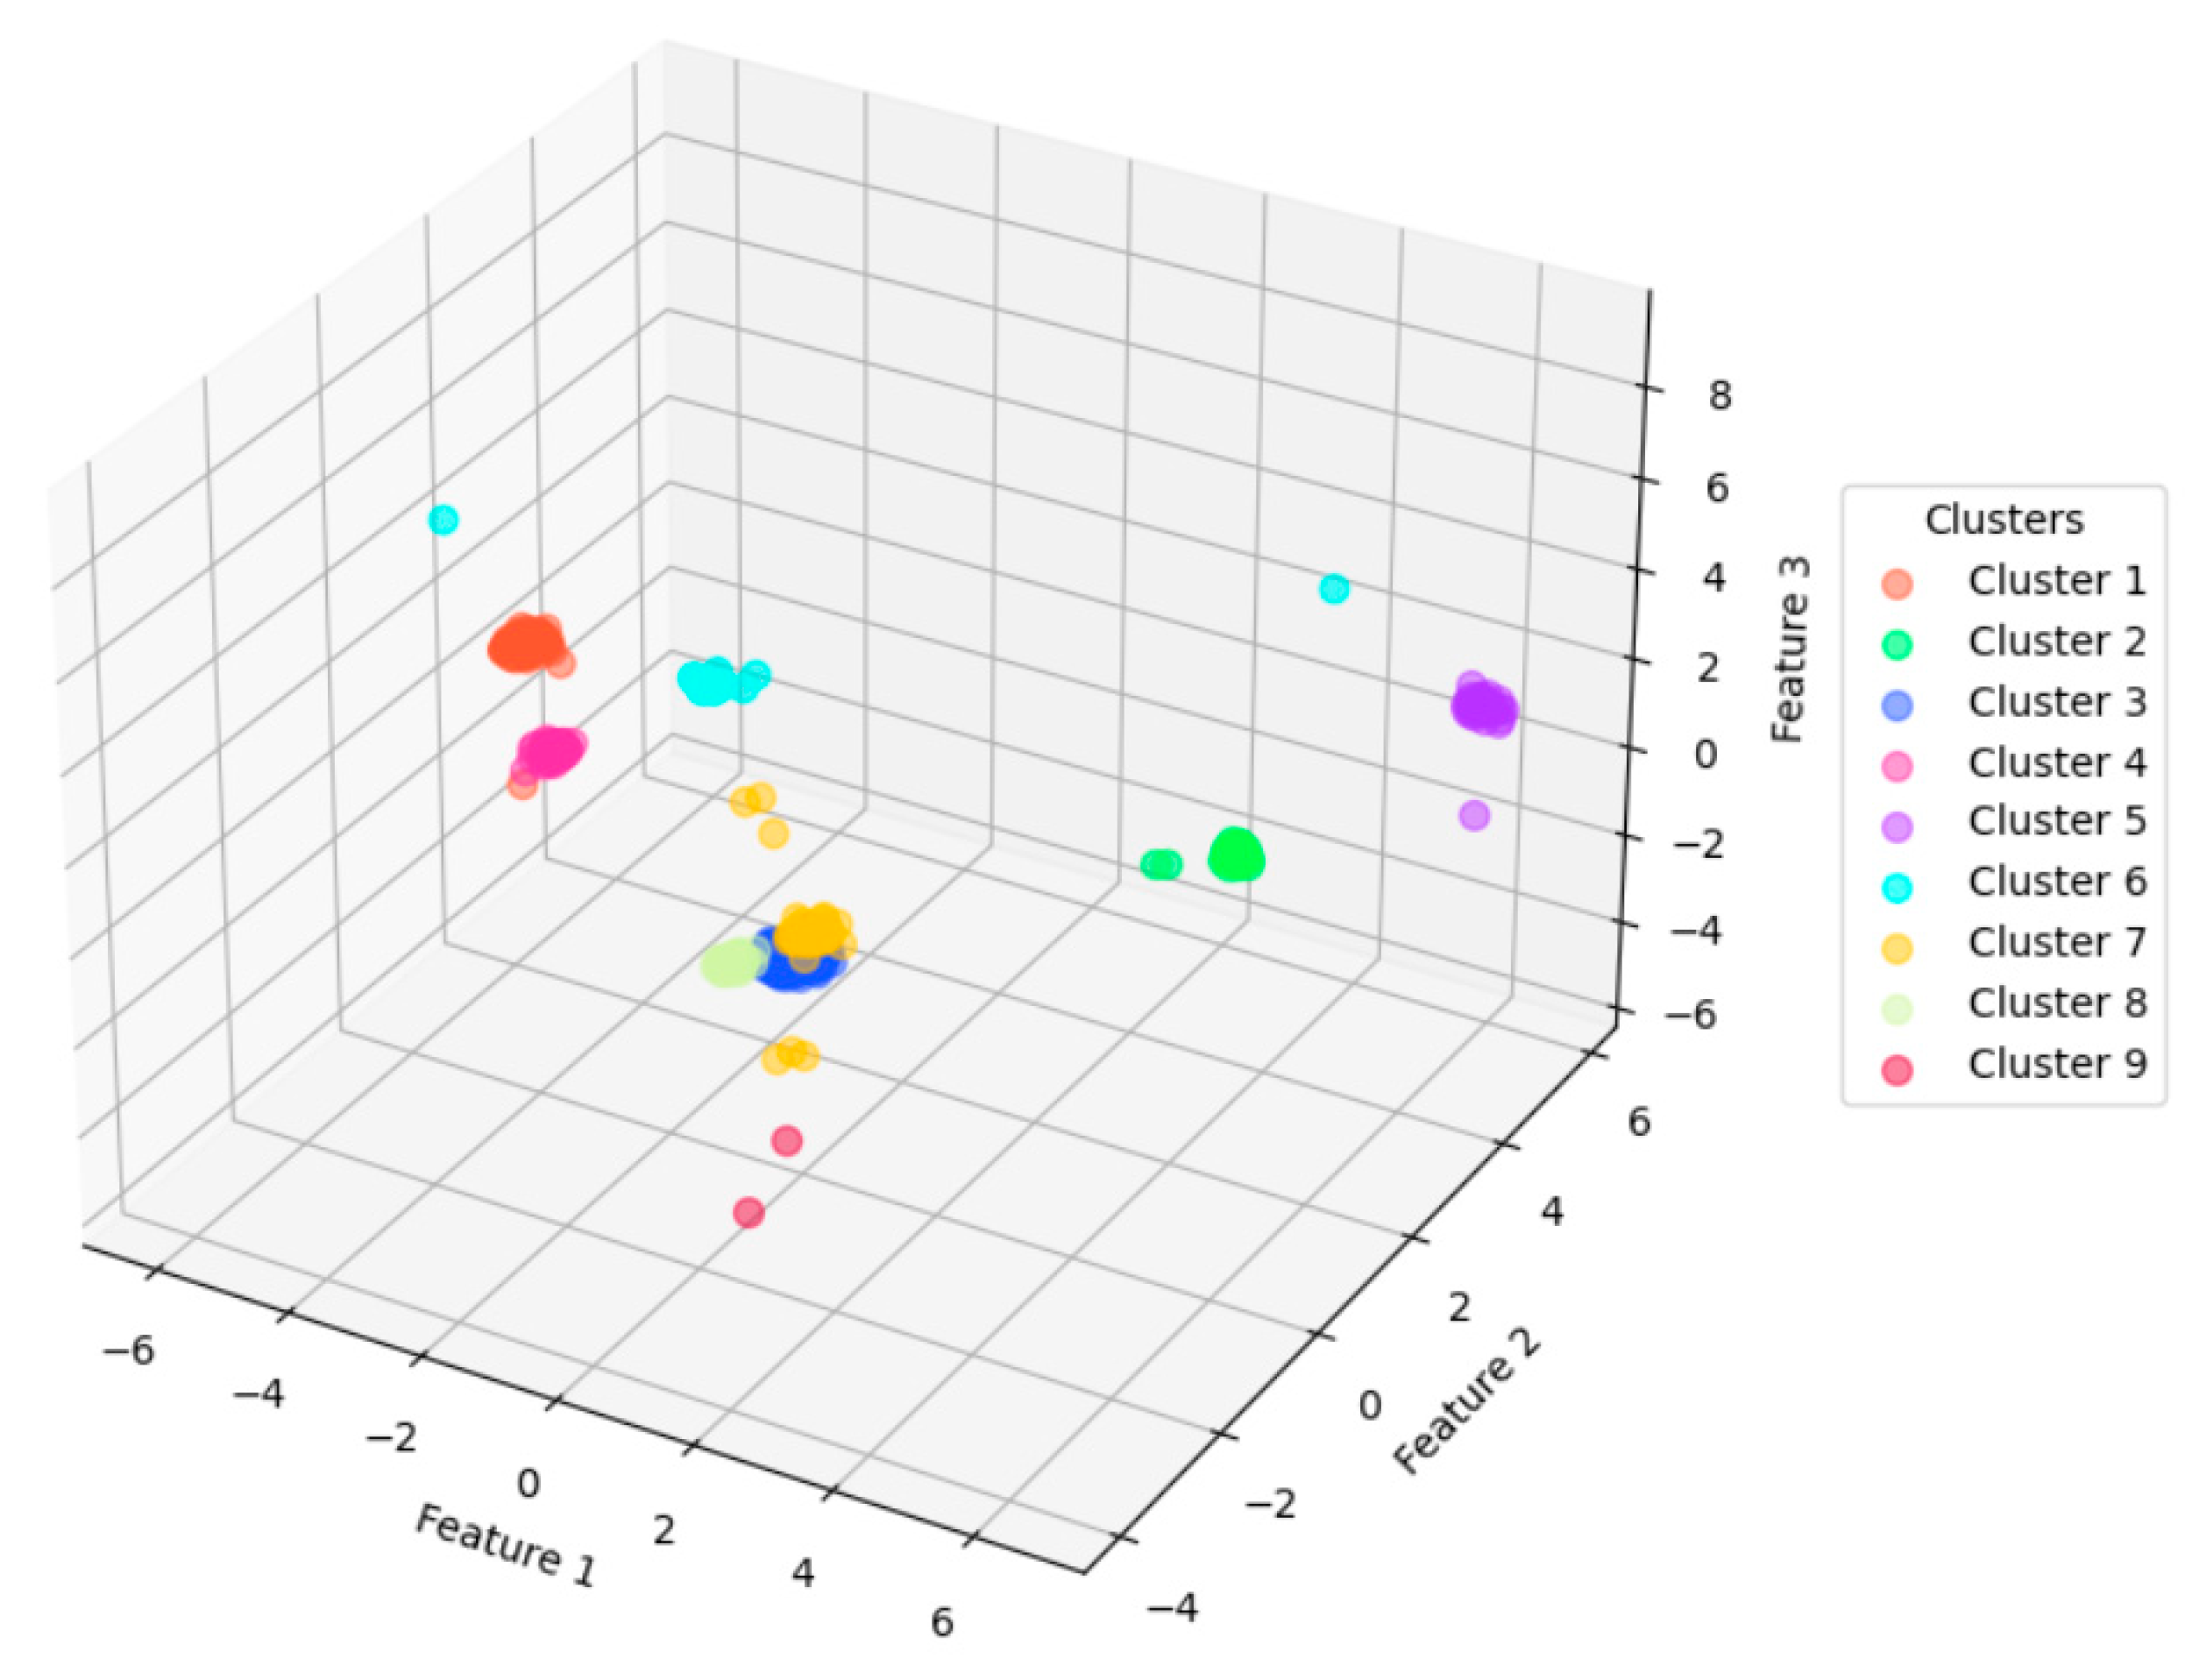
Figure 7 shows a 3D visualization of the clustering result with these parameters settings, using the first three major components after PCA processing of the feature vectors.
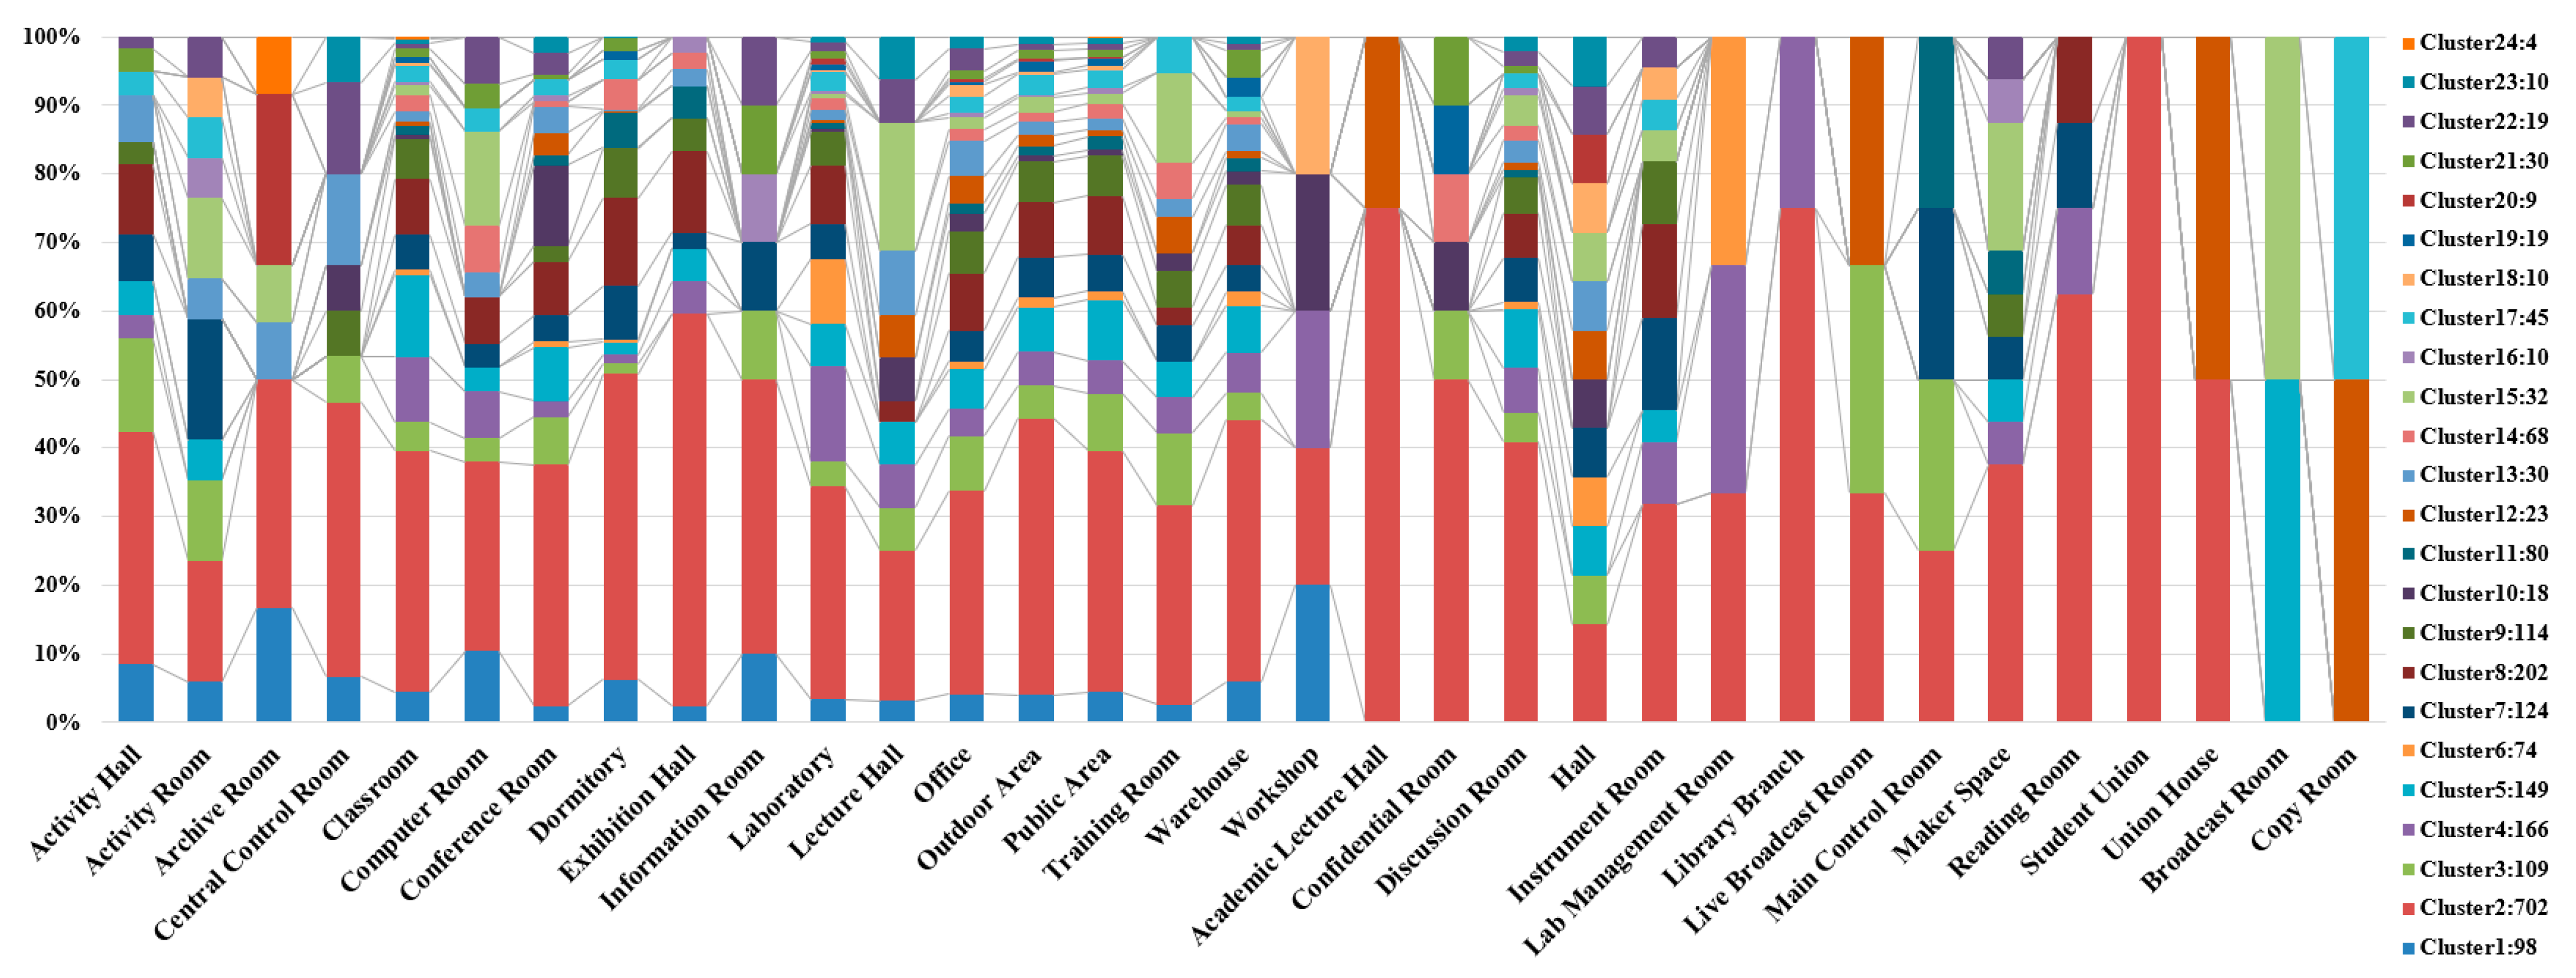
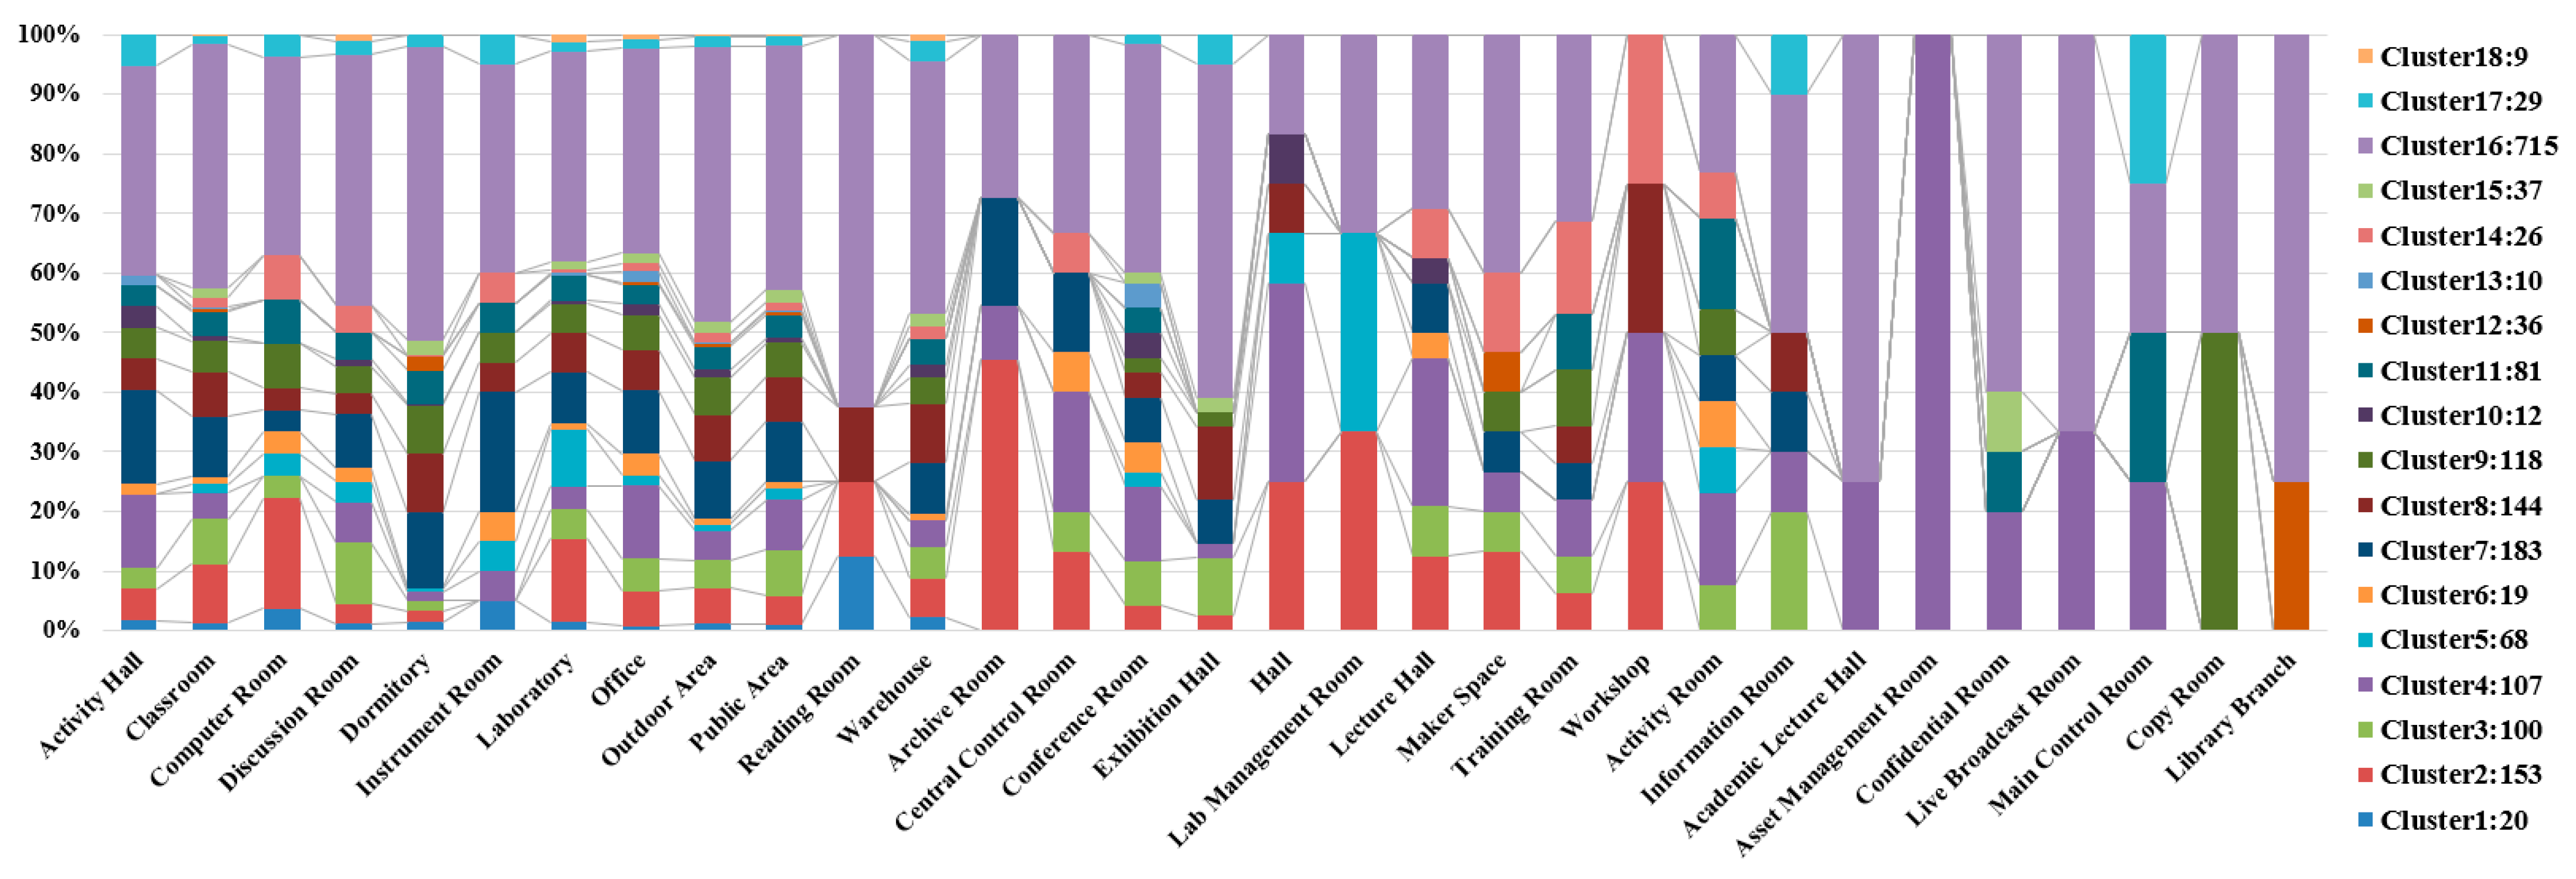
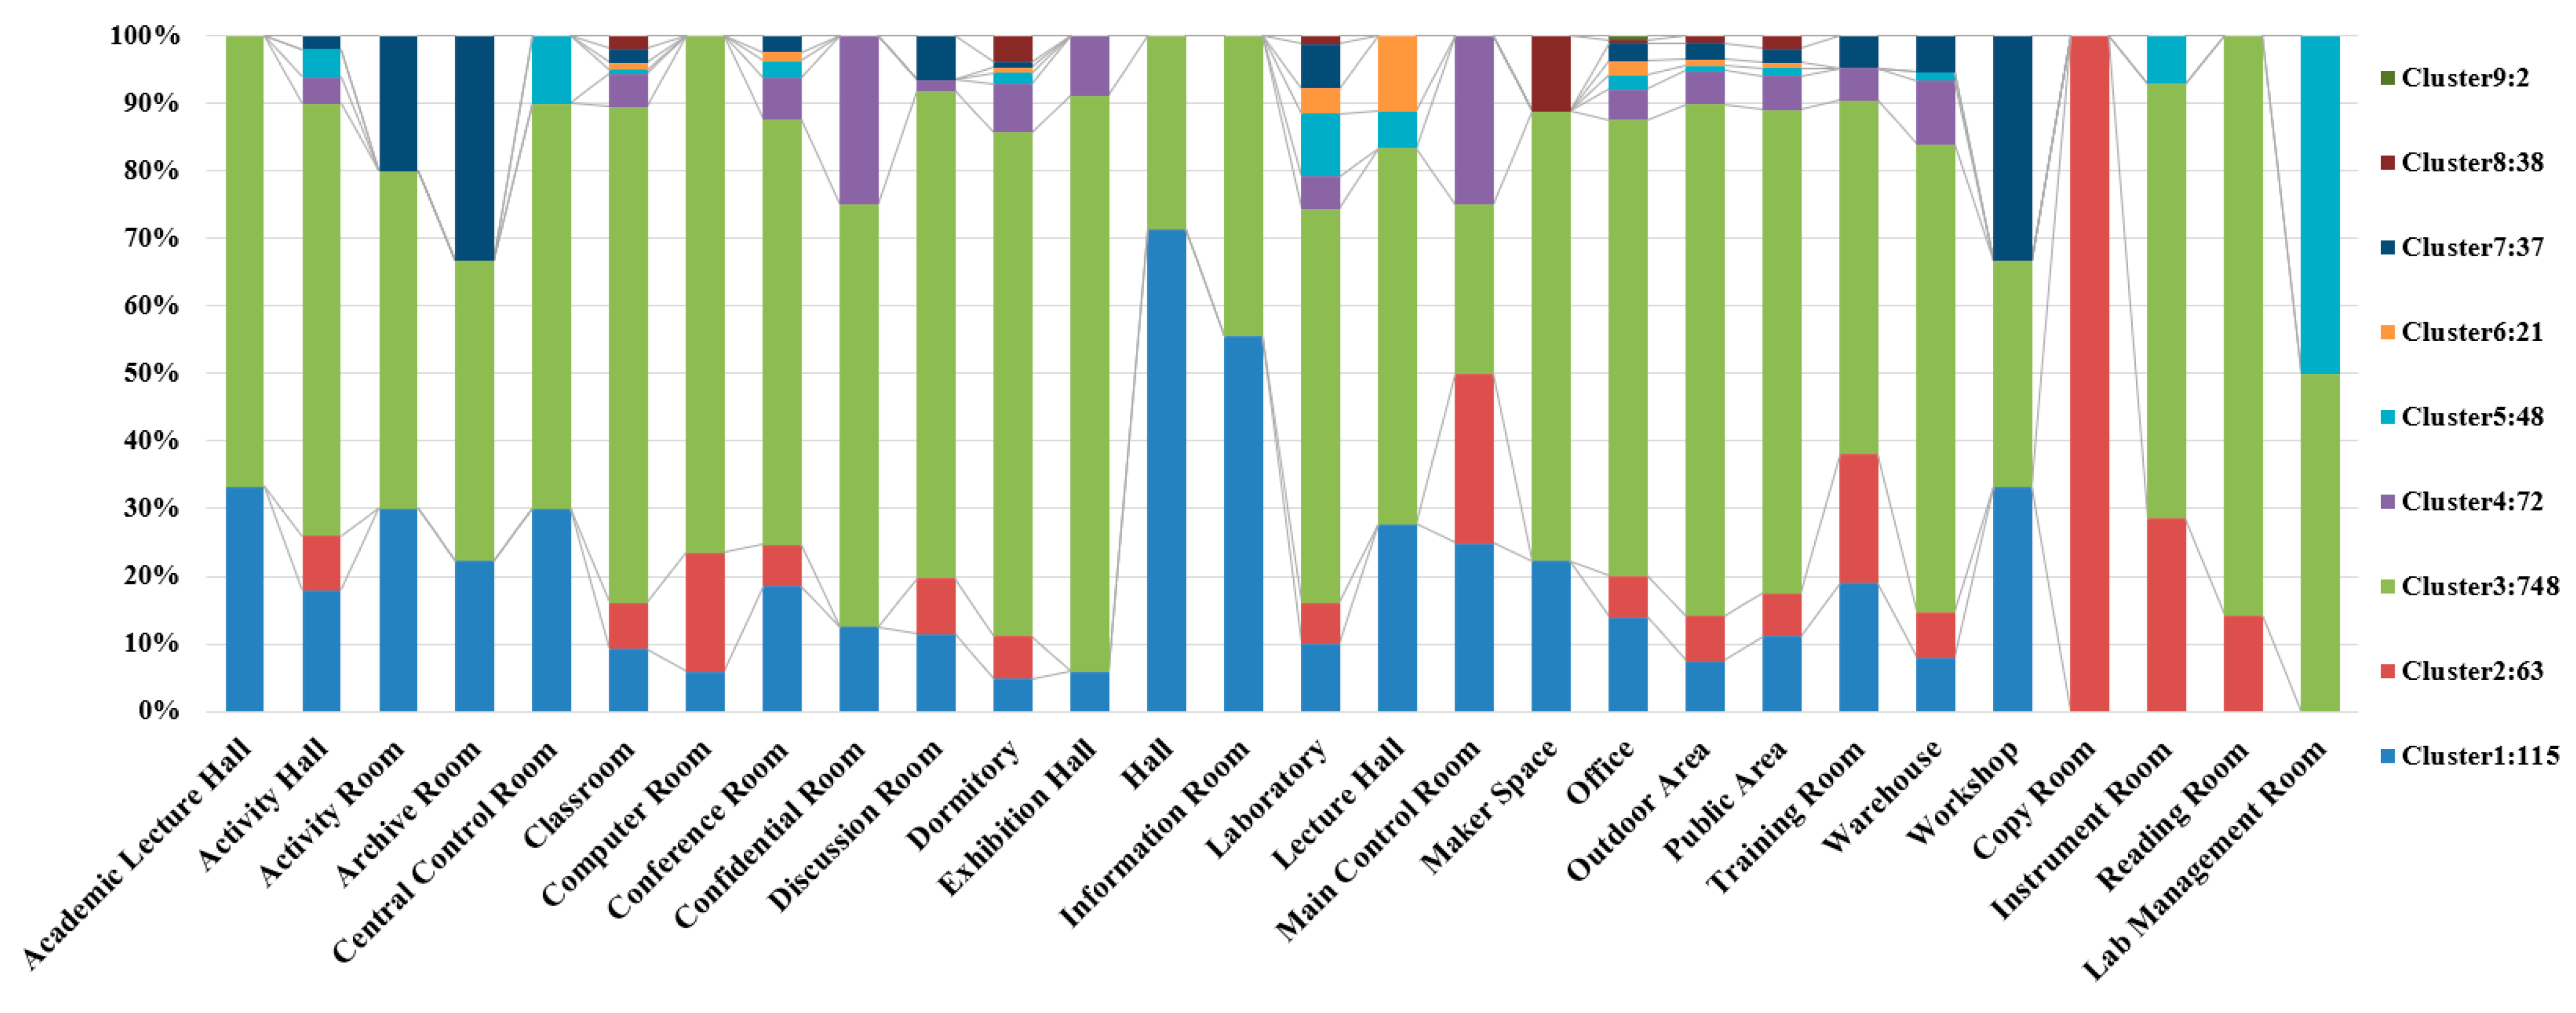
Figure 8 shows the percentage distribution of individuals in each of the 24 clusters across different space functions. Each bar comprises a percentage composition of clusters corresponding to one specific space function. The largest number of individuals is classified into Cluster 2, with the majority distributed in dormitories, classrooms, laboratories, and the student union. Notably, all records from the space function of student union fall with Cluster 2. This suggests that this group consists of students who are highly active on campus.
Among all nodes (individuals), nodes 555, 1772, 1925, and 2293 connected to 2107 individuals, making them the nodes with the most connections among all individuals. Their records over the nine days show a certain regularity, with the majority and longest durations spent in dormitories, followed by classrooms and laboratories. This strongly suggests that these individuals are students. According to the clustering results, node 555 belongs to Cluster 6, while the other three nodes are in Cluster 2, which is the largest cluster. Through comparative analysis, we found that, aside from the dormitory, node 555′s second most frequent location was the laboratory, with fewer records in classrooms. In contrast, the other three individuals had the majority and longest records in classrooms after the dormitory. Therefore, it is likely that node 555 represents a graduate student or a senior student, while nodes 1772, 1925, and 2293 may be students with an intensive course load or who spend significant time studying in classrooms.
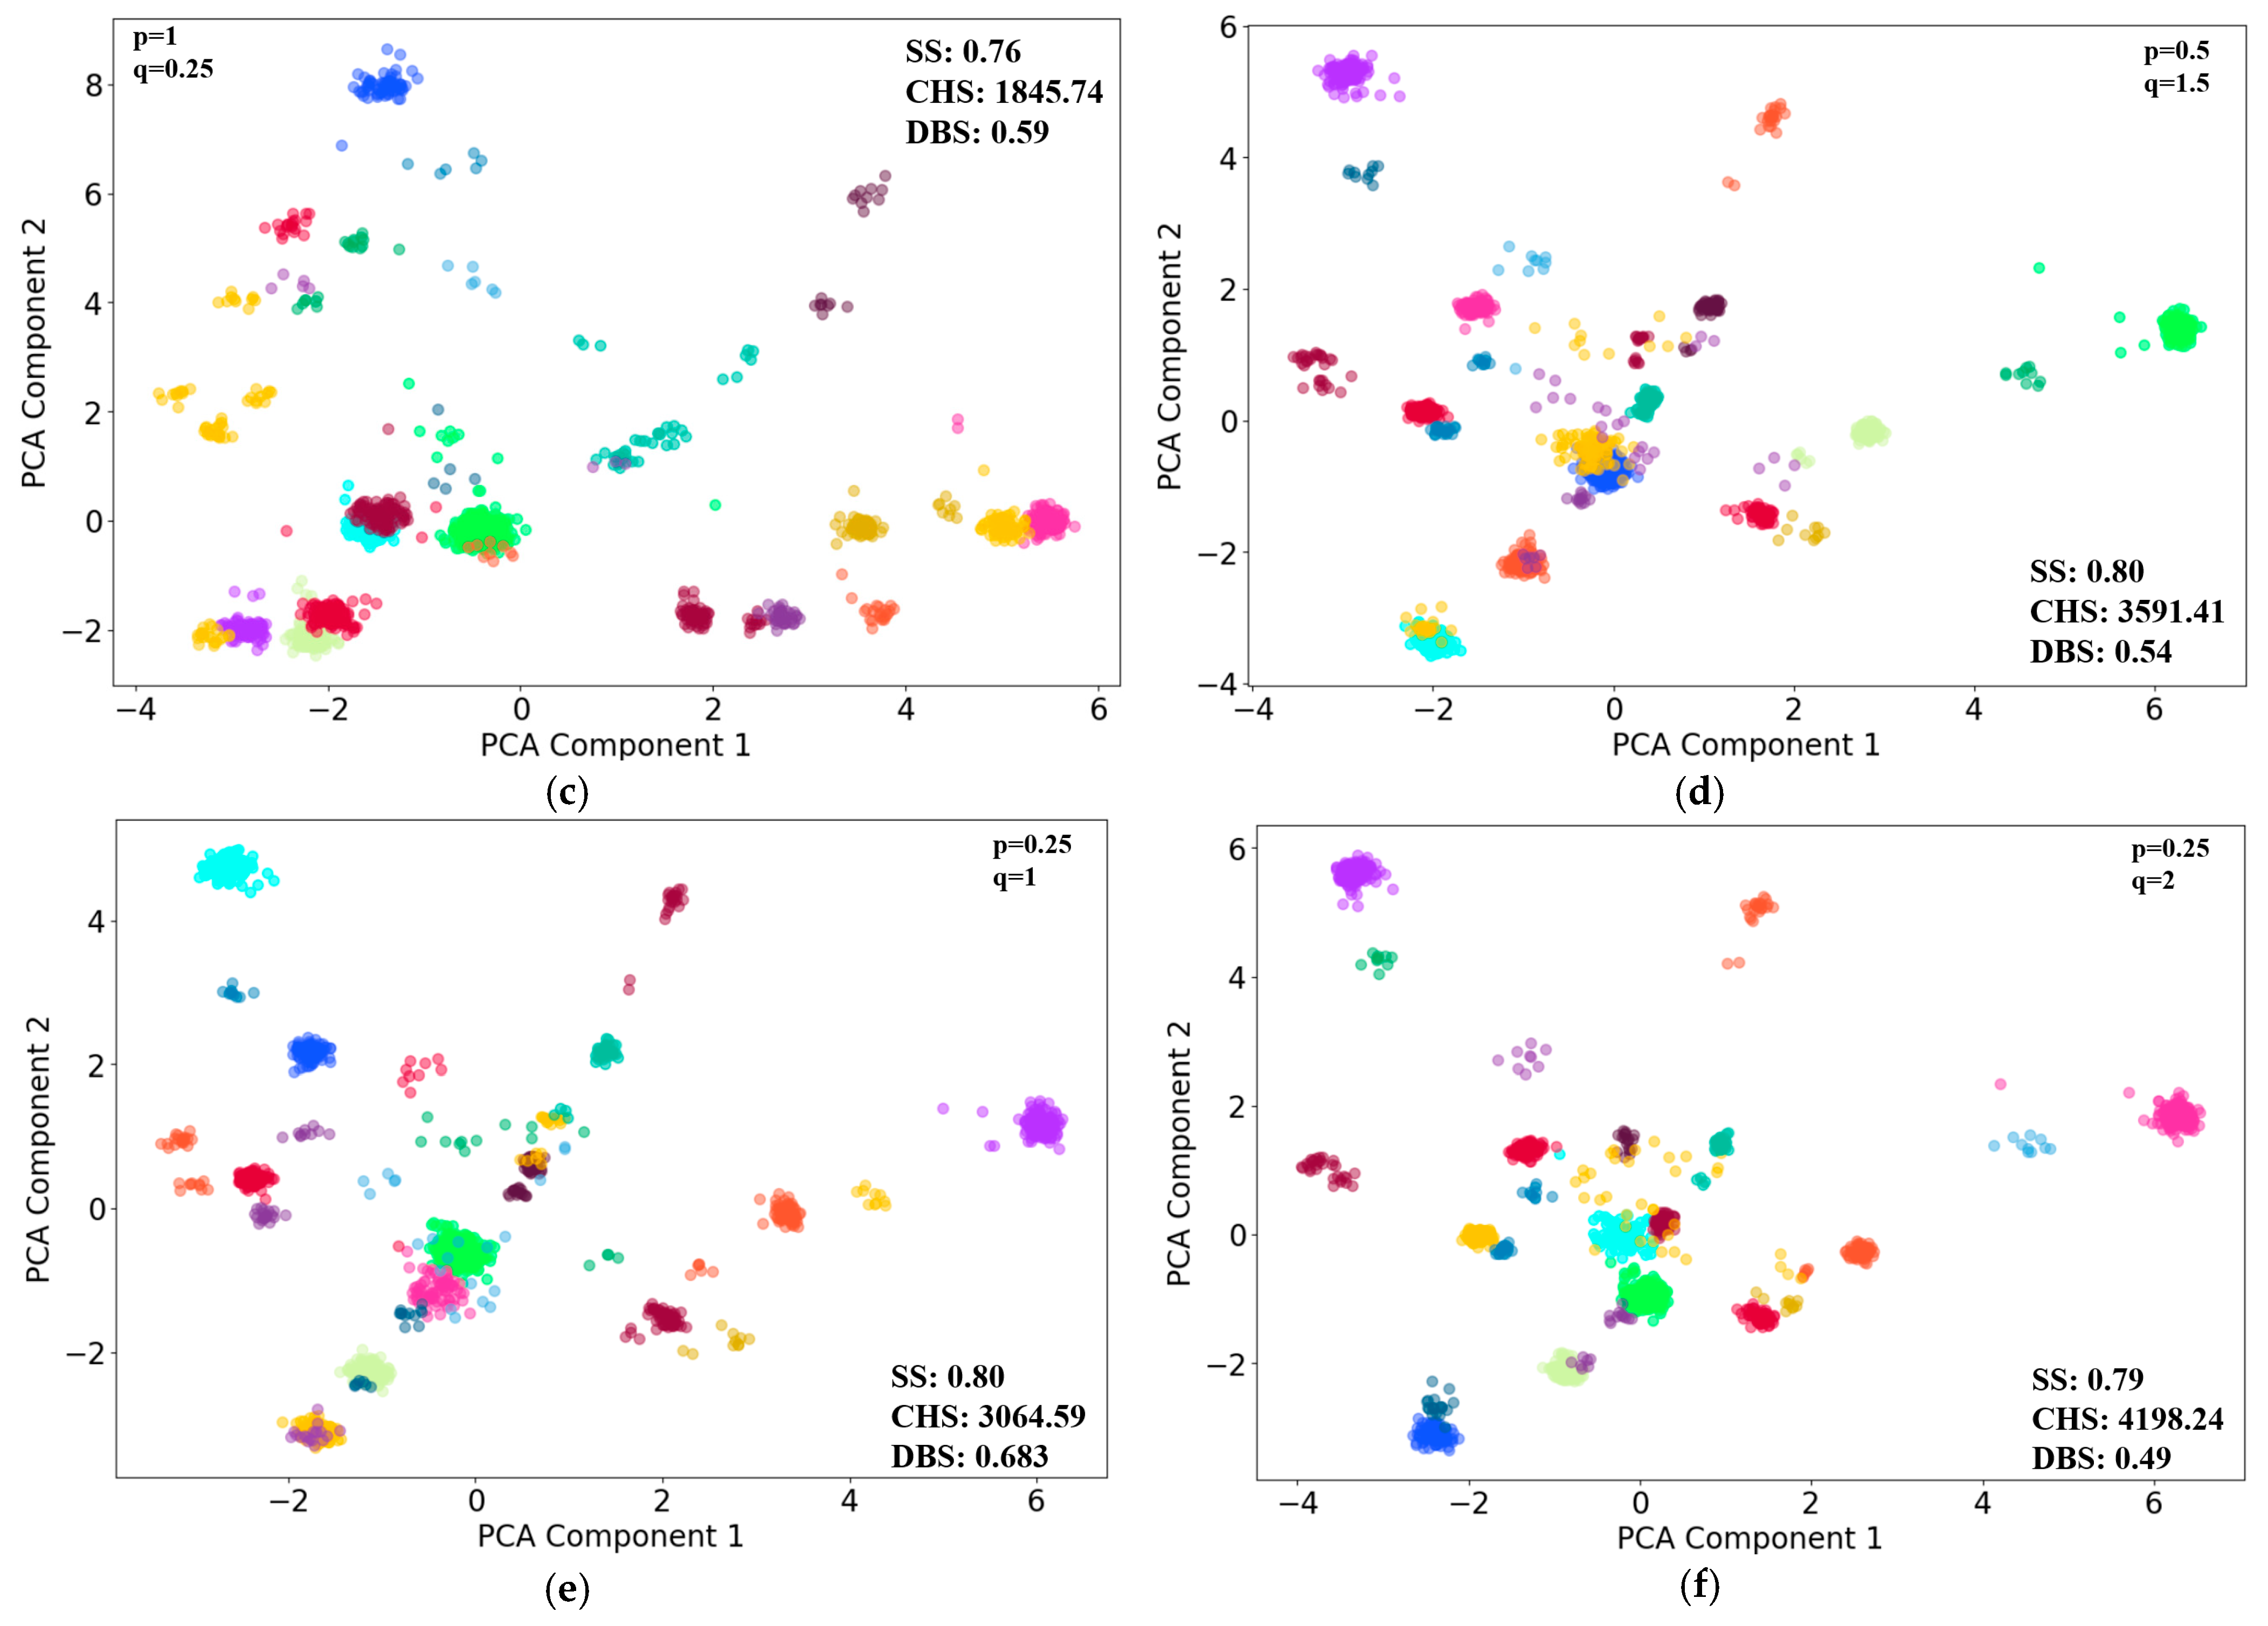
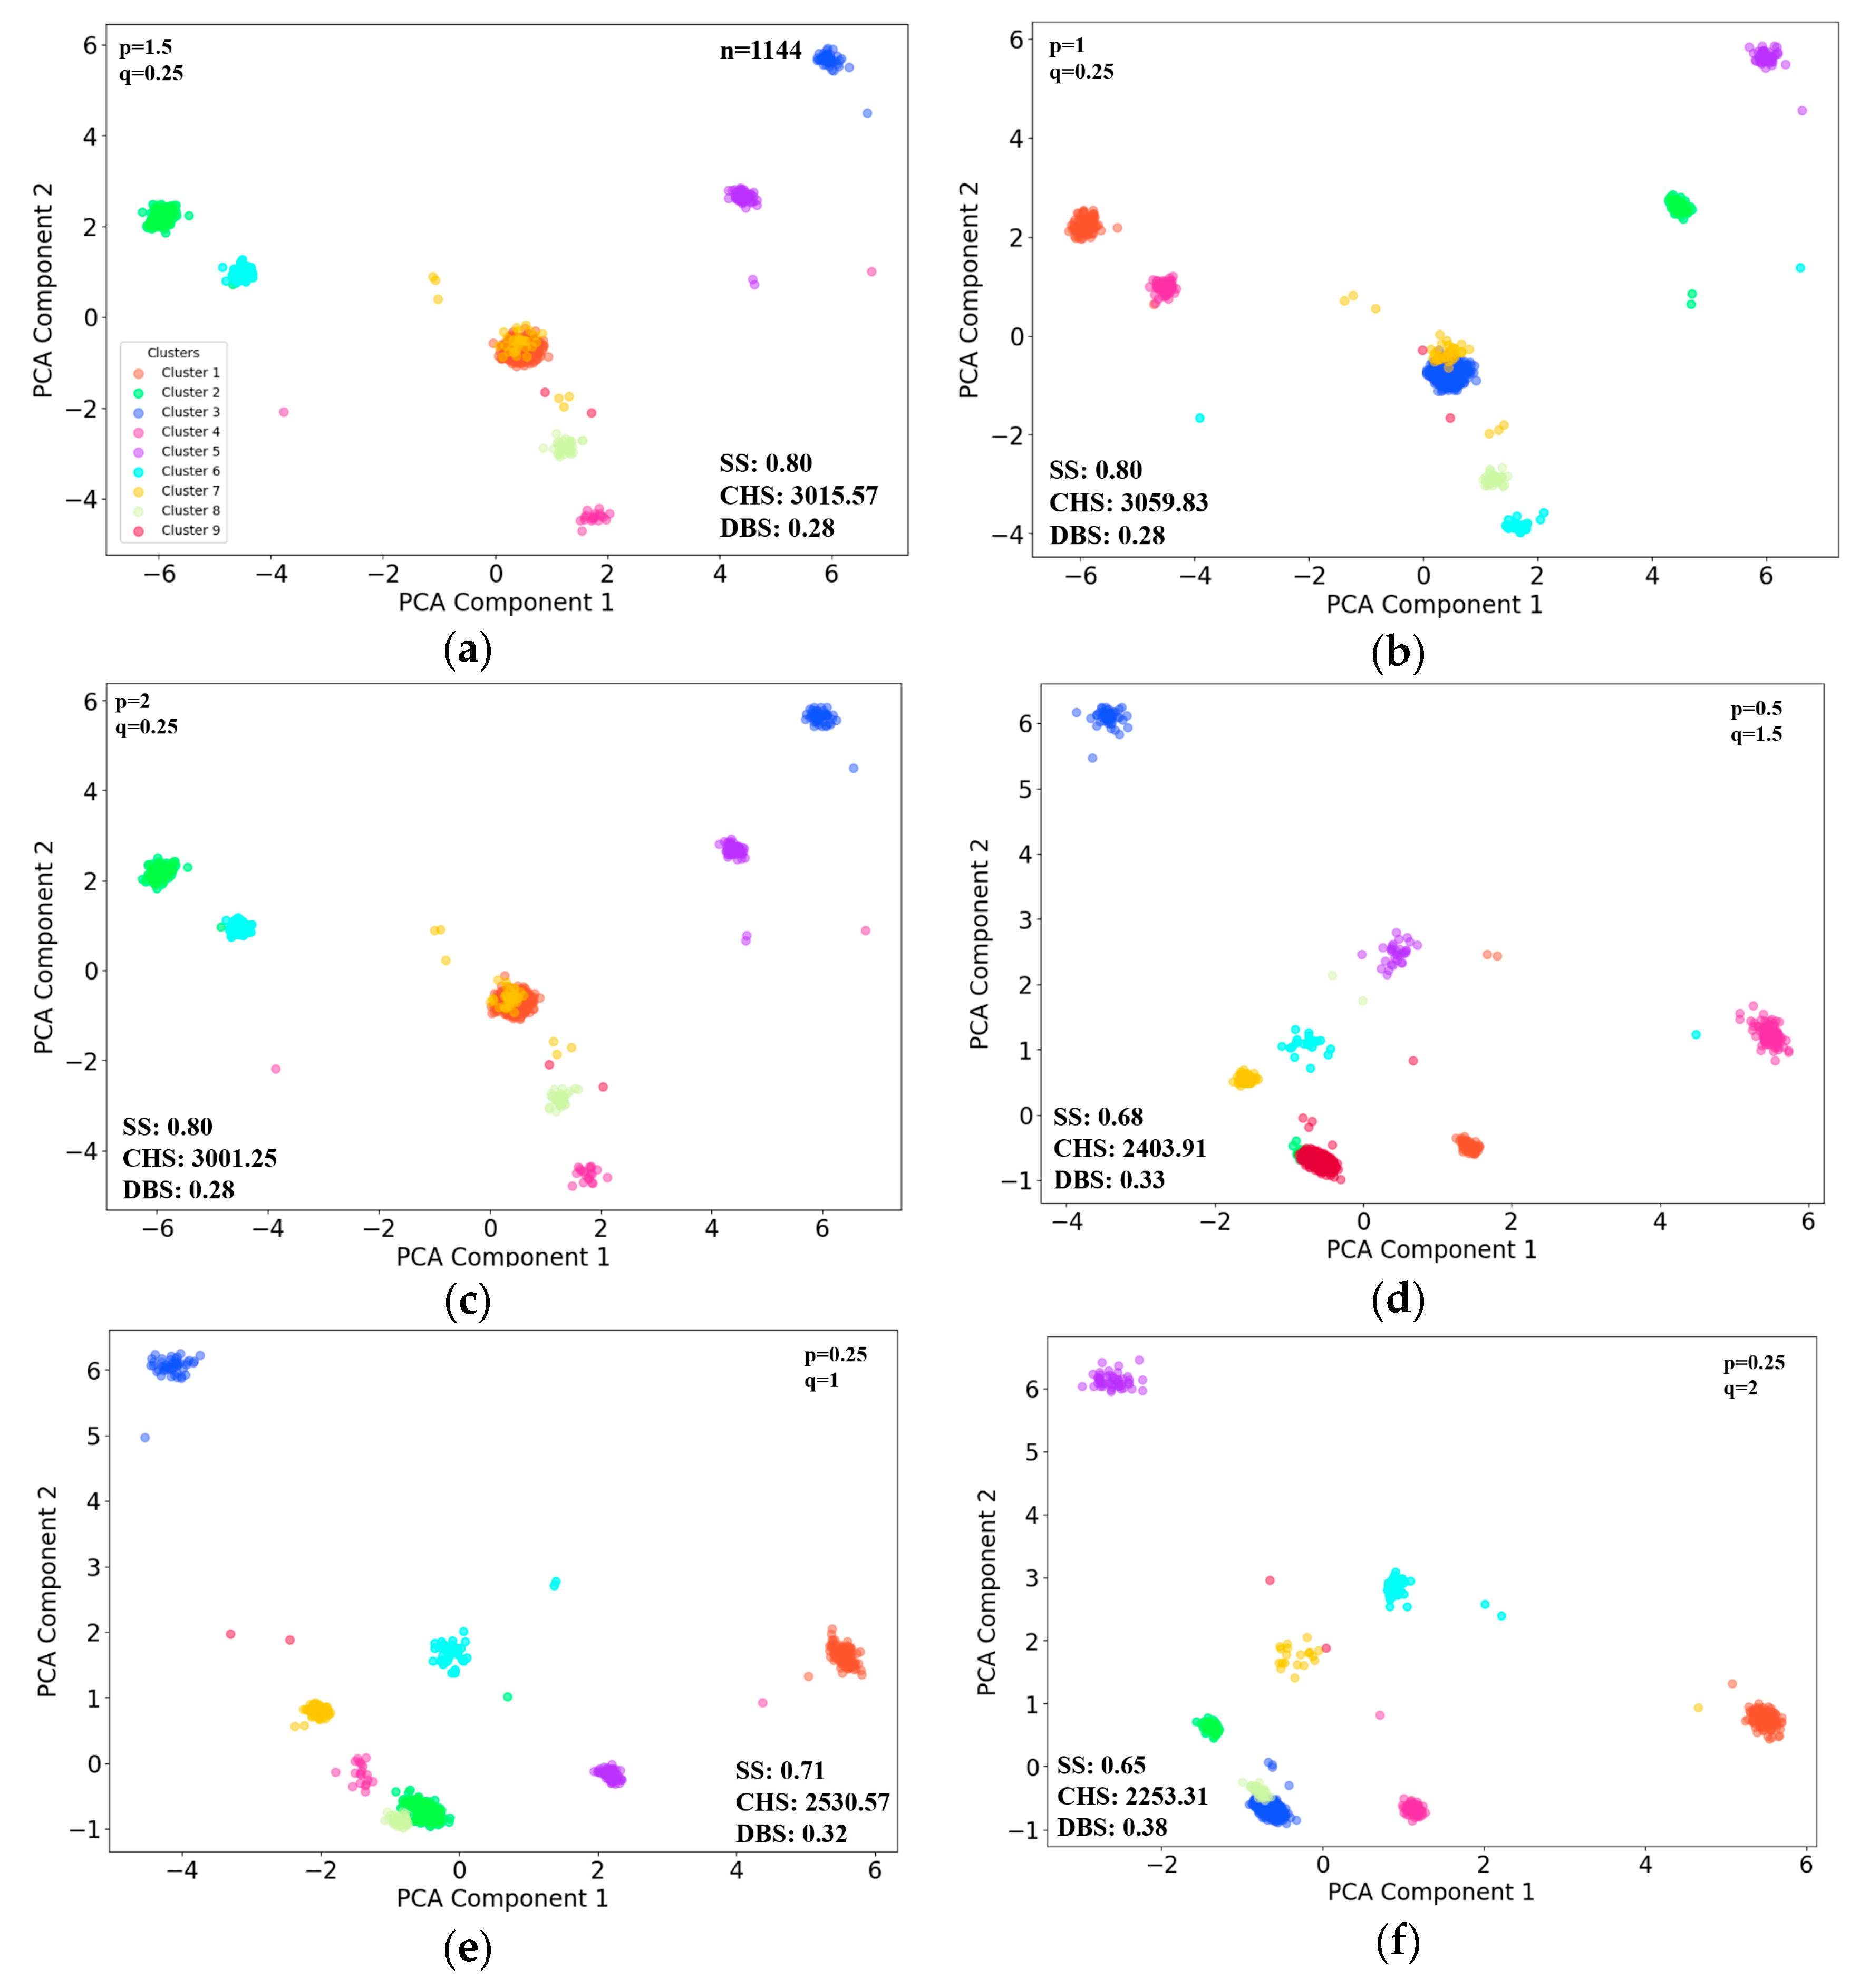
3.2. Individual K-Means Clustering in 4-Hour Scenario
Within the 4 h scenario, the human network size is smaller than that withing the 2 h scenario. The individuals were grouped into 18 clusters based on their feature vectors, of which there were also fewer than in the 2 h scenario. Similarly, six parameter combinations were selected, with the first three biased towards DFS and the last three towards BFS. The analysis of these combinations highlights how different biases and parameter settings influence the clustering results (
Figure 9). The subfigures (a) to (f) in
Figure 9 correspond to different combinations of
p and
q, respectively. The clustering results shown in
Figure 9 are plotted against the first two major components after dimension reduction of the original feature vectors based on PCA processing.
Figure 10 shows a 3D visualization of the clustering results with parameter settings of
p = 0.25 and
q = 2, which generate the best overall cluster metrics (DBS and CHS).
For the overall DBS and CHS cluster metrics,
Figure 9b presents the best performance.
Figure 10 shows a 3D visualization of the clustering results for this parameter scenario (
p = 1,
q = 0.25). Similarly the corresponding result is plotted against the first three major components after PCA dimension reduction.
Within the 4 h scenario, Cluster 16 has the largest number of individuals. Most of the individuals stay in dormitories, followed by classrooms and laboratories. This cluster covers the widest range of space functions compared to other clusters. On the other hand, Cluster 18 has the fewest individuals and the fewest space functions covered by their stay points.
Figure 11 shows the percentage of individuals in different functional spaces within each cluster, as well as the number of individuals in each cluster.
The nodes with the most edges, each having 1828 connections, are nodes 985, 1772, 1892, and 2527. Compared with the 2 h scenario, nodes 985, 1892, and 2527 have 2098 connections each, which is just below the nodes with the highest number of connections. Among these four nodes, node 985 is in Cluster 8, while the remaining three were assigned to Cluster 16, which contains the most nodes. Notably, node 1892 shows regular patterns of stay in both the dormitory and laboratory over the 9-day period. Almost every half-day work shift is spent in the laboratory, with a return to the dormitory after 11 p.m., suggesting that this individual may be a graduate student. In contrast, nodes 1772 and 2527, while having fewer records in the laboratory compared to node 1892, show similar patterns, spending significant time in classrooms during the daytime and evening work hours. Node 985, however, demonstrates more diverse space function patterns compared to the other three.
3.3. Individuals K-Means Clustering in 24 Hours
With the 24 h scenario, the feature vectors of human network nodes were grouped into nine clusters. The network size and cluster numbers are smaller than in the two scenarios discussed above. Six parameter combinations were tested using the same strategy. The evaluation of these biases and parameter combinations provides insights into their effects on the clustering results, revealing significant patterns and groupings among the individuals (
Figure 12). The subfigures (a) to (f) in
Figure 12 correspond to different combinations of
p and
q, respectively.
Figure 13 shows a 3D visualization of the clustering result with the best cluster metrics using the first three major components after PCA dimension reduction of corresponding feature vectors.
Figure 13 shows a 3D visualization of the clustering results with parameter settings of
p = 1,
q = 0.25, generate the best overall cluster metrics (DBS and CHS).
Among the nine clusters, Cluster 3 covers the most diverse range of space functions, with the majority of individuals spending time in dormitories, classrooms, and laboratories. Clusters 6, 7, and 9 have the fewest individuals staying in dormitories, with a proportions in classrooms and offices (
Figure 14).
The maximum number of edges connected to a single node s 1038, and there are 72 such nodes. Most of these nodes are found in Cluster 3. Analysis reveals that these individuals primarily spent their time in dormitories and laboratories over the nine days. Compared to individuals with the most connections withing the 2 h and 4 h scenarios, those in the 24 h scenario have significantly less frequent and shorter durations of classroom activities, suggesting that they are likely graduate students or research staff residing on campus.
4. Discussion
Spatio-temporal clustering based on human movement trajectories has been widely investigated based on location and time attributes in available research. Relevant clustering algorithms using geometric and temporal similarities of trajectories can reveal spatio-temporal patterns of human activities with similar location sequences. However, the space function of trajectory stay points, as one of the basic drivers of intentional human movements, has not been incorporated explicitly in previous works. It is necessary to identify individuals who visit spaces of the same type of function but at different locations. In this way, it is possible to effectively reveal the spatial dynamics of human mobility in view of space function and interactions between functions of spaces and human spatio-temporal behaviors.
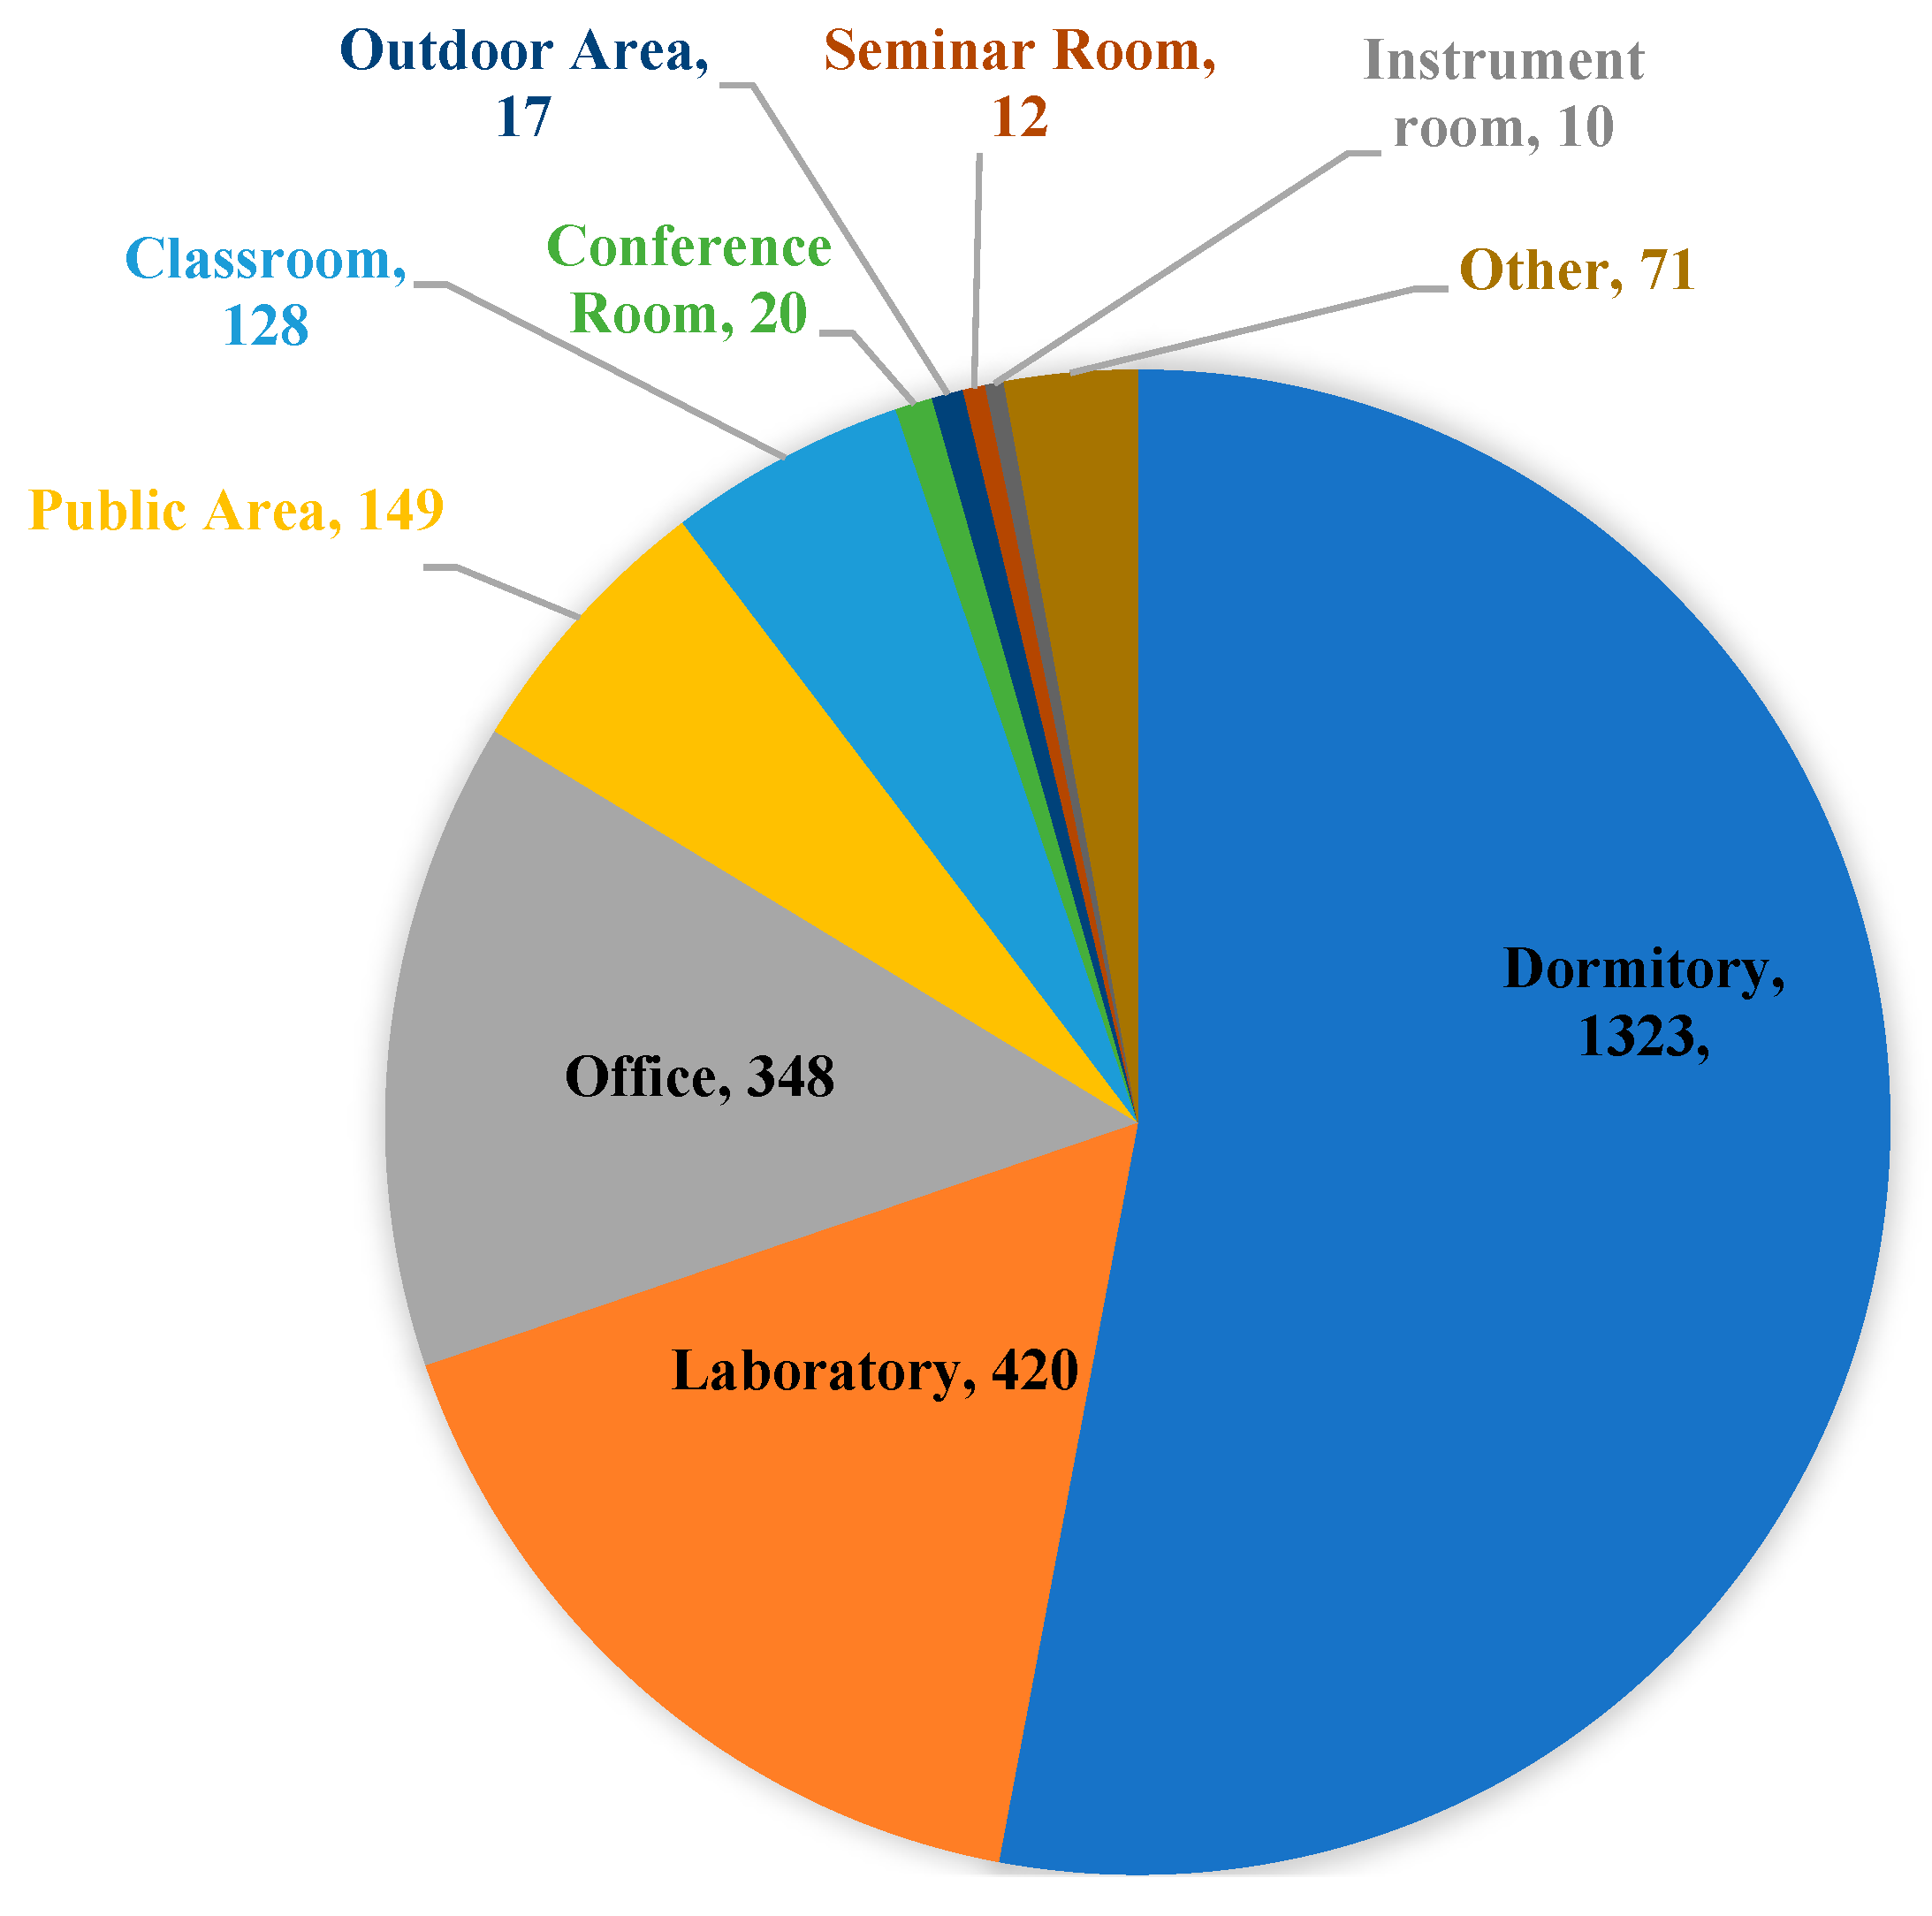
In our work, human clusters were generated based on space functions and time durations spent by individuals. Thirty-five types of space functions were categorized in our research region, and three typical time durations are considered to indicate connections among individuals in spaces of the same function. With trajectory data of 3000 individuals collected from the campus Wi-Fi network over nine days, it was found that the network size and relevant statistics are inversely proportional to time duration, which agrees with common understanding of characteristics of human gathering activities. Since individuals often visit multiple spaces with different functions in a certain period, the network represents variant-dimensional connections among individual nodes. Graph embedding techniques are appropriate tools to transform network neighboring data into low-dimensional, fixed-length feature vectors. Node2Vec was introduced in this work to learn and generate continuous representations of nodes with a biased random walk strategy. K-means was then used to conduct clustering in the vector space of the learned network representation. This clustering algorithm minimizes the variance in each cluster and maximizes differences between clusters. It enables us to input a suitable number of clusters, which is more effective than other algorithms requiring more parameters. It is effective in answering questions like how many types of campus inhabitants there are. Inertia and the silhouette score are employed to determine suitable numbers of clusters based on the elbow method. Each resulting number of clusters for the corresponding time duration is inversely proportional to the time duration. This is in agreement with characteristics of human group activities. Two additional indicators measuring clustering performance are used to identify appropriate settings of biased random walk strategies.
Upon analysis and comparison of clustering results, it was found that the largest clusters across all three scenarios exhibited common characteristics. They included the widest variety of space functions, with dormitories being the most frequent, followed by laboratories, classrooms, and public areas, suggesting that these clusters likely represent student groups. These results are consistent with the characteristics of major campus inhabitants and their corresponding activity patterns.
Based on the statistical results, it can be observed that the total number of individuals in larger clusters is directly proportional to the number of individuals who stay in dormitory spaces. By examining other stay points of these clusters, it can be validated that these individuals are primarily students. A more detailed analysis of their additional stay points allows for further distinctions between different groups of students. In contrast, for smaller clusters, dormitory stays do not reveal a clear pattern, as there are few or no records of dormitory stays. Instead, the stay points of these smaller groups are concentrated in offices, classrooms, and laboratories.
5. Conclusions
In this paper, we proposed a methodology for human clustering based on feature vector representations, which are generated by the graph embedding of human networks of space functions of trajectory stay points. Using trajectory data generated from the Wi-Fi log data of 3000 individuals over nine days on a university campus, three human networks were built for typical time durations. The networks’ sizes and key statistical data of node degrees are closely related to the corresponding time duration and agree with the general pattern of public activities in the application context. With help of clustering performance indicators, appropriate biased random walk strategies were determined for K-means clustering. Corresponding analysis of the clustering results was conducted, revealing distinct behavioral patterns of typical campus inhabitants. A general pattern is that more groups of individuals can be revealed as the time duration decreases. The individuals in typical clusters are in agreement with the background information about campus inhabitants, and space usage analysis also matches individuals’ spatial and temporal activity patterns.
By incorporating space function into human mobility analysis, more research can be conducted to improve this work and further explore applicationsin wider contexts. In our research, we set three typical time durations to build the corresponding human networks. In reality, there are many other spontaneous and planned activities happening on campus, which may not last for the specific time duration we set in this research. It would be meaningful to validate patterns found in our current work by investigating clustering characteristics with a fine time duration sequence. The search strategies used in graph embedding processing of the human network could be enhanced by incorporating edge weights—for example, exact time durations or sizes of individual groups. The semantics of time attribute is also an important factor in human mobility; for example, a two-hour duration in the morning is different from one in the afternoon. This was not fully considered in our current work and can be explored further. Space function is one type of categorical information, and the resulting clusters can be taken as categorical data as well. Correspondence analysis can be introduced to explore associations based on a contingency table [
30]. This research was designed to reveal the general relational patterns between human clusters and space functions by grouping each individual into a specific cluster. In the future, other clustering algorithms, such as hierarchical clustering algorithms and Density-Based Spatial Clustering of Applications with Noise (DBSCAN), can be employed to extract clusters adaptively and detect outliers. Of course, it is necessary to implement optimization algorithms to determine the suitable threshold values. In a broader urban context, a different space function system should be developed, and a fine adaptive time duration sequence should be introduced, considering very diverse human mobilities at large scales [
12]. Privacy and ethical issues should be considered to protect individuals’ rights and guarantee responsible big data use. The data used in this paper were anonymized and shared with restrictions. Verification of the results can be conducted at coarse granularity levels. This work can be used to derive more individuals’ spatial and temporal characteristics and detailed interactions with spaces, with further implications for public decision making.


