Article

Cancer Risk Associated with Inhalation Exposure to PM10-Bound PAHs and PM10-Bound Heavy Metals in Polish Agglomerations

Department of Air Protection, Silesian University of Technology, 22B Konarskiego St., 44-100 Gliwice, Poland
*
Author to whom correspondence should be addressed.
Appl. Sci. 2025, 15(14), 7903; https://doi.org/10.3390/app15147903
Submission received: 18 June 2025 / Revised: 9 July 2025 / Accepted: 11 July 2025 / Published: 15 July 2025

Abstract

Particulate matter (PM), polycyclic aromatic hydrocarbons (PAHs), and heavy metals (HMs) present in polluted air are strongly associated with an increased risk of respiratory diseases. In our study, we grouped cities based on their pollution levels using a method called Ward’s cluster analysis and looked at the increased cancer risk from PM10-bound harmful substances for adult men and women living in Polish cities. The analysis was based on data from 8 monitoring stations where concentrations of PM10, PAHs, and HMs were measured simultaneously between 2018 and 2022. The cluster analysis made it possible to distinguish three separate agglomeration clusters: cluster I (Upper Silesia, Wroclaw) with the highest concentrations of heavy metals and PAHs, with mean levels of lead 14.97 ± 7.27 ng·m−3, arsenic 1.73 ± 0.60 ng·m−3, nickel 1.77 ± 0.95 ng·m−3, cadmium 0.49 ± 0.28 ng·m−3, and ∑PAHs 15.53 ± 6.44 ng·m−3, cluster II (Warsaw, Łódź, Lublin, Cracow) with dominant road traffic emissions and low emissions, with average levels of lead 8.00 ± 3.14 ng·m−3, arsenic 0.70 ± 0.17 ng·m−3, nickel 1.64 ± 0.96 ng·m−3, and cadmium 0.49 ± 0.28 ng·m−3, and cluster III (Szczecin, Tricity) with the lowest concentration levels with favourable ventilation conditions. All calculated ILCR values were in the range of 1.20 × 10⁻⁶ to 1.11 × 10⁻⁵, indicating a potential cancer risk associated with long-term exposure. The highest ILCR values were reached in Upper Silesia and Wroclaw (cluster I), and the lowest in Tricity, which was classified in cluster III. Our findings suggest that there are continued preventive actions and stricter air quality control. The results confirm that PM10 is a significant carrier of airborne carcinogens and should remain a priority in both environmental and public health policy.

1. Introduction

The World Health Organization (WHO) has identified climate change as one of the greatest threats to health in the 21st century. Air pollution is also one of the greatest environmental threats to public health and economic progress in the modern society [1].
Air pollution contributes to the development of various diseases and premature death, particularly cardiovascular and respiratory diseases (including lung disease and lung cancer), as well as nervous and endocrine disorders, fertility issues and the acceleration of neurodegenerative diseases [2,3,4,5,6]. The combined impact of outdoor and household air pollution is responsible for around 6.7 million premature deaths each year, affecting people in countries with low, middle and high incomes [1].
Significant deterioration in air quality is observed in urbanized, densely populated urban areas. These regions are typically associated with intense industrial activity, heavy vehicular traffic, and high levels of economic activity. In many urban centres, the supporting infrastructure remains underdeveloped [7,8,9,10]. Contributing factors include the absence of bypass roads, industrial facilities being in close proximity to residential zones, and the widespread use of low-quality fuels [11,12,13]. Furthermore, limited air circulation exacerbates the accumulation of pollutants such as particulate matter (PM), volatile organic compounds (VOCs), nitrogen oxides (NOx), carbon monoxide (CO), heavy metals, and persistent organic pollutants [14]. Elevated noise levels also pose a concern, negatively impacting human well-being and potentially contributing to mental health disorders. Consequently, urban areas typically exhibit higher concentrations of air pollutants than non-urban regions [15,16,17].
Global epidemiological studies indicate that residents of large urban centres with high concentrations of particulate matter (PM10 and PM2.5) are more susceptible to cancer and a range of other diseases such as ischaemic heart disease, cardiovascular conditions and lung cancer [18,19,20]. An increase in PM2.5 concentrations of 10 μg·m−3 is associated with a 6–8% increase in lung cancer-related mortality [18,21,22]. These studies also reveal a correlation between daily fluctuations in PM concentrations and short-term mortality rates. Some of the most extreme air pollution levels are recorded in India, where air quality frequently reaches hazardous levels. Bhiwadi and New Delhi are among the world’s most polluted cities [23].
Although overall pollution levels in the United States are generally lower than in many Asian nations, cities such as Los Angeles, Chicago, and Washington still report high concentrations of PM2.5 and polycyclic aromatic hydrocarbons (PAHs) [24]. Elevated levels of heavy metals, including cadmium (Cd), nickel (Ni), lead (Pb), and arsenic (As), are particularly prevalent in regions characterised by intensive industrial activity and heavy road traffic [25,26]. In the European Union, it is estimated that inhaling air containing fine particulates caused approximately 240,000 premature deaths in 2020, including around 39,300 in Poland [27,28].
In the context of public health, particulate matter poses a significant threat to humans. It has been classified as carcinogenic to humans (Group 1) by both the World Health Organization (WHO) and the International Agency for Research on Cancer (IARC) [29,30,31,32]. Depending on its origin, particulate matter primarily consists of organic carbon (OC), elemental carbon (EC), water-soluble ions, and potentially toxic elements, including heavy metals and persistent organic pollutants (POPs) such as polycyclic aromatic hydrocarbons and their derivatives [33]. The chemical composition and particle size of PM significantly impact human health risks [34,35]. Epidemiological studies have revealed links between ambient PM10 levels and higher rates of total, cardiovascular, and respiratory mortality, as well as hospital admissions [36,37]. The absorption of particulate matter by living organisms poses a serious threat due to the variety of toxic, carcinogenic, and mutagenic chemicals it often contains [26,38]. Additionally, certain components of particulate matter can trigger allergic reactions. Particularly hazardous are toxic metals and their compounds, persistent organic pollutants, sulphates, and others.
PM-bound PAHs and PM-bound heavy metals, particularly fine particles, can re-enter the air or enter the human body via ingestion, inhalation or skin contact [39,40]. Heavy metals pose a significant health threat due to their tendency to be absorbed, retained and biomagnified within the body, potentially leading to various diseases [41]. The specific health effects depend on the type of metal involved. For example, the International Agency for Research on Cancer [30] has classified arsenic, cadmium, and nickel as carcinogenic to humans (Group 1), and they are linked to fatal cancers of the lungs, trachea and bronchi. Lead, categorised as possibly carcinogenic (Group 2A), can cause neurological damage and impair kidney function [35]. In children, long-term lead exposure has been associated with developmental delays and learning difficulties [42]. Overall, heavy metals have the potential to disrupt the nervous system, hinder kidney function, interfere with bone formation and negatively affect various other organs [17,43,44].
The IARC classifies PAH congeners according to their carcinogenicity: as carcinogenic to humans (Group 1), probably carcinogenic to humans (Group 2A), or possibly carcinogenic to humans (Group 2B) [30]. For example, benzo[a]pyrene is categorized as a Group 1 carcinogen, whereas benzo[a]anthracene, benzo[b]fluoranthene, benzo[j]fluoranthene, benzo[k]fluoranthene, dibenzo[a,h]anthracene, and indeno[1,2,3-cd]pyrene are classified as Group 2B compounds.
PAHs can be inhaled as vapours or adsorbed onto airborne particulate matter. The site at which they are deposited within the respiratory tract is influenced by the particles’ aerodynamic diameter [45]. Ultrafine particles can penetrate deep into the alveolar region and subsequently enter the bloodstream, spreading throughout the body. In contrast, larger particles are usually deposited in the bronchiolar regions [35]. Due to their lipophilic nature, PAHs accumulate in adipose tissue [46]. Studies demonstrate that benzo[a]pyrene accumulates in pulmonary tissue, as well as in the heart, liver, spleen, kidneys and skeletal muscle [47,48]. During biotransformation in the human body, PAHs are metabolised into reactive intermediates that can form covalent adducts with DNA, RNA and proteins [49,50]. This mechanism is widely recognised as a critical contributor to carcinogenesis [51,52]. However, it has yet to be definitively established whether carcinogenic outcomes are attributable to individual PAH congeners or the combined effect of multiple compounds [53].
Despite ongoing reductions in emissions, most of the European urban population continued to be exposed to hazardous air pollutants in 2022. In particular, they were exposed to concentrations of PM2.5 above the WHO’s 2021 annual guideline level of 5 µg·m−3 [54]. In Poland, high concentrations of PM, PAHs, and heavy metals pose a particular risk in urban areas such as Cracow, Upper Silesia, and Wroclaw, where normative values are consistently exceeded. In 2023, the average annual concentration of B[a]P, a key indicator of human exposure to priority PAHs [55,56], in Poland was 1.53 ng·m−3 This level exceeds both the European Union’s target value of 1.0 ng·m−3 [57,58] and the WHO’s recommended guideline of 0.12 ng·m−3 [59].
The report’s authors [60] indicate that the number of deaths in Poland attributable to exposure to suspended particulate matter is twice the European Union average. The report also emphasises the significant role of air pollution as a lung cancer risk factor, a factor that has previously been underestimated. The primary challenge in this area is accurately assessing the health risks associated with exposure to particulate matter. Firstly, particulate matter contains various pollutants, including known carcinogens such as polycyclic aromatic hydrocarbons and heavy metals, and its chemical composition varies depending on the emission source. Secondly, public health is influenced by numerous additional factors, including tobacco use (both traditional cigarettes and e-cigarettes), lifestyle choices, dietary habits, genetic predispositions, and other variables. Furthermore, we employ various methodological approaches to assess health risks. In our study, we estimated the total lifetime incremental cancer risk from inhaling carcinogens associated with PM10 among adult men and women living in Polish urban areas with populations exceeding 250,000. To achieve this, we selected monitoring stations in Poland that measured air quality, including PM10, PAHs, and heavy metals, for the specified time period.

2. Materials and Methods

2.1. Study Area and Sample Collection

In this study, we used daily measurements of PM10, PM10-bound PAHs, and PM10-bound heavy metals (Ni, Cd, Pb, and metalloid As) collected from 2018 to 2022. The data was retrieved from the Chief Inspectorate of Environmental Protection (CIEP) website [61] in Poland. The air monitoring data were officially validated data. We selected those monitoring stations located in urban agglomerations that met the criterion of simultaneous measurement of PM10 and PAHs such as benzo[a]anthracene B[a]A, benzo[a]pyrene B[a]P, benzo[b]fluoranthene B[b]F, benzo[j]fluoranthene B[j]F, benzo[k]fluoranthene B[k]F, dibenzo[a,h]anthracene DBA, indeno[1,2,3-cd]pyrene IP, and Ni, Cd, Pb, and As concentrations in the period 2018–2022.
The selected sites include Tricity (Gdańsk, PL0052A); Upper Silesia (Katowice- PL0008A); Cracow (PL0501A); Lublin (PL0085A); Łódź (PL0100A); Szczecin (PL0248A); Warsaw (PL0214A); and Wroclaw (PL0194A). The locations of the individual stations represent diverse environmental settings, including highly urbanised and industrialised areas (Upper Silesia, Wroclaw, and Łódź); agglomerations with dominant administrative and service functions (Warsaw, Cracow); coastal regions (Tricity, Szczecin); and cities with moderate levels of traffic and industrial activity (Lublin). The individual agglomerations also differ in terms of meteorological conditions. Tricity and Szczecin have a maritime climate characterised by high air humidity, frequent winds, and relatively mild winters that favour the dispersal of pollutants. However, frequent temperature inversions, especially during the heating season, expose Upper Silesia and Cracow, fostering the accumulation of pollutants near the ground. In addition, due to its location in a valley with limited air ventilation, Cracow has unfavourable conditions for the dispersal of pollutants. Warsaw, Łódź, and Wroclaw have transitional conditions between maritime and continental climates, with periodic stagnant air and varying wind speeds. Lublin, which lies in the valley of the Bystrzyca River, has numerous depressions of land and hills and is characterised by moderate circulation conditions and relatively few inversions. This arrangement of stations allows us to evaluate how risk patterns change in different environmental and human-made situations (Figure 1).
Detailed information on the location of air quality monitoring stations and the number of inhabitants in individual agglomerations is shown in Table S1.
At the air quality monitoring stations, particulate matter was manually collected over continuous 24 h periods using high-volume samplers operating at an airflow rate of 30 m3·h−1. Each sampler was fitted with a PM10 inlet and a system for automatically placing quartz fibre filters into the sampling channel. The amount of PM10 was measured using a standard method that involves weighing, following the PN-EN 12341:2014−07 standard [62], and it can detect levels as low as 1 μg·m−3.
The PM10-bound polycyclic aromatic hydrocarbons (PAHs) were isolated using an organic solvent extraction method. Analysis was then carried out using high-performance liquid chromatography (HPLC) with fluorescence detection, in accordance with the PN-EN 15549:2011 standard [63]. This analytical technique enables the quantification of benzo[a]pyrene and its congeners within a concentration range of approximately 0.05 to 20 ng·m−3.
The PM10-bound heavy metals (Ni, Cd, Pb, and As) were mineralised using microwaves and analysed using a graphite furnace and atomic absorption spectrometry, according to PN-EN 14902:2010 [64]. We apply this method across the following concentration ranges: Ni: 2–100 ng·m−3, Cd: 0.1–50 ng·m−3, Pb: 1–4000 ng·m−3, As: 0.5–350 ng·m−3. Where the measured concentration was below the method detection limit (MDL), this value was treated as a non-detect and substituted with half the MDL.

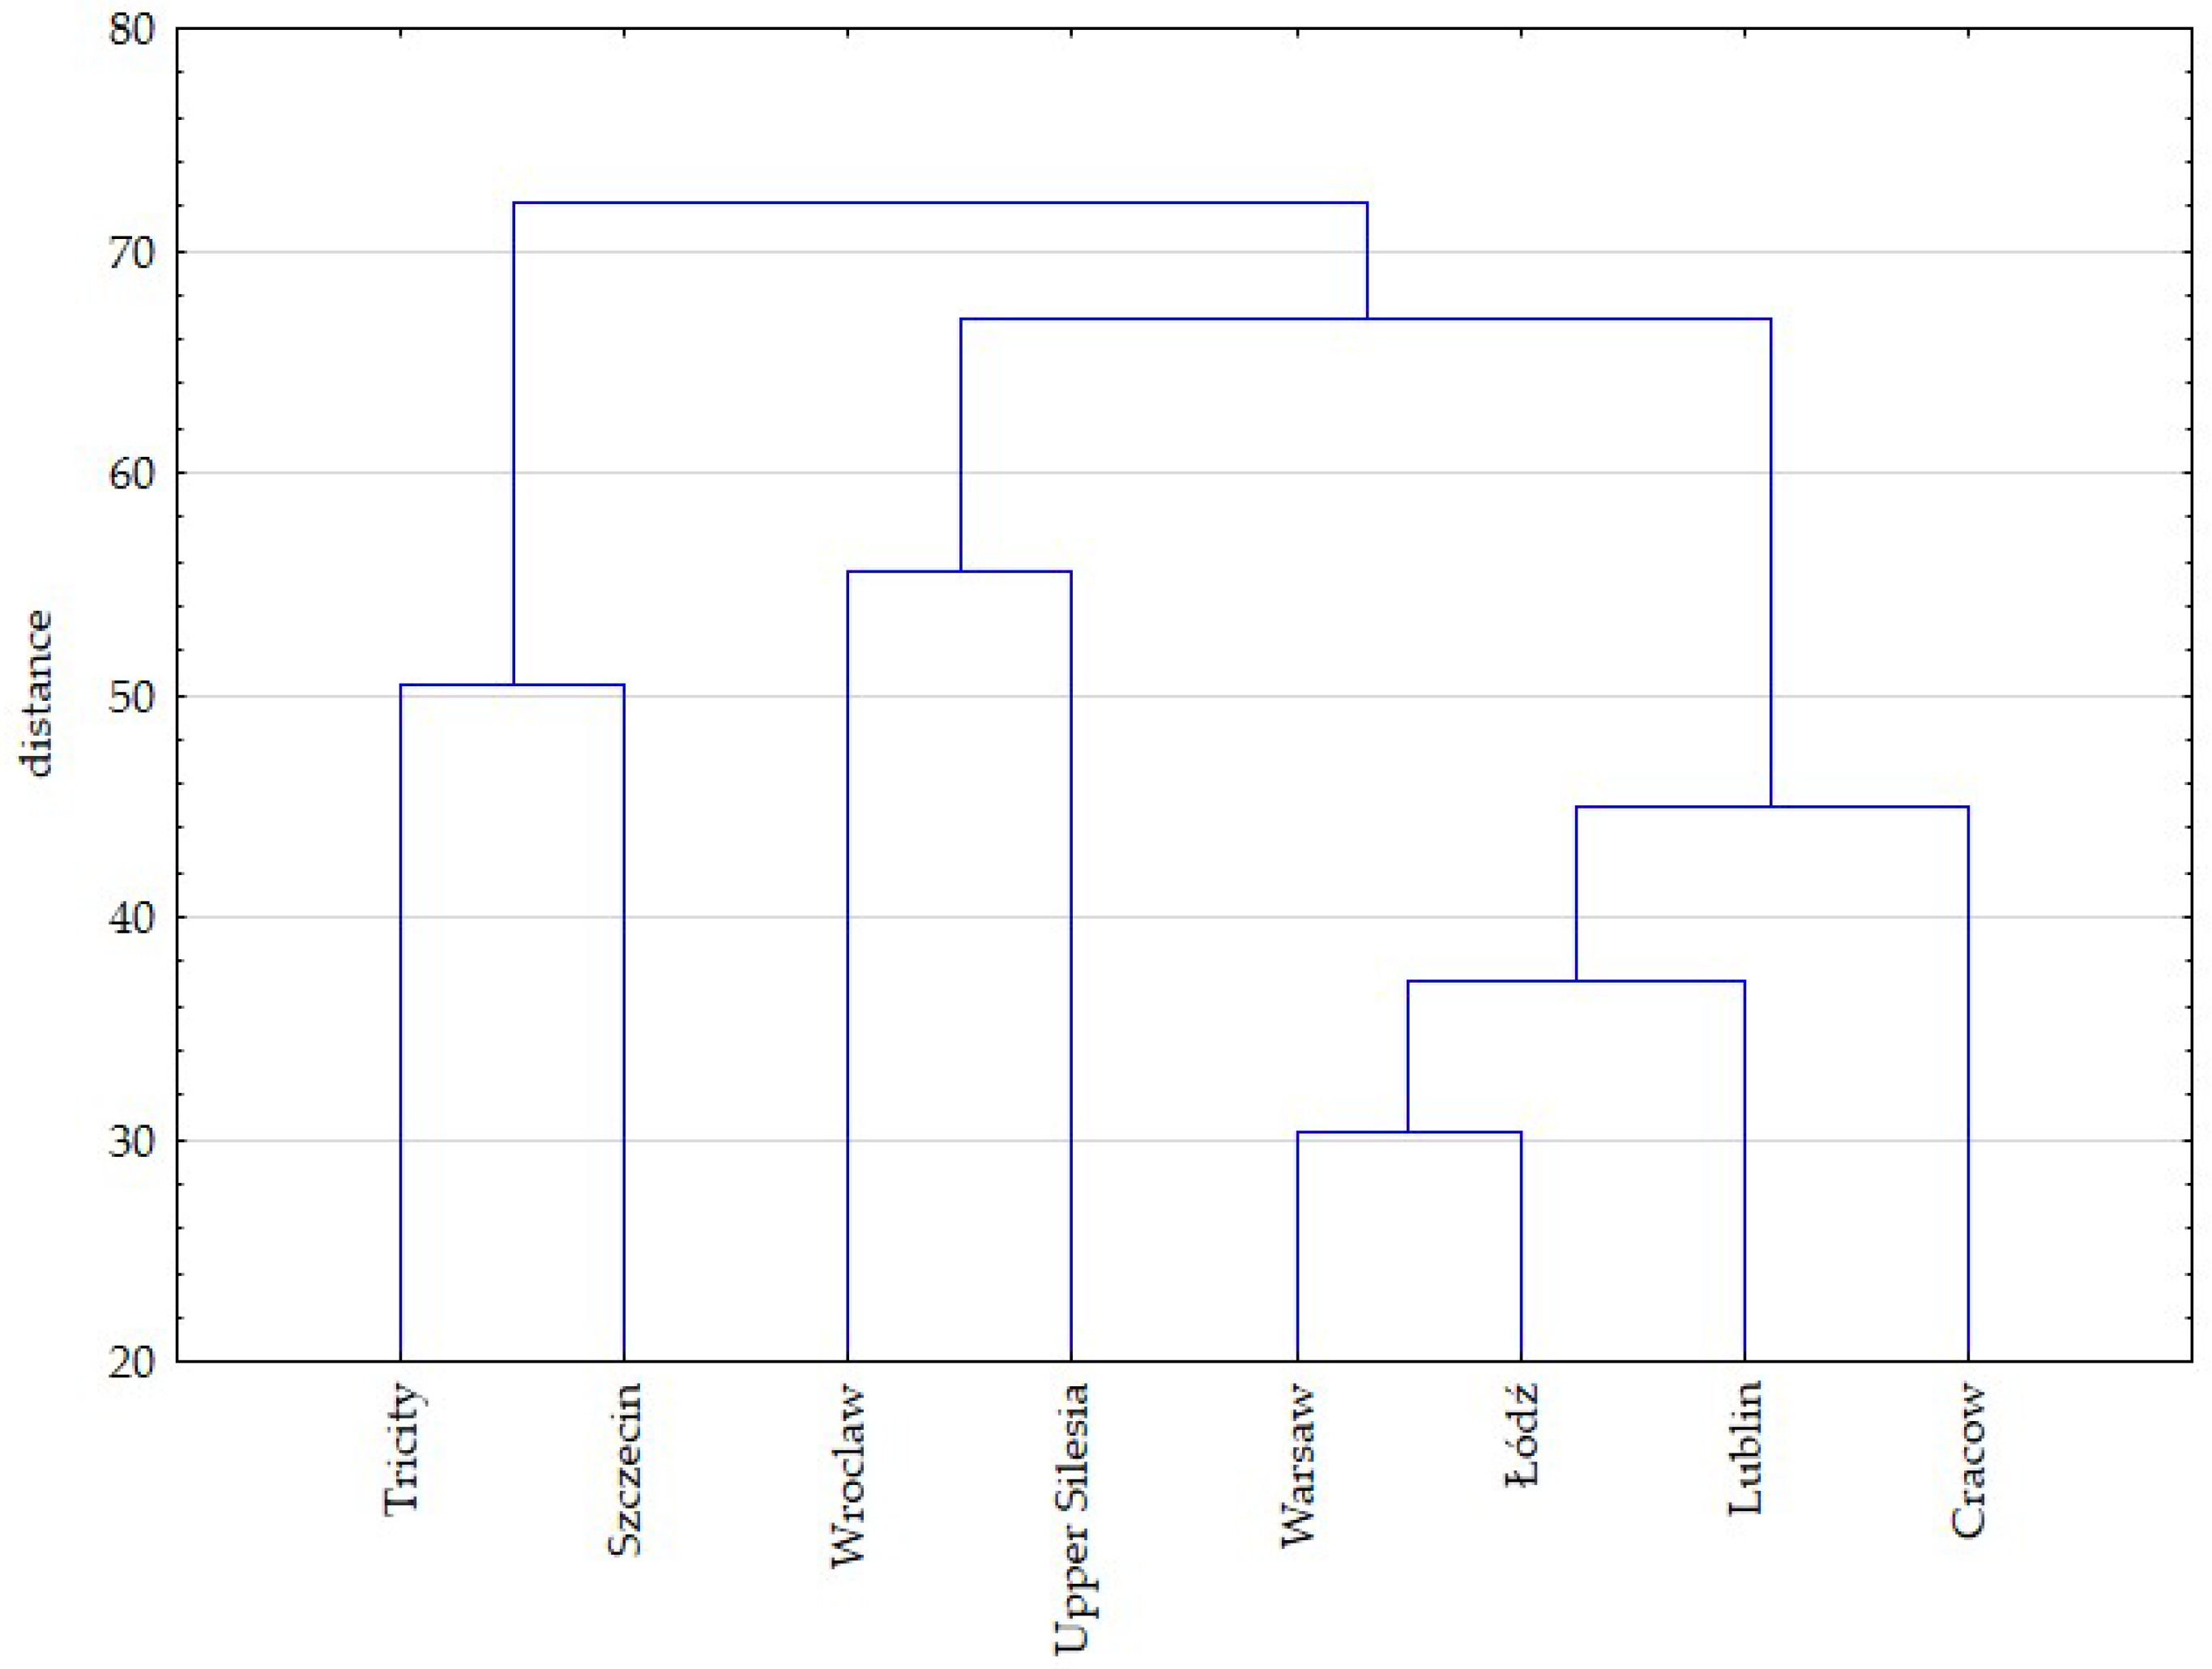
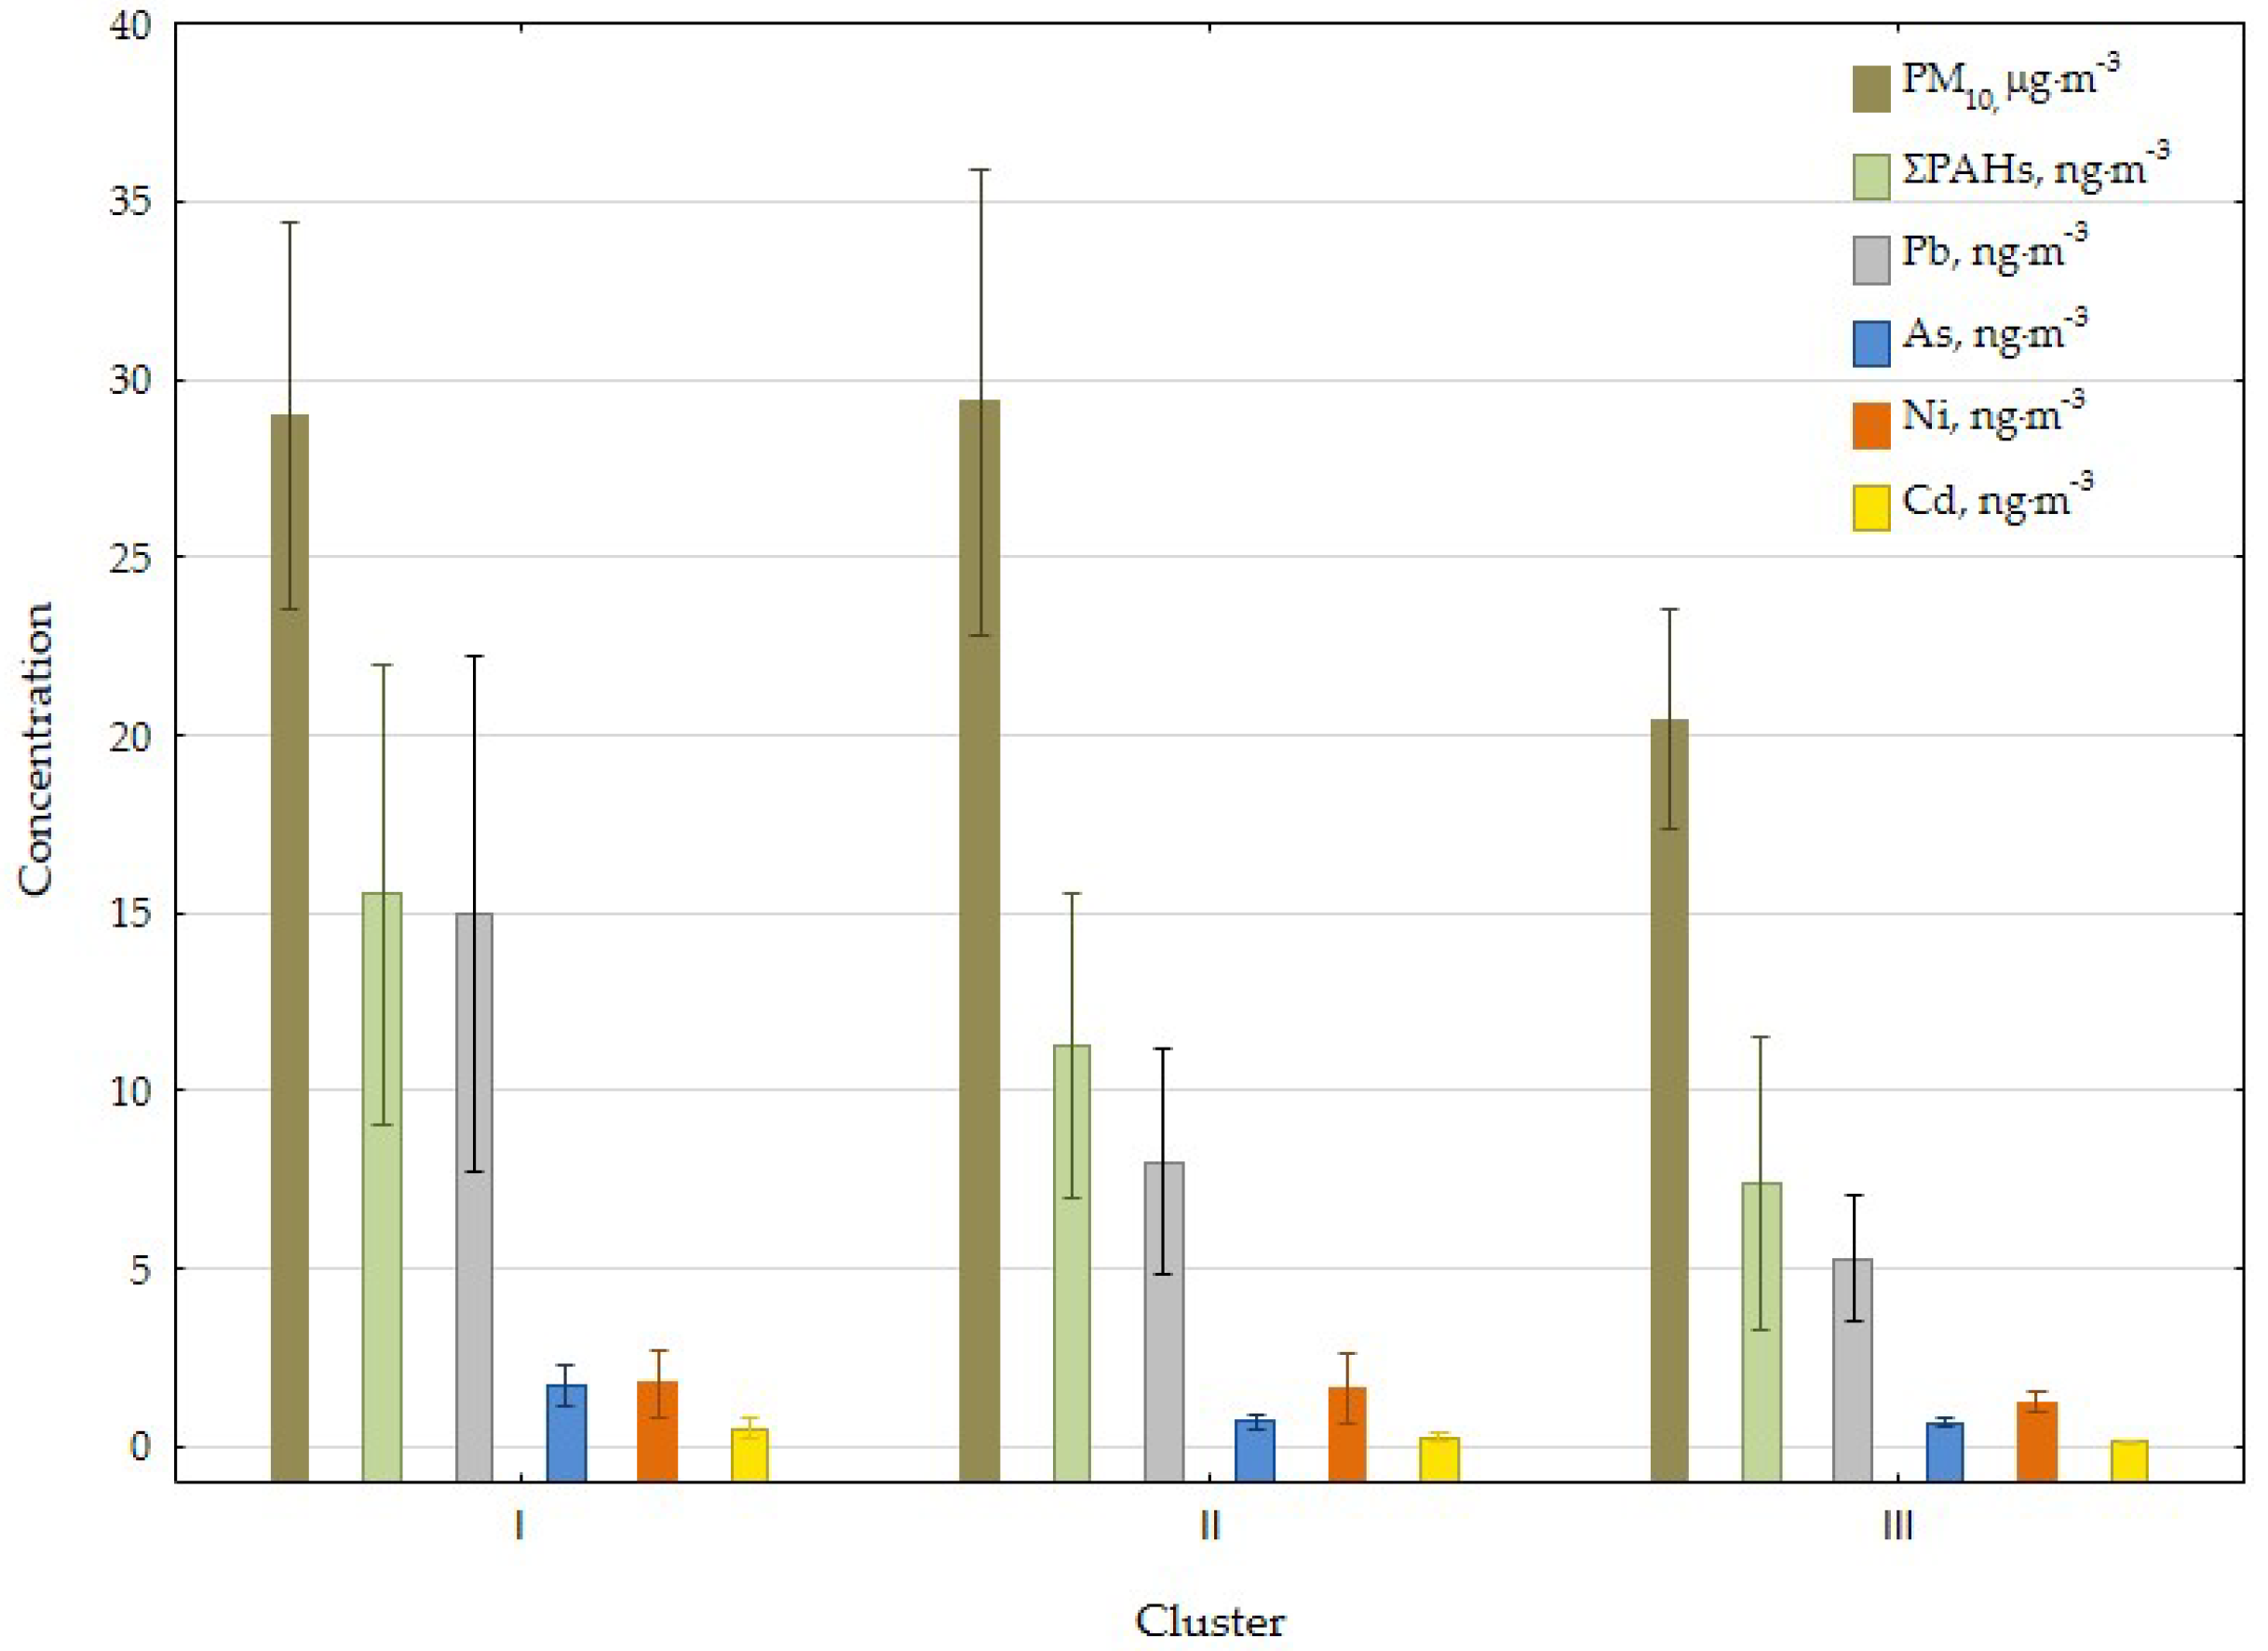
2.2. Statistical Analysis

To provide a comprehensive yet concise characterisation of the analysed concentrations, fundamental descriptive statistical parameters were computed for each monitoring station. These included the mean, median, standard deviation, maximum and minimum values, as well as the first and third quartiles. To find similarities between individual agglomerations, cluster analysis was used to distinguish groups/clusters (in this case, agglomerations). A single input vector was created for each city, covering the average daily concentrations of all the analysed pollutants (PM10, PM10-bound metals, and PM10-bound PAHs) from 2018 to 2022. The full-time period was analysed, and the data were not aggregated. Finally, each agglomeration was represented by a set of values corresponding to the daily concentrations of all pollutants, enabling their levels and structures to be considered simultaneously.
The Ward method employed the variance analysis approach to estimate distances between groups and calculate the distances between individual clusters. Before starting the cluster analysis, the input data was standardised so that when calculating the distance between objects, the variables had comparable values. The outcome of the cluster analysis was recorded as a dendrogram. All statistical analyses were conducted using Statistica 13 software from StatSoft, with a significance threshold set at α = 0.05.

2.3. Cancer Risks Assessment

According to the United States Environmental Protection Agency (USEPA) [65,66], probabilistic methods can be used to estimate the health risks associated with exposure to polycyclic aromatic hydrocarbons and heavy metals in particulate matter (PM10). As a result, the Incremental Lifetime Cancer Risk (ILCR) method was used to assess the possible cancer risk from seven PAHs and four heavy metals found in PM10. A gender-specific analysis was conducted for both males and females. The assessment focused on inhalation as the primary exposure pathway.
The ILCR is defined as the increased probability of an individual developing cancer over their lifetime due to cumulative exposure to selected carcinogens. It was calculated for lifetime exposure. The ILCR quantifies the probability of developing cancer as a result of exposure to PM10-bound metals and PAHs. For example, an ILCR of 1 × 10⁻⁵ indicates that an additional case of cancer could occur among 100,000 individuals exposed to these substances.
We assessed exposure via inhalation using the formula in Equation (1) to estimate the lifetime average daily inhaled dose (LADDinh) [67,68,69,70]:
L A D D i n h = C a i r × I R i n h × E F × E D × c f B W × A T ,
where Cair—concentration PAHs/heavy metals in air (ng·m−3); for the PAHs was used the B[a]P equivalent concentration (TEQ) calculated according to: TEQ = ∑CiPAH × TEFiPAH, toxic equivalent factor (TEF) values for B[a]A, B[a]P, B[b]F, B[j]F, B[k]F, DBA, IP were adopted as 0.005, 1, 0.1, 0.05, 0.05, 1.1, 0.1, respectively as per Larsen and Larsen [71]. IRinh—air inhalation rate 20.9 for males and 16.2 for females (m3·d−1) [72], EF—exposure frequency 350 (d·yr−1) [73], ED—exposure duration (18 to average life expectancy of males/females—Table S2) (yr), cf—conversion factor 10−6, BW—body weight 86 for males and 73 for females (kg), AT—averaging time for carcinogens 365 d·yr−1 × ED (d).
The health risks associated with carcinogenic pollutants and the incremental lifetime cancer risk (ILCRinh) due to inhalation were calculated as the additional probability of developing cancer throughout a person’s lifetime due to prolonged exposure to these pollutants. The formula for calculating ILCRinh is as follows [68,74]:
I L C R i n h = L A D D i n h × ( C S F i n h × B W 70 ) 3 ,
where CSFinh cancer slope factor for As, Pb, Cd, Ni, TEQ is 1.2 × 101, 4.2 × 10⁻², 1.5 × 101, 9.1 × 10⁻¹, and 3.9, respectively (mg·kg−1·d−1)−1 [75].
In Equation (2), we corrected the cancer slope factors for non-standard populations using the correction term B W / 70 3 , in accordance with USEPA guidelines [76]. This is because our calculations used gender-specific body weights that differed from the standard reference weight of 70 kg. This adjustment is often omitted in studies because its effect on the calculated ILCRinh values is generally negligible, and researchers typically assume a default adult reference weight of 70 kg [68,77].
The incremental lifetime cancer risk associated with inhalation was calculated as the sum of ILCRPAH and ILCRHM.

3. Results and Discussion

Poland has experienced excessive air pollution for decades. According to the Institute of Environmental Protection—National Research Institute (IEP-PIB), a downward trend in the concentrations of PM10 and other pollutants has been observed since 2010, affecting both annual and daily averages [78]. However, current concentrations of PM10, PM10-bound PAHs, and PM10-bound metals (Pb, Cd, Ni, and As) remain significantly elevated, particularly in urban areas such as Upper Silesia, Cracow, Łódź, and Wroclaw [61].

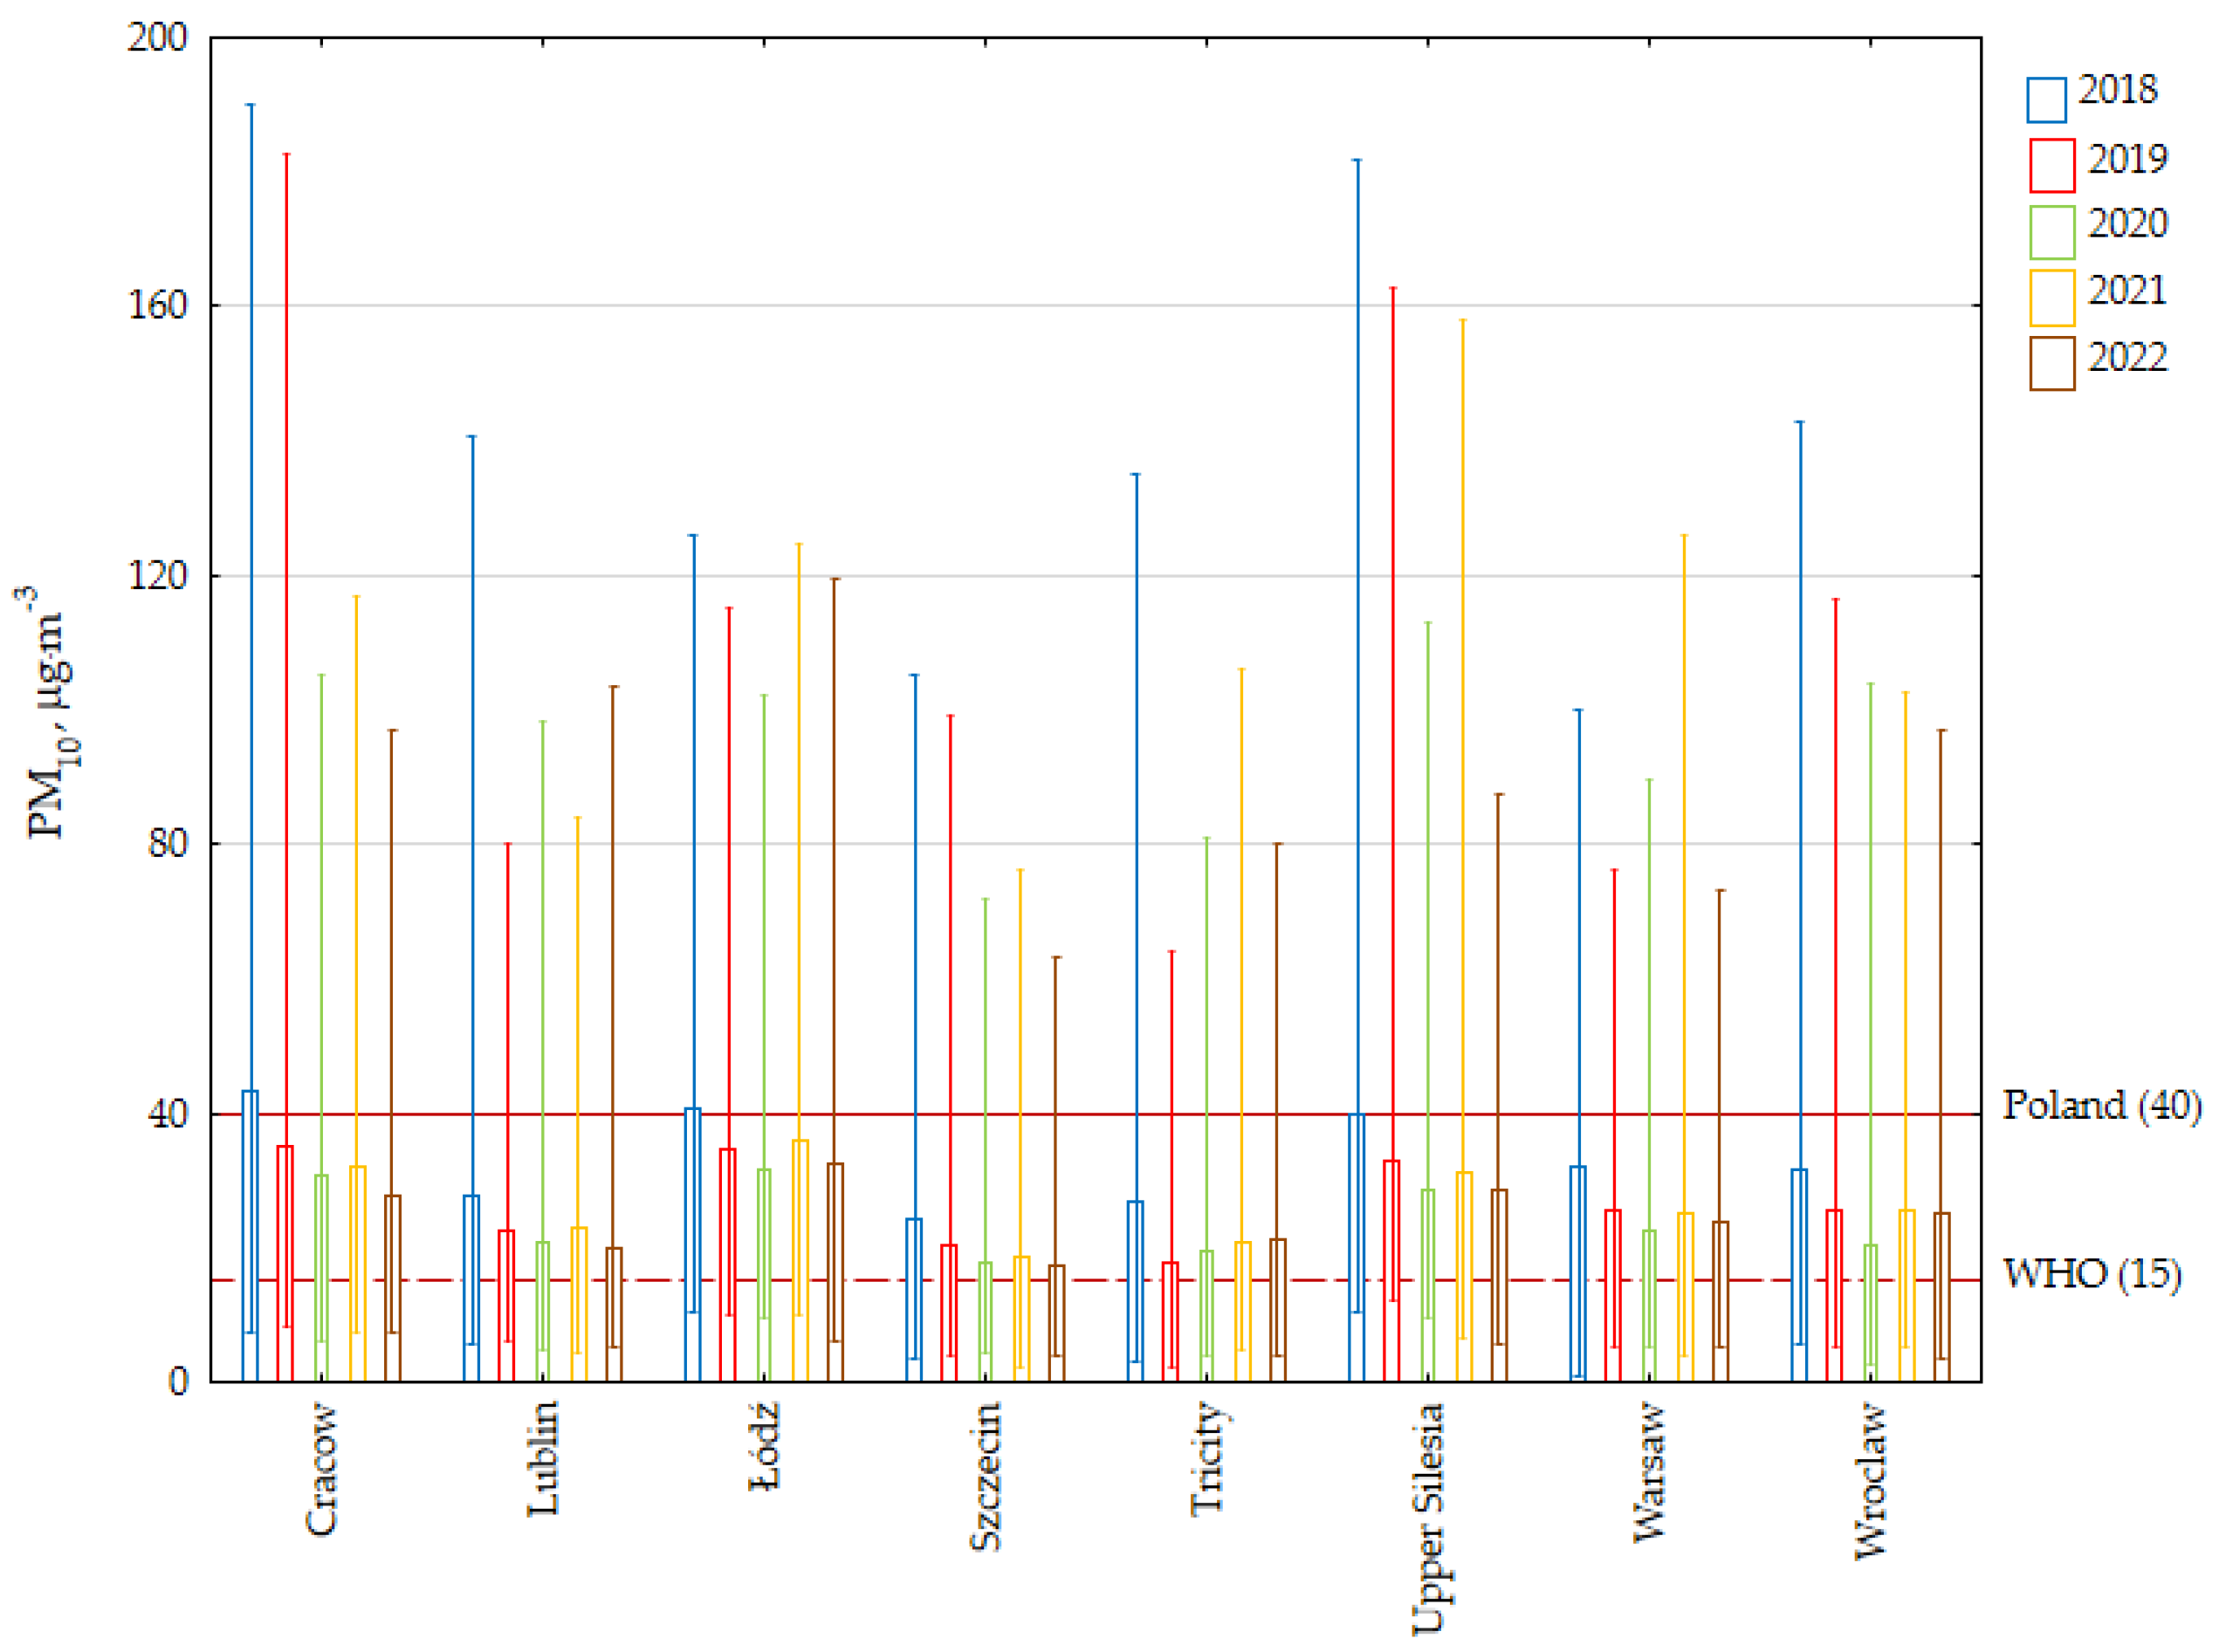
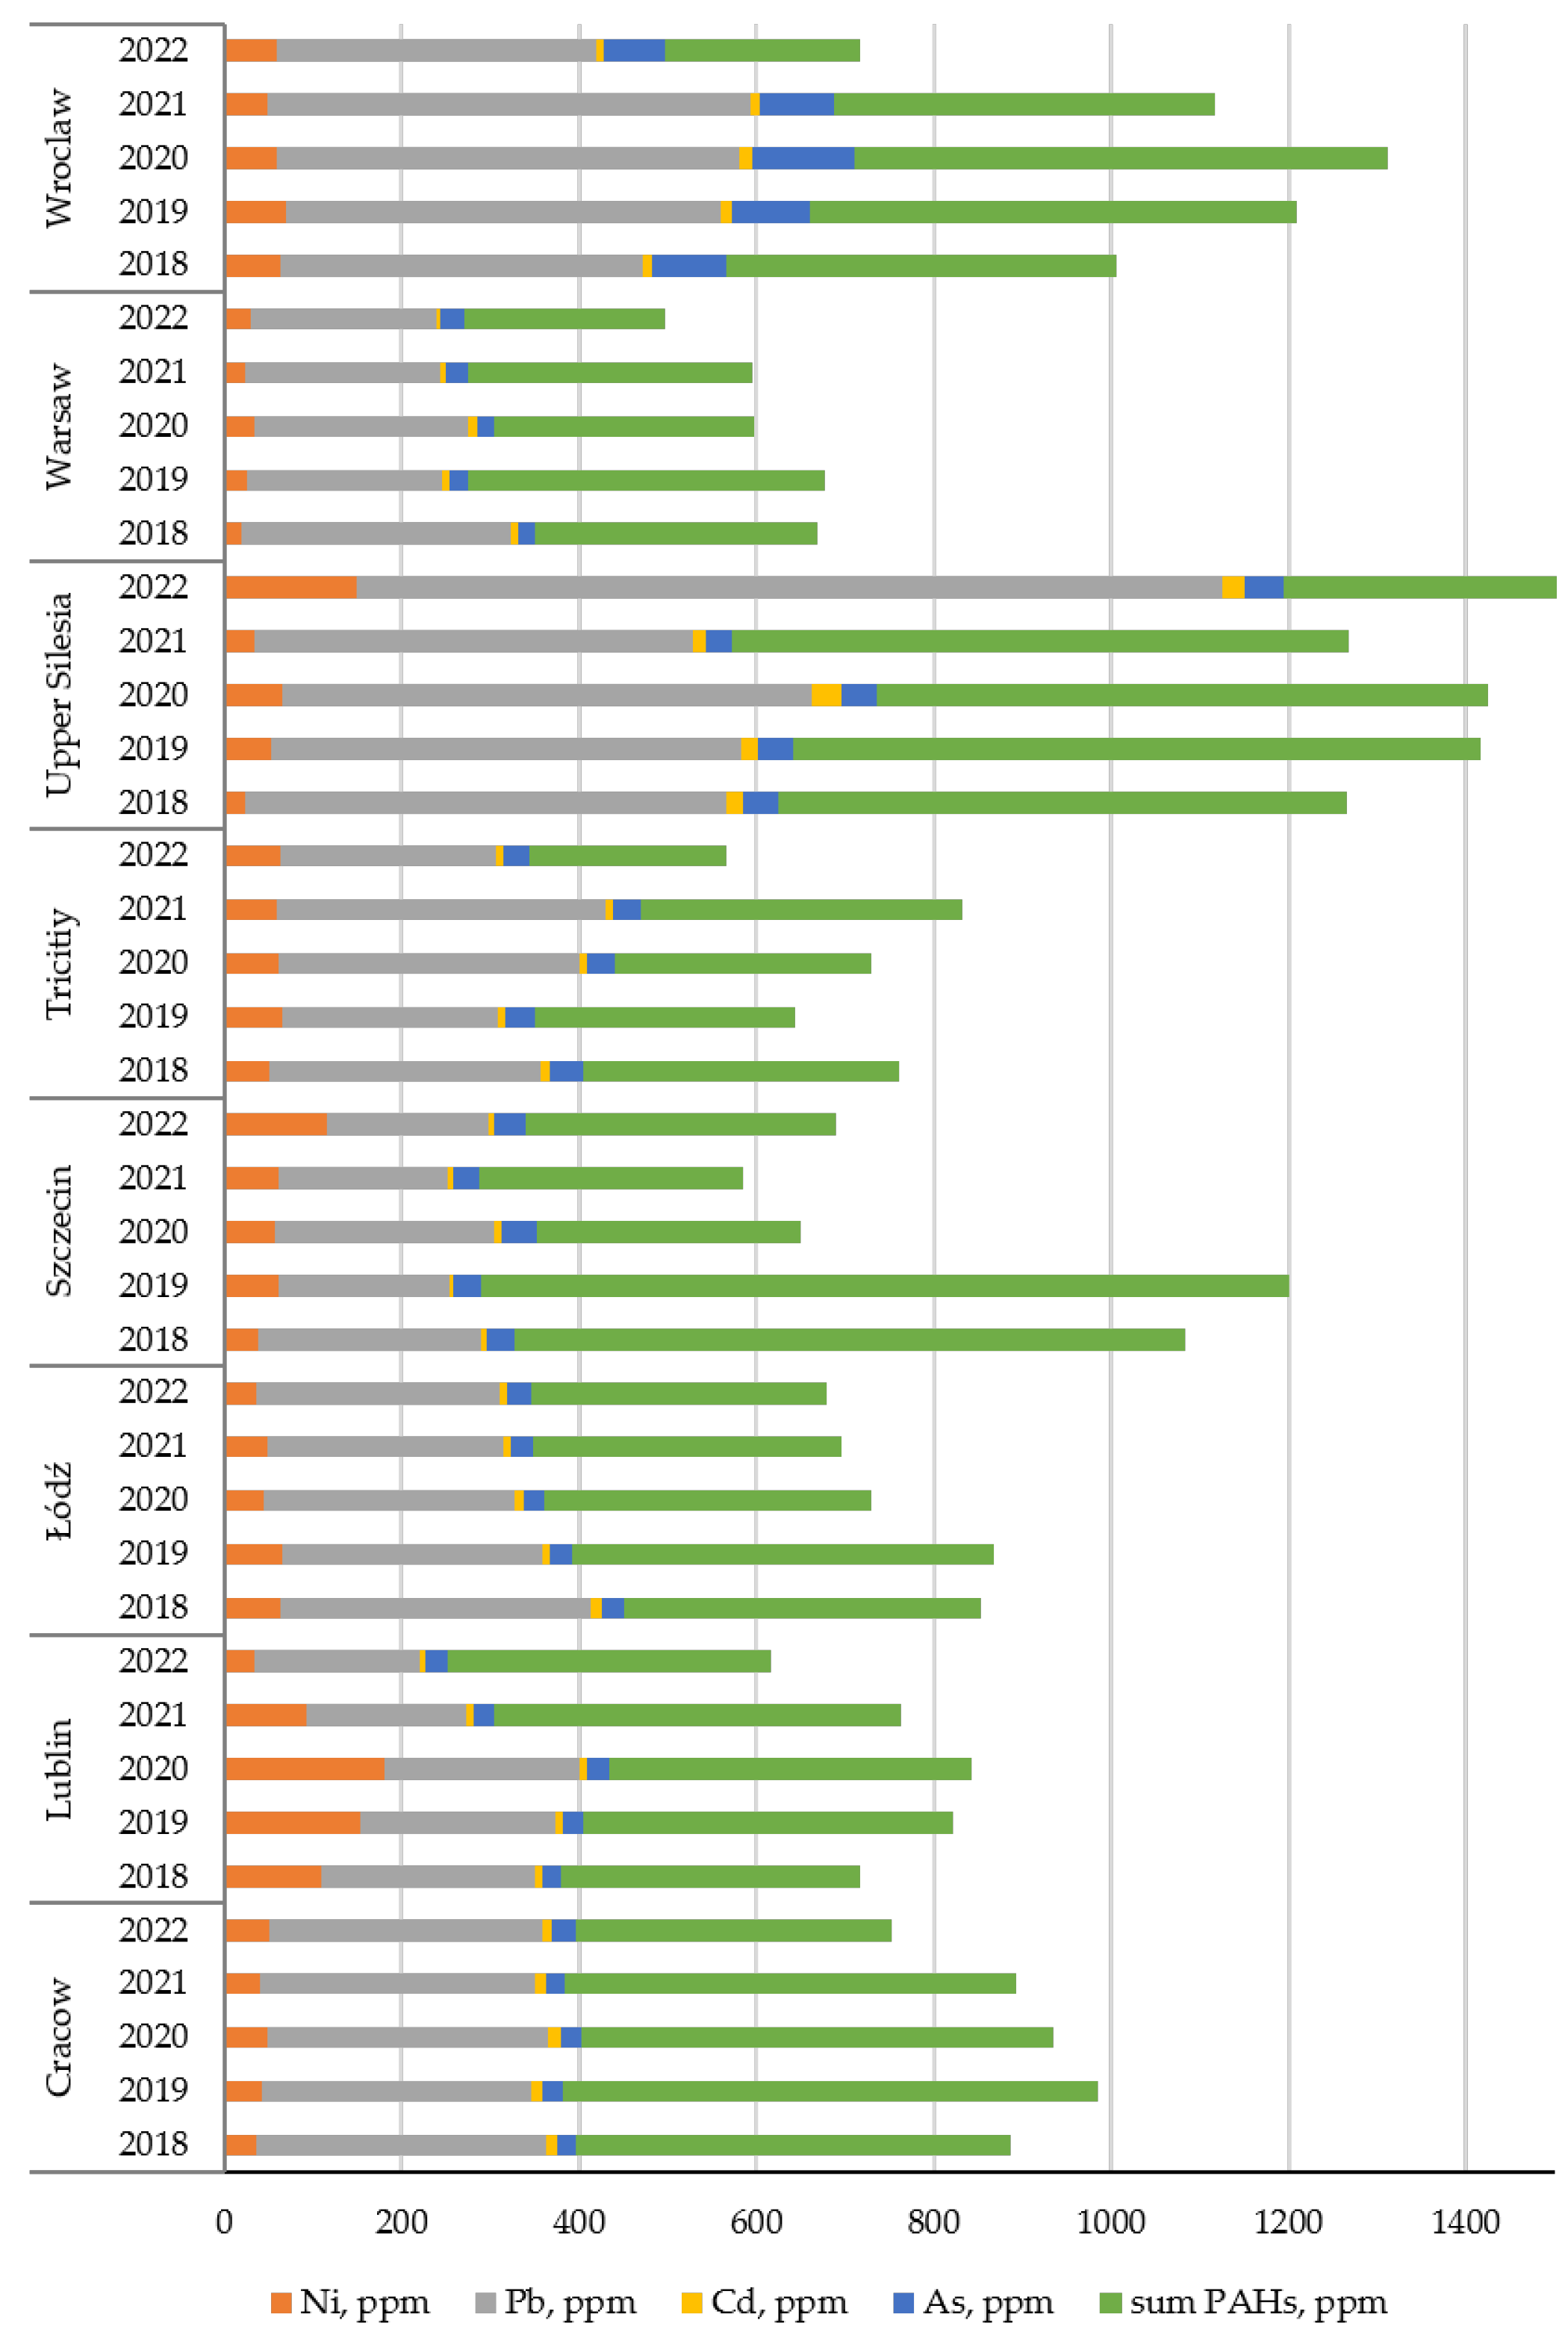
3.1. The Concentration of PM10 and PM10-Bound PAHs, and PM10-Bound Metals

In major Polish urban agglomerations between 2018 and 2022, the annual mean PM10 concentrations ranged from 17.42 to 43.20 µg m−3, depending on location and year (Table S3). Despite the observed downward trend recently, these values considerably exceed those reported in most other European countries [79,80]. The results of other detailed studies conducted in various Polish cities confirm similar trends, indicating a decrease in air pollutant concentrations [81,82]. In 2022, Poland’s annual average PM10 concentration reached 23.99 μg m−3, whereas in Slovakia, Lithuania, the Czech Republic, and Latvia—where these pollutants are also prevalent—the values were 20.91, 19.75, 19.00 and 18.09 μg m−3, respectively [54]. The highest multi-year mean PM10 concentration (average of annual values for the period 2018–2022) was recorded in the Łódź (35.04 μg·m−3), Cracow (33.75 μg·m−3) and Upper Silesia (32.31 μg·m−3) agglomerations. The lowest levels were recorded in the Szczecin (19.73 μg × m−3) and Tricity (21.13 μg × m−3) agglomerations. In 2018, the average annual concentrations in the agglomerations of Cracow, Łódź and Upper Silesia exceeded the national limit value of 40 µg·m−3 [83]. Compared to the WHO guideline of 15 µg × m−3, exceedances occurred at all monitoring stations in all years (Figure 2). Additionally, the regulatory threshold of 50 µg/m3 is exceeded on more days per year than is permitted [83]. The maximum average daily concentration recorded in Cracow was 190.2 μg × m−3, which is almost four times higher than the permissible limit. This highlights the seriousness of acute pollution episodes. Cracow’s specific location in the Vistula River valley naturally weakens the influx of westerly winds, which are dominated by hills to the west. Consequently, wind speeds in the city tend to be much lower than in the surrounding areas, which limits the city’s natural ventilation [84,85]. In addition, a temperature inversion often forms over Cracow, leading to higher concentrations of PM10, particularly on windless, cold days, mainly during the autumn and winter. While the presence of the Vistula River has a positive effect on local aeration, it is unable to completely negate the effects of the inversion and restricted air circulation.
Poland has consistently recorded the highest average annual concentrations of B[a]P of all European countries. In 2022, the concentration of this representative compound from the PAH group reached 2.41 ng·m−3, whereas in Slovakia, the Czech Republic, and Croatia, where B[a]P levels are also elevated, the values were 1.51, 1.19, and 0.87 ng·m−3, respectively [54]. The presented study found that all major urban areas in Poland experienced peak B[a]P concentrations in 2018, ranging from 1.50 ng·m−3 in Warsaw to 4.89 ng·m−3 in Cracow, with similarly high levels observed in Upper Silesia (4.73 ng·m−3). It is notable that the results of the studies conducted by Kaleta and Kozielska [86] in the Silesian Voivodeship confirm the persistence of high B[a]P concentrations in this region, with annual averages ranging from 6.2 to 7.1 ng·m−3 between 2018 and 2021. Significantly, average B[a]P concentrations can exceed 28 ng·m−3 during the heating season (from October to the end of March). These concentrations significantly exceed the regulatory limits established by the EU (1 ng·m−3) and the WHO (0.12 ng·m−3).
Table 1 shows the annual average concentrations of PM-bound ∑7 PAHs. The highest concentrations were consistently recorded in Upper Silesia, Cracow, and Łódź. Although levels decreased over the study period, they remained very high. In 2018, the maximum concentration of PAHs was observed in Cracow, reaching 101.58 ng·m−3. Szczecin also exhibited a high annual average concentration of total PAHs in the same year, at 18.50 ng·m−3, which was 2.7 to 3.5 times higher than in subsequent years. Benzo[a]pyrene constitutes between 12% and 25% of the total ∑7 PAH concentration. The high concentrations of PAHs in urban areas of Poland, including less urbanised regions, are primarily attributed to communal and household emission sources. In 2021, total PAH emissions amounted to 260.51 Mg, 206.53 Mg (79.28%) of which originated from household fuel combustion [87]. Exceedances of permissible levels of B[a]P and its congeners are mainly caused by the combustion of solid fuels in household boilers, particularly coal and wood [86,88,89,90,91].
Of the analysed metals, Pb and Ni were the most abundant in PM10 at the monitored stations. Their annual mean concentrations in the eight agglomerations between 2018 and 2022 ranged from 3.19 to 27.85 ng·m−3 for Pb and from 0.61 to 4.27 ng·m−3 for Ni. Lower concentrations were recorded for As (0.45 ÷ 2.66 ng·m−3) while Cd was the least abundant metal in PM10, with concentrations ranging from 0.10 to 1.00 ng·m−3 (Table S3). To better understand these differences, it is important to consider national emission inventories.
In 2021, the annual emissions of Pb, Ni, As, and Cd in Poland amounted to 279.90 Mg, 77.41 Mg, 14.95 Mg, and 10.96 Mg, respectively. While industrial processes were the main source of Pb, Cd and As emissions-accounting for 55%, 39% and 36% of total emissions, respectively—the dominant source of nickel was fuel combustion in the energy sector, accounting for 43% of national Ni emissions [87].
The diverse emission sources, meteorological conditions, and urban characteristics of the individual agglomerations contribute to the observed regional differences in heavy metal concentration levels. The highest average annual concentrations of Pb, Cd, and Ni were recorded in the Upper Silesia Agglomeration (Pb: 27.85 ng·m−3; Cd: 1.00 ng·m−3; Ni: 4.27 ng·m−3). This is a consequence of the large number of industrial facilities in the area, including coal-fired power stations, steel mills, coking plants, and other industrial plants. Numerous studies confirm that emissions from the combustion of fossil fuels, metallurgy, and metal ore processing are the main sources of these elements in PM10 in this region [92,93,94]. However, of particular significance is the fact that the highest maximum daily average lead concentration in the period 2018–2022 was not recorded in the Upper Silesia Agglomeration but in Wroclaw in 2021, at 106.02 ng·m−3. This is over 26% higher than the maximum lead concentration recorded in Upper Silesia in the same year (83.80 ng·m−3). Despite the area’s lack of heavy industries, such high concentrations may be the result of local episodes of low emissions, increased road traffic, and specific meteorological conditions favouring the accumulation of pollutants.
The studies by Kalbarczyk and Kalbarczyk [95], as well as Czernecki et al. [96], showed a strong link between high Pb levels and weather conditions like temperature and rainfall. They also highlighted how seasonal air inversions and stagnant air are important. Rogula-Kozłowska et al. [97] noted that road transport is a significant source of heavy metals, including Pb, in PM10 in cities that don’t have heavy industry, particularly in places with poor air circulation. They also emphasised the importance of seasonal air inversion and stagnation. Furthermore, the highest annual mean As concentrations, ranging from 1.71 to 2.66 ng·m−3, were recorded in Wroclaw each year. Such high As concentrations can be linked to local emission sources, primarily the individual heating of buildings and emissions from road transport, especially during the heating season. Additionally, the meteorological conditions typical of Wroclaw—frequent temperature inversions and episodes of poor air ventilation—favour the accumulation of As near the ground surface, thereby increasing its concentration in the air [98]. In Lublin, abnormally high annual mean nickel values (up to 3.79 ng·m−3) were observed between 2018 and 2020. Such high values may be due to local emissions, including the combustion of fuel oil and low-quality fuels in the municipal sector, as well as the activities of small workshops and metalworking businesses. The presence of Ni was also confirmed in Lublin street dust, indicating the role of road transport and dust resuspension [99]. Unfavourable dispersion conditions during the heating season, such as temperature inversion, may have further favoured Ni accumulation at ground level [100].
However, in Szczecin, researchers observed an unusually high annual mean nickel concentration of 2.01 ng·m−3 in 2022, despite generally lower concentrations of other metals being present. This variation may be partly attributed to the limited availability of measurement data in earlier years (approximately 50% of days monitored), as well as to specific local emission sources. Contributors are likely to include emissions from port operations, waterborne transport, and transshipment terminals, all of which are characteristic of this coastal region. Furthermore, frequent shifts in wind direction and high air humidity, which are common meteorological features in Szczecin, may influence the dispersion and deposition patterns of pollutants [101]. In comparison, other areas with a lot of road traffic and common use of solid fuels for home heating showed more consistent metal levels that followed clearer seasonal and weather patterns, like thermal inversions and low air movement.
It should also be noted that the concentration of the analysed pollutants—Pb, Ni, Cd, As, and ∑PAHs—can reach 1.69 mg per gram of PM10 (Figure 3). An extreme case was recorded in Upper Silesia in 2022, where the Pb content alone reached 0.97 mg per gram of PM10. Unfortunately, PM10 in Upper Silesia is rich in heavy metals and PAHs, with total pollutant concentrations ranging from 1.26 to 1.69 mg per gram. Similar pollutant levels, exceeding 1000 ppm, were observed in Wroclaw (2018–2021) and Szczecin (2018–2019). In the case of Szczecin, the elevated concentration levels observed during this period can be attributed to the fact that measurements covered less than 80% of the annual total. In general, across Poland, lead and polycyclic aromatic hydrocarbons constitute the largest share of pollutants in PM10.
Based on cluster analysis using Ward’s method, the agglomerations were grouped according to the similarity of the PM10 and PM10-bound Pb, Ni, Cd, As and PM10-bound PAH concentrations for the period 2018–2022. The application of this method made it possible to distinguish three statistically distinct groups of agglomerations: cluster I—Upper Silesia, Wroclaw; cluster II—Warsaw, Łódź, Lublin, Cracow; cluster III—Tricity, Szczecin (Figure 4). To deepen the analysis within each cluster, the mean concentration values of each pollutant analysed were compared along with the standard deviation (Figure 5).
This procedure made it possible not only to confirm cluster differences but also to determine the degree of variability, the level of environmental pressure, and potential emission sources. The first cluster includes agglomerations: Wroclaw and Upper Silesia which have much higher pollution levels, especially for lead (14.97 ± 7.27 ng·m−3), arsenic (1.73 ± 0.60 ng·m−3), cadmium (0.49 ± 0.28 ng·m−3) and ∑PAHs (15.53 ± 6.44 ng·m−3) with average concentrations of these metals being 2–3 times greater than in clusters II and III. These agglomerations are characterised by the highest pollution levels and high daily and seasonal variability. This situation may be due to the strong industrialisation of these regions, the high proportion of low emissions, and the significant impact of traffic emissions. Similar results have been obtained in studies conducted in Romania, Malaysia, and China, where urban agglomerations with a dominant share of industrial and road emissions showed high levels of metals in PM10 [102,103,104]. The second cluster is formed by agglomerations: Warsaw, Cracow, Łódź, and Lublin. Although the average PM10 concentrations (29.36 ± 6.57 μg·m−3) are comparable to group I, the levels of metals and ∑PAHs are noticeably lower.
This variation indicates a different structure of the pollution profile—the dominant role is most likely played by traffic-related emissions, low emissions during the winter season, and dense urban development. Despite geographic differences, the similarity of urban layout and local emission sources leads to similar pollution levels and structure. Other researchers [82,105,106,107] found similar trends, showing that the PM10 levels were mainly influenced by local factors like building designs and transportation intensity, leading to a consistent pattern in urban areas where road emissions are the main source. The third cluster is formed by the Szczecin and Tricity agglomerations, which show substantial similarity among themselves, as well as significant distinctiveness in relation to the other cities. Lower levels of PM10 (20.43 ± 3.09 μg·m−3) and associated compounds may be related to more favourable ventilation conditions (e.g., proximity to the sea, coastal winds, open development), less frequent inversion, and thus better dispersion of pollutants, as well as lower saturation of heavy industry and a greater share of natural emission sources. A similar observation was described in an article [108] concerning port regions in Italy, where cluster analysis revealed the distinctiveness of zones exposed to lower industrial loads and better dispersal conditions.

3.2. Health Risk Assessment

The incremental lifetime cancer risk (ILCR) associated with inhalation exposure was estimated based on the concentrations of PM10-bound PAHs and PM10-bound metals in the atmospheric air. The analysis covered eight Polish agglomerations, with risk estimates calculated separately for adult men and women over a five-year period (2018–2022). The results are presented in Table 2.
The calculations considered a number of parameters, including the average life expectancy of males and females (Table S2). On average, women live longer than men, with the difference in Poland amounting to around seven years. Between 2018 and 2022, average life expectancy ranged from 70.4 to 75.9 years for men and from 78.7 to 83 years for women. During this period, particularly in 2020 and 2021, life expectancy decreased for both sexes (Table S2), primarily due to the impact of the COVID-19 pandemic. In 2021 alone, the pandemic accounted for an additional 48,805 male and 42,389 female deaths in Poland, with nearly 18% of all deaths that year being attributed to the virus [109].
Cancer remains the second leading cause of death in Poland, after cardiovascular diseases, accounting for around a quarter of all fatalities [60,110]. Historically, cancer incidence has been higher in men; however, since 2021, the number of newly diagnosed cases of cancer in women has surpassed that in men [111]. Lung cancer remains the leading cause of cancer-related death, accounting for 22% of fatalities. In 2021, it caused 20,841 deaths nationwide [110,111]. Air pollution, both outdoor and indoor, is estimated to contribute to around 2% of all cancer-related deaths in Europe. For lung cancer specifically, the proportion is considerably higher, with conservative estimates at 9%, and more comprehensive assessments suggesting up to 17% [112,113].
In our study, people living in Upper Silesia, Cracow, and Wroclaw were the groups most affected by air pollutants that can cause cancer or might cause cancer (such as PM10-bound PAHs and PM10-bound HM) through breathing, among Polish urban agglomerations. As shown in Table 2, the highest ILCR values for adult men in 2018 were recorded in Upper Silesia (1.11 × 10⁻⁵) and Wroclaw (1.02 × 10⁻⁵). The ILCR values for women were slightly lower but comparable overall. Although some studies suggest that women may be at a higher risk of carcinogenesis due to their lower body weight, our results consistently show higher inhalation rate coefficients (IRC) for men across all investigated agglomerations. The difference is primarily due to the higher inhalation rates assumed for men (20.9 m3·day−1) than for women (16.2 m3·day−1), based on exposure factors commonly used in environmental risk assessments. When normalised by body weight, the inhaled air volume per kilogram of body weight is slightly higher for men (0.24 m3·kg−1·day−1) than for women (0.22 m3·kg−1·day−1). This means that, despite men’s higher body weight, the greater air intake rate is the dominant factor influencing the ILCR. Other studies have observed similar relationships, with differences in inhalation rate outweighing the effect of body weight in ILCR calculations [114]. The finding indicates that factors such as inhalation rate can greatly affect risk estimates and should be considered when examining differences in ILCR between sexes.
Furthermore, Wu et al. demonstrated that exposure levels were significantly higher in the winter than in the summer [114]. Studies by Kaleta and Kozielska [86] and Agudo-Castaeda et al. [115] also observed this dependency.
According to standard ILCR risk assessment guidelines, values below 1 × 10⁻⁶ are considered negligible. Values between 1 × 10⁻⁶ (1 in 1,000,000) and 1 × 10⁻⁴ (1 in 10,000) indicate a potential cancer risk, whereas values exceeding 1 × 10⁻⁴ are associated with a high potential risk and may necessitate corrective action [116]. In Polish agglomerations, based on the methodology applied in our study, no ILCR values below 1 × 10⁻⁶ were recorded at any monitoring site. At all locations, ILCR values fell within the 1 × 10⁻⁶ to 1 × 10⁻⁴ range. For males, the values ranged from 2.69 × 10⁻⁶ (Lublin) to 1.11 × 10⁻⁵ (Upper Silesia), and for females, from 1.20 × 10⁻⁶ (Warsaw, Lublin) to 4.87 × 10⁻⁶ (Upper Silesia). Upper Silesia is known as one of the most polluted regions in Poland [85,117].
In our study, we found that the levels of PAHs have the biggest effect on the ILCR value, followed by As, Cd, Ni, and Pb, making up 43.2%, 36.3%, 14.3%, 5.0%, and 1.2% of the total, respectively (Table S4). Interestingly, arsenic accounts for the largest share of the ILCR value in Wroclaw (60%), corresponding to values of 5.04 × 10⁻⁶ and 2.21 × 10⁻⁶ for men and women, respectively. A similar pattern was observed for Warsaw and the Tricity area, although in these cases, the impact of As on the ILCR value is only slightly greater than that of PAHs. The ILCR value in Upper Silesia during the studied time period is the highest in Poland for both men and women. Each year, the content of the analysed components exceeds 1200 ppm. The total amount of PAH concentrations is about 18 to 32 times greater than the amounts of As and Cd, but their impact on the ILCR is ranked as follows: PAHs make up 42.3%, As 30.1%, Cd 22.2%, Ni 3.7%, and Pb 1.7%.
The inhalation carcinogenic risk reported by other researchers (Table 3) varies significantly depending on location, age group, pollution level, and season. The highest risks were observed in Zabol, Iran, where the ILCR for adults was 4.5 × 10⁻⁴, and in Bengbu, China, where the values for adults ranged from 1.51 × 10⁻⁴ to 8.11 × 10⁻⁴. Seasonal and scenario-based differences, as observed in Poland, Los Angeles, and Milan, demonstrate the significant impact of heating periods, smog episodes, and local air quality on exposure levels. For instance, in Poland’s Silesian Voivodeship, ILCR values ranged from 6.72 × 10⁻⁶ to 9.74 × 10⁻⁵ during the heating season, dropping to 0.6 × 10⁻⁶ to 8.7 × 10⁻⁶ outside of it. In Los Angeles, the ILCR varied from 2.07 × 10⁻⁶ to 3.36 × 10⁻⁶ between the best- and worst-case scenarios. Although the ILCR values in Polish cities in this study are lower than those in the most polluted areas, they are still important for public health, showing that we need to keep managing air quality.
Toxicological studies by Majewski et al. [122] have demonstrated a higher risk of heavy metal exposure among the Zabrze population compared to the Warsaw population. These findings are consistent with the results of our study. Furthermore, numerous researchers have observed that adults may be slightly more susceptible to developing cancer due to exposure to heavy metals and PAHs than children [114,122,123,124]. However, it should be noted that children are more vulnerable to the adverse effects of environmental pollution and even lower ILCR values in children than in adults may pose a significant risk to their health.
The calculated lifetime lung cancer risk values are based solely on exposure via inhalation to the PAHs and four heavy metals contained in PM10. It is important to note that this study did not include certain hazardous substances, such as chromium (particularly Cr(VI)), which are known carcinogens associated with PM exposure [30]. Therefore, the calculated ILCR values should be considered conservative estimates, as they are based on a limited set of monitored substances. Including additional carcinogens, such as Cr(VI), could lead to higher ILCR values. The study by Dahmardeh Behrooz et al. [70] demonstrated that the calculated ILCR value of 4.5 × 10⁻⁴ for metals contained in TSP for adults is primarily influenced by Cr(VI) (approximately 55%) and As (43%). The ILCR value for this metalloid was found to be 1.9 × 10⁻⁴. The contributions from the other components (Pb, Ni, Co, and Cd) were found to be 3.8 × 10⁻⁷, 1.9 × 10⁻⁸, 5.2 × 10⁻⁶, and 9.6 × 10⁻⁸, respectively. Nevertheless, other factors can also influence and increase the risk of lung cancer, such as smoking, indoor emissions from burning solid fuels (coal and wood) in stoves, occupational exposure, or genetic factors of individuals [60]. Goudarzi et al. [125] suggest that the risk of developing cancer associated with inhaling PAHs via particulate matter through the oral and nasal pathways is negligible. However, Iakovides et al. [119] demonstrated that the lifetime cumulative cancer risk is influenced almost equally by inhalation (33%), ingestion (31%), and dermal contact (37%). Further studies support the substantial contribution of oral and dermal exposure routes to cancer risk in both children and adults [125]. Therefore, neglecting these additional exposure pathways could lead to an underestimation of the overall health risk in this study.
Conversely, exposure assessments are subject to inherent uncertainty because they rely on several assumptions. These include the exposure duration and frequency, inhalation rate, average body weight, and annual mean air pollutant concentrations. These parameters can vary considerably depending on individual characteristics, such as physical activity and lifestyle [72]. In particular, the inhalation rate can vary considerably. In the present study, however, these variables were not explicitly incorporated. Furthermore, the cancer slope factors applied in the risk assessment also entail a degree of uncertainty.
Using annual average pollutant concentrations fails to capture temporal exposure variability, which is particularly relevant in Poland. Here, both particulate matter levels and composition undergo significant seasonal fluctuations, with the most pronounced changes observed during the winter months [16,86,126]. In addition to this long-term variability, short-term smog episodes, especially in winter, can lead to acute spikes in pollutant concentrations that often exceed daily limit values several times over. Immediate health impacts are associated with these peaks, especially for vulnerable groups like children, the elderly, and individuals with pre-existing respiratory or cardiovascular conditions. Even brief exposure to such episodes has been associated with hospital admissions, asthma exacerbations, and elevated cardiovascular stress [127,128]. Given these fluctuations, the ILCR values estimated in this study should be interpreted as approximate indicators of potential carcinogenic risk. To better account for uncertainties and individual variability, probabilistic approaches such as Monte Carlo simulations should be employed [118,129]. Furthermore, incorporating a wider range of environmental variables and demographic characteristics would enhance the robustness and credibility of health risk assessments.

4. Conclusions

Air pollution from PM10 and other harmful substances, especially polycyclic aromatic hydrocarbons (PAHs) and heavy metals such as lead (Pb), cadmium (Cd), arsenic (As), and nickel (Ni), remains a significant environmental issue in Poland, particularly in densely populated urban areas. Although recent data show a downward trend in emissions and atmospheric concentrations of these pollutants, levels in many Polish agglomerations, such as Upper Silesia, Wroclaw, Cracow, and Łódź, still exceed EU and WHO standards. Of particular concern are the concentrations of benzo[a]pyrene (B[a]P), which exceed permissible levels several times over during winter. In Cracow, the average annual concentration of B[a]P was as high as 4.89 ng·m−3, which is well above the EU’s recommended value of 1 ng·m−3 and the WHO’s guideline of 0.12 ng·m−3.
Cluster analysis revealed three groups of agglomerations that differed in terms of pollutant concentration levels and structure. These groups reflect the influence of regional emission sources, urbanisation, and meteorological conditions. The first group (Upper Silesia and Wroclaw) exhibited the highest concentrations of heavy metals and PAHs, with an average lead level of 14.97 ± 7.27 ng·m−3 and ∑PAHs of 15.53 ± 6.44 ng·m−3. The second group (Cracow, Łódź, Warsaw, and Lublin) showed medium pollution levels dominated by traffic emissions, while the third group (Szczecin and Tricity) had the lowest concentrations and favourable airing conditions.
The study also included a cancer risk assessment using the Incremental Lifetime Cancer Risk (ILCR) method, with a focus on inhalation as the primary exposure pathway. This procedure enabled the actual impact of the hazardous substances contained in PM10 (and PM10 itself) on public health to be estimated. The highest average ILCR values were recorded in Upper Silesia (9.18 × 10⁻⁶ for males and 3.96 × 10⁻⁶ for females), and the lowest in the Warsaw area (3.16 × 10⁻⁶ for males and 1.40 × 10⁻⁶ for females). The calculated ILCR values for both sexes ranged from 1.20 × 10⁻⁶ to 1.11 × 10⁻⁵, indicating a level of health risk that cannot be considered negligible.
It is important to emphasise that this study focused on only a few pollutants. However, particulate matter is a chemically complex mixture containing many other toxic components, such as additional organic compounds, elemental carbon, and potentially carcinogenic metals (e.g., Cr(VI)), which were not included in our analysis. Furthermore, the risk assessment is based on several assumptions, including toxic equivalency factors (TEFs) for polycyclic aromatic hydrocarbons (PAHs), standardised average body weights, inhalation rates, and other exposure parameters. While inhaling ambient air is the main way in which the general population is exposed to PAHs and heavy metals, other pathways, such as dermal contact, ingestion, and combined exposure, can also contribute to the total absorbed dose. Consequently, the actual health risk associated with PM10 exposure may be underestimated. Another limitation relates to the frequency and continuity of data collection at certain monitoring stations, particularly in cities such as Szczecin. Insufficient data coverage may have affected the accuracy of the calculated annual average concentrations and, consequently, the ILCR estimates. Although we used all available measurements to provide the most reliable exposure assessment possible, the limited temporal coverage could have resulted in an under- or overestimation of actual exposure levels. To obtain a more comprehensive picture of the health risks associated with air pollution, future studies should consider a broader range of pollutants and their temporal variability. This would enhance our understanding of the various factors affecting ambient air quality and support the development of more effective public health policies.
Despite some limitations, the findings of this study clearly highlight the urgent need to continue anti-smog efforts and to implement effective local environmental protection policies, particularly in areas of significant industrial activity and high traffic density where residential emissions also play a significant role. It is also essential to establish effective public information systems to minimise the population’s exposure to carcinogenic air pollutants in urban areas. Further research is necessary to better understand the impact of toxic and carcinogenic air pollutants on human health, particularly among vulnerable groups such as children and the elderly.

Supplementary Materials

The following supporting information can be downloaded at: https://www.mdpi.com/article/10.3390/app15147903/s1, Table S1. Detailed information on the location of air quality monitoring stations [61] and the number of inhabitants in individual agglomerations in Poland [130]; Table S2. Average life expectancy of men and women in Polish agglomerations [131,132,133]; Table S3. Descriptive statistics of PM10 and PM-bound As, Cd, Ni, and Pb concentrations in the period 2018–2022 based on [61]; Table S4. Average incremental lifetime cancer risk due to inhalation exposure to PAHs and selected heavy metals in Polish Agglomerations, classified by sex.

Author Contributions

Conceptualisation, B.K. and D.K.; methodology, B.K. and D.K.; formal analysis, B.K. and D.K.; investigation, B.K.; resources, B.K.; data curation, D.K.; writing—original draft preparation, B.K. and D.K.; writing-review and editing, B.K.; visualisation, B.K. and D.K.; supervision, B.K.; project administration, B.K.; funding acquisition, B.K. and D.K. All authors have read and agreed to the published version of the manuscript.

Funding

This work was supported by the Faculty of Energy and Environmental Engineering, Silesian University of Technology (statutory research). No. 08/020/BK25/0047.

Institutional Review Board Statement

Not applicable.

Informed Consent Statement

Not applicable.

Data Availability Statement

The raw data supporting the conclusions of this article will be made available by the authors on request.

Conflicts of Interest

The authors declare no conflicts of interest.

References

  1. WHO. Ambient (Outdoor) Air Pollution. Available online: https://www.who.int/en/news-room/fact-sheets/detail/ambient-(outdoor)-air-quality-and-health (accessed on 28 April 2025).
  2. WHO. Compendium of WHO and other UN Guidance on Health and Environment, 2022 Update. Available online: https://apps.who.int/iris/handle/10665/352844 (accessed on 30 September 2024).
  3. Nazar, W.; Niedoszytko, M. Air Pollution in Poland: A 2022 Narrative Review with Focus on Respiratory Diseases. Int. J. Environ. Res. Public Health 2022, 19, 895. [Google Scholar] [CrossRef] [PubMed]
  4. Kim, K.H.; Jahan, S.A.; Kabir, E. A review on human health perspective of air pollution with respect to allergies and asthma. Environ. Int. 2013, 59, 41–52. [Google Scholar] [CrossRef] [PubMed]
  5. Garg, A.; Gupta, N.C.; Kumar, A. Relative risks of cardiopulmonary and lung cancer mortality by PM2.5 exposure in ambient air of Delhi particularly during smog episode. Environ. Claims J. 2023, 35, 205–222. [Google Scholar] [CrossRef]
  6. Quezada-Maldonado, E.M.; Sánchez-Pérez, Y.; Chirino, Y.I.; Vaca-Paniagua, F.; García-Cuellar, C.M. miRNAs deregulation in lung cells exposed to airborne particulate matter (PM10) is associated with pathways deregulated in lung tumors. Environ. Pollut. 2018, 241, 351–358. [Google Scholar] [CrossRef] [PubMed]
  7. Borck, R.; Schrauth, P. Urban pollution: A global perspective. J. Environ. Econ. Manag. 2024, 126, 103013. [Google Scholar] [CrossRef]
  8. Ahn, H.; Lee, J.; Hong, A. Urban form and air pollution: Clustering patterns of urban form factors related to particulate matter in Seoul, Korea. Sustain. Cities Soc. 2022, 81, 103859. [Google Scholar] [CrossRef]
  9. Kozielska, B.; Ferdyn-Grygierek, J.; Slezakova, K.; Sowa, J.; Hassan, S.K.M. Editorial: Indoor environmental air quality in urban areas. Front. Environ. Sci. 2024, 12, 1393997. [Google Scholar] [CrossRef]
  10. Yu, C.; Qin, Z.; Lu, Y.; Lin, H.; Yang, C.; Yuan, Q.; Wu, Q. Integrated strategies for road transportation-related multi-pollutant control: A cross-departmental policy mix. Transp. Res. D Transp. Environ. 2024, 132, 104257. [Google Scholar] [CrossRef]
  11. Barreira, L.M.; Lepistö, T.; Salo, L.; Helin, A.; Aurela, M.; Saarikoski, S.; Kuittinen, N.; Rönkkö, T.; Timonen, H. Comprehensive characterization of wintertime submicron aerosol in a Nordic town influenced by residential wood combustion, traffic and industrial sources. Atmos. Pollut. Res. 2023, 14, 101835. [Google Scholar] [CrossRef]
  12. Maceira, A.; Borrull, F.; Marcé, R.M. Occurrence of organic contaminants bonded to the particulate matter from outdoor air influenced by industrial activities. Environ. Sci. Pollut. Res. 2022, 29, 76644–76667. [Google Scholar] [CrossRef] [PubMed]
  13. Kozáková, J.; Pokorná, P.; Vodička, P.; Ondráčková, L.; Ondráček, J.; Křůmal, K.; Mikuška, P.; Hovorka, J.; Moravec, P.; Schwarz, J. The influence of local emissions and regional air pollution transport on a European air pollution hot spot. Environ. Sci. Pollut. Res. 2019, 26, 1675–1692. [Google Scholar] [CrossRef] [PubMed]
  14. Koolen, C.D.; Rothenberg, G. Air Pollution in Europe. Chem. Sus. Chem. 2019, 12, 164–172. [Google Scholar] [CrossRef] [PubMed]
  15. EEA. Country Fact Sheets. Available online: https://www.eea.europa.eu/en/analysis/maps-and-charts/air-quality-statistics-dashboards (accessed on 30 September 2024).
  16. Kozielska, B.; Rogula-Kozłowska, W.; Klejnowski, K. Selected organic compounds in fine particulate matter at the regional background, urban background and urban traffic points in Silesia (Poland). Int. J. Environ. Res. 2015, 9, 575–584. [Google Scholar]
  17. Ghosh, B.; Padhy, P.K.; Niyogi, S.; Patra, P.K.; Hecker, M. A comparative study of heavy metal pollution in ambient air and the health risks assessment in industrial, urban and semi-urban areas of West Bengal, India: An evaluation of carcinogenic, non-carcinogenic, and additional lifetime cancer cases. Environments 2023, 10, 190. [Google Scholar] [CrossRef]
  18. Yoo, J.; Lee, Y.; Park, Y.; Lee, J.; Choi, J.Y.; Lee, H.; Lim, J.U. Update in Association between Lung Cancer and Air Pollution. Tuberc. Respir. Dis. 2025, 88, 228–236. [Google Scholar] [CrossRef] [PubMed]
  19. Huang, F.; Pan, B.; Wu, J.; Chen, E.; Chen, L. Relationship between exposure to PM2.5 and lung cancer incidence and mortality: A meta-analysis. Oncotarget 2017, 8, 43322–43331. [Google Scholar] [CrossRef] [PubMed]
  20. Li, F.-J.; Yang, H.-W.; Ayyamperumal, R.; Liu, Y. Pollution, sources, and human health risk assessment of heavy metals in urban areas around industrialization and urbanization-Northwest China. Chemosphere 2022, 308, 136396. [Google Scholar] [CrossRef] [PubMed]
  21. U.S. EPA. Integrated Science Assessment (ISA) for Particulate Matter (Final Report, Dec 2019); U.S. Environmental Protection Agency: Washington, DC, USA, 2019; EPA/600/R-19/188. [Google Scholar]
  22. U.S. EPA. Benefits and Costs of the Clean Air Act. Available online: https://www.epa.gov/clean-air-act-overview/benefits-and-costs-clean-air-act (accessed on 30 April 2025).
  23. IQAir. World’s Most Polluted Cities 2024. Available online: https://www.iqair.com/world-air-quality-report (accessed on 5 May 2025).
  24. WHO. Ambient Air Quality Database (Update Jan 2024). Available online: https://www.who.int/publications/m/item/who-ambient-air-quality-database-(update-jan-2024) (accessed on 30 April 2025).
  25. Yang, Q.; Liu, G.; Falandysz, J.; Yang, L.; Zhao, C.; Chen, C.; Sun, Y.; Zheng, M.; Jiang, G. Atmospheric emissions of particulate matter-bound heavy metals from industrial sources. Sci. Total Environ. 2024, 947, 174467. [Google Scholar] [CrossRef] [PubMed]
  26. Liu, Y.; Xu, F.; Liu, W.; Liu, X.; Wang, D. Characteristics, sources, exposure, and health effects of heavy metals in atmospheric particulate matter. Curr. Pollution Rep. 2025, 11, 16. [Google Scholar] [CrossRef]
  27. EC. Air. Available online: https://environment.ec.europa.eu/topics/air_en (accessed on 10 May 2025).
  28. EEA. Air Quality in Europe 2022: Health Impacts of Air Pollution in Europe. Available online: https://www.eea.europa.eu/publications/air-quality-in-europe-2022/health-impacts-of-air-pollution (accessed on 10 May 2025).
  29. WHO. WHO Global Air Quality Guidelines. Particulate Matter (PM2.5 and PM10), Ozone, Nitrogen Dioxide, Sulfur Dioxide and Carbon Monoxide; WHO: Geneva, Switzerland, 2021; Available online: https://iris.who.int/handle/10665/345329 (accessed on 30 September 2024).
  30. IARC. IARC Monographs on the Identification of Carcinogenic Hazards to Humans; IARC: Lyon, France, 2021; Available online: https://monographs.iarc.who.int/list-of-classifications (accessed on 30 September 2024).
  31. IRC. Air Pollution and Cancer; IARC Scientific Publication No. 161; Straif, K., Cohen, A., Samet, J., Eds.; IARC: Lyon, France, 2013; Available online: https://publications.iarc.fr/Book-And-Report-Series/Iarc-Scientific-Publications/Air-Pollution-And-Cancer-2013 (accessed on 30 September 2024).
  32. WHO. WHO Guidelines for Indoor Air Quality: Selected Pollutants; WHO Regional Office for Europe: Copenhagen, Denmark, 2010; Volume 9. [Google Scholar]
  33. Rogula-Kozłowska, W. Size-segregated urban particulate matter: Mass closure, chemical composition, and primary and secondary matter content. Air Qual. Atmos. Health 2016, 9, 533–550. [Google Scholar] [CrossRef] [PubMed]
  34. Rachwał, M.; Wawer, M.; Jabłońska, M.; Rogula-Kozłowska, W.; Rogula-Kopiec, P. Geochemical and mineralogical characteristics of airborne particulate matter in relation to human health risk. Minerals 2020, 10, 866. [Google Scholar] [CrossRef]
  35. Vithanage, M.; Bandara, P.C.; Novo, L.A.; Kumar, A.; Ambade, B.; Naveendrakumar, G.; Ranagalage, M.; Magana-Arachchi, D.N. Deposition of trace metals associated with atmospheric particulate matter: Environmental fate and health risk assessment. Chemosphere 2022, 303, 135051. [Google Scholar] [CrossRef] [PubMed]
  36. Jeong, S. The impact of air pollution on human health in Suwon City. Asian J. Atmos. Environ. 2013, 7, 227–233. [Google Scholar] [CrossRef]
  37. Khaniabadi, Y.O.; Goudarzi, G.; Daryanoosh, S.M.; Borgini, A.; Tittarelli, A.; De Marco, A. Exposure to PM 10, NO2, and O3 andimpacts on human health. Environ. Sci. Pollut. Res. 2017, 24, 2781–2789. [Google Scholar] [CrossRef] [PubMed]
  38. Kim, K.H.; Jahan, S.A.; Kabir, E.; Brown, R.J.C. A review of airborne polycyclic aromatic hydrocarbons (PAHs) and their human health effects. Environ. Int. 2013, 60, 71–80. [Google Scholar] [CrossRef] [PubMed]
  39. Zheng, N.; Liu, J.; Wang, Q.; Liang, Z. Health risk assessment of heavy metal exposure to street dust in the zinc smelting district, Northeast of China. Sci. Total Environ. 2010, 408, 726–733. [Google Scholar] [CrossRef] [PubMed]
  40. Mohmand, J.; Eqani, S.; Fasola, M.; Alamdar, A.; Mustafa, I.; Ali, N.; Liu, L.P.; Peng, S.; Shen, H. Human exposure to toxic metals via contaminated dust: Bio-accumulation trends and their potential risk estimation. Chemosphere 2015, 132, 142–151. [Google Scholar] [CrossRef] [PubMed]
  41. Herojeet, R.; Rishi, M.S.; Kishore, N. Integrated approach of heavy metal pollution indices and complexity quantification using chemometric models in the Sirsa Basin, Nalagarh valley, Himachal Pradesh, India. Chin. J. Chem. 2015, 34, 620–633. [Google Scholar] [CrossRef]
  42. Swaringen, B.F.; Gawlik, E.; Kamenov, G.D.; McTigue, N.E.; Cornwell, D.A.; Bonzongo, J.-C.J. Children’s exposure to environmental lead: A review of potential sources, blood levels, and methods used to reduce exposure. Environ. Res. 2022, 204, 112025. [Google Scholar] [CrossRef] [PubMed]
  43. Lohani, M.B.; Singh, A.; Rupainwar, D.C.; Dhar, D.N. Seasonal variations of heavy metal contamination in river Gomti of Lucknow city region. Environ. Monit. Assess 2008, 147, 253–263. [Google Scholar] [CrossRef] [PubMed]
  44. Balali-Mood, M.; Naseri, K.; Tahergorabi, Z.; Khazdair, M.R.; Sadeghi, M. Toxic mechanisms of five heavy metals: Mercury, lead, chromium, cadmium, and arsenic. Front. Pharmaco. 2021, 227, 643972. [Google Scholar] [CrossRef] [PubMed]
  45. Li, H.; Li, H.; Zhang, L.; Cheng, M.; Guo, L.; He, Q.; Wang, X.; Wang, Y. High cancer risk from inhalation exposure to PAHs in Fenhe Plain in winter: A particulate size distribution-based study. Atmos. Environ. 2019, 216, 116924. [Google Scholar] [CrossRef]
  46. Chen, B.H.; Chen, Y.C. Formation of polycyclic aromatic hydrocarbons in the smoke from heated model lipids and food lipids. J. Agric. Food Chem. 2001, 49, 5238–5243. [Google Scholar] [CrossRef] [PubMed]
  47. Elovaara, E.; Mikkola, J.; Stockmann-Juvala, H.; Luukkanen, L.; Keski-Hynnilä, H.; Kostiainen, R.; Pasanen, M.; Pelkonen, O.; Vainio, H. Polycyclic aromatic hydrocarbon (PAH) metabolizing enzyme activities in human lung, and their inducibility by exposure to naphthalene, phenanthrene, pyrene, chrysene, and benzo(a)pyrene as shown in the rat lung and liver. Arch. Toxicol. 2007, 81, 169–182. [Google Scholar] [CrossRef] [PubMed]
  48. Mallah, M.A.; Changxing, L.; Mallah, M.A.; Noreen, S.; Liu, Y.; Saeed, M.; Xi, H.; Ahmed, B.; Feng, F.; Mirjat, A.A.; et al. Polycyclic aromatic hydrocarbon and its effects on human health: An overview. Chemosphere 2022, 296, 133948. [Google Scholar] [CrossRef] [PubMed]
  49. Jarvis, I.W.H.; Dreij, K.; Mattsson, A.; Jernström, B.; Stenius, U. Interactions between polycyclic aromatic hydrocarbons in complex mixtures and implications for cancer risk assessment. Toxicology 2014, 321, 27–39. [Google Scholar] [CrossRef] [PubMed]
  50. Tung, E.W.Y.; Philbrook, N.A.; Belanger, C.L.; Ansari, S.; Winn, L.M. Benzo[a]pyrene increases DNA double strand break repair in vitro and in vivo: A possible mechanism for benzo[a]pyrene-induced toxicity. Mutat. Res. Genet. Toxicol. Environ. Mutagen. 2014, 760, 64–69. [Google Scholar] [CrossRef] [PubMed]
  51. Shi, T.; Knaapen, A.M.; Begerow, J.; Birmili, W.; Borm, P.J.; Schins, R.P. Temporal variations of hydroxyl radical generation and 8-hydroxy-2’-deoxyguanosine formation by coarse and fine particulate matter. Occup. Environ. Med. 2003, 60, 315–321. [Google Scholar] [CrossRef] [PubMed]
  52. Danielsen, P.H.; Møller, P.; Jensen, K.A.; Sharma, A.K.; Wallin, H.; Bossi, R.; Autrup, H.; Mølhave, L.; Ravanat, J.-L.; Briedé, J.J.; et al. Oxidative stress, DNA damage, and inflammation induced by ambient air and wood smoke particulate matter in human A549 and THP-1 cell lines. Chem. Res. Toxicol. 2011, 24, 168–184. [Google Scholar] [CrossRef] [PubMed]
  53. Topinka, J.; Hovorka, J.; Milcova, A.; Schmuczerova, J.; Krouzek, J.; Rossner, P.; Sram, R.J. An acellular assay to assess the genotoxicity of complex mixtures of organic pollutants bound on size segregated aerosol. Part I: DNA adducts. Toxicol. Lett. 2010, 98, 304–311. [Google Scholar] [CrossRef] [PubMed]
  54. EEA. Air Quality in Europe 2024. Available online: https://www.eea.europa.eu//publications/europes-air-quality-status-2024 (accessed on 30 September 2024).
  55. USEPA. Guidelines for Carcinogen Risk Assessment; (EPA/630/P-03/001F); USEPA: Washington, DC, USA, 2005. Available online: http://www.epa.gov/osa/guidelines-carcinogen-risk-assessment (accessed on 21 July 2024).
  56. Delgado-Saborit, J.M.; Stark, C.; Harrison, R.M. Carcinogenic potential, levels and sources of polycyclic aromatic hydrocarbon mixtures in indoor and outdoor environments and their implications for air quality standards. Environ. Int. 2011, 37, 383–392. [Google Scholar] [CrossRef] [PubMed]
  57. EC. Council Directive 2004/107/EC Relating to Arsenic, Cadmium, Mercury, Nickel and Polycyclic Aromatic Hydrocarbons in Ambient Air. Available online: http://eur-lex.europa.eu/LexUriServ/LexUriServ.do?uri=OJ:L:2005:023:0003:0016:EN:PDF (accessed on 6 September 2024).
  58. EC. Directive (EU) 2024/2881 of the European Parliament and of the Council of 23 October 2024 on Ambient Air Quality and Cleaner Air for Europe (Recast). Available online: https://eur-lex.europa.eu/legal-content/EN/TXT/PDF/?uri=OJ:L_202402881&qid=1746441426446 (accessed on 30 April 2025).
  59. EEP. Status Report of Air Quality in Europe for Year 2023, Using Validated and up-to-Date Data; ETC-HE Report 2024/5. Available online: https://www.eionet.europa.eu/etcs/all-etc-reports (accessed on 30 April 2025).
  60. Manxhuka, B.; Hofmarcher, T. Cancer Dashboard for Poland–Lung Cancer. 2024. Available online: https://onkologia.org.pl/sites/default/files/publications/2024-09/ihe_-_lung_cancer_dashboard_poland.pdf (accessed on 30 May 2025).
  61. CIEP. Chief Inspectorate of Environmental Protection. Available online: https://powietrze.gios.gov.pl/pjp/archives (accessed on 30 September 2024).
  62. PN-EN 12341:2014-07; Ambient Air—Standard Gravimetric Measurement Method to Determine the Concentration of Mass Fractions PM10 or PM2.5 Particulate Matter. CEN: Brussels, Belgium, 2014.
  63. PN-EN 15549:2011; Air Quality—Standard Method for the Measurement of the Concentration of Benzo[a]pyrene in Ambient Air. CEN: Brussels, Belgium, 2011.
  64. PN-EN 14902:2010; Ambient Air Quality-Standard Method for the Measurement of Pb, Cd, As and Ni in the PM10 Fraction of Suspended Particulate Matter. CEN: Brussels, Belgium, 2010.
  65. US EPA. U.S. Environmental Protection Agency-Air Quality Analysis Division 2008; United States Environmental Protection Agency: Washington, DC, USA, 2008; EPA-454/B. [Google Scholar]
  66. EnHealth Council. Environmental Health Risk Assessment—Guidelines for Assessing Human Health Risks from Environmental Hazards; Australian Government Department of Health and Aged Care: Canberra, ACT, Australia, 2022. Available online: https://www.health.gov.au/sites/default/files/documents/2022/07/enhealth-guidance-guidelines-for-assessing-human-health-risks-from-environmental-hazards.pdf (accessed on 30 April 2025).
  67. Chiang, K.-C.; Chio, C.-P.; Chiang, Y.-H.; Liao, C.-M. Assessing hazardous risks of human exposure to temple airborne polycyclic aromatic hydrocarbons. J. Hazard. Mater. 2009, 166, 676–685. [Google Scholar] [CrossRef] [PubMed]
  68. Fadel, M.; Courcot, D.; Afif, C.; Ledoux, F. Methods for the assessment of health risk induced by contaminants in atmospheric particulate matter: A review. Environ. Chem. Lett. 2022, 20, 3289–3311. [Google Scholar] [CrossRef]
  69. Cao, S.; Duan, X.; Zhao, X.; Ma, J.; Dong, T.; Huang, N.; Sun, C.; He, B.; Wei, F. Health risks from the exposure of children to As, Se, Pb and other heavy metals near the largest coking plant in China. Sci. Total Environ. 2014, 472, 1001–1009. [Google Scholar] [CrossRef] [PubMed]
  70. Dahmardeh Behrooz, R.; Kaskaoutis, D.G.; Grivas, G.; Mihalopoulos, N. Human health risk assessment for toxic elements in the extreme ambient dust conditions observed in Sistan, Iran. Chemosphere 2021, 262, 127835. [Google Scholar] [CrossRef] [PubMed]
  71. Larsen, J.C.; Larsen, P.B. Chemical carcinogens. In Air Pollution and Health; Herster, R.E., Harrison, R.M., Eds.; Royal Society of Chemistry: Cambridge, UK, 1998; pp. 33–56. [Google Scholar]
  72. USEPA. Exposure Factors Handbook 2011 Edition (Final); U.S. Environmental Protection Agency: Washington, DC, USA, 2011; EPA/600/R-09/052F. [Google Scholar]
  73. USEPA. Supplemental Guidance for Developing Soil Screening Levels for Superfund Sites; U.S. Environmental Protection Agency: Washington, DC, USA, 2002. [Google Scholar]
  74. Peng, C.; Chen, W.; Liao, X.; Wang, M.; Ouyang, Z.; Jiao, W.; Bai, Y. Polycyclic aromatic hydrocarbons in urban soils of Beijing: Status, sources, distribution and potential risk. Environ. Pollut. 2011, 159, 802–808. [Google Scholar] [CrossRef] [PubMed]
  75. OEHHA. Available online: https://oehha.ca.gov/chemicals (accessed on 30 September 2024).
  76. US EPA. Exposure Factors Handbook: 2011 Edition; National Center of Environmental Assessment, Office of Research and Development: Washington, DC, USA, 2011; EPA/600/R-09/052F. Available online: https://rais.ornl.gov/documents/EFH_2011.pdf (accessed on 2 July 2025).
  77. Onjia, A. Concentration unit mistakes in health risk assessment of polycyclic aromatic hydrocarbons in soil, sediment, and indoor/road dust. Front. Environ. Sci. 2024, 12, 1370397. [Google Scholar] [CrossRef]
  78. IEP-PIB. Air Quality Assessment in Zones for 2022 Summary Report; Institute of Environmental Protection–National Research Institute: Warszawa, Poland, 2023. Available online: https://powietrze.gios.gov.pl/pjp/content/show/1004683 (accessed on 30 April 2025).
  79. EEA. Air Quality in Europe 2021: Europe’s Air Quality Status 2021. Available online: https://www.eea.europa.eu/publications/air-quality-in-europe-2021 (accessed on 30 September 2024).
  80. Jasiński, R.; Galant-Gołębiewska, M.; Nowak, M.; Kurtyka, K.; Kurzawska, P.; Maciejewska, M.; Ginter, M. Emissions and Concentrations of Particulate Matter in Poznan Compared with Other Polish and European Cities. Atmosphere 2021, 12, 533. [Google Scholar] [CrossRef]
  81. Traczyk, P.; Gruszecka-Kosowska, A. The Condition of Air Pollution in Kraków, Poland, in 2005–2020, with Health Risk Assessment. Int. J. Environ. Res. Public Health 2020, 17, 6063. [Google Scholar] [CrossRef] [PubMed]
  82. Zgłobicki, W.; Baran-Zgłobicka, B. Air Pollution in Major Polish Cities in the Period 2005–2021: Intensity, effects and attempts to reduce it. Environ. Res. 2024, 240, 117497. [Google Scholar] [CrossRef] [PubMed]
  83. Ministry of Climate and Environment. Regulation of the Minister of Climate and Environment of 12 April 2021 on the Levels of Certain Substances in the Air; Journal of Laws 2021, Item 845; Consolidated Text of 2012 Regulation; Ministry of Climate and Environment: Warsaw, Poland, 2012.
  84. Danek, T.; Weglinska, E.; Zareba, M. The influence of meteorological factors and terrain on air pollution concentration and migration: A geostatistical case study from Krakow. Poland. Sci. Rep. 2022, 12, 11050. [Google Scholar] [CrossRef] [PubMed]
  85. Gorzelnik, T.; Bogacki, M.; Oleniacz, R. Identification of Factors Influencing Episodes of High PM10 Concentrations in the Air in Krakow (Poland) Using Random Forest Method. Sustainability 2024, 16, 9015. [Google Scholar] [CrossRef]
  86. Kaleta, D.; Kozielska, B. Spatial and temporal volatility of PM2.5, PM10 and PM10-Bound B[a]P concentrations and assessment of the exposure of the population of Silesia in 2018–2021. Int. J. Environ. Res. Public Health 2023, 20, 138. [Google Scholar] [CrossRef] [PubMed]
  87. Ministry of Climate and Environment. National Emission Inventory of SO2, NOx, CO, NH3, NMVOCs, Particulate Matter, Heavy Metals, and POPs for the Years 1990–2021; Synthesis Report; Ministry of Climate and Environment: Warsaw, Poland, 2023. Available online: https://bip.mos.gov.pl/fileadmin/user_upload/bip/rejestry_ewidence_archiwa/DPM/Bilans_emisji_za_lata_1990-2021.pdf (accessed on 30 April 2025).
  88. Tomaz, S.; Shahpoury, P.; Jaffrezo, J.-J.; Lammel, G.; Perraudin, E.; Villenave, E.; Albinet, A. One-year study of polycyclic aromatic compounds at an urban site in Grenoble (France): Seasonal variations, gas/particle partitioning and cancer risk estimation. Sci. Total Environ. 2016, 565, 1071–1083. [Google Scholar] [CrossRef] [PubMed]
  89. Kozielska, B.; Żeliński, J.; Cieślar, M. The occurrence of polycyclic aromatic hydrocarbons in bottom ash from individual heating devices. Zeszyty Naukowe SGSP 2022, 83, 7–18. [Google Scholar] [CrossRef]
  90. Siudek, P. Atmospheric Deposition of Polycyclic Aromatic Hydrocarbons (PAHs) in the Coastal Urban Environment of Poland: Sources and Transport Patterns. Int. J. Environ. Res. Public Health 2022, 19, 14183. [Google Scholar] [CrossRef] [PubMed]
  91. Cieślik, E.; Fabiańska, M.J. Preservation of geochemical markers during co-combustion of hard coal and various domestic waste materials. Sci. Total Environ. 2021, 768, 144638. [Google Scholar] [CrossRef] [PubMed]
  92. Majewski, G.; Rogula-Kozłowska, W. The elemental composition and origin of fine ambient particles in the largest Polish conurbation: First results from the short-term winter campaign. Theor. Appl. Climatol. 2016, 125, 79–92. [Google Scholar] [CrossRef]
  93. Reizer, M.; Juda-Rezler, K. Explaining the high PM10 concentrations observed in Polish urban areas. Air Qual. Atmos. Health 2016, 9, 517–553. [Google Scholar] [CrossRef] [PubMed]
  94. Pastuszka, J.S.; Rogula-Kozłowska, W.; Zajusz-Zubek, E. Characterization of PM10 and PM2.5 and associated heavy metals at the crossroads and urban background site in Zabrze, Upper Silesia, Poland, during the smog episodes. Environ. Monit. Assess 2010, 168, 613–627. [Google Scholar] [CrossRef] [PubMed]
  95. Kalbarczyk, R.; Kalbarczyk, E. Structure of Pb concentration variability in PM10 particulate matter in Poland and its dependence on thermal air conditions and precipitation. Atmos. Res. 2025, 326, 108306. [Google Scholar] [CrossRef]
  96. Czernecki, B.; Półrolniczak, M.; Kolendowicz, L.; Marosz, M.; Kendzierski, S. Influence of the atmospheric conditions on PM10 concentrations in Poznań, Poland. J. Atmos. Chem. 2017, 74, 115–139. [Google Scholar] [CrossRef]
  97. Rogula-Kozłowska, W.; Penkała, M.; Bihałowicz, J.S.; Rogula-Kopiec, P.; Bihałowicz, J.; Błaszczak, B. Assessment of differences in elemental concentrations in particulate matter from road surfaces near and outside noise barriers in Poland. Arch. Environ. Prot. 2025, 51, 92–102. [Google Scholar] [CrossRef]
  98. Hołtra, A.; Zamorska-Wojdyła, D. Application of individual and integrated pollution indices of trace elements to evaluate the noise barrier impact on the soil environment in Wroclaw (Poland). Environ. Sci. Pollut. Res. 2023, 30, 26858–26873. [Google Scholar] [CrossRef] [PubMed]
  99. Zgłobicki, W.; Telecka, M.; Skupiński, S. Assessment of short-term changes in street dust pollution with heavy metals in Lublin (E Poland)-levels, sources and risks. Environ. Sci. Pollut. Res. 2019, 26, 35049–35060. [Google Scholar] [CrossRef] [PubMed]
  100. Cenowski, M. Zawartość arsenu, kadmu i niklu w pyle zawieszonym PM10 pobranym w powietrzu atmosferycznym w miejscach o różnym stopniu presji antropogenicznej. Ochr. Pow. Probl. Odp. 2009, 43, 94–103. [Google Scholar]
  101. Biernacik, D.; Jakusik, E. Charakterystyka wybranych elementów meteorologicznych w Szczecinie. In Współczesne Problemy Retencji Wód; IMGW-PIB: Warszawa, Poland, 2018; Available online: https://www.researchgate.net/publication/344875126_Charakterystyka_wybranych_elementow_meteorologicznych_w_Szczecinie_The_characteristics_of_the_selected_meteorological_elements_in_Szczecin (accessed on 4 July 2025).
  102. Bodor, K.; Bodor, Z.; Szép, A.; Szép, R. Human health impact assessment and temporal distribution of trace elements in Copșa Mică- Romania. Sci. Rep. 2021, 11, 7049. [Google Scholar] [CrossRef] [PubMed]
  103. Elhadi, R.E.; Abdullah, A.M.; Abdullah, A.H.; Hanan Ash’aari, Z.; Kura, N.U.; Gumel, D.Y.; Adamu, A. Source Identification of Heavy Metals in Particulate Matter (PM10) in a Malaysian Traffic Area Using Multivariate Techniques. Pol. J. Environ. Stud. 2017, 26, 2523–2532. [Google Scholar] [CrossRef] [PubMed]
  104. Tang, Y.; Han, G. Characteristics of major elements and heavy metals in atmospheric dust in Beijing, China. J. Geochem. Explor 2017, 176, 114–119. [Google Scholar] [CrossRef]
  105. Suris, F.N.A.; Bakar, M.A.A.; Ariff, N.M.; Mohd Nadzir, M.S.; Ibrahim, K. Malaysia PM10 air quality time series clustering based on dynamic time warping. Atmosphere 2022, 13, 503. [Google Scholar] [CrossRef]
  106. Qiao, X.; Ying, Q.; Li, X.; Zhang, H.; Hu, J.; Tang, Y.; Chen, X. Source apportionment of PM2.5 for 25 Chinese provincial capitals and municipalities using a source-oriented Community Multiscale Air Quality model. Sci. Total Environ. 2018, 612, 462–471. [Google Scholar] [CrossRef] [PubMed]
  107. Dominick, D.; Juahir, H.; Latif, M.T.; Zain, S.M.; Aris, A.Z. Spatial assessment of air quality patterns in Malaysia using multivariate analysis. Atmos. Environ. 2012, 60, 172–181. [Google Scholar] [CrossRef]
  108. Masiol, M.; Rampazzo, G.; Ceccato, D.; Squizzato, S.; Pavoni, B. Characterization of PM10 sources in a coastal area near Venice (Italy): An application of factor-cluster analysis. Chemosphere 2010, 80, 771–778. [Google Scholar] [CrossRef] [PubMed]
  109. CSO. Mortality in 2021. Deaths by Cause-Preliminary Data. Central Statistical Office: Warszawa, Poland. 2021. Available online: https://stat.gov.pl/obszary-tematyczne/ludnosc/statystyka-przyczyn-zgonow/umieralnosc-w-2021-roku-zgony-wedlug-przyczyn-dane-wstepne,10,3.html (accessed on 30 May 2025).
  110. OECD/European Union. Health at a Glance: Europe 2022: State of Health in the EU Cycle; OECD Publishing: Paris, France, 2022. [Google Scholar]
  111. Polish National Cancer Registry. Available online: https://onkologia.org.pl/en/report (accessed on 30 May 2025).
  112. EEA. Healthy Environment, Healthy Lives: How the Environment Influences Health and Well-Being in Europe. 2020. Available online: https://www.eea.europa.eu/en/analysis/publications/healthy-environment-healthy-lives (accessed on 30 May 2025).
  113. IHME. Institute for Health Metrics and Evaluation. Global Burden of Disease Data Set. 2020. Available online: https://ghdx.healthdata.org/gbd-results-tool (accessed on 30 May 2025).
  114. Wu, D.; Ma, Z.; Diao, H.; Wang, W.; Chen, L.; Zhou, D.; Yang, J.; Zhen, Q. Characteristics, potential sources, and cancer risk apportionment of PM10-bound polycyclic aromatic hydrocarbons in Bengbu, Central China. Front. Public Health 2024, 12, 1445782. [Google Scholar] [CrossRef] [PubMed]
  115. Agudelo-Castañeda, D.M.; Teixeira, E.C.; Schneider, I.L.; Lara, S.R.; Silva, L.F.O. Exposure to polycyclic aromatic hydrocarbons in atmospheric PM1.0 of urban environments: Carcinogenic and mutagenic respiratory health risk by age groups. Environ. Pollut. 2017, 224, 158–170. [Google Scholar] [CrossRef] [PubMed]
  116. US EPA. Regional Screening Levels (RSLs)–Generic Tables. U.S. EPA 2023. Available online: https://www.epa.gov/risk/regional-screening-levels-rsls-generic-tables (accessed on 30 April 2025).
  117. Rogula-Kozłowska, W.; Kozielska, B.; Błaszczak, B.; Klejnowski, K. The mass distribution of particle-bound PAH among aerosol fractions: A case-study of an urban area in Poland. In Organic Pollutants Ten Years After the Stockholm Convention-Environmental and Analytical Update; Puzyn, T., Mostrag-Szlichtyng, A., Eds.; IntechOpen: London, UK, 2012; pp. 163–190. [Google Scholar]
  118. Aldekheel, M.; Farahani, V.J.; Sioutas, C. Assessing Lifetime Cancer Risk Associated with Population Exposure to PM-Bound PAHs and Carcinogenic Metals in Three Mid-Latitude Metropolitan Cities. Toxics 2023, 11, 697. [Google Scholar] [CrossRef] [PubMed]
  119. Iakovides, M.; Iakovides, G.; Stephanou, E.G. Atmospheric particlebound polycyclic aromatic hydrocarbons, n-alkanes, hopanes, steranes and trace metals: PM2.5 source identification, individual and cumulative multi-pathway lifetime cancer risk assessment in the urban environment. Sci. Total Environ. 2021, 752, 141834. [Google Scholar] [CrossRef] [PubMed]
  120. Widziewicz, K.; Rogula-Kozłowska, W.; Loska, K.; Kociszewska, K.; Majewski, G. Health risk impacts of exposure to airborne metals and benzo(a)pyrene during episodes of high PM10 concentrations in Poland. Biomed. Environ. Sci. 2018, 31, 23–36. [Google Scholar] [CrossRef] [PubMed]
  121. Obradović, J.; Vesković, J.; Jovašević-Stojanović, M.; Obradović, M.; Onjia, A. Two-dimensional Monte Carlo simulation of source-specific risks from PM2.5-bound polycyclic aromatic hydrocarbons in indoor and outdoor school environments. Build. Environ. 2025, 279, 113050. [Google Scholar] [CrossRef]
  122. Majewski, G.; Klik, B.; Rogula-Kozłowska, W.; Rogula-Kopiec, P.; Rybak, J.; Radziemska, M.; Liniauskienė, E. Assessment of heavy metal inhalation risks in urban environments in Poland: A Case Study. J. Ecol. Eng. 2023, 24, 330–340. [Google Scholar] [CrossRef] [PubMed]
  123. Caggiano, R.; Sabia, S.; Speranza, A. Trace elements and human health risks assessment of finer aerosol atmospheric particles (PM1). Environ. Sci. Pollut. Res. Int. 2019, 26, 36423–36433. [Google Scholar] [CrossRef] [PubMed]
  124. Mainka, A. Children health risk assessment of metals in total suspended particulate matter (TSP) and PM1 in kindergartens during winter and spring seasons. Atmosphere 2021, 12, 1096. [Google Scholar] [CrossRef]
  125. Goudarzi, G.; Baboli, Z.; Moslemnia, M.; Tobekhak, M.; Birgani, Y.T.; Neisi, A.; Ghanemi, K.; Babaei, A.A.; Hashemzadeh, B.; Angali, K.A.; et al. Assessment of incremental lifetime cancer risks of ambient air PM10-bound PAHs in oil-rich cities of Iran. J. Environ. Health Sci. Eng. 2021, 19, 319–330. [Google Scholar] [CrossRef] [PubMed]
  126. Kozielska, B.; Rogula-Kozłowska, W.; Klejnowski, K. Seasonal variations in health hazards from polycyclic aromatic hydrocarbons bound to submicrometer particles at three characteristic sites in the heavily polluted polish region. Atmosphere 2015, 6, 1–20. [Google Scholar] [CrossRef]
  127. Orellano, P.; Reynoso, J.; Quaranta, N.; Bardach, A.; Ciapponi, A. Short-term exposure to particulate matter (PM10 and PM2.5), nitrogen dioxide (NO2), and ozone (O3) and all-cause and cause-specific mortality: Systematic review and meta-analysis. Environ. Int. 2020, 142, 105876. [Google Scholar] [CrossRef] [PubMed]
  128. Slama, A.; Śliwczyński, A.; Woźnica, J.; Zdrolik, M.; Wiśnicki, B.; Kubajek, J.; Turżańska-Wieczorek, O.; Gozdowski, D.; Wierzba, W.; Franek, E. Impact of air pollution on hospital admissions with a focus on respiratory diseases: A time-series multi-city analysis. Environ. Sci. Pollut. Res. 2019, 26, 16998–17009. [Google Scholar] [CrossRef] [PubMed]
  129. Miletić, A.; Vesković, J.; Lučić, M.; Onjia, A. Monte Carlo simulation of source-specific risks of soil at an abandoned lead-acid battery recycling site. Stoch. Environ. Res. Risk Assess 2024, 38, 3313–3329. [Google Scholar] [CrossRef]
  130. European Statistical Office (EUROSTAT). Population on 1 January by Age Groups and Sex-Functional Urban Areas. Dataset 2022. Available online: https://ec.europa.eu/eurostat/databrowser/view/urb_lpop1/default/table?lang=en&category=urb.urb_luz (accessed on 2 February 2025).
  131. Central Statistical Office (CSO). Life Expectancy Tables of Poland 2018. 2019. Available online: https://stat.gov.pl/obszary-tematyczne/ludnosc/trwanie-zycia/trwanie-zycia-w-2018-r-,2,13.html (accessed on 2 February 2025).
  132. Central Statistical Office (CSO). Life Expectancy Tables of Poland 2021. 2022. Available online: https://stat.gov.pl/obszary-tematyczne/ludnosc/trwanie-zycia/trwanie-zycia-w-2021-roku,2,16.html (accessed on 2 February 2025).
  133. Central Statistical Office (CSO). Life Expectancy of Poland in 2023. 2024. Available online: https://stat.gov.pl/obszary-tematyczne/ludnosc/trwanie-zycia/trwanie-zycia-w-2023-roku,2,18.html (accessed on 2 February 2025).
Figure 1. Sampling sites in the Polish Agglomerations.
Applsci 15 07903 g001
Figure 2. Annual average and maximum concentrations of PM10 (μg·m−3) measured in the period 2018–2022.
Applsci 15 07903 g002
Figure 3. Annual average concentrations of metal and ∑PAHs recorded in Polish Agglomerations in the period 2018–2022.
Applsci 15 07903 g003
Figure 4. Results of agglomerations grouping of cluster analysis (all pollutants).
Applsci 15 07903 g004
Figure 5. Graph of mean values and standard deviations of concentrations of PM10 and PM10-bound metals (Pb, Cd, As, Ni) and sum of PAHs by clusters.
Applsci 15 07903 g005
Table 1. Annual average (min–max) concentrations of PM-bound the sum of PAHs in the period 2018–2022 in Polish Agglomerations, ng·m−3.
Agglomeration20182019202020212022
Tricity9.49 (0.37–42.90)5.17 (0.31–26.05)5.59 (0.34–25.62)7.50 (0.38–42.40)4.47 (0.35–26.39)
Upper Silesia25.59 (1.27–89.95)21.96 (0.96–74.67)19.78 (1.43–69.09)21.75 (1.18–83.61)14.18 (1.38–45.62)
Cracow21.15 (1.20–101.58)16.96 (0.70–77.63)16.36(0.72–80.06)16.27 (0.88–72.37)9.90 (0.66–40.55)
Lublin9.35 (0.10–47.53)6.30 (0.08–21.60)8.56 (0.31–31.42)10.64 (0.24–40.35)7.27 (0.35–30.61)
Łódź16.47 (0.26–64.08)12.83 (0.36–49.02)11.60 (0.47–41.27)12.47 (0.32–41.32)10.83 (0.44–38.72)
Szczecin18.50 (0.77–68.97)6.85 (0.47–40.55)5.21 (0.54–27.26)5.61 (0.25–21.54)6.11 (0.45–30.12)
Warsaw10.23 (0.29–39.24)8.17 (0.38–31.77)6.56 (0.18–25.74)8.05 (0.35–47.85)5.46 (0.35–16.83)
Wroclaw14.04 (0.41–87.93)9.34 (0.35–50.72)12.14 (0.35–55.92)10.97 (0.35–45.99)5.55 (0.43–36.88)
Table 2. Incremental lifetime cancer risk from inhalation exposure in Polish Agglomerations (2018–2022) by sex.
Agglomeration20182019202020212022
MALES
Tricity5.46 × 10−63.09 × 10−63.08 × 10−63.53 × 10−63.05 × 10−6
Upper Silesia1.11 × 10−59.47 × 10−69.47 × 10−67.42 × 10−68.41 × 10−6
Cracow8.48 × 10−67.26 × 10−66.64 × 10−66.36 × 10−64.70 × 10−6
Lublin4.41 × 10−63.95 × 10−64.35 × 10−64.71 × 10−62.69 × 10−6
Łódź8.30 × 10−66.18 × 10−65.43 × 10−66.36 × 10−65.84 × 10⁻⁶
Szczecin8.80 × 10−64.75 × 10−64.59 × 10−63.88 × 10−64.41 × 10−6
Warsaw3.91 × 10−63.14 × 10−62.73 × 10−63.30 × 10−62.72 × 10−6
Wroclaw1.02 × 10−58.14 × 10−68.98 × 10−68.33 × 10−66.44 × 10−6
FEMALES
Tricity2.41 × 10−61.735 × 10−61.33 × 10−61.50 × 10−61.32 × 10−6
Upper Silesia4.87 × 10−64.12 × 10−64.08 × 10−63.14 × 10−63.61 × 10−6
Cracow3.82 × 10−63.25 × 10−62.94 × 10−62.79 × 10−62.10 × 10−6
Lublin1.98 × 10−61.77 × 10−61.91 × 10−62.02 × 10−61.20 × 10−6
Łódź3.63 × 10−62.70 × 10−62.69 × 10−62.69 × 10−62.51 × 10⁻⁶
Szczecin3.89 × 10−62.10 × 10−62.01 × 10−61.68 × 10−61.93 × 10−6
Warsaw1.75 × 10−61.40 × 10−61.20 × 10−61.43 × 10−61.22 × 10−6
Wroclaw4.54 × 10−63.61 × 10−63.95 × 10−63.59 × 10−62.82 × 10−6
Table 3. Selected studies on health risk assessments via inhalation of PAHs and heavy metals reported in the literature.
Country, CityCompoundsEstimated
Carcinogenic Risk
Reference
China,
Bengbu
MalePM1016 EPA priority PAHs1.61 × 10−4 ÷ 8.11 × 10⁻⁴[114]
Female1.51 × 10−4 ÷ 7.59 × 10⁻⁴
Children3.98 × 10−5 ÷ 6.09 × 10⁻⁴
USA,
Los Angeles
Worst casePM2.5PAHs and Ni, Cd, Pb, As Cr(VI) 3.36 × 10⁻⁶[118]
Best case2.07 × 10−6
Greece
Thessaloniki
Worst case6.51 × 10−6
Best case4.02 × 10−6
Italy, MilanWorst case14.92 × 10−6
Best case12.11 × 10−6
Cyprus, NicosiaLifetimePM2.5PAHs2.55 × 10−7[119]
As, Cd, Co, Ni, Pb5.29 × 10−5
Iran, ZabolChildrenTSPNi, Cr, Cd, Co, Pb and As 8.4 × 10⁻⁵[70]
Adult4.5 × 10−4
ChildrenPM2.55.0 × 10−5
Adult2.7 × 10−4
Belgrade, SerbiaLifetimePM2.5PAHs5.77 × 10−5 ÷ 2.27 × 10⁻⁴[120]
PolandSmog episodesPM10B(a)P and As, Cd, Pb, and Ni1.13 × 10−5[121]
No smog episodes1.04 × 10−5
Poland, Silesian VoivodeshipHeating seasonPM10B[a]P6.72 × 10−6÷9.74 × 10⁻⁵[86]
Non-heating season0.6 × 10−6 ÷ 8.7 × 10⁻⁶
Poland,
Agglomerations
Male PM10PAHs and Ni, Cd, Pb, As2.69 × 10−6 ÷ 1.02 × 10⁻⁵[This study]
Female1.20 × 10−6 ÷ 4.87 × 10⁻⁶
Disclaimer/Publisher’s Note: The statements, opinions and data contained in all publications are solely those of the individual author(s) and contributor(s) and not of MDPI and/or the editor(s). MDPI and/or the editor(s) disclaim responsibility for any injury to people or property resulting from any ideas, methods, instructions or products referred to in the content.

