Article

Acute Effects of Olive Leaf Tea and Olive Leaf Powder Biscuits on Postprandial Glycemia, Lipid Profile and Inflammatory Markers: A Randomized Controlled Crossover Trial in Healthy Volunteers

by
Panagiota Potsaki
1,
Olga I. Papagianni
1,
Kalliopi Almpounioti
1,
Charalampos Soulakellis
1,
Angeliki Voutsa
2,
Olga Katira
2,
Vasiliki Bountziouka
1,3,4,
Charalampos Karantonis
5 and
Antonios E. Koutelidakis
1,*
1
Laboratory of Nutrition and Public Health, Unit of Human Nutrition, Department of Food Science and Nutrition, University of the Aegean, 10 Ierou Lochou & Makrygianni Str., 81400 Myrina, Greece
2
Outpatient Clinic, 81400 Myrina, Greece
3
Cardiovascular Research Centre, Department of Cardiovascular Science, University of Leicester, Leicester LE1 7RH, UK
4
Population, Policy and Practice Research, GOS Institute of Child Health, University College London (UCL), London WC1N 1EH, UK
5
Laboratory of Food Chemistry, Biochemistry and Technology, Food Science and Nutrition Department, University of the Aegean, 11472 Myrina, Greece
*
Author to whom correspondence should be addressed.
Appl. Sci. 2025, 15(14), 7857; https://doi.org/10.3390/app15147857
Submission received: 30 May 2025 / Revised: 30 June 2025 / Accepted: 11 July 2025 / Published: 14 July 2025
(This article belongs to the Section Food Science and Technology)

Abstract

Postprandial dysmetabolism, which refers to the impaired regulation of glucose and lipid levels after meals, is recognized as an independent risk factor for cardiovascular diseases (CVDs). Diets rich in polyphenols have demonstrated potential in improving postprandial hyperglycemia and hyperlipidemia. This study investigates the effects of olive leaf polyphenols on postprandial metabolic outcomes following a high-fat and high-carbohydrate meal. A total of 36 healthy adults participated in a three-arm randomized crossover trial. They ingested either a biscuit made from olive leaf powder (OLB), olive leaf tea (OLT), or a placebo meal (CTRL) to assess the impact of olive leaf polyphenols on postprandial glycemia, lipid levels, platelet aggregation factor (PAF), and plasma antioxidant status (TAC). Although no statistically significant differences were observed in the primary biomarkers, including glucose and lipid profiles, a delayed insulin response was noted in the interventions involving olive leaf. These findings suggest that while acute olive leaf supplementation did not significantly alter postprandial glycemia or lipidemia, it may subtly influence insulin kinetics. Further research is needed to explore the long-term effects of olive leaf polyphenols on metabolic health, especially in populations at risk for CVDs.

1. Introduction

Cardiovascular disease (CVD) is the major cause of death worldwide [1], with millions of people affected each year. In addition to traditional risk factors like hypertension, smoking, and physical inactivity [1], recent evidence has emphasized the role of postprandial dysmetabolism, including hyperglycemia and hyperlipidemia, as independent contributors to cardiovascular events [2,3,4]. These postprandial alterations can significantly impact cardiovascular health, extending beyond the effects of conventional risk factors.
Diets high in saturated fats, trans fatty acids, and refined sugars have been strongly linked to elevated cholesterol levels, systemic inflammation, and obesity, factors that collectively increase the risk of CVDs [5,6,7]. In contrast, dietary patterns rich in bioactive compounds such as polyphenols have demonstrated beneficial effects on postprandial metabolism, including the modulation of glucose and lipid responses, attenuation of platelet activation (e.g., through regulation of platelet-activating factor, PAF), and reduction in oxidative stress, potentially lowering cardiometabolic risk [8,9,10].
Olive leaves are a particularly rich source of polyphenols and have garnered attention for their health-promoting properties, especially in the context of cardiovascular disease prevention [11,12]. Among their principal bioactive compounds, oleuropein and hydroxytyrosol have been shown to exhibit potent antioxidant, anti-inflammatory, and antihypertensive effects, contributing to improved endothelial function and overall metabolic health [12,13]. These polyphenols have also been shown to inhibit LDL oxidation, suppress pro-inflammatory cytokine production, and enhance insulin sensitivity—mechanisms that are particularly relevant in the context of postprandial dysmetabolism [14].
Postprandial dysmetabolism, marked by transient disruptions in glucose and lipid homeostasis, as well as impaired insulin sensitivity, plays a pivotal role in the pathogenesis of CVDs [15]. Against this backdrop, the current study aims to evaluate the effects of olive leaf tea and biscuits enriched with olive leaf powder on postprandial glycemic and lipid responses in healthy adults following a high-carbohydrate, high-fat meal, compared to placebo tea and biscuits. We hypothesized that the consumption of olive leaf tea and biscuits may enhance glycemic control, attenuating postprandial hyperglycemia, modulate lipid responses, increase plasma antioxidant capacity, and regulate platelet activation, as reflected by changes in platelet-activating factor (PAF) levels.

2. Materials and Methods
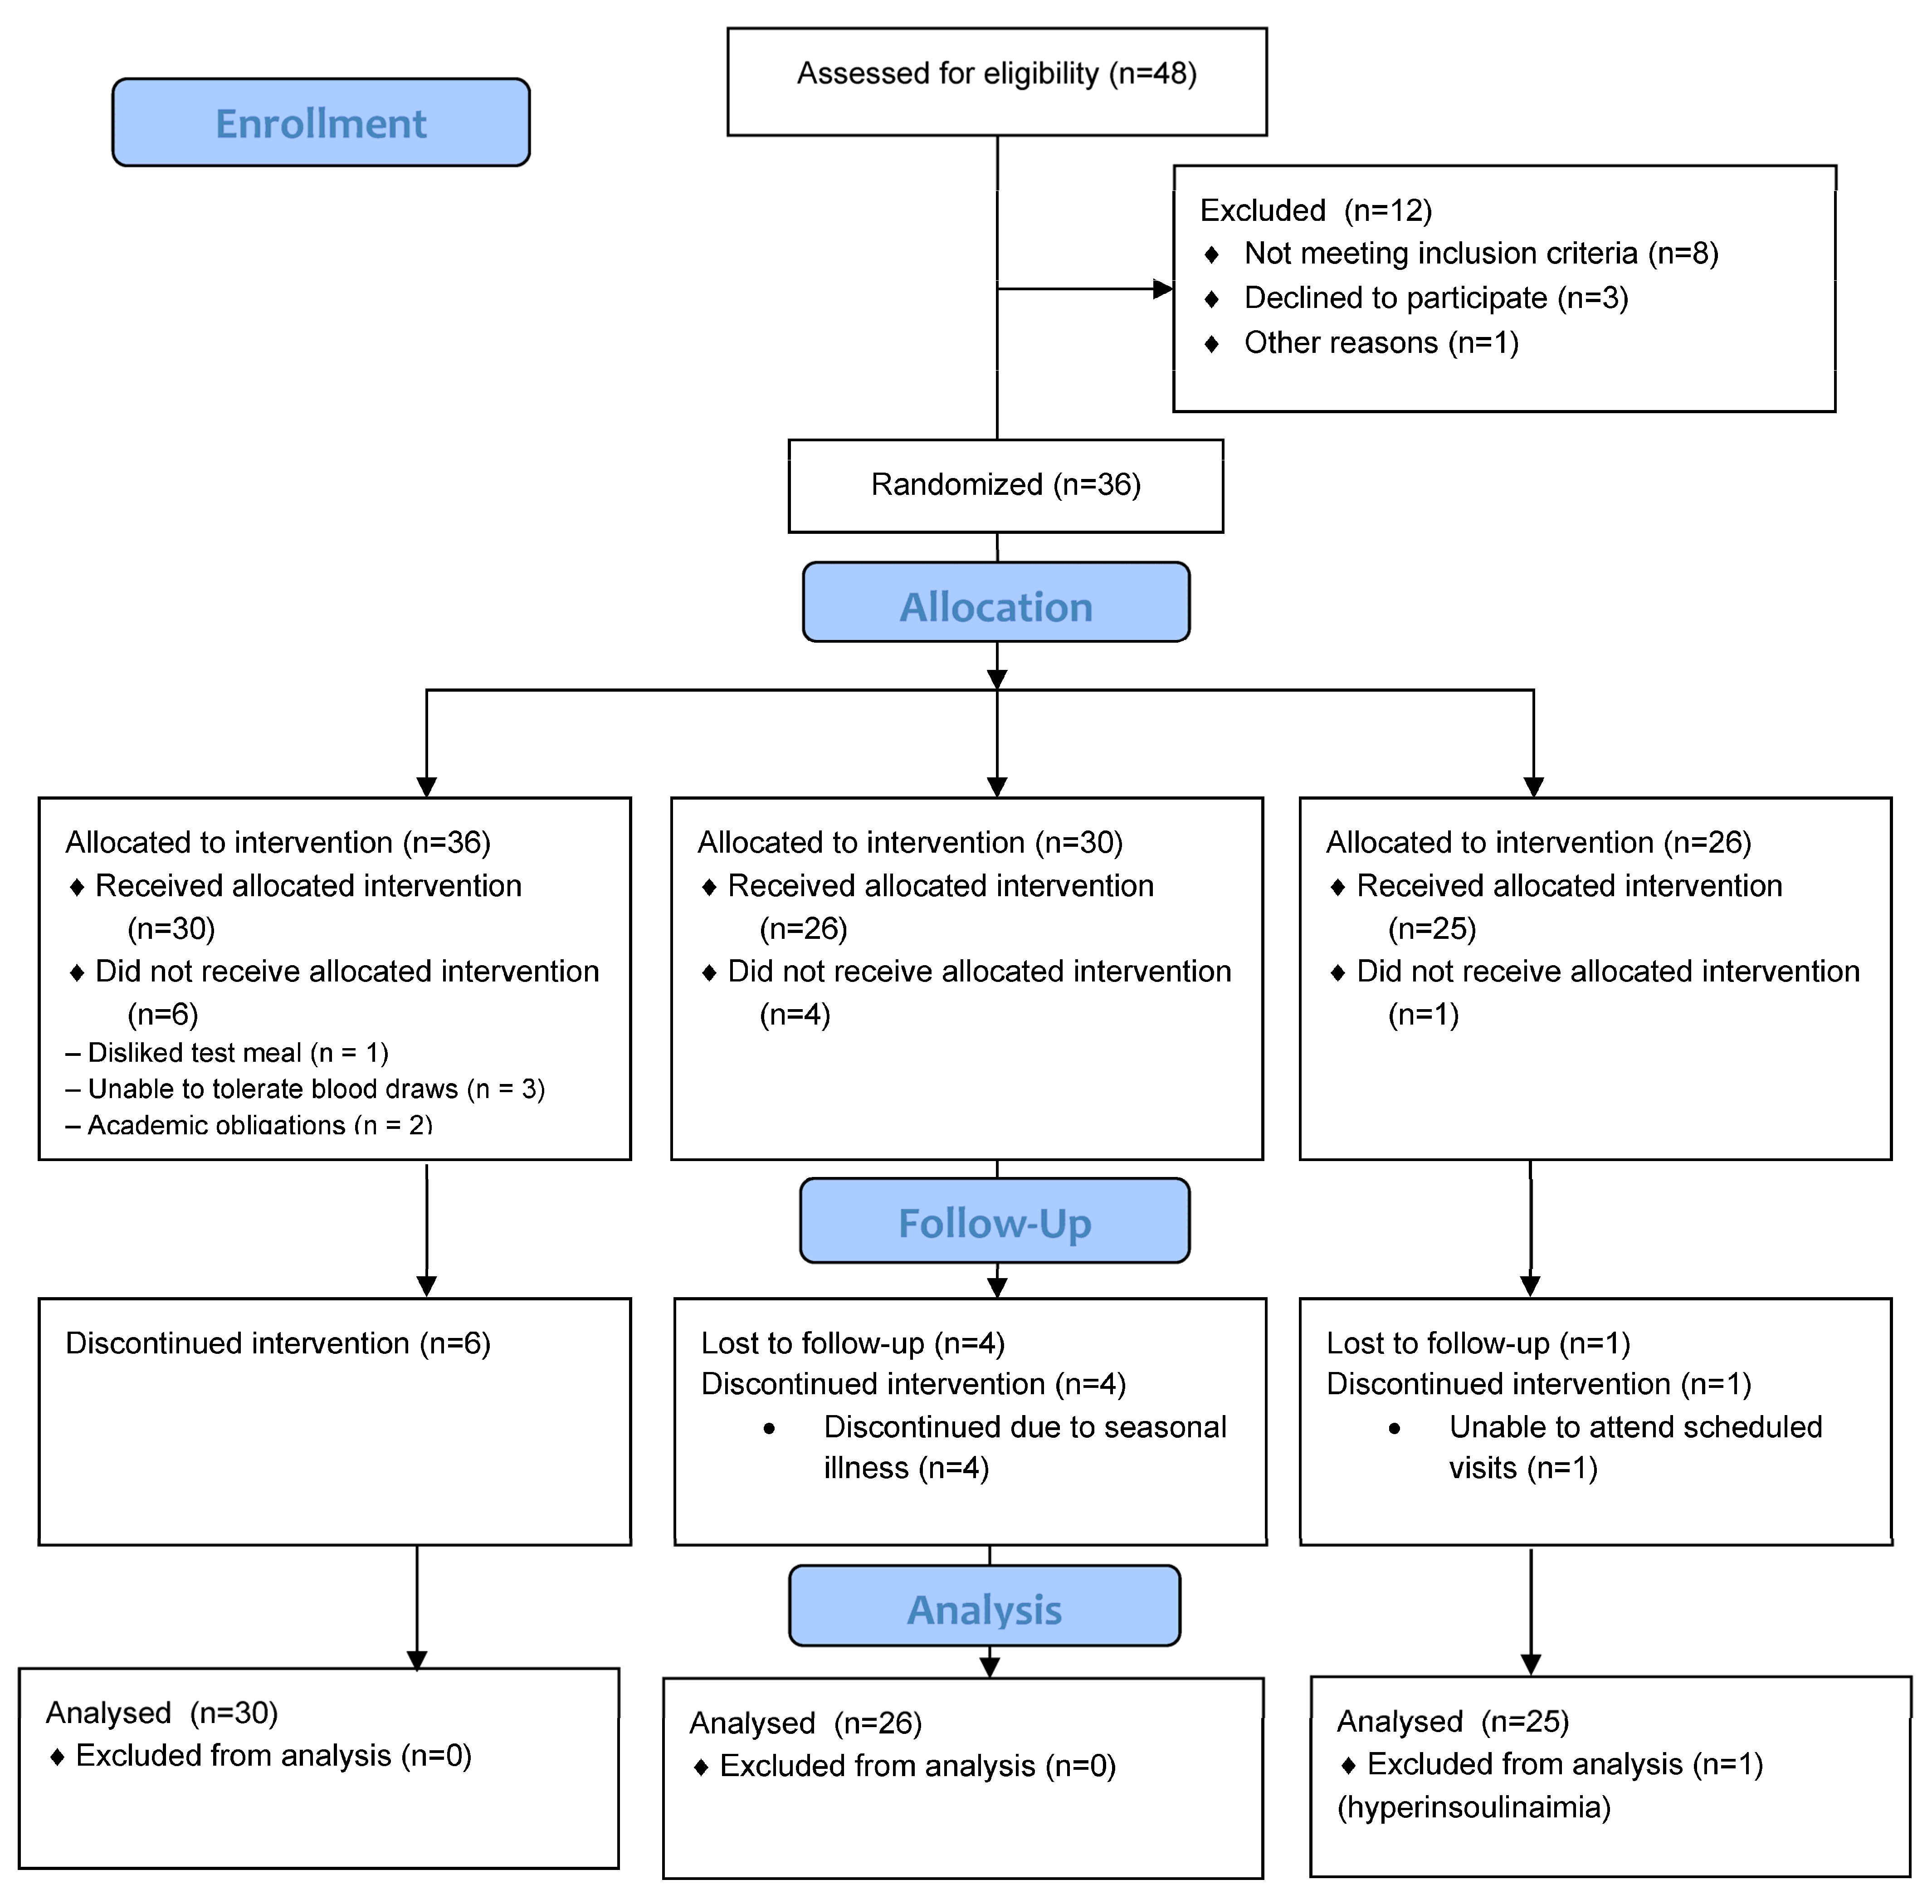
2.1. Participants

Participants were recruited through a public call, posted on social media platforms, as well as through the distribution of printed invitations at various locations across Lemnos Island, including facilities of the University of the Aegean. Eligible participants were individuals aged between 18 and 60 years, who were neither pregnant nor breastfeeding, and who were not receiving any pharmacological treatment that could potentially influence metabolic processes. Additionally, participants were required to be free from any active chronic diseases. The objectives of the study were clarified to each voluntary participant before they signed an informed consent form. Participation was voluntary, and all participants were required to provide written consent form prior to their involvement. The informed consent document provided detailed information regarding the voluntary nature of participation, as well as explicit assurances regarding the confidentiality and anonymity of participants’ essential data. On the day of data collection, each participant was assigned a unique code to ensure anonymity and cross-reference treatment allocation across the three visits. The study adhered to the World Medical Association’s Code of Ethics (Declaration of Helsinki).

2.2. Experimental Design

This study used a 3-arm, randomized, cross-over design, with a one-week washout period between treatment phases. The order of the three interventions was determined using a computer-generated randomization list, which assigned each participant to a specific treatment order. Consequently, participants were randomly allocated to receive all three interventions—(1) olive leaf powder biscuits (OLB), (2) olive leaf tea (OLT), and (3) placebo treatment (CTRL)—in a counterbalanced crossover design. A one-week washout period was implemented between each phase to eliminate carryover effects between interventions. During each intervention phase, participants consumed the assigned treatment simultaneously with a standardized high-carbohydrate, high-fat meal. Postprandial responses in glycemic, lipid, antioxidant, and platelet activation markers were assessed at predefined time points: 0 (baseline), 1, 2, and 4 h after the meal. Specifically, measurements included plasma glucose, insulin, lipid profile, total antioxidant capacity (TAC), and levels of platelet-activating factor (PAF).
In both the OLT and OLB interventions, the same amount of olive leaf powder (1.25 g) was administered per dose. The powder was derived from leaves of the Koroneiki olive cultivar, harvested in mid-October, a period known for high phenolic content, from multiple trees in the Kalamata region, Greece. Leaves were sourced from two different local producers to enhance representativeness.
The study was conducted in the specially designed area of the Nutrition and Public Health Unit of the University of Aegean, Lemnos, Greece, under the supervision of two collaborating physicians who were responsible for blood sampling.
The study protocol was approved by the Research Ethics and Ethics Committee of the University of the Aegean (ID: 9069/27.02.2025) and it was registered at www.clinicaltrials.gov (ClinicalTrials.gov identifier NCT06983145).

2.3. Pre-Trial Procedures

Participants were instructed to attend the Nutrition and Public Health Unit of the University of Aegean at 8:45 AM after completing a 12 h overnight fast. While hydration with water was permitted during the fasting, no other fluids were allowed during the trial session. Furthermore, participants were asked to refrain from consuming olives or olive oil in the final meal before the trial and to avoid any physical exertion on the morning of the test. Prior to the initiation of the trial, anthropometric measurements, including age, sex, and body mass index (BMI), were recorded to establish baseline participant characteristics.

2.4. Experimental Treatments

Dried olive leaves were obtained from AS Dolon, Kalamata, Greece. Upon receipt, the leaves were thoroughly rinsed, dried, and then dehydrated in an oven at 70 °C for 150 min. The selected drying temperature and duration were based on preliminary in vitro experiments conducted by our research team to optimize the retention of phenolic compounds and antioxidant activity in the olive leaf samples. After dehydration, the leaves were ground into a fine, homogeneous powder (from a 200 g batch) suitable for incorporation into the tea and biscuit products. A detailed chemical characterization of the olive leaf powder, including its phenolic composition and antioxidant properties, has been conducted in parallel in our laboratory. The results of these in vitro analyses are currently under preparation and will be presented in a separate forthcoming publication.
Prior to the clinical intervention, a separate sensory evaluation study was conducted to determine the most acceptable concentration of olive leaf tea. Initially, four different concentrations of olive leaf powder were pilot-tested internally by the research team (0.25%, 0.5%, 0.75%, 1%, and 2% w/v). Based on preliminary observations and practical considerations, the two most promising concentrations—0.5% and 1% w/v (corresponding to 1.25 and 2.5 g of olive leaf powder per 250 mL of water, respectively)—were selected for formal sensory testing. The selection of these two concentrations was based on multiple factors, including sensory acceptability, anticipated compliance with repeated intake, and the need to ensure a meaningful intake of bioactive compounds. Very low concentrations were excluded from the sensory trial to avoid compromising the expected polyphenolic and antioxidant potency. In addition, previously published studies using olive leaf infusions were reviewed to guide dose selection within a physiologically relevant and safe range. The sensory study involved an independent group of 34 untrained volunteers (aged 18–65 years) and followed a single-blind, within-subject crossover design. Each participant evaluated both selected tea samples under controlled conditions and rated them. The teas were brewed with boiling water, refrigerated overnight, and served chilled at 10 ± 2 °C. Sensory attributes, including color, aroma, taste, aftertaste, and overall acceptance, were rated using a 9-point hedonic scale (1 = dislike extremely, 9 = like extremely). Additionally, participants indicated their preferred sample. Based on participants’ preferences and sensory scores, the 0.5% (w/v) concentration was selected for the clinical trial.
Olive leaf tea for the clinical trial was prepared at the concentration determined from the sensory evaluation by adding 250 mL of boiling water to 1.25 g of olive leaf powder and letting it infuse for 5 min. The tea was then refrigerated overnight to be served chilled. In parallel, the biscuits were produced by incorporating 1.25 g of olive leaf powder into the dough intended for each participant’s serving.
Both test products were provided as part of a standardized, high-fat and carbohydrates meal, specifically designed to assess the postprandial metabolic effects. Each participant consumed a mixed meal consisting of 140 g of dough, providing 683 kcal, 75 g of carbohydrates, 7 g of protein, 39 g of fat, and 1.92 g of dietary fiber.

2.5. Measurements

Blood samples were collected at baseline (t = 0) and at the subsequent time points (1, 2, and 4 postprandial hours) to assess various biomarkers. Glucose, insulin, total cholesterol, HDL (high-density lipoprotein) cholesterol, LDL (low-density lipoprotein) cholesterol, and triglycerides were measured using a biochemical (COBAS c111, Roche, Basel, Switzerland) and immunological analyzer (Snibe Maglumi 1000, Snibe Diagnostic Co., Ltd., Shenzhen, China). The total antioxidant status of plasma was determined using the FRAP (Ferric Reducing Ability of Plasma) assay [16], while the antithrombotic activity was assessed via platelet aggregation factor (PAF) [10]. The platelet aggregation was measured in a Chrono-Log (Havertown, PA, USA) aggregometer coupled to a Chrono-Log recorder (Havertown, PA, USA).

2.6. Meal Analysis

The nutritional composition (Table 1) of the test meals was calculated using data from the United States Department of Agriculture (USDA) FoodData Central database [17]. The macronutrient content (carbohydrates, fats, proteins) and total caloric value of each meal were determined based on the individual ingredients and their respective quantities. Particular attention was given to ensuring that the meals were isocaloric and had similar macronutrient profiles, following the aims of the postprandial metabolic assessment.

2.7. Sample Size Calculations

The sample sizes were calculated using G*Power 3.1 (University of Düsseldorf, Düsseldorf, Germany). For the nutritional intervention, considering a probability of 80% that the study will detect a treatment difference at a two-sided 0.05 significance level, the sample of 30 individuals is sufficient to detect a difference of 0.25 mg/dL in the primary outcome (glucose) between the experimental groups. We increased the sample size to 36, considering a drop-out rate of 20%.
The sample size calculation of the sensory evaluation showed that 38 participants would be sufficient to identify a significant difference of 0.5 point on the “overall liking” indicator between the tested tea concentrations, with a power of 85% holding for a matched two-paired t-test at a level of 5%.

2.8. Data Analysis

Statistical analyses were conducted using IBM SPSS Statistics version 17.0 (IBM Corp., Armonk, NY, USA). Data were tested for normality to ensure the appropriateness of the test. For the clinical trial data, a repeated-measures design was employed via the General Linear Model (GLM) procedure to assess the effects of the three test meals on postprandial biomarker responses across four time points (baseline, 1 h, 2 h, and 4 h). Estimated marginal means were computed, and group-by-time interactions were examined. Statistical significance was set at p < 0.05. For the sensory evaluation, a paired samples t-test was applied to compare participants’ acceptability ratings between the two tea samples, as each participant evaluated both conditions.

3. Results

The results of this study are presented across multiple domains, including sensory evaluation, biochemical markers, antioxidant status, and platelet aggregation. Initially, a sensory evaluation was conducted to compare two different concentrations of olive leaf tea to determine the most acceptable formulation for use in the subsequent intervention. Following this line, the effects of the selected olive leaf products on postprandial glycemic and lipid responses, total antioxidant capacity, and platelet-activating factor (PAF)-induced platelet aggregation were assessed in healthy adults consuming a high-carbohydrate, high-fat meal.

3.1. Sensory Evaluation

A separate group of volunteers (n = 34) evaluated the sensory properties of each tea sample using a nine-point hedonic scale, assessing attributes such as taste, aroma, color, aftertaste, and overall liking. The “overall liking” score reflected the general acceptability of each sample.
The sensory evaluation revealed significant differences in consumer acceptance between the two olive leaf tea concentrations (0.5% and 1%) (Table 2). The 0.5% infusion received significantly higher scores in taste (7.11 vs. 6.13, p < 0.05), aftertaste (7.32 vs. 5.97, p < 0.05), color (5.55 vs. 6.66, p < 0.05), and overall liking (7.53 vs. 6.24, p < 0.05). No statistically significant difference was observed in aroma between the two samples (6.87 vs. 6.37, p > 0.05).
These findings suggest a clear preference among participants for the tea prepared at 0.5% concentration, particularly regarding flavor characteristics, as it received the highest overall acceptability scores. Although the 1% tea achieved higher scores in terms of color and had similar aromatic profiles, its more intense taste may have negatively affected its overall acceptability.

3.2. Participant Characteristics

Recruitment ceased after thirty-six participants were enrolled (Figure 1). During the study, eleven participants discontinued for various reasons: one participant withdrew due to dislike of the test meal; three participants reported being unable to tolerate repeated blood sampling; two participants were unable to continue due to academic obligations; four participants discontinued participation due to a seasonal viral infection; and one participant was unable to attend the clinic on the scheduled study days. As a result, twenty-five participants completed all study procedures and were included in the final analysis. However, one participant was excluded from the statistical analysis due to hyperinsulinemia observed in their postprandial insulin values.
Table 3 presents the baseline general characteristics of the 24 study participants, including demographic, anthropometric, and lifestyle variables. The sample consisted of 11 men and 13 women, with a mean age of 31.23 ± 9.8 years. Anthropometric data showed an average weight of 73.48 ± 19.24 kg, height of 171.24 ± 9.45 cm, and body mass index (BMI) of 24.71 ± 4.76 kg/m2. Additional body composition parameters included fat percentage (25.59 ± 6.08%), muscle mass (51.43 ± 12.28 kg), and total body water percentage (51.86 ± 3.69%). Basal metabolic rate averaged 1633.29 ± 368.37 kcal/day, while the waist-to-hip ratio (WHR) was 0.80 ± 0.09. Regarding lifestyle habits, 9 participants reported smokers and 15 non-smokers; physical activity levels varied, with 14 classified as low, 6 as medium, and 4 as high.
Given the acute nature of the intervention and the relatively short study duration (~14 days), which included three visits separated by one-week washout periods, post-intervention anthropometric reassessments were not performed. Significant changes in parameters such as body weight or composition are unlikely to occur within this timeframe, especially in response to a single administration of the test product. Therefore, our analysis focused on acute metabolic and biochemical markers to assess the effects of the interventions.

3.3. Biomarkers Analysis

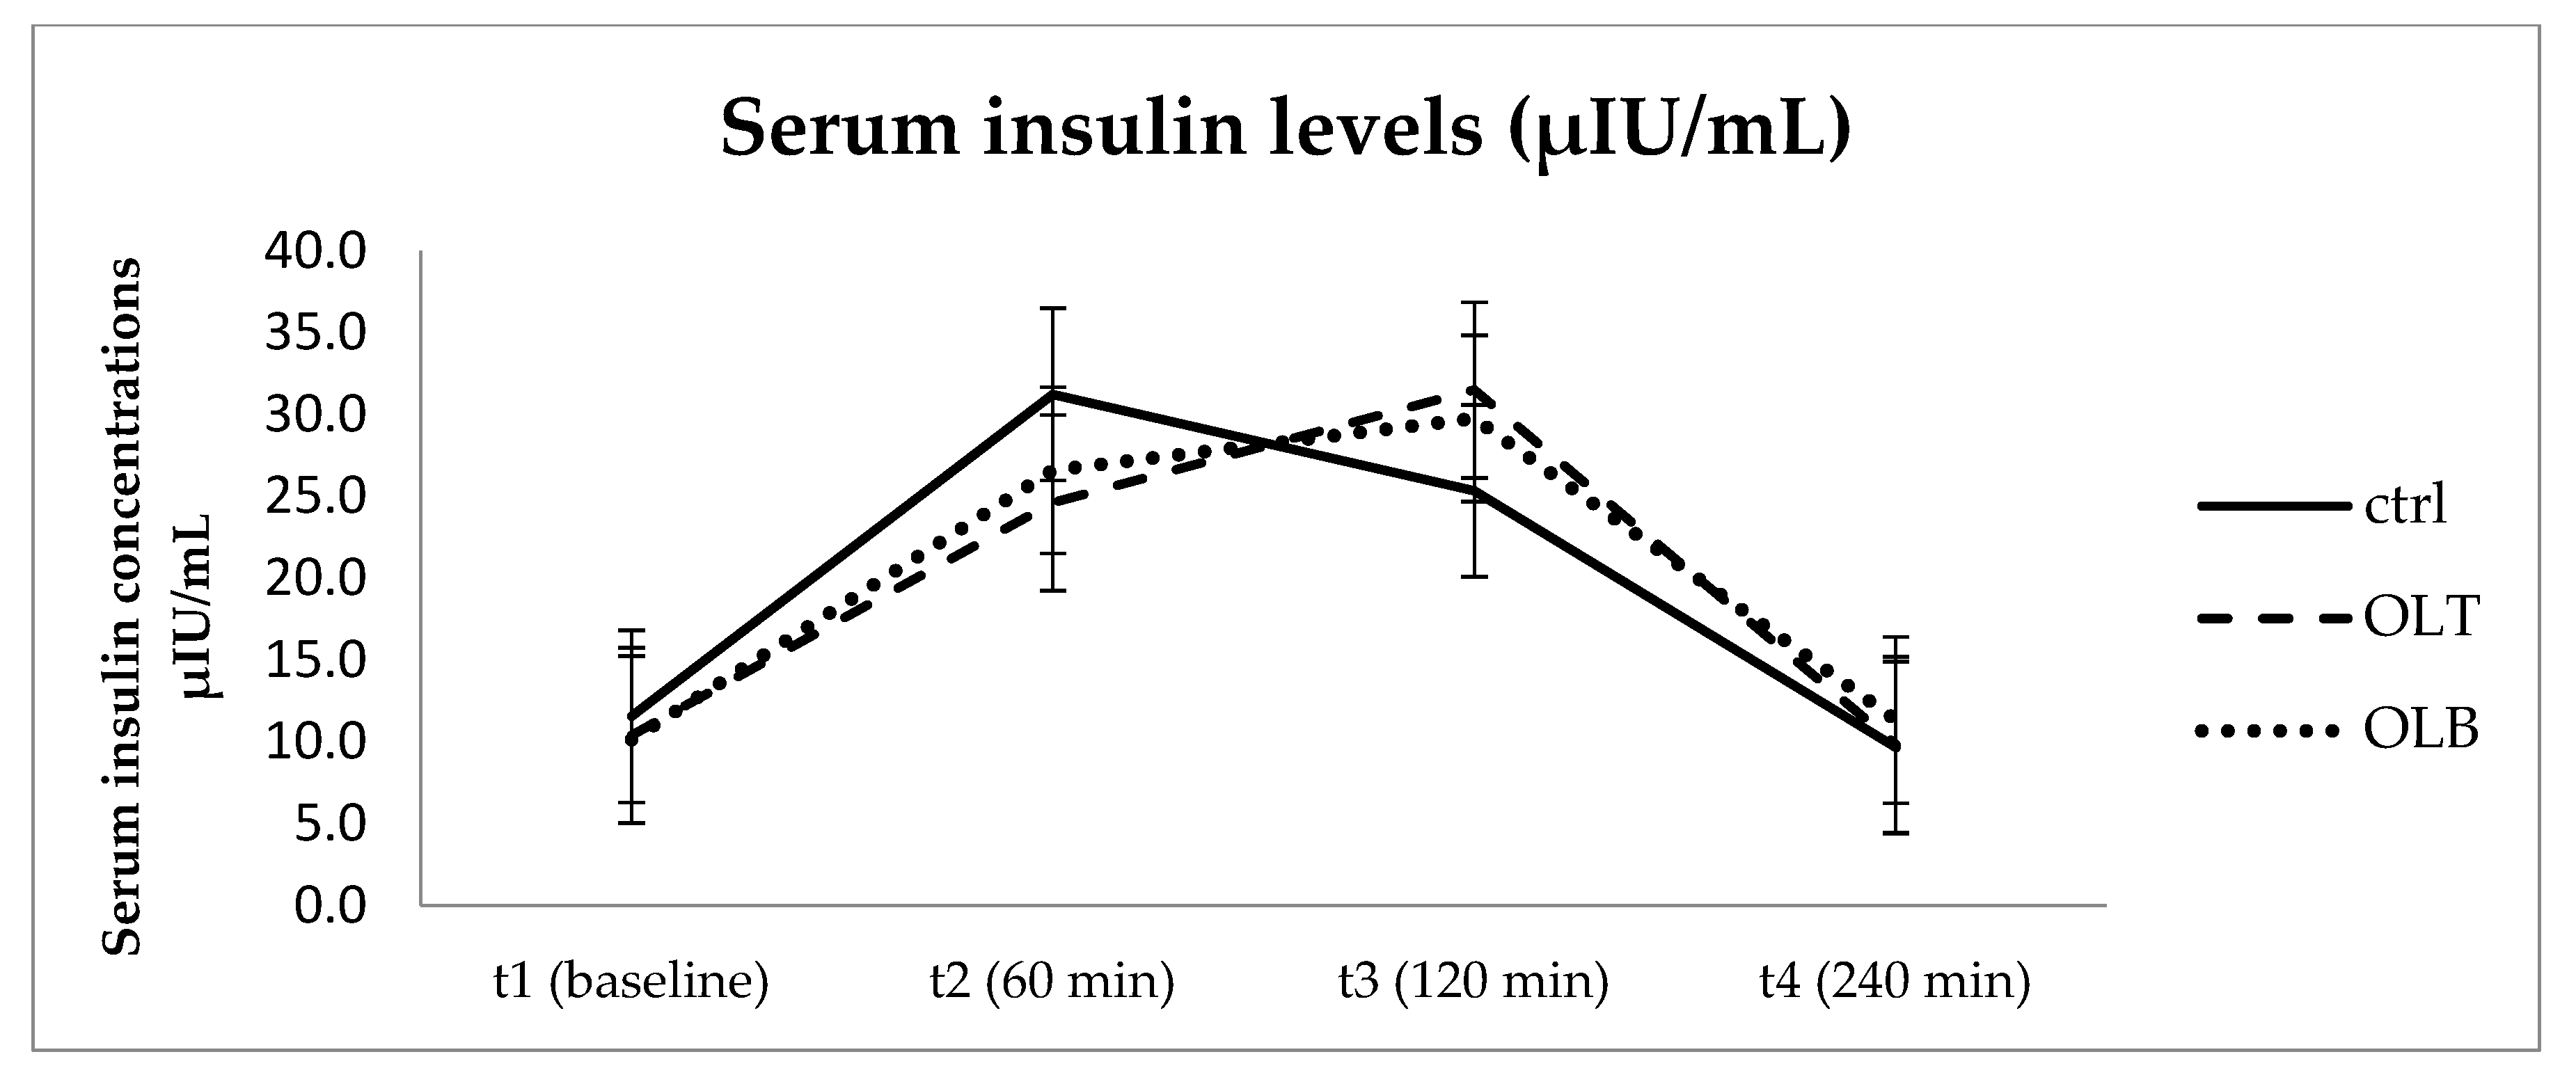
3.3.1. Insulin Levels

The estimated marginal means of insulin (INS) concentrations at baseline (t1), 1 h (t2), 2 h (t3), and 4 h (t4) are summarized in Table 4 and depicted in Figure 2. Baseline, INS levels were comparable across the CTRL (11.570 ± 1.084 μU/mL), OLT (10.387 ± 0.642 μU/mL), and OLB (10.158 ± 0.757 μU/mL) groups.
Postprandial INS increased in all groups, peaking at 1 h (t2) for CTRL (31.250 ± 3.311 μU/mL) and at 2 h (t3) for both OLT (31.513 ± 3.383 μU/mL) and OLB (29.773 ± 4.471 μU/mL) before declining toward baseline at 4 h (t4) in all groups.
Although graphical trends suggested differences in the timing and magnitude of the insulin peak between groups, the group-by-time interaction was not statistically significant (p = 0.054). Overlapping 95% confidence intervals across groups (e.g., t3: CTRL [17.211, 33.495], OLT [24.515, 38.510], OLB [20.524, 39.021]) further indicate the absence of significant differences.
Overall, these results demonstrate a transient postprandial increase in insulin followed by a return to baseline, with similar temporal patterns across groups. A possible delay in the insulin peak observed in the OLT and OLB groups compared to CTRL warrants further investigation into future studies.

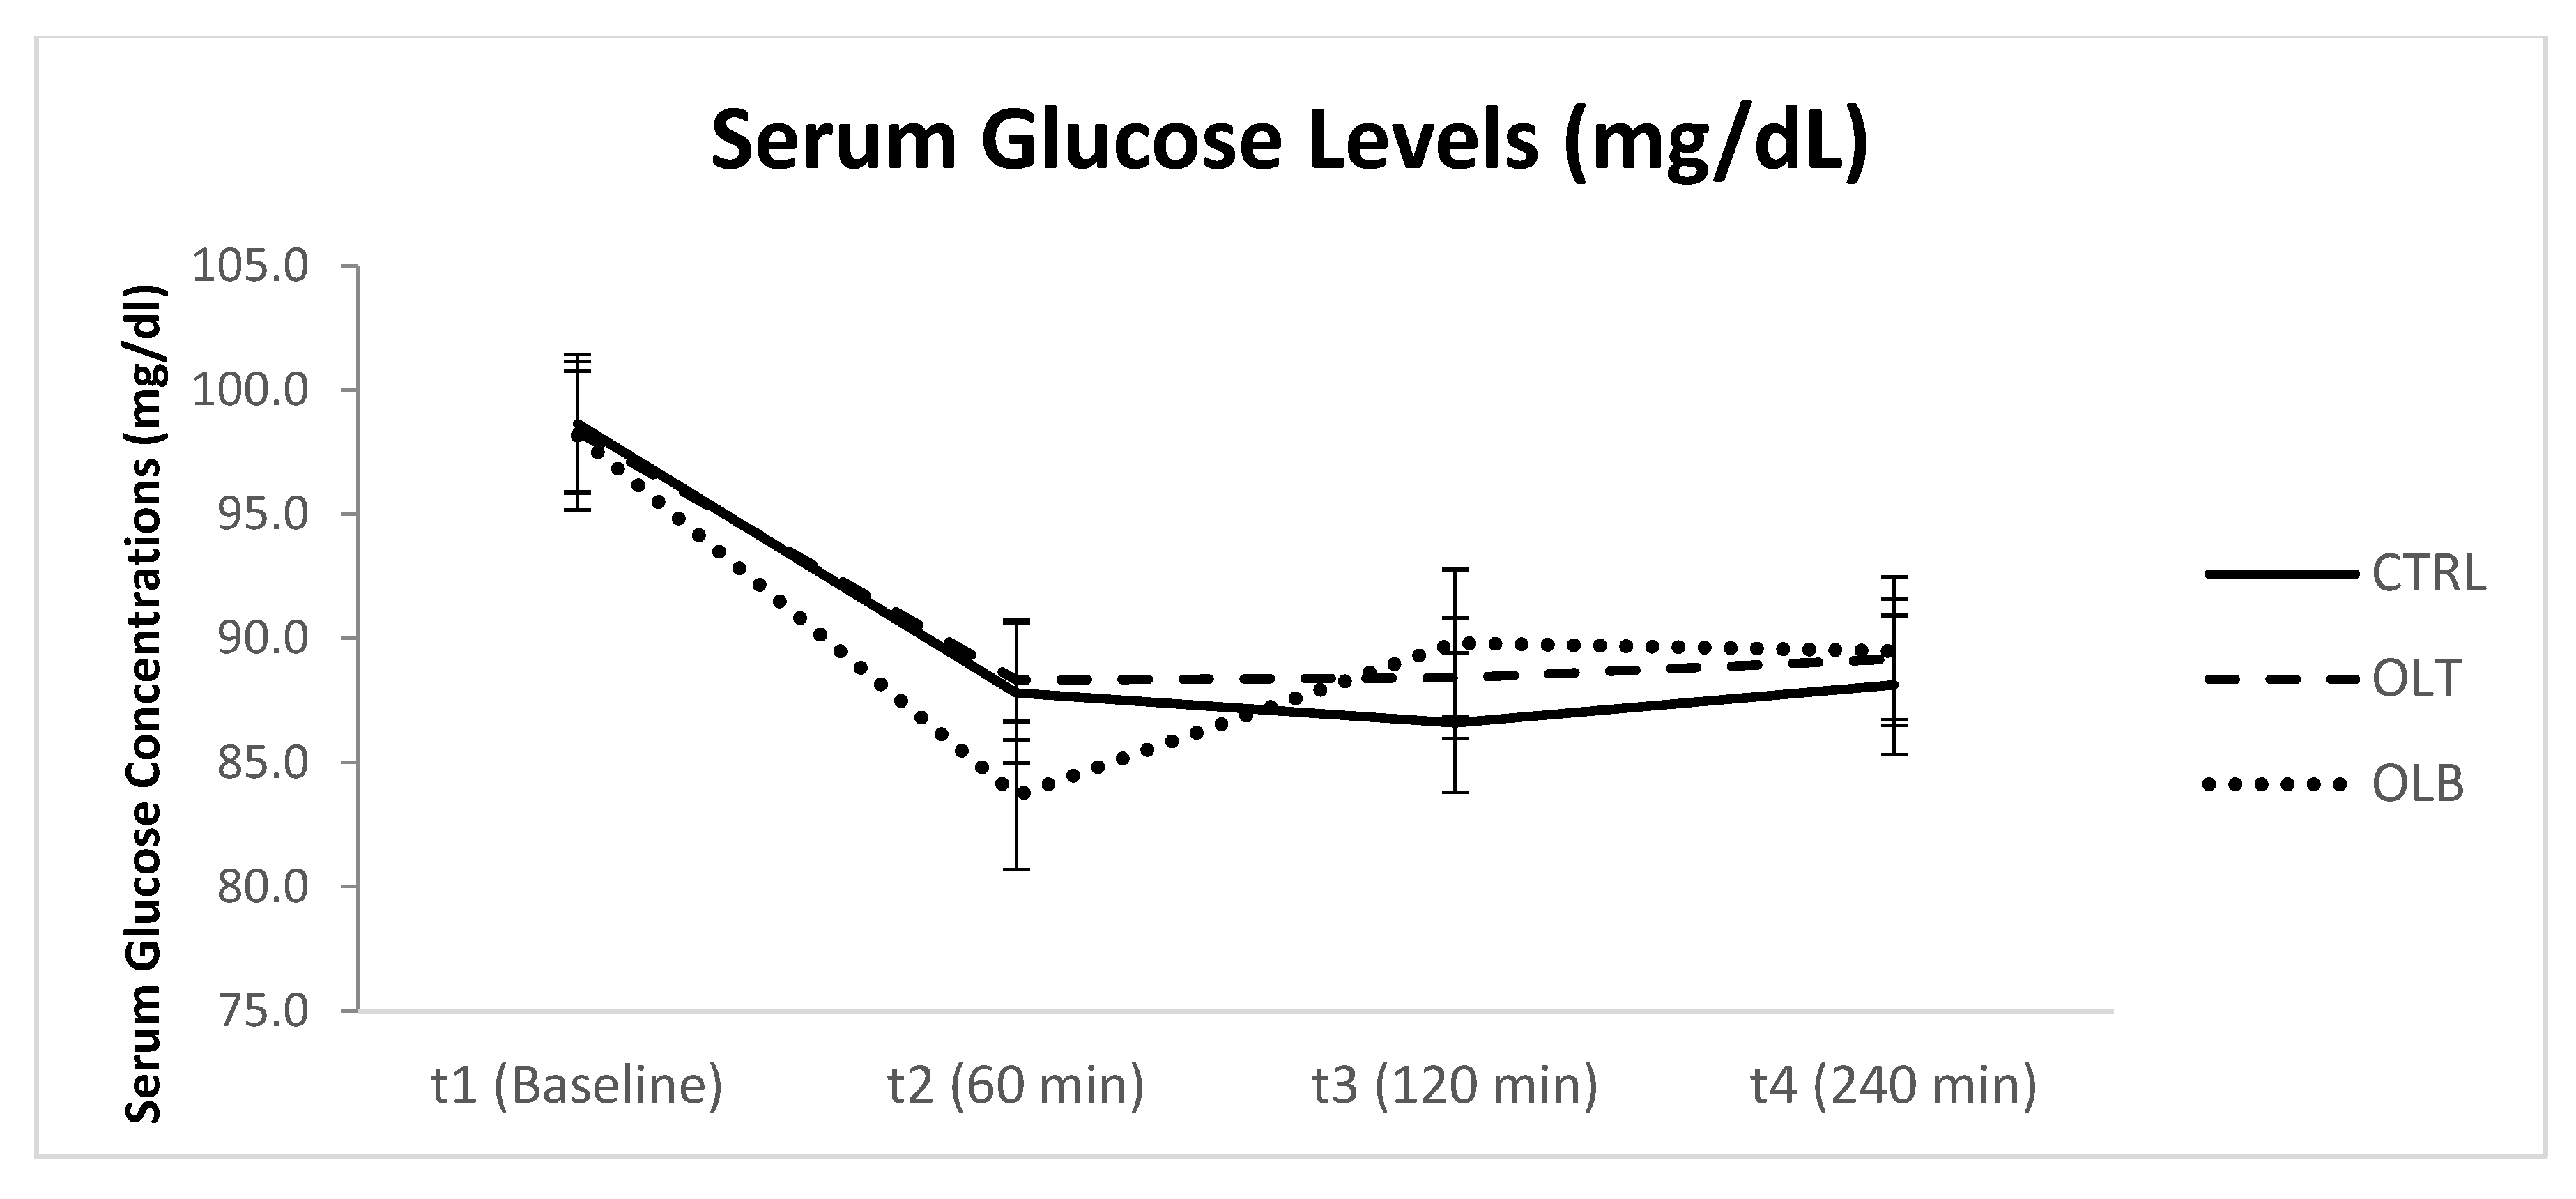
3.3.2. Glucose Levels

The estimated marginal means of glucose (GLU) concentrations at each time point are summarized in Table 5 and visualized in Figure 3. Baseline values were comparable across groups: CTRL (98.125 ± 1.282 mg/dL), OLT (97.833 ± 1.333 mg/dL), and OLB (97.167 ± 1.434 mg/dL).
Following the intervention, all the groups demonstrated a reduction in glucose levels at 1 h, with the lowest values observed at t2 in the OLB group (82.833 ± 2.983 mg/dL), followed by CTRL (86.458 ± 3.074 mg/dL) and OLT (87.208 ± 3.753 mg/dL). Glucose concentrations remained relatively stable at 2 and 4 h, with slight fluctuations but no substantial rebounds or further declines.
No statistically significant group-by-time interaction for glucose levels (p = 0.546) indicates that the temporal pattern of glucose change did not differ meaningfully among the groups. The 95% confidence intervals for all time points across the groups showed considerable overlap (e.g., t3: CTRL [79.840, 92.077], OLT [81.817, 91.933], OLB [82.174, 94.826]).
Overall, the intervention appeared to induce a modest and transient decline in glucose levels in all groups, but without a distinct differential effect between them.

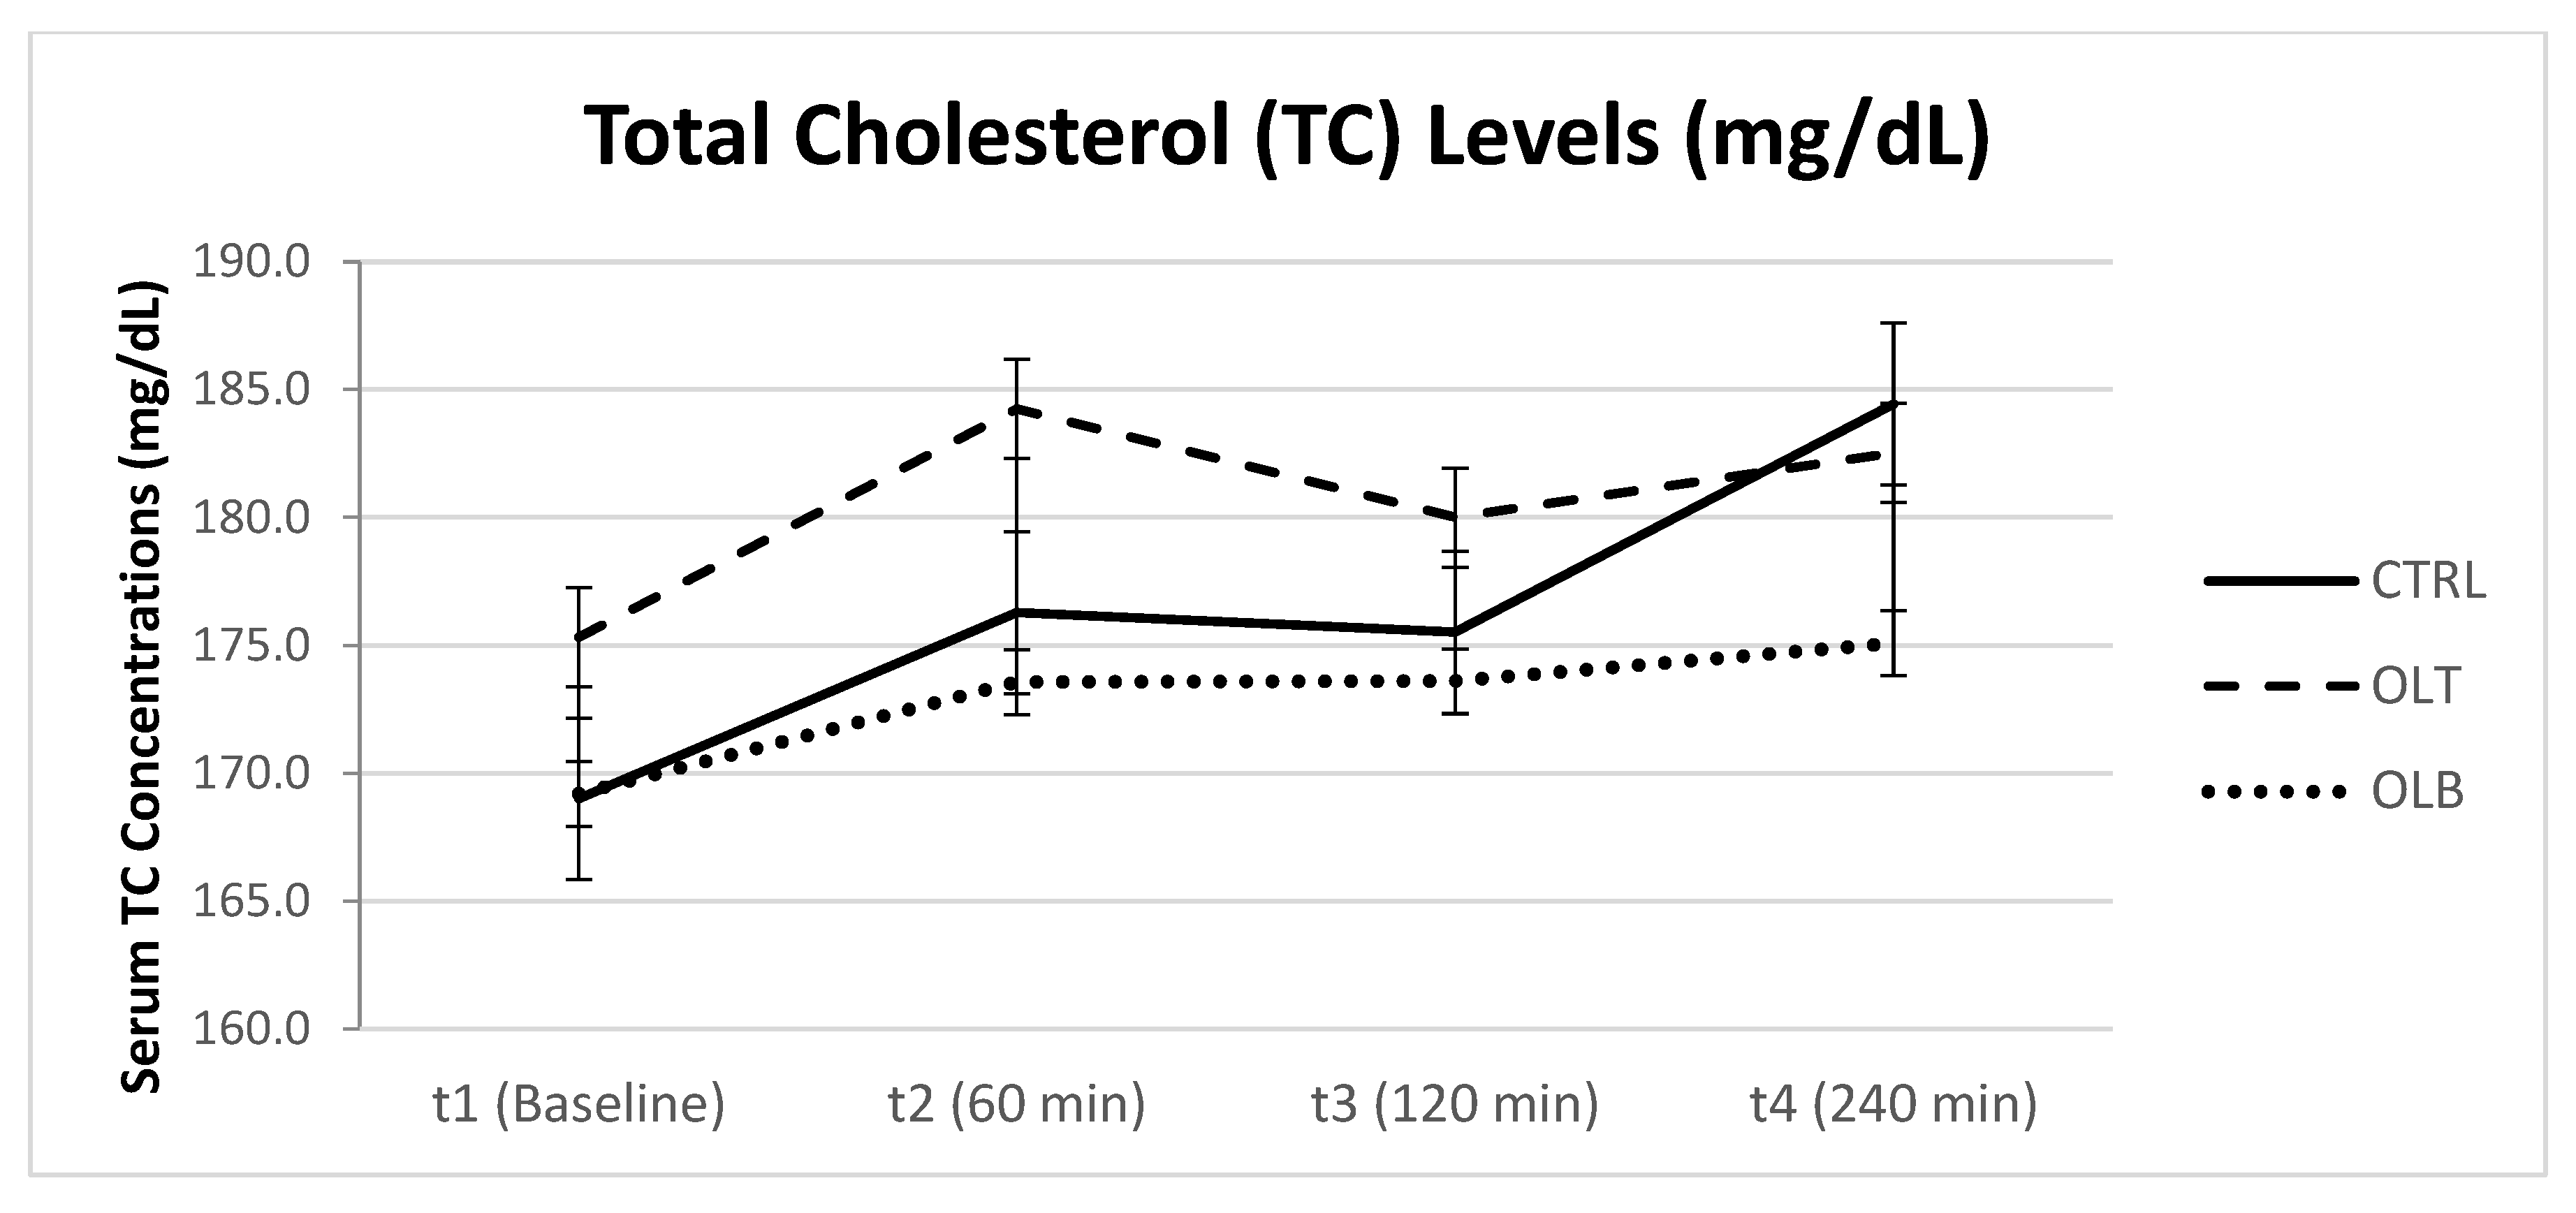
3.3.3. Cholesterol Levels

Estimated marginal means of total cholesterol (TC) at baseline (t1), 1 h (t2), 2 h (t3), and 4 h (t4) are presented in Table 6 and Figure 4. Baseline TC levels were similar among groups: CTRL (169.208 ± 6.623 mg/dL), OLT (173.333 ± 8.247 mg/dL), and OLB (167.042 ± 7.377 mg/dL).
During the postprandial period, TC levels exhibited only minor fluctuations within each group. Specifically, TC values showed slight increases at t2 and t4 across groups, with CTRL ranging from 169.208 ± 6.623 at baseline to 178.667 ± 7.829 mg/dL at 4 h, OLT from 173.333 ± 8.247 to 180.333 ± 8.579 mg/dL, and OLB from 167.042 ± 7.377 to 172.458 ± 6.201 mg/dL.
No significant group-by-time interaction was observed (p = 0.755), indicating no differential effect on TC dynamics between groups. The 95% confidence intervals substantially overlapped across all time points and groups (e.g., t4: CTRL [162.47, 194.86], OLT [162.59, 198.08], OLB [159.63, 185.29]).
Overall, total cholesterol levels remained relatively stable over time, with no statistically significant changes attributable to group or time.

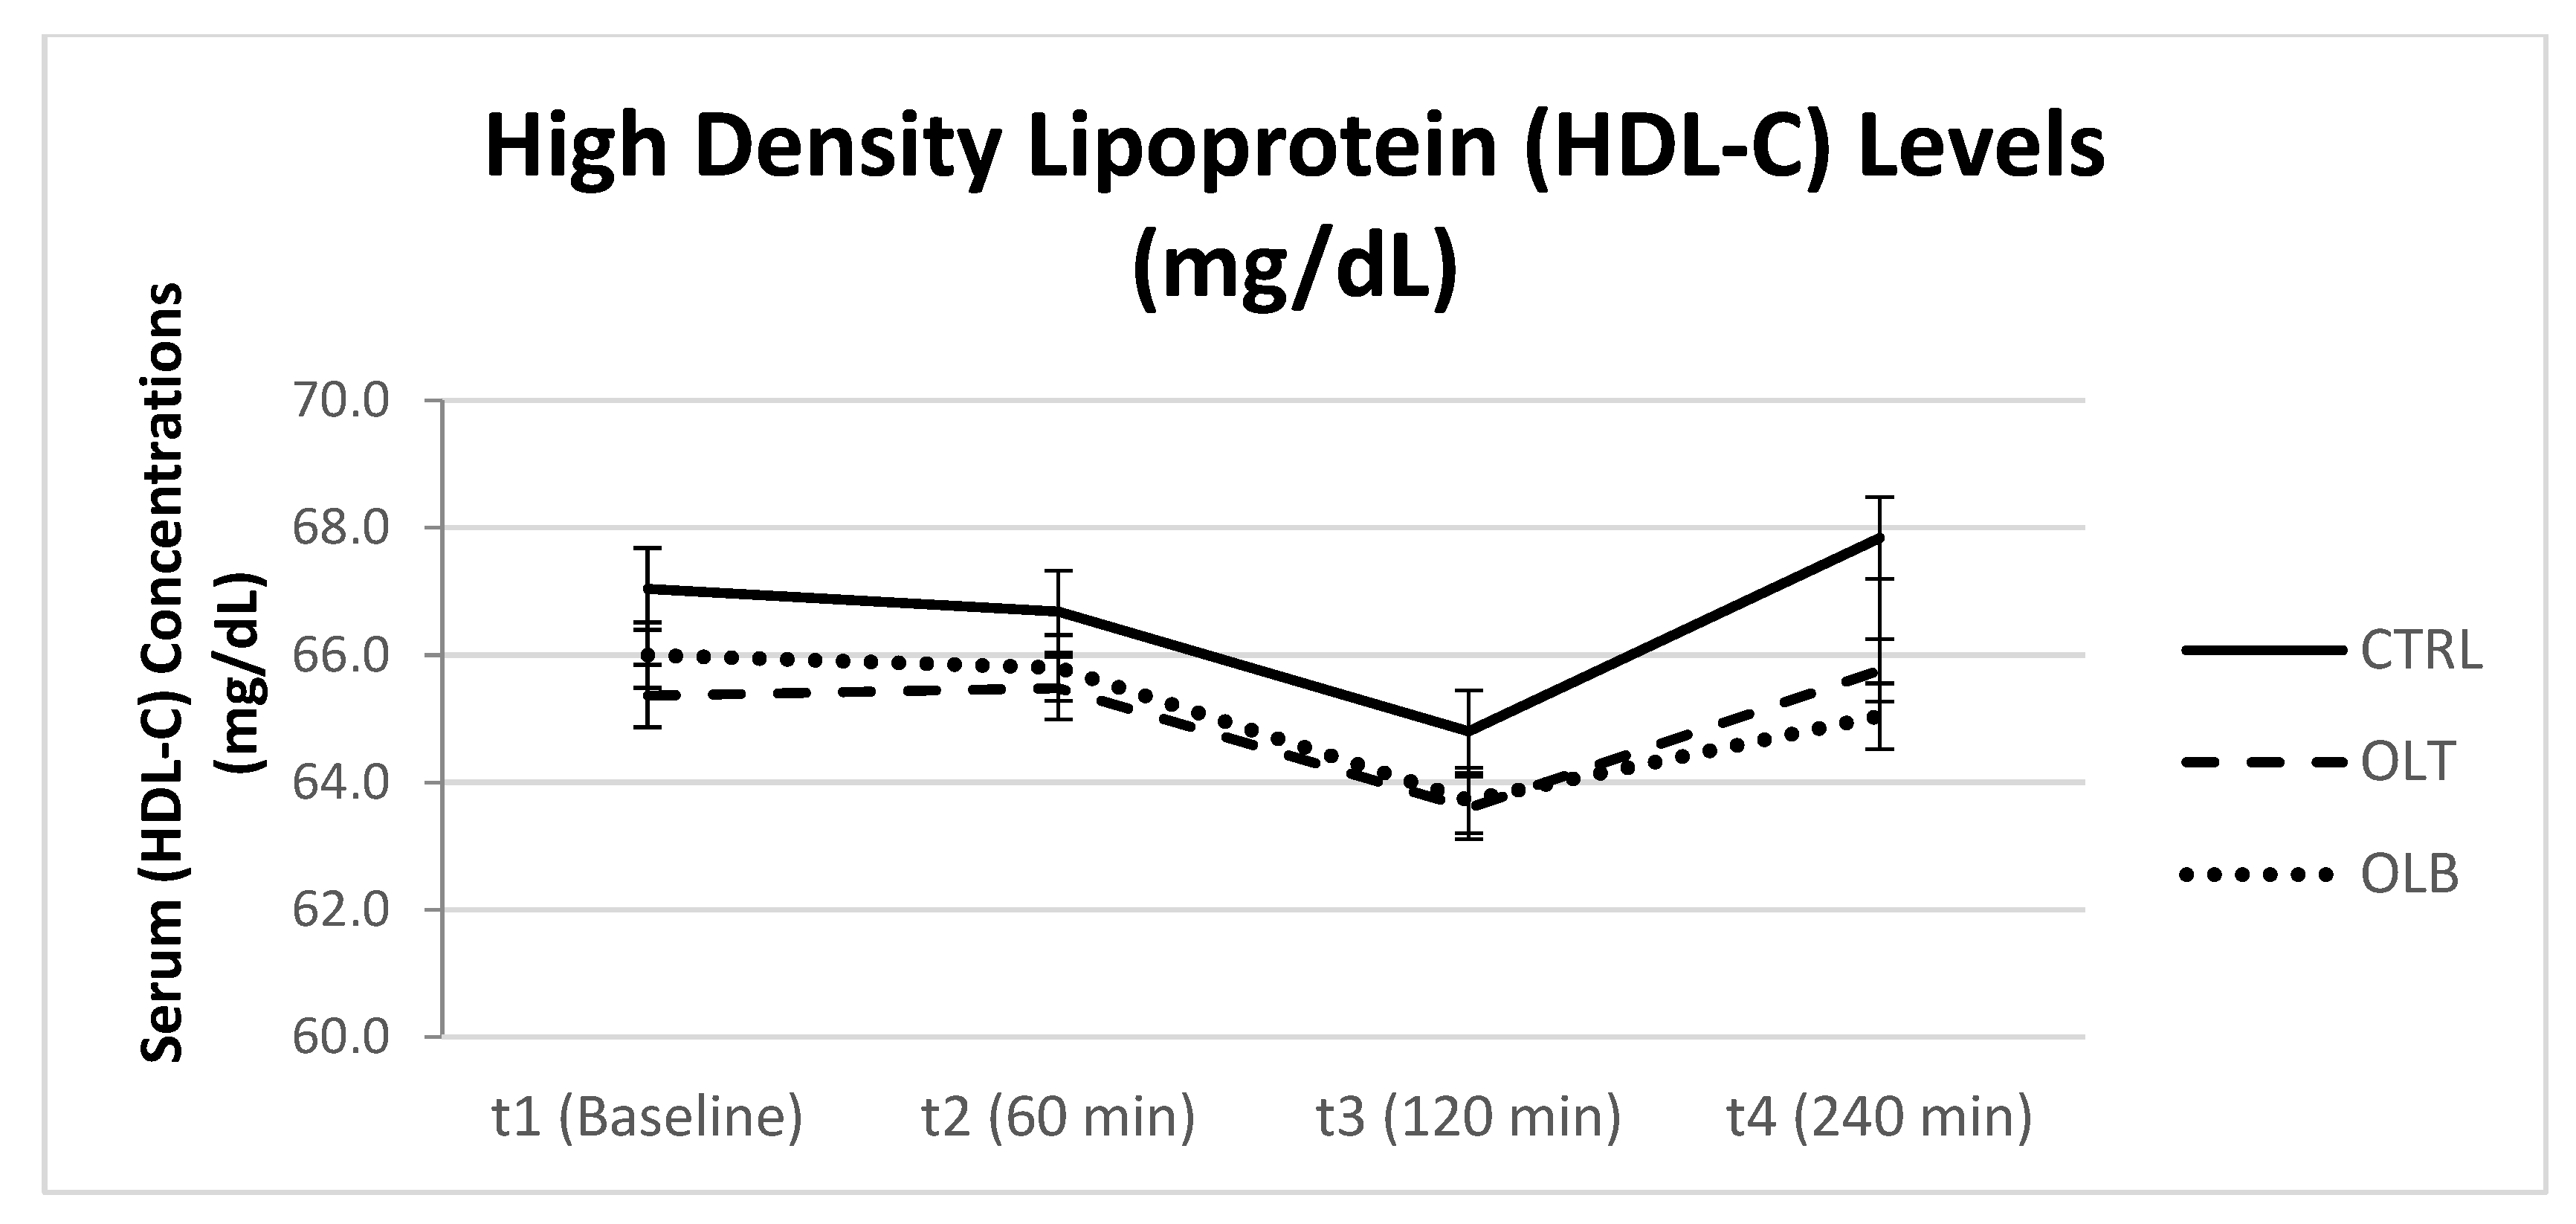
3.3.4. HDL-Cholesterol Levels

The estimated marginal means of high-density lipoprotein cholesterol (HDL-C) at baseline (t1), 1 h (t2), 2 h (t3), and 4 h (t4) are presented in Table 7 and Figure 5. Baseline HDL-C levels were comparable across groups: CTRL (67.875 ± 3.464 mg/dL), OLT (66.208 ± 3.436 mg/dL), and OLB (66.792 ± 2.725 mg/dL).
Throughout the postprandial period, HDL-C concentrations remained relatively stable across all groups. Minor fluctuations were observed, with values ranging between approximately 64 and 68 mg/dL across time points and groups. Specifically, no clear trends were evident.
Statistical analysis revealed no significant group-by-time interaction (p = 0.637), indicating that the temporal profile of HDL-C did not differ significantly between the groups. Overlapping 95% confidence intervals across all measurements further support this finding (e.g., t4: CTRL [61.162, 75.588], OLT [59.632, 73.451], OLB [59.770, 71.730]).
In summary, HDL-C levels remained stable over the postprandial period, with no significant changes attributable to treatment or time.

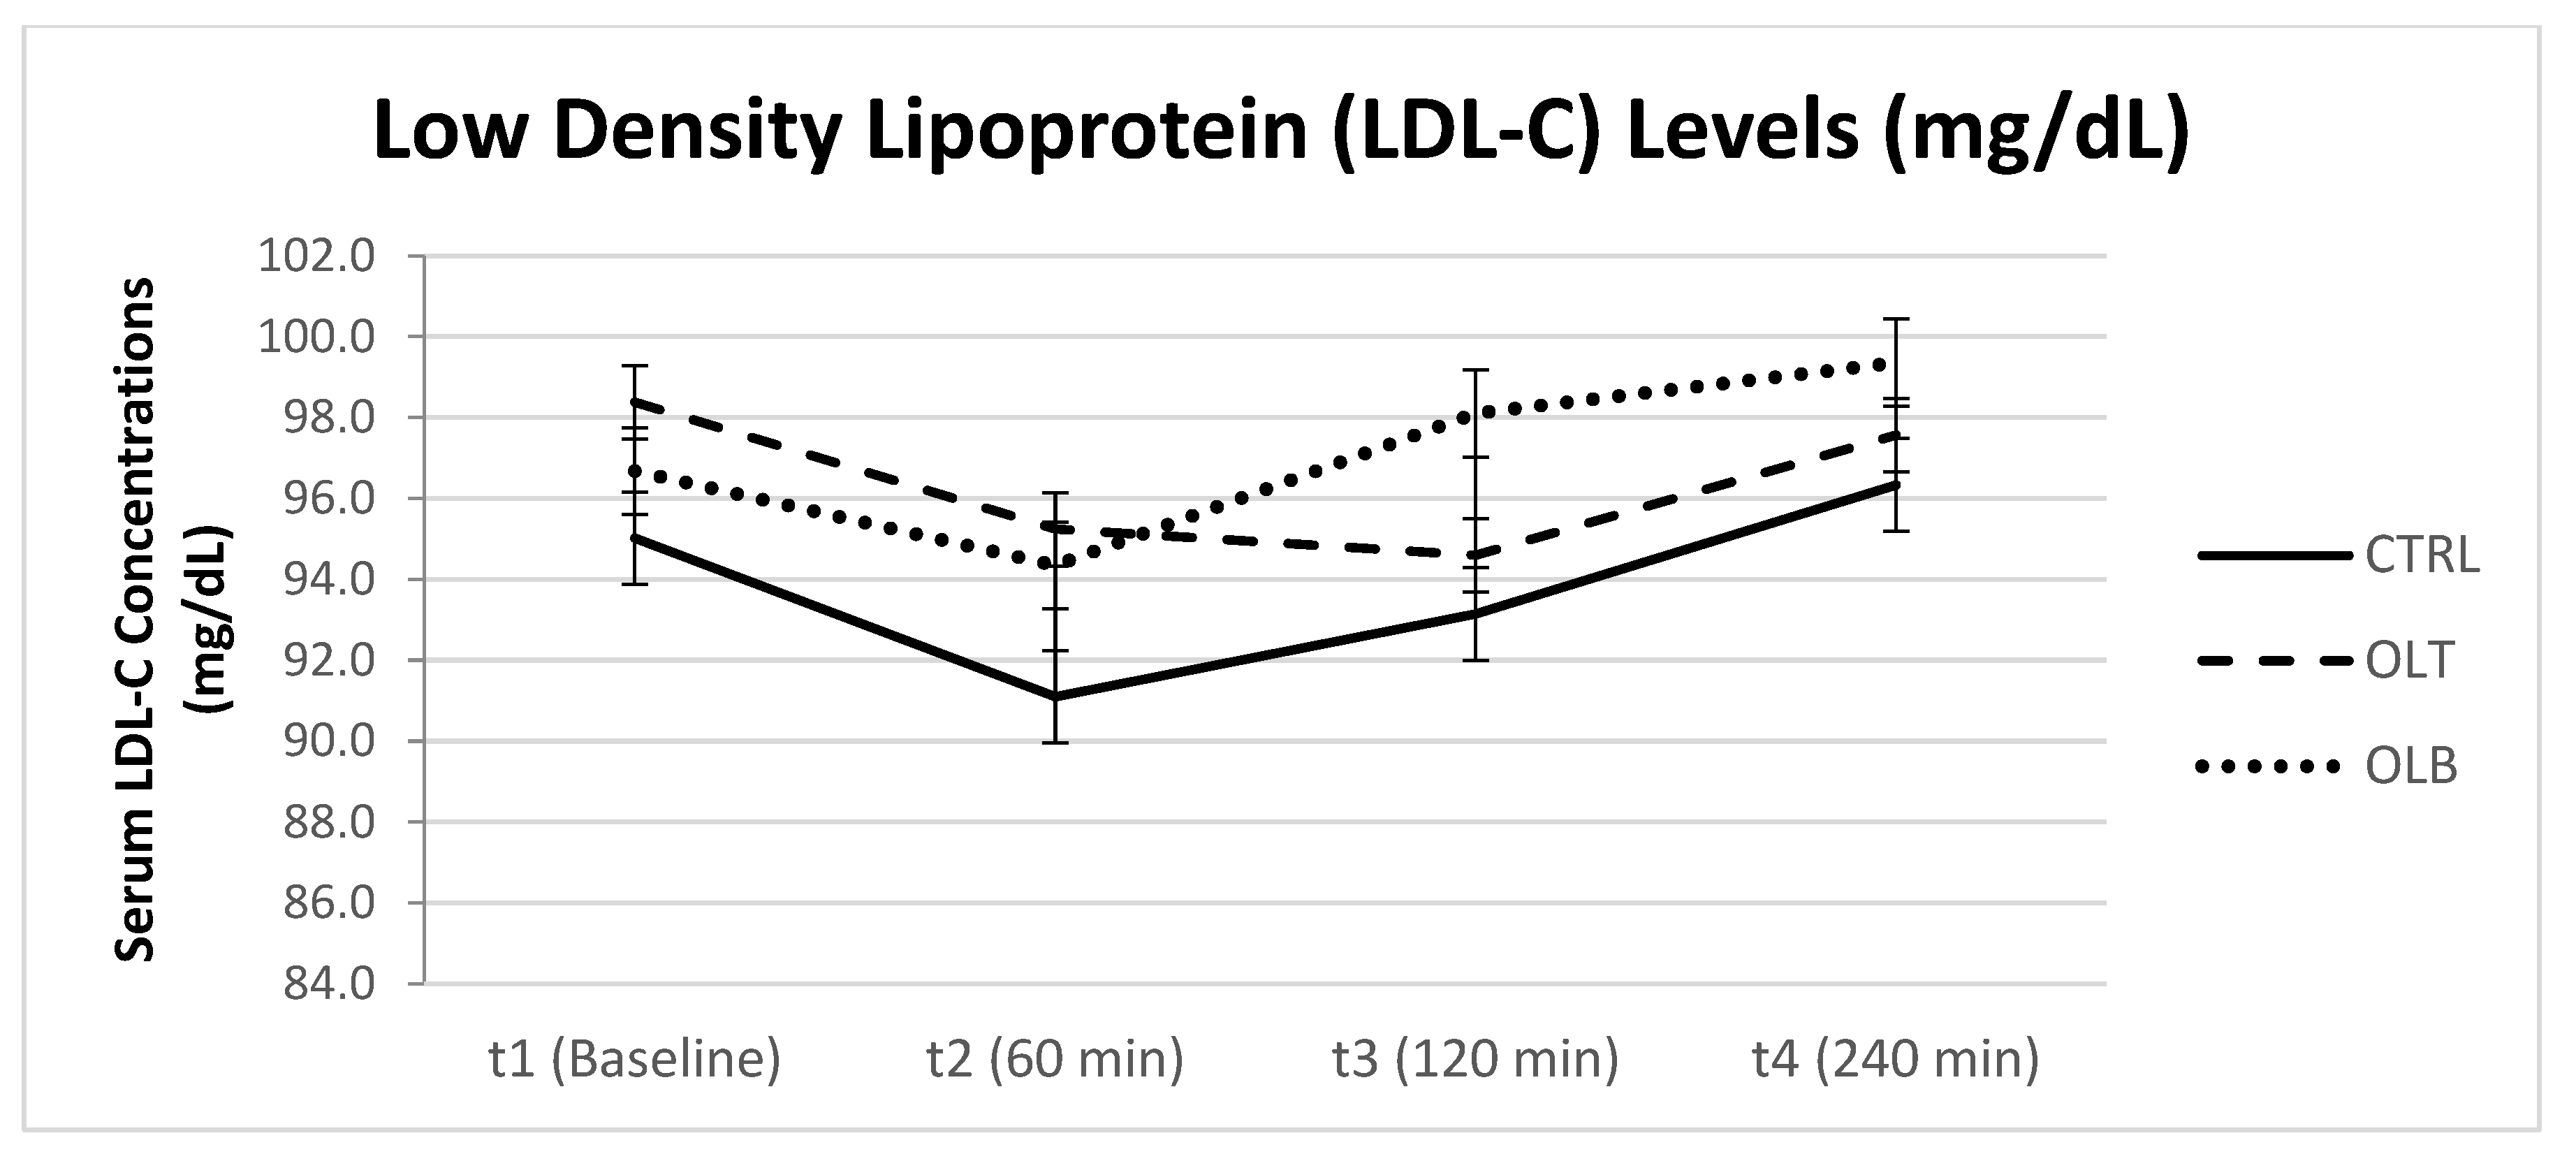
3.3.5. LDL-Cholesterol Levels

Estimated marginal means of low-density lipoprotein cholesterol (LDL-C) at baseline (t1), 1 h (t2), 2 h (t3), and 4 h (t4) are summarized in Table 8 and Figure 6. Baseline LDL-C values were similar across groups: CTRL (93.463 ± 5.566 mg/dL), OLT (95.379 ± 5.360 mg/dL), and OLB (94.458 ± 4.973 mg/dL).
LDL-C levels showed minor variations over time within groups. In the CTRL group, concentrations ranged from 93.463 ± 5.566 mg/dL at baseline to 95.152 ± 5.482 mg/dL at t4. Similarly, OLT and OLB groups demonstrated fluctuations within comparable ranges, with OLB presenting a slight, non-significant increase at t3 (95.540 ± 5.096 mg/dL).
No significant group-by-time interaction was observed (p = 0.325), indicating that changes in LDL-C over the 4 h period were not statistically different between groups. The 95% confidence intervals overlapped substantially across time points and groups (e.g., t4: CTRL [83.812, 106.49], OLT [83.879, 104.95], OLB [86.218, 107.35]).
Overall, LDL-C concentrations remained relatively stable throughout the study, with no statistically significant temporal or treatment-related effects.

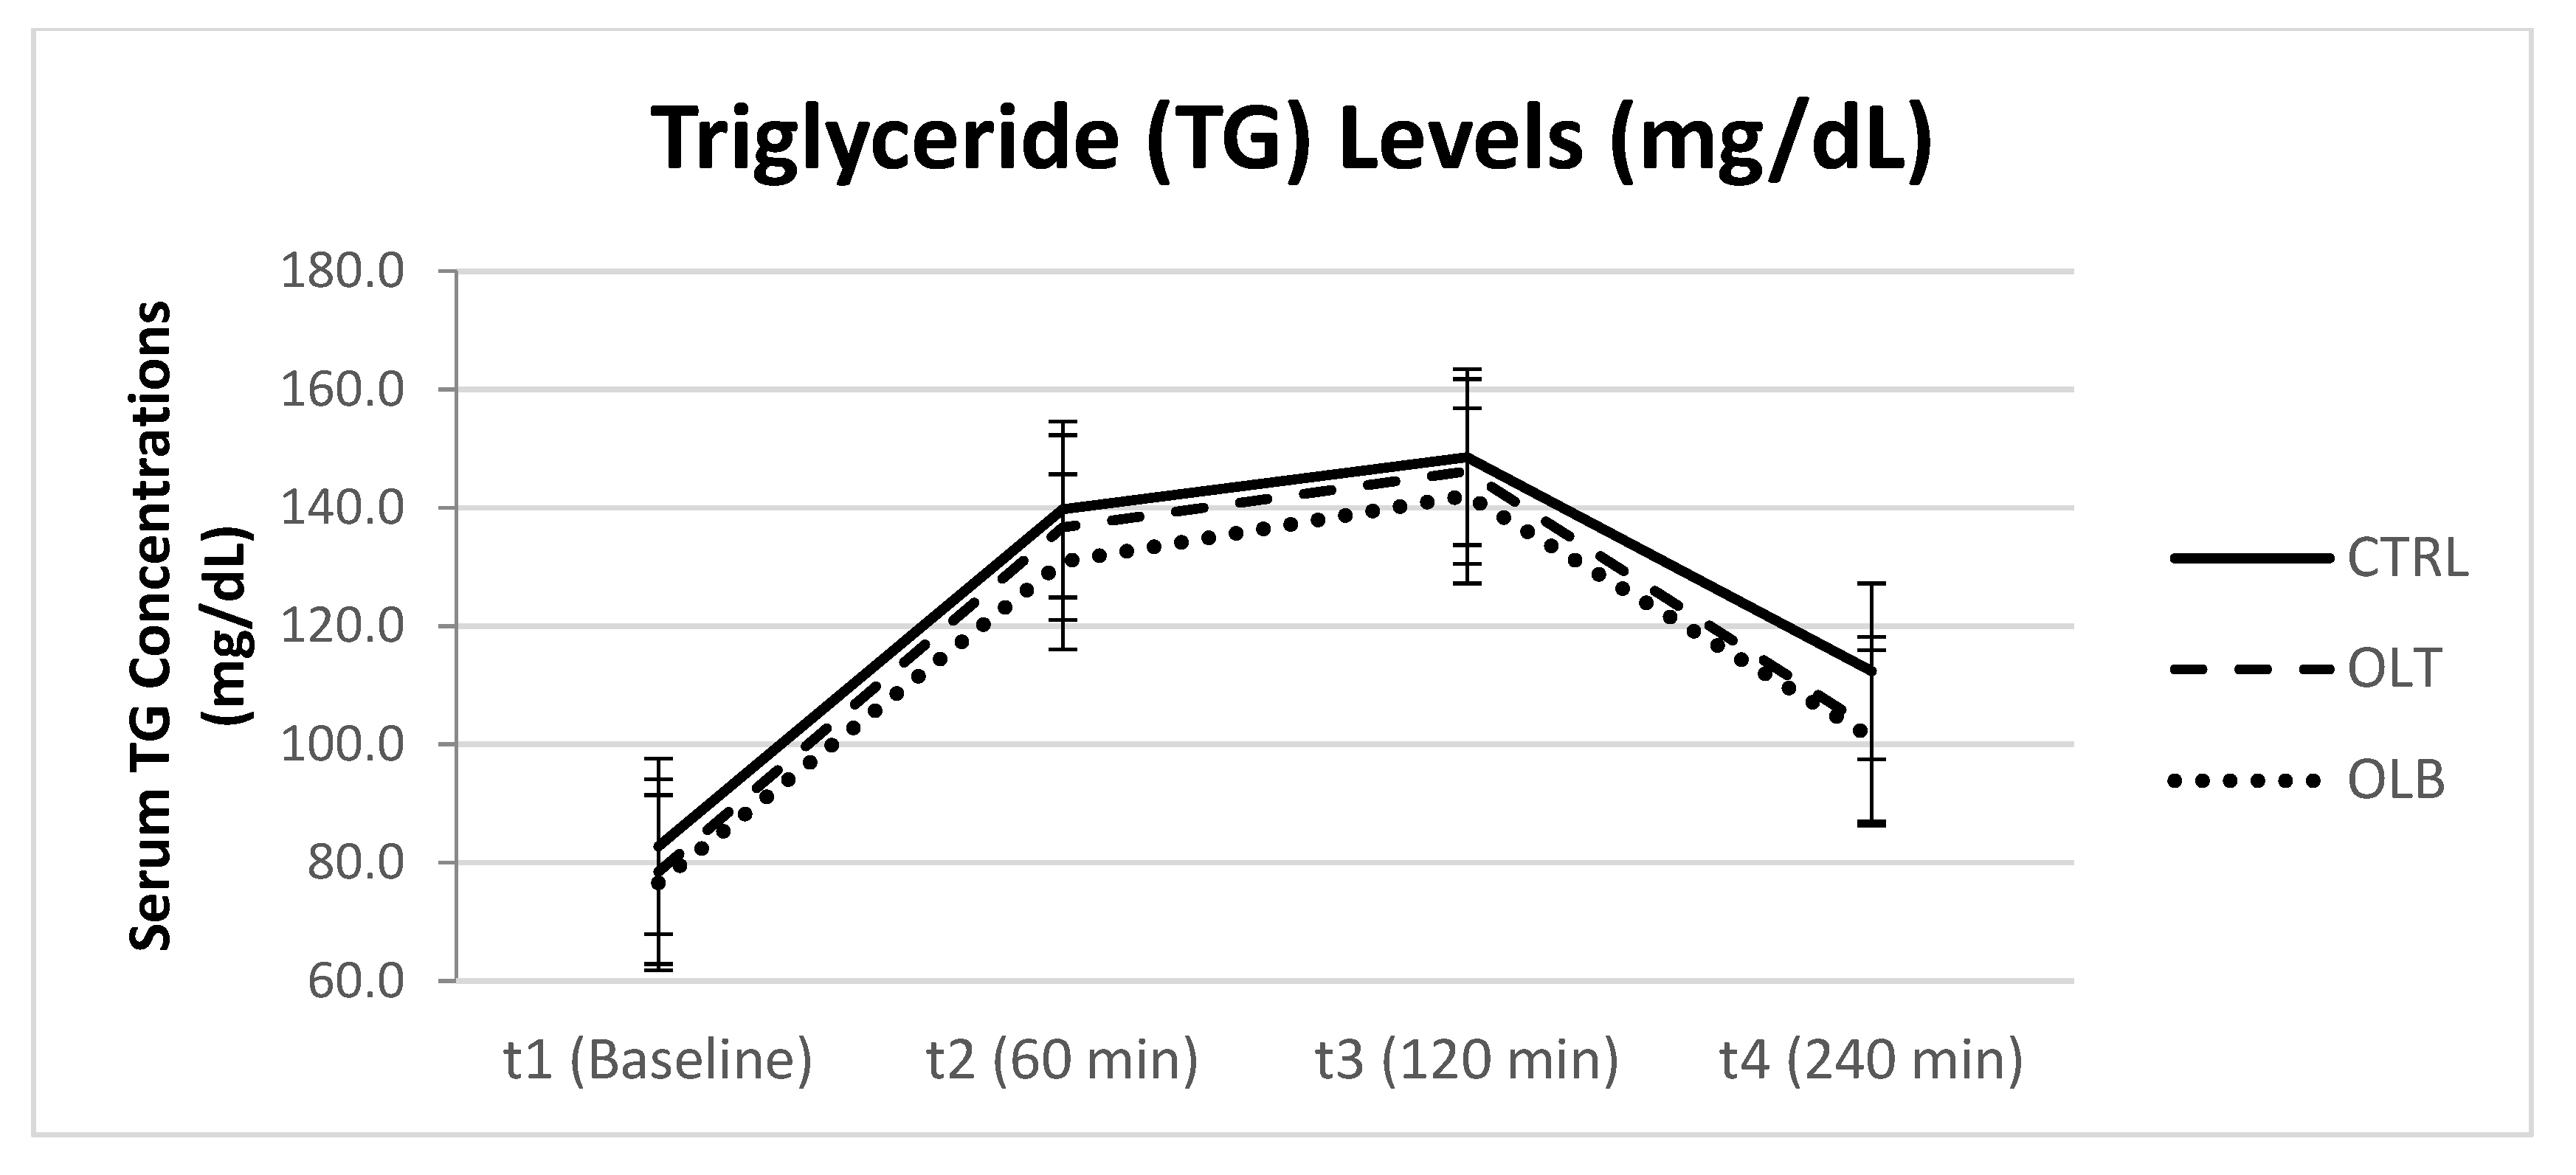
3.3.6. Triglyceride (TG) Levels

The estimated marginal means of triglyceride (TG) levels at baseline (t1), 1 h (t2), 2 h (t3), and 4 h (t4) are presented in Table 9 and Figure 7. Baseline TG concentrations were comparable among groups: CTRL (82.083 ± 8.442 mg/dL), OLT (78.000 ± 7.576 mg/dL), and OLB (75.083 ± 6.034 mg/dL).
Across all groups, TG levels increased markedly at 1 h, peaking at 2 h with CTRL reaching 147.042 ± 15.595 mg/dL, OLT 145.208 ± 16.805 mg/dL, and OLB 139.000 ± 12.866 mg/dL. By 4 h, TG levels declined but remained elevated compared to baseline, with values of 110.583 ± 13.913 mg/dL (CTRL), 102.042 ± 11.991 mg/dL (OLT), and 97.667 ± 9.833 mg/dL (OLB).
No significant group-by-time interaction was observed (p = 0.975), indicating similar temporal TG profiles across groups. The 95% confidence intervals overlapped substantially, supporting the absence of group-specific effects (e.g., t3: CTRL [114.78, 179.30], OLT [110.44, 179.97], OLB [112.39, 165.62]).
Overall, the data indicate a transient increase in TG levels peaking around 2 h post-intervention, followed by a gradual decrease toward baseline values, consistent across all study groups.

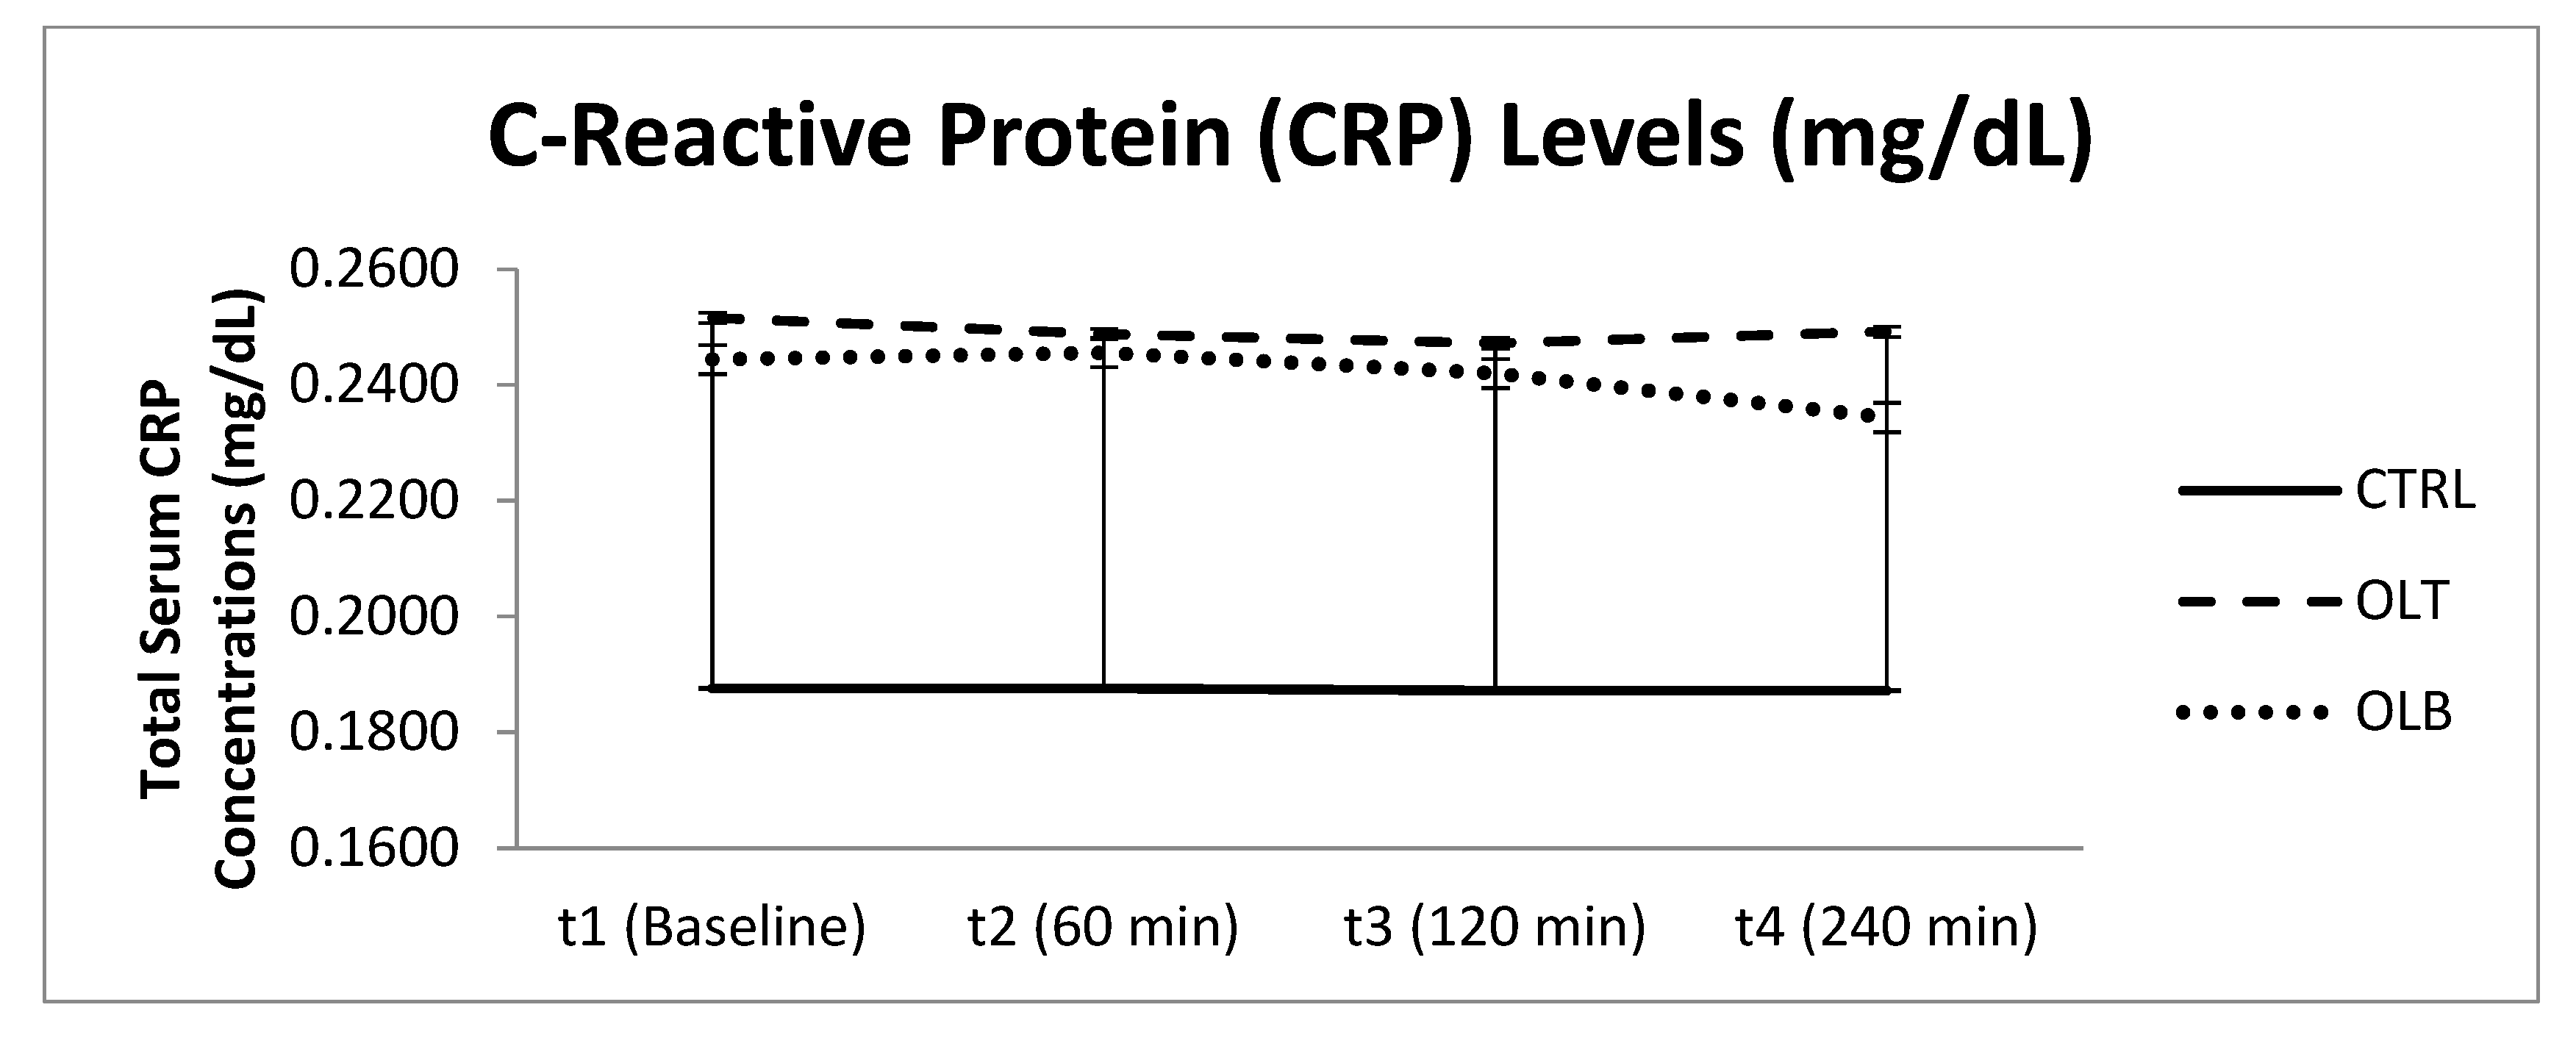
3.3.7. C-Reactive Protein (CRP) Levels

Estimated marginal means of C-reactive protein (CRP) concentrations at baseline (t1), 1 h (t2), 2 h (t3), and 4 h (t4) are presented in Table 10 and Figure 8. Baseline CRP levels were low and comparable across groups: CTRL (0.192 ± 0.045 mg/dL), OLT (0.259 ± 0.057 mg/dL), and OLB (0.250 ± 0.045 mg/dL).
CRP concentrations remained stable throughout the 4 h observation period, with minimal fluctuations within each group. For instance, in the CTRL group, CRP values varied slightly from 0.192 ± 0.045 mg/dL at baseline to 0.190 ± 0.039 mg/dL at 4 h. Similar stability was observed in the OLT and OLB groups.
No significant group-by-time interaction was found (p = 0.854), indicating no differential temporal effect among groups. The overlapping 95% confidence intervals across all time points further support the consistency of CRP levels over time (e.g., t4: CTRL [0.110, 0.270], OLT [0.142, 0.371], OLB [0.155, 0.327]).
Overall, CRP levels remained low and unchanged during the study, suggesting no acute inflammatory response related to the interventions.

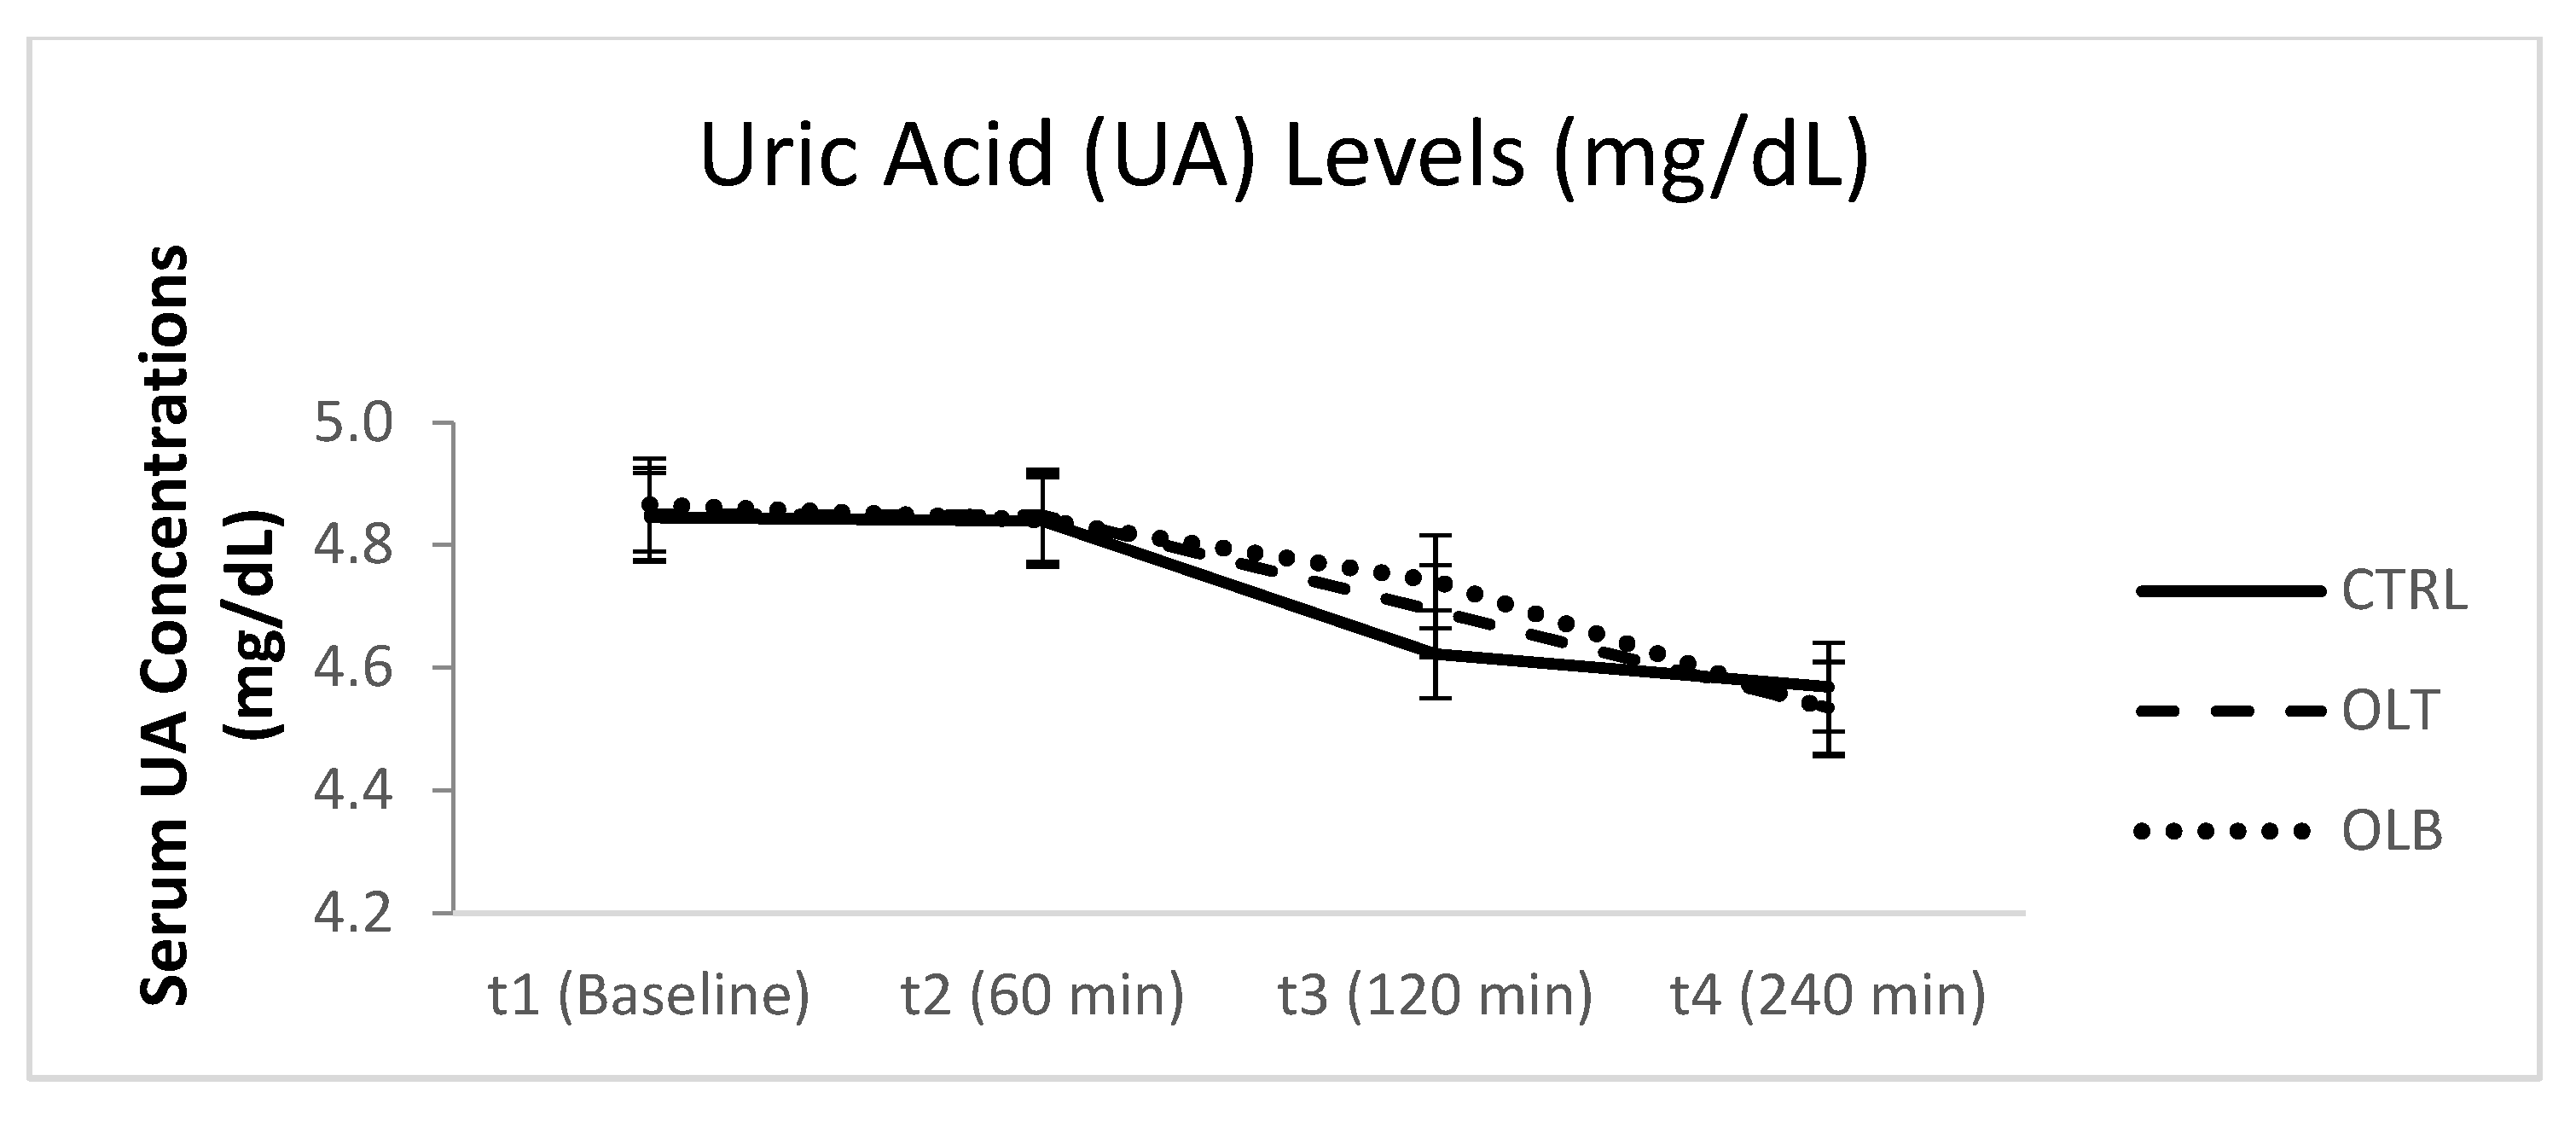
3.3.8. Uric Acid (UA) Levels

Uric acid (UA) concentrations remained relatively stable across all groups throughout the postprandial period (Table 11 and Figure 9). At baseline (t1), mean UA levels were similar between groups: 4.731 ± 0.220 mg/dL in CTRL, 4.735 ± 0.232 mg/dL in OLT, and 4.768 ± 0.225 mg/dL in OLB.
At 4 h (t4), UA levels showed slight reductions compared to baseline: 4.429 ± 0.216 mg/dL in CTRL, 4.430 ± 0.236 mg/dL in OLT, and 4.437 ± 0.224 mg/dL in OLB. However, the changes were minor and the group-by-time interaction was not statistically significant (p = 0.145). The 95% confidence intervals overlapped at all time points, indicating no differential effect of the interventions on postprandial UA concentrations.

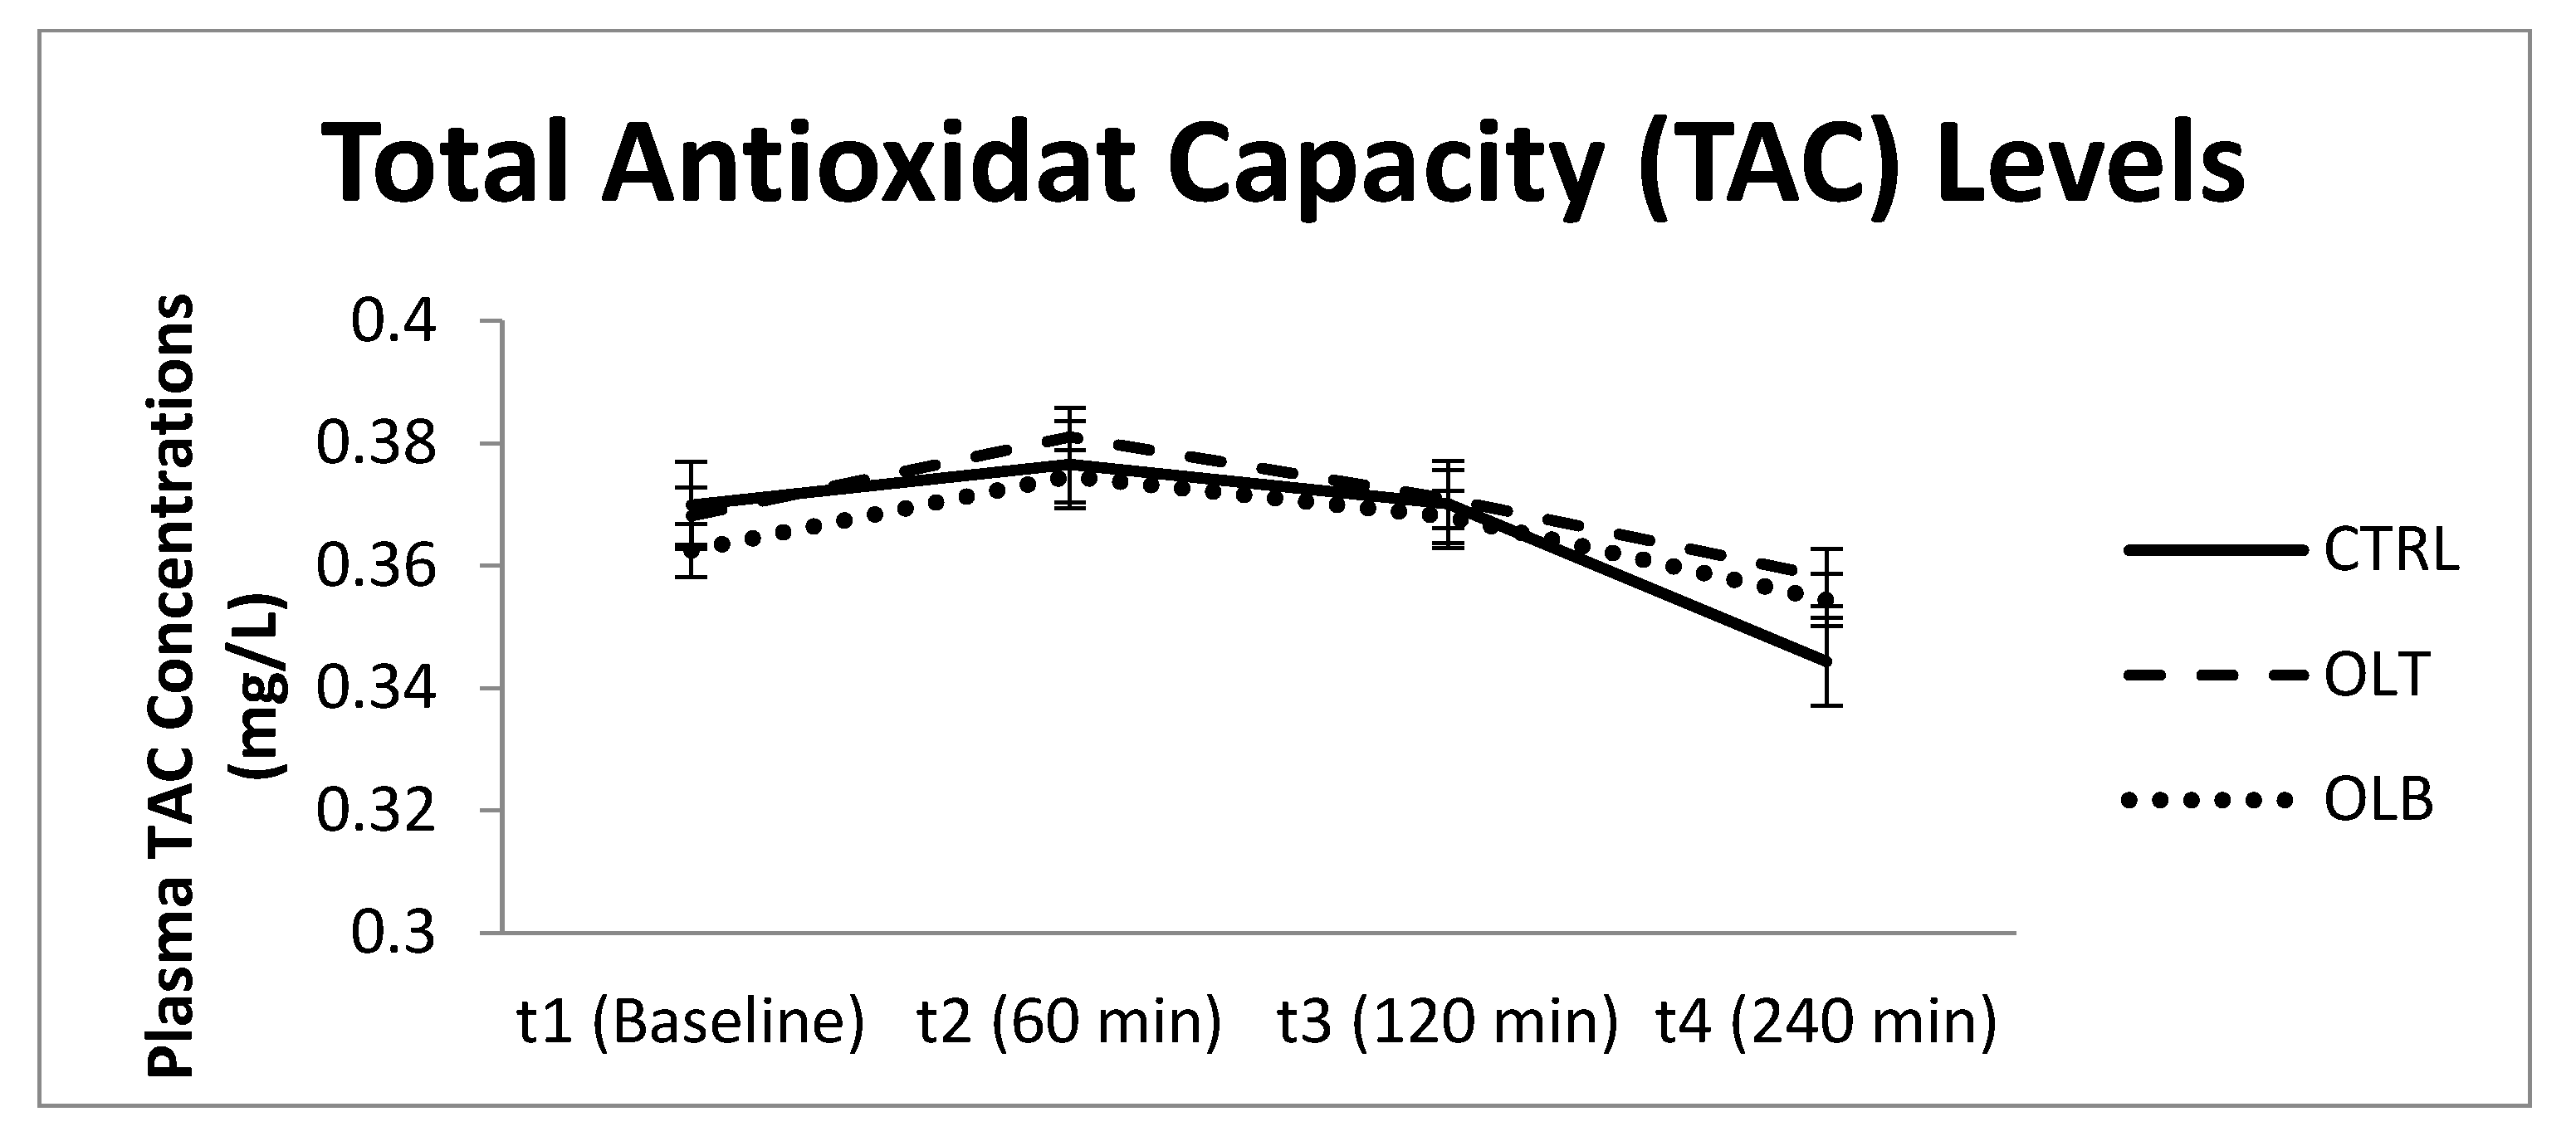
3.3.9. Total Plasma Antioxidant Capacity (TAC) Levels (mg/L)

Plasma total antioxidant capacity (TAC) levels remained relatively stable over time across all intervention groups (Table 12 and Figure 10). At baseline (t1), mean TAC values were similar: 0.370 ± 0.017 mmol/L in the CTRL group, 0.368 ± 0.015 mmol/L in the OLT group, and 0.362 ± 0.012 mmol/L in the OLB group.
Minor, non-significant fluctuations were observed over the 4 h period. In the CTRL group, TAC values ranged from 0.377 ± 0.018 mmol/L at 1 h to 0.344 ± 0.017 mmol/L at 4 h. Corresponding changes in the OLT group ranged from 0.381 ± 0.015 to 0.358 ± 0.016 mmol/L, while the OLB group ranged from 0.375 ± 0.013 to 0.354 ± 0.016 mmol/L.
No statistically significant group-by-time interaction was observed (p = 0.629), indicating that the interventions did not differentially affect antioxidant status across time. The overlap in 95% confidence intervals at all time points supports the lack of substantial temporal variation within or between groups.
These findings suggest that plasma TAC remained unaffected in the acute postprandial phase, regardless of intervention.

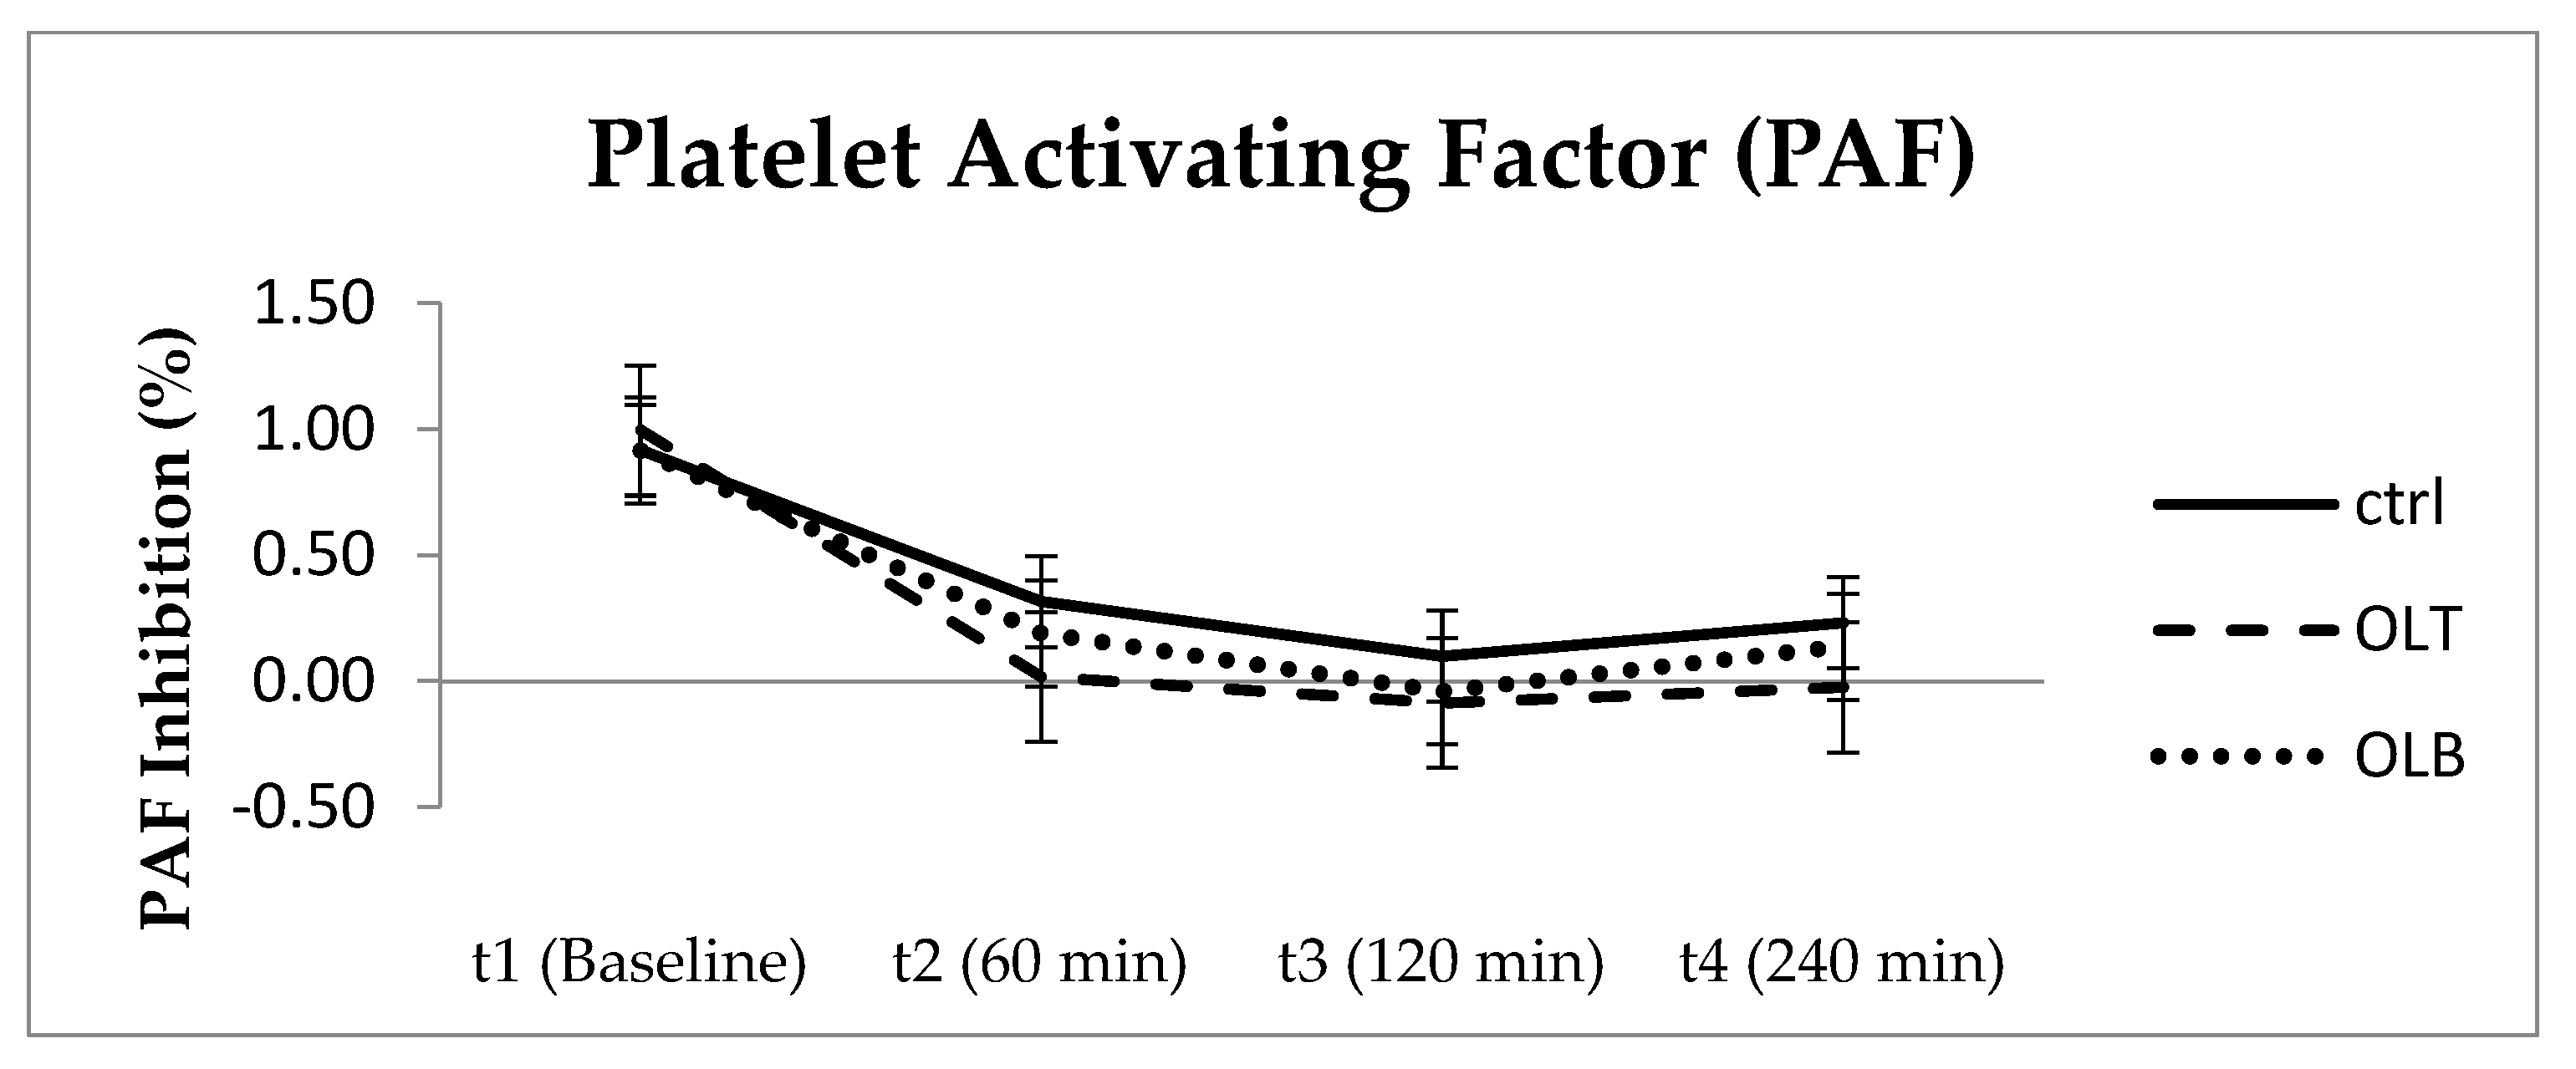
3.3.10. Platelet Aggregation Factor (PAF)

The estimated marginal means of platelet aggregation factor (PAF) across the four time points (baseline [t1], 1 h [t2], 2 h [t3], and 4 h [t4]) are summarized in Table 13 and illustrated in Figure 11. Baseline PAF levels were comparable across the three groups: CTRL (0.916 ± 0.064), OLT (0.996 ± 0.047), and OLB (0.916 ± 0.059).
Over the postprandial period, no statistically significant group-by-time interaction was observed (p = 0.713), indicating that the evolution of PAF values over time did not significantly differ between the three groups.
Specifically, in the CTRL group, PAF levels showed small positive values at t2, t3, and t4 (0.316 ± 0.288, 0.099 ± 0.124, and 0.231 ± 0.178, respectively), while the OLT and OLB groups exhibited negative or near-zero values at corresponding time points. In the OLT group, PAF levels at t3 and t4 were −0.086 ± 0.073 and −0.024 ± 0.066, respectively; similarly, in the OLB group, PAF was −0.040 ± 0.200 at t3, although a slight rebound occurred at t4 (0.138 ± 0.179).
Although not statistically significant, these negative differences showed decreased PAF levels in the OLT and OLB groups at later time points. However, the 95% confidence intervals for these changes included zero in all cases (e.g., OLT t3: [−0.238, 0.065]; OLB t3: [−0.454, 0.374]), indicating a lack of robust evidence for a true decrease.
Overall, PAF levels remained relatively stable throughout the study period, with no significant group-by-time interaction observed.

4. Discussion

The effects of olive leaf powder supplementation on postprandial biomarkers were investigated in the present study. Olive leaf extract (OLE), rich in phenolic compounds such as oleuropein, has been extensively studied for its potential health benefits [18]. Research indicates that OLE may exert beneficial effects on glucose metabolism, insulin sensitivity, and oxidative stress [19,20]. Additionally, OLE has demonstrated antihypertensive and hypocholesterolemic properties, supporting its potential role in cardiovascular health [21]. These effects are primarily attributed to its potent antioxidant and anti-inflammatory bioactive compounds, such as oleuropein and hydroxytyrosol, which contribute to the improvement of endothelial function, vascular tone, and lipid metabolism [18,21,22,23]. However, the evidence remains inconsistent, with variations in study design, dosage, and populations contributing to mixed results [23]. This study aimed to evaluate the impact of olive leaf powder supplementation in two different formats, as an aqueous infusion (Intervention A) and as an additive in a biscuit (Intervention B), on insulin, glucose, cholesterol, and other biomarkers in a controlled, randomized procedure.
Our results showed no statistically significant differences in most biomarkers tested, including insulin, glucose, cholesterol (HDL, LDL, total), triglycerides, and CRP, across the intervention groups compared to the control. This aligns with previous evidence suggested limited or inconsistent effects of olive leaf supplementation on metabolic markers [21,23]. Specifically, the effects of olive leaf extract on biomarkers such as glucose, insulin, and lipid profiles have shown variability across different trials. This may reflect variability in study designs, dosage, duration, and participant characteristics likely explains these inconsistent findings, as seen in our study.
In line with previous acute postprandial studies, Meireles et al. (2023) observed a delay in the peak time of postprandial glycemia after olive leaf tea (OLT) intake with a high-carbohydrate meal. While this study did not measure insulin, it suggests that OLT may modulate glucose responses [20]. Similarly, our study found a delayed insulin peak in both olive leaf powder interventions, with the highest insulin levels at 2 h postprandially, compared to 1 h in control.
This delayed insulin response should be interpreted cautiously, as the study did not observe statistically significant changes in insulin or glucose levels overall. It may indicate a more gradual insulin release, potentially beneficial for glycemic control by preventing rapid blood glucose fluctuations [19,24,25]. However, further studies focusing on insulin kinetics and longer intervention durations, are required to confirm this hypothesis.
While no significant changes were observed in lipid profiles or inflammatory markers, and similar findings have been reported in other trials [26], it is important to highlight that previous studies have suggested beneficial effects of OLE on lipid metabolism and inflammation [12,24,27,28]. Specifically, reductions in lipid markers such as total cholesterol, LDL cholesterol, and triglycerides, as well as decreases in pro-inflammatory cytokines like interleukin-6 and interleukin-8, following olive leaf supplementation have been previously reported [12,24,27,28]. However, only one study to date has reported a decrease in CRP levels [25], indicative of a potential anti-inflammatory effect. The lack of significant effects in our study could be due to factors such as the specific dosage, intervention duration, or participant characteristics, which may differ from those in other trials. These findings underscore the need for further research to elucidate the impact of OLE on lipid and inflammatory profiles.
Regarding the platelet-activating factor (PAF), our results indicated a postprandial decrease in PAF concentrations across all intervention groups, with no significant differences observed between the control (CTRL) group and the olive leaf supplementation groups (OLT and OLB). Notably, the CTRL and OLB groups exhibited larger standard errors compared to the OLT group, suggesting greater variability in PAF responses. This variability might reflect differences in the metabolic processing of the ingested meals, potentially influenced by the bioavailability and matrix of olive leaf polyphenols. The observed reduction in PAF after meal consumption aligns with its known role in inflammation and platelet aggregation, where a decrease may indicate a transient modulation of pro-thrombotic activity in the postprandial state in healthy individuals [29]. However, the considerable variability and lack of significant group-by-time interactions highlight the need for further investigation. Future studies should explore the mechanistic pathways through which olive leaf bioactives influence platelet function and PAF metabolism. Investigations in larger and more targeted populations—particularly individuals with cardiovascular risk factors or metabolic disorders—may help reduce variability and better elucidate these effects, as such groups often exhibit altered inflammatory and thrombotic profiles.
Standardized and well-controlled procedures are essential to ensure the consistency of olive leaf supplementation. Specifically, the establishment of the optimal and consistent dosage of olive leaf powder in clinical trials to reduce variability in results and enhance the reliability of results is crucial [21,30,31]. This could involve careful calibration of the dosage based on bioavailability studies and alignment with the most effective therapeutic doses identified in preliminary trials. Such standardization will help to accurately assess the efficacy of olive leaf supplementation in regulating metabolic biomarkers, it will also enable easier comparisons across studies.
Despite the valuable contribution of this study in understanding the effects of olive leaf powder on postprandial metabolic regulation, several limitations must be considered. Firstly, while the cross-over design allowed each participant to serve as their control, minimizing between-subject variability, the use of two different intervention formats, olive leaf powder incorporated into biscuits and in tea form, could have introduced variability in participant responses due to factors such as bioavailability of the active compounds and digestion rate influenced by meal composition. Additionally, the relatively short duration of the intervention period may not have been long enough to observe significant changes in biomarkers such as lipid profiles or inflammatory markers, which often require longer periods of supplementation to manifest. Furthermore, the homogeneity of the study cohort—composed solely of metabolically healthy volunteers from a single geographic location—while enhancing internal validity and reduces potential confounding factors, may restrict the generalizability of the results to broader populations, particularly those with underlying metabolic or inflammatory conditions. Moreover, the final sample size was smaller than initially anticipated and calculated during the study design phase, which may have impacted on the statistical power and robustness of the findings. The study also lacked a more precise standardization in the preparation process of the olive leaf powder, although all participants received the same dosage of 1.25 g, which was derived from a well-mixed batch of 200 g of olive leaves collected from different trees. Despite the careful mixing, slight variations in the chemical composition of the leaves from different trees could theoretically influence the consistency of the bioactive compounds, potentially affecting the observed outcomes.
Finally, the possible role of olive leaf bioactives in modulating insulin sensitivity, inflammatory cytokine production (e.g., interleukins), and oxidative stress pathways warrants further mechanistic investigation. Bioactive compounds such as oleuropein and hydroxytyrosol may exert differential effects depending on dosage, formulation, and timing of intake, which could partly explain the heterogeneity in findings across existing studies. Inter-individual variability in metabolic responses further highlights the need for personalized approaches in future research. To advance understanding and improve reproducibility, upcoming trials should prioritize standardized intervention formats, extended supplementation periods, and diverse participant cohorts. Well-designed protocols with consistent dosing will be critical for accurately evaluating the therapeutic potential of olive leaf supplementation in metabolic and inflammatory regulation.

5. Conclusions

This study contributes to the growing body of evidence examining the role of olive leaf supplementation in metabolic health, particularly focusing on postprandial responses in healthy adults. Our findings indicate a delayed insulin response following olive leaf intake, which may reflect more gradual insulin release beneficial for glycemic control. However, no significant changes were observed in glucose, lipid profiles, or platelet-activating factor levels between intervention and control groups within the acute study timeframe. The crossover design minimized inter-individual variability, yet some intra-individual variability in metabolic responses was evident, highlighting the complexity of postprandial regulation. The relatively small final sample size, along with the inclusion of metabolically healthy volunteers from a single geographic area, may limit the statistical power and generalizability of the results. Future studies should aim to include larger and more heterogeneous populations, extend intervention duration, and incorporate comprehensive biomarker analysis—including metabolomic and inflammatory profiling—to better characterize the mechanistic effects of olive leaf bioactives. Additionally, investigations involving individuals with metabolic risk factors may provide further insight into the therapeutic potential of olive leaf supplementation.

Author Contributions

Conceptualization, P.P. and A.E.K.; Data Curation, O.I.P., C.K. and V.B.; Formal Analysis, A.V.; Funding Acquisition, A.E.K.; Investigation, P.P., O.I.P., K.A., C.S., A.V., O.K. and C.K.; Methodology, P.P., O.I.P., K.A., C.S., A.V., O.K., V.B. and C.K.; Project Administration, A.E.K.; Resources, P.P., O.I.P., K.A., C.S., A.V., O.K. and C.K.; Software, P.P., K.A., C.S., V.B. and C.K.; Supervision, A.E.K.; Validation, P.P., O.I.P., V.B., C.K. and A.E.K.; Visualization, O.I.P. and A.E.K.; Writing—original draft, P.P.; Writing—review and editing, O.I.P. and A.E.K. All authors have read and agreed to the published version of the manuscript.

Funding

This work was supported by the Rural Development Program (RDP) 2014–2020 within the framework of Action 2 of Sub-measure 16.1–16.2 “Establishment and operation of Operational Groups of the European Innovation Partnership for the productivity and sustainability of agriculture”, with code M16SYN2-00375.

Institutional Review Board Statement

The study was conducted according to the guidelines of the Declaration of Helsinki and approved by the Ethics Committee of University of the Aegean (ID: 9069/27.02.2025).

Informed Consent Statement

All the participants provided informed consent prior to their involvement in this study. Consent has also been obtained from the volunteers for the publication of this paper.

Data Availability Statement

The data presented in this study are available upon request from the corresponding author.

Acknowledgments

The authors extend their gratitude to all individuals who participated in this study.

Conflicts of Interest

The authors declare no conflicts of interest.

References

  1. Vaduganathan, M.; Mensah, G.A.; Turco, J.V.; Fuster, V.; Roth, G.A. The Global Burden of Cardiovascular Diseases and Risk. J. Am. Coll. Cardiol. 2022, 80, 2361–2371. [Google Scholar] [CrossRef] [PubMed]
  2. Hiyoshi, T.; Fujiwara, M.; Yao, Z. Postprandial hyperglycemia and postprandial hypertriglyceridemia in type 2 diabetes. J. Biomed. Res. 2019, 33, 1–16. [Google Scholar] [CrossRef]
  3. Hanssen, N.M.J.; Kraakman, M.J.; Flynn, M.C.; Nagareddy, P.R.; Schalkwijk, C.G.; Murphy, A.J. Postprandial Glucose Spikes, an Important Contributor to Cardiovascular Disease in Diabetes? Front. Cardiovasc. Med. 2020, 7, 570553. [Google Scholar] [CrossRef]
  4. Sasso, E.; Baticic, L.; Sotosek, V. Postprandial Dysmetabolism and Its Medical Implications. Life 2023, 13, 2317. [Google Scholar] [CrossRef]
  5. Reddy, K.S.; Katan, M.B. Diet, nutrition and the prevention of hypertension and cardiovascular diseases. Public Health Nutr. 2004, 7, 167–186. [Google Scholar] [CrossRef] [PubMed]
  6. Mazur, M.; Przytuła, A.; Szymańska, M.; Popiołek-Kalisz, J. Dietary strategies for cardiovascular disease risk factors prevention. Curr. Probl. Cardiol. 2024, 49, 102746. [Google Scholar] [CrossRef] [PubMed]
  7. Chareonrungrueangchai, K.; Wongkawinwoot, K.; Anothaisintawee, T.; Reutrakul, S. Dietary Factors and Risks of Cardiovascular Diseases: An Umbrella Review. Nutrients 2020, 12, 1088. [Google Scholar] [CrossRef]
  8. Yamagata, K.; Tagami, M.; Yamori, Y. Dietary polyphenols regulate endothelial function and prevent cardiovascular disease. Nutrition 2015, 31, 28–37. [Google Scholar] [CrossRef]
  9. Burton-Freeman, B. Postprandial metabolic events and fruit-derived phenolics: A review of the science. Br. J. Nutr. 2010, 104, S1–S14. [Google Scholar] [CrossRef]
  10. Karantonis, H.C.; Fragopoulou, E.; Antonopoulou, S.; Rementzis, J.; Phenekos, C.; Demopoulos, C.A. Effect of fast-food Mediterranean-type diet on type 2 diabetics and healthy human subjects’ platelet aggregation. Diabetes Res. Clin. Pract. 2006, 72, 33–41. [Google Scholar] [CrossRef]
  11. Singh, I.; Mok, M.; Christensen, A.-M.; Turner, A.H.; Hawley, J.A. The effects of polyphenols in olive leaves on platelet function. Nutr. Metab. Cardiovasc. Dis. 2008, 18, 127–132. [Google Scholar] [CrossRef]
  12. Lockyer, S.; Rowland, I.; Spencer, J.P.E.; Yaqoob, P.; Stonehouse, W. Impact of phenolic-rich olive leaf extract on blood pressure, plasma lipids and inflammatory markers: A randomised controlled trial. Eur. J. Nutr. 2017, 56, 1421–1432. [Google Scholar] [CrossRef] [PubMed]
  13. De Bock, M.; Thorstensen, E.B.; Derraik, J.G.B.; Henderson, H.V.; Hofman, P.L.; Cutfield, W.S. Human absorption and metabolism of oleuropein and hydroxytyrosol ingested as olive (Olea europaea L.) leaf extract. Mol. Nutr. Food Res. 2013, 57, 2079–2085. [Google Scholar] [CrossRef] [PubMed]
  14. D’Angelo, C.; Franceschelli, S.; Quiles, J.L.; Speranza, L. Wide Biological Role of Hydroxytyrosol: Possible Therapeutic and Preventive Properties in Cardiovascular Diseases. Cells 2020, 9, 1932. [Google Scholar] [CrossRef]
  15. O’Keefe, J.H.; Bell, D.S.H. Postprandial Hyperglycemia/Hyperlipidemia (Postprandial Dysmetabolism) Is a Cardiovascular Risk Factor. Am. J. Cardiol. 2007, 100, 899–904. [Google Scholar] [CrossRef] [PubMed]
  16. Benzie, I.F.F.; Strain, J.J. The Ferric Reducing Ability of Plasma (FRAP) as a Measure of “Antioxidant Power”: The FRAP Assay. Anal. Biochem. 1996, 239, 70–76. [Google Scholar] [CrossRef]
  17. United States Department of Agriculture, Agricultural Research Service FoodData Central. Available online: https://fdc.nal.usda.gov (accessed on 10 May 2025).
  18. El, S.N.; Karakaya, S. Olive tree (Olea europaea) leaves: Potential beneficial effects on human health. Nutr. Rev. 2009, 67, 632–638. [Google Scholar] [CrossRef]
  19. De Bock, M.; Derraik, J.G.B.; Brennan, C.M.; Biggs, J.B.; Morgan, P.E.; Hodgkinson, S.C.; Hofman, P.L.; Cutfield, W.S. Olive (Olea europaea L.) Leaf Polyphenols Improve Insulin Sensitivity in Middle-Aged Overweight Men: A Randomized, Placebo-Controlled, Crossover Trial. PLoS ONE 2013, 8, e57622. [Google Scholar] [CrossRef]
  20. Meireles, M.; Cortez-Ribeiro, A.; Polck, D.; Almeida-de-Souza, J.; Ferro-Lebres, V. Olive Leaf Tea Impact on Postprandial Glycemia: A Randomized Cross-Over Trial. Foods 2023, 12, 528. [Google Scholar] [CrossRef]
  21. Razmpoosh, E.; Abdollahi, S.; Mousavirad, M.; Clark, C.C.T.; Soltani, S. The effects of olive leaf extract on cardiovascular risk factors in the general adult population: A systematic review and meta-analysis of randomized controlled trials. Diabetol. Metab. Syndr. 2022, 14, 151. [Google Scholar] [CrossRef]
  22. González-Hedström, D.; García-Villalón, Á.L.; Amor, S.; De La Fuente-Fernández, M.; Almodóvar, P.; Prodanov, M.; Priego, T.; Martín, A.I.; Inarejos-García, A.M.; Granado, M. Olive leaf extract supplementation improves the vascular and metabolic alterations associated with aging in Wistar rats. Sci. Rep. 2021, 11, 8188. [Google Scholar] [CrossRef] [PubMed]
  23. Ismail, M.A.; Norhayati, M.N.; Mohamad, N. Olive leaf extract effect on cardiometabolic profile among adults with prehypertension and hypertension: A systematic review and meta-analysis. PeerJ 2021, 9, e11173. [Google Scholar] [CrossRef]
  24. Álvares, A.A.; Garcêz, A.; Silva, L.T.; Averbuch, N.; Garavaglia, J. Olive leaf extract effect on cardiometabolic risk factors: A systematic review and meta-analysis of randomized clinical trials. Nutr. Rev. 2024, 82, 1710–1725. [Google Scholar] [CrossRef]
  25. Ahmadpour, E.; Toulabi, T.; Yadegarinia, D.; Yarahmadi, S.; Mohammadi, R.; Keyvanfar, A. Efficacy of olive leaves extract on the outcomes of hospitalized covid-19 patients: A randomized, triple-blinded clinical trial. Explor. 2023, 19, 536–543. [Google Scholar] [CrossRef] [PubMed]
  26. Stevens, Y.; Winkens, B.; Jonkers, D.; Masclee, A. The effect of olive leaf extract on cardiovascular health markers: A randomized placebo-controlled clinical trial. Eur. J. Nutr. 2021, 60, 2111–2120. [Google Scholar] [CrossRef] [PubMed]
  27. Araki, R.; Fujie, K.; Yuine, N.; Watabe, Y.; Nakata, Y.; Suzuki, H.; Isoda, H.; Hashimoto, K. Olive leaf tea is beneficial for lipid metabolism in adults with prediabetes: An exploratory randomized controlled trial. Nutr. Res. 2019, 67, 60–66. [Google Scholar] [CrossRef]
  28. Frumuzachi, O.; Gavrilaș, L.I.; Vodnar, D.C.; Rohn, S.; Mocan, A. Systemic Health Effects of Oleuropein and Hydroxytyrosol Supplementation: A Systematic Review of Randomized Controlled Trials. Antioxidants 2024, 13, 1040. [Google Scholar] [CrossRef]
  29. Ahuja, K.D.K.; Thomas, G.A.; Adams, M.J.; Ball, M.J. Postprandial platelet aggregation: Effects of different meals and glycemic index. Eur. J. Clin. Nutr. 2012, 66, 722–726. [Google Scholar] [CrossRef]
  30. Silvan, J.M.; Guerrero-Hurtado, E.; Gutiérrez-Docio, A.; Alarcón-Cavero, T.; Prodanov, M.; Martinez-Rodriguez, A.J. Olive-Leaf Extracts Modulate Inflammation and Oxidative Stress Associated with Human, H. pylori Infection. Antioxidants 2021, 10, 2030. [Google Scholar] [CrossRef]
  31. Munteanu, C.; Kotova, P.; Schwartz, B. Impact of Olive Oil Components on the Expression of Genes Related to Type 2 Diabetes Mellitus. Nutrients 2025, 17, 570. [Google Scholar] [CrossRef]
Figure 1. CONSORT schematic of participant recruitment, screening, assessment, and analysis.
Applsci 15 07857 g001
Figure 2. Postprandial insulin concentrations (Mean ± SE) over time (baseline, 1 h, 2 h, 4 h) in control (CTRL), olive leaf tea (OLT), and olive leaf biscuit (OLB) groups.
Applsci 15 07857 g002
Figure 3. Postprandial glucose concentrations (Mean ± SE) over time (Baseline, 1 h, 2 h, 4 h) in control (CTRL), olive leaf tea (OLT), and olive leaf biscuit (OLB) groups.
Applsci 15 07857 g003
Figure 4. Postprandial total cholesterol concentrations (Mean ± SE) over time (baseline, 1 h, 2 h, 4 h) in control (CTRL), olive leaf tea (OLT), and olive leaf biscuit (OLB) groups.
Applsci 15 07857 g004
Figure 5. Postprandial high-density lipoprotein concentrations (Mean ± SE) over time (baseline, 1 h, 2 h, 4 h) in control (CTRL), olive leaf tea (OLT), and olive leaf biscuit (OLB) groups.
Applsci 15 07857 g005
Figure 6. Postprandial low-density lipoprotein concentrations (Mean ± SE) over time (baseline, 1 h, 2 h, 4 h) in control (CTRL), olive leaf tea (OLT), and olive leaf biscuit (OLB) groups.
Applsci 15 07857 g006
Figure 7. Postprandial triglyceride concentrations (Mean ± SE) over time (baseline, 1 h, 2 h, 4 h) in control (CTRL), olive leaf tea (OLT), and olive leaf biscuit (OLB) groups.
Applsci 15 07857 g007
Figure 8. Postprandial CRP concentrations (Mean ± SE) over time (baseline, 1 h, 2 h, 4 h) in control (CTRL), olive leaf tea (OLT), and olive leaf biscuit (OLB) groups.
Applsci 15 07857 g008
Figure 9. Postprandial UA concentrations (Mean ± SE) over time (baseline, 1 h, 2 h, 4 h) in control (CTRL), olive leaf tea (OLT), and olive leaf biscuit (OLB) groups.
Applsci 15 07857 g009
Figure 10. Postprandial TAC concentrations (Mean ± SE) over time (Baseline, 1 h, 2 h, 4 h) in control (CTRL), olive leaf tea (OLT), and olive leaf biscuit (OLB) groups.
Applsci 15 07857 g010
Figure 11. Postprandial PAF Inhibition (Mean ± SE) over time (baseline, 1 h, 2 h, 4 h) in control (CTRL), olive leaf tea (OLT), and olive leaf biscuit (OLB) groups.
Applsci 15 07857 g011
Table 1. Total energy and macronutrient composition of meals.
MealEnergy (kcal)Total Carbohydrates (g)Dietary Fiber (g)Protein (g)Lipids (g)
CTRL652.8378.052.288.1034.53
OLT652.8378.052.288.1034.53
OLB652.8378.052.288.1034.53
CTRL: Control meal without olive leaf supplementation. OLT: Meal supplemented with olive leaf tea. OLB: Meal supplemented with olive leaf-enriched biscuit. Energy values are expressed in kilocalories (kcal), and macronutrient amounts in grams (g).
Table 2. Sensory evaluation results for olive leaf tea samples (0.5% and 1%) based on color, aroma, taste, aftertaste, and overall liking scores.
Attribute0.5% Concentration1% Concentration
Taste7.11 ± 1.33 a6.13 ± 1.61 b
Aroma6.87 ± 1.59 a6.37 ± 1.56 a
Aftertaste7.32 ± 1.45 a5.97 ± 1.63 b
Color5.55 ± 1.75 a6.66 ± 1.16 b
Overall Liking7.53 ± 1.48 a6.24 ± 1.86 b
Values are presented as mean scores ± standard deviation. Different superscript letters (a, b) indicate significant differences between the 0.5% and 1% olive leaf tea samples (p < 0.05) based on sensory evaluation.
Table 3. General characteristics of participants at baseline.
General CharacteristicsN
Participants (total)24
Men11
Women13
Mean ± SD
Age (years)31.23 ± 9.8
Anthropometric characteristicsMean ± SD
Weight (kg)73.48 ± 19.24
Height (cm)171.24 ± 9.45
BMI (kg/m2)24.71 ± 4.76
FAT (%)25.59 ± 6.08
Muscle Mass (kg)51.43 ± 12.28
TBW (%)51.86 ± 3.69
BM (kcal/day)1633.29 ± 368.37
WHR0.80 ± 0.09
General habitsN
Smoking
Smokers9
Non-smokers15
Physical activity
Low14
Medium6
High4
Data are presented as mean ± standard deviation (SD) for continuous variables and as counts (N) for categorical variables. Abbreviations: BMI, body mass index; FAT, body fat percentage; TBW, total body water; BM, basal metabolism; WHR, waist-to-hip-ratio.
Table 4. Postprandial changes in serum insulin levels.
INS
(Mean ± SE) at Baseline (t1)
INS
(Mean ± SE) at 1 h (t2)
INS
(Mean ± SE) at 2 h (t3)
INS
(Mean ± SE) at 4 h (t4)
95% Confidence Intervalp Value
(Group × Time)
TimeLower BoundUpper Bound
CTRL11.570 ± 1.08431.250 ± 3.31125.353 ± 3.9369.654 ± 0.907t1
t2
t3
t4
9.328
24.401
17.211
7.778
13.812
38.099
33.495
11.530
p = 0.054
OLT10.387 ± 0.64224.614 ± 2.41831.513 ± 3.3839.840 ± 0.879t1
t2
t3
t4
9.058
19.612
24.515
8.020
11.715
29.616
38.510
11.659
OLB10.158 ± 0.75726.607 ± 3.35629.773 ± 4.47111.330 ± 1.529t1
t2
t3
t4
8.593
19.665
20.524
8.167
11.724
33.550
39.021
14.493
Values are presented as mean ± standard error (SE). INS: serum insulin concentration (μIU/mL). t1: baseline, t2: 1 h, t3: 2 h, t4: 4 h postprandially. CTRL: Control meal without olive leaf supplementation. OLT: Meal supplemented with olive leaf tea. OLB: Meal supplemented with olive leaf-enriched biscuit. Statistical analysis was performed using repeated measures (ANOVA) to assess the interaction effect (group × time).
Table 5. Postprandial changes in serum glucose levels.
GLU
(Mean ± SE) at Baseline (t1)
GLU
(Mean ± SE) at 1 h (t2)
GLU
(Mean ± SE) at 2 h (t3)
GLU
(Mean ± SE) at 4 h (t4)
95% Confidence Intervalp Value
(Group × Time)
TimeLower BoundUpper Bound
CTRL98.125 ± 1.28286.458 ± 3.07485.958 ± 2.95888.167 ± 1.890t1
t2
t3
t4
95.474
80.099
79.840
84.257
100.78
92.817
92.077
92.076
p = 0.546
OLT97.833 ± 1.33387.208 ± 3.75386.875 ± 2.44588.667 ± 1.538t1
t2
t3
t4
95.075
79.444
81.817
85.486
100.60
94.973
91.933
91.848
OLB97.167 ± 1.43482.833 ± 2.98388.500 ± 3.05889.042 ± 1.993t1
t2
t3
t4
94.200
76.662
82.174
84.918
100.13
89.005
94.826
93.165
Values are presented as mean ± standard error (SE). GLU: serum glucose concentration (mg/dL). t1: baseline, t2: 1 h, t3: 2 h, t4: 4 h postprandially. CTRL: Control meal without olive leaf supplementation. OLT: Meal supplemented with olive leaf tea. OLB: Meal supplemented with olive leaf-enriched biscuit. Statistical analysis was performed using repeated measures (ANOVA) to assess the interaction effect (group × time).
Table 6. Postprandial changes in serum total cholesterol (TC) levels.
TC
(Mean ± SE) at Baseline (t1)
TC
(Mean ± SE) at 1 h (t2)
TC
(Mean ± SE) at 2 h (t3)
TC
(Mean ± SE) at 4 h (t4)
95% Confidence Intervalp Value
(Group × Time)
TimeLower BoundUpper Bound
CTRL169.208 ± 6.623176.375 ± 8.189172.167 ± 7.679178.667 ± 7.829t1
t2
t3
t4
155.51
159.44
156.28
162.47
182.91
193.32
188.05
194.86
p = 0.755
OLT173.333 ± 8.247182.458 ± 8.801178.125 ± 9.249180.333 ± 8.579t1
t2
t3
t4
156.27
164.25
158.99
162.59
190.39
200.67
197.26
198.08
OLB167.042 ± 7.377171.375 ± 6.167171.083 ± 6.895172.458 ± 6.201t1
t2
t3
t4
151.78
158.61
156.82
159.63
182.30
184.13
185.35
185.29
Values are presented as mean ± standard error (SE). TC: serum total cholesterol concentration (mg/dL). t1: baseline, t2: 1 h, t3: 2 h, t4: 4 h postprandially. CTRL: Control meal without olive leaf supplementation. OLT: Meal supplemented with olive leaf tea. OLB: Meal supplemented with olive leaf-enriched biscuit. Statistical analysis was performed using repeated measures (ANOVA) to assess the interaction effect (group × time).
Table 7. Postprandial changes in serum HDL-C levels.
HDL-C
(Mean ± SE) at Baseline (t1)
HDL-C
(Mean ± SE) at 1 h (t2)
HDL-C
(Mean ± SE) at 2 h (t3)
HDL-C
(Mean ± SE) at 4 h (t4)
95% Confidence Intervalp Value
(Group × Time)
TimeLower BoundUpper Bound
CTRL67.875 ± 3.46467.458 ± 3.48265.625 ± 3.49168.375 ± 3.487t1
t2
t3
t4
60.709
60.255
58.404
61.162
72.428
74.662
72.846
75.588
p = 0.637
OLT66.208 ± 3.43666.292 ± 3.50964.458 ± 3.43866.542 ± 3.340t1
t2
t3
t4
59.100
59.034
57.346
59.632
73.317
73.550
71.571
73.451
OLB66.792 ± 2.72566.583 ± 2.95764.417 ± 2.86665.750 ± 2.891t1
t2
t3
t4
60.155
60.466
58.488
59.770
72.428
72.701
70.345
71.730
Values are presented as mean ± standard error (SE). HDL-C: serum high-density lipoprotein cholesterol concentration (mg/dL). t1: baseline, t2: 1 h, t3: 2 h, t4: 4 h postprandially. CTRL: Control meal without olive leaf supplementation. OLT: Meal supplemented with olive leaf tea. OLB: Meal supplemented with olive leaf-enriched biscuit. Statistical analysis was performed using repeated measures (ANOVA) to assess the interaction effect (group × time).
Table 8. Postprandial changes in serum LDL-C levels.
LDL-C
(Mean ± SE) at Baseline (t1)
LDL-C
(Mean ± SE) at 1 h (t2)
LDL-C
(Mean ± SE) at 2 h (t3)
LDL-C
(Mean ± SE) at 4 h (t4)
95% Confidence Intervalp Value
(Group × Time)
TimeLower BoundUpper Bound
CTRL93.463 ± 5.56689.662 ± 5.96091.787 ± 5.81695.152 ± 5.482t1
t2
t3
t4
81.949
77.333
79.755
83.812
104.74
101.99
103.82
106.49
p = 0.325
OLT95.379 ± 5.36092.216 ± 5.69691.583 ± 4.88094.414 ± 5.093t1
t2
t3
t4
84.290
80.434
81.487
83.879
106.47
104.00
101.68
104.95
OLB94.458 ± 4.97391.805 ± 5.14795.540 ± 5.09696.782 ± 5.107t1
t2
t3
t4
84.171
81.157
84.999
86.218
104.74
102.45
106.08
107.35
Values are presented as mean ± standard error (SE). LDL-C: serum low-density lipoprotein cholesterol concentration (mg/dL). t1: baseline, t2: 1 h, t3: 2 h, t4: 4 h postprandially. CTRL: Control meal without olive leaf supplementation. OLT: Meal supplemented with olive leaf tea. OLB: Meal supplemented with olive leaf-enriched biscuit. Statistical analysis was performed using repeated measures (ANOVA) to assess the interaction effect (group × time).
Table 9. Postprandial changes in triglyceride (TG) levels.
TG
(Mean ± SE) at Baseline (t1)
TG
(Mean ± SE) at 1 h (t2)
TG
(Mean ± SE) at 2 h (t3)
TG
(Mean ± SE) at 4 h (t4)
95% Confidence Intervalp Value
(Group × Time)
TimeLower BoundUpper Bound
CTRL82.083 ± 8.442139.197 ± 10.365147.042 ± 15.595110.583 ± 13.913t1
t2
t3
t4
64.619
117.73
114.78
81.803
99.547
160.61
179.30
139.36
p = 0.975
OLT78.000 ± 7.576136.333 ± 11.982145.208 ± 16.805102.042 ± 11.991t1
t2
t3
t4
62.328
111.55
110.44
77.237
93.672
161.12
179.97
126.85
OLB75.083 ± 6.034129.000 ± 8.327139.000 ± 12.86697.667 ± 9.833t1
t2
t3
t4
62.601
111.78
112.39
77.326
87.566
146.23
165.62
118.00
Values are presented as mean ± standard error (SE). TG: serum triglyceride concentration (mg/dL). t1: baseline, t2: 1 h, t3: 2 h, t4: 4 h postprandially. CTRL: Control meal without olive leaf supplementation. OLT: Meal supplemented with olive leaf tea. OLB: Meal supplemented with olive leaf-enriched biscuit. Statistical analysis was performed using repeated measures (ANOVA) to assess the interaction effect (group × time).
Table 10. Postprandial changes in serum CRP levels.
CRP
(Mean ± SE) at Baseline (t1)
CRP
(Mean ± SE) at 1 h (t2)
CRP
(Mean ± SE) at 2 h (t3)
CRP
(Mean ± SE) at 4 h (t4)
95% Confidence Intervalp Value
(Group × Time)
TimeLower BoundUpper Bound
CTRL0.192 ± 0.0450.192 ± 0.0420.190 ± 0.0410.190 ± 0.039t1
t2
t3
t4
0.099
0.104
0.106
0.110
0.284
0.280
0.275
0.270
p = 0.854
OLT0.259 ± 0.0570.256 ± 0.0560.255 ± 0.0550.257 ± 0.055t1
t2
t3
t4
0.140
0.141
0.140
0.142
0.378
0.371
0.369
0.371
OLB0.250 ± 0.0450.252 ± 0.0430.249 ± 0.0440.241 ± 0.042t1
t2
t3
t4
0.158
0.163
0.158
0.155
0.343
0.341
0.340
0.327
Values are presented as mean ± standard error (SE). CRP: serum C-reactive protein concentration (mg/dL). t1: baseline, t2: 1 h, t3: 2 h, t4: 4 h postprandially. CTRL: Control meal without olive leaf supplementation. OLT: Meal supplemented with olive leaf tea. OLB: Meal supplemented with olive leaf-enriched biscuit. Statistical analysis was performed using repeated measures (ANOVA) to assess the interaction effect (group × time).
Table 11. Postprandial changes in serum uric acid (UA) levels (mg/dL).
UA
(Mean ± SE) at Baseline (t1)
UA
(Mean ± SE) at 1 h (t2)
UA
(Mean ± SE) at 2 h (t3)
UA
(Mean ± SE) at 4 h (t4)
95% Confidence Intervalp Value
(Group × Time)
TimeLower BoundUpper Bound
CTRL4.731 ± 0.2204.713 ± 0.2104.488 ± 0.2114.429 ± 0.216t1
t2
t3
t4
4.276
4.279
4.053
3.983
5.186
5.147
4.924
4.875
p = 0.145
OLT4.735 ± 0.2324.735 ± 0.2284.583 ± 0.2314.430 ± 0.236t1
t2
t3
t4
4.255
4.263
4.104
3.941
5.214
5.206
5.062
4.918
OLB4.768 ± 0.2254.743 ± 0.2214.649 ± 0.2194.437 ± 0.224t1
t2
t3
t4
4.303
4.285
4.195
3.974
5.234
5.201
5.103
4.900
Values are presented as mean ± standard error (SE). UA: Serum uric acid concentration (mg/dL). t1: baseline, t2: 1 h, t3: 2 h, t4: 4 h postprandially. CTRL: Control meal without olive leaf supplementation. OLT: Meal supplemented with olive leaf tea. OLB: Meal supplemented with olive leaf-enriched biscuit. Statistical analysis was performed using repeated measures (ANOVA) to assess the interaction effect (group × time).
Table 12. Postprandial changes in plasma total antioxidant capacity (TAC) levels (mg/L).
TAC
(Mean ± SE) at Baseline (t1)
TAC
(Mean ± SE) at 1 h (t2)
TAC
(Mean ± SE) at 2 h (t3)
TAC
(Mean ± SE) at 4 h (t4)
95% Confidence Intervalp Value
(Group × Time)
TimeLower BoundUpper Bound
CTRL0.370 ± 0.0170.377 ± 0.0180.370 ± 0.0160.344 ± 0.017t1
t2
t3
t4
0.335
0.340
0.337
0.310
0.405
0.413
0.403
0.379
p = 0.629
OLT0.368 ± 0.0150.381 ± 0.0150.371 ± 0.0140.358 ± 0. 016t1
t2
t3
t4
0.338
0.350
0.343
0.325
0.398
0.412
0.399
0.391
OLB0.362 ± 0.0120.375 ± 0.0130.368 ± 0.0140.354 ± 0.016t1
t2
t3
t4
0.337
0.349
0.339
0.321
0.388
0.400
0.397
0.387
Values are presented as mean ± standard error (SE). TAC: plasma total antioxidant capacity concentration (mg/L). t1: baseline, t2: 1 h, t3: 2 h, t4: 4 h postprandially. CTRL: Control meal without olive leaf supplementation. OLT: Meal supplemented with olive leaf tea. OLB: Meal supplemented with olive leaf-enriched biscuit. Statistical analysis was performed using repeated measures (ANOVA) to assess the interaction effect (group × time).
Table 13. Postprandial changes in platelet-activating factor.
PAF
(Mean ± SE) at Baseline (t1)
PAF
(Mean ± SE) at 1 h (t2)
PAF
(Mean ± SE) at 2 h (t3)
PAF
(Mean ± SE) at 4 h (t4)
95% Confidence Intervalp Value
(Group × Time)
TimeLower BoundUpper Bound
CTRL0.916 ± 0.0640.316 ± 0.2880.099 ± 0.1240.231 ± 0.178t1
t2
t3
t4
0.785
−0.280
−0.158
−0.137
1.048
0.913
0.356
0.599
p = 0.713
OLT0.996 ± 0.0470.018 ± 0.059−0.086 ± 0.073−0.024 ± 0.066t1
t2
t3
t4
0.898
−0.104
−0.238
−0.161
1.094
0.139
0.065
0.113
OLB0.916 ± 0.0590.190 ± 0.197−0.040 ± 0.2000.138 ± 0.179t1
t2
t3
t4
0.794
−0.218
−0.454
−0.233
1.037
0.599
0.374
0.509
Values are presented as mean ± standard error (SE). PAF: plasma platelet-activating factor (% Inhibition). t1: baseline, t2: 1 h, t3: 2 h, t4: 4 h postprandially. CTRL: Control meal without olive leaf supplementation. OLT: Meal supplemented with olive leaf tea. OLB: Meal supplemented with olive leaf-enriched biscuit. Statistical analysis was performed using repeated measures (ANOVA) to assess the interaction effect (group × time).
Disclaimer/Publisher’s Note: The statements, opinions and data contained in all publications are solely those of the individual author(s) and contributor(s) and not of MDPI and/or the editor(s). MDPI and/or the editor(s) disclaim responsibility for any injury to people or property resulting from any ideas, methods, instructions or products referred to in the content.

