Article

Assessment of Water Quality in the Tributaries of the Rega River (Northwestern Poland) as a Fish Habitat

by
Małgorzata Bonisławska
1,
Arkadiusz Nędzarek
1,*,
Adam Tański
2,
Agnieszka Tórz
1 and
Krzysztof Formicki
2
1
Department of Aquatic Bioengineering and Aquaculture, West Pomeranian University of Technology in Szczecin, Kazimierza Królewicza Street 4B, 71-550 Szczecin, Poland
2
Department of Hydrobiology, Ichthyology and Biotechnology of Breeding, West Pomeranian University of Technology in Szczecin, Kazimierza Królewicza Street 4, 71-550 Szczecin, Poland
*
Author to whom correspondence should be addressed.
Appl. Sci. 2025, 15(14), 7846; https://doi.org/10.3390/app15147846 (registering DOI)
Submission received: 6 June 2025 / Revised: 7 July 2025 / Accepted: 10 July 2025 / Published: 14 July 2025

Abstract

The effective assessment and improvement of water quality require analysis not only of the main river flowing into the sea but also of its tributaries, which may contribute to significant pollution. This study aimed to evaluate the physicochemical conditions of water in nine streams flowing into the Rega River between 2018 and 2022. It also sought to determine whether the water quality in these tributaries meets the standards defined by EU regulations for inland waters that serve as habitats for fish. The parameters analyzed included water temperature, dissolved oxygen (DO), pH, total suspended solids (TSSs), electrical conductivity (EC), alkalinity, total hardness (TH), biochemical oxygen demand (BOD5), nitrite nitrogen (NO2-N), ammonium nitrogen (NH4+-N), and total phosphorus (TP). The results indicated that most indicators met the requirements for waters suitable for salmonid species. Elevated concentrations of NO2-N observed across all sites were still within acceptable limits for cyprinid species. Among the parameters studied, TSSs was identified as the main factor that downgraded water quality over the study period. Principal component analysis (PCA) showed that the dominant variables influencing water chemistry were NH4+-N, NO2-N, TP, EC, and chloride (Cl), all of which are associated with anthropogenic sources.

1. Introduction

Many fish species are increasingly threatened by habitat modifications caused by human activities [1,2,3]. The impact of these changes varies among species, depending on their specific ecological requirements and sensitivity to hydrological alterations. Salmonids, for example, inhabit fast-flowing, cold-water sections of rivers that are well-oxygenated and low in nutrients. They rely on coarse substrates such as gravel and cobble for successful spawning. In contrast, rheophilic cyprinids are more tolerant of changes in water quality and typically occupy the middle and lower reaches of rivers, where flow is slower, channels are wider, and the substrate is sandy. In these habitats, summer water temperatures may exceed 20 °C, and oxygen depletion can occur near the riverbed.
Rivers, streams, and smaller watercourses serve as vital ecological corridors for fish, facilitating migration, dispersal, and access to critical habitats. However, their functioning is increasingly disrupted by pollution stemming from human activities. Major sources of contamination include municipal and industrial wastewater, agricultural runoff, and leachate from waste disposal sites [4,5,6]. These inputs introduce a wide range of harmful substances into aquatic ecosystems, including pesticides, surfactants, petroleum hydrocarbons, and heavy metals [7,8]. According to WWAP [9], more than 80% of municipal wastewater is discharged into water bodies without treatment. Additionally, agriculture is a leading contributor to water pollution, accounting for 70% of global freshwater withdrawals [10].
Eutrophication caused by excessive nutrient loads transported by rivers into seas remains a major environmental challenge, despite progress in reducing pollution from point and diffuse sources within catchments [11].
Water quality is shaped by several factors, including ineffective municipal wastewater management, poorly maintained or missing septic systems and treatment plants, and the intensification of agriculture and animal husbandry. According to Kundzewicz et al. [12], the implementation of the Water Framework Directive (WFD) in Poland has led to significant improvements in water quality. However, achieving at least good status for all waters by the 2015 deadline was not possible, and it is unlikely that this objective will be fully met by 2027 [12].
This is supported by diagnostic monitoring carried out in Poland between 2016 and 2021, which assessed the condition of rivers, lakes, and transitional and coastal waters. The findings revealed that in over 75% of river monitoring sites, the status of physicochemical elements did not meet the threshold for good condition. Furthermore, in terms of ecological status, 40% of the surveyed rivers were classified as being in poor or bad condition [13].
The quality of river water depends on the condition of the entire catchment. Smaller streams, classified as first- and second-order tributaries, contribute various types of pollution to the main river. Therefore, improving water quality requires a comprehensive assessment of both the main river and its tributaries.
The Rega River, the third-longest river in Poland discharging into the Baltic Sea, has a catchment area of 2725 km2. Its major tributaries include the Mołstowa, Ukleja, Gardominka, Stara Rega, Reska Węgorza, Rekowa, Łoźnica, Brzeźnicka-Węgorza, Lubieszowa, Piaskowa, and Sarnia rivers [14]. An assessment of the physicochemical conditions of the Rega River conducted between 2018 and 2022 revealed that, among twelve water quality indicators, long-term average values of total suspended solids (TSSs) and nitrite nitrogen (NO2-N) did not comply with EU standards [15]. Additionally, occasional high concentrations of conductivity, TSSs, BOD5, NO2-N, and chlorides were recorded, indicating the influence of pollutants transported by the tributaries into the Rega River.
Between 2018 and 2022, efforts were undertaken to restore suitable conditions for migratory fish species within the Rega River catchment. The activities focused on constructing artificial spawning grounds and gravel-cobble riffles that serve as breeding habitats for salmonid fish. As part of these efforts, it was both necessary and justified to evaluate the water quality of the river’s first- and second-order tributaries, which may serve as potential spawning habitats for salmonids and lampreys.
The specific objectives of this study were to: (I) assess the physicochemical water quality of nine tributary flowing into the Rega River and (II) determine whether the water in these rivers meets the EU regulatory standards for inland waters that support natural fish populations. The general goal was to provide data to support the management of aquatic environments in small catchments in Poland.

2. Materials and Methods
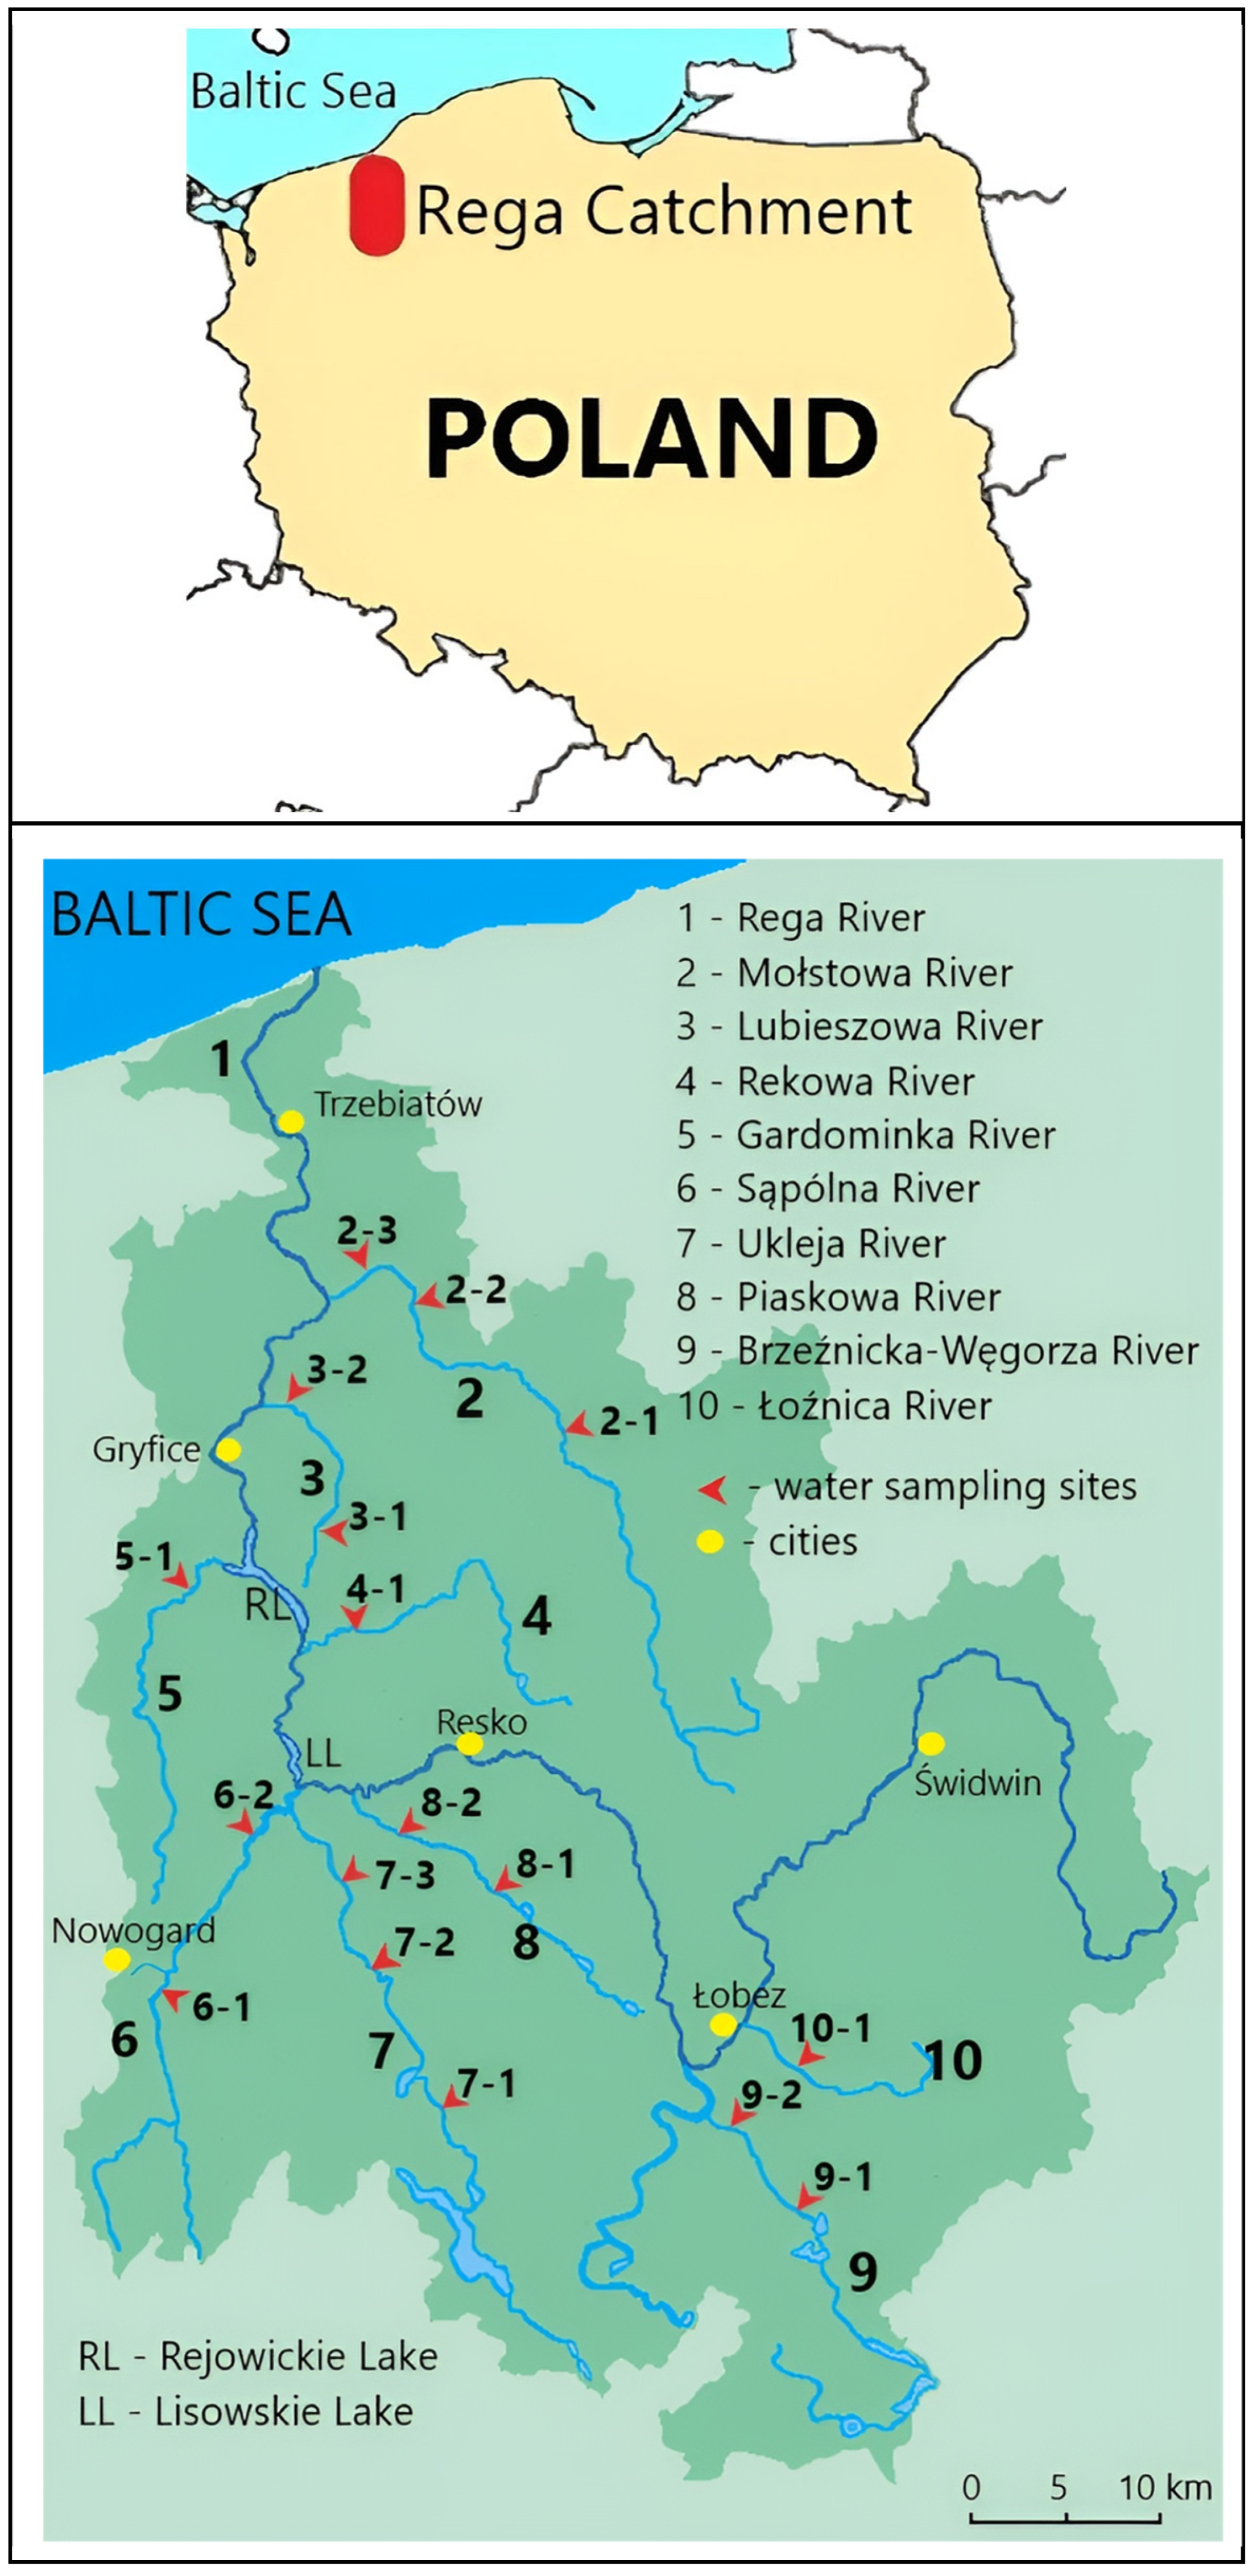
2.1. Study Area

This study covered nine rivers within the Rega River catchment (Figure 1), with brief descriptions provided below.
Mołstowa is the longest first-order tributary of the Rega River (Table 1). Its upper reaches have a mountainous character and flow through forested areas, while its lower course runs through agricultural land and meadows. A water quality assessment conducted by the Regional Environmental Protection Inspectorate [16] in 2008 at the confluence with the Rega indicated that physicochemical parameters fell below the threshold for good ecological status. Biological elements were classified as class I, and the overall ecological condition was assessed as moderate [16]. Three sampling points were established along the Mołstowa in the villages of Rzesznikowo, Mołstowo, and Bielikowo (Figure 1, Table 2).
Ukleja is a left-bank tributary of the Rega with the largest catchment area among the studied rivers (Table 1). It originates from Lake Dłusko and flows through Lakes Woświn, Mielno, and Okrzeja, acting as a connecting river between them. It then transitions into a gravel-bed lowland stream and finally becomes a sandy-clay lowland river before joining the Rega. Just before its mouth, it receives its largest tributary, the Sąpólna River, from the left. Various fish species are found along different sections of the river, with the most abundant being gudgeon (Gobio gobio L.), brown trout (Salmo trutta fario L.), bullhead (Cottus gobio L.), and spined loach (Cobitis taenia L.) [14]. A 2008 assessment by WIOŚ at the mouth of the Ukleja rated its overall water quality as good [16]. Sampling sites were located near the villages of Mieszewo, Troszczyno, and Miłogoszcz (Figure 1, Table 2).
Gardominka is a left-bank tributary of the Rega, with a length of 26.6 km (Table 1). It receives effluents from a mechanical wastewater treatment plant in Grębocin and a mechanical-biological facility in Trzygłów. In the upper section, the dominant fish species is the three-spined stickleback (Gasterosteus aculeatus); in the middle section, roach (Rutilus rutilus L.), pike (Esox lucius L.), and tench (Tinca tinca L.); and in the lower section, stone loach (Barbatula barbatula L.) and gudgeon [14]. A single sampling site was located near the village of Truskolas (Figure 1, Table 2).
Rekowa is a right-bank tributary of the Rega, also 26.6 km long (Table 1). It originates between the village of Gardzin and the hamlet of Gozdno. Since 2010, its lower section has been protected within the Rekowa River Nature Reserve, which lies within the Natura 2000 site “Dorzecze Regi” (PLH320049). In 2008, a water quality assessment at the river’s mouth showed physicochemical parameters below the good status threshold, while biological elements were classified as class I. The overall ecological status was moderate, and the general two-tier evaluation rated the river in poor condition [16]. The unregulated lower section of the river is inhabited by numerous fish species, including roach, burbot (Lota lota L.), gudgeon, brown trout, and bullhead [14]. One sampling point was established near the village of Wicimie (Figure 1, Table 2).
Piaskowa is a left-bank tributary of the Rega River, stretching 14.0 km through forested terrain (Table 1). It originates from Lake Piaski in the Łobez Upland and is characterized by a predominantly sandy substrate. In its upper forested section, bullhead is abundant, while roach, three-spined stickleback, and brook lamprey (Lampetra planeri Bloch.) occur in smaller numbers [14]. Two sampling sites were established near the villages of Świętochowo and Maliniec (Figure 1, Table 2).
Lubieszowa is a right-bank tributary of the Rega River, 14.3 km long, flowing through Lake Łopianowskie (Table 1). Water quality monitoring near the bridge on Provincial Road 105 revealed poor status under the general two-tier classification system [16]. Despite this, Lubieszowa is a key tributary, serving as an annual spawning ground for brown trout and sea trout (Salmo trutta m. trutta L.). The river also supports several protected species, including bullhead, stone loach, and the thick-shelled river mussel (Unio crassus Philipsson) [14]. Sampling sites were located near the villages of Charnowo and Lubieszewo (Figure 1, Table 2).
Łoźnica is a 13.4 km long left-bank tributary of the Rega, flowing through the Drawsko Lake District and the Łobez Upland (Table 1). It enters the Rega in the town of Łobez. A 2008 WIOŚ assessment at the confluence with the Rega showed physicochemical parameters below the good status threshold. The overall condition of the river was classified as poor [16]. Fish species in the river include bullhead, brown trout, three-spined stickleback, and brook lamprey [14]. One sampling site was located near the village of Wysiedle (Figure 1, Table 2).
Brzeźnicka-Węgorza is a right-bank tributary of the Reska-Węgorza, which itself is a left-bank tributary of the Rega. The river is 37.8 km long and drains a catchment area of 276.0 km2 (Table 1). It originates from Lake Studnica on the Drawsko Plain and flows through Lake Ostrowickie and the villages of Bucierz, Czaple, Brzeźno, and Żabice. Its varied course supports a diverse range of fish species, including gudgeon, bitterling (Rhodeus sericeus amarus), spined loach, and roach [14]. Since 2007, the river has been part of the Natura 2000 protected area “Brzeźnicka Węgorza” (PLH320002). It is also an important spawning ground for trout [18]. Water quality measurements at the confluence with the Reska-Węgorza showed that physicochemical parameters met Class II standards, biological elements were rated Class I, and the ecological status was assessed as good. Overall, the river was classified as being in good condition [16]. In 2017, the chemical status of the waters was assessed as below good, and the overall status was classified as poor [19]. Two sampling sites were established near the villages of Brzeźniak and Lesięcin (Figure 1, Table 2).
Sąpólna is a left-bank tributary of the Ukleja River, which flows into the Rega. Its source lies near the village of Bagna. The stream is home to several protected fish species, including bullhead, stone loach, and brook lamprey [14]. Between 2019 and 2020, five artificial spawning beds were constructed to restore salmonid spawning habitats, primarily for brown trout [18]. However, studies conducted in 2021–2022 identified pollution in the lower reaches, linked to wastewater discharges from the treatment plant in Nowogard [15]. Two sampling points were established near the outskirts of Nowogard and the village of Żabówko (Figure 1, Table 2).

2.2. Measurement and Analysis of Water Quality

This study was conducted from September 2018 to April 2022. Water samples were collected in autumn, winter, spring, and summer—resulting in a total of 16 samples taken from each site (Figure 1; Table 1 and Table 2).
Samples were taken from the riverbed, 20 cm below the surface, at the midpoint of the flow. Stream width was measured using a Leica Disto A3 laser rangefinder; five measurements were taken at each site and averaged. Water flow was assessed with a Geopacks hydrometric meter (Geomor Technik, Szczecin, Poland), also based on five measurements per site.
Field measurements included water temperature and pH, determined using a waterproof multiparameter device (Chemland 7011-01, Stargard, Poland), and conductivity, measured with a waterproof conductometer (Chemland 7200-03, Stargard, Poland).
Water quality indicators were analyzed using standard methods recommended by APHA [20] (Table 3). Colorimetric methods were performed with a U-2900 UV-VIS double-beam spectrophotometer (Hitachi High-Technologies Corporation, Tokyo, Japan).
Water quality assessment followed the criteria set out in Directive 2006/44/EC of the European Parliament and Council of 6 September 2006, on the quality of fresh waters needing protection or improvement to support fish life (Official Journal of the European Union, 25 September 2006) [21], as well as the Regulation of the Polish Ministry of Infrastructure of 25 June 2021 [17]. This regulation defines the classification of ecological status, ecological potential, and chemical status of surface water bodies, along with environmental quality standards for priority substances, based on Directive 2000/60/EC (Water Framework Directive) [22] (Table 4).
According to these classifications, the Rega River tributaries were categorized as follows: PN—lowland stream; RzN—lowland river; P1_poj—stream within a river-lake system in a lake district, salmonid waters; R1_poj—river within a river-lake system in a lake district, salmonid waters

2.3. Statistical Analysis

Prior to running ANOVA, the normality in data were tested using the Shapiro–Wilk test. The data met this assumption and were analyzed using one-way ANOVA (p < 0.05) and the Duncan test (p < 0.05) to determine statistically significant differences in water quality indicators among the various research sites.
To further explore the structure of the dataset, the relationships between parameters, and variability among rivers, principal component analysis (PCA) was performed. All measured water quality variables were included in the analysis. According to Wang et al. [23] the loading of physicochemical indicators on the principal components (PCs) is classified as low, medium, or strong when the values fall within the ranges of 0.3–0.5, 0.5–0.75, and 0.75–1, respectively.
Statistical analyses were carried out using Statistica 13.3 software (TIBCO Software Inc., Palo Alto, CA, USA).

3. Results and Discussion

3.1. Hydrochemical Conditions of the Studied Rivers

The analysis of twelve water quality indicators across the nine studied rivers showed that long-term mean values (over four years) differed significantly (p ≤ 0.05) for all parameters except water temperature, which remained statistically uniform among the sites (Table 5 and Table 6).
Average water temperature ranged from 8.3 °C in the Łoźnica River to 10.4 °C in the Brzeźnicka-Węgorza (Table 5). The lowest temperatures were recorded during winter and did not exceed 3 °C. In contrast, peak temperatures occurred in summer, typically remaining below 20 °C. However, in isolated cases, values approached or exceeded the thermal tolerance limit for salmonids (21.5 °C), as observed in the Ukleja River (near the threshold) and the Brzeźnicka-Węgorza River (slightly exceeding it), as defined in Directive 2006/44/EC (Table 4 and Table 5) [21].
pH values in all rivers ranged from 7.2 to 7.7 (Table 5), falling within the recommended range of 6.0–9.0 for freshwater bodies that support fish life (Directive 2006/44/EC of the European Parliament and of the Council of 6 September 2006; Table 4). The lowest average pH was recorded in the Gardominka (7.2), while the highest values were observed in the Łoźnica and Brzeźnicka-Węgorza rivers (7.7).
Conductivity varied significantly between rivers (p ≤ 0.05), but remained below 360 µS·cm−1 across all sites, aligning with Class I water quality standards (Table 4 and Table 5) [17]. These values indicate low levels of mineralization, consistent with relatively unpolluted conditions.
Total suspended solids (TSSs) exceeded the acceptable threshold of 25 mg·L−1 (Directive 2006/44/EC of the European Parliament and of the Council of 6 September 2006) in eight out of nine rivers (Table 4 and Table 5). The most pronounced exceedances—more than double the limit—were recorded in the Mołstowa, Piaskowa, Łoźnica, Brzeźnicka-Węgorza, and Sąpólna. Only the Gardominka had TSS concentrations that consistently met the standard for fish-supporting waters, with an average value of 18 mg·L−1.
Of particular concern were the exceptionally high maximum TSS concentrations observed in some rivers: Mołstowa (318 mg·L−1), Lubieszowa (230 mg·L−1), Piaskowa (224 mg·L−1), and Sąpólna (208 mg·L−1) (Table 4). The elevated levels of TSSs can be largely attributed to the high proportion of agricultural land within the catchments of the studied rivers. According to the Regional Inspectorate for Environmental Protection in Szczecin, agricultural land in the West Pomeranian Voivodeship accounts for 48.7% of the total area, including 38.5% arable land, 6.6% meadows, 3.4% pastures, and 0.2% orchards [24]. Within the municipalities through which the tributaries of the Rega River flow, the share of agricultural land ranges from 38% to 72%. The highest percentages are found in the municipalities of Brojce (72%; Mołstowa, Lubieszowa), Gryfice (67%; Rega), Radowo Małe (66%; Ukleja, Piaskowa), Nowogard (65%; Sąpólna, Wołczenica, Gardominka), Płoty (61%; Ukleja, Rekowa, Lubieszowa), Łobez (56%; Brzeźnica–Węgorza), Resko (50%; Ukleja, Rega), and Przybiernów (38%; Łoźnica) [25]. Numerous studies have shown that soil erosion from agricultural areas is a major source of nutrient salts and mineral matter, primarily in the form of fine soil particles, entering surface waters [26,27]. In the case of the Sąpólna River, the exceptionally high TSS concentrations are further exacerbated by wastewater discharges from a treatment plant [15].
These elevated values pose a serious threat to in-stream spawning habitats, especially artificial salmonid redds. High TSS levels can lead to oxygen depletion within spawning nests, hindering embryo development and significantly reducing hatching success [28,29,30]. Moreover, sediment-laden flows may accelerate the degradation of artificial spawning structures [18].
For most of the studied rivers, dissolved oxygen (DO) concentrations ranged between 7.6 and 9.6 mg O2·L−1, corresponding to Class I and II water quality [17] and indicating conditions suitable for both salmonid and cyprinid fish (Directive 2006/44/EC of the European Parliament and of the Council of 6 September 2006). However, in the Gardominka and Rekowa rivers, DO levels fell below the Class II threshold of 7.5 mg O2·L−1, making these waters unsuitable for sustaining fish populations according to EU standards (Table 3 and Table 4). Critically low DO values were recorded in the Gardominka (1.9 mg O2·L−1), Lubieszowa (2.9 mg O2·L−1), and Rekowa (3.1 mg O2·L−1) rivers (Table 5). These oxygen deficits occurred primarily during spring and summer.
Low DO levels are indicative of various forms of pollution, primarily of anthropogenic origin. Historical monitoring by WIOŚ in 2008 already identified poor water quality in the Gardominka, Rekowa, and Lubieszowa rivers [16]. One contributing factor is likely the reduced flow velocity due to siltation, especially in straightened river sections, such as those in the Lubieszowa catchment, dominated by meadows and cultivated fields. In the Gardominka River, low DO levels may be linked to beaver activity. The construction of dams by beavers creates impoundments, resulting in areas of reduced flow or stagnant water. These conditions promote the accelerated decomposition of organic matter and the oxidation of minerals—processes that significantly deplete dissolved oxygen in the water [31,32].
When DO concentrations drop below 3–4 mg O2·L−1, the functioning of aquatic ecosystems may be disrupted, potentially leading to fish mortality. Maintaining DO above this threshold is essential to support healthy aquatic communities and preserve the self-purifying capacity of rivers.
The intensity of organic matter decomposition is also reflected in the biochemical oxygen demand (BOD5). In eight of the nine rivers, BOD5 levels remained below 3.0 mg O2·L−1, indicating good water quality. Only the Brzeźnicka-Węgorza slightly exceeded this value, at 3.1 mg O2·L−1 (Table 4 and Table 5). These results are consistent with Class I and II water quality and confirm the general suitability of these waters for both salmonid and cyprinid species [17,21].
Long-term mean concentrations of total phosphorus (TP) were below 0.2 mg P·L−1 in all rivers, which is within the limit for salmonid waters under Directive 2006/44/EC (Table 4 and Table 6) [21]. However, the more stringent threshold for Class I water quality (0.100 mg P·L−1) [17] was exceeded in the Lubieszowa, Łoźnica, and Sąpólna rivers. Particularly high TP concentrations were observed in the Sąpólna River, where maximum levels reached 0.676 mg P·L−1 (Table 6).
Although the long-term mean TP levels remained below 0.2 mg P·L−1, the findings point to considerable anthropogenic influence across the studied catchments. Meybeck [33] suggests that TP concentrations in undisturbed rivers should remain below 0.025 mg P·L−1. The elevated values observed here likely stem from the predominantly agricultural land use, especially in meadow areas where mown grasses are often left in place during summer, as required for farmers to receive EU subsidies.
Additionally, the growing presence of beaver habitats and their associated modifications to river hydrology—particularly slowed water flow and increased sedimentation—may further contribute to phosphorus accumulation. According to the Central Statistical Office of Poland, the beaver population has increased significantly over the past 28 years—from 5000 to approximately 127,000 individuals [34]. Beaver activity can affect water quality in both negative and positive ways. It may contribute to reduced DO levels and increased TP concentrations [31,32], while also promoting reductions in N and TSS levels [35,36].
However, a comprehensive inventory and targeted research are needed to fully understand the ecological impact of beaver activity on nutrient dynamics in these river systems.
The long-term mean concentrations of nitrite nitrogen (NO2-N) in the studied rivers ranged from 0.012 mg·L−1 (Rekowa) to 0.026 mg·L−1 (Sąpólna), with statistically significant differences between rivers (p ≤ 0.05) (Table 6). According to Directive 2006/44/EC, these values are within the acceptable range for waters supporting cyprinid fish (Table 4). However, the maximum NO2-N concentrations observed in the Mołstowa, Ukleja, Gardominka, Rekowa, Brzeźnicka-Węgorza, and Sąpólna rivers exceeded the threshold of 0.03 mg·L−1, which is considered the upper limit for cyprinid habitats (Table 4 and Table 6). Such elevated levels suggest anthropogenic nutrient loading, consistent with findings by Kelso et al. [37].
In the Mołstowa River, high NO2-N concentrations were particularly evident during low-flow periods. This may be linked to a rainbow trout hatchery located upstream of the sampling point in Mołstowo (Figure 1, Site 2-2), as well as the presence of agricultural land further downstream. In the Ukleja River, sampling points 7.2 (Troszczyno) and 7.3 (Miłogoszcz) are located downstream of weirs (Figure 1; Table 2 and Table 6), where impounded water promotes sediment accumulation and nutrient retention, especially in summer. Although the river is bordered in places by forested buffer zones, agricultural land beyond these buffers likely contributes additional nutrient inputs.
In the Gardominka River, beaver dams and lodges located both upstream and downstream of the sampling site have created flooded areas that extend into meadows and croplands, increasing the retention and release of nutrients into the water. The Rekowa River, a small watercourse with channel features resembling a drainage ditch, collects runoff from surrounding agricultural fields, explaining its elevated NO2-N levels. In the Brzeźnicka-Węgorza, the sampling site near the village of Brzeźniak (Figure 1, Site 9-1) is influenced by water flowing from the eutrophic Lake Żabice, which experiences seasonal algal blooms that impact water quality further downstream. In the case of the Sąpólna River, the maximum NO2-N concentration reached 0.101 mg·L−1, likely due to the discharge of treated wastewater [15]. These elevated NO2-N concentrations are concerning, as they can impair fish health, reducing reproductive success and increasing physiological stress [38,39].
In contrast, ammonium nitrogen (NH4+-N) levels remained low across all rivers, ranging from 0.043 mg·L−1 (Łoźnica) to 0.111 mg·L−1 (Sąpólna) (Table 4 and Table 6). These values meet Class I standards [7] and indicate that the waters are suitable for salmonid fish [21].
Nutrient-driven eutrophication remains a critical issue in European waters. More than 60% of water bodies fail to meet the target of “good ecological status” (GES) established under the EU Water Framework Directive [22]. Agricultural runoff, along with household and municipal wastewater, represents one of the main pressures on surface waters [40,41,42,43].
Long-term mean alkalinity in the studied rivers ranged from 161.0 to 222.0 mg CaCO3·L−1, while water hardness varied from 225.3 to 260.0 mg CO32−·L−1, with statistically significant differences between rivers (Table 6). These values indicate medium water hardness according to standard classification.
Chloride ion (Cl) concentrations ranged from 24.7 to 59.5 mg·L−1 and also varied significantly among rivers (Table 6). In natural freshwater systems, typical Cl concentrations range between 15–35 mg·L−1 [44]. Increases beyond this range are commonly attributed to anthropogenic sources, such as agricultural runoff, wastewater discharge, and road salt use [45,46,47]. The highest long-term mean chloride concentration (59.5 mg·L−1) and maximum value (127.8 mg·L−1) were recorded in the Sąpólna River, suggesting contamination likely linked to treated wastewater inputs [15].
Changes in chloride and other ion concentrations in surface waters can significantly alter aquatic habitat quality and pose risks to aquatic plants and animals [48].
Water quality in terms of habitat suitability for aquatic organisms can be assessed using selected fish species as bioindicators. This method also enables evaluation of the effects of river engineering on the functioning of aquatic fauna [49]. Such monitoring was carried out in June 2019 on the tributaries of the Rega River as part of the project “Strengthening natural populations of the most valuable ichthyotaxa (including migratory salmonids) through environmentally friendly innovative initiatives such as novel hatchery techniques, creation of spawning grounds, development of fish feed for stocking purposes, and assessment of their impact on fish health and reproductive potential, as well as environmental monitoring for socio-economic infrastructure development in the region” (unpublished data). The assessment recorded the presence of brown trout, with 22 individuals found in the Łoźnica River, 18 in the Mołstowa, and 4–5 individuals in the Ukleja, Piaskowa, and Brzeźnicka-Węgorza rivers. In addition, individual bullheads were observed in the Mołstowa, Ukleja, and Piaskowa rivers. Minnow (Phoxinus phoxinus L.) was recorded only in the Ukleja River (8 individuals), while stone loach was found in the Sąpólna River (5 individuals) (unpublished data). The occurrence of these fish species, known for their sensitivity to pollution, is consistent with the high water quality in these rivers. Approximately 78% of the assessed water quality indicators indicated a very good chemical status (Supplementary Table S2).
Data collected in 2018–2019 during a salmonid inventory in the Rega River basin confirm that the catchment is a key habitat for both migratory and non-migratory salmonid species in northern Poland. Electrofishing surveys conducted on the Ukleja, Brzeźnicka-Węgorza, Piaskowa, Sąpólna, Mołstowa, and Rega rivers showed that salmonids—specifically sea trout, brown trout, and grayling—accounted for 25.86% of the total fish caught [50].
The good water quality in the Ukleja and Sąpólna rivers is further evidenced by the willingness of brown trout to establish spawning nests on artificial spawning grounds created in 2019–2020 [18].

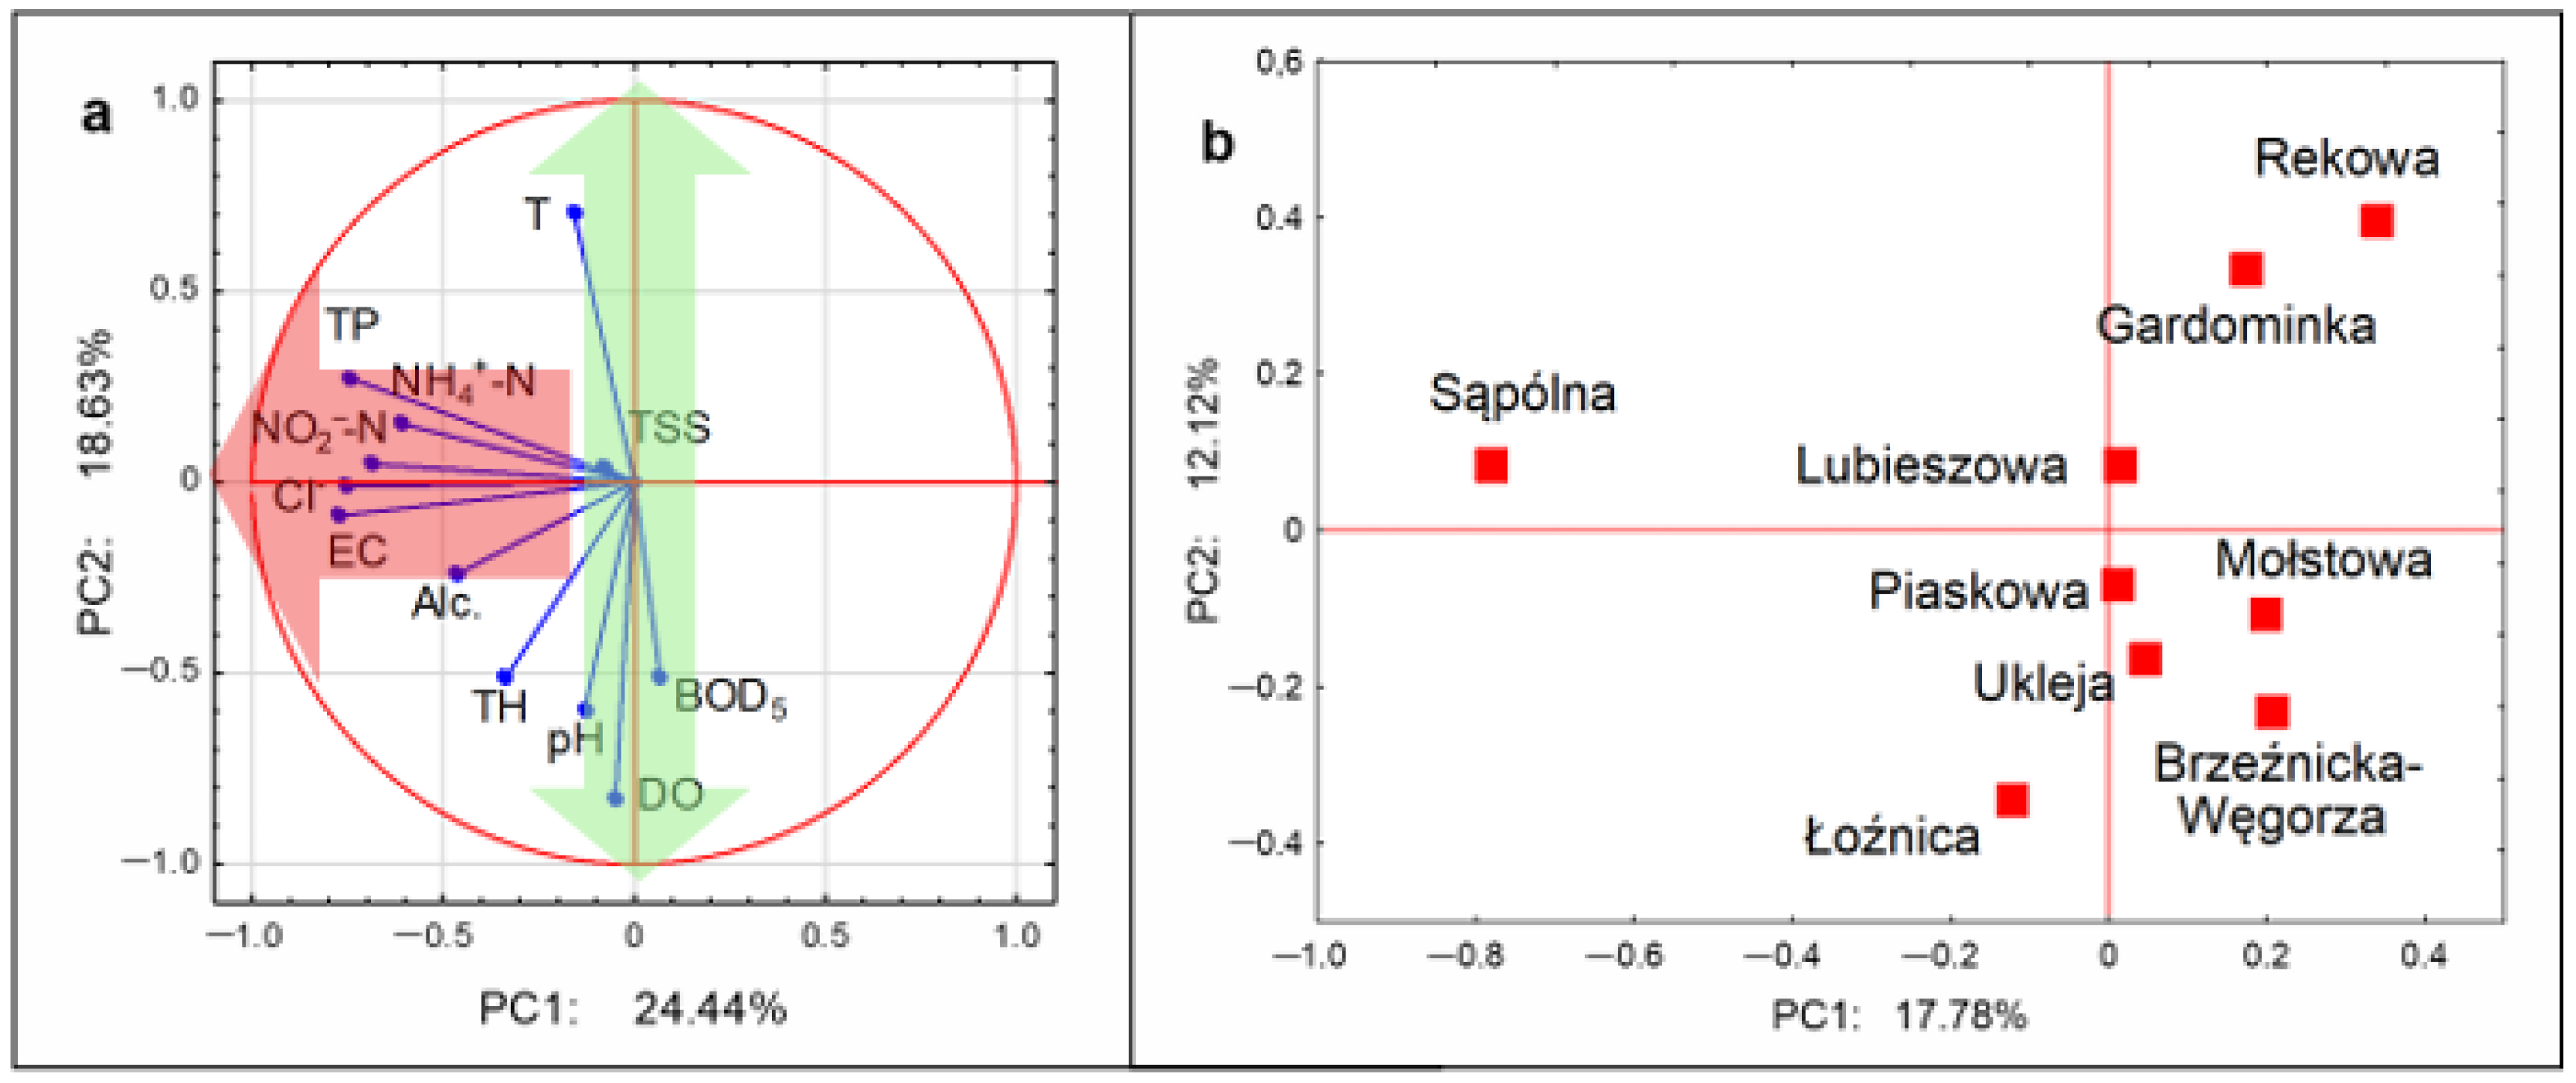
3.2. Multivariate Analysis

Principal component analysis (PCA) was conducted using all measured water quality parameters. The first two principal components accounted for approximately 43% of the total variance (Figure 2a).
PC1 showed medium to strong correlations with ammonium nitrogen (NH4+-N, −0.61), nitrite nitrogen (NO2-N, −0.69), total phosphorus (TP, −0.75), electrical conductivity (EC, −0.77), and chloride ions (Cl, −0.75), while PC2 was associated with water temperature (0.71), pH (−0.60), and dissolved oxygen (DO, −0.83) (Table 7).
These variables represent the key factors shaping the hydrochemistry of the studied rivers. The presence of both nitrogen forms, elevated phosphorus, chloride ions, and their proportional relationship with EC suggest an anthropogenic origin. Increased nutrient concentrations in surface waters are widely recognized as a consequence of human activity—ranging from agricultural practices (e.g., fertilizer application, manure management) to the discharge of municipal and industrial wastewater [40,51,52,53,54].
Pearson correlation coefficients further support the shared origin of these pollutants (Table 8). Significant positive correlations were found between NH4+-N and NO2-N (r = 0.51), NH4+-N and TP (r = 0.43), and NO2-N and TP (r = 0.40). These variables were also correlated with chloride and EC values (r ranging from 0.29 to 0.51), reinforcing their link to human-induced nutrient and ion enrichment. Elevated chloride levels in surface waters are commonly associated with anthropogenic pressures, as confirmed in other studies from the region [55,56,57]. Nędzarek et al. [57], for example, identified chloride, nitrogen, and phosphorus as dominant chemical contributors in a PCA of the Ina River basin.
Water temperature was the only parameter clearly governed by natural conditions, reflecting seasonal atmospheric variation typical of temperate climates. In contrast, pH and DO were influenced by biogeochemical processes such as aerobic decomposition of organic matter and subsequent hydrogen ion release, which explains their moderate correlation (r = 0.41). Both parameters were also affected by atmospheric oxygen diffusion, which is inversely related to water temperature. This is reflected in the significant negative correlations between temperature and pH (r = −0.17), and temperature and DO (r = −0.58) (Table 8).
The PCA ordination plot (Figure 2b) clearly separated the Sąpólna River from the others, driven by its high concentrations of nitrogen, phosphorus, chloride, and EC (Table 6). These values reflect significant anthropogenic pressure, consistent with findings by Bonisławska et al. [15], who reported a negative impact from wastewater discharges originating from the Nowogard treatment plant.
The Łoźnica River formed a distinct group characterized by the highest average alkalinity and water hardness. Meanwhile, the Piaskowa, Ukleja, Lubieszowa, Mołstowa, and Brzeźnicka-Węgorza rivers exhibited similar physicochemical profiles and clustered closely. The Gardominka and Rekowa rivers formed another subgroup, with distinctively low average TSS and DO values (Table 6). These rivers are heavily influenced by beaver activity, especially the Gardominka, where numerous dams create extensive backwater areas. The slowed flow promotes sedimentation and enhances aerobic decomposition of organic matter, both of which contribute to oxygen depletion.
Supplementary PCA conducted separately for each river (Supplementary Figure S1 and Table S1) revealed that the first two components explained between 43.6% and 64.0% of the total variance, with the lowest and highest values observed in the Piaskowa and Gardominka rivers, respectively. Including the third principal component (PC3; see Supplementary Table S1) increased the cumulative variance from 59.60% (Piaskowa) to 73.68% (Gardominka). These values can be considered low, consistent with the findings of Zhang et al. [58], who reported a cumulative variance of hydrochemical parameters below 68%. They attributed this to incomplete hydrochemical data caused by water cut-off during the dry season. Similarly low cumulative variance values (>70%) have been reported in other studies, including those on groundwater systems with highly variable hydrological and geological regimes [59], stream waters [23], lake waters [60], and coastal waters [61], where pollution sources are diverse and include agricultural non-point source pollution, domestic sewage, industrial wastewater, and atmospheric deposition.
In our study, we observed that the influence of individual water quality indicators on the extracted principal components (PCs) varied across the rivers. At the current stage—particularly due to the lack of detailed inventories of pollution sources within the catchments—it was not possible to combine PCA with factor analysis (FA), as was performed by, for example, Wang et al. (2025) [23]. The application of PCA/FA would allow for more accurate identification of links between specific water quality indicators and actual pollution sources in each river. Nevertheless, it is worth noting that in our analysis, PC1 most frequently showed medium to strong correlations (above 0.6) with quality indicators, particularly in the Brzeźnicka-Węgorza, Gardominka, Mołstowa, and Sąpólna rivers. These indicators most often included water temperature, DO, NH4+-N, and TP. PC2 was most commonly correlated with TH, Cl and NO2−-N, while PC3 exhibited strong correlations only occasionally.
This variability reflects site-specific environmental conditions—many of which remain unidentified—that shape the chemistry of each watercourse, despite their shared location within the Rega River catchment. This also highlights the need for an individual approach to assessing the water quality status of these rivers, particularly in the context of environmental conditions required to support fish communities

4. Conclusions

Most of the analyzed water quality indicators met the standards required for waters that support salmonid fish habitats. The exception was nitrite nitrogen (NO2-N), which met the criteria only for cyprinid species. However, total suspended solids were the primary factor lowering the water quality classification in most of the monitored rivers (see Supplementary Table S2).
The studied rivers can generally be classified as having moderate salinity, although the observed levels suggest anthropogenic influence. In contrast, alkalinity and total hardness indicate a natural buffering capacity against incoming hydrogen and hydroxide ions.
Among all the rivers, the Sąpólna stood out as having water conditions unsuitable for fish reproduction and survival, particularly for salmonid species. PCA identified NH4+-N, NO2-N, TP, EC, and Cl as the main chemical variables shaping the water chemistry of the studied rivers, all of which are linked to anthropogenic sources. The analysis also highlighted the importance of site-specific assessments of chemical water status due to local environmental conditions. These findings may support water quality control agencies in evaluating the suitability of river ecosystems for sustaining fish populations.
In light of the alarming poor water quality observed in the studied rivers—particularly in the Sąpólna River—the following measures should be considered:
  • Establishing buffer zones to limit human activities that may negatively impact the aquatic environment (e.g., restrictions on construction).
  • Investing in water quality and ichthyofauna monitoring through modern measurement systems.
  • Restoring fish habitats, including the construction of gravel ridges in tributaries. These structures would serve as natural spawning grounds for fish, especially salmonids, and at the same time act as minor flow barriers that do not impede fish migration but can significantly enhance water retention.
  • Protecting fish migration routes and spawning grounds.
  • Implementing educational programs for local communities to raise awareness of the importance of water protection.
  • Revising quantitative and qualitative wastewater discharge limits in water permits, considering changing flow conditions—especially during summer low-flow periods.
  • Introducing continuous monitoring of strategic locations, particularly tributaries with the highest concentration of spawning grounds (e.g., the Lubieszowa, Mołstowa, and Sąpólna rivers).

Supplementary Materials

The following supporting information can be downloaded at: https://www.mdpi.com/article/10.3390/app15147846/s1, Supplementary Figure S1. Position of eigenvalue vectors of the analyzed indicators in relation to the first two principal components for studied rivers. Supplementary Table S1. Principal component loadings for hydrochemistry parameters in the studied rivers. Supplementary Table S2. Percentage contribution of individual indicators in Class I, Class II, and below Class II according to RMI 2021 [17].

Author Contributions

Conceptualization: M.B., A.N., A.T. (Adam Tański) and K.F., methodology: M.B., A.N. and A.T. (Agnieszka Tórz); formal analysis and investigation: M.B., A.N., A.T. (Adam Tański) and A.T. (Agnieszka Tórz); data curation, M.B., A.N., A.T. (Adam Tański) and A.T. (Agnieszka Tórz), writing—original draft preparation: M.B. and A.N.; writing—review and editing: M.B., A.N., A.T. (Adam Tański) and A.T. (Agnieszka Tórz); supervision, M.B. and A.N.; funding acquisition: K.F. All authors have read and agreed to the published version of the manuscript.

Funding

This research was conducted as part of the project “Strengthening natural populations of the most valuable ichthyotaxa (including migratory salmonids) through environmentally friendly innovative initiatives such as novel hatchery techniques, creation of spawning grounds, development of fish feed for stocking purposes, and assessment of their impact on fish health and reproductive potential, as well as environmental monitoring for socio-economic infrastructure development in the region”. This study was performed within the project no 00001-6521.1-OR1600002/17/18 financed by the Sectoral Operational Programme “Fisheries and See 2014-2020”.

Institutional Review Board Statement

Not applicable.

Informed Consent Statement

Not applicable.

Data Availability Statement

The original contributions presented in the study are included in the article, further inquiries can be directed to the corresponding author.

Conflicts of Interest

The authors declare no conflicts of interest.

References

  1. Fialho, A.P.; Oliveira, L.G.; Tejerina-Garro, F.L.; de Mérona, B. Fish-habitat relationship in a tropical river under anthropogenic influences. Hydrobiologia 2008, 598, 315–324. [Google Scholar] [CrossRef]
  2. Esselman, P.C.; Infante, D.M.; Wang, L.; Wu, D.; Cooper, A.R.; Taylor, W.W. An index of cumulative disturbance to river fish habitats of the conterminous United States from landscape anthropogenic activities. Ecol. Restor. 2011, 29, 133–151. [Google Scholar] [CrossRef]
  3. Moraga, D.; Vivancos, A.; Ruiz, V.H.; Rojas, O.; Díaz, G.; Manosalva, A.; Habit, E. A century of anthropogenic river alterations in a highly diverse river coastal basin: Effects on fish assemblages. Front. Environ. Sci. 2022, 10, 943586. [Google Scholar] [CrossRef]
  4. Ezzati, G.; Kyllmar, K.; Barron, J. Long-term water quality monitoring in agricultural catchments in Sweden: Impact of climatic drivers on diffuse nutrient loads. Sci. Total Environ. 2023, 864, 160978. [Google Scholar] [CrossRef] [PubMed]
  5. Marx, C.; Tetzlaff, D.; Hinkelmann, R.; Soulsby, C. Effects of 66 years of water management and hydroclimatic change on the urban hydrology and water quality of the Panke catchment, Berlin, Germany. Sci. Total Environ. 2023, 900, 165764. [Google Scholar] [CrossRef]
  6. Gavrilaș, S.; Burescu, F.L.; Chereji, B.D.; Munteanu, F.D. The Impact of Anthropogenic Activities on the Catchment’s Water Quality Parameters. Water 2025, 17, 1791. [Google Scholar] [CrossRef]
  7. Mendiguchía, C.; Moreno, C.; García-Vargas, M. Evaluation of natural and anthropogenic influences on the Guadalquivir River (Spain) by dissolved heavy metals and nutrients. Chemosphere 2007, 69, 1509–1517. [Google Scholar] [CrossRef]
  8. Singh, V.; Ahmed, G.; Vedika, S.; Kumar, P.; Chaturvedi, S.K.; Rai, S.N.; Vamanu, E.; Kumar, A. Toxic heavy metal ions contamination in water and their sustainable reduction by eco-friendly methods: Isotherms, thermodynamics and kinetics study. Sci. Rep. 2024, 14, 7595. [Google Scholar] [CrossRef]
  9. WWAP 2017. The United Nations World Water Development Report 2017: Wastewater, the Untapped Resource. United Nations World Water Assessment Programme (WWAP). Paris, United Nations Educational, Scientific and Cultural Organization. Available online: https://www.unido.org/sites/default/files/2017-03/UN_World_Water_Development_Report_-_Full_0.pdf (accessed on 25 May 2025).
  10. Mateo-Sagasta, J.; Zadeh, S.M.; Turral, H. Water Pollution from Agriculture: A Global Review. Executive Summary [Internet]; Food and Agriculture Organization of the United Nations (FAO): Rome, Italy; International Water Management Institute (IWMI): Colombo, Sri Lanka, 2017; Available online: http://www.fao.org/3/a-i7754e.pdf (accessed on 25 May 2025).
  11. Piniewski, M.; Tattari, S.; Koskiaho, J.; Olsson, O.F.; Giełczewski, M.; Marcinkowski, P.; Księżniak, M.; Okruszko, T. How effective are River Basin Management Plans in reaching the nutrient load reduction targets? Ambio 2021, 50, 706–722. [Google Scholar] [CrossRef]
  12. Kundzewicz, Z.; Zaleski, J.; Nachlik, E.; Januchta-Szostak, A. Managing water—Challenges for Poland. Science 2021, 1, 79–102. (In Polish) [Google Scholar] [CrossRef]
  13. GIOŚ 2022; Chief Inspectorate of Environmental Protection. In State of the Environment in Poland. Report 2022. Water Quality; Environmental Monitoring Library: Warsaw, Poland, 2022; pp. 61–91.
  14. Radtke, G.; Bernaś, R.; Dębowski, P.; Skóra, M. The ichthyo-fauna of the Rega river system. Sci. Ann. Pol. Angl. Assoc. 2010, 23, 51–78. (In Polish) [Google Scholar]
  15. Bonisławska, M.; Nędzarek, A.; Rybczyk, A.; Tański, A. The Influence of Anthropogenic Pollution on the Physicochemical Conditions of the Waters of the Lower Section of the Sąpólna River. Water 2024, 16, 35. [Google Scholar] [CrossRef]
  16. WIOŚ. Surface Water Quality Assessment in the West Pomeranian Voivodeship for 2008; WIOŚ: Szczecin, Poland, 2009; p. 8. (In Polish) [Google Scholar]
  17. RMI. Regulation of the Ministry of Infrastructure of June 25, 2021 on the classification of ecological status, ecological potential and chemical status, and the method of classification of the status of surface water bodies, as well as environmental quality standards for priority substances. J. Laws 2021, 1475. [Google Scholar]
  18. Bonisławska, M.; Tański, A.; Nędzarek, A.; Tórz, A.; Formicki, K.; Korzelecka-Orkisz, A. Suitability of Waters of the Rega River Catchment for the Construction and Operation of Artificial Spawning Grounds for Migratory Salmonids. Wylęgarnia 2021; Wydawnictwo Instytutu Rybactwa Śródlądowego: Olsztyn, Poland, 2021; pp. 119–128. (In Polish) [Google Scholar]
  19. WIOŚ in Szczecin 2018, Provincial Inspectorate of Environmental Protection. In The State of the Environment in the West Pomeranian Voivodeship. Report 2018; WIOŚ: Szczecin, Poland, 2018. (In Polish)
  20. APHA. Standard Methods for Examination of Water and Wastewater, 20th ed.; American Public Health Association: Washington, DC, USA, 1999; p. 1325. ISBN 0875532357. [Google Scholar]
  21. Directive 2006/44/EC of the European Parliament and of the Council of 6 September 2006 on the quality of fresh waters needing protection or improvement in order to support fish life. Off. J. Eur. Union L 2006, 20, 264.
  22. Directive 2000/60/EC of the European Parliament and of 23 October 2000 the Council establishinga framework for Community action in the field of water police. Off. J. Eur. Union L 2000, 327, 1.
  23. Wang, Y.; Xiao, Q.; He, B.; Razafindrabe, B.H.N. The Characteristics and Source Contribution Analysis of Nutrients in Water Bodies of Small Watersheds in the Pearl River Delta. Water 2025, 17, 1739. [Google Scholar] [CrossRef]
  24. About the voivodeship. Agriculture. Provincial Inspectorate of Environmental Protection Szczecin. Available online: https://wios.szczecin.pl/chapter_16000.asp (accessed on 22 December 2011).
  25. Available online: https://bdl.stat.gov.pl/bdl/dane/podgrup/temat (accessed on 26 June 2025).
  26. Jiru, E.B.; Wegari, H.T. Soil and water conservation practice effects on soil physicochemical properties and crop yield in Ethiopia: Review and synthesis. Ecol. Process. 2022, 11, 21. [Google Scholar] [CrossRef] [PubMed]
  27. Masha, M.; Belayneh, M.; Bojago, E.; Tadiwos, S.; Dessalegn, A. Impacts of land-use and topography on soil physicochemical properties in the Wamancho watershed, Southern Ethiopia. J. Agric. Food Res. 2023, 14, 100854. [Google Scholar] [CrossRef]
  28. Newcombe, C.P.; Jensen, J.O.T. Channel suspended sediment and fisheries: A synthesis for quantitative assessment of risk and impact. N. Am. J. Fish. Manag. 1996, 16, 693–727. [Google Scholar] [CrossRef]
  29. Bonisławska, M.; Formicki, K.; Smaruj, I.; Szulc, J. Total suspended solids in surface waters versus embryonic development of pike (Esox lucius L.). EJPAU 2011, 14, 7. Available online: http://www.ejpau.media.pl/volume14/issue1/art-07.html (accessed on 14 September 2023).
  30. Kemp, P.; Sear, D.; Collins, A.; Naden, P.; Jones, I. The impacts of fine sediment on riverine fish. Hydrol Process. 2011, 25, 1800–1821. [Google Scholar] [CrossRef]
  31. Curran, J.C.; Cannatelli, K.M. The impact of beaver dams on the morphology of a river in the eastern United States with implications for river restoration. Earth Surf. Process. Landf. 2014, 39, 1236–1244. [Google Scholar] [CrossRef]
  32. Rozhkova-Timina, O.I.; Popkov, V.K.; Mitchell, P.J.; Kirpotin, S.N. Beavers as ecosystem engineers—A review of their positive and negative effects. IOP Conf. Ser. Earth Environ. Sci. 2018, 201, 012015. [Google Scholar] [CrossRef]
  33. Meybeck, M. Carbon, nitrogen and phosphorus transport by world rivers. Am. J. Sci. 1982, 282, 401–450. [Google Scholar] [CrossRef]
  34. Short Statistical Yearbook of the Republic of Poland 2000-2019. Available online: https://stat.gov.pl (accessed on 18 July 2020).
  35. Lazar, J.G.; Addy, K.; Gold, A.J.; Groffman, P.M.; McKinney, R.A.; Kellogg, D.Q. Beaver Ponds: Resurgent Nitrogen Sinks for Rural Watersheds in the Northeastern United States. J. Environ. Qual. 2015, 44, 1684–1693. [Google Scholar] [CrossRef]
  36. Bason, C.W.; Kroes, D.E.; Brinson, M.M. The effect of beaver ponds on water quality in rural coastal plain streams. SENA 2017, 16, 584–602. [Google Scholar] [CrossRef]
  37. Kelso, B.H.L.; Smith, R.V.; Laughlin, R.J. Effects of carbon substrates on nitrite accumulation in freshwater sediments. Appl. Environ. Microbiol. 1999, 65, 61–66. [Google Scholar] [CrossRef]
  38. Korwin-Kossakowski, M.; Myszkowski, L.; Kazuń, K. Acute toxicity of nitrite to tench (Tinca tinca L.) larvae. Pol. Arch. Hydrobiol. 1995, 42, 213–216. [Google Scholar]
  39. Kroupová, H.; Valentová, O.; Svobodová, Z.; Šauer, P.; Machova, J. Toxic effects of nitrite on freshwater organisms: A review. Rev. Aquac. 2018, 10, 525–542. [Google Scholar] [CrossRef]
  40. Wolfram, J.; Stehle, S.; Bub, S.; Petschick, L.L.; Schulz, R. Water quality and ecological risks in European surface waters—Monitoring improves while water quality decreases. Environ. Int. 2021, 152, 106479. [Google Scholar] [CrossRef] [PubMed]
  41. Nikolaidis, N.P.; Phillips, G.; Poikane, S.; Várbíró, G.; Bouraoui, F.; Malagó, A.; Lilli, M.A. River and lake nutrient targets that support ecological status: European scale gap analysis and strategies for the implementation of the Water Framework Directive. Sci. Total Environ. 2022, 20, 151898. [Google Scholar] [CrossRef] [PubMed]
  42. Steinhoff-Wrześniewska, A.; Strzelczyk, M.; Helis, M.; Paszkiewicz-Jasińska, A.; Gruss, Ł.; Pulikowski, K.; Skorulski, W. Identification of catchment areas with nitrogen pollution risk for lowland river water quality. Arch. Environ. Protect. 2022, 48, 53–64. [Google Scholar] [CrossRef]
  43. Yu, J.; Mo, L.; Dai, J.; Bai, K.; Mo, J.; Zhang, S. Nitrogen and Phosphorus Pollution Discharge and Water Quality Evaluation in a Small Basin of the Upper Reaches of Lijiang River. Water 2024, 16, 104. [Google Scholar] [CrossRef]
  44. Pal, S.; Chakraborty, K. Different aspects of chloride in freshwater: A review. Inter. J. Curr. Trends. Sci. Tech. 2017, 7, 20295–20303. [Google Scholar]
  45. Panno, S.V.; Hackley, K.C.; Hwang, H.H.; Greenberg, S.E.; Krapac, I.G.; Landsberger, S.; O’Kelly, D.J. Database for the Characterization and Identification of Sources of Sodium and Chloride in Natural Waters of Illinois; Open File Series 2005-1; Illinois State Geological Survey: Champaign, IL, USA, 2005. [Google Scholar]
  46. Cao, K.F.; Chen, Z.; Wu, Y.H.; Mao, Y.; Shi, Q.; Chen, X.W.; Bai, Y.; Li, K.; Hu, H.Y. The noteworthy chloride ions in reclaimed water: Harmful effects, concentration levels and control strategies. Water Res. 2022, 215, 118271. [Google Scholar] [CrossRef] [PubMed]
  47. Liu, W.; Zhang, Z.; Li, W.; Zhang, Y.; Ren, Z.; Li, X.; Wu, Y.; Li, J.; Zhu, W.; Ma, Z.; et al. Chloride accumulation in inland rivers of China and its toxic impact on cotton. J. Environ. Manag. 2024, 371, 123122. [Google Scholar] [CrossRef]
  48. Litalien, A.; Zeeb, B. Curing the earth: A review of anthropogenic soil salinization and plant-based strategies for sustainable mitigation. Sci. Total Environ. 2020, 698, 134235. [Google Scholar] [CrossRef]
  49. Okwuosa, O.B.; Eyo, J.E.; Omovwohwovie, E.E. Role of fish as bioindicators: A Review. Iconic Res. Eng. J. 2019, 2, 1456–8880. [Google Scholar]
  50. Formicki, K.; Więcaszek, B.; Czerniejewski, P.; Rybczyk, A.; Tański, A.; Korzelecka-Orkisz, A.; Ostaszewska, T.; Zakęś, Z. Preliminary results of the salmonids monitoring in the river Rega (north-western Poland). Front. Mar. Sci. 2019, 6, 157. [Google Scholar] [CrossRef]
  51. Viaroli, P.; Soana, E.; Pecora, S.; Laini, A.; Naldi, M.; Fano, E.A.; Nizzoli, D. Space and time variations of watershed N and P budgets and their relationships with reactive N and P loadings in a heavily impacted river basin (Po river, Northern Italy). Sci. Total Environ. 2018, 639, 1574–1587. [Google Scholar] [CrossRef]
  52. Zhang, W.; Li, H.; Li, Y. Spatio-temporal dynamics of nitrogen and phosphorus input budgets in a global hotspot of anthropogenic inputs. Sci. Total Environ. 2019, 656, 1108–1120. [Google Scholar] [CrossRef] [PubMed]
  53. Wang, Y.; Xie, X.; Liu, C.; Wang, Y.; Li, M. Variation of net anthropogenic phosphorus inputs (NAPI) and riverine phosphorus fluxes in seven major river basins in China. Sci. Total Environ. 2020, 742, 140514. [Google Scholar] [CrossRef] [PubMed]
  54. Liu, J.; Gu, W.; Liu, Y.; Li, W.; Shao, D. Influence of anthropogenic nitrogen inputs and legacy nitrogen change on riverine nitrogen export in areas with high agricultural activity. J. Environ. Manag. 2023, 338, 117833. [Google Scholar] [CrossRef]
  55. Szklarek, S.; Górecka, A.; Wojtal-Frankiewicz, A. The effects of road salt on freshwater ecosystems and solutions for mitigating chloride pollution—A review. Sci. Total Environ. 2022, 805, 150289. [Google Scholar] [CrossRef]
  56. Bonisławska, M.; Tański, A.; Mokrzycka, M.; Brysiewicz, A.; Nędzarek, A.; Tórz, A. The effect of effluents from rainbow trout ponds on water quality in the Gowienica River. J. Water Land Develop. 2013, 19, 3–11. [Google Scholar] [CrossRef]
  57. Nędzarek, A.; Bonisławska, M.; Tórz, A.; Gajek, A.; Socha, M.; Harasimiuk, F.B. Water quality in the central reach of the Ina River (West Pomerania, Poland). Pol. J. Environ. Stud. 2015, 24, 207–214. [Google Scholar] [CrossRef]
  58. Zhang, H.; Li, H.; Gao, D.; Yu, H. Source identification of surface water pollution using multivariate statistics combined with physicochemical and socioeconomic parameters. Sci. Total Environ. 2022, 806, 151274. [Google Scholar] [CrossRef]
  59. Benadela, L.; Bekkoussa, B.; Gaidi, L. Multivariate analysis and geochemical investigations of groundwater in a semi-arid region, case of superficial aquifer in Ghriss Basin, Northwest Algeria. JGSE 2022, 10, 233–249. [Google Scholar] [CrossRef]
  60. Liu, L.; Dong, Y.; Kong, M.; Zhou, J.; Zhao, H.; Tang, Z.; Zhang, M.; Wang, Z. Insights into the long-term pollution trends and sources contributions in Lake Taihu, China using multi-statistic analyses models. Chemosphere 2020, 242, 125272. [Google Scholar] [CrossRef]
  61. Liu, L.; Tang, Z.; Kong, M.; Chen, X.; Zhou, C.; Huang, K.; Wang, Z. Tracing the potential pollution sources of the coastal water in Hong Kong with statistical models combining APCS-MLR. J. Environ. Manag. 2019, 245, 143–150. [Google Scholar] [CrossRef]
Figure 1. Location of water sampling sites in the studied rivers of the Rega catchment.
Applsci 15 07846 g001
Figure 2. Results of PCA analysis using concentrations of all indicators. Position of eigenvalue vectors of the analyzed indicators (a) and position of the studied rivers (b) in relation to the first two principal components PC1 and PC2. The red arrow represents anthropogenic gradients. The green arrows represent natural gradients.
Applsci 15 07846 g002
Table 1. GPS coordinates, river characteristics, number of sampling sites, and classification of watercourses according to RMI 2021 [17].
RiverGPS CoordinatesMean Width
(m)
Mean Depth
(m)
Guidelines
(RMI 2021)
River’s first-order tributaries
Mołstowa53°44′43″ N 15°36′03″ E54.4377.0R1_poj
Ukleja53°29′24″ N 15°29′15″ E45.4457.0R1_poj
Gardominka53°51′32″ N 15°13′47″ E26.6112.6R1_poj
Rekowa53°41′39″ N 15°27′11″ E22.0110.4P1_poj
Piaskowa53°41′39″ N 15°27′11″ E18.086.70P1_poj
Lubieszowa53°56′12″ N 15°14′22″ E14.365.94P1_poj
Łoźnica53°38′23″ N 15°37′32″ E13.488.14PN
River’s second-order tributaries
Brzeźnicka-Węgorza53°29′25″ N 15°43′30″ E37.8276.0R1_poj
Sapólna53°31′59″ N 15°09′26″ E60.187.7RzN
Table 2. River parameters at individual sampling sites.
RiverPositionPoints on the MapMean Width
m
Mean Depth mMean Flow m·s−1
MołstowaRzesznikowo Mołstowo
Bielikowo
2-1
2-2
2-3
15.0
11.09
9.1
1.6
1.2
1.5
0.65
0.87
0.45
UklejaMieszewo
Troszczyno
Miłogoszcz
7-1
7-2
7-3
6.4
17.1
15.7
0.3
0.4
1.5
0.12
0.19
0.51
GardominkaTruskolas5-17.50.60.23
RekowaWicimie4-15.20.20.13
PiaskowaŚwiętochowo
Maliniec
8-1
8-2
1.5
6.3
0.2
0.3
0.29
0.65
LubieszowaCharnowo
Lubieszewo
3-1
3-2
4.5
4.0
0.5
0.6
0.47
0.45
ŁoźnicaWysiedle10-18.10.30.52
Brzeźnicka-WęgorzaBrzeźniak
Lesięcin
9-1
9-2
12.2
10.5
0.7
0.5
0.56
0.93
Sapólnanear Nowogard
Żabówko
6-1
6-2
10.1
7.3
0.4
0.4
0.31
0.24
Table 3. Laboratory methods used to determine the values of analyzed parameters in the nine tributaries of the Rega River (after APHA [20]).
ParameterMethodUnits
TemperatureStandard Method 2550°C
ConductivityStandard Method 2510μS·cm−1
pHStandard Method 4500-H+
Total suspended solids (TSSs)Standard Method 2540Dmg·L−1
AlkalinityStandard Method 2320mg CaCO3·L−1
Total hardness (TH)Standard Method 2340mg CO3·L−1
Chloride by Argentometric MethodStandard Method 4500-Bmg Cl·L−1
Dissolved oxygen (DO)Standard Method 4500-O Bmg O2·L−1
Biochemical Oxygen Demand (BOD5)Standard Method 5210 Bmg O2·dm−3
Nitrite-nitrogen (NO2-N)Standard Method 4500-NO2mg·L−1 (as NO2-N)
Total ammonia nitrogen (NH4-N)Standard Method 4500-NH3mg·L−1 (as NH3-N)
Total phosphorus (TP)Standard Method 4500-Pmg·L−1 (as P)
Table 4. Threshold values for surface water quality in accordance with Directive 2006/44/EC [21] and the Regulation of the Ministry of Infrastructure [17].
Directive 2006/44/EC
Indicator name, unitSalmonid watersCyprinid waters
Temperature, °C<21.5<28.0
pH6.0–9.0
TSSs mg·L−1≤25
DO mgO2·L−150% ≥ 9.0  100% ≥ 7.050% ≥ 7.0  100% ≥ 7.0
BOD5 mgO2·L−1≤3.0≤6.0
TP mg·L−1≤0.2≤0.4
N-NO2 mg·L−1≤0.01≤0.03
N-NH4 mg·L−1≤1.0
Regulation of the Ministry of Infrastructure
Indicator name, unitThe threshold value for water quality class
IIIIII–V
Indicators characterizing oxygen conditions and organic pollution
DO mgO2·L−1≥8.5≥7.5Not classified—nc
BOD5 mgO2·L−1≤3.0≤3.8
Indicators characterizing salinity
Conductivity in 20 °C µS·cm−1≤360≤480Not classified—nc
Indicators characterizing biogenic conditions
N-NH4 mg·L−1≤0.12≤0.30Not classified—nc
TP mg·L−1≤0.10≤0.30
Table 5. Long-term mean values (4 years), standard deviation (±SD), and observed minimum and maximum values of water quality indicators in the studied rivers.
Parameter
River
Temp.
°C
pHConductivity
µS·cm−1
TSSs
mg·L−1
DOBOD5
mgO2·L−1
Mołstowa9.1 ± 4.3 a7.5 ± 0.6 bcd161 ± 28 a I57 ± 56 bd9.4 ± 1.6 b I2.6 ± 1.3 bcd I
min–maxmin–maxmin–maxmin–maxmin–maxmin–max
2.5–17.96.6–8.1121–2342–3186.3–11.50.2–5.0
Ukleja9.3 ± 5.8 a7.6 ± 0.5 bd201 ± 48 b I41 ± 25 ae9.4 ± 2.1 b I2.8 ± 1.0 b I
min–maxmin–maxmin–maxmin–maxmin–maxmin–max
0.3–21.56.5–8.1114–3814–1044.9–13.80.6–5.2
Gardominka9.1 ± 4.9 a7.2 ± 0.5 a187 ± 42 b I18 ± 14 a6.8 ± 2.5 ac nc2.0 ± 0.8 ac I
min–maxmin–maxmin–maxmin–maxmin–maxmin–max
1.3–17.96.1–7.7143–3012–581.9–10.60.7–3.7
Rekowa8.4 ± 3.7 a7.3 ± 0.5 ac153 ± 22 a I26 ± 35 ac6.0 ± 1.9 a nc1.8 ± 0.9 a I
min–maxmin–maxin-maxmin–maxmin–maxmin–max
2.3–13.86.4–7.7112–1892–1593.1–8.90.6–3.8
Piaskowa9.4 ± 4.1 a7.6 ± 0.4 bd205 ± 23 b I67 ± 50 bd8.8 ± 1.8 b I2.3 ± 0.9 ac I
min–maxmin–maxmin–maxmin–maxmin–maxmin–max
1.1–15.56.4–8.0163–2368–2245.2–12.00.7–4.6
Lubieszowa8.4 ± 4.5 a7.3 ± 0.5 ad190 ± 30 bc I41 ± 44 ad7.6 ± 2.0 cd II2.0 ± 1.1 ad I
min–maxmin–maxmin–maxmin–maxmin–maxmin–max
1.8–16.96.1–8.0141–2482–2302.9–11.10.7–3.9
Łoźnica8.3 ± 3.5 a7.7 ± 0.5 d210 ± 28 b I51 ± 28 bcde9.6 ± 1.2 b I2.1 ± 0.8 ad I
min–maxmin–maxmin–maxmin–maxmin–maxmin–max
2.2–14.56.6–8.1169–2496–1128.1–11.60.8–3.5
Brzeźnicka-Węgorza10.4 ± 6.7 a7.7 ± 0.5 d170 ± 23 ac I55 ± 36 bd9.1 ± 1.9 b I3.1 ± 1.4 b II
min–maxmin–maxmin–maxmin–maxmin–maxmin–max
0.4–22.96.5–8.3120–21514–1785.4–12.90.7–5.6
Sąpólna8.6 ± 4.3 a7.5 ± 0.5 bcde269 ± 64 d I54 ± 53 bd9.1 ± 1.6 b I2.4 ± 1.3 ab II
min–maxmin–maxmin–maxmin–maxmin–maxmin–max
2.0–16.96.5–8.0146–4094–2085.4–11.60.7–5.6
p0.7980.00800.00400.001
Table 6. Long-term mean values (4 years), standard deviation (± SD), and observed ranges (min–max) of water quality parameters in the studied rivers.
Parameter
River
TPNO2-NNH4-NAlkalinity
mgCaCO3·L−1
Total Hardness
mgCO32−·L−1
Chlorides
mgCl·L−1
mg·L−1
Mołstowa0.089 ± 0.036 abc I0.020 ± 0.013 bc0.064 ± 0.042 a I161.2 ± 27.9 a229.1 ± 28.8 ab25.8 ± 6.8 a
min–maxmin–maxmin–maxmin–maxmin–maxmin–max
0.047–0.2460.005–0.0650.017–0.193110.0–195.0165.0–285.014.2–46.2
Ukleja0.092 ± 0.050 abc I0.015 ± 0.007 ac0.049 ± 0.041 a I181.7 ± 22.5 b225.5 ± 41.0 ab33.7 ± 9.7 ab
min–maxmin–maxmin–maxmin–maxmin–maxmin–max
0.021–0.2970.005–0.0320.007–0.229111.5–230.087.5–276.014.2–56.8
Gardominka0.058 ± 0.017 a I0.015 ± 0.009 ac0.054 ± 0.065 a I167.6 ± 19.9 a231.7 ± 27.1 ab35.3 ± 6.1 b
min–maxmin–maxmin–maxmin–maxmin–maxmin–max
0.033–0.0870.005–0.0400.012–0.252122.0–225.0185.0–295.028.4–49.7
Rekowa0.083 ± 0.025 abc I0.012 ± 0.012 a0.064 ± 0.029 a I161.0 ± 27.8 a227.7 ± 27.8 ab25.8 ± 5.9 a
min–maxmin–maxmin–maxmin–maxmin–maxmin–max
0.050–0.1440.003–0.0490.020–0.123109.0–179.5192.5–275.017.8–39.1
Piaskowa0.081 ± 0.041 abc I0.013 ± 0.005 a0.077 ± 0.052 ab I185.7 ± 14.6 c238.5 ± 31.9 ab32.1 ± 13.7 ab
min–maxmin–maxmin–maxmin–maxmin–maxmin–max
0.025–0.1980.004–0.0230.02–0.166170.0–230.0120.0–257.517.8–95.9
Lubieszowa0.109 ± 0.056 c II0.013 ± 0.005 a0.050 ± 0.045 a I198.2 ± 19.9 c244.5 ± 18.5 b32.2 ± 13.4 ab
min–maxmin–maxmin–maxmin–maxmin–maxmin–max
0.053–0.3130.005–0.0290.024–0.269154.0–235.0217.5–286.317.8–71.0
Łoźnica0.104 ± 0.022 c I0.016 ± 0.004 ac0.043 ± 0.024 a I222.6 ± 23.8 d260.4 ± 41.3 cd26.4 ± 7.4 a
min–maxmin–maxmin–maxmin–maxmin–maxmin–max
0.06–0.1290.011–0.0250.009–0.094254.0–184.0270.0–322.514.2–39.1
Brzeźnicka-Węgorza0.065 ± 0.038 ab I0.014 ± 0.008 ac0.075 ± 0.046 ab I191.3 ± 18.1 bc220.8 ± 36.5 a24.7 ± 7.3 a
min–maxmin–maxmin–maxmin–maxmin–maxmin–max
0.022–0.2200.001–0.0410.016–0.203161.0–235.0102.5–252.514.2–42.6
Sąpólna0.173 ± 0.150 d II0.026 ± 0.018 d0.111 ± 0.133 b I197.8 ± 24.7 c259.3 ± 23.6 cd59.5 ± 32.1 c
min–maxmin–maxmin–maxmin–maxmin–maxmin–max
0.044–0.6760.016–0.1010.014–0.699152.5–245.0220.0–300.024.9–127.8
p000.001000
Explanations: a–e—The averages in columns marked with different upper indices are statistically significantly different at p < 0.05 (Duncan’s test). Classification of water according to the Regulation of the Minister of Infrastructure dated 25 June 2021—Class I, Clas II, NC—no class. Classification of water according to Directive 2006/44/EC of the European Parliament and of the Council of 6 September 2006—blue color represents waters meeting the conditions for the life of salmonid fish, green represents waters meeting the conditions for the life of cyprinid fish; red indicates waters not meeting the requirements for the life of cyprinid fish.
Table 7. Loadings of principal components (PC1 and PC2) for the analyzed water quality indicators.
IndicatorLoading Values
PC1PC2
T−0.160.71
pH−0.13−0.60
TSSs−0.080.04
DO−0.05−0.83
BOD50.07−0.51
NH4+-N−0.610.15
NO2-N−0.690.05
TP−0.750.27
EC−0.77−0.09
Alc.−0.46−0.24
TH−0.34−0.52
Cl−0.75−0.01
Table 8. Pearson correlation coefficients (r) for relationships among water quality parameters in the studied rivers.
TpHTSSsDOBOD5NH4+-NNO2-NTPECAlc.TH
pH−0.17 *
TSS−0.01−0.05
DO−0.58 *0.41 *0.17 *
BOD5−0.18 *0.140.030.45 *
NH4+-N0.03−0.040.17 *−0.04−0.03
NO2-N0.150.150.130.05−0.050.51 *
TP0.28 *−0.020.19 *−0.07−0.130.43 *0.40 *
EC0.04−0.040.030.14−0.020.29 *0.38 *0.47 *
Alc.0.150.29−0.22 *0.09−0.01−0.000.070.25 *0.41 *
TH−0.29 *0.26−0.100.19 *0.010.050.15−0.040.27 *0.36 *
Cl0.020.02−0.08-0.030.020.34 *0.38 *0.51 *0.54 *0.22 *0.25 *
Statistically significant correlations at * p < 0.05.
Disclaimer/Publisher’s Note: The statements, opinions and data contained in all publications are solely those of the individual author(s) and contributor(s) and not of MDPI and/or the editor(s). MDPI and/or the editor(s) disclaim responsibility for any injury to people or property resulting from any ideas, methods, instructions or products referred to in the content.

