Article

Deep Learning-Based Layout Analysis Method for Complex Layout Image Elements

School of Packaging Engineering, Hunan University of Technology, Zhuzhou 412007, China
*
Author to whom correspondence should be addressed.
Appl. Sci. 2025, 15(14), 7797; https://doi.org/10.3390/app15147797
Submission received: 9 May 2025 / Revised: 4 July 2025 / Accepted: 7 July 2025 / Published: 11 July 2025
(This article belongs to the Special Issue Engineering Applications of Hybrid Artificial Intelligence Tools)

Abstract

Featured Application

A specific application of this work is an automated design element segmentation tool for converting complex graphic designs, such as movie posters, into editable layered formats. By leveraging the improved DeepLabv3+ model, the tool can accurately identify and segment text, images, logos, and other layout elements within a raster image (e.g., JPEG/PNG). This enables designers to automatically generate structured, layered files (e.g., PSD) for efficient editing, adaptation to different formats (e.g., social media, print), or trend analysis. The model’s reduced computational demands and enhanced accuracy make it suitable for integration into design software, streamlining workflows, and reducing manual effort in reverse-engineering layouts.

Abstract

The layout analysis of elements is indispensable in graphic design, as effective layout design not only facilitates the delivery of visual information but also enhances the overall esthetic appeal to the audience. The combination of deep learning and graphic design has gradually turned into a popular research direction in graphic design in recent years. However, in the era of rapid development of artificial intelligence, the analysis of layout still requires manual participation. To address this problem, this paper proposes a method for analyzing the layout of complex layout image elements based on the improved DeepLabv3++ model. The method reduces the number of model parameters and training time by replacing the backbone network. To improve the effect of multi-scale semantic feature extraction, the null rate of ASPP is fine-tuned, and the model is trained by self-constructed movie poster dataset. The experimental results show that the improved DeepLabv3+ model achieves a better segmentation effect on the self-constructed poster dataset, with MIoU reaching 75.60%. Compared with the classical models such as FCN, PSPNet, and DeepLabv3, the improved model in this paper effectively reduces the number of model parameters and training time while also ensuring the accuracy of the model.

1. Introduction

At this stage, artificial intelligence has developed into the intersection of many disciplines such as cognitive science, psychology, art, and computer science [1,2]. With the development of deep learning and neural networks, more and more researchers combine them with design, such as intelligent image color matching and intelligent image quality evaluation [3,4]. And the complex layout images obtained from text, graphics, images, and other layout elements through the process of artistic design, pre-press processing, typesetting and so on are widely used in packaging, posters, book binding, and so on [5,6]. At present, the study of complex layout images is only for simple document images, and there are few reports on the design of complex layout images. Therefore, there is an urgent need for more scientific, intelligent, and highly accurate methods and techniques for analyzing the layout of complex layout images.
Compared with such complex images as posters, document images, newspapers, and other complex images have a single background and neatly arranged text, graphics, tables and other foregrounds. Currently, most domestic and international research on complex layout image analysis focuses on document images, newspapers, and similar structured materials, while relatively few studies have addressed layout analysis in traditional poster designs, brochures, and other visual media. Traditional layout analysis can be roughly categorized into three approaches: top-down approach [7]; bottom-up approach [8]; hybrid approach [9]. Amidst the rise of neural networks, a number of researchers have combined layout analysis with computers, deep learning, neural networks, and other techniques to explore complex layout image analysis [10]. Wu et al. [11] proposed a method for document image layout analysis with explicit edge embedding networks, which exploits the model to overcome the data scarcity by using an integrated document approach compared to the traditional methods. Guo et al. [12] proposed a design space to describe the design elements in advertising posters and introduced a design sequence to rationalize the design decisions of human designers in creating posters. There is still much room for research in the field of combining visual communication design images with deep learning techniques.
The central question of this research is how to perform automatic layout design through artificial intelligence. The first step towards enabling automatic layout design with AI is to parse and recognize the constituent components of the layout. As suggested in previous work [13], this study adopts deep learning techniques to accurately locate and classify layout elements in complex visual designs such as movie posters. The presence of different foregrounds and complex graphical backgrounds in natural images like movie posters and the text in the images with various, colors, sizes, orientations, and textures make it even more challenging to perform an image layout analysis for complex layout images like movie posters.
Aiming at the problem of difficulty in analyzing the layout of visual communication images, this paper takes movie posters as the research object and carries out the construction of movie poster dataset. Based on the improved DeepLabv3+ network model, the segmentation and recognition of text, theme and graphic regions of movie posters were performed. Finally, according to the layout segmentation results, the positional relationship of the theme area, text area and graphic area is analyzed, and the layout analysis of the movie poster is performed using the GoogLeNet image classification network model.
In summary, this study proposes a two-stage approach for analyzing complex movie poster layouts. An improved DeepLabv3+ model with a lightweight backbone and optimized ASPP is used for accurate element segmentation, and a GoogLeNet-based classifier is employed to determine layout types. A high-resolution annotated dataset of 2300 posters is also constructed to support the experiments.
The rest of this paper is organized as follows: Section 2 introduces the layout types of movie posters. Section 3 presents the proposed segmentation method. Section 4 describes dataset construction and training details. Section 5 provides experimental results and analysis. Section 6 concludes the paper.

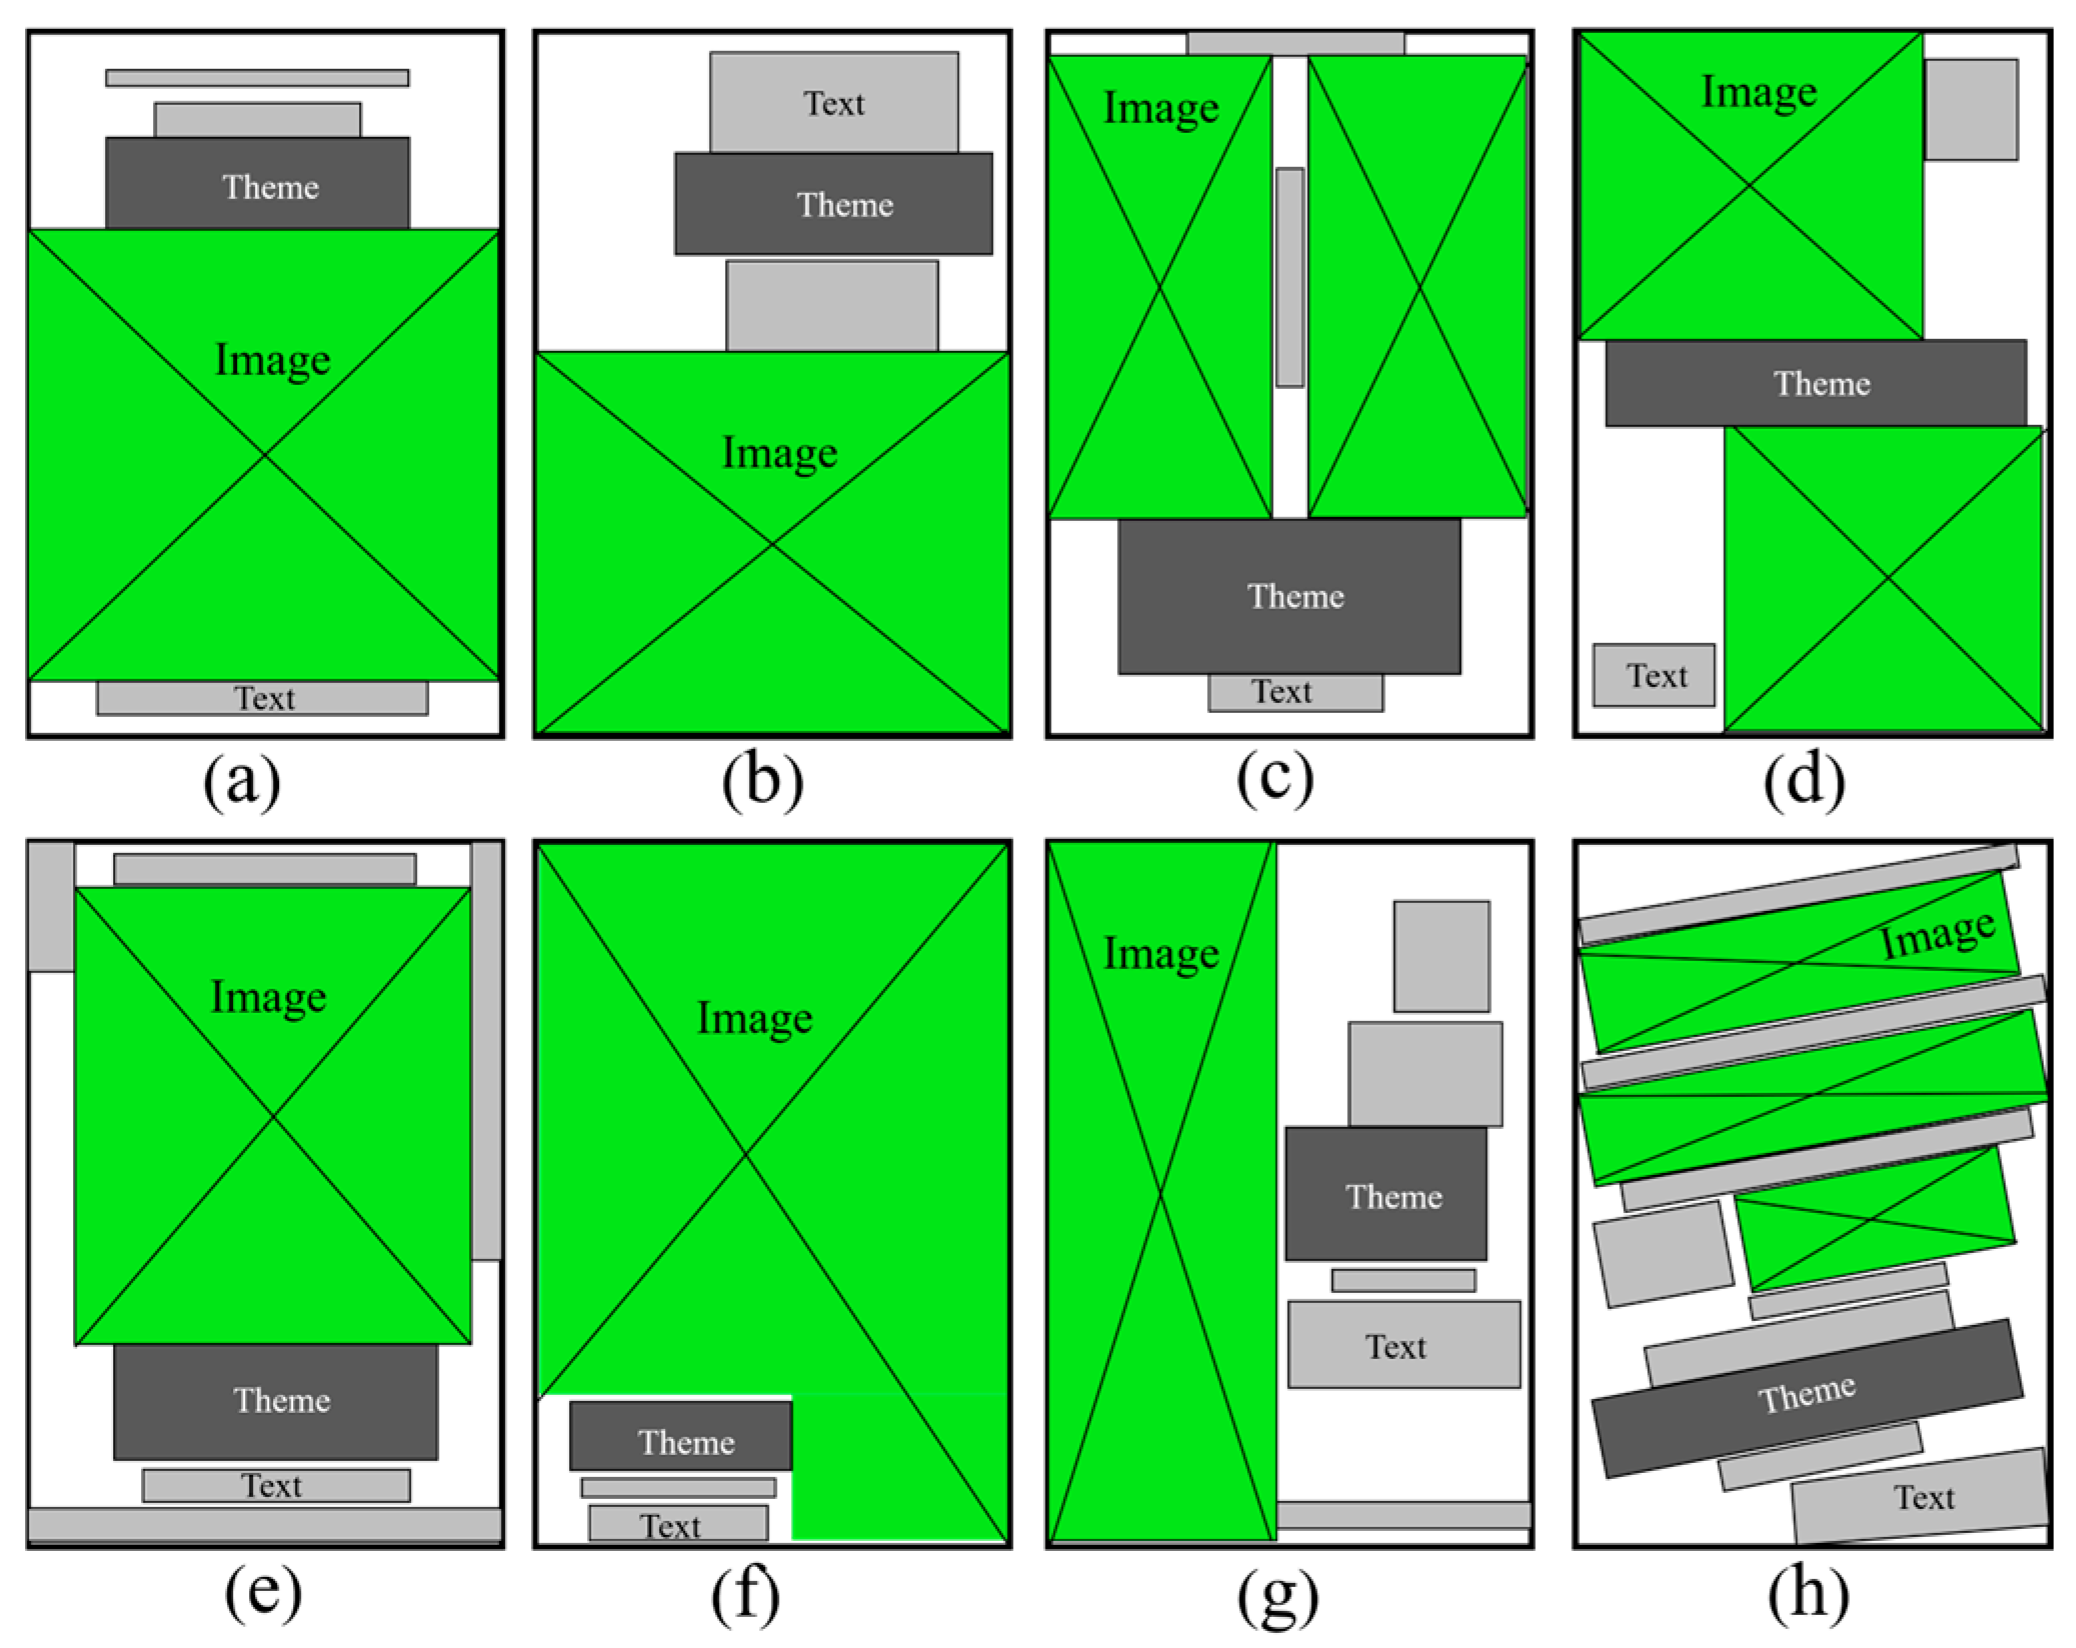
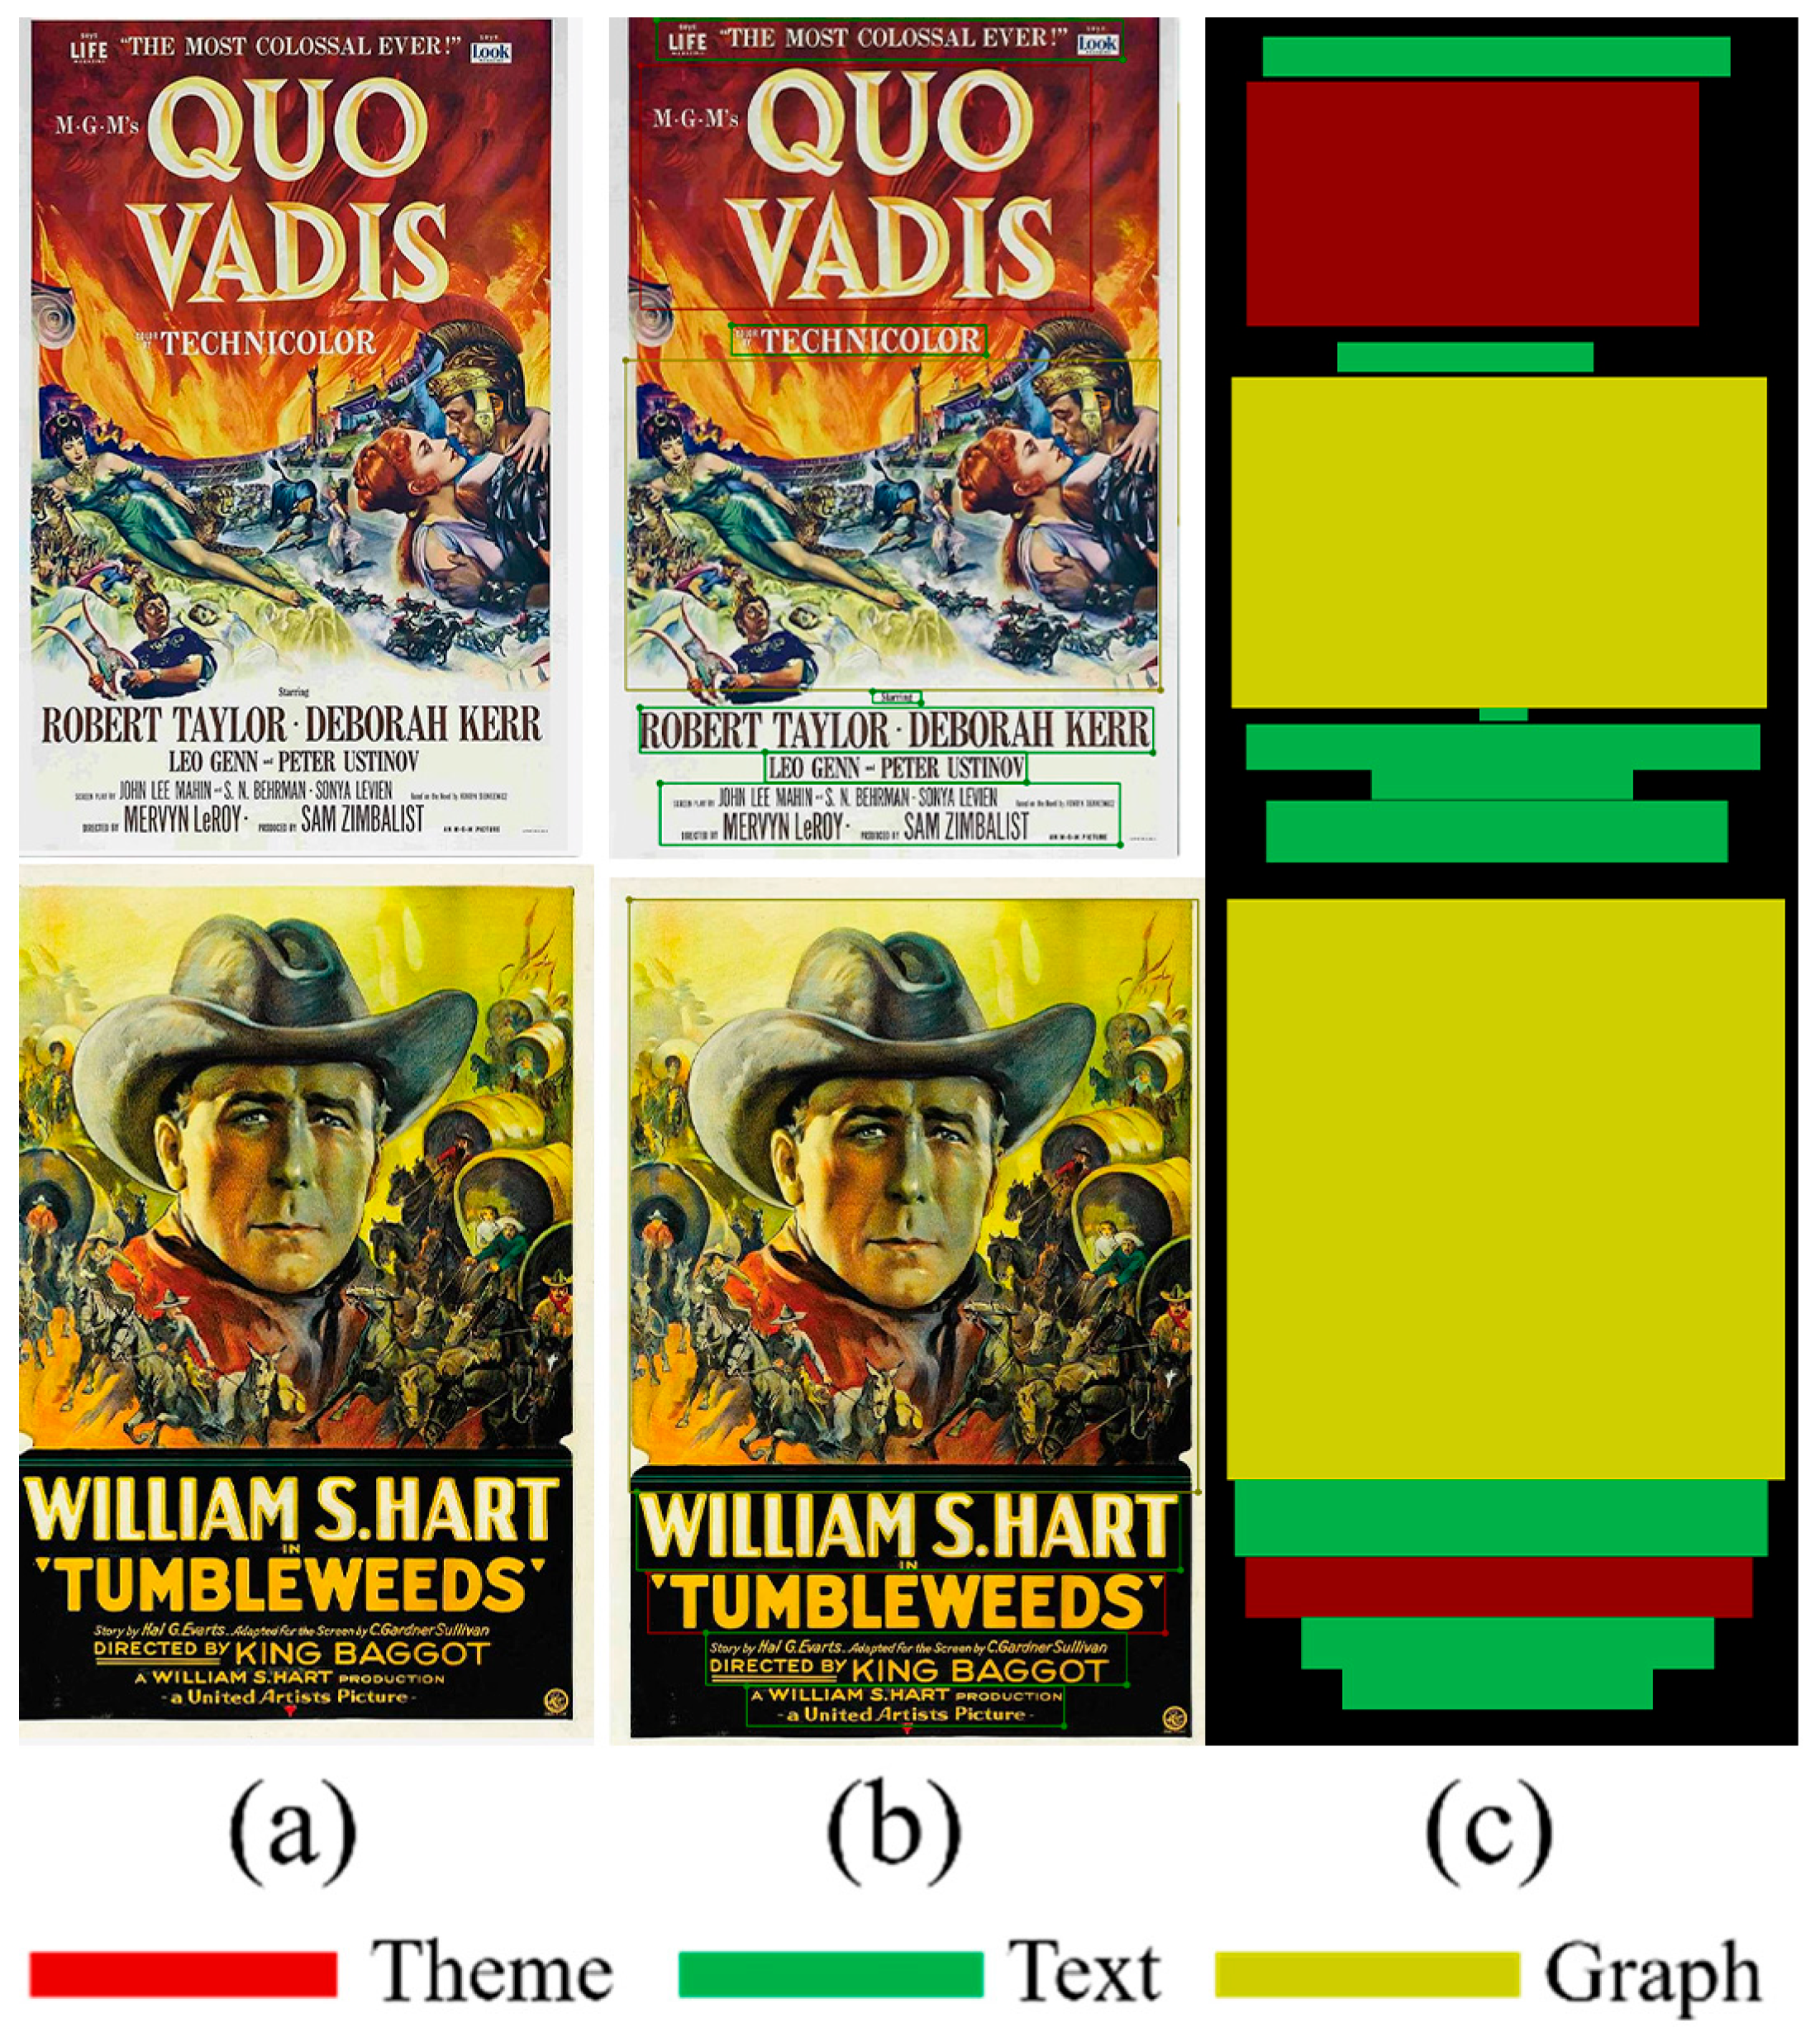
2. Film Poster Composition Layout Method

At present, there is no uniform view in the academic world on the compositional layout of film posters, so there are various methods of classification. This study combines the existing rules of poster layout design composition and typography, and summarizes film poster images into the following eight commonly used types: centered layout, split layout, symmetrical layout, diagonal layout, wraparound layout, full-screen layout, axial layout, inclined layout, and other compositional layouts.
Centered layout will be the main elements in a centrally aligned manner, can quickly attract the eye to occupy the visual focus, as shown in Figure 1a. The split layout arranges the poster in an asymmetrical structure with the figure above the text below and the figure below the text above, ensuring a balanced and stable picture and forming a sharp contrast, as shown in Figure 1b. The symmetrical layout arranges the main elements in a symmetrical manner relative to the central axis, visually giving a feeling of rigor and rationality, as shown in Figure 1c. The diagonal layout distributes the main elements of the poster in opposite corners, adding an unstable variation that can bring a visual impact, as shown in Figure 1d. The surrounding layout is generally a graphic surrounded by text, its composition form is fuller, more information, as shown in Figure 1e. The full-screen layout is mainly graphics to support the entire layout, supplemented by text, visually give people an intuitive and strong feelings, as shown in Figure 1f. The axis layout is dominated by a hidden axis, arranging the main elements in a hidden axis to break the limitations of a centered layout and make the layout appear less dull, as shown in Figure 1g. The tilt layout mainly arranges the main elements of the poster in a tilted manner, giving a sense of visual motion and instability, as shown in Figure 1h. In practical examples, it is difficult for some posters to generalize and define the characteristics of a layout, and it may be difficult to fit into a certain layout classification. In order to simplify the analysis, this study categorizes posters that are disorganized, free-layout posters, or posters that are laid out in other layout styles within the Other Layout category. The first eight ways encompass most of the current ways of laying out a film poster.

3. Film Poster Layout Segmentation Method Based on Improved DeepLabv3+

3.1. Relevant Model Theory

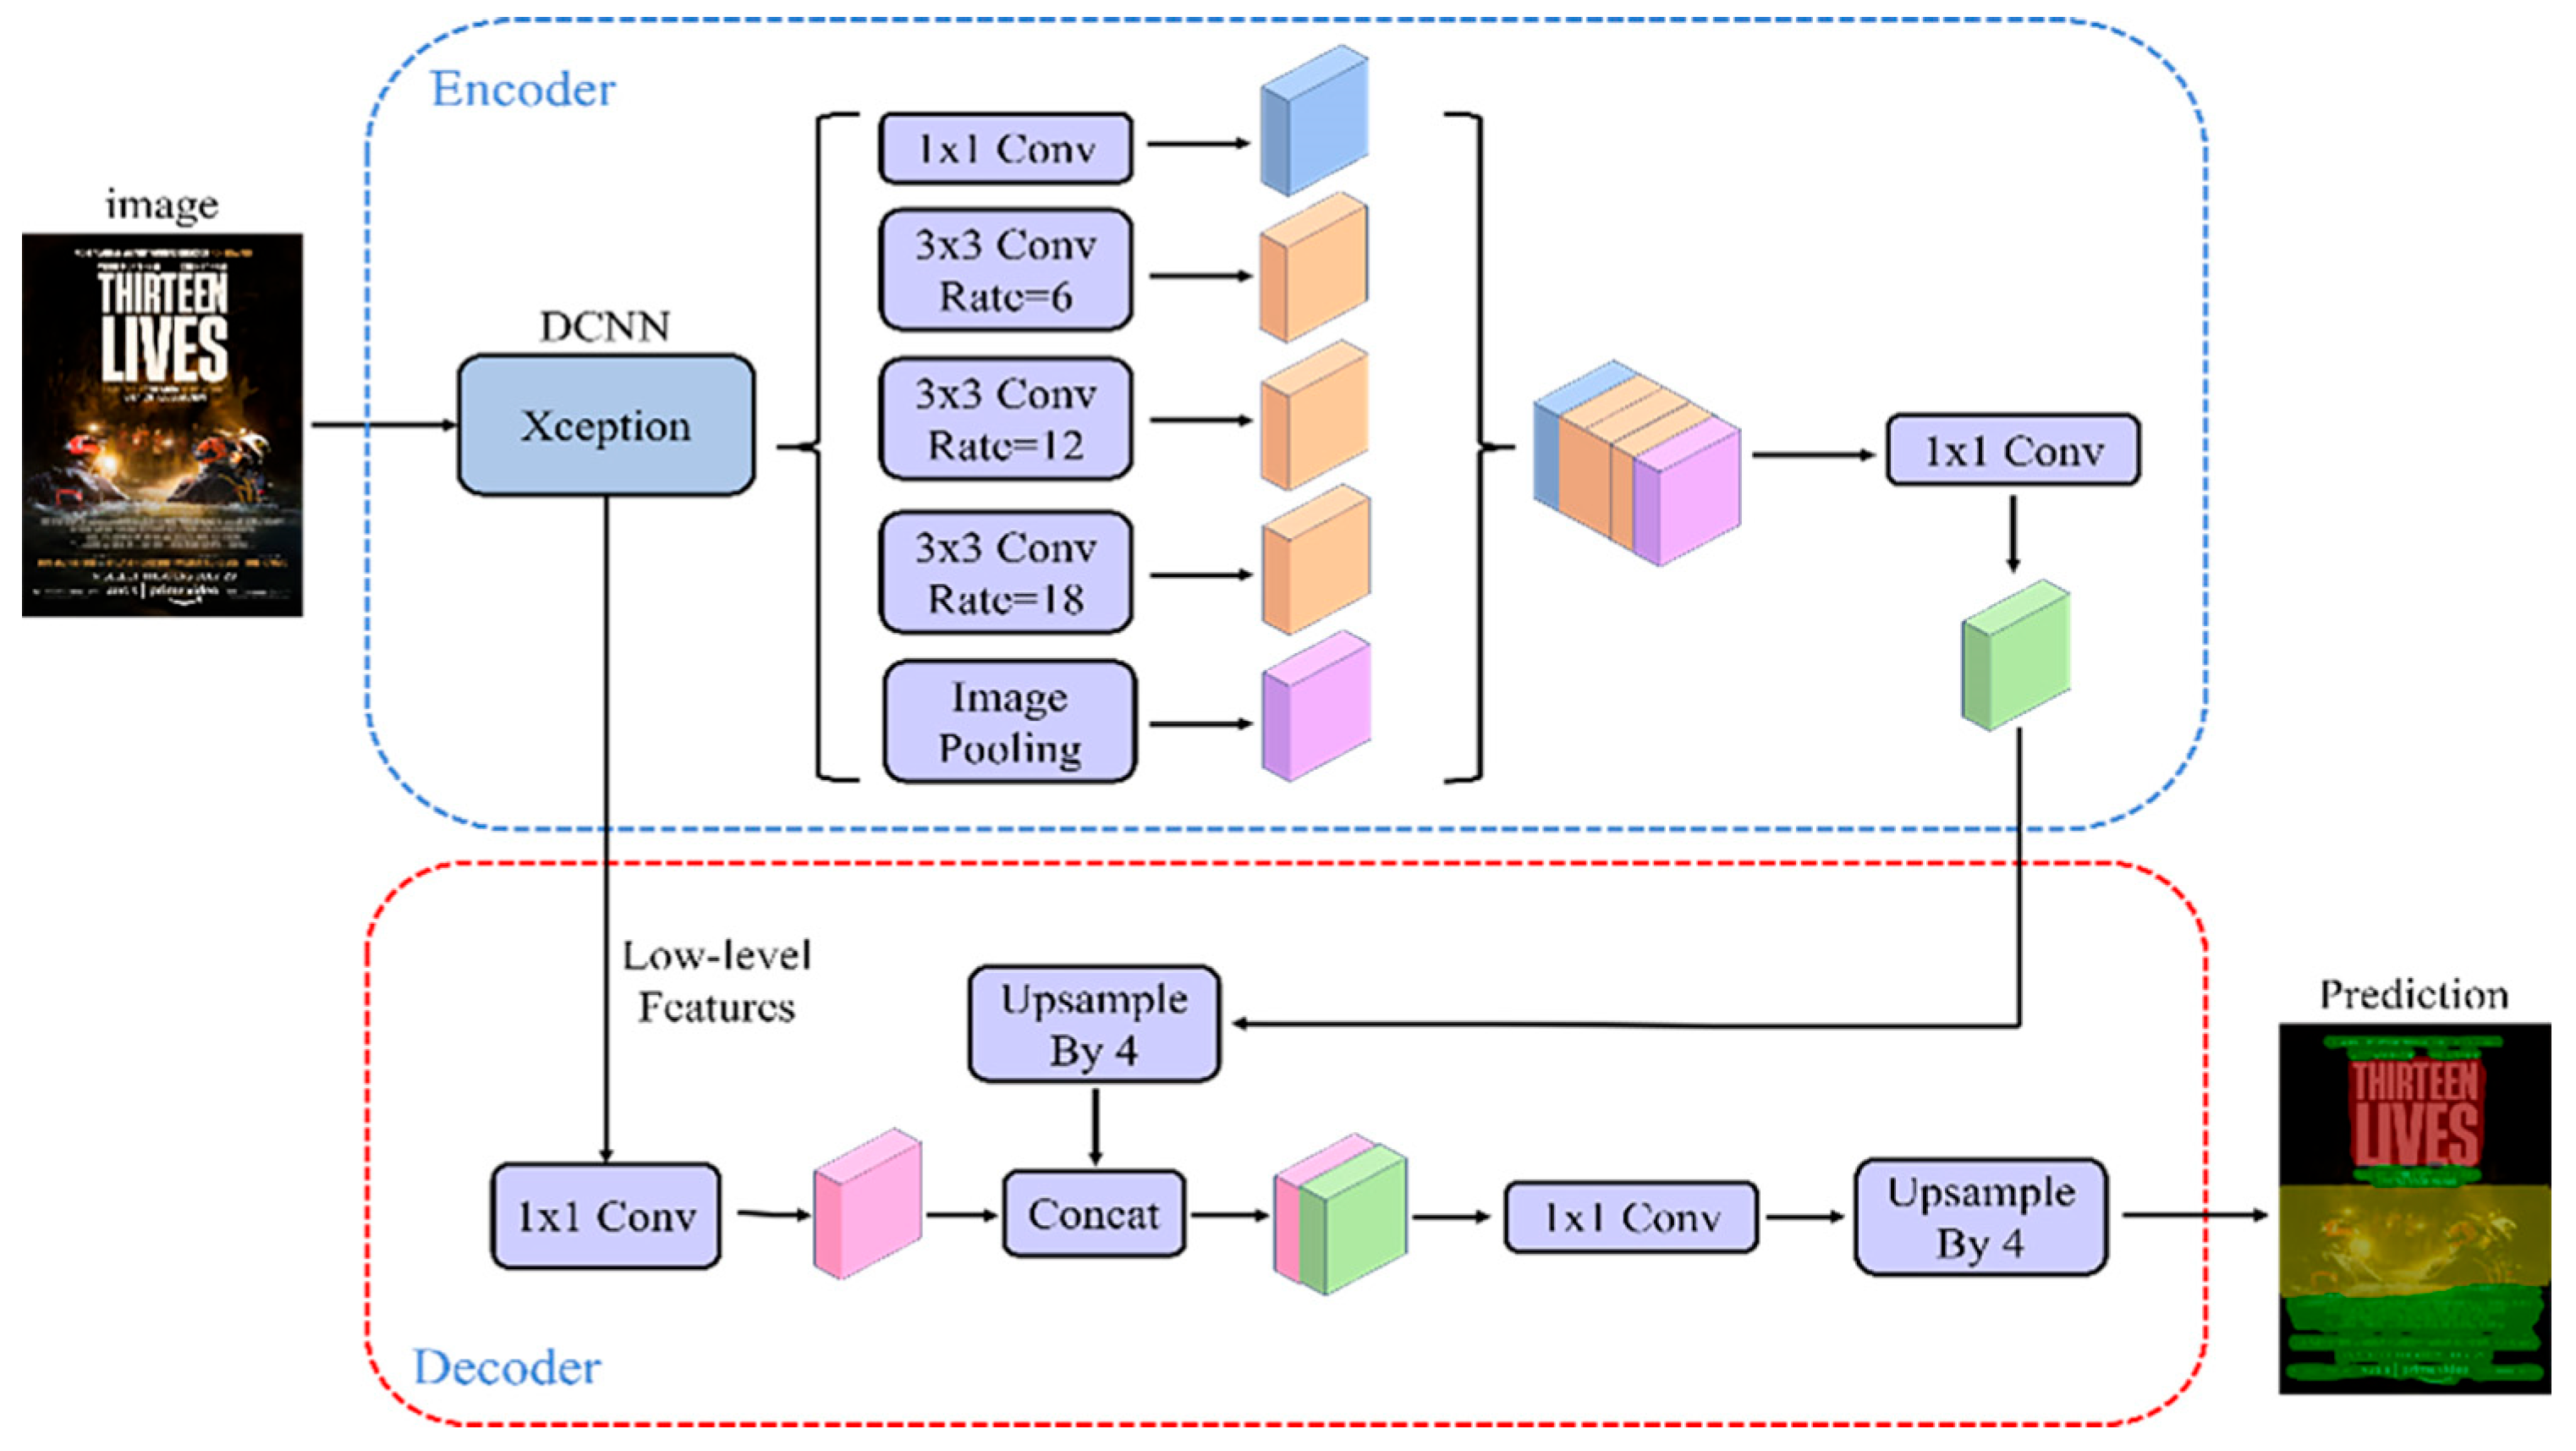
3.1.1. DeepLabv3+ Base Model

DeepLabv3+ (Rethinking Atrous Convolution for Semantic Image Segmentation) is a semantic segmentation based on Atrous Spatial Pyramid Pooling (ASPP) module proposed by Google team in 2019 network [14], and the model is widely used in various image semantic segmentation tasks. The model introduces a decoder structure based on DeepLabv3 [15], which further fuses the underlying features with the higher-level features to improve the segmentation boundary accuracy. The overall architecture of the DeepLabv3+ model is shown in Figure 2, and the main body of its encoder is the DCNN with cavity convolution, which uses Xception [16]. The model introduces the cavity convolution, which increases the sensory field without loss of information, so that each convolution output contains a larger range of information.
The algorithm effectively expands the network sensory field and captures a wide range of contextual information to improve the segmentation accuracy of the image through the cavity convolution in the ASPP module. The equivalent convolution kernel K of the cavity convolution is formulated as follows:
K = k + k 1 r 1
where k is the original convolutional kernel size, and r is the null rate.
As the backbone feature extraction network extracts both low-order and high-order features, the high-order features capture information at multiple scales. The parallel features are then fused to form a semantic-rich feature map, and the number of channels is adjusted using a 1 × 1 convolution. This is followed by fusion with low-order features through the upsampling operation in the decoder, and finally, a 3 × 3 convolution and another upsampling are applied to restore the original image size and produce the final segmentation result.

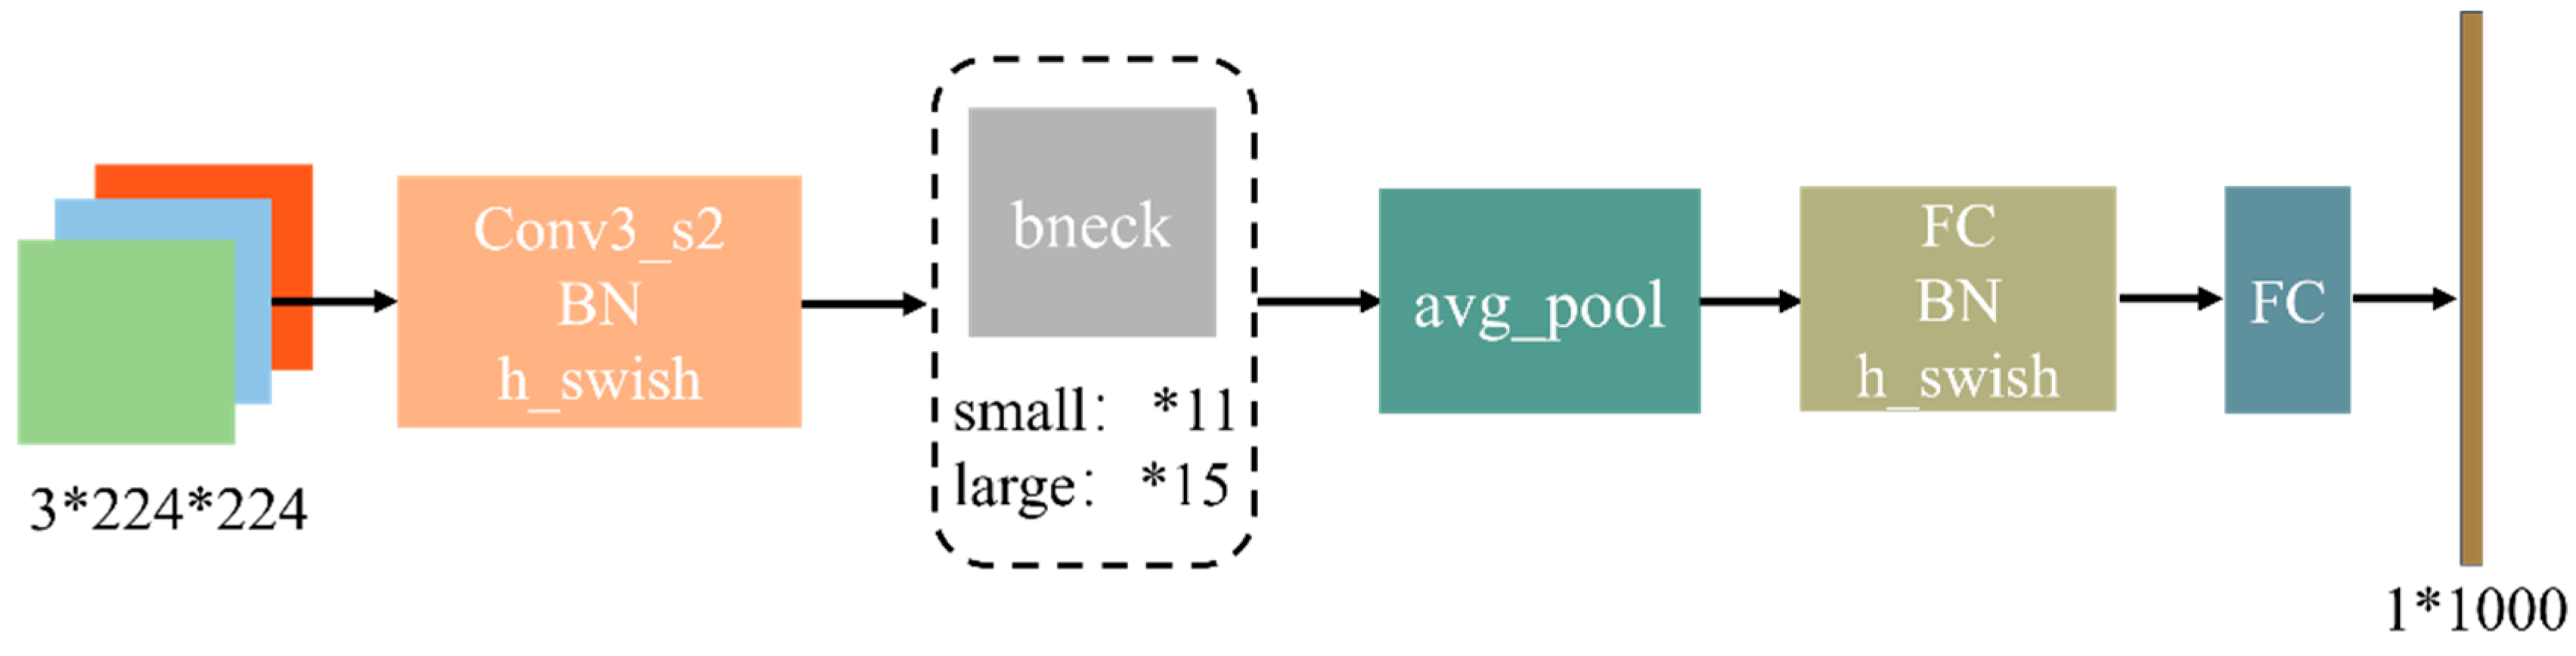
3.1.2. Mobilenetv3 Network

Mobilenetv3, proposed by Howard et al. [17], is a lightweight convolutional neural network, which has been accumulated from two generations of networks, Mobilenetv1 and Mobilenetv2, retaining the deep separable convolution of Mobilenetv1 and the inverted residual linear bottleneck block of Mobilenetv2, while improving the model structure to reduce the amount of parameters and training time. Mobilenetv3 builds on v2 by adding the Squeeze and Excitation (SE) block attention mechanism to the Bottleneck block, replacing the ReLU6 function with hard-swish and the sigmoid function with hard sigmoid, and redesigning the structure of the time-consuming layer of the network. The overall structure of the time-consuming layer of the network is shown in Figure 3, in which the structure of the small and large versions is basically the same, and the only difference lies in the number of basic units (bneck) and the internal parameters, which are mainly reflected in the difference in the number of channels.

3.1.3. GoogLeNet Network

In order to avoid the problems of slow network training convergence, long training time, and susceptibility to gradient vanishing and gradient explosion, the Google team proposed the GoogLeNet network in 2014, which won the first place in the classification task in the ImageNet competition that year [18]. This network introduces the Inception structure in order to fuse feature information at different scales. It uses a 1 × 1 convolutional kernel for both dimensionality reduction and feature mapping. A global average pooling strategy is adopted instead of a fully connected layer to reduce the number of parameters. In addition, two auxiliary classifiers are added to assist training, which not only achieve model fusion and enhance gradient flow, but also add a back-propagated gradient signal and provide additional regularization to support network training. The model consists of 22 modular structures including a convolutional layer, 9 modular structures, a global average pooling layer, and an output layer. The network is mainly used in the fields of image classification and object recognition.

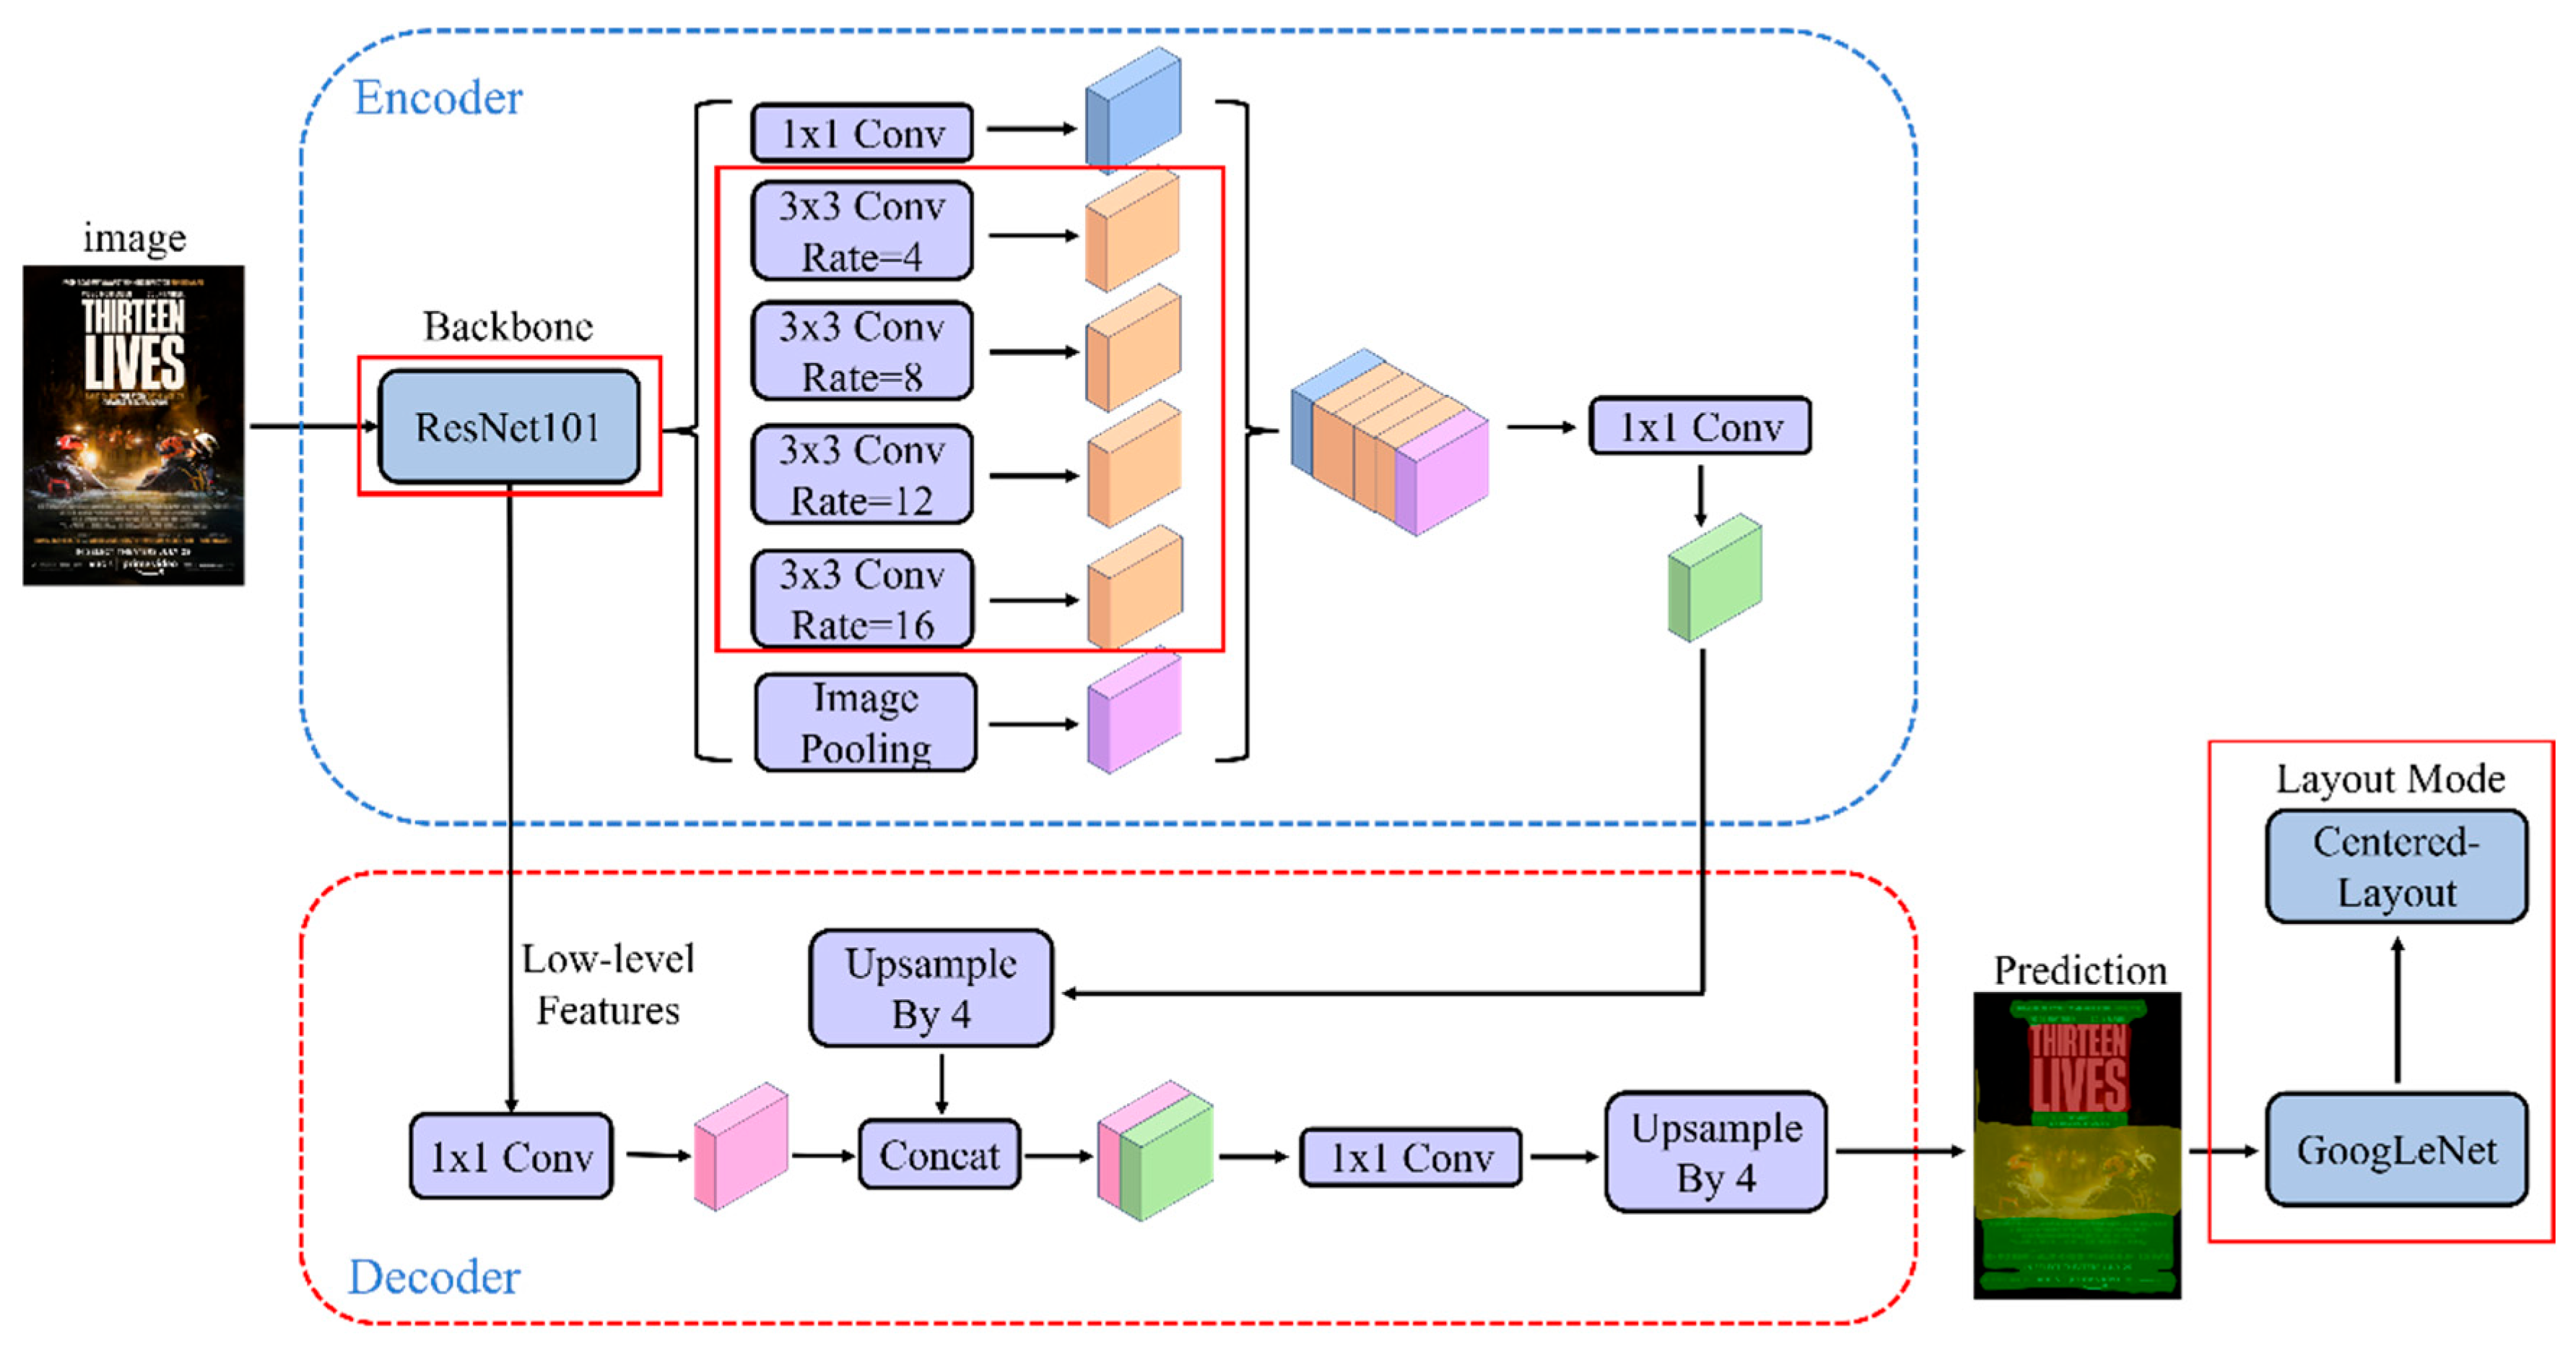
3.2. Improved DeepLabv3+ Network Models

In order to effectively extract the semantic information of movie posters at different scales, the DeepLabv3+ structure is used in this paper. The algorithmic model proposed in this paper is obtained by improving the DeepLabv3+ algorithmic model, which contains encoder and decoder modules. The encoder module contains the main body of the backbone network (DCNN) with null convolution as well as the ASPP (Null Spatial Convolutional Pooling Pyramid, Atrous Spatial Pyramid Pooling) module, in which the main body of DCNN adopts the improved Xception network with cavity convolution, which mainly adopts deep separable convolution, making its computational volume smaller. On this basis, the shallow features generated by the DCNN are utilized and fed into the decoder–encoder module, and the high semantic high-level features are fed into the decoder for up-sampling, followed by the fusion of the features using the results obtained by 1 × 1 convolution, the extraction of the features using 3 × 3 convolution, and the bilinear interpolation of the image to obtain segmentation predictions consistent with the image size.
Due to the more complex structure of the backbone network Xception in the original DeepLabv3+ model, this is more difficult for extracting smaller categories and textures in complex layout images, and when the network is extracting details and texture information, problems such as blurring and confusion may occur, resulting in the inability to continuously extract a particular category. In addition, the network has more parameters, is more computationally intensive, and takes longer to reason. In this paper, the lightweight Mobilenetv3-small network structure will be used as the feature extraction network, which has a reduced number of parameters relative to the Xception network, as well as a reduced number of computations and time required, thus increasing the speed of training and learning.
The combination of null rates for the ASPP module null convolution in the original DeepLabv3+ is 6, 12, and 18, and as the backbone network carries out feature extraction, the resolution of the feature maps decreases gradually, and the combination of 6, 12, and 18 cannot extract the features of the multi-resolution feature maps more efficiently because it does not set a smaller null rate, resulting in a lack of the ability to segment the small targets. In order to effectively extract the semantic information of complex layout images at different scales, the DeepLabv3+ structure is improved in this paper. In the improved DeepLabv3+ model, the original backbone network Xception is replaced by Mobilenetv3-small network, and at the same time two null convolution layers are added in the ASPP module. The null convolution null rate in the module is changed from a combination of 6, 12, and 18 to a combination of 2, 4, 8, 12, and 16, in order to be able to enhance the ability of the network model for the segmentation of different size categories in complex layout images. It is processed by two modules, the backbone network and ASPP, and transmitted to the decoder module, whose main structure remains unchanged. After the complex layout image processed by decoder module will output the predicted layout element segmentation, then the prediction result will be passed to the GoogLeNet classification model to classify the layout, and finally obtain the result prediction of the layout mode of the movie poster. The structure of the improved DeepLabv3+ model is shown in Figure 4.

4. Dataset and Model Training

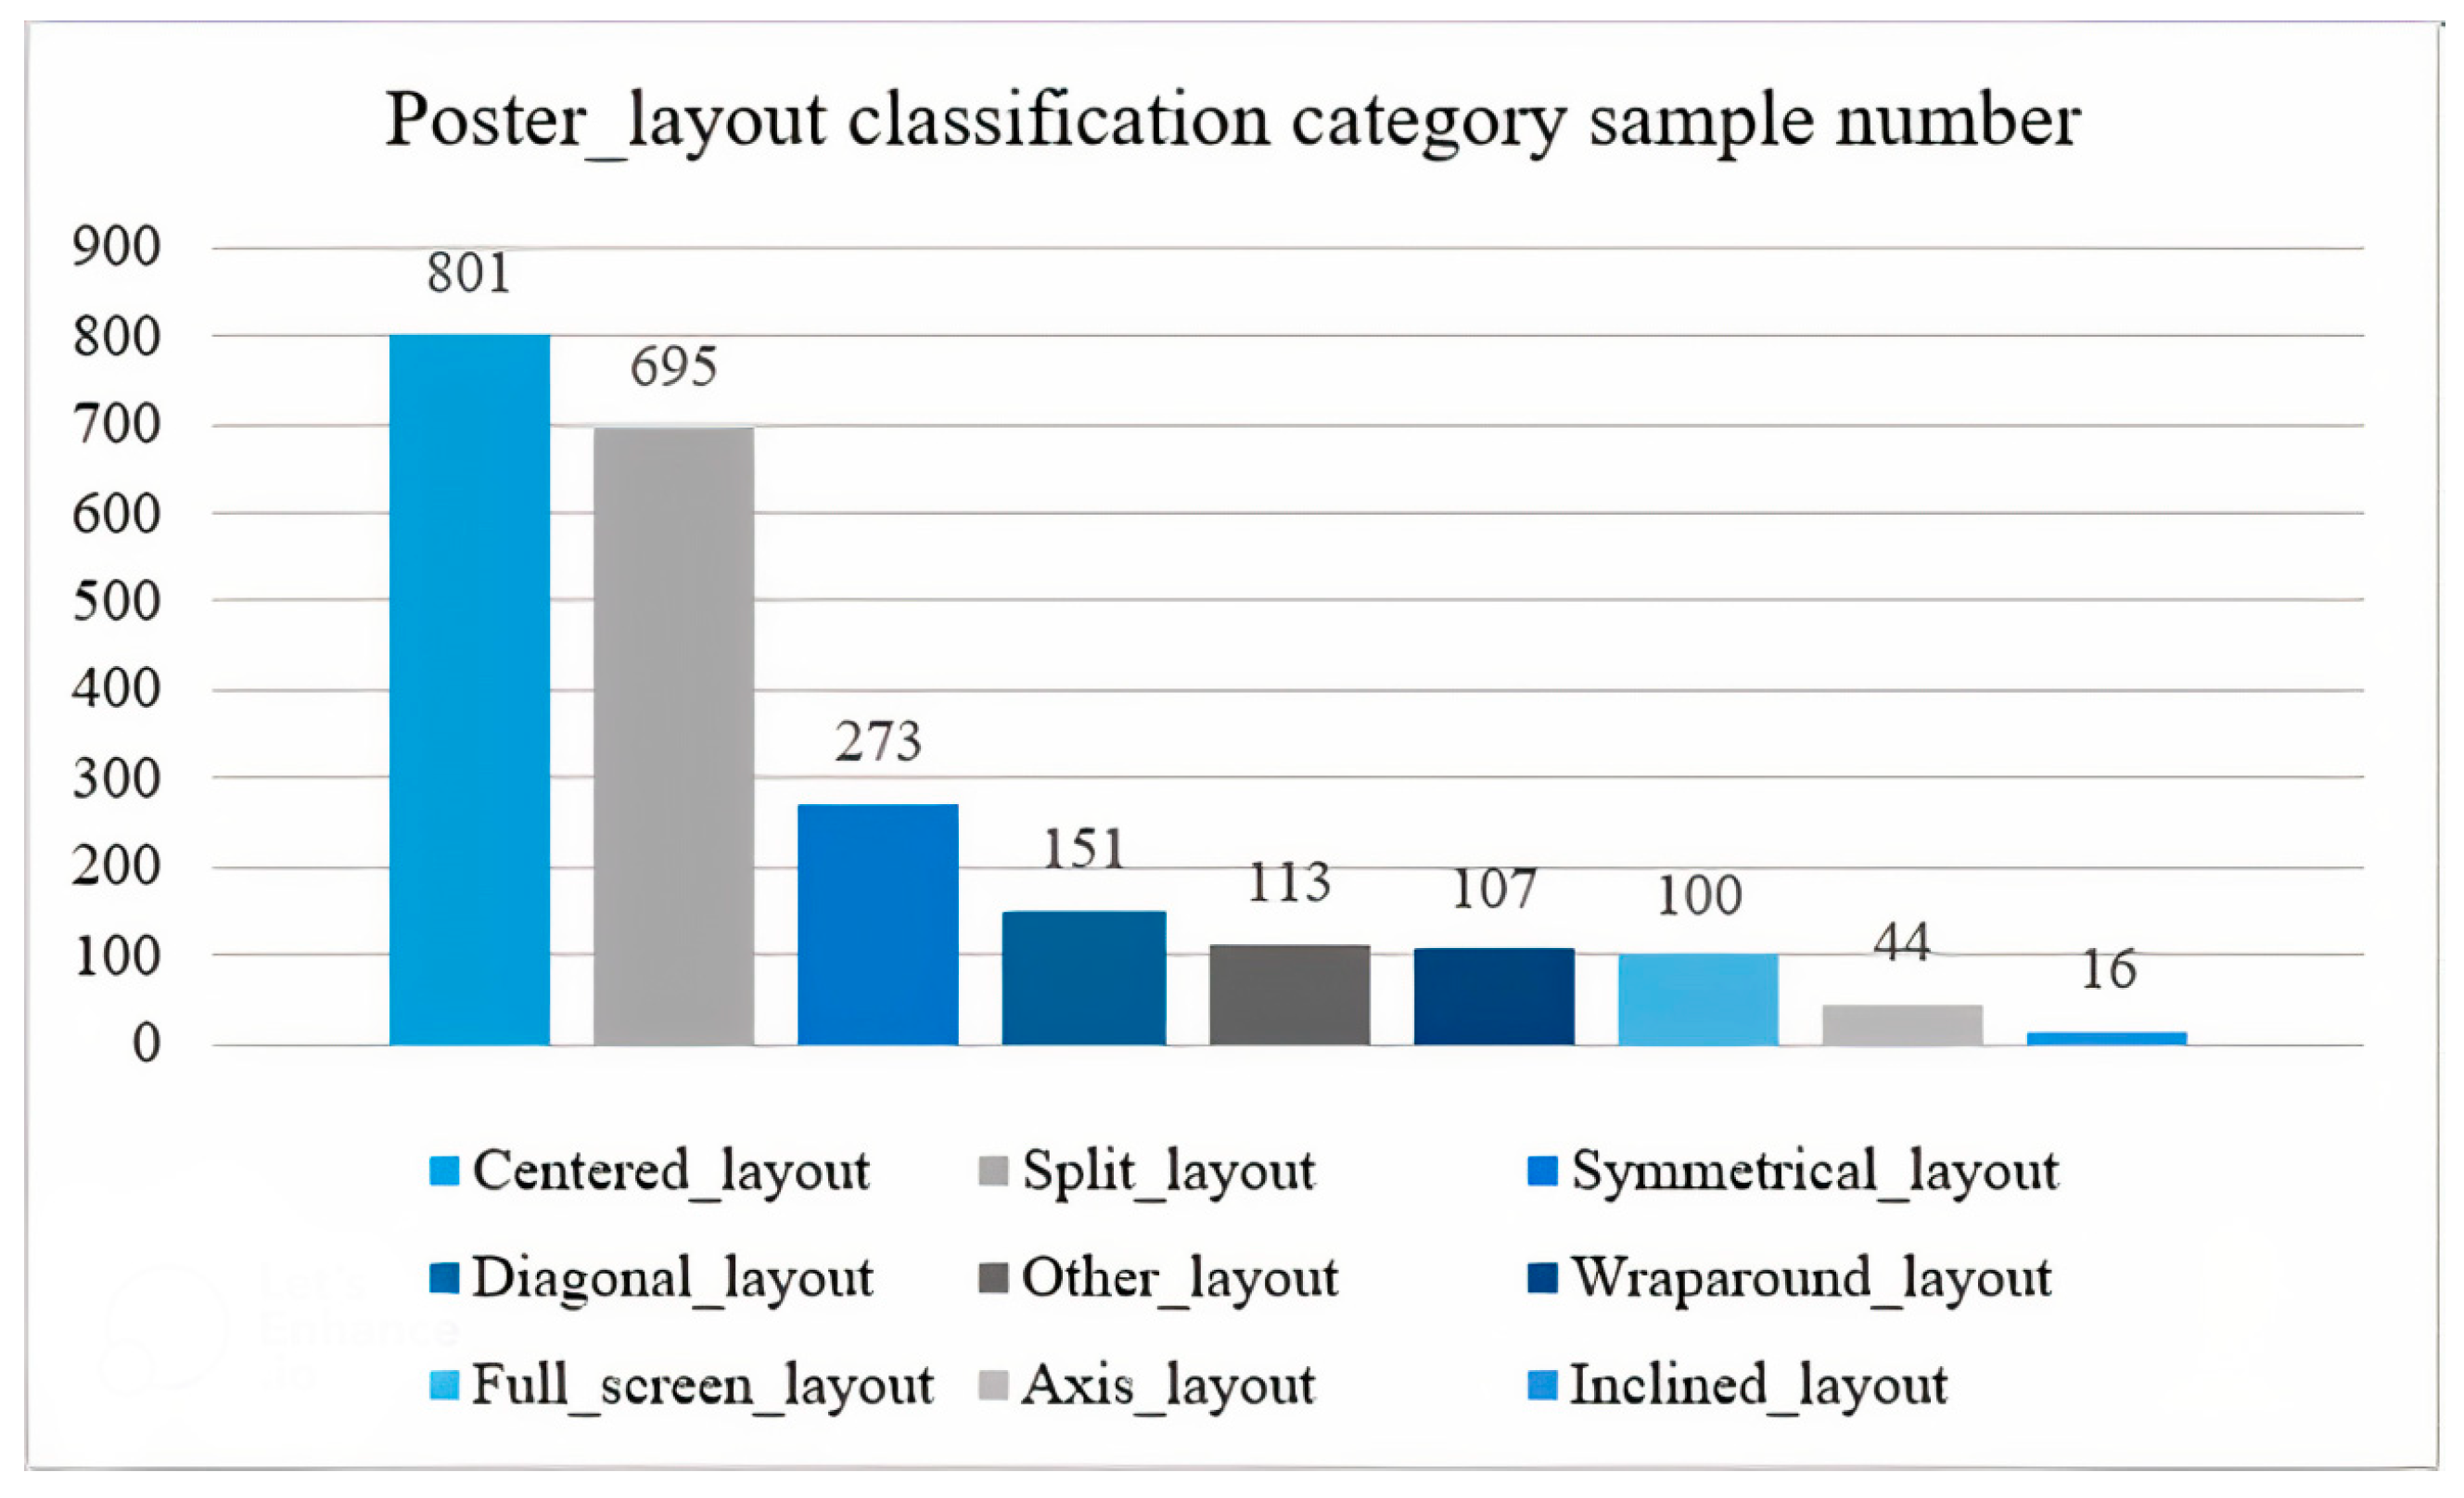
4.1. Dataset Production

In this study, the movie poster images were obtained from the IMP Awards (http://www.impawards.com/, accessed on 15 April 2025) and the Douban website (https://movie.douban.com/, accessed on 15 April 2025). The dataset contains 2300 high-resolution movie poster images, primarily in JPEG (.jpg) and PNG (.png) formats, with a minimum resolution of 505 × 755 pixels and a maximum resolution of 6889 × 9778 pixels. After completing the image sampling use the open source annotation software labelme (https://github.com/wkentaro/labelme, accessed on 15 April 2025) for manual annotation, where red is the subject class, green is the text class, and yellow is the graphic class. Figure 5 illustrates the annotation workflow using two example posters obtained from the public domain for demonstration purposes only. Figure 5b shows a sample annotation map generated with Labelme. For each annotated poster, a corresponding JSON file is automatically created, storing the polygon coordinates of the labeled regions along with essential image metadata. In total, 2300 JSON files were generated based on the annotated dataset used in this study. These files were then converted into a semantic segmentation dataset following the Pascal VOC 2012 format [19], using the official Labelme conversion script. The resulting segmentation mask, containing the three layout classes (theme, text, and graphic), is shown in Figure 5c.
The poster dataset is divided into training, validation, and test sets in the ratio of 7:2:1, with 1610 poster images in the training set, 460 poster images in the validation set, and 230 poster images in the test set. The training set is used to train the model parameters, the validation set is used for model hyperparameter tuning, and the test set is used to evaluate the model generalization ability.
The manually segmented 2300 labeled diagrams were divided into nine categories according to nine poster layout styles, where the distribution of category samples is shown in Figure 6 and their categories are schematically illustrated in Figure 1. Each category was divided into a training set and a validation set in the ratio of 9:1, where the training set had a total of 2080 poster images and the validation set 220 poster images. Table 1 shows the division of the poster segmentation dataset and the layout classification dataset training set, validation set, and test set.

4.2. Model Training

In this paper, the model is built using the Pytorch deep learning framework (version 2.2.2 + CUDA 12.1), and trained on a computer with a system environment of Win10, an Intel(R) Core (TM) i7-10700F CPU @ 2.90GHz processor (Intel, Santa Clara, CA, USA) and an NVIDIA Geforce RTX 3060 Ti 12G graphics card (NVIDIA, Santa Clara, CA, USA).
The dataset was imported into the improved DeepLabv3+ model and the model was trained. The categories for semantic segmentation are background, subject, text, and graphics, and the output segmented images are of the same size as the input. Using the migration learning approach, the model parameters that have been trained by the large-scale Pascal VOC 2012 dataset are migrated to the model in this paper, and then the model training is performed to train 200 Epochs, respectively, with the batch size set to 4. To minimize the loss function during training, the Stochastic Gradient Descent (SGD) algorithm is employed, where model parameters are iteratively updated based on the gradient of the loss. This parameter update rule is defined as follows:
θ t + 1 =   θ t α 𝛻 L ( θ t )
where θt denotes the parameter values of the model at the tth iteration, α denotes the learning rate, and ∇L(θt) denotes the gradient of the loss function L (θ) with respect to the model parameter θ. The momentum value was set to 0.9, initial learning rate was set to 0.007, and weight decay index was 0.0005. The poster layout classification dataset was then put into the GoogLeNet classification network model for training, with its training batch size set to 2, initial learning rate set to 0.001, and 200 epochs trained.

5. Experimental Results and Analysis

5.1. Loss Functions and Evaluation Indicators

The study presented in this paper belongs to the multi-category image segmentation problem, which are subject, text, and graphics. Therefore, the categorical cross-entropy function is chosen as the loss function of the image segmentation model, which is calculated as follows:
Loss = 1 N i = 1 N [ o i ln ( p i ) + 1 o i · ln 1 p i ]
where N is the number of samples, oi is the true label value of the sample, and pi is the probability of the predicted value of the sample. The loss value is the difference between the actual output probability and the expected output probability. The smaller the value of the cross entropy is, the closer the two probability distributions are.
This loss function is particularly suitable for multi-class pixel-wise classification tasks such as semantic segmentation, and enables stable training with differentiable loss signals.
Firstly, 2070 movie poster datasets and corresponding labeled graphs are imported into four image semantic segmentation models for training, of which 1610 images are in the training set and 460 images are in the validation set, and the changes in the loss function in the training and validation sets are observed during the training of the networks. As shown in Figure 7, it shows the change in loss function during the training process of the three models, where the horizontal coordinate represents the number of training rounds, and the vertical coordinate represents the loss function value. The first 50 rounds of all three models were trained by freezing, and the last 150 rounds were trained by unfreezing. A comparison of the loss change curves of the three models shows that the gap between the training loss and the validation loss of the improved model in this paper is small, and the training loss and the validation loss as a whole tends to decrease during the whole training process, and the loss gradually tends to flatten out after 150 rounds of iteration, which indicates that the model has reached the optimal state. It can be seen that the improved model in this study is normal throughout the training process, there is no overfitting or underfitting phenomenon, and the model is in good condition.
After the network training is completed, 230 test set images are fed into the trained model. Despite the fact that movie posters have complex graphical backgrounds and fonts of various colors and sizes, they still perform well on the improved segmentation model in this paper.
In this paper, Mean Intersection over Union (MIoU) is used as an evaluation index, which is calculated as follows:
M I o U = 1 n i n i i j n i j + j n i j n i i
where nij denotes the number of pixels in which category i is predicted to be category j, nii denotes the number of pixels that are predicted accurately, and n is the number of target categories (containing background, theme, text, and graphics).

5.2. Segmentation Comparison Experiment Analysis

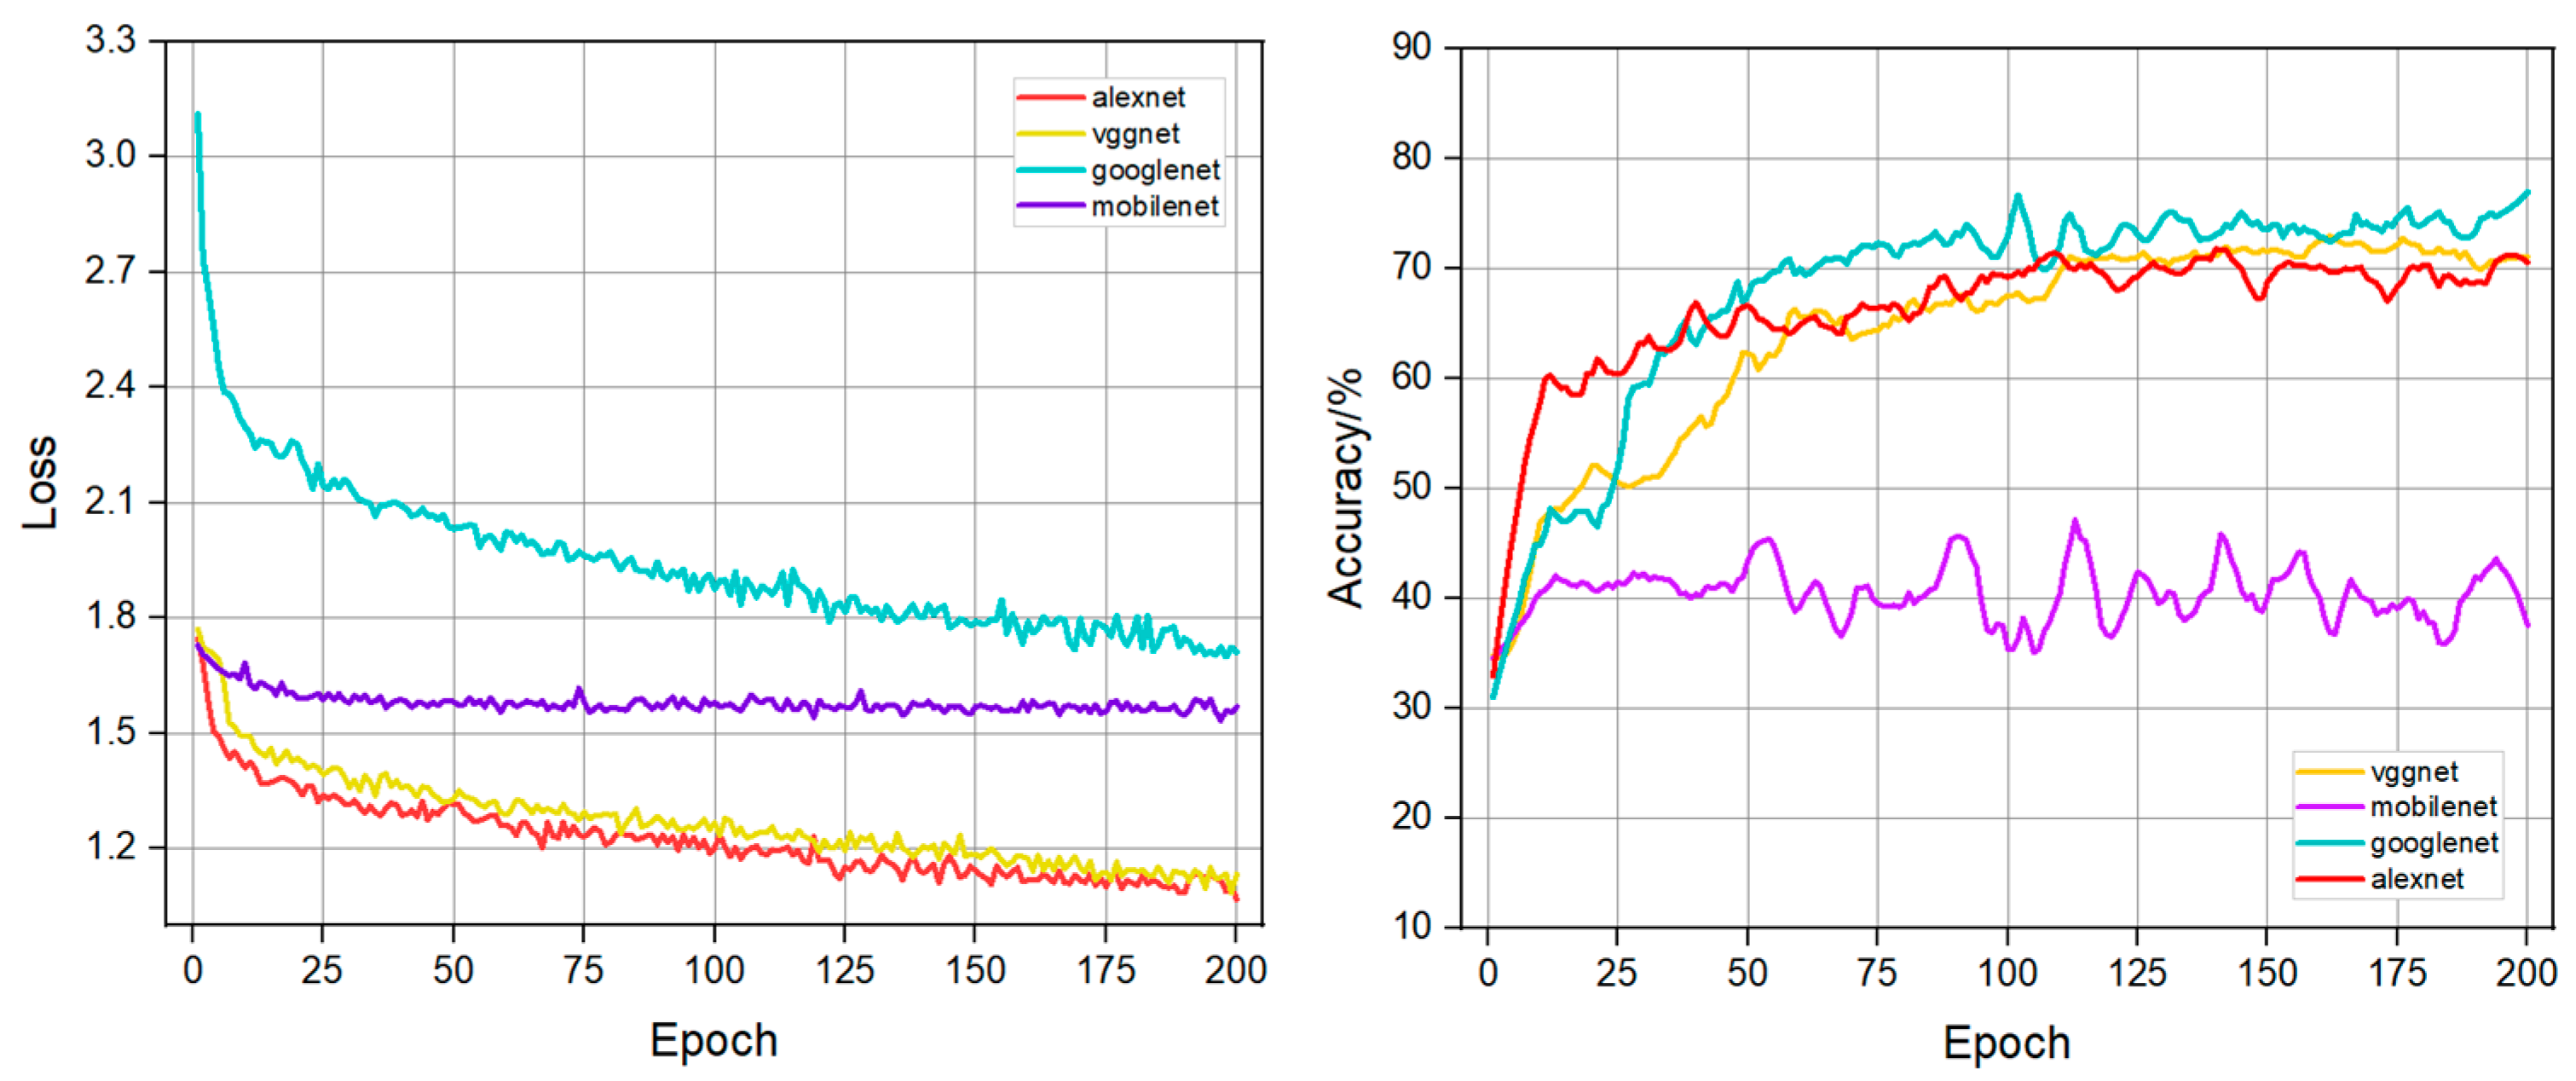
5.2.1. Impact of Different Backbone Feature Extraction Networks on Model Performance

We aimed to reduce the number of parameters of the model, shorten the training time of the model, and improve the segmentation accuracy of the model for small target categories. In this paper, Xception, ResNet101, Mobilenetv2, and Mobilentv3-small were selected as the backbone feature extraction networks for testing the improved model, and Table 2 shows the performance of the model when different backbone feature extraction networks are used.
From Table 2, it can be seen that the Xception and ResNet101 networks have a higher number of parameters, more computations, and longer inference time, which took almost 10 h more compared to the Mobilenet series of networks. The Mobilenetv3 network is based on Mobilenetv1 and Mobilenetv2 with the addition of an attention mechanism and an improved time-consuming layer; thus, it can be seen that Mobilenetv3-small has a greater improvement in segmentation accuracy compared to the previous three network structures, and the training time has also been reduced to some extent. Therefore, Mobilenetv3-small network is chosen as the backbone feature extraction network for the model in this study.

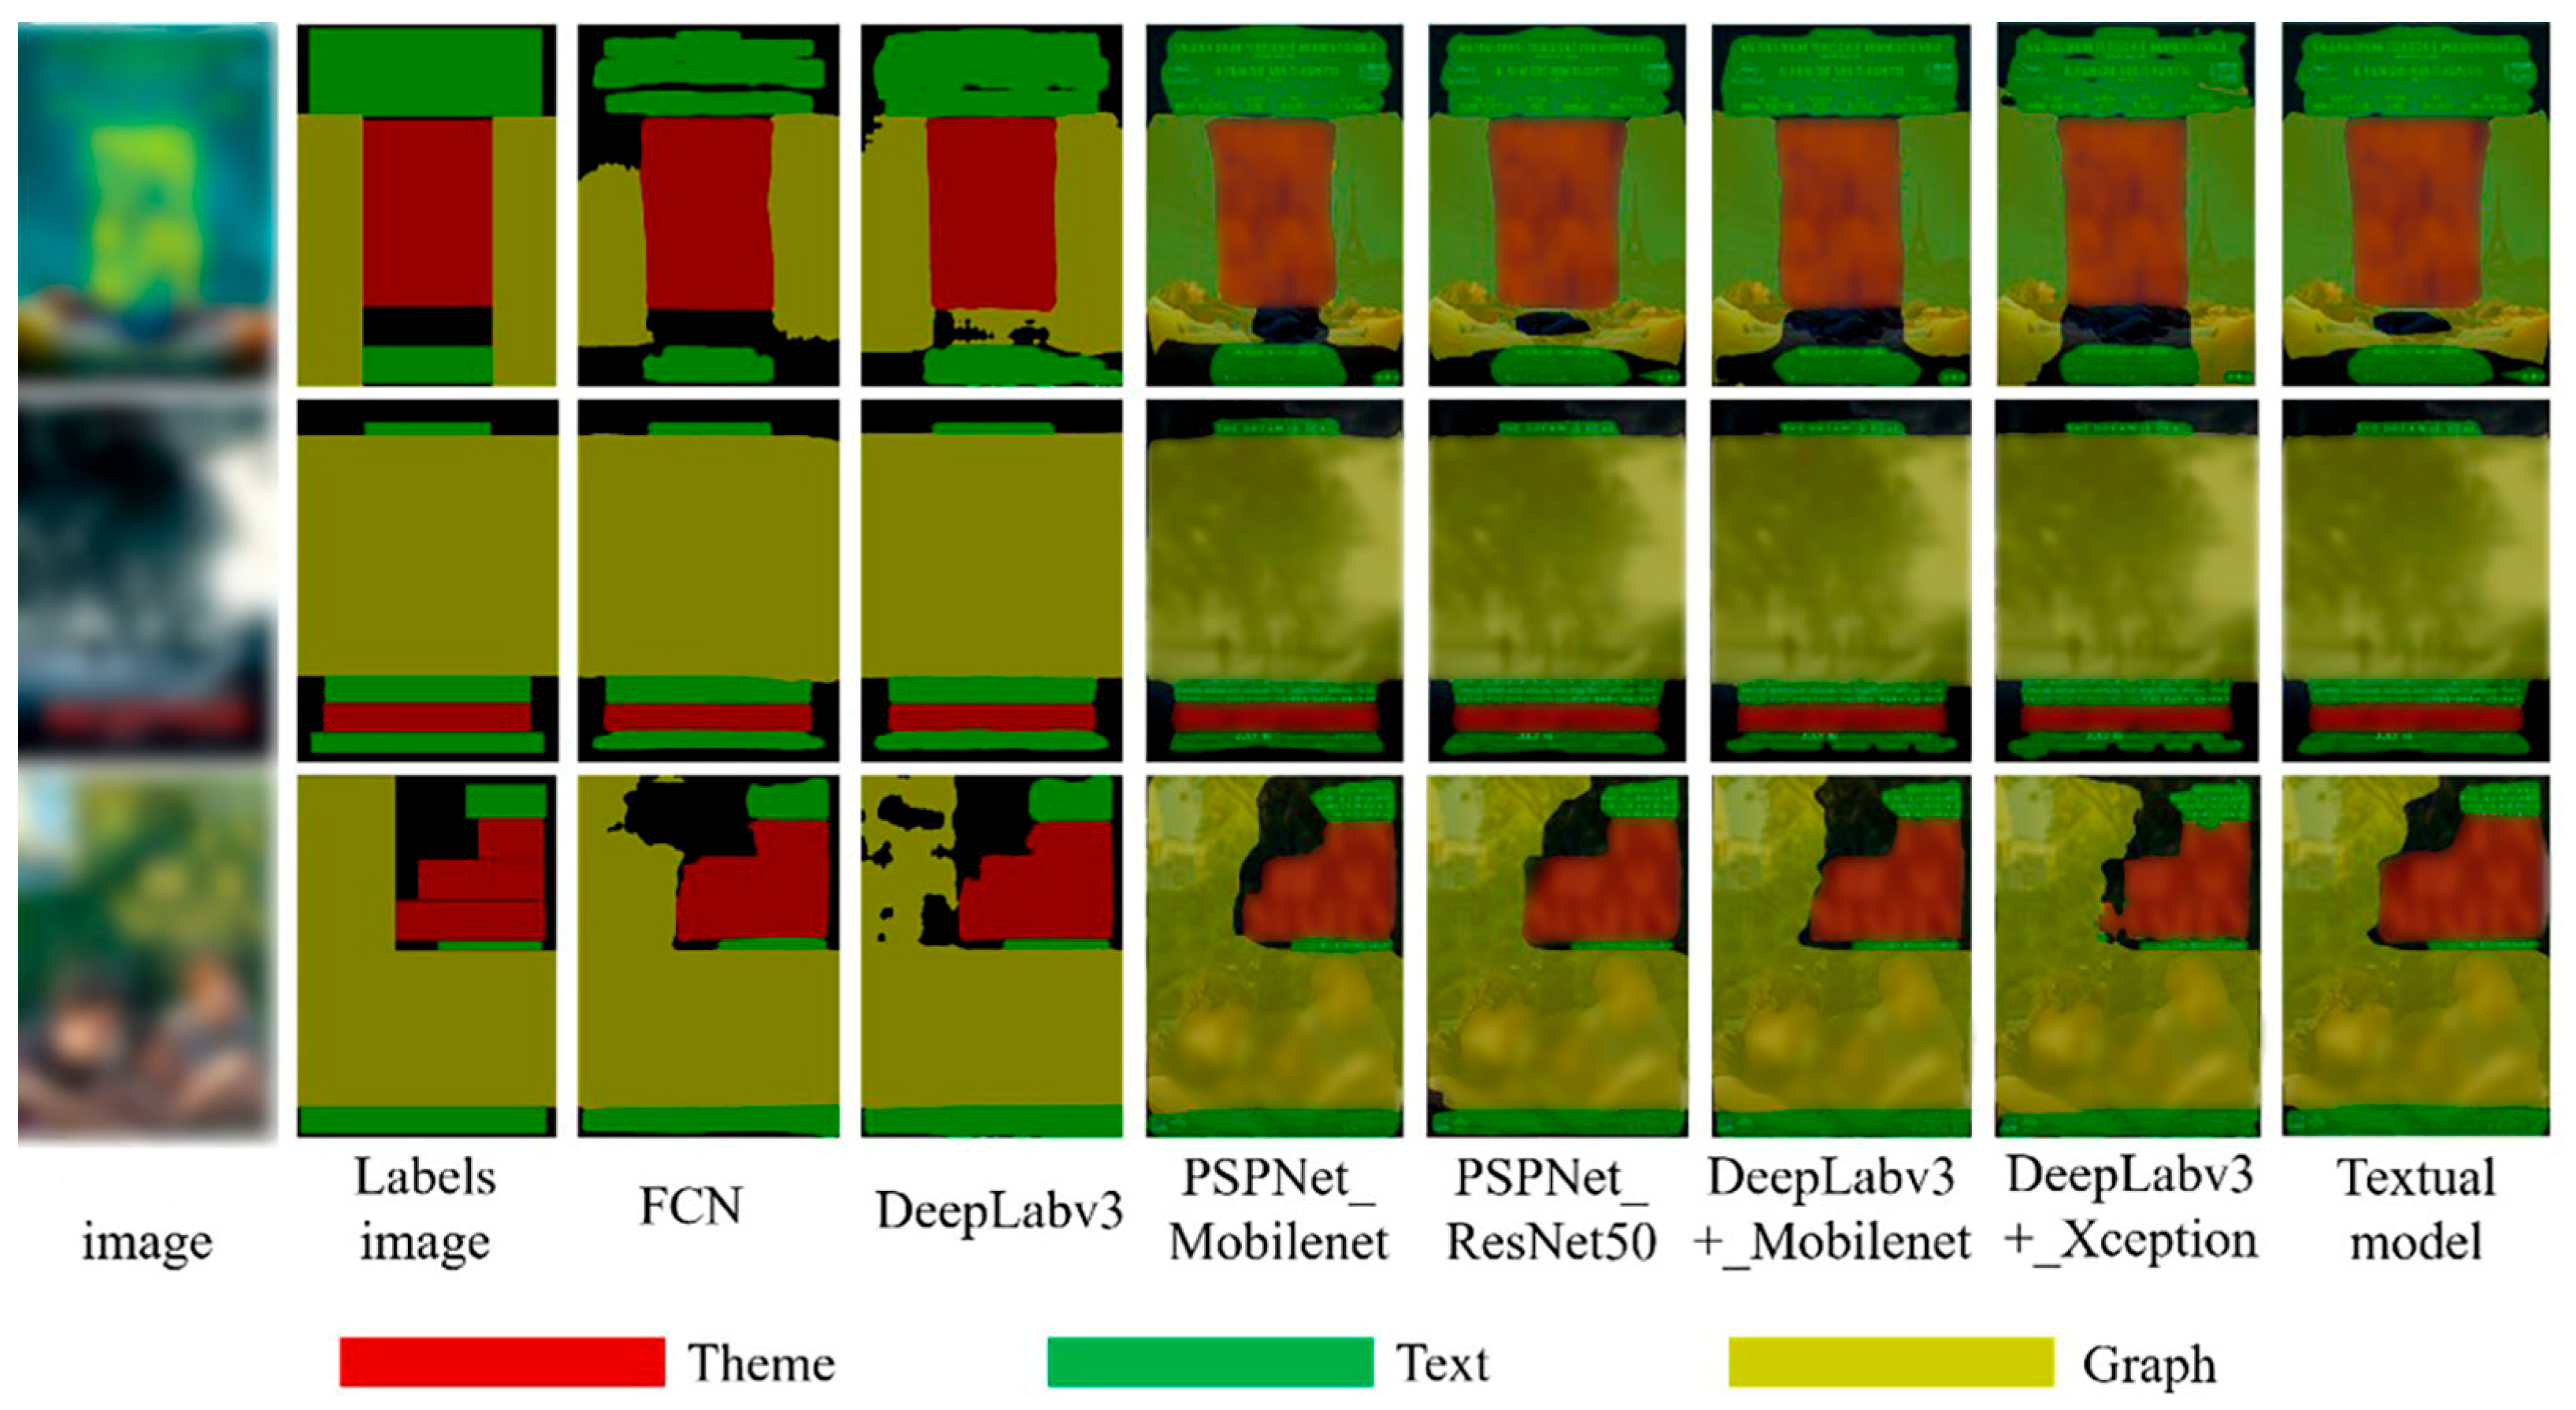
5.2.2. Comparative Experimental Analysis of Different Models

In order to further validate the effectiveness and advantages of the proposed model in semantic segmentation tasks, we selected four widely used models, namely, FCN [20], PSPNet [21], DeepLabv3 [15], and the original DeepLabv3+, for comparative testing. All models were trained on the same poster dataset constructed in this study, under identical parameter settings to ensure fairness. The comparative results are presented in Table 3.
These baseline models represent three distinct architectural philosophies: FCN as an early encoder–decoder framework, PSPNet focusing on global-context modeling through pyramid pooling, and the DeepLab series employing Atrous Spatial Pyramid Pooling (ASPP) combined with a dedicated decoder for multi-scale refinement.
Other segmentation frameworks such as UNet [22], BiSeNet [23], and SegFormer [24] were not included in our experiments for specific reasons. UNet, though effective in biomedical imaging, tends to underperform on text-rich natural scenes without extensive enhancements. BiSeNet prioritizes real-time inference speed at the expense of segmentation accuracy, which is suboptimal for our boundary-sensitive poster segmentation task. SegFormer and similar transformer-based models generally require large-scale datasets and considerable computational resources to achieve stable convergence, making them less feasible under our experimental setup and computational constraints.
Therefore, our selection of baseline models aimed to strike a balance between representativeness, architectural diversity, and practical feasibility in the context of complex layout image segmentation.
From the results in Table 3, it can be seen that the improved model in this study reduces the training time by 45 min compared to the FCN model, and the segmentation accuracy is improved by 2.6%. Compared to the PSPNet model, the improved model in this paper improves 2.0% in MIoU, and the training time is reduced by 78 min; compared to the DeepLabv3 model, the segmentation accuracy of this paper’s model has a small effect of improvement. Compared with the DeepLabv3 model, the model in this paper has a small effect of improving the segmentation accuracy, which is only 0.8%, but the training time is saved by 165 min, which is a larger time reduction in comparison; compared with the original DeepLabv3+ model, the model in this paper has a large improvement in the segmentation accuracy, which is 6.1% compared to the improvement, and the training time is also relatively reduced by 52 min. In summary, the performance of the improved model in this study on the self-built dataset is the most outstanding compared to the classical model.
As can be seen from Figure 8, although the DeepLabv3 model has a higher MIoU performance compared with other classical models during training, the generalization ability of its model is not high as can be seen from the test result graphs. The FCN model is not fine enough for some detail segmentation, and the learning effect of the layout style model with fewer data samples is not as good as that of the improved model in this study. Compared with PSPNet and the basic DeepLabv3+ model, the difference in segmentation accuracy between the improved models in this paper is not large, and from the visualization results, the segmentation fineness of the improved models in this study is better than that of PSPNet and DeepLabv3+.

5.3. Analysis of Layout Results

The proposed approach involves two phases. In the first phase, the improved DeepLabv3+ model is used to segment the elements of movie posters, including text, subject, and graphic regions. In the second phase, the spatial relationships among these segmented elements are analyzed, and the layout type of each poster is determined using the GoogLeNet classification model. The main layout styles correspond to the common types summarized in Section 2.
The GoogLeNet model was first trained with the movie poster classification dataset, and in order to select the classification model with better performance, comparative experiments were performed using AlexNet [25], Mobilenet [26], and VGGNet [27], as shown in Figure 9, which shows the change in the loss during the training process of the four models, as well as the curve of the change in the classification accuracy rate under the same conditions.
From Figure 9, it can be seen that the GoogLeNet model has the best performance in the whole training process, so in this paper, the GoogLeNet model is chosen to analyze the layout method classification of movie posters. The network is constructed based on the Inception network, which fuses feature information from different scales to achieve better recognition results. Although the loss of the GoogLeNet model did not drop to a very low level during training, the loss was trending down throughout. As can be seen from the classification accuracy, iterating the same number of training times, GoogLeNet performs best in terms of accuracy.

6. Conclusions

Based on the analysis and generalization of the characteristics of complex layout images, this paper proposes a complex image layout analysis method based on improved DeepLabv3+ model. By improving the backbone network and the ASPP module in the DeepLabv3+ model, the network is easier to train and the image pixel recognition accuracy is higher, which enhances the model’s ability to segment smaller categories of targets; secondly, based on the summarization of the poster image layout categories in this paper, we combine the GoogLeNet network model with the layout classification and analysis of the complex image. Experimental results show that the improved method proposed in this study achieves segmentation accuracy comparable to that of classical models. However, it significantly enhances the model’s ability to segment smaller target categories and reduces training time while maintaining overall accuracy. Despite these advancements, the model still struggles to accurately segment text with irregular orientations—such as tilted or curved fonts—due to the complex design styles often present in poster layouts. This remains a key challenge to be addressed in future work.
In particular, future research may consider integrating recent consensus-based segmentation strategies, such as kinetic modeling frameworks [28,29], which have shown strong potential in improving robustness and handling layout uncertainty. These model-driven approaches can complement current deep learning methods and further enhance the system’s generalization ability across diverse design structures.
Moreover, our experiments confirm that arbitrarily oriented text—such as slanted, rotated, and curved styles—often disrupts the alignment between text strokes and convolutional filters, leading to blurred boundaries and fragmented predictions. To address this issue, recent advances such as the Hi-SAM framework proposed by Ye et al. [30] have demonstrated promising capabilities by adapting the Segment Anything Model (SAM) for the hierarchical segmentation of complex text layouts with minimal supervision.
Additionally, the DASM module proposed by Ding et al. [31], which integrates dual spatial–channel attention into the decoder stage, has proven effective in enhancing text boundary localization under challenging lighting and distortion conditions. Building on these insights, future work will explore combining kinetic segmentation models with orientation-aware decoding, dual-attention mechanisms, and prompt-guided fine-tuning to improve robustness against spatial transformations and enhance adaptability in complex design scenarios.

Author Contributions

Conceptualization, Y.Z.; methodology, Y.Z. and Y.P.; software, Y.P.; validation, X.L., W.Z. and Y.C.; resources, H.H. and L.Z.; writing—original draft preparation, Y.P.; writing—review and editing, Y.Z. and D.L.; supervision, Y.Z.; project administration, Y.Z.; funding acquisition, Y.Z. All authors have read and agreed to the published version of the manuscript.

Funding

This research was funded by the Natural Science Foundation of Hunan Province, Grant No. 2021JJ30218.

Institutional Review Board Statement

Not applicable.

Informed Consent Statement

Not applicable.

Data Availability Statement

The datasets and source code used in this study are currently not publicly available due to copyright restrictions and ongoing research work. However, related materials can be provided upon reasonable request to the corresponding author.

Conflicts of Interest

The authors declare no conflicts of interest.

References

  1. Li, H. Visual communication design of digital media in digital advertising. J. Contemp. Educ. Res. 2021, 5, 36–39. [Google Scholar] [CrossRef]
  2. Jin, X.; Zhou, B.; Zou, D.; Li, X.; Sun, H.; Wu, L. Image aesthetic quality assessment: A survey. Sci. Technol. Rev. 2018, 36, 36–45. Available online: http://www.kjdb.org/CN/10.3981/j.issn.1000-7857.2018.09.005 (accessed on 1 March 2025).
  3. Deng, Y.; Loy, C.C.; Tang, X. Image aesthetic assessment: An experimental survey. IEEE Signal Process. Mag. 2017, 34, 80–106. [Google Scholar] [CrossRef]
  4. She, D.; Lai, Y.-K.; Yi, G.; Xu, K. Hierarchical layout-aware graph convolutional network for unified aesthetics assessment. In Proceedings of the IEEE/CVF Conference on Computer Vision and Pattern Recognition, CVPR, Online, 19–25 June 2021; pp. 8475–8484. [Google Scholar] [CrossRef]
  5. Riyanto, B. Analysis of Design Elements on Secret Magic Control Agency Movie Poster. TAMA J. Vis. Arts 2023, 1, 29–37. [Google Scholar] [CrossRef]
  6. Chen, S.; Liu, D.; Pu, Y.; Zhong, Y. Advances in deep learning-based image recognition of product packaging. Image Vis. Comput. 2022, 128, 104571. [Google Scholar] [CrossRef]
  7. George, N.; Sharad, C.S. Hierarchical image representation with application to optically scanned documents. In Proceedings of the 7th International Conference on Pattern Recognition (ICPR), Montreal, QC, Canada, 30 July–2 August 1984; pp. 347–349. Available online: http://digitalcommons.unl.edu/cseconfwork (accessed on 15 March 2025).
  8. Mao, S.; Rosenfeld, A.; Kanungo, T.; Smith, E.H.B.; Hu, J.; Kantor, P.B. Document structure analysis algorithms: A literature survey. Doc. Recognit. Retr. X 2003, 5010, 197–207. [Google Scholar] [CrossRef]
  9. Ha, J.; Haralick, R.M.; Phillips, I.T. Document page decomposition by the bounding-box project. In Proceedings of the IEEE 3rd International Conference on Document Analysis and Recognition, Montreal, QC, Canada, 14–18 August 1995; Volume 2, pp. 1119–1122. [Google Scholar] [CrossRef]
  10. Pu, Y.; Liu, D.; Chen, S.; Zhong, Y. Research Progress on the Aesthetic Quality Assessment of Complex Layout Images Based on Deep Learning. Appl. Sci. 2023, 13, 9763. [Google Scholar] [CrossRef]
  11. Wu, X.; Zheng, Y.; Ma, T.; Ye, H.; He, L. Document image layout analysis via explicit edge embedding network. Inf. Sci. 2021, 577, 436–448. [Google Scholar] [CrossRef]
  12. Guo, S.; Jin, Z.; Sun, F.; Li, J.; Li, Z.; Shi, Y.; Cao, N. Vinci: An intelligent graphic design system for generating advertising posters. In Proceedings of the 2021 CHI Conference on Human Factors in Computing Systems, New Orleans, LA, USA, 8–13 May 2021; pp. 1–17. [Google Scholar] [CrossRef]
  13. Huo, H.; Wang, F. A Study of Artificial Intelligence-Based Poster Layout Design in Visual Communication. Sci. Program. 2022, 2022, 1191073. [Google Scholar] [CrossRef]
  14. Chen, L.C.; Papandreou, G.; Schroff, F.; Adam, H. Rethinking atrous convolution for semantic image segmentation. arXiv 2017, arXiv:1706.05587. [Google Scholar] [CrossRef]
  15. Chen, L.-C.; Papandreou, G.; Kokkinos, I.; Murphy, K.; Yuille, A.L. Deeplab: Semantic image segmentation with deep convolutional nets, atrous convolution, and fully connected crfs. IEEE Trans. Pattern Anal. Mach. Intell. 2017, 40, 834–848. [Google Scholar] [CrossRef] [PubMed]
  16. Chollet, F. Xception: Deep learning with depthwise separable convolutions. In Proceedings of the IEEE Conference on Computer Vision and Pattern Recognition, Honolulu, HI, USA, 21–26 July 2017; pp. 1251–1258. [Google Scholar] [CrossRef]
  17. Howard, A.; Sandler, M.; Chen, B.; Wang, W.; Chen, L.-C.; Tan, M.; Chu, G.; Vasudevan, V.; Zhu, Y.; Pang, R.; et al. Searching for mobilenetv3. In Proceedings of the IEEE/CVF International Conference on Computer Vision, Seoul, Republic of Korea, 27 October–2 November 2019; pp. 1314–1324. [Google Scholar] [CrossRef]
  18. Szegedy, C.; Liu, W.; Jia, Y.; Sermanet, P.; Reed, S.; Anguelov, D.; Erhan, D.; Vanhoucke, V.; Rabinovich, A.; Liu, W.; et al. Going deeper with convolutions. In Proceedings of the 2015 IEEE Conference on Computer Vision and Pattern Recognition (CVPR), Boston, MA, USA, 7–12 June 2015; pp. 1–9. [Google Scholar] [CrossRef]
  19. Everingham, M.; Eslami, S.M.A.; Van Gool, L.; Williams, C.K.I.; Winn, J.; Zisserman, A. The pascal visual object classes challenge: A retrospective. Int. J. Comput. Vis. 2015, 111, 98–136. [Google Scholar] [CrossRef]
  20. Long, J.; Shelhamer, E.; Darrell, T. Fully convolutional networks for semantic segmentation. In Proceedings of the IEEE Conference on Computer Vision and Pattern Recognition, Boston, MA, USA, 7–12 June 2015; pp. 3431–3440. [Google Scholar] [CrossRef]
  21. Zhao, H.; Shi, J.; Qi, X.; Wang, X.; Jia, J. Pyramid scene parsing network. In Proceedings of the IEEE Conference on Computer Vision and Pattern Recognition, Honolulu, HI, USA, 21–26 July 2017; pp. 2881–2890. [Google Scholar] [CrossRef]
  22. Ronneberger, O.; Fischer, P.; Brox, T. U-Net: Convolutional Networks for Biomedical Image Segmentation. In Proceedings of the MICCAI 2015, Munich, Germany, 5–9 October 2015; pp. 234–241. Available online: https://arxiv.org/abs/1505.04597 (accessed on 20 April 2025).
  23. Yu, C.; Wang, J.; Peng, C.; Gao, C.; Yu, G.; Sang, N. BiSeNet: Bilateral Segmentation Network for Real-time Semantic Segmentation. In Proceedings of the ECCV 2018, Munich, Germany, 8–14 September 2018; pp. 334–349. Available online: https://arxiv.org/abs/1808.00897 (accessed on 20 April 2025).
  24. Xie, E.; Wang, W.; Yu, Z.; Anandkumar, A.; Alvarez, J.M.; Luo, P. SegFormer: Simple and Efficient Design for Semantic Segmentation with Transformers. In Proceedings of the Advances in Neural Information Processing Systems, Online, 6–14 December 2021; Available online: https://arxiv.org/abs/2105.15203 (accessed on 20 April 2025).
  25. Krizhevsky, A.; Sutskever, I.; Hinton, G.E. ImageNet classification with deep convolutional neural networks. Commun. ACM 2017, 60, 84–90. [Google Scholar] [CrossRef]
  26. Howard, A.G.; Zhu, M.; Chen, B.; Kalenichenko, D.; Wang, W.; Weyand, T.; Andreetto, M.; Adam, H. Mobilenets: Efficient convolutional neural networks for mobile vision applications. arXiv 2017, arXiv:1704.04861. [Google Scholar] [CrossRef]
  27. Simonyan, K.; Zisserman, A. Very deep convolutional networks for large-scale image recognition. arXiv 2014, arXiv:1409.1556. [Google Scholar] [CrossRef]
  28. Cabini, R.F.; Tettamanti, H.; Zanella, M. Understanding the Impact of Evaluation Metrics in Kinetic Models for Consensus-Based Segmentation. Entropy 2025, 27, 149. [Google Scholar] [CrossRef] [PubMed]
  29. Cabini, R.F.; Pichiecchio, A.; Lascialfari, A.; Figini, S.; Zanella, M. A Kinetic Approach to Consensus-Based Segmentation of Biomedical Images. Kinet. Relat. Models 2025, 18, 286–311. [Google Scholar] [CrossRef]
  30. Ye, M.; Zhang, J.; Liu, J.; Liu, C.; Yin, B.; Liu, C.; Tao, D. Hi-SAM: Marrying Segment Anything Model for Hierarchical Text Segmentation. arXiv 2024, arXiv:2401.17904. [Google Scholar] [CrossRef] [PubMed]
  31. Ding, L.; Liu, Y.; Zhao, Q.; Liu, Y. Text Font Correction and Alignment Method for Scene Text Recognition. Sensors 2024, 24, 7917. [Google Scholar] [CrossRef] [PubMed]
Figure 1. Schematic diagram of the poster layout. (a) Centered layout; (b) split layout; (c) symmetrical layout; (d) diagonal layout; (e) wraparound layout; (f) full-screen layout; (g) axial layout; (h) inclined layout.
Applsci 15 07797 g001
Figure 2. DeepLabv3+ basic network architecture (adapted from [14,15]).
Applsci 15 07797 g002
Figure 3. Mobilenetv3 network structure diagram (adapted from [17]).
Applsci 15 07797 g003
Figure 4. Improved DeepLabv3+ model architecture.
Applsci 15 07797 g004
Figure 5. Demonstration of the annotation process. (a) Sample poster(Quo Vadis, 1951; Tumbleweeds, 1925); (b) split label diagram; (c) label split effect diagram. The images are public domain samples used only for illustration and not for training. (https://picryl.com/, accessed on 15 April 2025).
Applsci 15 07797 g005
Figure 6. Poster layout categorization dataset category sample distribution.
Applsci 15 07797 g006
Figure 7. Loss function variation curves of the training set and validator on three different models. (a) The improved DeepLabv3+ model in this paper; (b) the original DeepLabv3+ model; (c) the PSPNet+ResNet50 model.
Applsci 15 07797 g007
Figure 8. Comparison of page segmentation test results. The original poster images were blurred post-experiment to comply with copyright regulations, preserving layout structure for visualization without impacting model training or evaluation.
Applsci 15 07797 g008
Figure 9. Loss and accuracy variation curves for four classification models.
Applsci 15 07797 g009
Table 1. Poster segmentation dataset and classification dataset division.
DatasetTrainValTest
Poster Segmentation1610460230
Poster_layout classification2080220
Table 2. Comparison of model results using different backbone feature extraction networks. Bold-best performance.
BackboneMIoU/%Time/h
Xception71.0925.10
ResNet10172.8926.20
Mobilenetv270.0516.20
Mobilenetv3-small75.6015.09
Table 3. Comparison experimental results of different models.
ModelBackboneMIoU/%Time/h
FCNResNet10173.0015.54
PSPNetResNet10173.6016.27
DeepLabv3ResNet10174.8017.54
DeepLabv3+
Textual model
Mobilenetv2
Mobilenetv3-small
69.50
75.60
16.01
15.09
Disclaimer/Publisher’s Note: The statements, opinions and data contained in all publications are solely those of the individual author(s) and contributor(s) and not of MDPI and/or the editor(s). MDPI and/or the editor(s) disclaim responsibility for any injury to people or property resulting from any ideas, methods, instructions or products referred to in the content.

