Article

Effects of Daytime vs. Nighttime on Travel Mode Choice and Use Patterns: Insights from a Ride-Pooling Survey in Germany

by
Mehmet Emre Goerguelue
*,
Nadine Kostorz-Weiss
,
Ann-Sophie Voss
,
Martin Kagerbauer
and
Peter Vortisch
Institute for Transport Studies, Karlsruhe Institute of Technology, 76131 Karlsruhe, Germany
*
Author to whom correspondence should be addressed.
Appl. Sci. 2025, 15(14), 7774; https://doi.org/10.3390/app15147774
Submission received: 4 June 2025 / Revised: 4 July 2025 / Accepted: 9 July 2025 / Published: 10 July 2025
(This article belongs to the Special Issue Sustainable Urban Mobility)

Abstract

Ride-pooling (RP) services, in which passengers with similar destinations share a ride, offer considerable potential for enhancing urban mobility by bridging gaps in public transportation (PT) networks and providing a convenient alternative to private car use. For the effective design and operation of such services, a detailed understanding of user preferences and usage patterns is essential. This study investigates differences in RP preferences and usage between day and night (with nighttime defined as 10:00 p.m. to 5:00 a.m.), drawing on both a stated choice experiment (SCE) and revealed preference data collected in Mannheim, Germany. The focus lies on the local RP service fips, which is integrated into the PT system. The SCE, conducted in 2024 with 566 participants, was analyzed using a nested logit model. The analysis of the SCE reveals that nighttime preferences for RP are characterized by reduced sensitivity to travel time and cost, creating an opportunity for RP operators to optimize stop network designs during nighttime hours by increasing pooling rates. In addition, it indicates a greater likelihood of private car usage at night, especially among women, likely due to safety concerns and limited PT availability. The analysis of revealed preference data provides a complementary perspective. It shows that the RP nighttime service primarily attracts younger users, while many respondents report not being active on weekend nights. However, the combination of low public awareness and limited service availability, evidenced by rejected booking requests, suggests that existing demand is not being fully captured. This implies that low usage is not merely the result of low demand, but also of structural barriers on both the supply and information side. Overcoming these barriers through targeted information campaigns and expansion of nighttime service capacity could substantially enhance sustainable urban travel options during nighttime.

1. Introduction

To address the evolving needs and challenges in urban and rural traffic systems, new mobility services have been developed in recent years. Characterized by flexibility and convenience, a range of services have been established, ranging from bike- and carsharing to ride-hailing and ride-pooling (RP) [1]. While the former involves the individual booking and independent use of a bicycle or private car, ride-hailing entails booking a vehicle with a driver for a specific route without additional passengers. RP builds on this concept by allowing other passengers to share the ride [2]. Based on a predefined algorithm, this app-based service pools passengers with similar destinations along a shared route into a single vehicle. In this way, individual travel costs, total mileage driven, and traffic congestion can be reduced overall, contributing to a more sustainable public transportation (PT) system [3,4,5]. Proponents highlight RP’s potential to reduce vehicle miles traveled and address first- and last-mile connectivity issues, thereby increasing the accessibility and efficiency of the overall mobility system. However, critics caution that RP may cannibalize existing PT services by shifting demand from line-based PT to more flexible, on-demand options, potentially increasing traffic volumes and emissions [6,7,8]. Previous studies have examined a wide range of influencing factors, including sociodemographic, mobility-related, and psychological determinants [9].
However, one dimension that has received limited attention is the temporal variation in RP usage, particularly during nighttime hours. In this study, nighttime is defined as the period between 10:00 p.m. and 5:00 a.m. It can be assumed that travel behavior differs significantly between daytime and nighttime due to increased safety concerns and the reduced availability of alternative transport modes [3,10,11,12]. This gap in research is particularly relevant as RP services may offer substantial potential during nighttime, both in improving accessibility and in filling service gaps left by traditional PT. To better understand these dynamics, this study examines the case of the RP service fips in Mannheim, Germany, which complements the existing local PT network. The analysis is based on survey data collected from Mannheim residents during January and February 2024. This is the first study in Germany that combines stated preference and revealed preference data to empirically analyze temporal differences in RP behavior, thereby contributing novel insights to the field of time-sensitive mobility research. While the methodological framework builds on established discrete choice modeling techniques, the main objective of this study lies in generating empirically grounded insights into temporal variation in ride-pooling behavior. The integrated use of stated and revealed preference data strengthens the robustness of the analysis and provides a more comprehensive understanding of user behavior in a relatively underexplored research context. The findings aim to illuminate the varying behavior of passengers at different times of the day, providing valuable insights for RP operators and urban planners to enhance the effectiveness and sustainability of RP services.
This paper is structured as follows: Section 2 provides a comprehensive literature review on the impact of nighttime conditions on travel mode choice and mobility behavior. Section 3 outlines the methodological framework of the study, including the design and implementation of the stated choice experiment (SCE), the characteristics of the RP service fips, the data collection process, and the statistical modeling approach. Section 4 presents and discusses the empirical results. Finally, Section 5 summarizes the main findings, reflects on their implications for transport policy and planning, and suggests directions for future research.

2. Literature Review

Although RP services can exist in privately owned forms or as a complement to line-based PT [13], their integration is aimed at supplementing the typically radial design of PT networks and enhancing flexibility through on-demand features. Several studies highlight the complex relationship between RP and PT systems. For instance, Schaller [14] found that RP services in suburban California are mainly adopted by existing PT users. To preserve the functionality of PT, Anzenhofer et al. [15] propose a clear separation between the two systems by means of pricing strategies and distinct service design. A deeper understanding of the factors that influence user decisions to adopt or reject RP services is therefore essential. While the literature has extensively examined a wide range of influencing factors, including sociodemographic (e.g., age) [16], sociopsychological (e.g., environmental awareness) [9], mobility-related (e.g., pricing strategies) [17], and trip-related aspects (e.g., urban structure) [3,18], the role of nighttime conditions as a contextual factor remains relatively underexplored, despite its growing relevance in travel behavior science.

2.1. Nighttime Travel Behavior

Nighttime mobility is increasingly recognized as a critical dimension of urban travel behavior, particularly due to challenges related to safety and service availability. PT continues to be a vital mode during nighttime hours, although with specific limitations. In a study based on semi-structured interviews with 167 PT users in Karlsruhe (Germany), Kapitza [19] found that, although nighttime PT is generally positively perceived, issues of safety and cleanliness were frequently mentioned as areas for improvement. Using a hybrid choice modeling approach, Scagnolari et al. [20] demonstrated that young drivers are more likely to switch to PT when safe and affordable options are available. Similarly, McCray and Brais [21] showed in a GIS-based analysis that bus users tend to avoid poorly lit stops, underscoring the role of physical infrastructure in nighttime mobility. In the context of bike-sharing systems, Yu et al. [22] found that nighttime demand is more dispersed and often associated with night bus routes in Beijing, while Faghih-Imani et al. [23] observed significantly reduced late-night demand in Barcelona and Seville using a mixed linear model. At the same time, private car usage tends to increase at night, largely due to safety concerns and limited PT availability. Analyzing MiD 2017 data via a discrete choice model, Kapitza [24] found that suburban commuters are especially prone to using private cars at night. Furthermore, Bromley et al. [25] noted that concerns about the security of parking facilities play a significant role in the decision to use private cars at night. In a similar vein, Gelino et al. [26] demonstrated that unreliable nighttime transport services, specifically delays exceeding 30 min, can prompt students to walk home alone, even when this option is perceived as unsafe. Moreover, gender-specific safety perceptions have emerged as a critical determinant of nighttime mobility behavior. Based on a commuter survey, Kapitza [27] showed that women perceive nighttime travel as significantly less safe, which directly affects their mode choice. Similarly, Bromley et al. [25] found that women report substantially higher levels of fear when waiting at bus stops or in parking garages during nighttime hours. Heinen et al. [28] also observed that female bicycle commuters in the Netherlands are less likely to cycle at night, predominantly due to safety concerns. These findings underscore the importance of incorporating gender-sensitive perspectives into nighttime mobility planning, particularly when aiming to foster equitable and inclusive access to transportation across all user groups.

2.2. Nighttime Utilization of RP Services

Within this broader context, RP services exhibit distinctive temporal patterns, particularly at night. Goedde et al. [1] conducted spatial regression analyses using CleverShuttle data from Berlin and Munich, revealing a notable demand peak for RP services around midnight, precisely when PT services are unavailable or insufficient. Kostorz et al. [29] observed similar peaks in the evening hours between 8 p.m. and midnight based on data from the MOIA RP service in Hamburg. Zwick et al. [30] investigated nighttime use of MOIARP during the COVID-19 pandemic, when the RP service supplemented PT. They found users to be significantly younger and that RP was mainly used for leisure purpose, even though nighttime curfew still existed during that time. An analysis of MOIA booking data from 2023 focusing on individuals with mobility impairments reveals that this user group primarily travels during the day, while usage is significantly lower in the evening and at night [31]. Shulika et al. [3] confirmed that RP usage intensifies during weekend nights, with up to 50% of trips being efficiently shared, using an offline utility-based algorithm and 1.5 million New York taxi rides. Krauss et al. [32] conducted an SCE in German cities to examine mode choice for shared modes and found that cost outweighed travel time for RP and carsharing. However, users’ willingness to pay (WTP) for RP services appears to decline slightly during nighttime. Hou et al. [33] report a 2.12% decrease in WTP at night, potentially reflecting heightened safety concerns or a higher subjective valuation of time.
The reviewed literature highlights that nighttime mobility is shaped by a complex interplay of contextual, infrastructural, and psychosocial factors. Safety concerns, particularly among women, emerge as a consistent barrier across all modes of transport. While PT remains essential at night, its limited availability and perceived lack of safety often lead to increased reliance on private cars. In this context, RP services demonstrate potential as a flexible and demand-responsive alternative, especially during periods of low PT coverage. However, their effectiveness depends on a range of factors that are particularly sensitive to nighttime-specific conditions.

3. Methodology

This section outlines the methodological approach used to examine the effect of daytime on travel mode choice. First, the design and characteristics of the local RP service are described, followed by details on the data collection process and the experimental setup of the stated choice survey. Subsequently, the statistical models employed for data analysis are introduced.

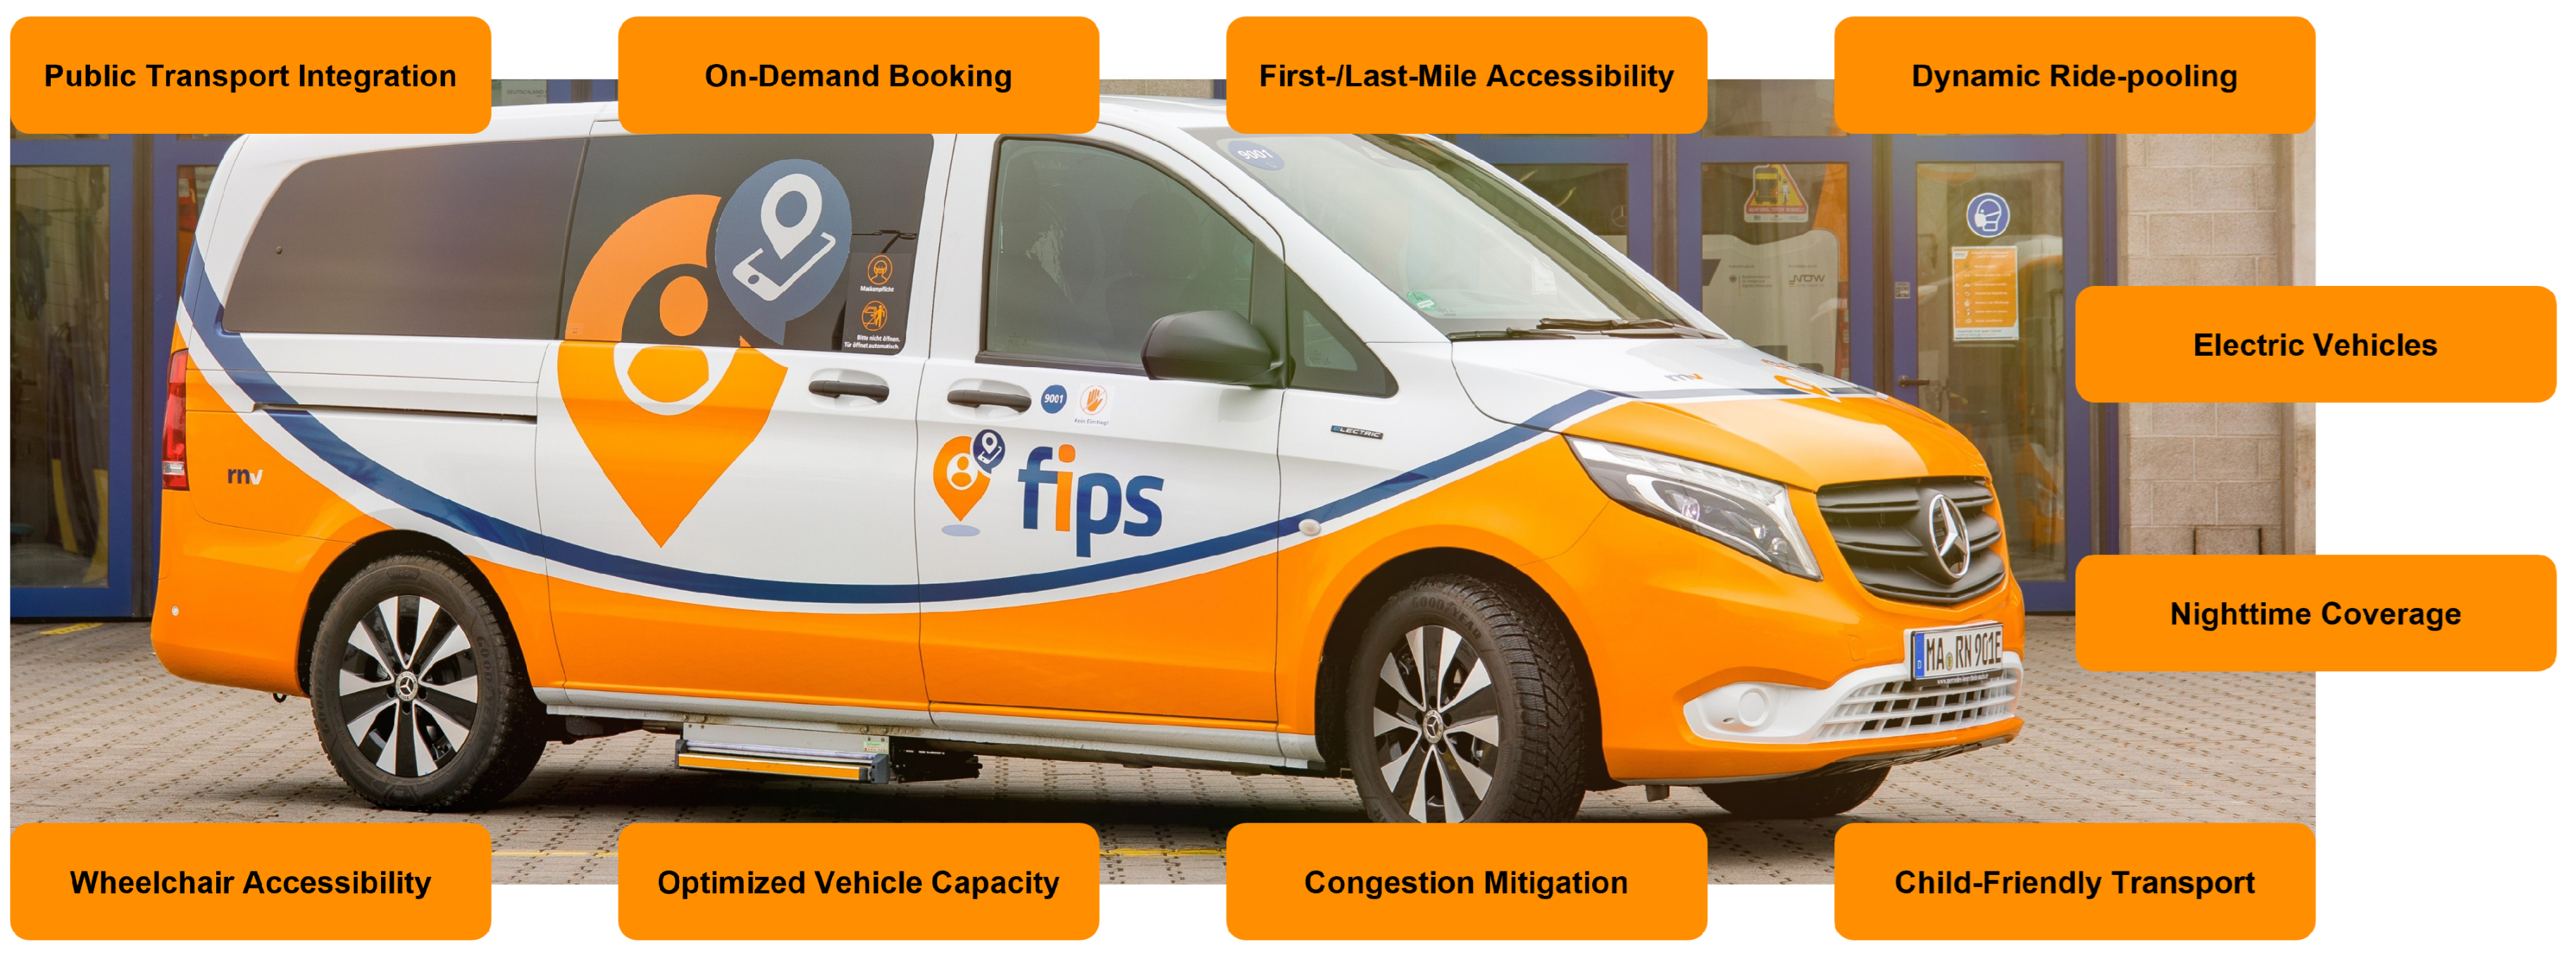
3.1. Description of the RP Service Fips

According to the local PT operator rnv, the RP service fips complements PT in Mannheim and Heidelberg (Germany), particularly in peripheral areas, and serves as a first- and last-mile solution [34]. Rides can be booked via app or phone within defined zones and hours. Using RP, passengers with similar routes are grouped to optimize capacity and reduce congestion. The service operates fully electric vehicles powered by 100% renewable energy, some of which have barrier-free access including wheelchair ramps and low-floor entry. Each vehicle seats up to five passengers, with space for luggage, strollers, and mobility aids, and includes integrated child safety seats. By promoting shared mobility, fips aims to reduce single-occupancy private car trips, thereby lowering emissions and easing urban traffic congestion. Passengers with a disability card travel free of charge, while holders of a PT pass pay only a EUR 1 surcharge per ride. Of particular relevance to this work, fips also operates during nighttime hours, when regular public transport services are limited, thereby ensuring comprehensive urban accessibility. During the day, however, fips is only available in the northern and southern parts of the city, while at night it operates citywide. Figure 1 shows a typical fips vehicle.

3.2. Data Collection and Sample Description

In the context of an acceptance study for fips [35], data were collected between January and February 2024. Participant recruitment primarily took place through small postcard invitations sent randomly to over 100,000 households across the Mannheim urban district, supplemented by social media advertisements from rnv. As an incentive, participants had the chance to win one of 25 local gift vouchers, each worth EUR 20. The survey was designed to collect detailed information on participants’ sociodemographic characteristics, their general attitudes toward RP services, and in particular, their usage behavior with respect to the nighttime RP service fips. Respondents who had previously used the nighttime service were asked to provide information about their most recent trip. This included the purpose of the trip and any complementary modes of transportation used during the outbound or return leg (e.g., walking, PT, private car). In addition, the survey also addressed non-users of the RP service. These respondents were asked to specify the reasons for their non-utilization, such as lack of awareness.
Besides revealed preferences, a central component of the survey was a stated choice experiment (SCE), which focused on participants’ travel mode choices across both daytime and nighttime scenarios, encompassing both mono- and intermodal options. This experiment forms the core of the study, providing insights into individuals’ preferences for various modes of transportation under different travel conditions. The conceptual design of the survey, particularly the combination of revealed preference elements with a stated choice design, follows methodological standards that have also been applied in other studies evaluating innovative mobility services. For instance, a similarly structured empirical study was conducted as part of the accompanying research on the deployment of automated minibuses in Monheim am Rhein [36]. In total, 602 individuals participated in the survey. After applying data cleaning procedures, such as removing responses with implausible completion times and identifying straightlining behavior, a final sample of 566 participants remained for analysis. Table 1 presents descriptive statistics for different user groups, highlighting the attractiveness of the nighttime service for younger individuals. Specifically, users of the RP nighttime service have an average age of 42.9 years, making them significantly younger than both daytime-only users (51.6 years) and non-users (51.3 years). This age-related pattern aligns with the demographic profile of nighttime service users of the private RP provider MOIA, as reported by Zwick et al. [30]. During the sample recruitment, no quotas were aligned, but all people willing could fill out the survey, as we expected major challenges to find sufficient respondents with experience while applying quotas. Therefore, the right-hand column provides the results from the latest German national household survey Mobilitaet in Deutschland to compare the current sample with [37]. Since only adults could participate, the proportion of employed and retired people in our sample is higher than the German average. As the data stems from 2017 membership rates for shared services are low or not available at all.

3.3. Stated Choice Experiment Design

The SCE was structured around three scenarios, each featuring three situational variations, resulting in nine stated choice tasks per respondent. In each situation, respondents had to select the alternative they personally found most attractive. As illustrated in Figure 2, the first scenario captured mode choice decisions for daytime travel, while the third scenario focused on nighttime travel (10:00 p.m.–5:00 a.m.). The second scenario involved an intermodal setting, featuring a combination of PT (bus and rail) and the RP service fips. However, in order to ensure comparability between the daytime and nighttime scenarios, each of which exclusively reflects unimodal choices, the intermodal scenario was excluded from the present analysis.
A preliminary question assessed participants’ ability to drive at night (e.g., considering factors such as regular alcohol consumption during nighttime activities or general fatigue), which served as a filter for displaying the bicycle or private car (highlighted in blue in Figure 2). To reduce complexity and prevent participants from being overwhelmed by too many choices, taxis were excluded from the daytime scenarios. This decision was based on the assumption that taxis are more relevant at night due to the lower availability of other transport modes such as PT [23]. The Ngene 1.2 software was used to design the SCE by optimizing utility functions within a D-efficient design, thereby minimizing the number of required respondents and the D-error [38]. Four question blocks were identified as the optimal setup. Travel times were constrained to reflect real-world conditions in the city of Mannheim, Germany. Typical urban trips with distances ranging from 2 to 5 km served as a reference for the scenario design. For better comprehensibility, Table 2 presents the attribute levels used in the experiment. The cost attributes in the scenarios were adjusted to account for realistic urban trip distances and fare discounts, such as those available for PT pass holders or individuals with mobility impairments.

3.4. Model Specification

This study analyzes travel mode choice within the utility maximization framework [39,40], where the utility U j of alternative j is composed of a deterministic part V j and a random error term ε j :
U j = V j + ε j .
The deterministic utility is specified as
V j = β 0 j + i β i j X i j ,
where β 0 j is the alternative-specific constant capturing intrinsic preferences, and X i j are explanatory variables such as travel time or cost.
Although machine learning methods (e.g., random forests, gradient boosting, neural networks) offer high predictive accuracy [41,42], they lack behavioral interpretability and require large datasets [43]. Since this study focuses on explaining mode choice behavior, especially differences between daytime and nighttime travel, discrete choice models (DCMs) are preferred for their interpretability and suitability for moderate sample sizes. The multinomial logit (MNL) model, based on the assumption that the error terms ε j follow an i.i.d. Gumbel distribution, defines choice probabilities as
P j = exp ( V j ) k C exp ( V k ) ,
where C denotes the choice set.
However, MNL imposes the Independence of Irrelevant Alternatives (IIA) assumption, which can be violated if alternatives share unobserved characteristics, leading to biased estimates. To relax IIA, the nested logit (NL) model groups alternatives into nests B m , allowing correlated unobserved utility components within nests [44]. The choice probability decomposes into the product of the probability of choosing nest m and the conditional probability of choosing alternative j within that nest:
P j = P j | m × P m
with
P j | m = exp V j λ m k B m exp V k λ m
and
P m = exp λ m I m l = 1 M exp λ l I l
where λ m ( 0 , 1 ] is the nest correlation parameter and
I m = ln k B m exp V n k λ m
is the inclusive value summarizing nest attractiveness.
Model parameters are estimated via maximum likelihood, implemented with the Apollo package in R [45]. This approach balances explanatory power with computational feasibility given the sample size and the study’s behavioral focus.

3.5. Model Selection

To assess the model fit and compare different model specifications, we rely on key statistical indicators, particularly the log-likelihood value (LL), the Bayesian Information Criterion (BIC) [46]. The LL value measures how well the model explains the observed choices: a higher (less negative) LL indicates better in-sample fit. However, as model complexity increases, the LL alone may favor overfitted models. Therefore, the BIC is reported additionally, which penalizes model complexity and helps in selecting a more parsimonious specification. The BIC is defined as
B I C = 2 · L L + k · ln ( N )
where k denotes the number of estimated parameters and N represents the number of observations. Lower BIC values indicate a better trade-off between model fit and complexity.

4. Results and Discussion

This section presents key findings on how nighttime-specific conditions influence travel behavior. It begins with an analysis of revealed preferences regarding the use and perception of the fips RP nighttime service, followed by insights from stated preference modeling. Throughout the presentation of results, direct comparisons with existing literature are made to contextualize the findings.

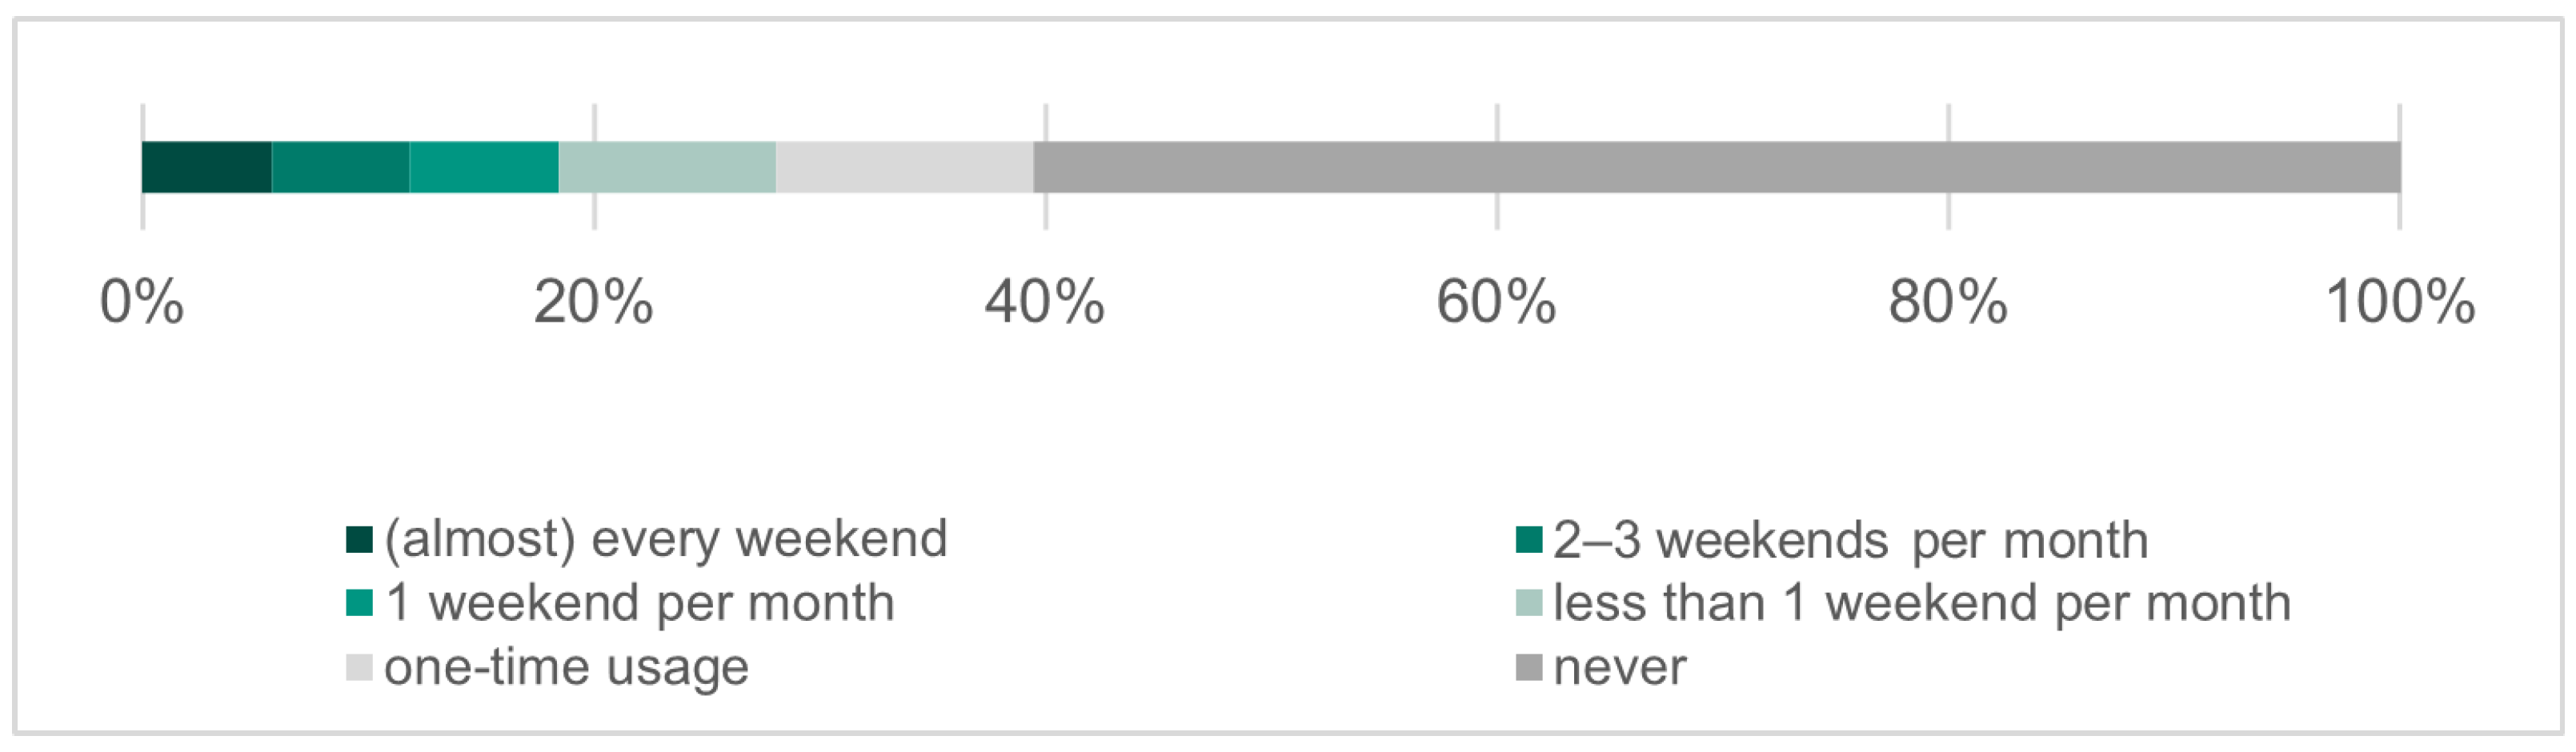
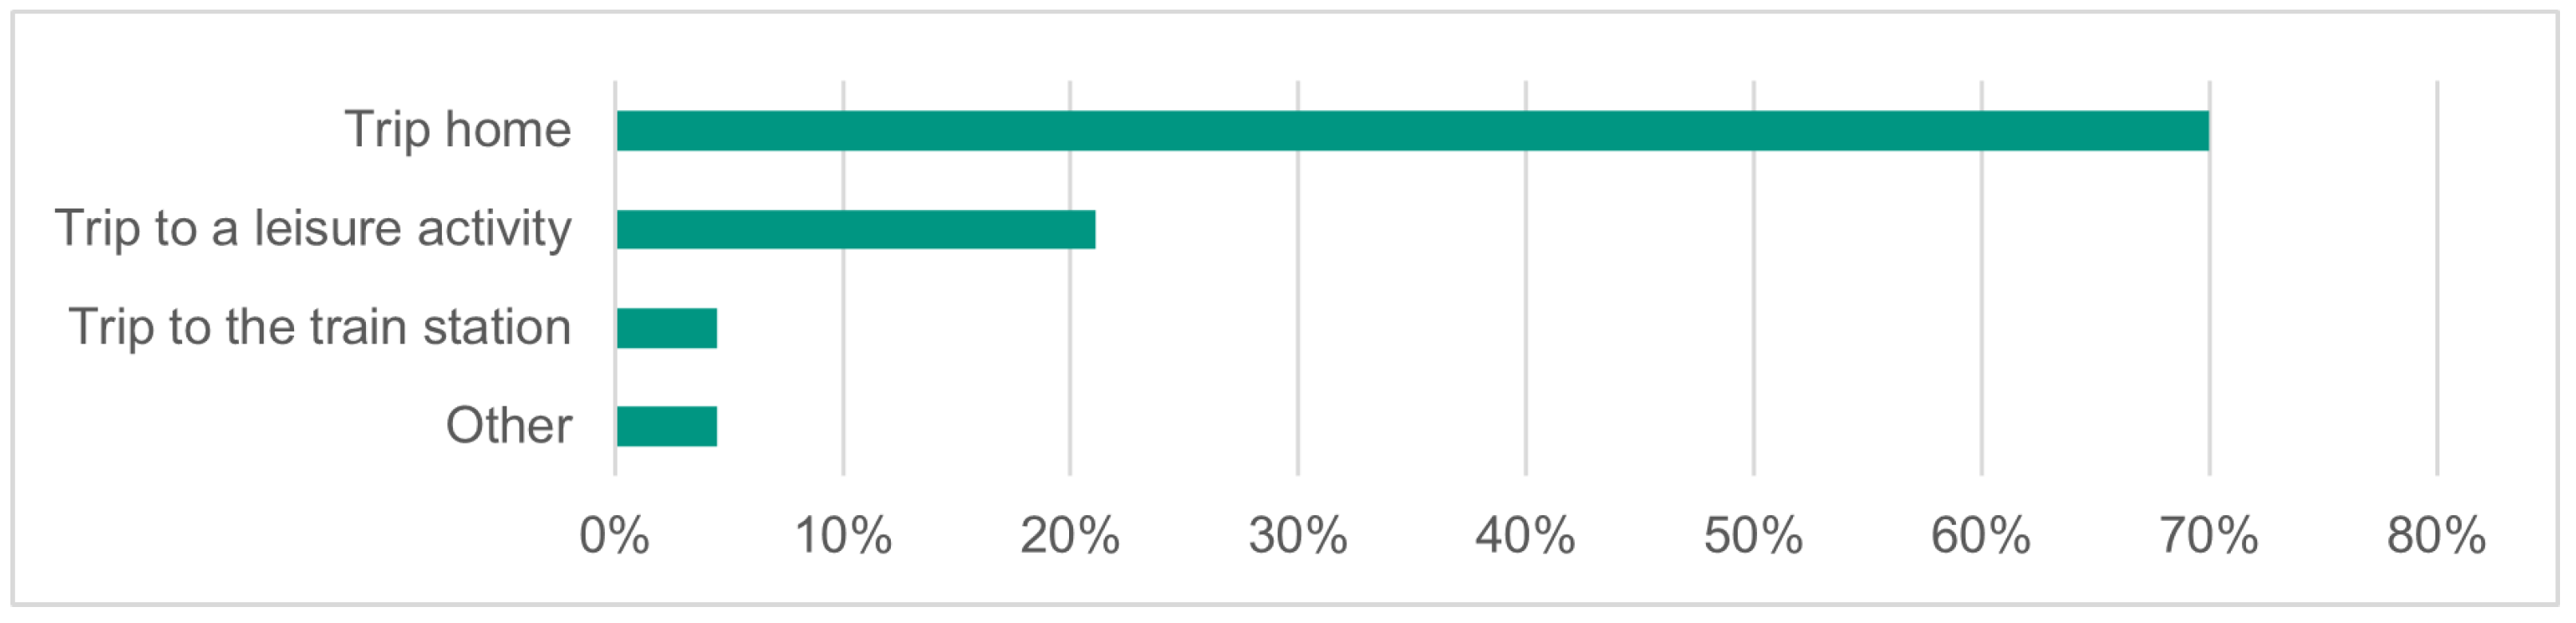
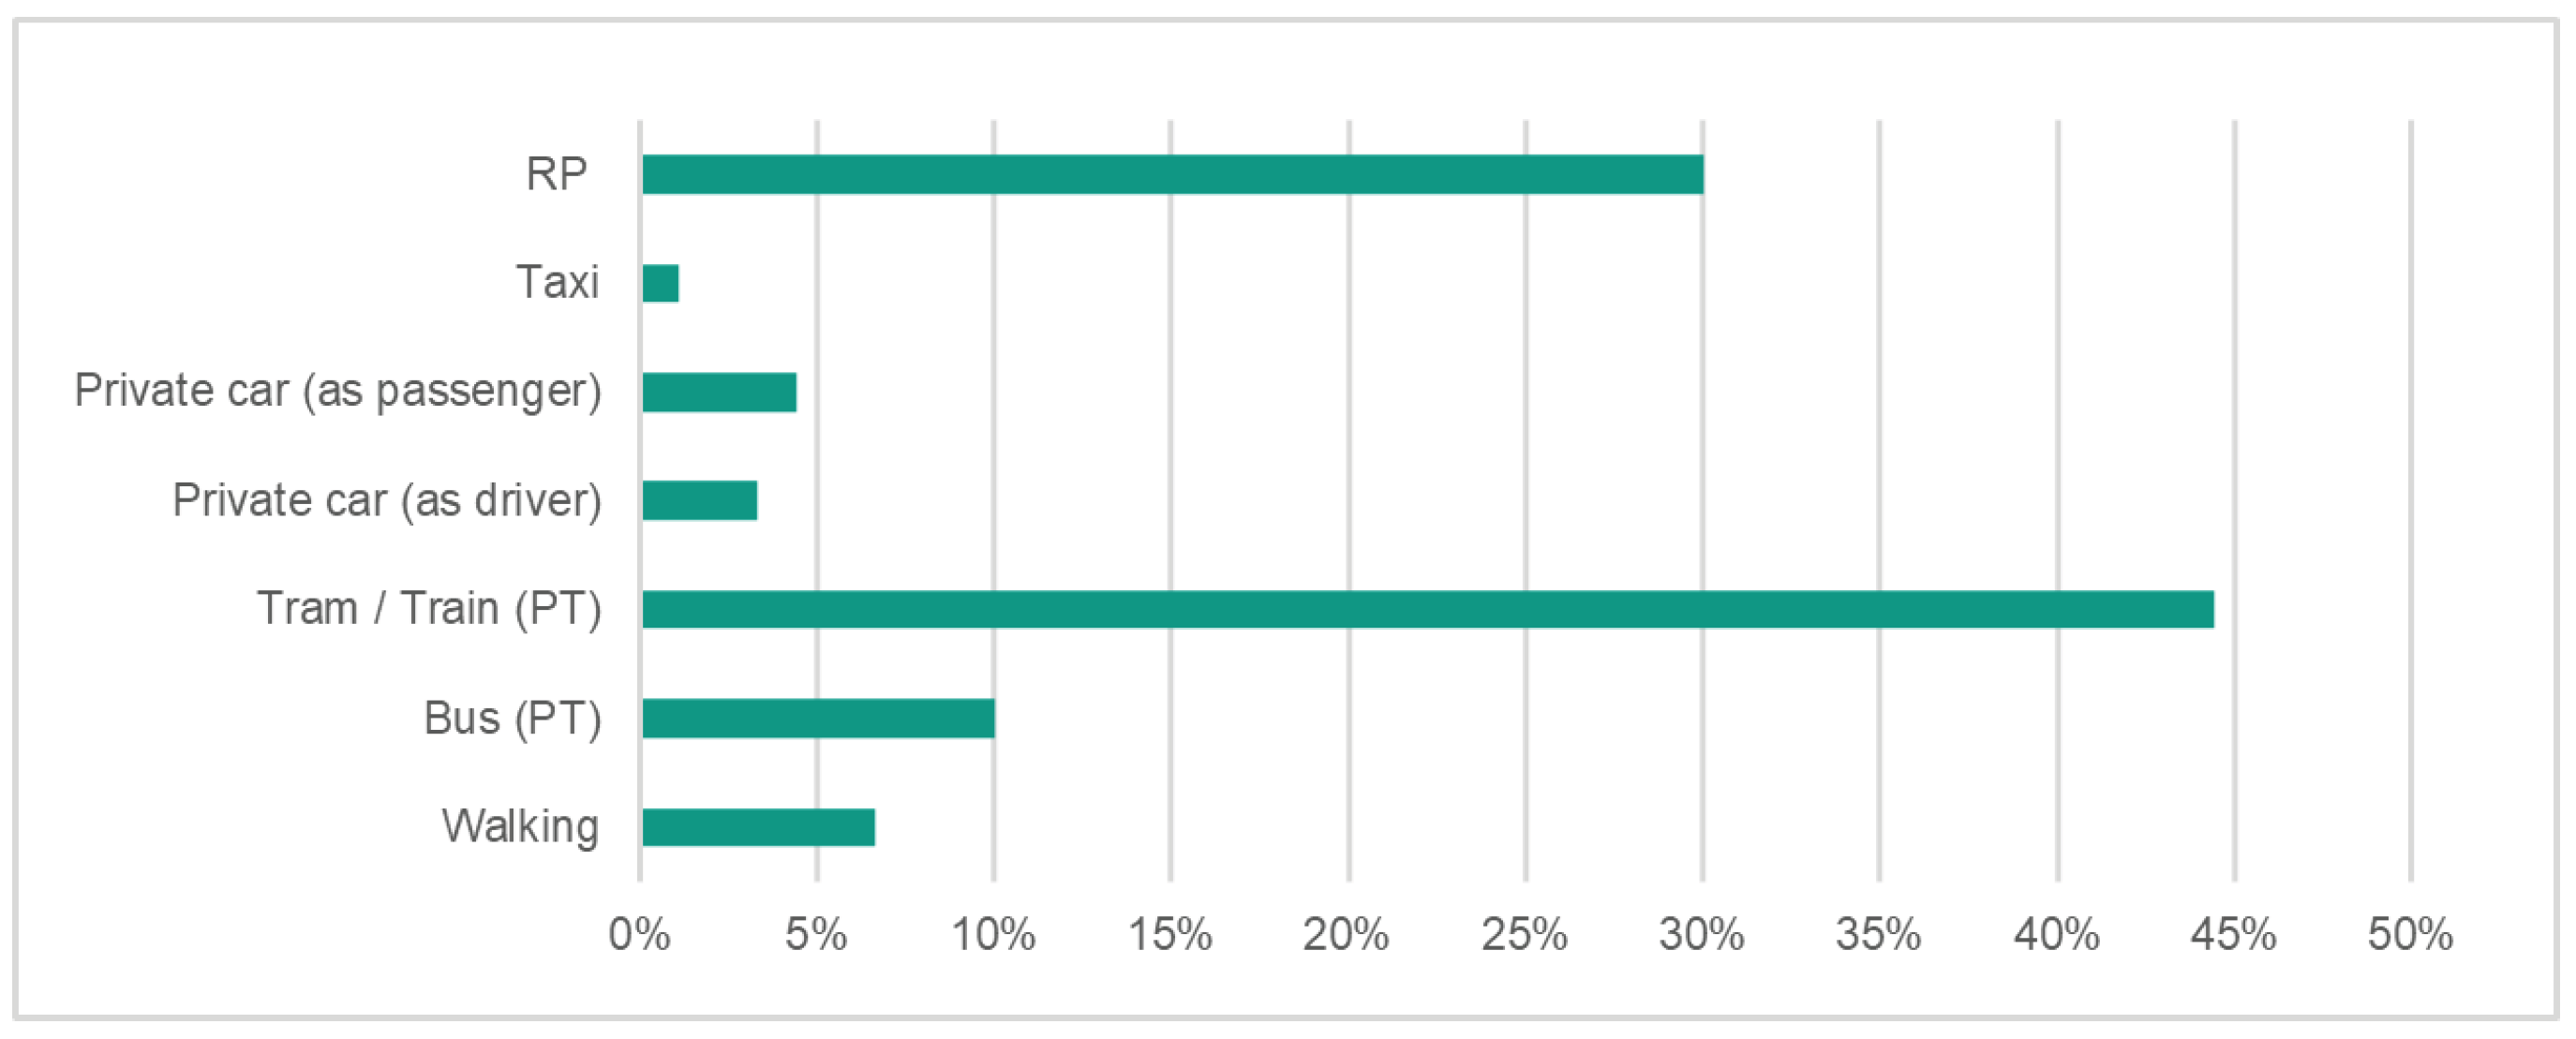
4.1. Revealed Preferences: Nighttime RP Usage and Perceptions

Survey-based insights into actual use patterns of the local RP nighttime service indicate currently low adoption rates, as illustrated in Figure 3. Among all respondents, who have ever used the RP service fips (n = 228), only 40% (n = 91) had used the service during nighttime. Of these, 15.4% reported using the service nearly every weekend, another 15.4% used it 2–3 times per month, and 27.5% had tried it only once.
Since the nighttime service is not widely used, it is important to understand the barriers to its adoption (see Figure 4). Among both daytime-only RP users (n = 138) and non-users with RP awareness (n = 271), the most frequently cited reason for non-use was simply not traveling at night (67% and 55%, respectively). However, 24% of daytime-only users and over 40% of non-users reported being unaware of the nighttime service, indicating substantial information deficits. Additionally, RP non-users show a significantly stronger preference for using the private car compared to daytime-only RP users, aligning with findings by Kapitza [24] and Bromley et al. [25], who documented increased nighttime car usage. Furthermore, operational barriers such as limited service areas ( 20% of RP non-users) and failed booking attempts (8% of RP daytime-only users) point to functional shortcomings or a limited number of operating vehicles during nighttime. Notably, safety concerns were rarely reported as a barrier to nighttime RP use. Taken together, these findings suggest that addressing both informational and operational barriers offers considerable potential to increase awareness and, ultimately, adoption of RP nighttime services.
The majority of nighttime RP trips (70%) were for returning home, often following leisure-related activities (21%). Only a minority used the service for accessing or leaving PT stations (4%) or for other purposes (4%), as depicted in Figure 5. This usage pattern underscores the critical role of flexible demand-responsive services in bridging accessibility gaps during off-peak hours, especially when traditional PT networks operate at reduced frequencies and limited coverage.
The analysis of modal combinations shows that many users combine RP with PT: 44% used PT (tram/train or bus) for either the outbound or return trip while using RP for the other. Additionally, 30% used RP for both directions, highlighting its key role in complementing PT, especially during off-peak hours. Figure 6 illustrates the transport modes used before and after nighttime RP trips.
Overall, the analysis of revealed preferences indicates low current usage of the service during nighttime hours, primarily due to low awareness among potential users. However, the service is particularly valued for convenient return trips. Enhancing user awareness and expanding service coverage could significantly improve nighttime mobility.

4.2. Stated Preferences for Daytime and Nighttime Travel Mode

To analyze travel mode preferences at different times of day, several model specifications were estimated and compared. The process started with a baseline MNL model including only ASCs. Explanatory variables, such as level of service and other travel-related attributes, were then incrementally added. Model performance was assessed using LL and BIC, as previously described. To address potential IIA violations, several NL models with alternative structures were tested. Table 3 summarizes the results.
The final NL model (NL extended) achieved the lowest BIC and the highest LL, indicating superior model fit. Moreover, all estimated nest-specific scale parameters ( λ ) lie strictly between 0 and 1 and are significantly different from 1, supporting the statistical validity of the nesting structure and justifying its selection for the final analysis.
The estimated nested logit model reveals significant differences in travel mode preferences between daytime and nighttime contexts, as shown in Table 4. The findings suggest that individuals are less sensitive to travel times and costs when traveling by RP or private car at night. This is consistent, on the one hand, with findings by Kapitza [24] and Bromley et al. [25], who report a significantly increased likelihood of nighttime car use. On the other hand, the results also align with Goedde et al. [1] and Shulika et al. [3], who found peak RP demand around midnight, particularly when PT options are limited. Moreover, access and egress times for RP services are perceived less negatively at night, indicating that users are more willing to accept longer walking distances to and from the service during nighttime hours. In terms of gender differences, women exhibit a lower preference for RP and walking at night compared to daytime, likely due to reduced perceived safety during nighttime, as documented by previous research [25,26,27]. Similarly, bicycle owners shift toward private car use at night, likely due to reduced visibility and safety concerns, though biking remains their dominant mode overall. Among individuals with mobility impairments, PT is preferred during the day, whereas taxis are more frequently chosen at night, suggesting that differences in service availability, accessibility, or perceived convenience may influence this shift. For trips to major transport hubs, RP appears to be the preferred mode during the day, particularly for accessing the main train station.
At night, however, the distribution of mode choices becomes more balanced, with taxis slightly more frequently chosen than RP or PT, possibly due to their greater reliability as connecting modes to scheduled rail services. In contrast, for leisure and homebound trips, private car usage is less common at night than during the day. This pattern may be related to a higher prevalence of social activities in walkable areas, reducing the need for private car use during evening hours. In terms of service familiarity, individuals who are familiar with RP services are more likely to choose this mode both during the day and at night. Additionally, they show a significantly lower tendency to use the private car at night, suggesting that RP may function as a perceived substitute for private car use, especially in nighttime contexts. However, among frequent RP users, a stronger preference for RP is only evident during the daytime. This difference may be linked to lower demand or altered mobility patterns during nighttime. A similar day–night divide is observed in relation to PT pass ownership, which is positively associated with PT use and negatively associated with private car use during the day. These effects are not observed at night, which may be related to reduced PT service frequency, limited spatial coverage, or decreased perceived safety of transit systems during nighttime. Finally, private car ownership, parenthood, and employment status are all associated with reduced PT usage during the daytime. This finding may reflect an increased need for flexible mobility or a stronger preference for the convenience of private modes among these groups. However, at night, this relationship appears to weaken, possibly due to a shift toward non-obligatory activities or changes in evening activity patterns.
The nested logit model provides deeper insights into how individuals make travel decisions. Its parameters indicate moderate correlation in the unobserved utility components of walking and cycling ( λ = 0.55), suggesting these modes are partially substitutable. A higher parameter for private car and PT ( λ = 0.81) points to weaker substitutability, though shared use contexts such as commuting may explain their grouping. RP is not part of any nest, indicating that it is perceived as a distinct alternative with a unique utility structure. These results suggest that RP is not primarily substituted by a specific mode but rather competes broadly across multiple modes.
In summary, based on the stated preference data, nighttime travel is characterized by a decreased sensitivity to both travel time and travel cost. Concurrently, there is a significant shift towards increased private car usage, particularly among women, which can likely be attributed to heightened safety concerns as well as the reduced availability and frequency of PT services during night hours. RP services emerge as a valuable alternative, especially among users familiar with the service, functioning as a partial substitute for private car use at night and potentially contributing to a reduction in individual motorized traffic.

5. Conclusions

RP services, which allow passengers with similar destinations to share rides, present significant opportunities to enhance urban mobility by complementing existing PT systems and offering viable alternatives to private car use. Understanding usage patterns, particularly temporal variations between day and night, is essential for optimizing these services. This study emphasizes the importance of temporal differentiation in RP preferences, using the case of the local RP service fips, which is integrated into the PT network in Mannheim, Germany. In 2024, a survey was conducted that included both a stated choice experiment and revealed preference questions, yielding a sample of 566 valid responses. To analyze differences in mode choices between daytime and nighttime contexts, a nested logit model was estimated based on the stated choice data. The findings underscore that nighttime mobility exhibits distinct behavioral patterns, including a decreased sensitivity to travel time and cost and a greater reliance on private cars, particularly among women, most likely due to safety concerns and the limited availability of PT. Moreover, the reduced sensitivity to travel time observed in nighttime contexts suggests a potential for a more efficient and spatially optimized stop network during these periods to improve vehicle utilization and reduce operational costs. An analysis of the revealed preference data further shows that the RP service during nighttime hours mainly attracts younger users, while a substantial portion of respondents reported not being active during weekend nights. Nonetheless, the actual utilization of RP services at night remains low. This appears to be driven less by a lack of demand and more by structural limitations, such as low public awareness and insufficient service availability, as reflected in the frequency of rejected booking attempts during nighttime. This implies that low usage is not merely the result of low demand, but also of structural barriers on both the supply and information sides. Overcoming these barriers through targeted information campaigns and a strategic expansion of nighttime service capacity could substantially promote more sustainable mobility during nighttime. Overall, the results align with prior research highlighting the increasing importance of flexible mobility solutions when conventional PT is less accessible or perceived as unsafe. However, it should be noted that the survey sample is not representative of the population, which limits the generalizability of these results. Moreover, due to the recruitment strategy, particularly via the social media channels of the local PT provider rnv, the sample may overrepresent PT-affine individuals, potentially leading to a self-selection bias that influences mode preferences. In addition, the intermodal scenario, originally included for daytime settings, was deliberately omitted from the nighttime experiment to isolate time-of-day effects. This limits the findings to unimodal choices during nighttime. Future research should deepen the understanding of how nighttime-specific conditions, such as safety concerns, limited service availability, and reduced PT coverage, influence travel decisions across diverse population groups. In particular, studies using more representative samples and including intermodal scenarios could help to better capture the full range of mobility needs and evaluate the role of RP services as a complement to PT under real-world nighttime constraints. Although safety concerns were rarely reported explicitly by non-users in this study, future research should incorporate qualitative interviews to better capture implicit safety-related barriers, particularly among women, that may not be fully reflected in standardized survey responses. From a modeling perspective, integrating the estimated discrete choice models into agent-based models (ABMs) enables the simulation of individual travel decisions and their system-level impacts under varying nighttime and off-peak conditions. This allows for a differentiated assessment of modal shifts, network utilization and cannibalization effects between RP and PT, supporting the design of adaptive, demand-responsive mobility strategies. These insights contribute to a better understanding of nighttime travel behavior.

Author Contributions

Conceptualization, M.E.G., N.K.-W. and M.K.; methodology, M.E.G.; software, M.E.G.; validation, M.E.G. and N.K.-W.; formal analysis, M.E.G. and N.K.-W.; investigation, M.E.G.; data curation, M.E.G. and N.K.-W.; writing—original draft preparation, M.E.G., A.-S.V. and N.K.-W.; writing—review and editing, M.E.G., N.K.-W. and A.-S.V.; visualization, M.E.G. and N.K.-W.; supervision, M.K. and P.V.; project administration, M.K., N.K.-W. and M.E.G.; funding acquisition, M.K. All authors have read and agreed to the published version of the manuscript.

Funding

This work was funded by Rhein-Neckar-Verkehr GmbH. The article processing charge was covered by the KIT-Publication Fund of the Karlsruhe Institute of Technology.

Institutional Review Board Statement

Not applicable.

Informed Consent Statement

Not applicable.

Data Availability Statement

The data are not publicly available due to legal reasons.

Conflicts of Interest

The authors declare no conflict of interest.

References

  1. Gödde, J.; Ruhrort, L.; Allert, V.; Scheiner, J. User characteristics and spatial correlates of ride-pooling demand–Evidence from Berlin and Munich. J. Transp. Geogr. 2023, 109, 103596. [Google Scholar] [CrossRef]
  2. Ke, J.; Yang, H.; Zheng, Z. On ride-pooling and traffic congestion. Transp. Res. Part B Methodol. 2020, 142, 213–231. [Google Scholar] [CrossRef]
  3. Shulika, O.; Bujak, M.; Ghasemi, F.; Kucharski, R. Spatiotemporal variability of ride-pooling potential–Half a year New York City experiment. J. Transp. Geogr. 2024, 114, 103767. [Google Scholar] [CrossRef]
  4. Wang, Y.; Zheng, B.; Lim, E.-P. Understanding the effects of taxi ride-sharing—A case study of Singapore. Comput. Environ. Urban Syst. 2018, 69, 124–132. [Google Scholar] [CrossRef]
  5. Fagnant, D.J.; Kockelman, K.M. Dynamic ride-sharing and fleet sizing for a system of shared autonomous vehicles in Austin, Texas. Transportation 2018, 45, 143–158. [Google Scholar] [CrossRef]
  6. Shaheen, S.; Chan, N. Mobility and the sharing economy: Potential to facilitate the first-and last-mile public transit connections. Built Environ. 2016, 42, 573–588. [Google Scholar] [CrossRef]
  7. Araldo, A.; de Palma, A.; Arib, S.; Gauthier, V.; Sere, R.; Chaabouni, Y.; Kharouaa, O.; Ari, A. Pooling for first and last mile: Integrating carpooling and transit. arXiv 2020, arXiv:2010.13438. [Google Scholar]
  8. Kostorz-Weiss, N.; Engelhardt, R.; Wilkes, G.; Dandl, F.; Heilig, M.; Zwick, F.; Fraedrich, E.; Bogenberger, K.; Vortisch, P.; Kagerbauer, M. Assessing the Role of Ride-Pooling in Urban Transportation Systems Using a Large-Scale Integrated Supply and Demand Model-Investigations Based on Empirical Data from Europe’s Largest Ride-Pooling Service. 2024; Under review. [Google Scholar] [CrossRef]
  9. Burghard, U.; Scherrer, A. Sharing vehicles or sharing rides-Psychological factors influencing the acceptance of carsharing and ridepooling in Germany. Energy Policy 2022, 164, 112874. [Google Scholar] [CrossRef]
  10. Lokhandwala, M.; Cai, H. Dynamic ride sharing using traditional taxis and shared autonomous taxis: A case study of NYC. Transp. Res. Part C Emerg. Technol. 2018, 97, 45–60. [Google Scholar] [CrossRef]
  11. Currie, G.; Delbosc, A.; Mahmoud, S. Factors Influencing Young Peoples’ Perceptions of Personal Safety on Public Transport. J. Public Transp. 2013, 16, 1–19. [Google Scholar] [CrossRef]
  12. Orozco-Fontalvo, M.; Soto, J.; Arévalo, A.; Oviedo-Trespalacios, O. Women’s perceived risk of sexual harassment in a Bus Rapid Transit (BRT) system: The case of Barranquilla, Colombia. J. Transp. Health 2019, 14, 100598. [Google Scholar] [CrossRef]
  13. Zwick, F.; Axhausen, K.W. Ride-pooling demand prediction: A spatiotemporal assessment in Germany. J. Transp. Geogr. 2022, 100, 103307. [Google Scholar] [CrossRef]
  14. Schaller, B. The New Automobility: Lyft, Uber and the Future of American Cities. 2018. Available online: https://trid.trb.org/View/1527868 (accessed on 27 March 2025).
  15. Anzenhofer, F.; Fleckenstein, D.; Klein, R.; Steinhardt, C. Analyzing the Impact of Demand Management in Rural Shared Mobility-on-Demand Systems. SRN Electron. J. 2023, 4682056. [Google Scholar] [CrossRef]
  16. Irannezhad, E.; Mahadevan, R. Examining factors influencing the adoption of solo, pooling and autonomous ride-hailing services in Australia. Transp. Res. Part C Emerg. Technol. 2022, 136, 103524. [Google Scholar] [CrossRef]
  17. Ke, J.; Yang, H.; Li, X.; Wang, H.; Ye, J. Pricing and equilibrium in on-demand ride-pooling markets. Transp. Res. Part B Methodol. 2020, 139, 411–431. [Google Scholar] [CrossRef]
  18. Soza-Parra, J.; Kucharski, R.; Cats, O. The shareability potential of ride-pooling under alternative spatial demand patterns. Transp. A Transp. Sci. 2024, 20, 2140022. [Google Scholar] [CrossRef]
  19. Kapitza, J. Freitagnachts unterwegs im ÖPNV. Standort 2022, 46, 68–75. [Google Scholar] [CrossRef]
  20. Scagnolari, S.; Walker, J.; Maggi, R. Young drivers’ night-time mobility preferences and attitude toward alcohol consumption: A Hybrid Choice Model. Accid. Anal. Prev. 2015, 83, 74–89. [Google Scholar] [CrossRef]
  21. McCray, T.; Brais, N. Exploring the Role of Transportation in Fostering Social Exclusion: The Use of GIS to Support Qualitative Data. Netw. Spat. Econ. 2007, 7, 397–412. [Google Scholar] [CrossRef]
  22. Yu, S.; Han, X.; Liu, L.; Liu, G.; Cheng, M.; Ke, Y.; Li, L. Exploring usage pattern variation of free-floating bike-sharing from a night travel perspective. Sci. Rep. 2024, 14, 16017. [Google Scholar] [CrossRef]
  23. Faghih-Imani, A.; Hampshire, R.; Marla, L.; Eluru, N. An empirical analysis of bike sharing usage and rebalancing: Evidence from Barcelona and Seville. Transp. Res. Part A Policy Pract. 2017, 97, 177–191. [Google Scholar] [CrossRef]
  24. Kapitza, J. How people get to work at night. A discrete choice model approach towards the influence of nighttime on the choice of transport mode for commuting to work. J. Transp. Geogr. 2022, 104, 103418. [Google Scholar] [CrossRef]
  25. Bromley, R.; Thomas, C.; Millie, A. Exploring safety concerns in the night-time city: Revitalising the evening economy. Town Plan. Rev. 2000, 71, 71–96. [Google Scholar] [CrossRef]
  26. Gelino, B.W.; Graham, M.E.; Strickland, J.C.; Glatter, H.W.; Hursh, S.R.; Reed, D.D. Using behavioral economics to optimize safer undergraduate late-night transportation. J. Appl. Behav. Anal. 2024, 57, 117–130. [Google Scholar] [CrossRef]
  27. Kapitza, J. Commuting at night: How time of day affects commuter perceptions. Travel Behav. Soc. 2024, 35, 100750. [Google Scholar] [CrossRef]
  28. Heinen, E.; Maat, K.; van Wee, B. Day-to-Day Choice to Commute or Not by Bicycle. Transp. Res. Rec. 2011, 2230, 9–18. [Google Scholar] [CrossRef]
  29. Kostorz, N.; Fraedrich, E.; Kagerbauer, M. Usage and user characteristics—insights from Moia, Europe’s largest ridepooling service. Sustainability 2021, 13, 958. [Google Scholar] [CrossRef]
  30. Zwick, F.; Fraedrich, E.; Kostorz, N.; Kagerbauer, M. Ridepooling als ÖPNV-Ergänzung: Der Moia-Nachtservice während der Corona-Pandemie. Int. Verkehrswesen 2020, 72, 84–88. [Google Scholar]
  31. Kuehnel, N.; Zwick, F.; Kuhlen, T.-E. Revealed demand patterns of people with disabilities in on-demand ridepooling. Eur. J. Transp. Infrastruct. Res. 2025, 25, 33–58. [Google Scholar] [CrossRef]
  32. Krauss, K.; Krail, M.; Axhausen, K.W. What drives the utility of shared transport services for urban travellers? A stated preference survey in German cities In. Case Stud. Transp. Policy 2021, 9, 1433–1445. [Google Scholar] [CrossRef]
  33. Hou, Y.; Garikapati, V.; Weigl, D.; Henao, A.; Moniot, M.; Sperling, J. Factors Influencing Willingness to Pool in Ride-Hailing Trips. Transp. Res. Rec. 2020, 2674, 419–429. [Google Scholar] [CrossRef]
  34. Rhein-Neckar-Verkehr GmbH. Fips—Personen-Shuttle. Rhein-Neckar-Verkehr GmbH. 2025. Available online: https://www.rnv-online.de/english/ (accessed on 27 March 2025).
  35. Institute for Transport Studies (Karlsruhe Institute of Technology). Accompanying Research fips. Institute for Transport Studies (Karlsruhe Institute of Technology). 2025. Available online: https://www.ifv.kit.edu/english/21_1650.php (accessed on 27 March 2025).
  36. Goerguelue, M.E.; Barthelmes, L.; Kagerbauer, M. Accompanying Research on Automated Minibusses in Monheim am Rhein: Report on Results; Karlsruhe Institute of Technology: Karlsruhe, Germany, 2024. [CrossRef]
  37. Bundesministerium für Verkehr und Digitale Infrastruktur, infas, Deutsches Zentrum für Luft- und Raumfahrt, Institut für Verkehrsplanung und Transportsysteme, infas360. Mobilität in Tabellen (MiT 2017). Bundesministerium für Verkehr und Digitale Infrastruktur. 2018. Available online: https://mobilitaet-in-tabellen.bast.de/ (accessed on 27 March 2025).
  38. ChoiceMetrics. Ngene 1.2: User Manual & Reference Guide. 2018. Available online: https://dl.icdst.org/pdfs/files4/a4dfa4b81043c641ec83525d32e8e33f.pdf (accessed on 27 March 2025).
  39. McFadden, D. Conditional logit analysis of qualitative choice behavior. In Frontiers in Econometrics; Zarembka, P., Ed.; Academic Press: New York, NY, USA, 1974; pp. 105–142. [Google Scholar]
  40. Train, K.E. Discrete Choice Methods with Simulation; Cambridge University Press: Cambridge, UK, 2003. [Google Scholar]
  41. Hermaputi, R.L.; Hua, C. Decoding Jakarta Women’s Non-Working Travel-Mode Choice: Insights from Interpretable Machine-Learning Models. Sustainability 2024, 16, 8454. [Google Scholar] [CrossRef]
  42. Hagenauer, J.; Helbich, M. A Comparative Study of Machine Learning Classifiers for Modeling Travel Mode Choice. Expert Syst. Appl. 2017, 78, 273–282. [Google Scholar] [CrossRef]
  43. Martín-Baos, J.Á.; López-Gómez, J.A.; Rodriguez-Benitez, L.; Hillel, T.; García-Ródenas, R. A prediction and behavioural analysis of machine learning methods for modelling travel mode choice. Transp. Res. Part C Emerg. Technol. 2023, 156, 104318. [Google Scholar] [CrossRef]
  44. Koppelman, F.; Bhat, C. A Self Instructing Course in Mode Choice Modelling: Multinomial and Nested Logit Models; U.S. Department of Transportation, Federal Transit Administration: Washington, DC, USA, 2006.
  45. Hess, S.; Palma, D. Apollo: A Flexible, Powerful Cust. Free. Package Choice Model Estim. Application. J. Choice Model 2019, 32, 100170. [Google Scholar] [CrossRef]
  46. Schwarz, G. Estimating the Dimension of a Model. Ann. Stat. 1978, 6, 461–464. [Google Scholar] [CrossRef]
Figure 1. Features of the fips service (Source: rnv).
Applsci 15 07774 g001
Figure 2. Design of the stated choice experiment.
Applsci 15 07774 g002
Figure 3. Frequency of usage of the RP nighttime service by all RP users (n = 228).
Applsci 15 07774 g003
Figure 4. Reasons for the previous non-use of the RP nighttime service (n = 138).
Applsci 15 07774 g004
Figure 5. Trip purposes of RP nighttime usage (n = 90).
Applsci 15 07774 g005
Figure 6. Transport modes used before and after nighttime RP trips (n = 90).
Applsci 15 07774 g006
Table 1. Sociodemographic and mobility characteristics of RP (non-)user groups.
CategoryDay and Night
RP Users
(n = 90|15%)
Daytime-only RP Users
(n = 138|23%)
Non RP Users
(n = 271|62%)
Germany
(2017 [37])
Sociodemographics
Female50.0%51.4%51.7%49%
Average age [years]42.951.651.344.4
Individual with mobility impairments14.4%32.6%10.5%11%
Employed58.9%60.1%64.3%47%
Student10.0%2.1%5.2%2%
Retired20.0%30.4%22.0%21%
Lives in Mannheim city90.0%86.2%84.8%
Availability of mobility tools
Driver’s license58.9%71.7%84.2%87%
Avg. number of cars per household0.790.831.21.1
RP use at least once per week46.7%40.6%
Public transit pass64.4%48.6%37.0%18%
Bicycle available64.4%64.5%75.1%73%
Car-sharing membership10.0%8.7%6.0%3%
Bike-sharing membership10.0%10.1%8.1%
E-scooter-sharing membership17.8%10.1%8.9%
Table 2. Attribute levels in the stated choice experiment.
AttributesWalkingBicyclePrivate CarPTRPTaxi
Travel time (min)25, 35, 45, 559, 14, 19, 245, 8, 11, 146, 9, 12, 156, 9, 12, 155, 8, 11, 14
Egress time (min)--2, 4, 64, 6, 82, 4-
Degress time (min)--1, 3, 52, 4, 62, 4, 6-
Waiting time—day (min)---4, 8, 124, 8, 12-
Waiting time—night (min)---15, 30, 4515, 30, 452, 7, 12
Transfer (within PT)---0, 1--
Travel costs (EUR)--1.5, 3, 4.50, 1.7, 3.2, 4.70, 1, 3.5, 4.5, 5.512, 18, 24
Table 3. Model comparison.
ModelLLBIC#Parameters
MNL base 4825.03 9690.71 5
NL base 4804.17 9665.25 7
MNL extended 4185.17 8825.64 56
NL extended 4174.64 8820.84 58
Table 4. Estimation results for the nested logit model on mode choice.
WalkingBicyclePrivate CarPTRPTaxi
Base attributes
Alternative specific constants0.400.82 **0.230.4−1.26 ***
Travel time (min)
   Day−0.05 ***−0.07 ***−0.35 **0−0.06 ***n.a.
   Night−0.04−0.07 ***000−0.04 **
Travel cost (EUR)
   Dayn.a.n.a.−0.14 ***−0.17 ***−0.17 ***0
   Nightn.a.n.a.−0.06 *000
Egress/Degress time (min)
   Dayn.a.n.a.−0.05 ***0−0.1 ***n.a.
   Nightn.a.n.a.−0.07 ***−0.05 ***0n.a.
Waiting time (min)
   Dayn.a.n.a.n.a.000
   Nightn.a.n.a.n.a.−0.02 ***−0.01 ***0
Further attributes
Female
   Day0.37 *00.57 ***0.55 ***0.62 ***n.a.
   Night000.93 ***0.75 ***0.42 **0.71 ***
Bicycle ownership
   Day−1.1 ***0−1.27 ***−1.32 ***−1.38 ***n.a.
   Night−0.9 ***0−0.83 ***−1.58 ***−1.5 ***−1.12 ***
Individual with mobility impairments
   Day0000.54 *0n.a.
   Night000001.32 ***
Trip to main train station
   Day0000.87 ***1.07 ***n.a.
   Night0000.71 **0.76 ***0.86 ***
Leisure trip
   Day00000n.a.
   Night00−0.45 *000
Home trip
   Day00000n.a.
   Night00−0.42 *000
RP service awareness
   Day0.38 *0001.06 ***n.a.
   Night00−1.03 ***01.11 ***0
RP frequent user
   Day00000.61 ***n.a.
   Night000000
PT pass ownership
   Day00−0.73 ***0.68 ***0n.a.
   Night000000
Private car ownership
   Day000−0.5 ***0n.a.
   Night000000
Child(-ren) in household
   Day000−0.35 *0n.a.
   Night000000
Employed
   Day000−0.5 ***0n.a.
   Night000000
***, **, * indicate significance at the 1%, 5%, and 10% levels, respectively. n.a. indicates that the value is not applicable for the respective specification. Bicycle serves as a reference mode for model estimation LL(NL) = −4174.64, Adj. ρ2 = 0.2149, AIC = 8465.28, BIC = 8820.84.
Disclaimer/Publisher’s Note: The statements, opinions and data contained in all publications are solely those of the individual author(s) and contributor(s) and not of MDPI and/or the editor(s). MDPI and/or the editor(s) disclaim responsibility for any injury to people or property resulting from any ideas, methods, instructions or products referred to in the content.

