Abstract
Adobe churches are representative of Andean architectural heritage, yet their structural vulnerability to seismic events remains a significant concern. This study evaluates the seismic performance of the 17th-century Church of Santo Tomás de Aquino in Rondocan, Peru, an adobe building that underwent conservation work in the late 1990s. The assessment combines in situ inspections and experimental testing with advanced nonlinear numerical modeling. A finite-element macro-model was developed and calibrated using sonic and ambient vibration tests to replicate the observed structural behavior. Nonlinear static (pushover) analyses were performed in the four principal directions to identify failure mechanisms and to evaluate seismic capacity using the Peruvian seismic code. Kinematic limit analyses were conducted to assess out-of-plane mechanisms using force- and displacement-based criteria. The results revealed critical vulnerabilities in the rear façade and lateral walls, particularly in terms of out-of-plane collapse, while the main façade exhibited a higher capacity but a brittle failure mode. This study illustrates the value of advanced numerical simulations, calibrated with field data, as effective tools for assessing seismic vulnerability in historic adobe buildings. The outcomes highlight the necessity of strengthening measures to balance life safety requirements with preservation goals.
1. Introduction
Adobe is one of the most widely used traditional construction materials in seismic regions, particularly throughout the Andean highlands. In this context, historic adobe churches hold significant architectural, cultural, and religious value. However, despite their historical importance and widespread use, adobe structures are inherently vulnerable to seismic actions due to their brittle material behavior, low mechanical strength, and inadequate wall-to-wall and wall-to-diaphragm connections. These vulnerabilities often result in characteristic damage patterns, including orthogonal wall separation, in-plane shear cracking, and out-of-plane wall collapse. Seismic performance is further compromised by the lack of box-like action, which is attributed to weak wall interconnections, insufficient bracing, and non-rigid diaphragms. In addition, adobe masonry is characterized by relatively low mechanical properties. In air-dry conditions, compressive strength typically ranges between 1–3 MPa for adobe units and 0.5–3 MPa for the masonry assembly [1]. The Young’s modulus of adobe masonry is generally below 1 GPa, with minimum values as low as 100 MPa reported [1].
Recognizing the critical need to protect earthen architectural heritage from seismic risks, the Getty Conservation Institute (GCI) initiated two major projects: the Getty Seismic Adobe Project (GSAP) and the Seismic Retrofitting Project (SRP). GSAP, launched in the early 1990s, aimed to develop minimally invasive retrofitting techniques for historic adobe buildings. It combined laboratory testing of adobe models on shake tables with post-earthquake field surveys (most notably after the 1994 Northridge earthquake) to evaluate the effectiveness of retrofitting methods and their compatibility with conservation principles [2,3]. The SRP, which commenced in 2009, focused on applying these principles in the Peruvian Andes [4,5]. The project developed and tested a methodology for the seismic retrofitting of historic churches, as exemplified by the intervention at the Church of Kuñotambo, which integrates structural analysis, field testing, and traditional construction techniques [6].
Recent efforts emphasize the use of integrated assessment methodologies for historic adobe structures. These approaches combine detailed on-site investigations with advanced numerical simulations to improve reliability. For example, Aguilar et al. [7] proposed a comprehensive workflow that begins with high-definition 3D laser scanning and photogrammetry to obtain accurate geometry, along with ambient vibration testing to identify dynamic properties, and then the generation of calibrated finite element (FEM) models for nonlinear analysis. Using this methodology on a 16th-century adobe church in Peru, the researchers were able to predict the likely seismic damage patterns, notably global rocking of the façade and partial collapse of the gable tympanum, which corresponded closely to observed vulnerabilities. Similarly, Briceño et al. [8] demonstrated the efficacy of an integrated multi-tool assessment on the Andahuaylillas church in Cusco, combining non-destructive evaluation (laser scanning, infrared thermography, sonic tests) with model updating and pushover analysis. The results showed that a combination of such techniques can properly predict the observed damage from past earthquakes. Advanced case studies like these validate that an interdisciplinary approach yields the most insight into an adobe monument’s seismic performance.
Researchers have also studied other adobe building typologies under seismic actions. Tarque et al. [9,10] have demonstrated the potential of FEM modeling using continuum damage plasticity approaches to replicate both in-plane and out-of-plane failure modes under dynamic loading in typical one-story Peruvian adobe dwellings using a displacement-based framework. Similar efforts have emerged beyond South America. Momin et al. [11] applied nonlinear dynamic simulation to Portuguese adobe buildings, introducing novel damage metrics (crack propagation and volume loss) to derive fragility and fatality risk curves. Li et al. [12] explored seismic vulnerability of Chinese earthen buildings through statistical models.
Despite these significant contributions, many challenges remain in the field. The seismic behavior of adobe structures is complex and often nonlinear, involving multiple failure mechanisms such as rocking, sliding, and cracking. Experimental data on the inelastic response of adobe is limited, particularly for full-scale structures under realistic seismic loading. As a result, there is a strong need for advanced numerical tools that can accurately capture the nonlinear behavior of adobe buildings, predict critical failure modes, and assess seismic capacity in a performance-based framework. The calibration of these models remains challenging due to the variability in material properties and construction techniques, and their application to real-world heritage structures is still limited. Each historic adobe structure presents unique challenges that necessitate a case-by-case study. Factors such as architectural layout, construction quality, prior damage, and past interventions can differ widely and influence seismic behavior. Thus, continued in-depth assessments of individual heritage buildings are essential to refine our general understanding.
This study contributes to closing this gap by presenting structural performance and seismic safety assessment of the Church of Santo Tomás de Aquino, a 17th-century adobe church located in Rondocan, Cusco, Peru. The church comprises a single nave with a presbytery and two annexes (a baptistery and a sacristy), with thick adobe walls supporting a timber roof system composed of wooden trunks and clay tiles. Some walls are strengthened with buttresses. The building underwent conservation interventions between 1994 and 1997. The present research was developed under the auspices of the Getty Conservation Institute (GCI), with fieldwork, testing, and numerical modeling conducted by the University of Minho.
The main objective of this work is to evaluate the seismic performance and safety level of the church using advanced nonlinear numerical modeling techniques. A macro-modeling approach is adopted, treating adobe and stone masonry as homogenized continuum materials and incorporating nonlinear behavior through a total-strain rotating-crack model. Material properties were derived from in situ testing and literature data, and the model was calibrated using results from ambient vibration testing.
The assessment integrates nonlinear static (pushover) and kinematic analyses to identify critical collapse mechanisms and to estimate the seismic capacity relative to the seismic demand as defined in the Peruvian seismic code [13,14]. Particular emphasis is placed on the behavior of the lateral walls and façades. The methodology involves (1) the development of a finite element model including foundations, walls, and timber tie beams; (2) the calibration of material properties based on dynamic identification tests; (3) the execution of pushover analyses along the principal axes to derive capacity curves and to identify potential failure mechanisms; (4) the evaluation of performance against the Damage Limitation (DL) and Life Safety (LS) limit states using kinematic analyses; and (5) the interpretation of the results to assess structural safety.
Thus, this work also contributes to the growing body of knowledge on the seismic assessment of heritage adobe buildings by demonstrating the applicability and limitations of advanced numerical tools within a conservation-driven framework. A key contribution of this work is the integrated analytical–numerical strategy, which combines kinematic limit analysis with nonlinear FEM modeling. This dual approach enables cross-validation of failure mechanisms and seismic capacity estimates, improving confidence in the results, this being an important factor given the uncertainties typically associated with historic structures. By providing a step-by-step process of its implementation and calibration, this study also contributes to replicability and methodological transparency, enabling its adaptation to other adobe heritage buildings. Although several studies present detailed analyses, they often lack a clear connection between their results and a performance-based or code-aligned context, which limits their utility for informing risk mitigation or conservation decisions. These gaps highlight the need for assessment methods that combine analytical and numerical tools, incorporate real structural data, and translate engineering output into practical conservation criteria. In response, this study is framed within a performance-based assessment approach, an aspect still underutilized in the analysis of adobe buildings. By linking the findings to recognized performance thresholds, the results ensure their applicability in heritage preservation and seismic safety decision-making.
2. General Description of the Building and Its Current Damage State
The Church of Santo Tomás de Aquino in Rondocan, Peru, is an adobe structure dating back to the 17th century (Figure 1). The building consists of a single nave with a presbytery, along with an adjacent baptistery and sacristy on the south side. Figure 2 and Figure 3 depict the plan, elevations, and sections obtained through the geometric survey performed by Carleton Immersive Media Studio (CIMS). The interior space of the nave and presbytery measures approximately 34.0 m in length and 8.0 m in width. The church is situated on a plot with a slope of approximately 10% (Figure 2c,e). The structure comprises a foundation of rubble stone masonry laid using earth mortar, walls and buttresses built with adobe, and a gable roof made of timber beams and clay tiles. The current structural configuration and decoration date post-1650 earthquake interventions. Between 1994 and 1997, the church underwent extensive conservation works, which included the replacement of the roof cover and adobe blocks as well as the addition of timber keys. However, there is no available information on the exact locations of these interventions [15].

Figure 1.
Church of Santo Tomás de Aquino in Rondocan: (a) Main façade and (b) the view from the south.
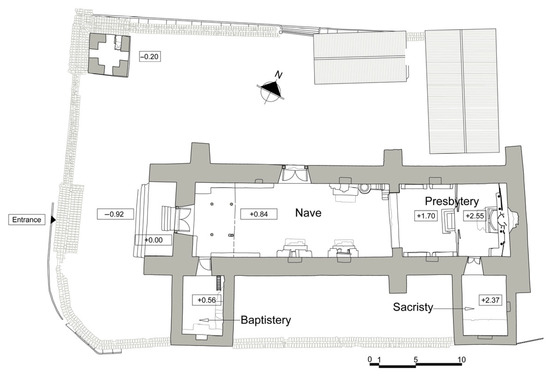

Figure 2.
Geometrical survey of the Church of Santo Tomás de Aquino in Rondocan: (a) Plan view with North indicated; (b) West elevation (main façade); (c) North elevation; (d) East elevation (rear façade); (e) South elevation.

Figure 3.
Geometrical survey of the Church of Santo Tomás de Aquino in Rondocan: (a) Section A-A; (b) Section D-D.
The foundation extends above ground level, reaching up to 2.0 m in certain elements of the main façade. The lateral walls and the main façade have a thickness of approximately 2.0 m, while the walls of the baptistery and sacristy range from 1.0 to 1.2 m in thickness. The main façade (Figure 2b) faces west, toward the plaza, and its gable end reaches a height of 11.5 m (measured from the reference level 0.0 m). This façade features the principal entrance, a door with stone jambs and a semicircular arch on the outer side of the wall, while the inner side has splayed jambs (embrasure) that support a timber lintel. A similar gate is situated in the middle of the north wall (Figure 2c).
The rear façade (Figure 2d), located on the east side, is approximately 1.9 m thick, with its gable end rising about 9.7 m above ground level (13.6 m measured from the reference level). It features a window with an embrasure and a niche positioned above it (Figure 3a).
All the windows and doors of the lateral walls, main façade, baptistery, and sacristy are characterized by embrasures, with timber lintels for the windows and semicircular arches for doors. In the triumphal arch, adobe was used for the pilasters, while quincha was employed for the spandrels and the arch. The richly decorated choir loft is located above the main entrance and is made of a timber structure supported by four quincha columns and fixed to the walls of the nave and the main façade (Figure 3).
The roof system consists of timber trusses made of wooden trunks placed at a spacing of 0.60 to 0.75 m. Each truss is composed of two top rafters supported on the tops of the lateral walls, two bottom rafters resting on an interior timber wall plate, and a collar tie connecting the upper half of the bottom rafters (Figure 4). All the rafters are fixed to a timber ridge beam that runs along the nave and presbytery. The top rafters overhang by approximately 0.50 m and support a layer of canes, a layer of earth mixed with straw, and clay tiles. Nine timber tie beams connect the lateral walls at the height of the wall plates: five in the nave, three in the presbytery, and one located inside the triumphal arch. Additionally, two tie beams are placed in the baptistery and two more in the sacristy.

Figure 4.
Structural scheme of the roof system.
Regarding decoration and artwork, the interior of the church features mural paintings extending across its full height. In addition, the church houses several movable paintings, many of which are attributed to Bernardo Bitti, an Italian Jesuit painter who significantly influenced South American art in the 16th and 17th centuries [16,17]. Additionally, the main altarpiece, crafted in the Baroque style, entirely covers the wall behind the altar, showcasing wooden carvings and canvases depicting religious themes. The altarpiece is anchored to the rear wall with horizontal timber ties. Due to its construction techniques, traditional architecture, and decorative elements, including Bitti’s paintings, the church was declared a National Cultural Heritage site in 2016 [18].
An on-site inspection conducted in 2024 revealed the deterioration and damage affecting the building. In terms of structural damage, cracks were detected at the intersection of the lateral walls with both the rear and main façades, as well as separation of the choir loft connections. In the main façade, vertical cracks, visible from both the interior and exterior, extended along the entire height at the intersections with the lateral nave walls. The choir loft also exhibited separation from the façade and the lateral walls, causing deformation of the timber elements. The most severe damage was identified in the rear façade, where vertical cracks had developed at the intersection with the lateral walls (Figure 5a,b), leading to near-total separation from the rear façade. Borescopic inspection at a 2.0 m height revealed that the crack depths were at least 0.30 m at the south corner and 0.50 m at the north corner (Figure 5c). Additional vertical cracks were detected at the midspan of the gable walls in the baptistery and sacristy. Furthermore, the spandrels of the triumphal arch were tilted toward the nave, resulting in cracks at their connection with the lateral walls.

Figure 5.
Intersection of the rear façade with the lateral walls, showing the vertical cracks (in red) at (a) the south corner, (b) the north corner, and (c) the borescopic examination and internal views of the cracks [19].
3. FEM Model Validation
A 3D finite element model (FEM) was developed to evaluate the seismic capacity of the church using a nonlinear pushover analysis. The model was calibrated based on data obtained from the experimental campaign to ensure reliability. The model was initially subjected to incremental dead loads until the full gravitational force was reached. The seismic action was then applied as an incremental lateral load, adopting a mass proportional distribution in the four main directions. The loading continued until the structure exhibited inelastic behavior, including peak and post-peak responses. This methodology enabled the assessment of structural capacity through capacity curves and the identification of potential collapse mechanisms for the church.
3.1. FEM Model Generation
The FEM model was created in DIANA 10.10 software [20] using a 3D geometry generated with AutoCAD 2024 software [21]. It is based on the geometric survey conducted by CIMS and includes the nave, presbytery, baptistery, and sacristy, as shown in Figure 6. The foundation, considering height variations due to the ground slope (see Figure 6b; highlighted in green), and the timber tie beams were also incorporated into the model (see Figure 6a; red transversal lines in the different church bodies). However, the choir loft and the spandrels of the triumphal arch were excluded, as their influence on the global structural response of the church was considered negligible. Due to limited information on the geometry of the lintels (red parts over openings in Figure 6), those above the doors of the main façade and north wall were assumed to have a thickness of 0.30 m and a bearing length of 0.50 m, while the remaining lintels were assumed to be 0.25 m thick with a bearing length of 0.20 m.

Figure 6.
Three-dimensional geometry used for the FEM model: (a) Isometric view and (b) south elevation.
Regarding the boundary conditions, all translational degrees of freedom at the bottom surface of the foundation were constrained. The mesh, depicted in Figure 7, consists of 151,257 nodes and 45,557 elements. An average element size of 0.50 m was adopted, enabling the thickness of the walls to be discretized using four elements. The foundation, walls, and lintels were modeled using twenty-node isoparametric solid brick elements with quadratic interpolation (CHX60). Unlike linear elements, which use first-order (linear) shape functions and have nodes only at the ends, quadratic elements incorporate an additional node at the midpoint of each element edge. This allows for the use of second-order polynomial shape functions, which provide a more accurate approximation of the displacement field and internal force distribution within each element [22]. Therefore, they capture curvature more effectively and improve the representation of local deformations, particularly in elements subject to bending. While quadratic elements involve a higher computational cost per element, their improved accuracy often reduces the total number of elements needed compared with elements with linear interpolation.

Figure 7.
Isometric visualization of the FEM model with assigned material properties.
Timber tie beams were simulated by two-node truss elements (L2TRUs), assuming an equivalent circular section with a 0.20 m diameter. To prevent stress concentration in the tie-to-wall connections, the tie beams ends were considered to be embedded within the walls. The embedded portions were modeled using bar reinforcement elements, continuous with truss elements and having the same diameter and mechanical properties.
The roof system was excluded from the numerical model, as it does not exhibit any significant rigid diaphragm behavior that would contribute to the global structural response of the church. However, its mass was considered by applying an equivalent density to the upper sections of the walls. The equivalent densities accounted for the weight of the timber trusses, cane layer, earthen layer, and roof tiles and the self-weight of the wall sections.
3.2. Material Properties
The mechanical properties of the materials for the church were determined based on bibliographic sources and in situ experimental tests carried out by the University of Minho in April 2024 [19]. As depicted in Figure 7, material assignments in the model correspond to their observed location on site: rubble stone masonry for the foundation; adobe masonry for the walls, buttresses, and triumphal arch pilasters; timber for the lintels and tie beams. Young’s modulus values for the adobe and rubble stone masonry were obtained from the sonic tests. Sonic testing is a non-destructive method used to estimate certain elastic properties by measuring the speed of stress waves (P-waves, S-waves, and R-waves) through the material. The method involves placing piezoelectric sensors on a wall to record the travel time of wave pulses between two points, either on the same surface (indirect test) or across the wall’s thickness (direct test). Wave velocity is a function of the material’s density, dynamic Young’s modulus, and Poisson’s ratio [23,24,25]. Studies on the indirect sonic testing of masonry walls have shown that the resulting dynamic Young’s modulus values are often close to those obtained from static tests [25].
However, due to the inherent heterogeneity and anisotropy of masonry, the results depend strongly on the direction of wave propagation relative to the mortar joints. Direct sonic tests are generally preferred, as they allow for more accurate detection of the P-waves, which are the first to arrive [26]. In contrast, indirect sonic tests are more challenging to interpret, but they allow for the estimation of Young’s modulus in the vertical direction [27] and are relatively easy to perform. When the adobe masonry is uniform and in good condition, as in this case, a combination of direct and indirect tests is typically employed, with the results processed statistically. Accordingly, both methods were used here to estimate the Young’s modulus of the two masonry types. For adobe, the average modulus was found to be 340 MPa, with a coefficient of variation (CoV) of 29%, while rubble stone masonry exhibited an average of 1080 MPa, with a CoV of 12%. These values fall within the ranges identified in the nearby Church of Kuñotambo [28], where the modulus for rubble stone masonry ranges from 190 MPa to 1600 MPa, and between 200 MPa and 450 MPa for adobe. Both masonry types were assigned a Poisson’s ratio of 0.2 and a density of 1900 kg/m3 [19,29,30].
A homogeneous isotropic material model was adopted for the adobe masonry, as this approach is well suited for large structures [1]. Given the similar material composition of adobe blocks and mortar, cracks tend to develop independently of the unit layout, thereby supporting the use of isotropic modeling for such constructions [6]. Masonry is a quasi-brittle material exhibiting high compressive strength but limited tensile and shear capacity. Under compressive loading, masonry undergoes an initial hardening phase, followed by a softening branch after peak strength. Even before reaching peak stress, materials such as concrete, brick, mortar, soils (including adobe blocks), and rocks exhibit nonlinear compressive behavior, which is driven by internal progressive damage and microcrack development [1,31,32,33]. Under tension, the material response is characterized by a rapid softening branch initiated by microcrack formation [1].
The total-strain rotating-crack model is well suited for describing this nonlinear behavior, as it captures the transition from the initial microcracking to the development of localized macrocracks. For the numerical model, a parabolic hardening–softening law was adopted to represent the compressive response, while tension behavior was described by an exponential softening in strength, as depicted in Figure 8 [20]. This material model assumes that under compression, adobe behaves linearly at up to one-third of its maximum strength capacity; beyond this point, the material enters an inelastic response (hardening) until the peak is reached, which adequately represents the nonlinear behavior of quasi-brittle materials.

Figure 8.
Adopted stress–strain curves for compression (parabolic) and tension (exponential).
Stress–strain curves are defined by the material strength and the fracture energies (which are normalized by the finite element representative size h): for tension and for compression. The compressive and tensile strengths, along with the tensile fracture energy for adobe and rubble stone, were taken from the literature [6]. The compressive fracture energy was calculated as
where is the compressive strength [1]. The in situ inspection of timber elements suggested adopting material and mechanical properties consistent with those of Eucalyptus wood species: 351–491 kg/m3 for density and 3900–7500 MPa for Young’s modulus [19]. Based on this, the timber elements in the model were described with a linear elastic law, adopting the average values of the reported density and Young’s modulus ranges. Finally, the mechanical properties assigned to each material are summarized in Table 1.

Table 1.
Mechanical properties of adobe masonry, rubble stone masonry, and timber.
3.3. Model Updating
A preliminary eigenvalue analysis was performed under the assumption of full continuity among all the structural elements, which is representative of the undamaged state. The values of Young’s modulus adopted for this analysis are those listed in Table 1. The first six vibration modes of the numerical model are shown in Figure 9. Mode 1 (2.45 Hz) represents the fundamental transverse mode of the structure, which is dominated by the in-phase out-of-plane movement of the lateral walls of the nave and provides the highest participation mass of approximately 25%. Modes 2 (3.28 Hz) and 3 (4.25 Hz) also involve the motion of the lateral walls in the X direction but with increasingly complex deformation shapes, achieving a cumulative mass participation of about 40% in Mode 3. In higher modes, mass participation in the X direction drops significantly. Mode 4 (4.60 Hz) is characterized by out-of-plane displacement of the rear façade, which is associated with a 12% participation mass. The subsequent higher-frequency shapes are associated with local modes and low masses, predominantly in the Y direction, e.g., the motion of the lateral walls of the sacristy and baptistery.

Figure 9.
Mode shapes of the model with no damage and average values for Young’s modulus obtained from the experimental campaign.
The in situ experimental campaign also included dynamic identification testing using ambient vibration measurements, through which 13 tentative mode shapes and associated natural frequencies were identified [19]. Figure 10a depicts the first three experimental modes. Their comparison against the preliminary numerical vibration modes revealed discrepancies in both the frequencies and mode shapes. Therefore, the numerical model was calibrated by adjusting the Young’s modulus of adobe and rubble stone masonry and by testing various structural conditions. The goal was to match the frequencies and mode shapes of the first three modes obtained from the ambient vibration tests. Several scenarios were considered during the calibration process, namely the following: reduced stiffness in the buttresses of the nave; exclusion of the pilasters of the triumphal arch; reduced stiffness in the rear façade; the presence of cracks at the inner corners of the rear façade; absence of tie beams in the presbytery; and a fully undamaged condition. Cracks were simulated by introducing a vertical gap in the upper half of the internal corners, with a depth equal to half the thickness of the lateral walls.

Figure 10.
Model validation: (a) Experimental mode shapes; (b) Mode shapes of the numerical model with discrete cracks, assuming a Young’s modulus of 335 MPa for adobe and 1400 MPa for rubble stone masonry.
The Modal Assurance Criterion (MAC) was employed to compare the mode shape vectors from the experimental and numerical analyses, as defined in Equation (2) [34]. In this formulation, and denote the respective mode shapes and represents the degrees of freedom corresponding to the accelerometer positions and associated nodes in the FEM model. The MAC values range from 0 (indicating no correlation) to 1 (perfect correlation), indicating the degree of similarity between the mode shapes. Typically, a value of 0.7 and higher is considered an acceptable correlation.
Lower and upper bounds for the Young’s modulus of both masonry types were initially established. Following several iterations, the final value for the rubble stone masonry was set at 1400 MPa. Subsequently, additional analyses were conducted to determine the most suitable value for adobe masonry across all models. Among the tested scenarios, the model incorporating discrete cracks, referred as to Model-A, achieved the highest correlation with the first three target modes, particularly improving the match with the third mode, as illustrated in Figure 10. These results suggest that cracks have a greater impact on the out-of-plane behavior of the rear façade rather than variations in the elastic properties of the adobe masonry. Table 2 summarizes the frequencies obtained from both the numerical modal analyses and the experimental campaign, as well as the corresponding MAC values for the first three modes. The average and maximum errors in frequency are 2.4% and 4.6% respectively, which are rather low, whereas the average and minimum MAC are 0.91 and 0.85, respectively, which are rather high. These values indicate an excellent match. The calibrated Young’s modulus values were set at 335 MPa for adobe and 1400 MPa for rubble stone masonry.
Table 2.
Mechanical properties of adobe masonry and rubble stone masonry for calibration.
Since crack repair is the minimum intervention necessary for structural safety and should be, ideally, executed regardless of any additional strengthening intervention, the analyses were conducted based on the undamaged model (Model-B) calibrated with the selected elastic material properties. A final modal analysis was performed to verify the dynamic characteristics of the church. As illustrated in Figure 11, Modes 1 and 2 are similar to those observed in the experimental results, with MAC values exceeding 0.90. The frequency discrepancies are 0.1% for Mode 1 and 6.2% for Mode 2. Following repair of the existing cracks, the out-of-plane mode shape of the rear façade shifts from Mode 3 to Mode 4. While the MAC value remains at 0.85, the associated frequency increases significantly, resulting in a deviation of 22%. This frequency shift highlights the sensitivity of the rear façade’s dynamic response to existing damage and emphasizes the structural impact of the observed cracks. The substantial increase in frequency following crack repair indicates stiffer out-of-plane behavior. Accordingly, the repair of these cracks is a necessary measure to restore partial structural integrity and to improve the seismic response of the rear façade.

Figure 11.
Mode shapes of the updated undamaged model (Model-B), assuming a Young’s modulus of 335 MPa for adobe and 1400 MPa for rubble stone masonry.
Although no direct information is available regarding the current condition of the connections between the tie beams and the walls, the comparison of the numerical analyses with experimental data suggests that the connections are effective for low-amplitude vibrations (i.e., there is no indication that the connections will be effective in the case of a strong earthquake). The agreement of the model’s outcomes with the dynamic identification test indicates that the tie beam–wall connections are likely to contribute to the overall behavior of the church, at least for low-magnitude earthquakes.
4. Nonlinear Pushover Analyses
A series of nonlinear pushover analyses was conducted to evaluate the global seismic performance of the church and to identify its most vulnerable structural elements. The building was initially subjected to gravity loading, followed by an incremental monotonic lateral load, which represents inertial forces. Due to the geometric and structural complexity of irregular masonry buildings, multidirectional pushover analysis is essential to capture the full range of possible collapse mechanisms [35]. Therefore, the loads were applied in the four principal directions, i.e., along the X and Y axes, in positive and negative directions. The lateral loading was increased until the structure reached its ultimate capacity. Among the various lateral-load distribution patterns available, the mass-proportional distribution was adopted, as this has been recognized as being the most appropriate for complex unreinforced masonry structures [36]. The modal pattern was not considered reliable in this case, as the eigenvalue analysis showed that the vibration modes are predominantly local, involving the response of individual walls with minimal associated mass participation [36]. The convergence criteria were based on energy, set at 0.1%, and force, which was equal to 5%. The standard Newton–Raphson iterative method was applied for a self-weight load (gravitational loading), while a secant method was used for lateral loading [20].
The structural seismic response is given in terms of capacity curves describing the relationship between the load factor (equivalent ground acceleration) and the displacements of control points located at the top of selected walls, depending on the direction of analysis. Damage patterns were identified at the ultimate displacement using principal tensile strains. These analyses were able to reproduce the main observed damage patterns, including the formation of cracks at the corners of the building, thus providing valuable insight into the church’s structural vulnerabilities.
In the +X direction (positive transverse direction), the structure reached a peak capacity of 0.22 g, with a corresponding displacement of 2.62 cm measured at the top of the south nave wall (Figure 12a). Damage started at the intersections between the lateral walls and the façades, with the onset of vertical cracks at the upper corners. As the lateral load increased, diagonal cracks developed, and a horizontal crack opened at the interface between the rubble stone foundation and the adobe masonry. At peak load, the out-of-plane failure mechanism of the south wall was fully developed. In the post-peak phase, buttresses detached from the walls due to shear failure, and cracking also led to partial separation of the gable walls of the sacristy and baptistery (Figure 13a). The maximum displacement recorded at the south nave wall in this phase reached 3.90 cm (Figure 12a).

Figure 12.
Capacity curves and deformed shapes at the ultimate displacement for the (a) +X direction, (b) −X direction, (c) +Y direction, and (d) −Y direction.

Figure 13.
Principal tensile strains for the (a) +X direction at ultimate displacement, (b) −X direction at ultimate displacement, (c) +Y direction at 0.12 g (left) and at the peak load (right), and (d) −Y direction at ultimate displacement.
This failure mechanism can be attributed to the limited out-of-plane restraint of the wall due to the absence of ring beams, perpendicular walls, intermediate slabs, or a rigid horizontal diaphragm, all of which are typically used to enhance lateral stability. Moreover, the low tensile and shear strength of adobe makes the wall highly susceptible to cracking and detachment under lateral loading. The poor anchorage between the buttresses and the wall led to their detachment once shear forces exceeded the interface shear strength.
In the −X direction (negative transverse direction), the building exhibited slightly lower strength (a 10% reduction), with a maximum strength capacity of 0.20 g and a peak displacement of 2.15 cm at the north nave wall (Figure 12b). Although the buttress exhibited a stiffer response up to the peak load, its deformation capacity was similar to that of the north nave wall by the end of the analysis, both reaching approximately 3.40 cm (Figure 12b). The structural continuity provided by the tie beams resulted in nearly symmetric deformation responses in the lateral walls of the nave (Figure 12b). The damage started with cracking at the connections between the lateral walls and the baptistery and sacristy. As the deformation increased, diagonal and horizontal cracks formed, leading to the full development of an out-of-plane collapse mechanism of the complete north wall (Figure 13b). The north buttress exhibited crushing at the base and shear failure along its connection with the north wall, resulting in detachment. By the end of the analysis, all three buttresses on the north side had separated from the main structure (Figure 13b).
As in the case of the south wall, the failure of the north wall was primarily driven by insufficient out-of-plane restraint and a lack of mechanical connection between the structural elements. The adobe material properties contributed to its vulnerability, but the absence of structural continuity, particularly the lack of ring beams, stiff horizontal diaphragms, and transverse walls, was the dominant factor in the formation of this failure mode. The relatively long vertical and horizontal spans further exacerbated the wall’s vulnerability. The detachment of the buttresses was again the result of inadequate anchorage and low shear strength, highlighting the need for improved detailing in future strengthening strategies.
As seen in Figure 12c, in the +Y direction (positive longitudinal direction), the rear (east) façade exhibited an initially stiff response, followed by a strength drop at 0.12 g and a partial recovery leading to a peak at 0.17 g, with a displacement of 5.40 cm. The post-peak phase was characterized by a short plateau, reaching a maximum displacement of 7.00 cm (Figure 12c). In general, the damage was concentrated primarily at the intersections of the rear façade with the lateral walls, with the onset of cracking observed at a load factor of 0.12 g. This damage started at the corners, with vertical cracks propagating downward, followed by diagonal cracking near the presbytery window (north wall) and the formation of a horizontal hinge at the base of the rear façade (Figure 13c). At peak load, the out-of-plane collapse mechanism was completely developed, characterized by full detachment of the rear façade, with vertical cracks at both corners and the formation of a horizontal hinge along the base of the foundation (Figure 13c). This collapse mechanism is directly associated with the stress concentration at the corners and the poor mechanical properties of the material, along with weak continuity between the rear façade and the adjoining lateral walls. That is, in the absence of proper anchors, ring beams, and rigid roof, the façade relies only on the tensile strength of adobe, which is very limited. Once the tensile capacity is exceeded, vertical cracking and detachment occur. The rear façade has no buttresses, which increases its susceptibility to out-of-plane overturning. The observed failure is thus the result of inadequate mechanical restraint and unfavorable geometry.
In the –Y direction, the main (west) façade and its buttresses experienced the most significant deformations. The structure exhibited the highest lateral load capacity among all directions, with a peak of 0.26 g and a displacement of 1.53 cm (Figure 12d). However, this response was characterized by brittle behavior. The initial drop in stiffness at 0.19 g was associated with the onset of vertical cracks at the upper corners, which propagated downward as the lateral load increased. At peak load, the vertical cracks at the main façade corners extended along the full wall height, and damage developed in the gable walls of the baptistery and sacristy (Figure 13d). Additionally, the connection between the buttresses and the main façade failed due to shear, resulting in detachment. The post-peak behavior was marked by limited ductility and rapid strength degradation, reaching a maximum displacement of 2.55 cm (Figure 12d). These results confirm that, despite its relatively high strength, the main façade is prone to brittle failure under seismic loading. Finally, partial detachment of the baptistery and sacristy from the rest of the structure was identified (Figure 13d).
5. Nonlinear Kinematic Analyses
The seismic safety evaluation of the church was assessed in terms of displacement demand, following the kinematic approach outlined in the Italian code [29,30]. This is a simplified procedure that takes into account the expected failure mechanisms, which, in this case, considered the collapse mechanisms identified in the nonlinear pushover analyses. The structural elements are modeled as rigid bodies, and their equilibrium capacity under horizontal seismic loads is evaluated through kinematic limit analysis. The models include a portion of the south lateral wall with a hinge at the top of the foundation layer (Figure 14a); the whole north lateral wall, considering a horizontal hinge at ground level (Figure 14b); the main façade with its buttresses (Figure 15a); and the whole rear façade (Figure 15b).

Figure 14.
Geometric configuration of the block and distribution of forces for the out-of-plane collapse mechanism of the (a) south lateral wall and (b) north lateral wall (dimension in meters).

Figure 15.
Geometric configuration of the block and distribution of forces for the out-of-plane collapse mechanism of the (a) main façade and (b) rear façade (dimension in meters).
The verification procedure was carried out using both linear and nonlinear approaches. In the linear method, the activation of each collapse mechanism was assessed by computing the horizontal load multiplier, , i.e., the minimum seismic coefficient required to trigger body motion. The nonlinear approach, on the other hand, involves constructing a load–displacement capacity curve (), which describes the progressive capacity of the rigid block until equilibrium loss (collapse). Typically, these curves exhibit a linear reduction of as the displacement increases, eventually reaching zero.
The methodology outlined in [29,30] is based on the assumptions that (1) masonry exhibits no tensile strength, (2) sliding between blocks does not occur, and (3) macro-blocks behave as monolithic rigid bodies. These assumptions result in a linear capacity curve with infinite initial stiffness up to the activation of the collapse mechanism, which is defined by the load multiplier . While effective for simplified analysis, this rigid-body approach tends to overestimate the horizontal load multiplier when compared with deformable body models [37,38,39]. However, such an overestimation is more significant in the case of free-standing cantilever walls than in walls that develop flexural out-of-plane resistance before the activation of an overturning mechanism [29,30], as was observed in the case of the church (Figure 12). Once the mechanism is activated, the rigid-body curve approximates well the deformable-body curve [40].
Although the kinematic limit analysis treats the blocks as rigid, the limited compressive strength of adobe masonry can be considered by adjusting the location of the horizontal hinge to account for compression stresses at the wall toe. This modification shortens the lever arm associated with gravity loads and, consequently, reduces the stabilizing moment, allowing for a more realistic representation of the material’s mechanical limitations within the rigid-body framework. Considering the previous hypotheses and the assumption of a uniform distribution of stress, the location of the rotation hinge, t, can be calculated as
where is the total vertical load acting on the mechanism, is the compressive strength of the material, and is the length of the hinge.
The self-weight of the blocks was applied at their respective centers of mass. The roof weight was calculated by considering the timber elements, the canes, the earthen layer, and the roof tiles. These loads were applied at two locations, i.e., at the top (center of the wall) and bottom (inner face) chords of the timber trusses (Figure 16). The vertical and horizontal components of the roof loads were determined based on the tributary area supported by each wall. The horizontal resistance provided by the tie beams was estimated using Equation (4), where is the thickness of the wall. Equation (4) was derived through linear regression based on the results obtained from pull-out tests performed on the timber tie beams [5]. A partial safety factor of 2.0 was applied to reduce the capacity of the ties according to [41]. Seismic forces were assumed to act at both the center of mass of the rigid blocks and the application points of the roof load. The load multiplier, , was computed using the principle of virtual work by equating the stabilizing moments and the overturning moments.

Figure 16.
Points of load application of the roof and tie beams.
Seismic safety was evaluated by converting the Multi-Degree of Freedom (MDOF) system into the equivalent Single-Degree of Freedom (SDOF) system. The structural capacity was assessed in terms of both force (linear analysis) and displacement (nonlinear analysis) and compared against the corresponding spectral demands following the methodology outlined in [29,30]. These demands were determined based on the performance requirements of two limit states defined in [29,30]: Damage Limitation (DL), associated with a return period of 95 years, and Life Safety(LS), also referred to as Significant Damage [42], which is associated with a return period of 475 years. For the return period of 95 years, the reference PGA of the return period of 475 years was scaled by a factor of 0.58, as recommended in [42].
The reference ground acceleration was established according to the Peruvian seismic code for Zone 2 ( 0.25 g), soil type S2 (1.2), and an importance factor corresponding to building category B ( 1.3) [13]. This results in a reference ground acceleration equal to 0.39 g. However, the code permits a reduction in this value based on the characteristics of the structure. In the case of adobe buildings, it refers to the provisions of code E.080 [14], where the reference ground acceleration can be taken as 0.29 g. This reduction aligns with strategies adopted in recommendations for the assessment of heritage structures, where assuming long return periods and high peak ground accelerations, while linked to the importance of the structure, is avoided to prevent excessively invasive interventions [43]. For a more conservative, yet realistic, assessment, the following verifications were carried out, assuming a reference ground acceleration of 0.30 g ( 0.25 g, 1.2).
The horizontal load multiplier, , is calculated using the Principle of Virtual Work, which equates the external and internal work associated with a virtual displacement configuration. In this approach, the virtual displacement, , produced by each force in the direction of loading is derived from the virtual rotation, , applied to the mechanism. The system is assumed to be in equilibrium when the work performed by the external forces equals the internal resisting work, . The equilibrium condition is expressed as
where represents the weight of the blocks, is the weight contribution from the floor and roof, includes the internal and external non-mass-related forces, e.g., the horizontal resistance provided by the tie beams, and , , and are the corresponding virtual displacements in the direction of each force component.
The transformation of the mechanism into an equivalent SDOF system requires the estimation of the equivalent mass, , the fraction of participating mass, , and the equivalent acceleration, , as defined by the following equations:
where is the gravity acceleration, and FC is the confidence factor, assumed as 1.0, corresponding to knowledge level LC3, based on the Italian code [29,30]. According to [29,30], the verification for the DL limit state is carried out through the linear approach. The verification is satisfied if the acceleration for the activation of the mechanism, is larger than the demand acceleration evaluated in the DL elastic spectrum at period , i.e., (for a return period of 95 years,, ):
For the LS limit state, the verification in terms of force (linear approach) is satisfied if the acceleration is larger than the acceleration specified in the LS elastic spectrum (for a return period of 475 years, , ), considering a behavior factor [29,30]:
The LS limit state verification was also performed through the nonlinear approach, which involved comparing the displacement capacity of the mechanism, , with the displacement demand, . The verification is satisfied if . The calculation of the center of mass of the system is required to estimate the finite rotation at which the mechanism loses its stability (angle measured from the vertical). Therefore, the center of mass of the system is given by
The displacement of the control point () at which the mechanism loses its stability is estimated as follows:
where is the height of the control point. This displacement is transformed into an equivalent displacement of a SDOF system, :
where is the virtual displacement of the control point. The displacement capacity for LS limit state is given by [29,30]:
with an equivalent acceleration, :
and equivalent period, :
The displacement demand is calculated using Equation (17), applying the Peruvian seismic code, where s and s [13].
For the mechanisms of the south and north lateral walls, further considerations were assumed to determine their geometric parameters and hinge location. Given the building location on a slope, the height of the equivalent masonry block was defined using the average height of the wall section. Similarly, the roof load was applied at an average height representative of its actual distribution. Since the buttress is included in the calculation of the hinge location, Equation (3) must be adjusted. The new expression assumes that the buttresses have proper connections to the longitudinal walls, and that the entire section of the buttress falls within the plastic range [44]:
where and are the area and the depth of the buttress, respectively, and is the effective depth of the area under compression, measured from the outer edge of the buttress to the inner face of the wall. This adjustment enables the calculation of the geometric centroid of the compressed area, which defines the location of the hinge.
Table 3 summarizes the results and the key parameters used in the seismic safety assessment of the four out-of-plane mechanisms. These values were calculated using Equations (5)–(17). Appendix A provides the expressions derived from the Virtual Work Principle (Equations (A1)–(A4)), along with the corresponding forces and geometric parameters used in each case (Table A1, Table A2, Table A3 and Table A4).
Table 3.
Parameters used in the seismic safety assessment of the four out-of-plane mechanisms.
The force-based verifications for both the DL and LS limit states were satisfied for the out-of-plane collapse mechanism for the main façade, indicating that the seismic demand is lower than the lateral load capacity of the mechanism. Furthermore, the displacement capacity of the façade significantly exceeds the expected displacement demand, confirming safety in terms of deformation as well (Figure 17c). In contrast, the other three mechanisms (corresponding to the rear façade and the south and north lateral walls) did not meet the force-based verification criteria for either the DL or LS limit states, suggesting that the seismic force demand exceeds their lateral load capacities. Nonetheless, despite being activated under seismic loading, these mechanisms are capable of sustaining displacements beyond those expected during a design-level earthquake without reaching instability, as illustrated in Figure 17. However, these mechanisms only barely fulfilled the displacement-based criteria, suggesting a restricted deformation capacity. This highlights the need for caution regarding the stability and safety of these structural elements against out-of-plane collapse.

Figure 17.
Acceleration–displacement response spectra for the LS limit state (return period of 475 years) and capacity curves of the (a) south lateral wall, (b) north lateral wall, (c) main façade, and (d) rear façade.
6. Conclusions
This study presents a comprehensive seismic performance assessment of the historic Church of Santo Tomás de Aquino in Rondocan, Peru, using advanced numerical modeling techniques. Despite conservation efforts undertaken between 1996 and 1997, the structure exhibits significant vulnerabilities, notably at the intersections of lateral walls and façades.
A finite-element model employing a macro-modeling approach was developed and calibrated using in situ sonic and ambient vibration tests. The results confirmed that the timber tie beams contribute to the global structural behavior under low-intensity seismic excitation. Their effectiveness in resisting moderate to strong seismic forces is largely determined by the condition and integrity of their mechanical connections. Notably, all nonlinear analyses were performed assuming that existing cracks in the rear façade had been repaired and that effective connections exist at wall-to-wall and wall-to-buttress interfaces. These assumptions must be verified or achieved in future conservation actions to ensure the validity of the numerical predictions.
The accuracy and relevance of numerical simulations in heritage structures heavily rely on their calibration using field data. In this context, in situ inspections and experimental campaigns are indispensable. They provide critical information about material properties, boundary conditions, existing damage, and the effectiveness of previous interventions. This information is essential not only for model validation but also for reducing uncertainties in the assessment of seismic performance. When dealing with historically and culturally significant structures, the availability of experimental data becomes even more vital, as it informs appropriate intervention strategies that balance safety and preservation.
The model effectively replicated observed damage patterns, particularly at the wall corners, highlighting the vulnerability of different structural elements. The nonlinear pushover analyses showed that seismic loading along the transverse axis (X direction) produced widespread damage, while longitudinal loading (Y direction) concentrated the damage within either the main or rear façade, depending on the loading direction. The rear (east) façade was identified as the element most vulnerable to out-of-plane collapse, with a maximum load factor of 0.17 g, even under idealized conditions (assuming repaired cracks). In contrast, the main (west) façade showed the highest capacity, with a peak load factor of 0.27 g, although it exhibits a brittle post-peak response. The lateral walls also demonstrated susceptibility to overturning despite the presence of buttresses, with load factors ranging from 0.20 to 0.22 g. In all cases, failure also involved the detachment of buttresses due to shear stress at the connection with the walls.
Given the design-level peak ground acceleration (PGA) of 0.30 g (or up to 0.39 g in the case where an importance factor of 1.3 is adopted to account for the cultural value), the results from the force-based analyses indicate that the church does not meet the life safety performance targets under current conditions. This underscores the need for a global strengthening strategy that focuses on enhancing the connectivity between structural elements: namely, the roof-to-wall ties, transverse-to-longitudinal wall intersection, and wall-to-buttress interfaces.
To complement the nonlinear static (pushover) analyses, a kinematic limit analysis was conducted for four critical out-of-plane mechanisms, identified based on geometric configurations and damage patterns. The mechanisms were evaluated under force- and displacement-based criteria, following established guidelines for historic masonry structures [29,30]. Only the main façade mechanism satisfied the verification requirements for both Damage Limitation (DL) and Life Safety (LS) limit states, with a safety factor of 2.5. The remaining mechanisms (for the rear façade and the lateral walls) did not meet the force-based criteria but barely fulfilled the displacement-based verifications, with safety indices ranging from 1.03 to 1.11. Despite satisfying the displacement-based criteria, the values of observed deformations may compromise the structural stability of the roof and endanger occupants. Future interventions should prioritize the implementation of out-of-plane restraint systems to prevent roof collapse. In particular, the out-of-plane displacements of the lateral walls highlight the need for restraints to reduce the risk of instability and collapse.
Overall, the study confirms the value of advanced numerical modeling as a tool for assessing the seismic performance of complex earthen heritage buildings. Numerical models, when rigorously calibrated with field data, serve as powerful instruments for predicting failure mechanisms and optimizing interventions. Their continued development and application depend on robust experimental input and a feedback loop between field observations and analytical refinement.
The results support the implementation of comprehensive seismic strengthening measures that prioritize not only structural safety but also the preservation of architectural elements such as mural paintings and decorative features. Continued research should aim to reduce modeling uncertainties by integrating more detailed testing, extensive damage surveys, and performance monitoring of strengthened structures.
This study advances current methodologies for the seismic assessment of historic adobe structures by applying a calibrated numerical model within a performance-based framework, which is still underutilized in the seismic safety assessment of earthen heritage buildings. The integration of field data, through sonic and ambient vibration testing, allowed for a more realistic representation of material and possible connection deficiencies, which, in turn, informed both the nonlinear and kinematic analyses. By combining these complementary approaches, the study not only identified critical vulnerabilities but also provided actionable insights for retrofitting that are grounded in code-based performance criteria. This reinforces the role of advanced modeling as a decision-support tool that links structural analysis with conservation needs in a practical and meaningful way.
Author Contributions
Conceptualization, N.M. and P.B.L.; methodology, N.M. and P.B.L.; software, E.N.-M. and N.M.; validation, N.M. and P.B.L.; formal analysis, E.N.-M., N.M., M.S. and P.B.L.; investigation, E.N.-M.; resources, N.M. and P.B.L.; data curation, E.N.-M.; writing—original draft preparation, E.N.-M.; writing—review and editing, N.M., M.S. and P.B.L.; visualization, E.N.-M.; supervision, N.M., M.S. and P.B.L.; project administration, P.B.L.; funding acquisition, P.B.L. All authors have read and agreed to the published version of the manuscript.
Funding
This work is partially funded by the Getty Conservation Institute—Seismic Retrofitting Project. The study is also funded by the STAND4HERITAGE project (new STANDards FOR seismic assessment of built cultural HERITAGE) that has received funding from the European Research Council (ERC) under the European Union’s Horizon 2020 research and innovation program (Grant No. 833123) as an Advanced Grant. This study is also partially funded by national funds (PIDDAC) under the R&D Unit Institute for Sustainability and Innovation in Structural Engineering (ISISE) under reference UIDB/04029/2020 (https://doi.org/10.54499/UIDB/04029/2020) and from the Associate Laboratory Advanced Production and Intelligent Systems ARISE under reference LA/P/0112/2020. The opinions and conclusions presented in this paper are those of the authors and do not necessarily reflect the views of the sponsoring organizations.
Institutional Review Board Statement
Not applicable.
Informed Consent Statement
Not applicable.
Data Availability Statement
Data will be available upon reasonable request to the authors.
Conflicts of Interest
The authors declare no conflicts of interest.
Appendix A
The required force distribution and geometric values were extracted from Figure 14 and Figure 15, which illustrate the configuration and dimensions of each mechanism. The equations derived from the Virtual Work Principle for each mechanism, along with the forces and geometric parameters used for the calculation of the load multiplier , are presented below.
The out-of-plane collapse mechanism of the south lateral wall, including its corresponding buttress, is determined by a horizontal hinge at the interface between the foundation and the adobe masonry, with diagonal cracks propagating toward the top corners of the wall. For the south wall, the effective depth of 3.12 m was estimated using Equation (18), considering a compressive strength for adobe of 0.45 MPa, a length of the hinge, , of 13.90 m, and a buttress area of 3.60 m2. The forces acting in the mechanism and used to solve Equation (A1) are summarized in Table A1.
Table A1.
Load calculations for the block in the south lateral wall.
Table A1.
Load calculations for the block in the south lateral wall.
| Building Component | Forces | Load Coordinates | Virtual Displacements | |||||||
|---|---|---|---|---|---|---|---|---|---|---|
| PV | PH | xi (1) | yi | x*i (2) | δx | δy | PV∙δx | PV∙δx2 | ||
| N | N | m | m | m | N | N | ||||
| Wall | P1 | 6,249,649 | 1.03 | 4.36 | 0.70 | 0.56 | 0.09 | 3,488,921 | 1,947,720 | |
| Buttress | P2 | 484,662 | 3.02 | 3.61 | 1.29 | 0.46 | 0.16 | 224,025 | 103,550 | |
| Roof top chord | P3 | 441,800 | 1.03 | 7.81 | 0.70 | 1.00 | 0.09 | 441,800 | 441,800 | |
| Roof bottom chord | P4 | 188,400 | 0.00 | 7.73 | 1.73 | 0.99 | 0.22 | 186,470 | 184,560 | |
| Roof top chord | P5 | 246,500 | 1.03 | 7.81 | 0.70 | 1.00 | 0.09 | |||
| Roof bottom chord | P6 | 320,000 | 0.00 | 7.73 | 1.73 | 0.99 | 0.22 | |||
| Ties | F1 | 518,930 | 0.00 | 7.73 | 1.73 | 0.99 | 0.22 | |||
| TOTAL | 7,364,512 | 4,341,215 | 2,677,631 | |||||||
(1) Measured from the reference point RP. (2) Measured from the hinge.
The out-of-plane collapse mechanism of the north lateral wall, including its corresponding buttress, is defined by a horizontal hinge at the base of the foundation, accompanied by diagonal cracks extending toward the intersections of the main and rear façades. For the estimation of the roof load, the tributary area associated with the upper length of the wall was used. Equation (18) was used to estimate the effective depth of the area under compression, , where the area and length of the buttress are = 3.21 m2 and = 1.70 m, respectively. The effective depth is 2.03 m, considering a length of the hinge, , of 20.11 m and a compressive strength for rubble stone masonry of 0.60 MPa; the forces acting in the mechanism and used to solve Equation (A2) are summarized in Table A2.
Table A2.
Load calculation for the block in the north lateral wall.
Table A2.
Load calculation for the block in the north lateral wall.
| Building Component | Forces | Load Coordinates | Virtual Displacements | |||||||
|---|---|---|---|---|---|---|---|---|---|---|
| PV | PH | xi (1) | yi | x*i (2) | δx | δy | PV∙δx | PV∙δx2 | ||
| N | N | m | m | m | N | N | ||||
| Wall | P1 | 9,993,300 | 2.68 | 4.95 | 0.65 | 0.54 | 0.07 | 5,412,901 | 2,931,914 | |
| Buttress | P2 | 513,504 | 0.87 | 4.29 | 1.16 | 0.47 | 0.13 | 241,046 | 113,151 | |
| Roof top chord | P3 | 449,000 | 2.68 | 9.14 | 0.65 | 1.00 | 0.07 | 449,000 | 449,000 | |
| Roof bottom chord | P4 | 215,800 | 3.65 | 9.03 | 1.62 | 0.99 | 0.18 | 213,320 | 210,868 | |
| Roof top chord | P5 | 253,900 | 2.68 | 9.14 | 0.65 | 1.00 | 0.07 | 0 | 0 | |
| Roof bottom chord | P6 | 345,000 | 3.65 | 9.03 | 1.62 | 0.99 | 0.18 | 0 | 0 | |
| Ties | F1 | 491,877 | 3.65 | 9.03 | 1.62 | 0.99 | 0.18 | 0 | 0 | |
| TOTAL | 11,171,604 | 6,316,267 | 3,704,932 | |||||||
(1) Measured from the reference point RP. (2) Measured from the hinge.
The out-of-plane collapse mechanism of the main façade includes its two corresponding buttresses. The mechanism is determined by vertical cracks developing along the entire height of the lateral walls at their intersection with the main façade. These cracks propagate down to the base of the foundation, where a horizontal hinge is formed. The contribution of the roof load was not considered in the calculations, as it represents 3% of the total mass of the block. Consequently, the forces summarized in Table A3, used to solve Equation (A3), account only for the mass of the façade and the buttresses.
Table A3.
Load calculation for the block in the main façade.
Table A3.
Load calculation for the block in the main façade.
| Building Component | Forces | Load Coordinates | Virtual Displacements | |||||||
|---|---|---|---|---|---|---|---|---|---|---|
| PV | PH | xi (1) | yi | x*i (2) | δx | δy | PV∙δx | PV∙δx2 | ||
| N | N | m | m | m | N | N | ||||
| Wall | P1 | 4,542,222 | 1.13 | 5.76 | 2.29 | 1.00 | 0.40 | 4,542,222 | 4,542,222 | |
| Buttress | P2 | 2,246,516 | 3.70 | 4.98 | 0.28 | 0.86 | 0.05 | 1,942,201 | 1,679,108 | |
| TOTAL | 6,788,738 | 6,484,422 | 6,221,330 | |||||||
(1) Measured from the reference point RP. (2) Measured from the hinge.
The out-of-plane collapse mechanism of the rear façade includes the extension of the walls that work as buttresses at the east corners of the church. The mechanism is defined by vertical cracks throughout the height of both corners and a horizontal hinge at the base of the foundation. The position of the hinge was calculated using Equation (3) and considering a compressive strength of 0.60 MPa for rubble stone masonry and a hinge length = 15.88 m. The roof load was neglected in the calculations, since the weight associated with the tributary area is low in comparison with the mass of the wall. Equation (A4) was solved using the data in Table A4.
Table A4.
Load calculation for the block in the rear façade.
Table A4.
Load calculation for the block in the rear façade.
| Building component | Forces | Load Coordinates | Virtual Displacements | |||||||
|---|---|---|---|---|---|---|---|---|---|---|
| PV | PH | xi (1) | yi | x*i (2) | δx | δy | PV∙δx | PV∙δx2 | ||
| N | N | m | m | m | N | N | ||||
| Wall | P1 | 5,074,772 | 0.92 | 4.95 | 0.58 | 1.00 | 0.12 | 5,074,772 | 5,074,772 | |
| TOTAL | 5,074,772 | 5,074,772 | 5,074,772 | |||||||
(1) Measured from the reference point RP. (2) Measured from the hinge.
References
- Lourenço, P.B.; Gaetani, A. Finite Element Analysis for Building Assessment: Advanced Use and Practical Recommendations, 1st ed.; Routledge: New York, NY, USA, 2022; ISBN 9780429341564. [Google Scholar]
- Tolles, E.L.; Kimbro, E.E.; Ginell, W.S. Seismic Stabilization of Historic Adobe Structures: Final Report of the Getty Seismic Adobe Project; Getty Conservation Institute: Los Angeles, CA, USA, 2000. [Google Scholar]
- Tolles, E.L.; Kimbro, E.E.; Ginell, W.S. Planning and Engineering Guidelines for the Seismic Retrofitting of Historic Adobe Structures; GCI Scientific Program Reports; Getty Conservation Institute: Los Angeles, CA, USA, 2002. [Google Scholar]
- Cancino, C.; Lardinois, S. Seismic Retrofitting Project: Assessment of Prototype Buildings; Getty Conservation Institute: Los Angeles, CA, USA, 2012. [Google Scholar]
- Torrealva, D.; Vicente, E.; Michiels, T. Seismic Retrofitting Project: Testing of Materials and Building Components of Historic Adobe Buildings in Peru; Getty Conservation Institute: Los Angeles, CA, USA, 2018. [Google Scholar]
- Karanikoloudis, G.; Lourenço, P.B. Structural Assessment and Seismic Vulnerability of Earthen Historic Structures. Application of Sophisticated Numerical and Simple Analytical Models. Eng. Struct. 2018, 160, 488–509. [Google Scholar] [CrossRef]
- Aguilar, R.; Noel, M.F.; Ramos, L.F. Integration of Reverse Engineering and Non-Linear Numerical Analysis for the Seismic Assessment of Historical Adobe Buildings. Autom. Constr. 2019, 98, 1–15. [Google Scholar] [CrossRef]
- Briceño, C.; Noel, M.F.; Chácara, C.; Aguilar, R. Integration of Non-Destructive Testing, Numerical Simulations, and Simplified Analytical Tools for Assessing the Structural Performance of Historical Adobe Buildings. Constr. Build. Mater. 2021, 290, 123224. [Google Scholar] [CrossRef]
- Tarque, N.; Camata, G.; Spacone, E.; Varum, H.; Blondet, M. Nonlinear Dynamic Analysis of a Full-Scale Unreinforced Adobe Model. Earthq. Spectra 2014, 30, 1643–1661. [Google Scholar] [CrossRef]
- Tarque, N. Numerical Modelling of the Seismic Behaviour of Adobe Buildings; Università degli Studi di Pavia: Pavia, Italy, 2011. [Google Scholar]
- Momin, S.; Lovon, H.; Silva, V.; Ferreira, T.M.; Vicente, R. Seismic Vulnerability Assessment of Portuguese Adobe Buildings. Buildings 2021, 11, 200. [Google Scholar] [CrossRef]
- Li, S.-Q.; Zhang, C.; Qin, P.-F. Seismic Vulnerability Analysis of Adobe Structures Considering Historical Chinese Seismic Intensity Standards. Soil Dyn. Earthq. Eng. 2025, 197, 109543. [Google Scholar] [CrossRef]
- NTE E.030; Norma Técnica E.030 Diseño Sismoresistente. Ministerio de Vivienda Construcción y Saneamiento: Lima, Peru, 2016.
- NTE E.080; Norma E.080 Diseño y Construcción con Tierra Reforzada. Ministerio de Vivienda Construcción y Saneamiento: Lima, Peru, 2017.
- Gerencia de Obras Division de Puesta en Valor de Monumentos Transcripción informe final de ejecución de obra (1994–1997); Obra Iglesia de Rondoan: Cusco, Peru, 1998.
- Tejada Farfán, A.G. Una Serie de Cuadros de Bernardo Bitti: Del Cuzco a Rondocan a Través de Sus Fuentes Documentales. Rev. Arch. Gen. la Nación 2019, 34, 43–59. [Google Scholar] [CrossRef]
- Tejada Farfán, A.G. La Oración En El Huerto de Bernardo Bitti S. J. En Rondocan. Let. 2023, 94, 46–60. [Google Scholar] [CrossRef]
- Ministerio de Cultura. Resolución Vice Ministerial No 078-2016-VMPCIC-MC; Diario Oficial del Bicentenario El Pe-ruano: Lima, Peru, 2016. Available online: https://www.gob.pe/institucion/cultura/normas-legales/204331-078-2016-vmpcic-mc (accessed on 1 April 2025).
- Karanikoloudis, G.; Mendes, N.; Lourenço, P.B. In Situ Inspection and Experimental Testing in the Church of Rondocan, in Peru; Report 2024-DEC/E-10; University of Minho: Guimarães, Portugal, 2024. [Google Scholar]
- DIANA FEA BV. DIANA Finite Element Analysis, Version 10.10 [Computer software]; DI-ANA FEA BV: Delft, The Netherlands, 2025. [Google Scholar]
- Autodesk Inc. AutoCAD, 2024 [Computer software]; Autodesk Inc.: San Francisco, CA, USA, 2023. [Google Scholar]
- Bathe, K.-J. Formulation and Calculation of Isoparametric Finite Element Matrices. In Finite Element Procedures; Klaus-Jurgen Bathe: Watertown, MA, USA, 2014; pp. 338–484. [Google Scholar]
- ASTM C1383-15(2022); Standard Test Method for Measuring the P-Wave Speed and the Thickness of Concrete Plates Using the Impact-Echo Method. ASTM International: West Conshohocken, PA, USA, 2022.
- Miranda, L. Acoustic and Flat Jack Tests on Resistant Masonries; University of Porto: Porto, Portugal, 2011. [Google Scholar]
- Malhotra, V.M.; Carino, N.J. Handbook on Nondestructive Testing of Concrete; CRC Press: Boca Raton, FL, USA, 2004; ISBN 9780429191213. [Google Scholar]
- ASTM C597-16; Standard Test Method for Pulse Velocity Through Concrete. ASTM International: West Conshohocken, PA, USA, 2016.
- Miranda, L.; Cantini, L.; Guedes, J.; Costa, A. Assessment of Mechanical Properties of Full-Scale Masonry Panels through Sonic Methods. Comparison with Mechanical Destructive Tests. Struct. Control Health Monit. 2016, 23, 503–516. [Google Scholar] [CrossRef]
- Karanikoloudis, G.; Mendes, N.; Lourenço, P.B. Experimental in Situ Testing and Visual Inspection of a Retrofitted Adobe Historic Structure, Within the Getty Seismic Retrofitting Project; The Church of Kuñotambo, in Peru: Guimarães, Portugal, 2020. [Google Scholar]
- Ministero delle Infrastrutture e dei Trasporti. NTC 2018, Norme Tecniche per Le Costruzioni, Decreto 17 Gennaio 2018; Gazzetta Ufficiale della Repubblica Italiana, n. 42: Roma, Italy, 2018. (In Italian) [Google Scholar]
- Circolare NTC 2018. Istruzioni per l’Applicazione dell’«Aggiornamento delle “Norme Tecniche per le Costruzioni”» di cui al Decreto Ministeriale 17 Gennaio 2018; Ministero delle Infrastrutture e dei Trasporti: Roma, Italy, 2019. (In Italian) [Google Scholar]
- Wu, F.; Li, G.; Li, H.-N.; Jia, J.-Q. Strength and Stress–Strain Characteristics of Traditional Adobe Block and Masonry. Mater. Struct. 2013, 46, 1449–1457. [Google Scholar] [CrossRef]
- Silveira, D.; Varum, H.; Costa, A.; Martins, T.; Pereira, H.; Almeida, J. Mechanical Properties of Adobe Bricks in Ancient Constructions. Constr. Build. Mater. 2012, 28, 36–44. [Google Scholar] [CrossRef]
- Illampas, R.; Ioannou, I.; Charmpis, D.C. Adobe Bricks under Compression: Experimental Investigation and Derivation of Stress–Strain Equation. Constr. Build. Mater. 2014, 53, 83–90. [Google Scholar] [CrossRef]
- Allemang, R.J.; Brown, D.L. A Correlation Coefficient for Modal Vector Analysis. In Proceedings of the 1st International Modal Analysis Conference, Orlando, FL, USA, 8–10 November 1982. [Google Scholar]
- Kalkbrenner, P.; Pelà, L.; Sandoval, C. Multi Directional Pushover Analysis of Irregular Masonry Buildings without Box Behavior. Eng. Struct. 2019, 201, 109534. [Google Scholar] [CrossRef]
- Lagomarsino, S.; Cattari, S. PERPETUATE Guidelines for Seismic Performance-Based Assessment of Cultural Heritage Masonry Structures. Bull. Earthq. Eng. 2015, 13, 13–47. [Google Scholar] [CrossRef]
- Lagomarsino, S. Seismic Assessment of Rocking Masonry Structures. Bull. Earthq. Eng. 2015, 13, 97–128. [Google Scholar] [CrossRef]
- Degli Abbati, S.; Cattari, S.; Lagomarsino, S. Validation of Displacement-Based Procedures for Rocking Assessment of Cantilever Masonry Elements. Structures 2021, 33, 3397–3416. [Google Scholar] [CrossRef]
- Giordano, N.; De Luca, F.; Sextos, A. Out-of-Plane Closed-Form Solution for the Seismic Assessment of Unreinforced Masonry Schools in Nepal. Eng. Struct. 2020, 203, 109548. [Google Scholar] [CrossRef]
- Griffith, M.C.; Lam, N.T.K.; Wilson, J.L.; Doherty, K. Experimental Investigation of Unreinforced Brick Masonry Walls in Flexure. J. Struct. Eng. 2004, 130, 423–432. [Google Scholar] [CrossRef]
- EN 1996-1-1; Eurocode 6: Design of Masonry Structures—Part 1-1: General Rules for Reinforced and Unreinforced Ma-sonry Structures. European Committee for Standardization: Brussels, Belgium, 2005.
- EN 1998-1; Eurocode 8: Design of Structures for Earthquake Resistance—Part 1: General Rules, Seismic Actions and Rules for Buildings. European Committee for Standardization: Brussels, Belgium, 2004.
- Ministerio della Cultura Linee Guida per La Valutazione e La Riduzione Del Rischio Sismico Del Patrimonio Culturale Allineate Alle Nuove Norme Tecniche Sulle Costruzioni (D.M. 14-01-2008); Rome, Italy, 2006. Available online: https://dgspatrimonioculturale.beniculturali.it/atti-e-normativa/prevenzione-e-riduzione-rischio-sismico/ (accessed on 30 April 2025).
- Lourenço, P.B.; Pereira, J.M.; Torrealva, D. Seismic Retrofitting Project: Simplified Calculations for the Structural Analy-sis of Earthen Historic Sites; Getty Conservation Institute: Los Angeles, CA, USA, 2021. [Google Scholar]
Disclaimer/Publisher’s Note: The statements, opinions and data contained in all publications are solely those of the individual author(s) and contributor(s) and not of MDPI and/or the editor(s). MDPI and/or the editor(s) disclaim responsibility for any injury to people or property resulting from any ideas, methods, instructions or products referred to in the content. |
© 2025 by the authors. Licensee MDPI, Basel, Switzerland. This article is an open access article distributed under the terms and conditions of the Creative Commons Attribution (CC BY) license (https://creativecommons.org/licenses/by/4.0/).