Transferring Face Recognition Techniques to Entomology: An ArcFace and ResNet Approach for Improving Dragonfly Classification

 , , , , and
Abstract
1. Introduction
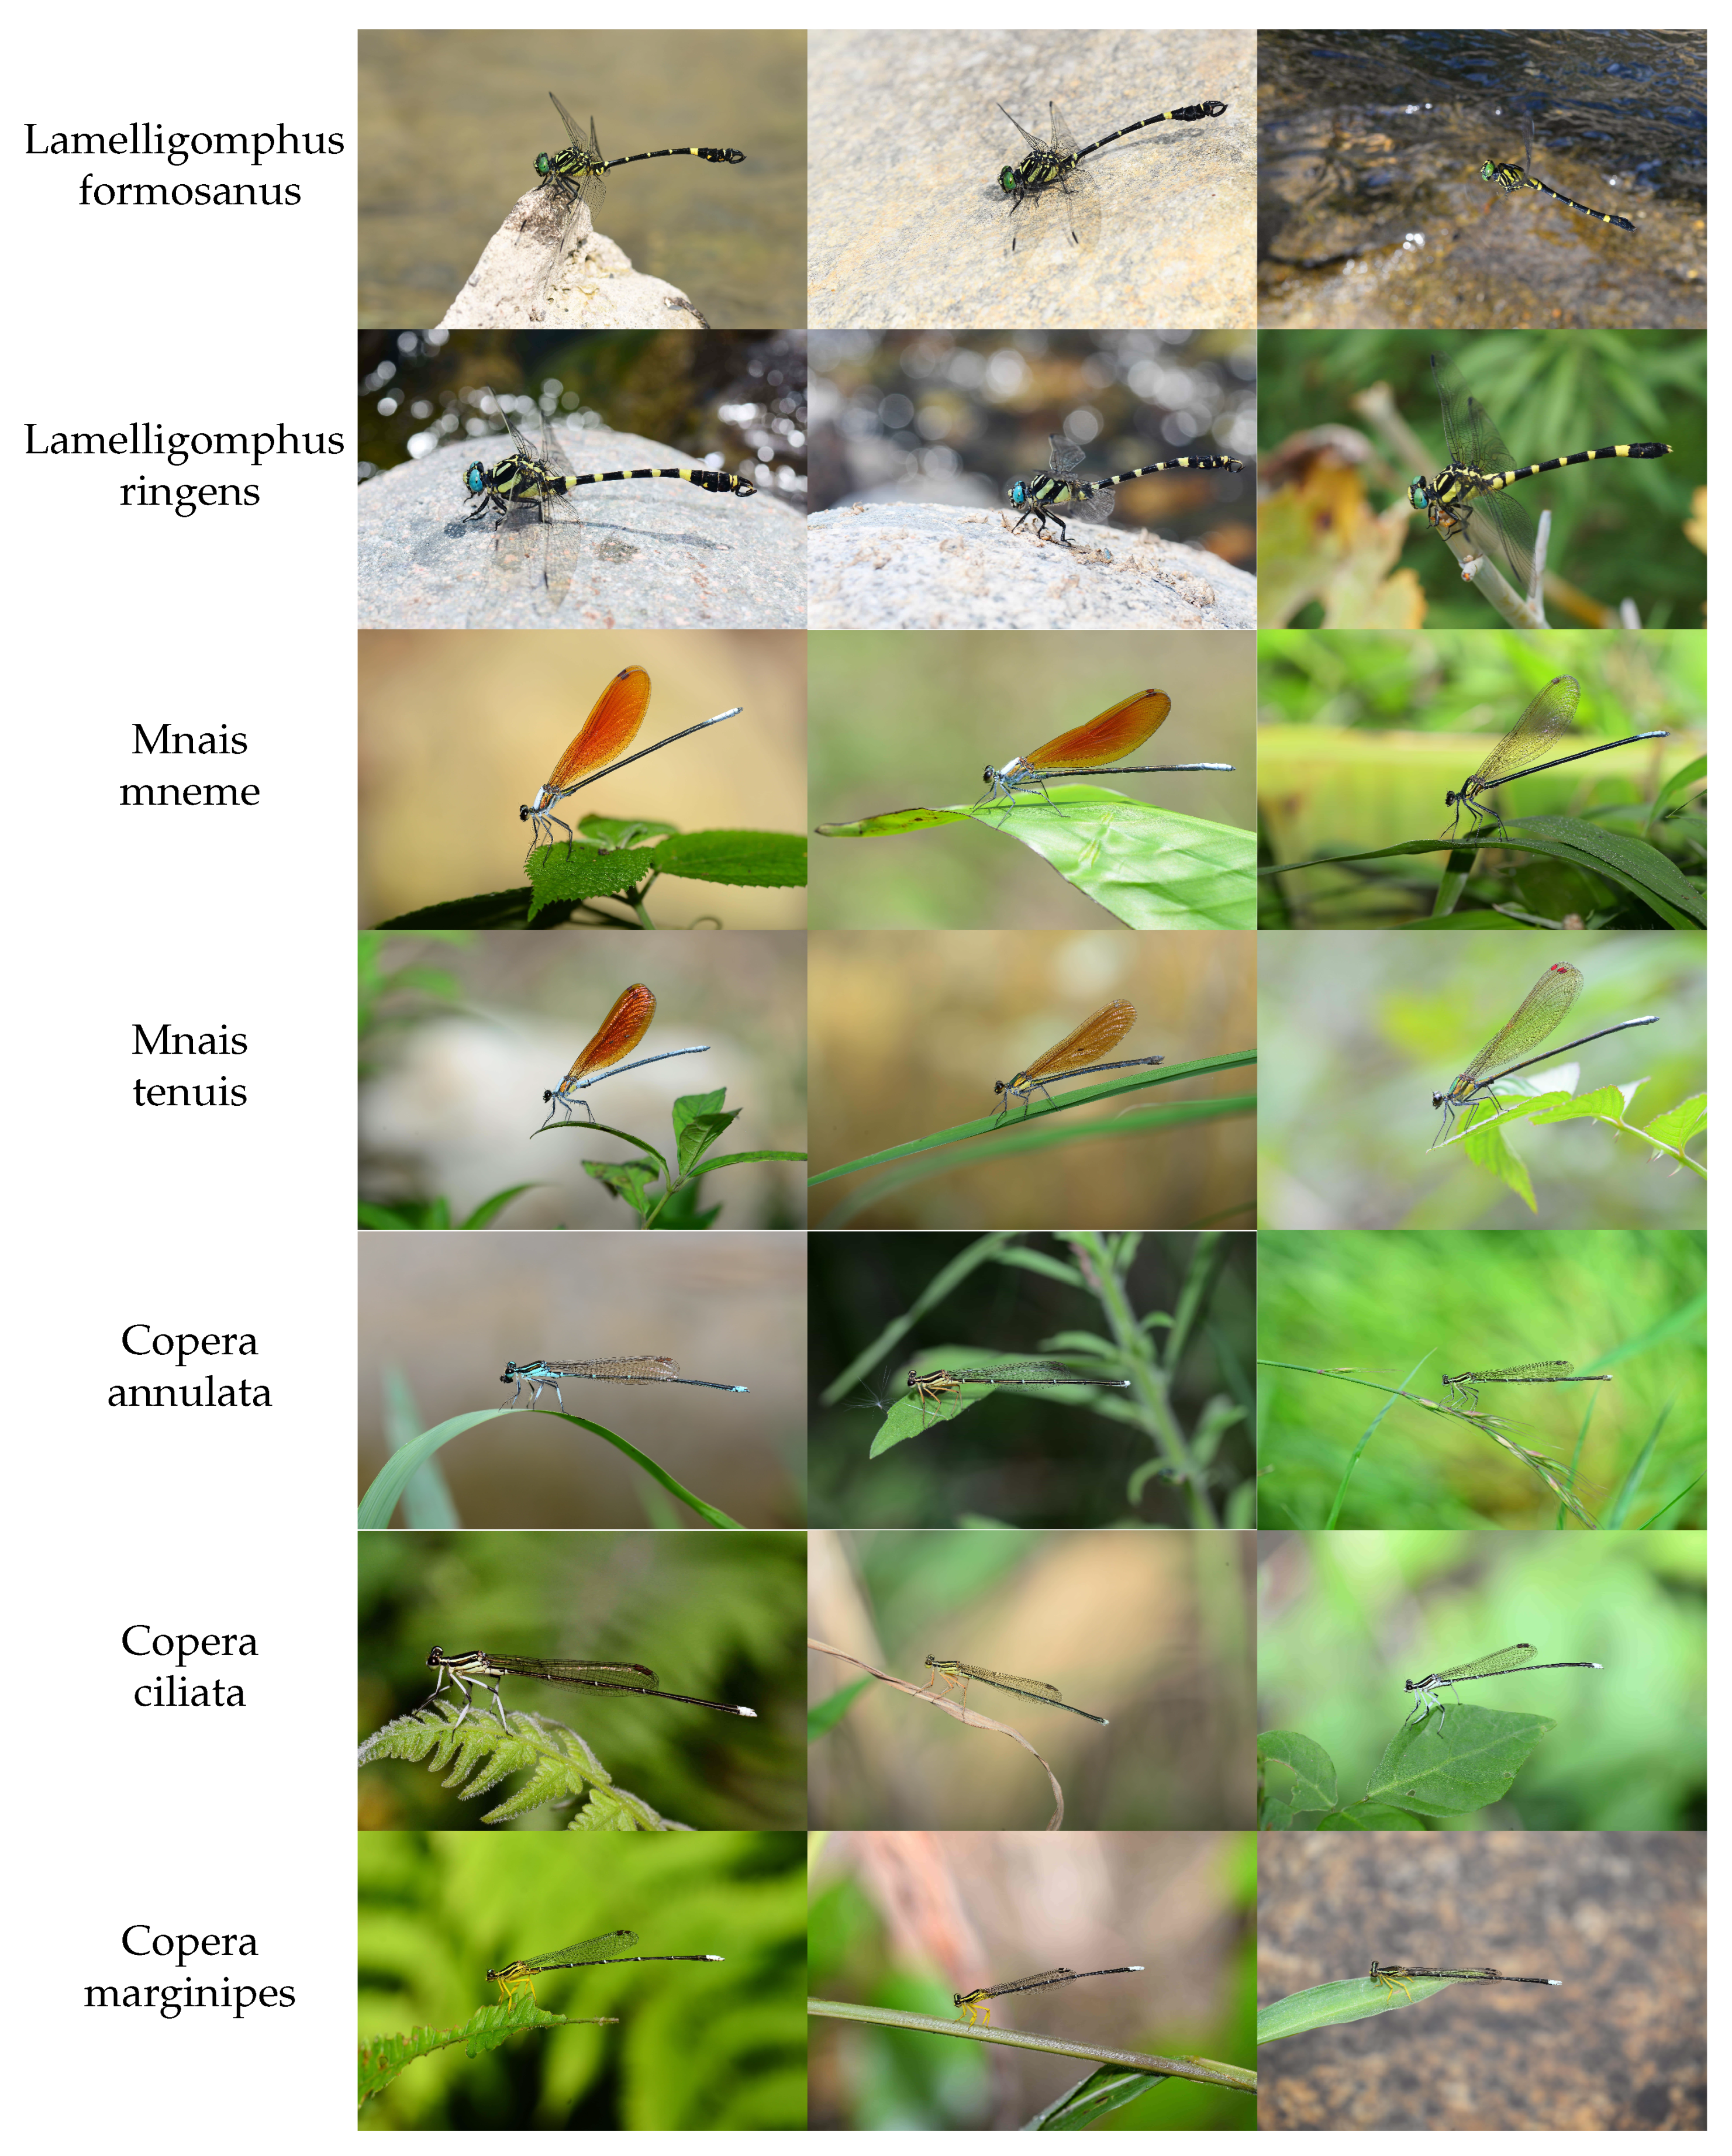
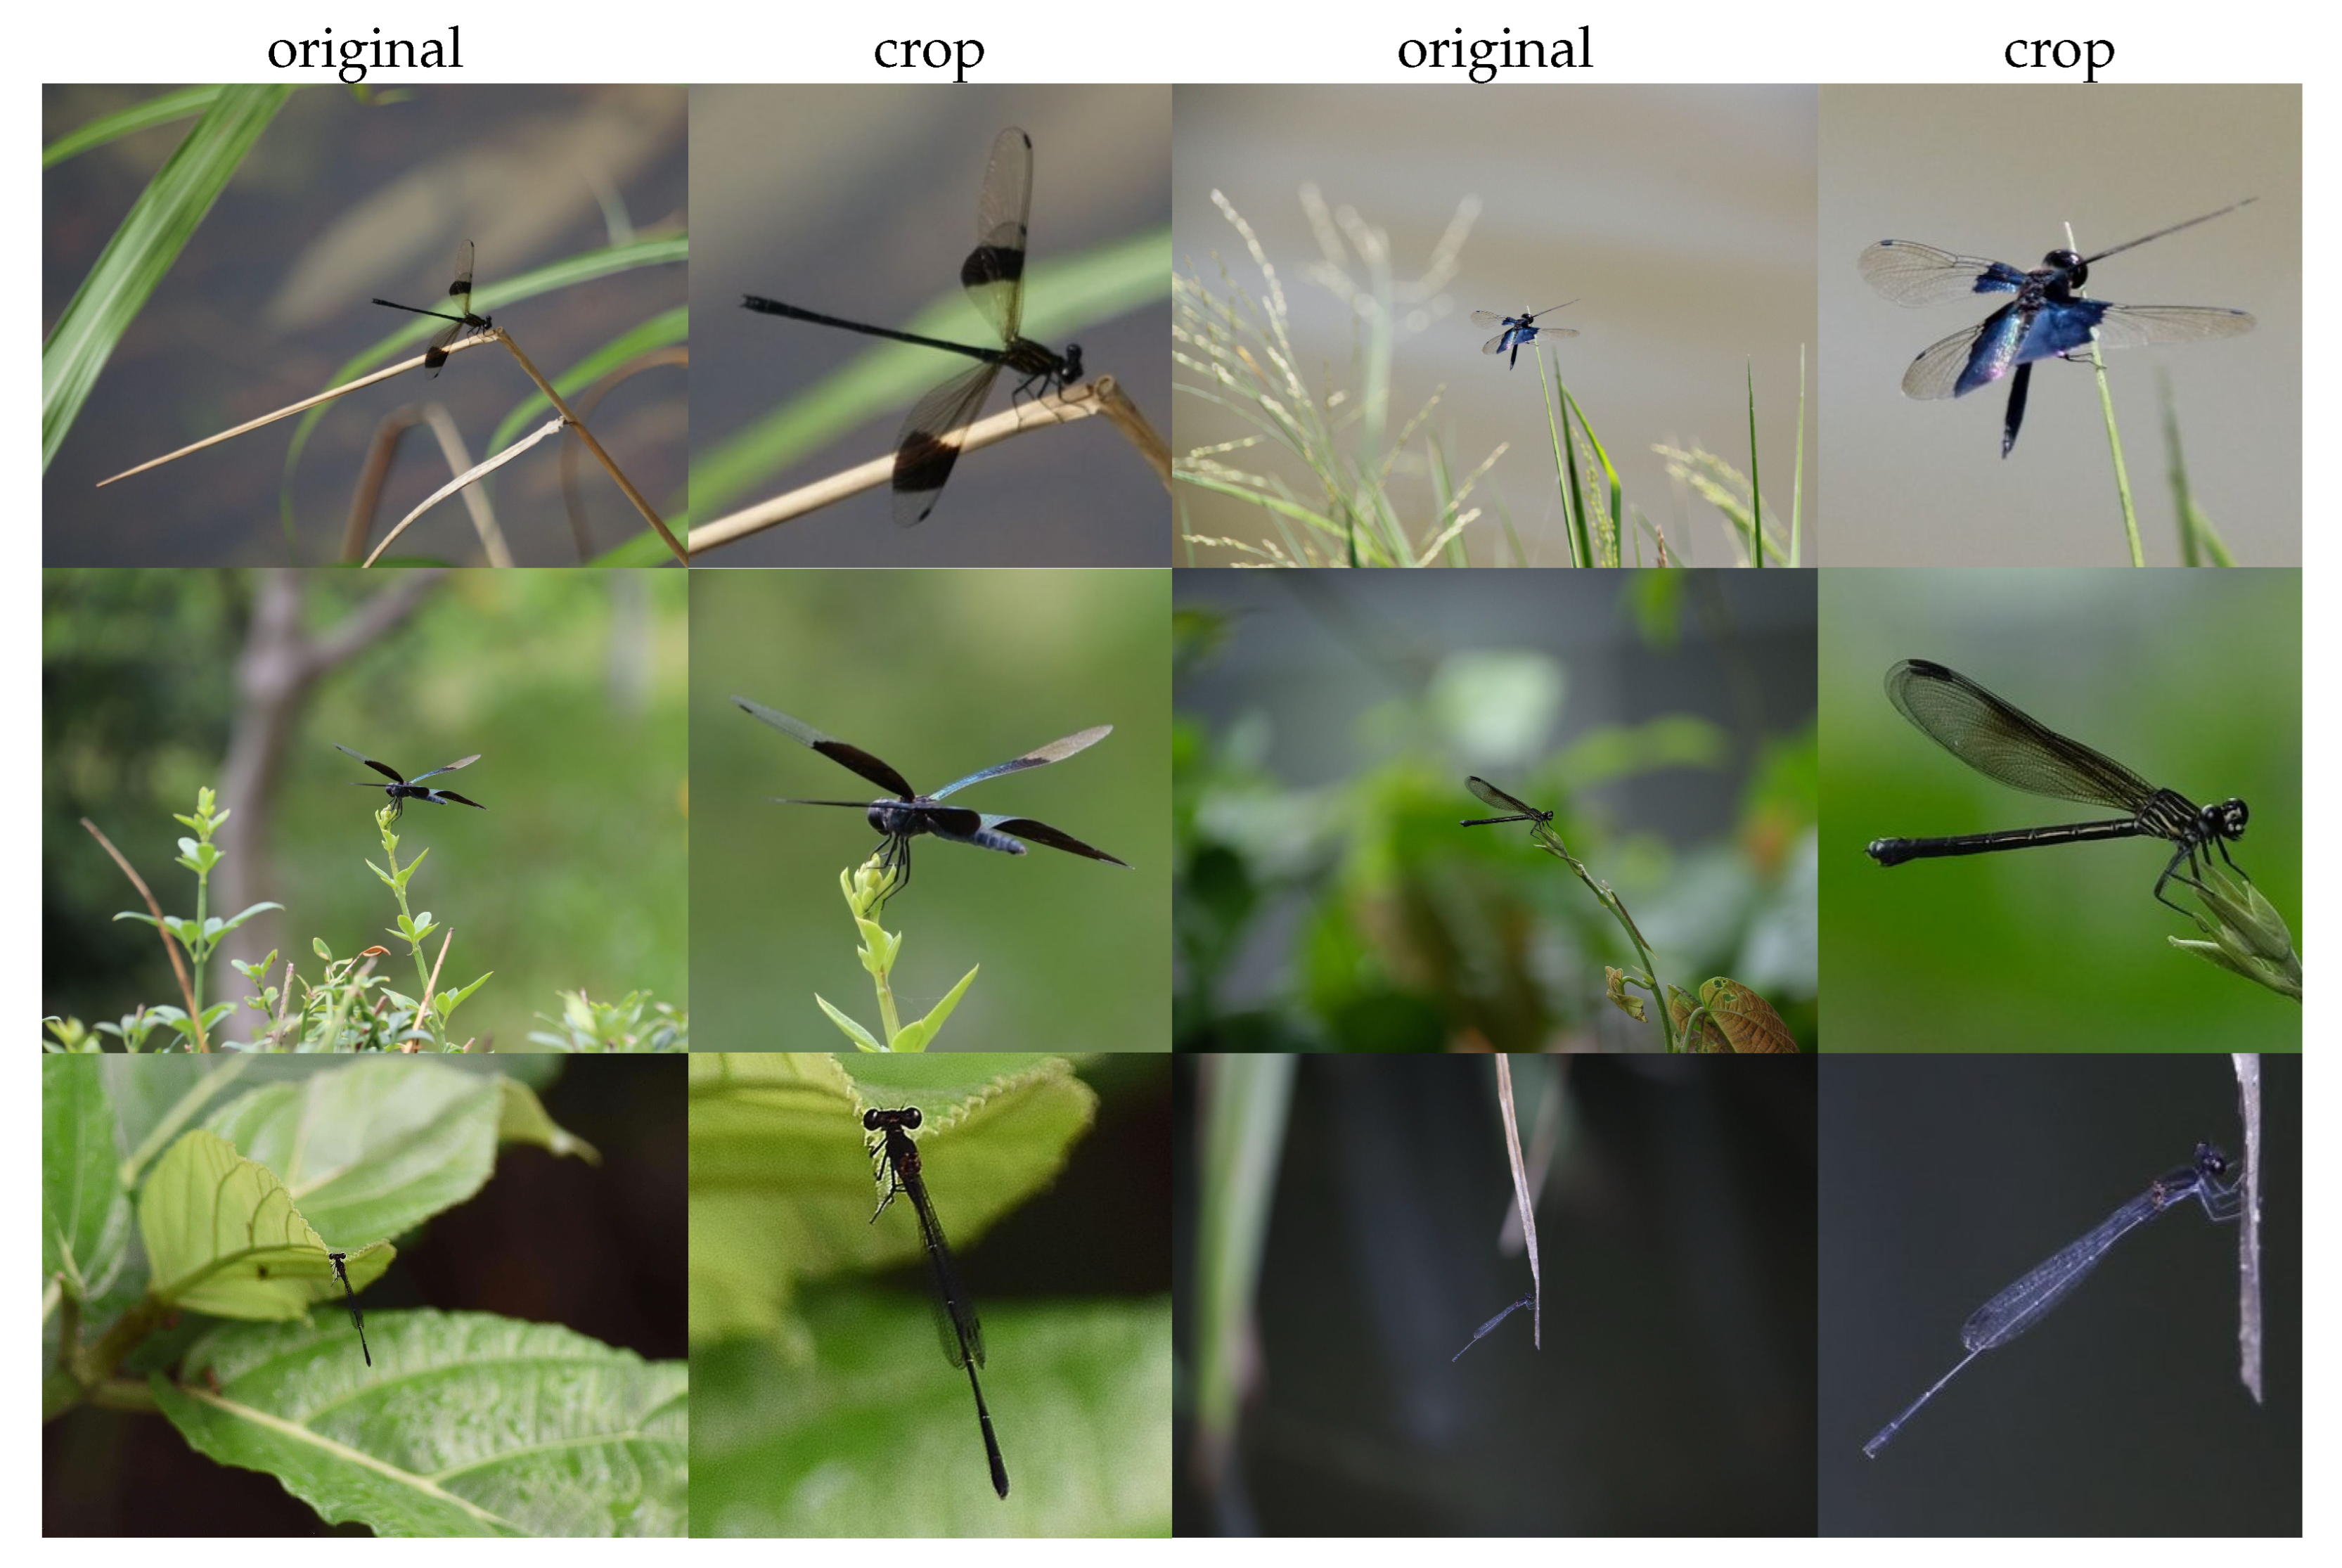
2. Data Process
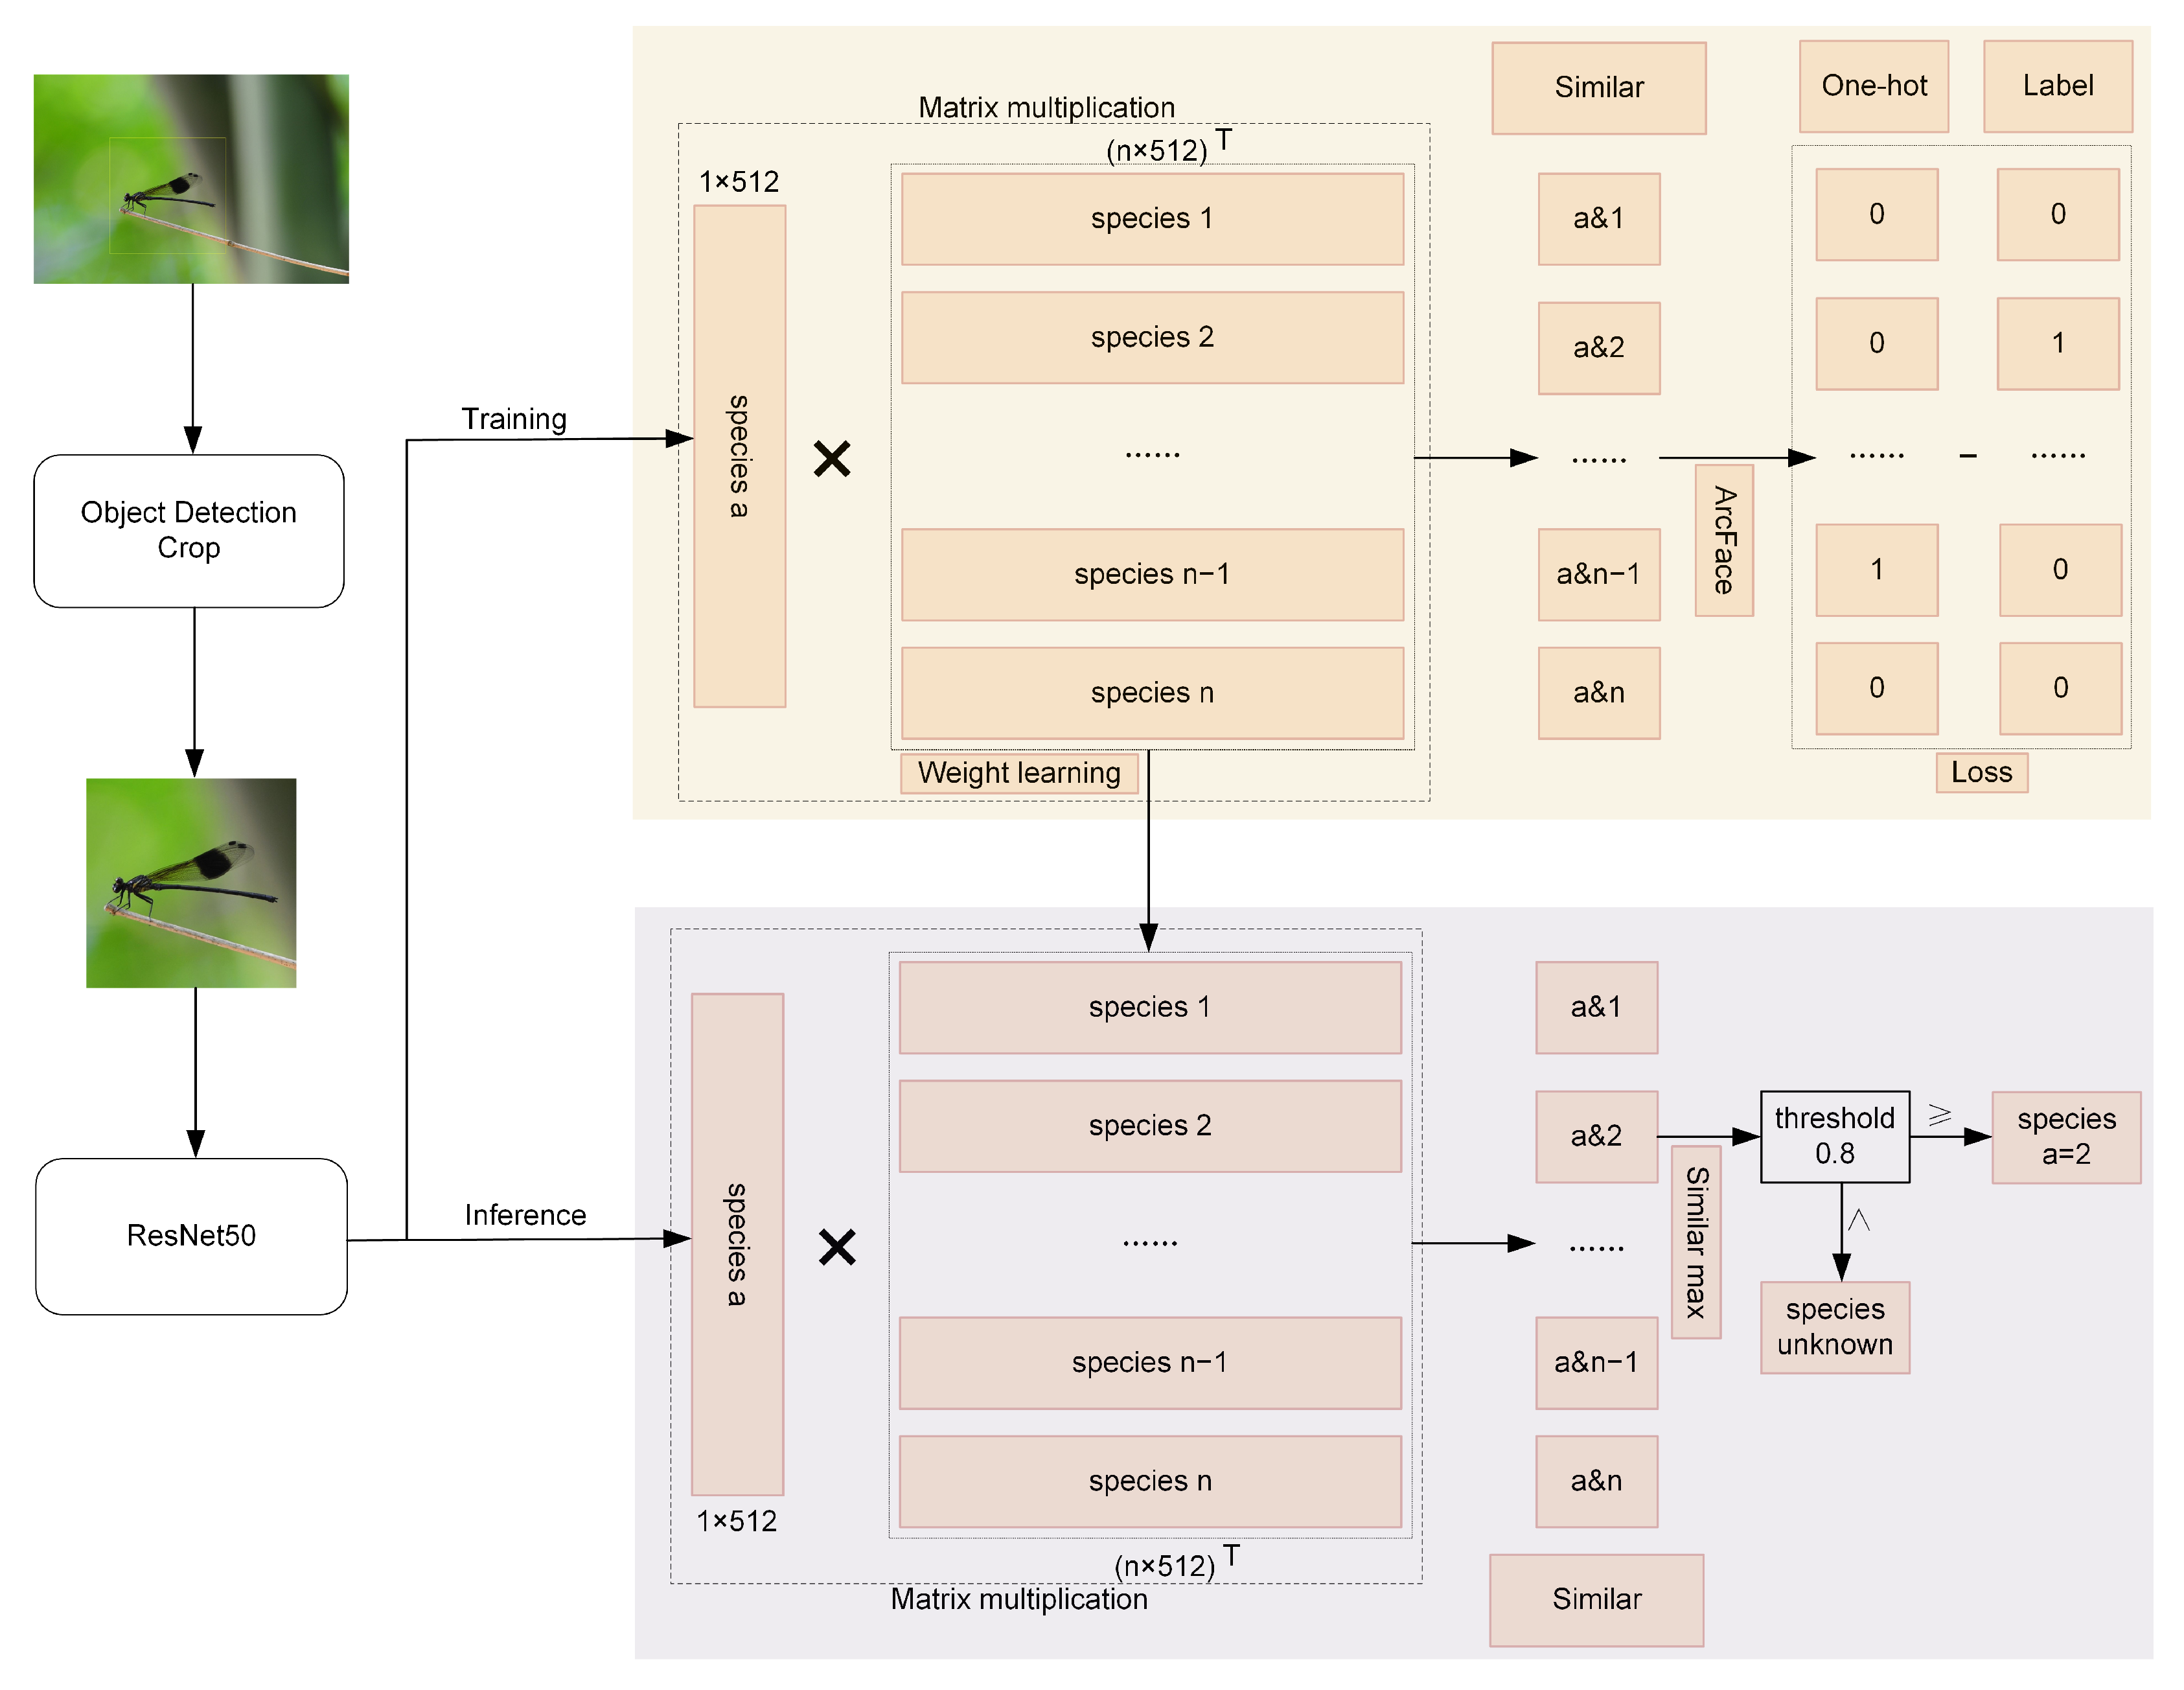
3. Proposed Methodology
- N is the batch size;
- s is the scale factor (default = 30);
- is the angle for the true class ;
- m is the angular margin (default = 0.5 radians);
- is the cosine similarity for class j.
4. Experiments
4.1. Experimental Setup
4.2. Experimental Data
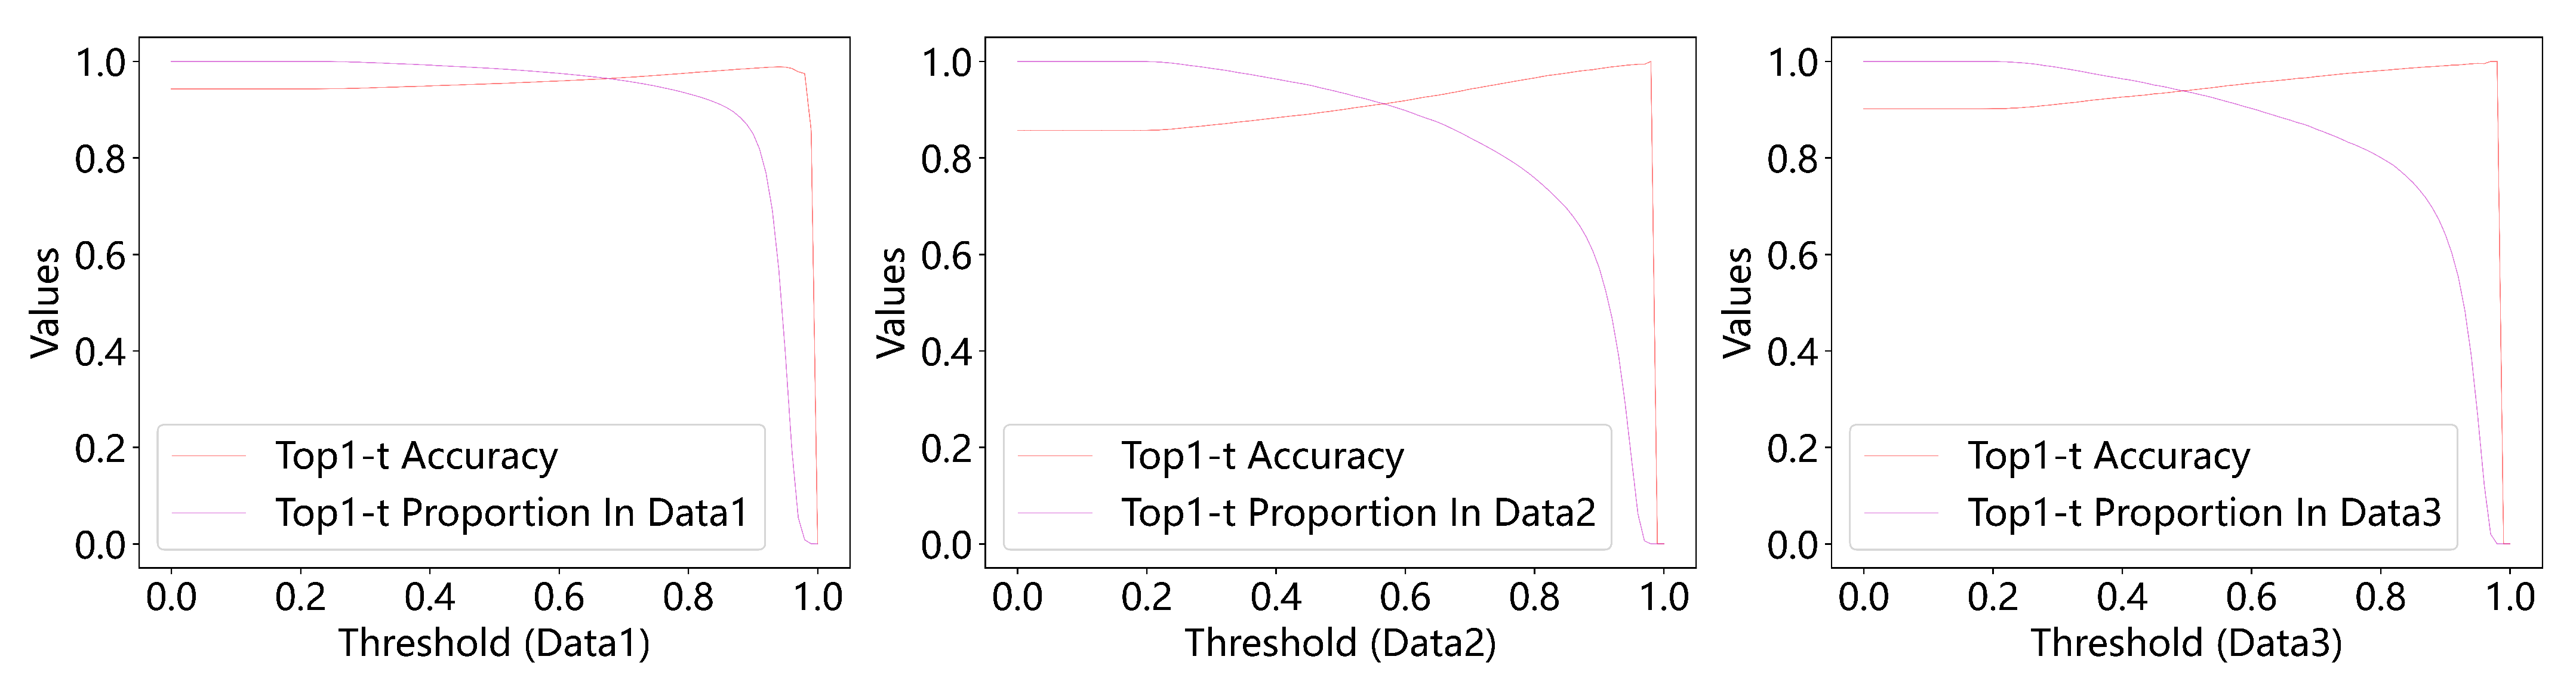
4.3. Experimental Results
- t is the similarity threshold;
- denotes the size of a set.
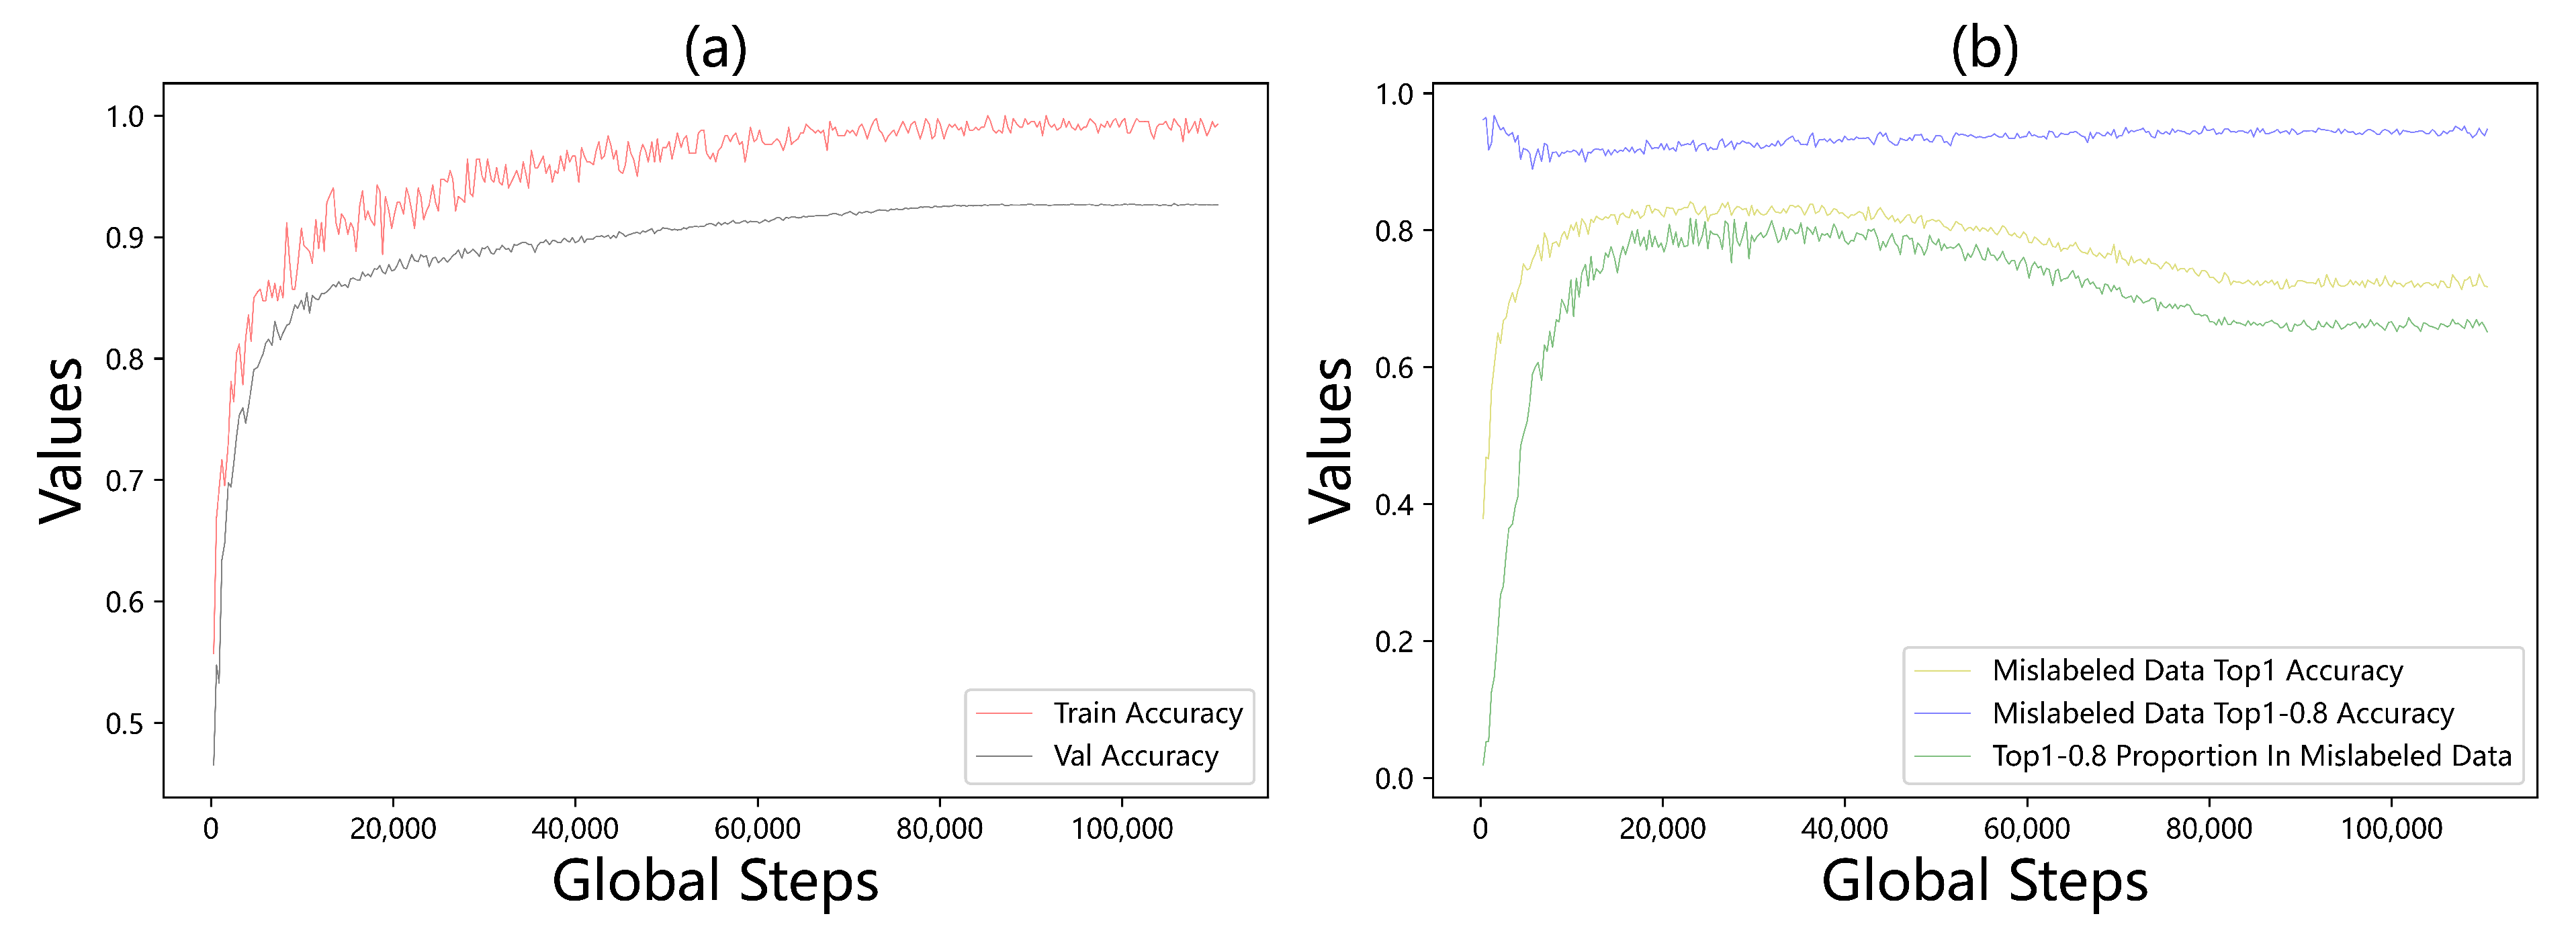
4.4. Ablation Study: Mislabeled Data Correction
4.5. Discussion and Relevance
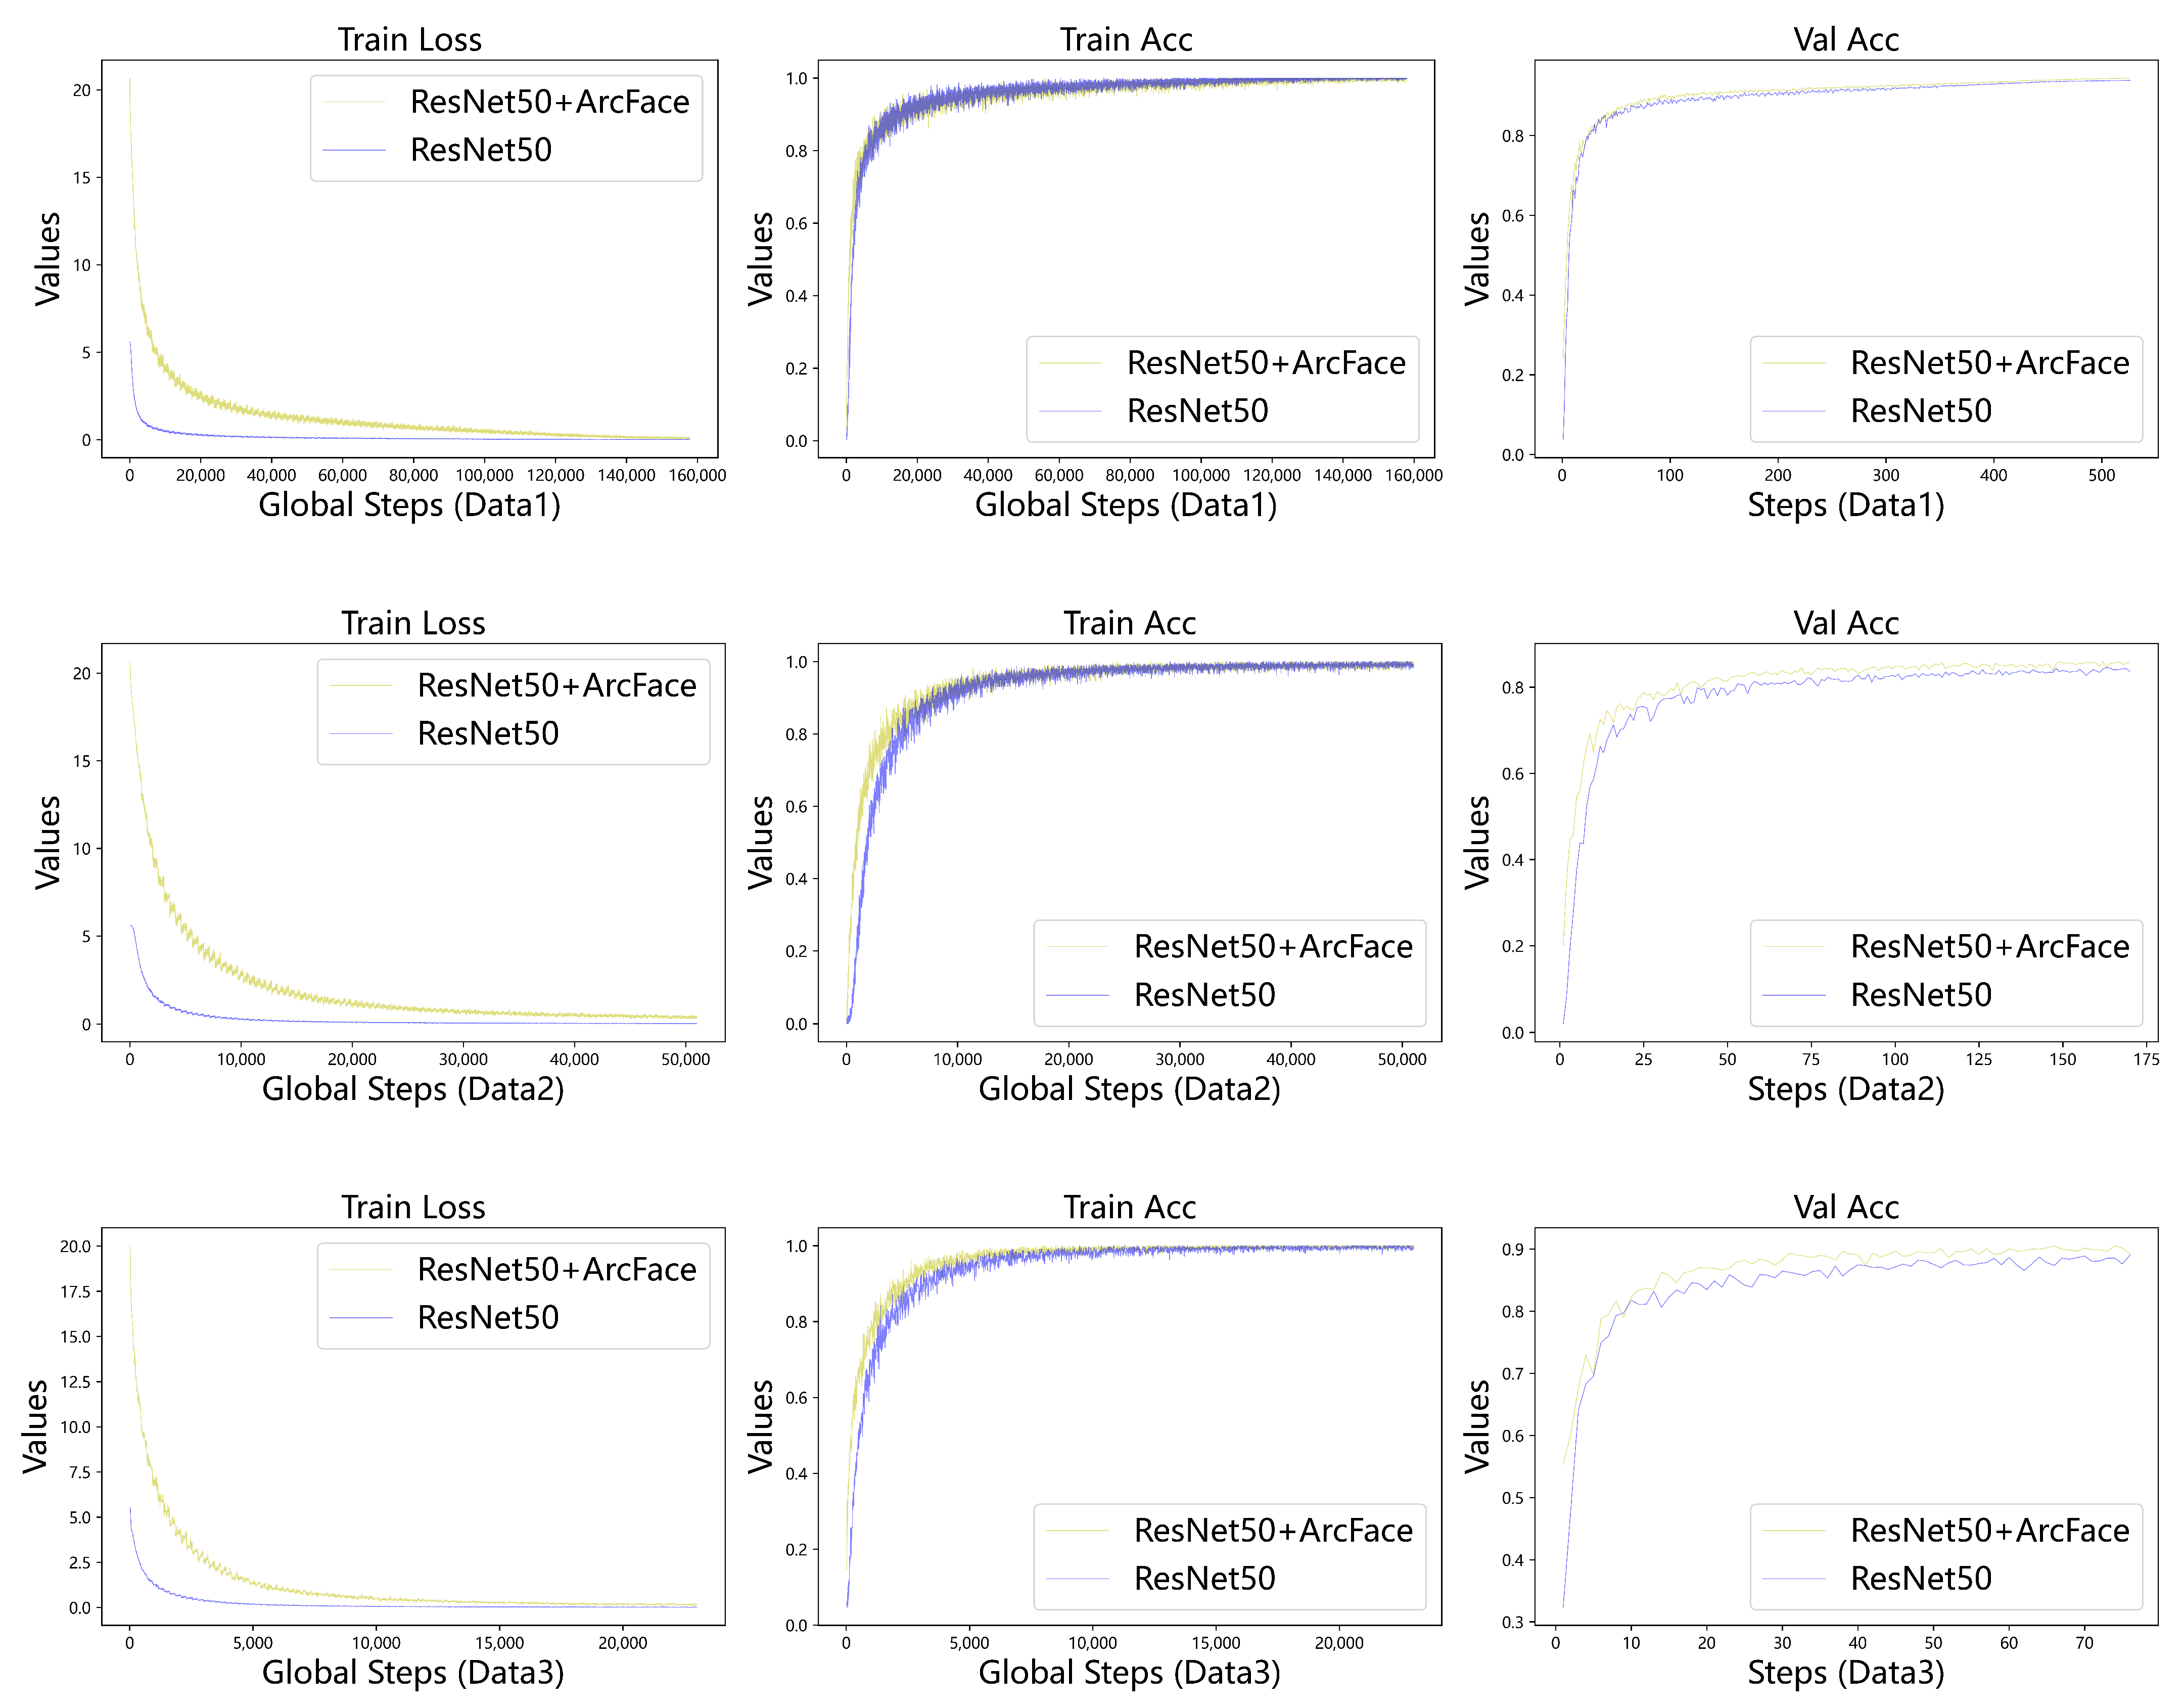
4.5.1. Classification Performance of the Two Models on Three Dataset
4.5.2. Prediction Methods of the Two Models
4.5.3. Imbalanced Class Distribution
4.5.4. Model Improvements
5. Conclusions
Author Contributions
Funding
Institutional Review Board Statement
Informed Consent Statement
Data Availability Statement
Conflicts of Interest
References
- Kalkman, V.J.; Clausnitzer, V.; Dijkstra, K.-D.B.; Orr, A.G.; Paulson, D.R.; van Tol, J. Global diversity of dragonflies (Odonata) in freshwater. Hydrobiologia 2008, 595, 351–363. [Google Scholar] [CrossRef]
- Bybee, S.M.; Kalkman, V.J.; Erickson, R.J.; Frandsen, P.B.; Breinholt, J.W.; Suvorov, A.; Dijkstra, K.D.B.; Cordero-Rivera, A.; Skevington, J.H.; Abbott, J.C.; et al. Phylogeny and classification of Odonata using targeted genomics. Mol. Phylogenet. Evol. 2021, 160, 107115. [Google Scholar] [CrossRef] [PubMed]
- Schneider, S.; Taylor, G.W.; Kremer, S. Deep Learning Object Detection Methods for Ecological Camera Trap Data. In Proceedings of the 2018 15th Conference on Computer and Robot Vision (CRV), Toronto, ON, Canada, 8–10 May 2018; pp. 321–328. [Google Scholar] [CrossRef]
- Wäldchen, J.; Mäder, P. Machine learning for image based species identification. Methods Ecol. Evol. 2018, 9, 2216–2225. [Google Scholar] [CrossRef]
- Krizhevsky, A.; Sutskever, I.; Hinton, G.E. ImageNet classification with deep convolutional neural networks. Commun. ACM 2017, 60, 84–90. [Google Scholar] [CrossRef]
- He, K.; Zhang, X.; Ren, S.; Sun, J. Deep Residual Learning for Image Recognition. In Proceedings of the 2016 IEEE Conference on Computer Vision and Pattern Recognition (CVPR), Las Vegas, NV, USA, 27–30 June 2016; pp. 770–778. [Google Scholar] [CrossRef]
- Huang, G.; Liu, Z.; Van Der Maaten, L.; Weinberger, K.Q. Densely Connected Convolutional Networks. In Proceedings of the 2017 IEEE Conference on Computer Vision and Pattern Recognition (CVPR), Honolulu, HI, USA, 21–26 July 2017; pp. 2261–2269. [Google Scholar] [CrossRef]
- Tan, M.; Le, Q. EfficientNet: Rethinking Model Scaling for Convolutional Neural Networks. In Proceedings of the 36th International Conference on Machine Learning, Long Beach, CA, USA, 9–15 June 2019; Chaudhuri, K., Salakhutdinov, R., Eds.; PMLR: Long Beach, CA, USA, 2019; Volume 97, pp. 6105–6114. [Google Scholar]
- Dosovitskiy, A.; Beyer, L.; Kolesnikov, A.; Weissenborn, D.; Zhai, X.; Unterthiner, T.; Dehghani, M.; Minderer, M.; Heigold, G.; Gelly, S.; et al. An Image is Worth 16x16 Words: Transformers for Image Recognition at Scale. In Proceedings of the International Conference on Learning Representations, Vienna, Austria, 4 May 2021. [Google Scholar]
- Liu, Z.; Lin, Y.; Cao, Y.; Hu, H.; Wei, Y.; Zhang, Z.; Lin, S.; Guo, B. Swin Transformer: Hierarchical Vision Transformer using Shifted Windows. In Proceedings of the 2021 IEEE/CVF International Conference on Computer Vision (ICCV), Montreal, QC, Canada, 10–17 October 2021; pp. 9992–10002. [Google Scholar] [CrossRef]
- Yuan, L.; Chen, Y.; Wang, T.; Yu, W.; Shi, Y.; Jiang, Z.; Tay, F.E.H.; Feng, J.; Yan, S. Tokens-to-Token ViT: Training Vision Transformers from Scratch on ImageNet. In Proceedings of the 2021 IEEE/CVF International Conference on Computer Vision (ICCV), Montreal, QC, Canada, 10–17 October 2021; pp. 538–547. [Google Scholar] [CrossRef]
- Zhou, C.L.; Ge, L.M.; Guo, Y.B.; Zhou, D.M.; Cun, Y.P. A comprehensive comparison on current deep learning approaches for plant image classification. J. Phys. Conf. Ser. 2021, 1873, 012002. [Google Scholar] [CrossRef]
- Lin, C.; Huang, X.; Wang, J.; Xi, T.; Ji, L. Learning niche features to improve image-based species identification. Ecol. Inform. 2021, 61, 101217. [Google Scholar] [CrossRef]
- Sourav, M.S.U.; Wang, H. Intelligent Identification of Jute Pests Based on Transfer Learning and Deep Convolutional Neural Networks. Neural Process. Lett. 2023, 55, 2193–2210. [Google Scholar] [CrossRef] [PubMed]
- Qi, F.; Wang, Y.; Tang, Z. Lightweight Plant Disease Classification Combining GrabCut Algorithm, New Coordinate Attention, and Channel Pruning. Neural Process. Lett. 2022, 54, 5317–5331. [Google Scholar] [CrossRef]
- Joshi, D.; Mishra, V.; Srivastav, H.; Goel, D. Progressive Transfer Learning Approach for Identifying the Leaf Type by Optimizing Network Parameters. Neural Process. Lett. 2021, 53, 3653–3676. [Google Scholar] [CrossRef]
- Theivaprakasham, H.; Darshana, S.; Ravi, V.; Sowmya, V.; Gopalakrishnan, E.; Soman, K. Odonata identification using Customized Convolutional Neural Networks. Expert Syst. Appl. 2022, 206, 117688. [Google Scholar] [CrossRef]
- Sun, J.; Futahashi, R.; Yamanaka, T. Improving the Accuracy of Species Identification by Combining Deep Learning With Field Occurrence Records. Front. Ecol. Evol. 2021, 9, 762173. [Google Scholar] [CrossRef]
- Frank, L.; Wiegman, C.; Davis, J.; Shearer, S. Confidence-Driven Hierarchical Classification of Cultivated Plant Stresses. In Proceedings of the 2021 IEEE Winter Conference on Applications of Computer Vision (WACV), Waikoloa, HI, USA, 3–8 January 2021; pp. 2502–2511. [Google Scholar] [CrossRef]
- Bickford, D.; Lohman, D.J.; Sodhi, N.S.; Ng, P.K.; Meier, R.; Winker, K.; Ingram, K.K.; Das, I. Cryptic species as a window on diversity and conservation. Trends Ecol. Evol. 2007, 22, 148–155. [Google Scholar] [CrossRef] [PubMed]
- Paulson, D. Dragonflies and Damselflies of the East; Princeton Field Guides; Princeton University Press: Princeton, NJ, USA, 2011. [Google Scholar]
- Dijkstra, K.; Schröter, A.; Lewington, R. Field Guide to the Dragonflies of Britain and Europe, 2nd ed.; Bloomsbury Wildlife Guides; Bloomsbury Publishing: London, UK, 2020. [Google Scholar]
- Barlow, A.; Golden, D.; Bangma, J. Field Guide to Dragonflies and Damselflies of New Jersey; New Jersey Department of Environmental Protection, Division of Fish and Wildlife: Trenton, NJ, USA, 2009. [Google Scholar]
- Corbet, P. Dragonflies: Behavior and Ecology of Odonata; A Comstock Book Series; Comstock Pub. Associates: Ithaca, NY, USA, 1999. [Google Scholar]
- Wang, A.; Chen, H.; Liu, L.; CHEN, K.; Lin, Z.; Han, J.; Ding, G. YOLOv10: Real-Time End-to-End Object Detection. In Proceedings of the Thirty-Eighth Annual Conference on Neural Information Processing Systems, Vancouver, BC, Canada, 10–15 December 2024. [Google Scholar]
- Simonyan, K.; Zisserman, A. Very Deep Convolutional Networks for Large-Scale Image Recognition. In Proceedings of the 3rd International Conference on Learning Representations, ICLR 2015, San Diego, CA, USA, 7–9 May 2015; Conference Track Proceedings; Bengio, Y., LeCun, Y., Eds.; ICLR: Appleton, WI, USA, 2015. [Google Scholar]
- Wen, Y.; Zhang, K.; Li, Z.; Qiao, Y. A Discriminative Feature Learning Approach for Deep Face Recognition. In Proceedings of the Computer Vision—ECCV 2016, Amsterdam, The Netherlands, 11–14 October 2016; Leibe, B., Matas, J., Sebe, N., Welling, M., Eds.; Springer: Cham, Switzerland, 2016; pp. 499–515. [Google Scholar]
- Wang, H.; Wang, Y.; Zhou, Z.; Ji, X.; Gong, D.; Zhou, J.; Li, Z.; Liu, W. CosFace: Large Margin Cosine Loss for Deep Face Recognition. In Proceedings of the 2018 IEEE/CVF Conference on Computer Vision and Pattern Recognition, Salt Lake City, UT, USA, 18–23 June 2018; pp. 5265–5274. [Google Scholar] [CrossRef]
- Liu, W.; Wen, Y.; Yu, Z.; Li, M.; Raj, B.; Song, L. SphereFace: Deep Hypersphere Embedding for Face Recognition. In Proceedings of the 2017 IEEE Conference on Computer Vision and Pattern Recognition (CVPR), Honolulu, HI, USA, 21–26 July 2017; pp. 6738–6746. [Google Scholar] [CrossRef]
- Deng, J.; Guo, J.; Yang, J.; Xue, N.; Kotsia, I.; Zafeiriou, S. ArcFace: Additive Angular Margin Loss for Deep Face Recognition. IEEE Trans. Pattern Anal. Mach. Intell. 2022, 44, 5962–5979. [Google Scholar] [CrossRef] [PubMed]
- Xu, J.; Liu, X.; Zhang, X.; Si, Y.W.; Li, X.; Shi, Z.; Wang, K.; Gong, X. X2-Softmax: Margin adaptive loss function for face recognition. Expert Syst. Appl. 2024, 249, 123791. [Google Scholar] [CrossRef]
- Bazarevsky, V.; Kartynnik, Y.; Vakunov, A.; Raveendran, K.; Grundmann, M. BlazeFace: Sub-millisecond Neural Face Detection on Mobile GPUs. arXiv 2019, arXiv:1907.05047. [Google Scholar]
- Deng, J.; Guo, J.; Ververas, E.; Kotsia, I.; Zafeiriou, S. RetinaFace: Single-Shot Multi-Level Face Localisation in the Wild. In Proceedings of the 2020 IEEE/CVF Conference on Computer Vision and Pattern Recognition (CVPR), Seattle, WA, USA, 13–19 June 2020; pp. 5202–5211. [Google Scholar] [CrossRef]
- Guo, J.; Deng, J.; Lattas, A.; Zafeiriou, S. Sample and Computation Redistribution for Efficient Face Detection. In Proceedings of the International Conference on Learning Representations, Virtual, 25–29 April 2022. [Google Scholar]


| Class | Images | Instances | FP | FN | Precision | Recall | mAP50 | mAP50-95 |
|---|---|---|---|---|---|---|---|---|
| Odonate | 500 | 542 | 18 | 41 | 0.965 | 0.924 | 0.967 | 0.841 |
| Data | Model | Top1 | Top5 | Precision | Recall | F1-Score | Top1-0.7 | Top1-0.8 | Top1-0.9 | Top1-0.95 |
|---|---|---|---|---|---|---|---|---|---|---|
| Data1 | ResNet50 | 0.937 | 0.986 | 0.934 | 0.929 | 0.931 | - | - | - | - |
| ResNet50+ArcFace | 0.943 | 0.978 | 0.94 | 0.936 | 0.938 | 0.967 | 0.976 | 0.986 | 0.988 | |
| Data2 | ResNet50 | 0.842 | 0.958 | 0.848 | 0.842 | 0.843 | - | - | - | - |
| ResNet50+ArcFace | 0.857 | 0.936 | 0.864 | 0.857 | 0.857 | 0.943 | 0.966 | 0.985 | 0.993 | |
| Data3 | ResNet50 | 0.886 | 0.969 | 0.636 | 0.574 | 0.587 | - | - | - | - |
| ResNet50+ArcFace | 0.902 | 0.96 | 0.66 | 0.6 | 0.615 | 0.969 | 0.981 | 0.991 | 0.996 |
| Data | Model | Top1 | Top5 | Precision | Recall | F1-Score | Top1-0.7 | Top1-0.8 | Top1-0.9 | Top1-0.95 |
|---|---|---|---|---|---|---|---|---|---|---|
| Data1 | ResNet50 | 0.945 | 0.988 | 0.942 | 0.937 | 0.94 | - | - | - | - |
| ResNet50+ArcFace | 0.951 | 0.983 | 0.949 | 0.946 | 0.947 | 0.967 | 0.974 | 0.983 | 0.984 | |
| Data2 | ResNet50 | 0.866 | 0.965 | 0.873 | 0.866 | 0.867 | - | - | - | - |
| ResNet50+ArcFace | 0.884 | 0.948 | 0.889 | 0.883 | 0.884 | 0.951 | 0.97 | 0.986 | 0.992 | |
| Data3 | ResNet50 | 0.895 | 0.969 | 0.763 | 0.65 | 0.682 | - | - | - | - |
| ResNet50+ArcFace | 0.911 | 0.961 | 0.751 | 0.7 | 0.709 | 0.975 | 0.986 | 0.994 | 0.997 |
| Data | Model | 0.7 | 0.80 | 0.85 | 0.90 | 0.95 |
|---|---|---|---|---|---|---|
| Data1 | ResNet50+ArcFace | 0.960 | 0.933 | 0.910 | 0.850 | 0.395 |
| Data2 | ResNet50+ArcFace | 0.842 | 0.759 | 0.695 | 0.572 | 0.176 |
| Data3 | ResNet50+ArcFace | 0.60 | 0.801 | 0.749 | 0.641 | 0.265 |
Disclaimer/Publisher’s Note: The statements, opinions and data contained in all publications are solely those of the individual author(s) and contributor(s) and not of MDPI and/or the editor(s). MDPI and/or the editor(s) disclaim responsibility for any injury to people or property resulting from any ideas, methods, instructions or products referred to in the content. |
© 2025 by the authors. Licensee MDPI, Basel, Switzerland. This article is an open access article distributed under the terms and conditions of the Creative Commons Attribution (CC BY) license (https://creativecommons.org/licenses/by/4.0/).
Share and Cite
Li, Z.; Pu, S.; Lu, J.; Song, R.; Zhang, H.; Lu, X.; Wang, Y. Transferring Face Recognition Techniques to Entomology: An ArcFace and ResNet Approach for Improving Dragonfly Classification. Appl. Sci. 2025, 15, 7598. https://doi.org/10.3390/app15137598
Li Z, Pu S, Lu J, Song R, Zhang H, Lu X, Wang Y. Transferring Face Recognition Techniques to Entomology: An ArcFace and ResNet Approach for Improving Dragonfly Classification. Applied Sciences. 2025; 15(13):7598. https://doi.org/10.3390/app15137598
Chicago/Turabian StyleLi, Zhong, Shaoyan Pu, Jingsheng Lu, Ruibin Song, Haomiao Zhang, Xuemei Lu, and Yanan Wang. 2025. "Transferring Face Recognition Techniques to Entomology: An ArcFace and ResNet Approach for Improving Dragonfly Classification" Applied Sciences 15, no. 13: 7598. https://doi.org/10.3390/app15137598
APA StyleLi, Z., Pu, S., Lu, J., Song, R., Zhang, H., Lu, X., & Wang, Y. (2025). Transferring Face Recognition Techniques to Entomology: An ArcFace and ResNet Approach for Improving Dragonfly Classification. Applied Sciences, 15(13), 7598. https://doi.org/10.3390/app15137598