Article

Quality Control of Asphalt Mixes Using EM Density Gauge: A Statistical Evaluation of Field Durability

by
M. Ariel Villanueva-Guzmán
1,*,
Hugo L. Chávez-García
1,
Elia M. Alonso-Guzmán
1,
Wilfrido Martínez-Molina
1,
Horacio Delgado-Alamilla
2,
Juan F. Mendoza-Sanchez
2,
Marco Antonio Navarrete-Seras
1 and
Mauricio Arreola-Sánchez
1
1
Faculty of Civil Engineering, Universidad Michoacana de San Nicolás de Hidalgo, Morelia 58070, Mexico
2
Coordinatio of Roadways, Mexican Institute of Transportation (IMT), Querétaro 76703, Mexico
*
Author to whom correspondence should be addressed.
Appl. Sci. 2025, 15(13), 7586; https://doi.org/10.3390/app15137586
Submission received: 26 May 2025 / Revised: 25 June 2025 / Accepted: 27 June 2025 / Published: 7 July 2025

Abstract

It is proposed to reduce the statistical uncertainty to make informed decisions in pavement construction, using a non-destructive method to determine the density (p) of asphalt mixtures, a decisive parameter to know the quality of the material studied and the content of voids (air voids), contrasting the results with destructive and physical tests to specimens extracted at the test site. This was carried out in the field with the EM density gauge (electromagnetic), on a 71.2 km long stretch of road. The results of the non-destructive tests were compared with the AASHTO standards. The study was focused on a representative sample of 25.9% of the total population, obtained using intentional stratified statistical sampling; the standard deviation was taken as the decisive value of dispersion in the determination of the p-density of the mixtures. The AASHTO T343 standard establishes that the permissible standard deviation for asphalt mixtures should be 0.050 g/cm3. Supplementary statistical analysis shows that the measurement error of the EM densitometer and the core-sampling method is ±1.8%, and the correlation coefficient within the 95% confidence interval reaches 0.91. The results of the analysis show a convincing trend towards the implementation of non-destructive methods, such as EM density gauge, to guarantee the determination of the quality of asphalt mixtures in the field, reducing the time required to determine the quality of the asphalt mixes. The results of the analysis show a convincing trend towards the implementation of non-destructive methods, such as EM density gauge, to ensure the determination of the quality of asphalt mixtures in the field, reducing the time required to determine the quality of asphalt mixtures.

1. Introduction

In Civil Engineering, a change in ideology has begun, as structural elements are not only designed for resistance to maximum stresses, but they are also designed for durability, with a thought of extending its life to external agents and more complex behaviors of materials, such as the principle of fatigue or Hooke’s Law. Since about 1987, a design ideology emerged from this reasoning. The SUPERPAVE™ mixture design method and its analysis are more complex than the methods in use, and the extent of its use depends on the traffic level or functional classification of the pavement for which the design is made. As a result, three design levels of asphalt mixtures were developed and classified, for which tests are required. In the adaptation of the SUPERPAVETM method to the conditions in Mexico, the classification of the design levels was carried out in four levels, which are presented in Figure 1 [1,2,3].
Currently, investigations of the performance evaluation of asphalt mixtures have provided certainty on the direct relationship that air voids (AV) have with the mechanical behavior, performance, and durability of asphalt mixtures in the field, so that densification can be analyzed by non-destructive methods in a detailed manner to clear ambiguities about the final behavior of the constructed asphalt mixture. Due to the complexity of replicating design conditions for field laboratory HMA, as well as damage to the built surface of the HMA generated by the traditional core extraction methodology for determining volumetric properties that guarantee good performance (AV = 3–8%) [1,2,3,4,5,6,7,8,9,10,11,12,13,14,15].
The core extraction method is carried out every 50 m, this causes damage to the pavement, so the application of “non-destructive methods” has been sought to predict the values of physical parameters (Gmb and AV) highly correlated with HMA quality assurance, without generating damage and with the possibility of obtaining a higher sampling frequency, as is the case with the electromagnetic density gauge, which allows to know the density of the asphalt mixture [16,17,18,19,20,21,22,23,24,25,26,27,28,29,30].
Using a comparison of 100/150 rotational compactions, the results show that for every 50 increase in compaction work, the EM density reading increases by 0.03 g/cm3, which is consistent with theoretical expectations.
The taking of readings that estimate the density and humidity of asphalt mixtures in the field is of utmost importance for the quality control of pavements and the evaluation of the condition of existing pavements. The estimation of the density of asphalt mixtures remains of utmost importance, and to do so by implementing non-destructive methods implies an effective way for this task [31,32].
In the core extraction method, it takes approximately 60–90 min to obtain a density and air content value (prior knowledge of the Gmm of the mixture is required), while, in non-destructive methods, it is possible to know a reading every 60 s for the EM density gauge, and with the GPR it is possible to evaluate 10 km of length in 15 min.
There has been a boom in the use of non-destructive methods for investigating physical properties of pavements, since they are fast and implement electromagnetic techniques such as the electromagnetic (EM) density gauge and the Ground-penetrating Radar (GPR). The non-destructive method for has been implemented for taking in Mexico for HMA quality control is the EM Density gauge, which is mainly due to the advantages it has over the GPR (Table 1).

2. Materials and Methods

2.1. EM Density Gauge Theory

To measure the density of asphalt mixture in the field was used PQI 380 electromagnetic (EM) density gauge, the operation of nuclear or non-nuclear density meters (non-destructive methods) is generally similar, this process includes calibration, the input value of asphalt mixture density through specimens in laboratory (cores or test pieces), and data collection [33,34].
The EM density was used, a device that uses electroscopic impedance to measure the electrical response of the asphalt from which you want to calculate its density. The electric field is transmitted through the material by the sensor on the equipment plate [30].
The EM density gauge is a device that uses impedance spectroscopy to make readings of the electrical response of the asphalt, from which the density of the asphalt mixture is calculated directly. The electric transmission field is transmitted from the sensor located in the plate of the EM density gauge through the material (asphalt mixture), to subsequently measure the electrical impedance (Figure 2) and use it within the calculation of the density of the specific rock aggregate [34].
It has been found that the dielectric constant of a matrix consisting of several materials is proportional to the volume fractions and the dielectric constants of these materials, as shown in Equation (1) [35].
ε c o m p = 1 n v n ε r n α α
where εrn are the dielectric constants of the materials constituting the matrix and vn are the fractions of the volume of the materials involved, α is a constant that explains the effects of interfacial dielectric polarization for engineering materials, α = 0.5. Table 2 below shows the usual data for each of the materials making up an asphalt mixture [35].
The value of the dielectric constant for stone aggregates depends on their petrographic and chemical composition; in the case of this research, we used basalt (εr = 3.2), but granite (εr = 4.5) can also be used.
According to the results expected from the equation of the asphalt dielectric constant, it is shown that the temperature coefficient in a mixture having a content of 2% water of −1% per 10 °C, for a temperature of 150 °C corresponding to 0.025 g/cm3.
If required, a correction of the densities should be made according to the temperature range (at every 10 °C) in which they are carried out, as shown in Equation (2) [35]:
εw = 78.54 (1 − 0.004579 (T − 25)) + 0.0000119 (T − 25)2
There are two common measurement methodologies in the EM density gauge (PQI 380) to obtain the results of the density of asphalt mixtures, which are simple measurements, or with the average measurement of 5 points, the density measurement range of the PQI is 18–2.5 g/cm3. For optimal results, the calibration of the PQI 380 with the core method is the most accurate and consistent readings; to ensure the methodology is reproducible, the calibration cycle must be monthly or in every change in the aggregate type and size, as well as the changes in the binders, produce a wide variety of electrical properties [36].
The EM densimeter can take density readings of several modalities (Figure 3a), with the simple reading and regional average method of 5 points. In the regional average, method density readings are taken at 5 points, which start in the center and move the equipment to 2″ from the upper and lower ends on both sides of the starting point (Figure 3b).
Due to the practicality of the procedure and the analysis that is performed on more than 586 points, it was decided to perform the simple reading method (one reading per point) with the equipment.
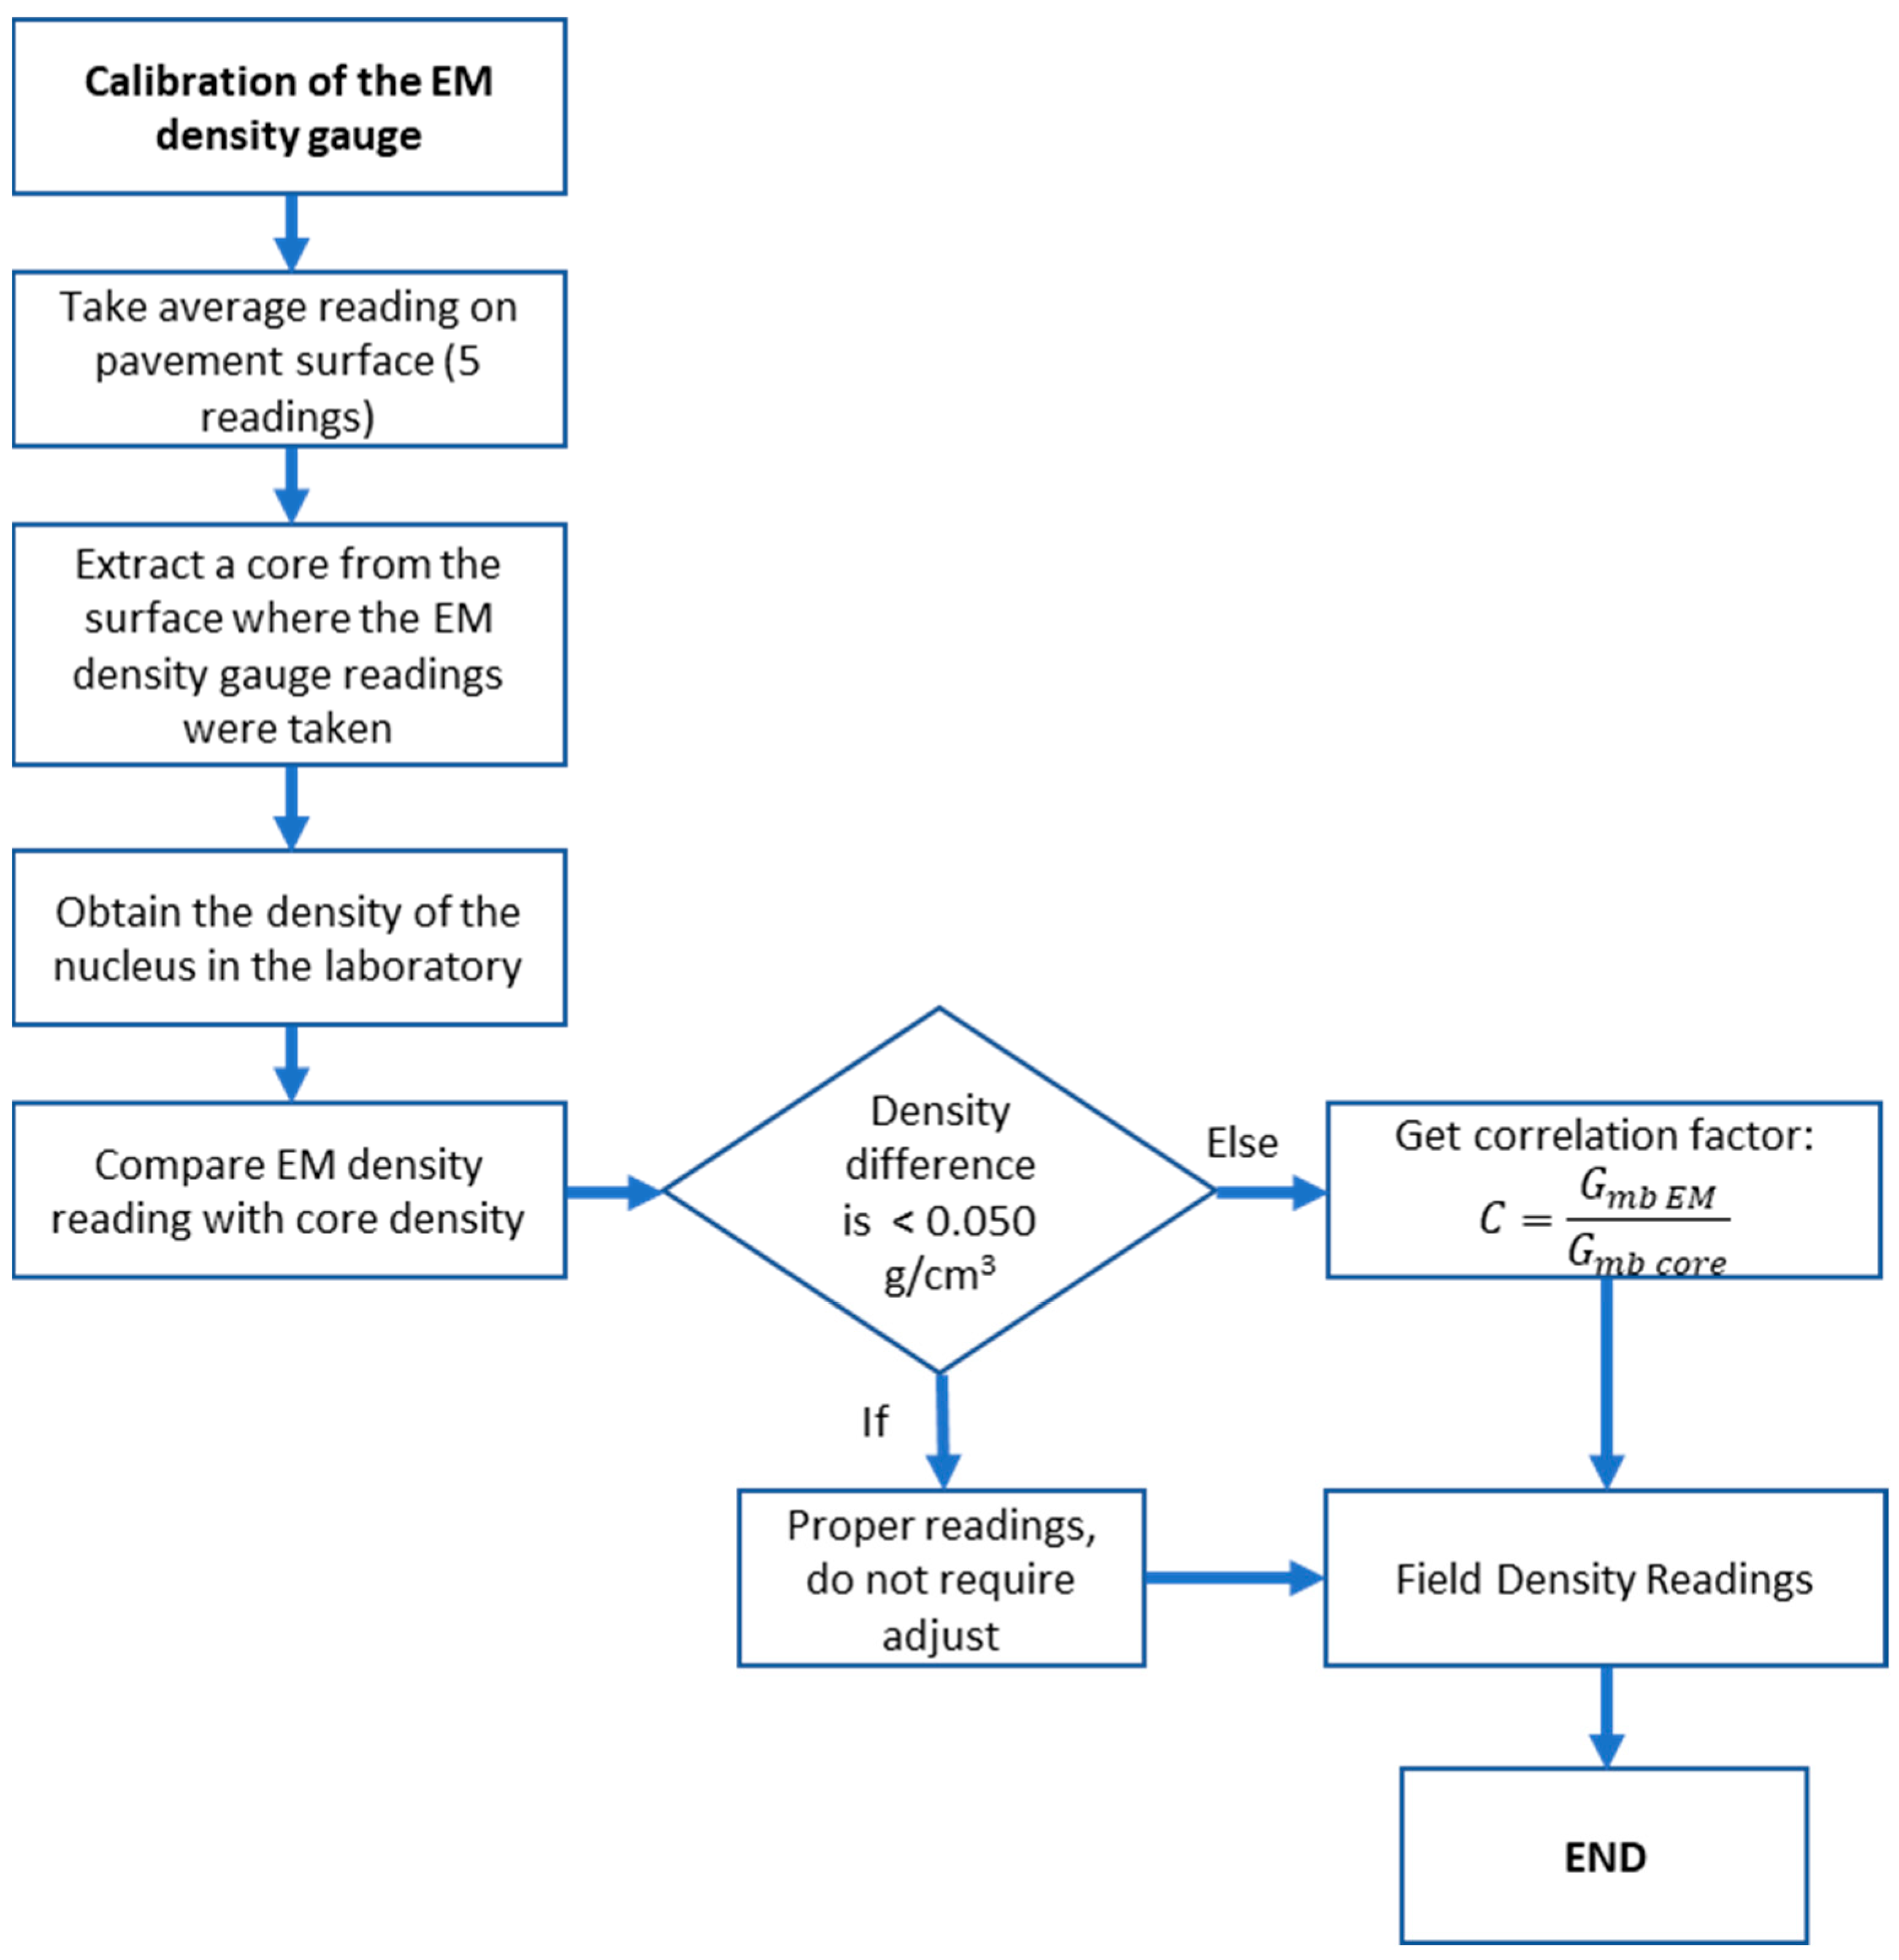
Performing the electromagnetic densimeter calibration process depends on the specifications provided by the manufacturer, who usually agree that the equipment should be calibrated for each new asphalt mixing working formula (JMF) in order to obtain approximate and consistent readings. This is mainly due to the fact that field work in construction uses different types of asphalt mixtures, which have small variations, which are mainly the change in the type and size of the stone aggregate or a change in the asphalt; these slight changes cause the electrical properties of the mixtures to be altered.
The standard calibration procedure should be performed using the average reading mode (5 readings of the area under analysis) of the electromagnetic field densimeter; subsequently, a core will be extracted from this surface in order to determine the density in the laboratory and make a comparison between both readings, having to adjust the densimeter reading to the result obtained with the core in the laboratory. This procedure is shown in the following flow diagram in Figure 4.
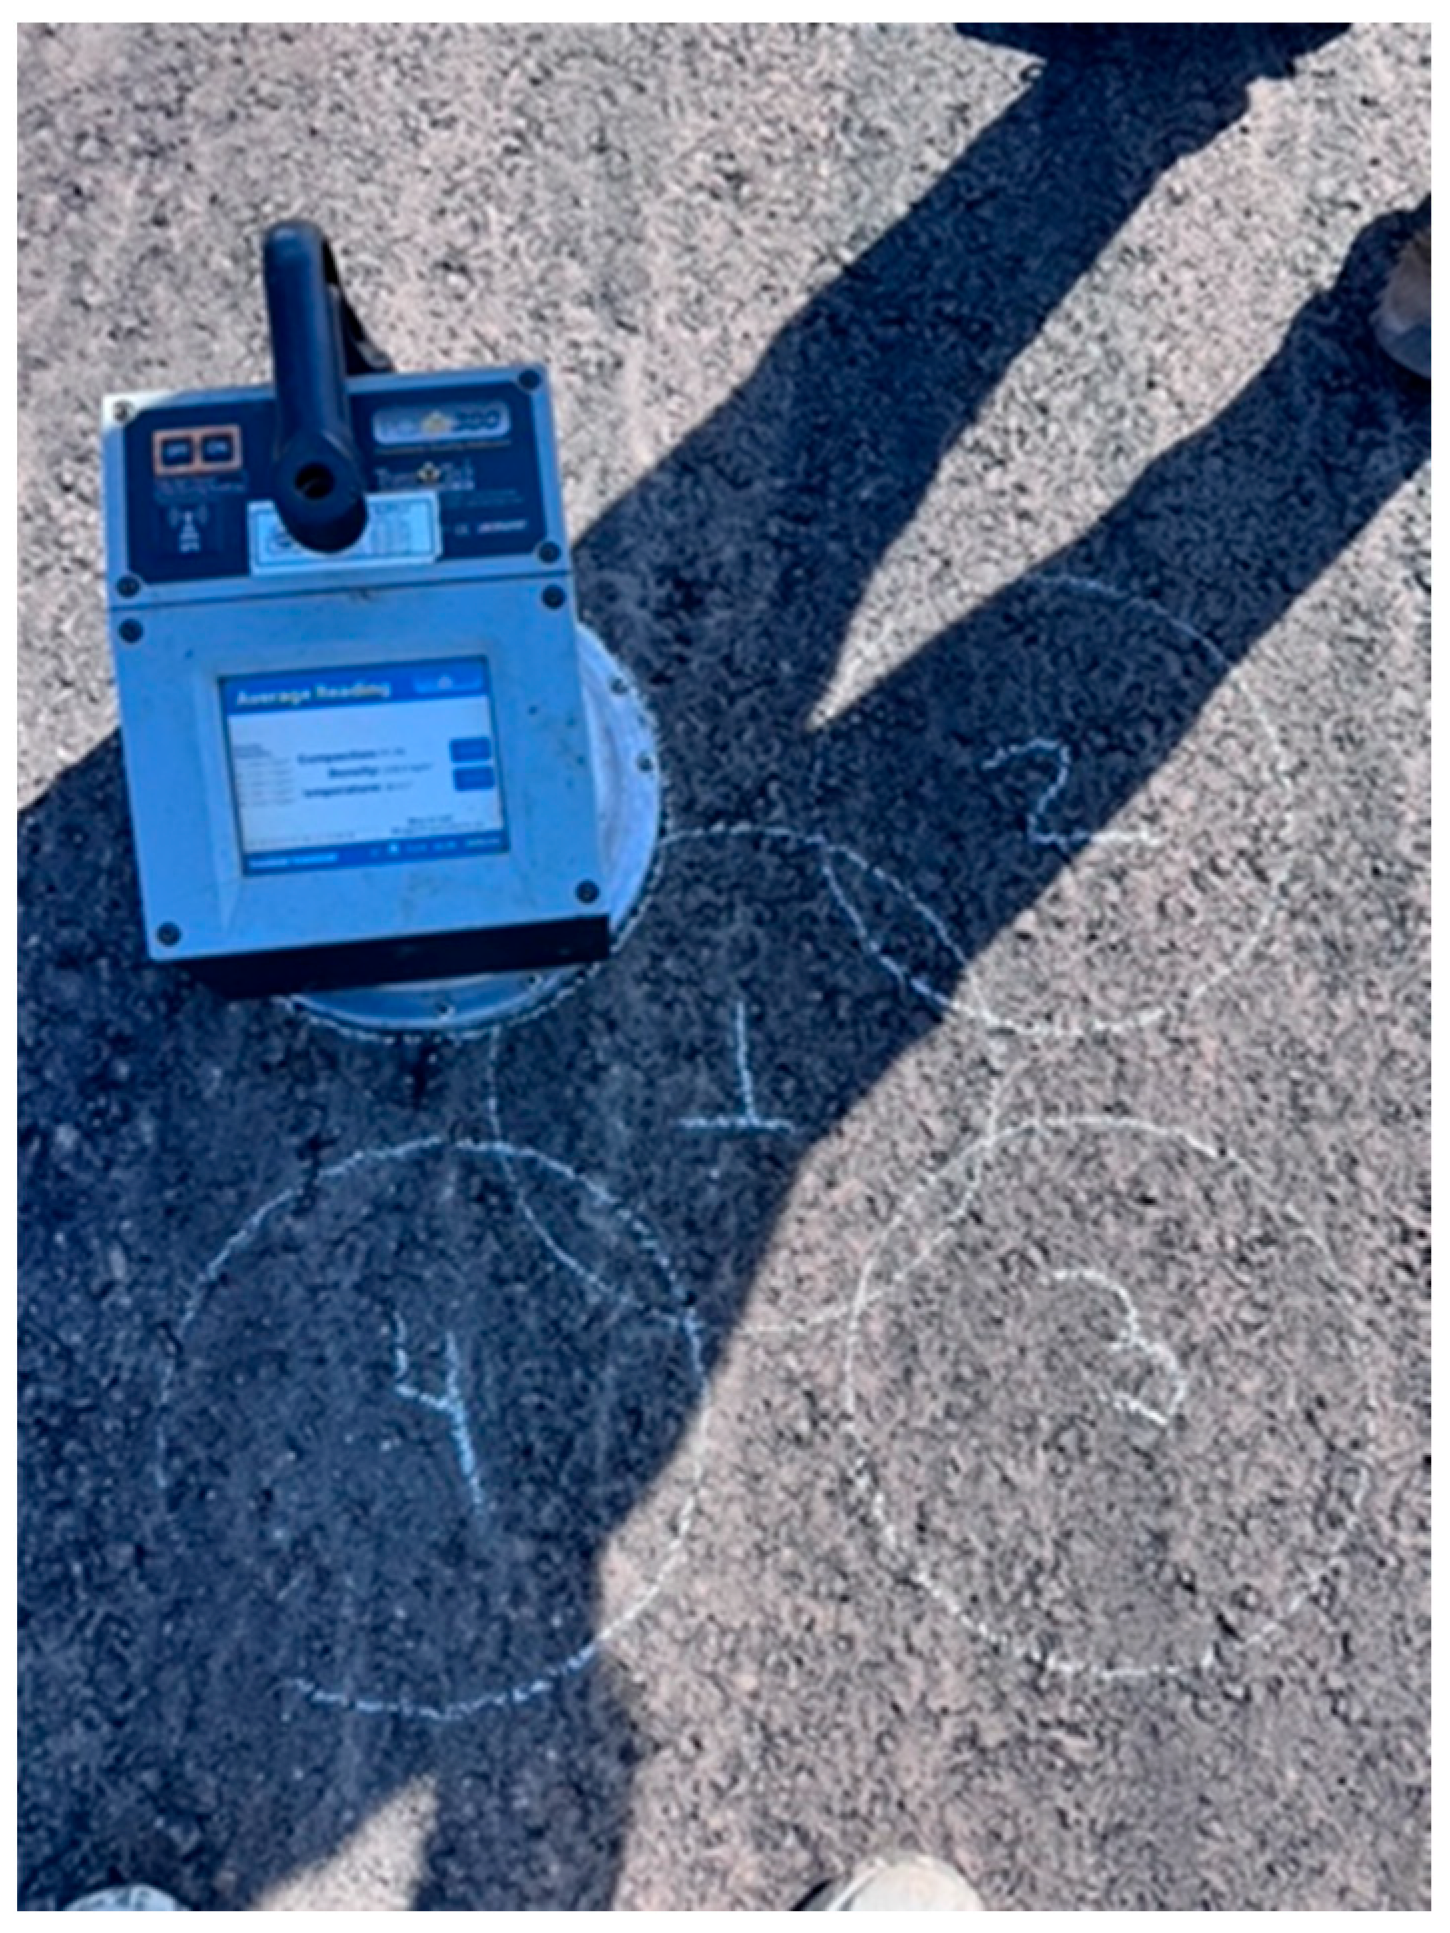
For the case of this investigation, the method of simple readings was used; that is to say, the result is recorded at a point (area of the plate) on the surface of the asphalt mixture, as shown in Figure 5. This test method with simple readings was chosen because of its ease and speed to obtain better field measurement performance, since the approximation and certainty of existing theoretical models for density prediction with EM equipment depends mainly on an extensive set of specimens for calibration [32]. Density readings from the HMA were taken every 50 m away on the axis.
To improve the accuracy of the electromagnetic density gauge, the laboratory core density is used as a reference. At least the density of the HMA shall be estimated with the electric field response and displayed on the display [33].

2.2. Characteristics of the Analysis Section

As the length of the built HMA surface is a high specification road of the Network of Toll Roads, which has 2 bodies, each body with 2 traffic lanes of 3.50 m each, and 1.80 m, the section under analysis has a length of approximately 71.2 km, with traffic conditions as shown in Table 3.
Where the classification indicates Annual Daily Average Traffic (ADAT) of 4506 and 4618 mixed vehicles, of which there are motorcycles (M), light vehicles (A), and heavy vehicles (B, C2, C3, T3S2, T3S3, and T3S2R4), where there are buses (B), freight trucks (C), and tractor units (T) with semi-trailers (S) or complete trailers (R), and the number accompanying them is the number of axles composing them. According to the vehicle composition of the section (Table 3), it is estimated that there is a 39.6% and 39.9% traffic of heavy vehicles in A and B, respectively.
The stretch is located in the state of Michoacán, where the prevailing climatic conditions (Table 4) consider it an area of “temperate climate”.
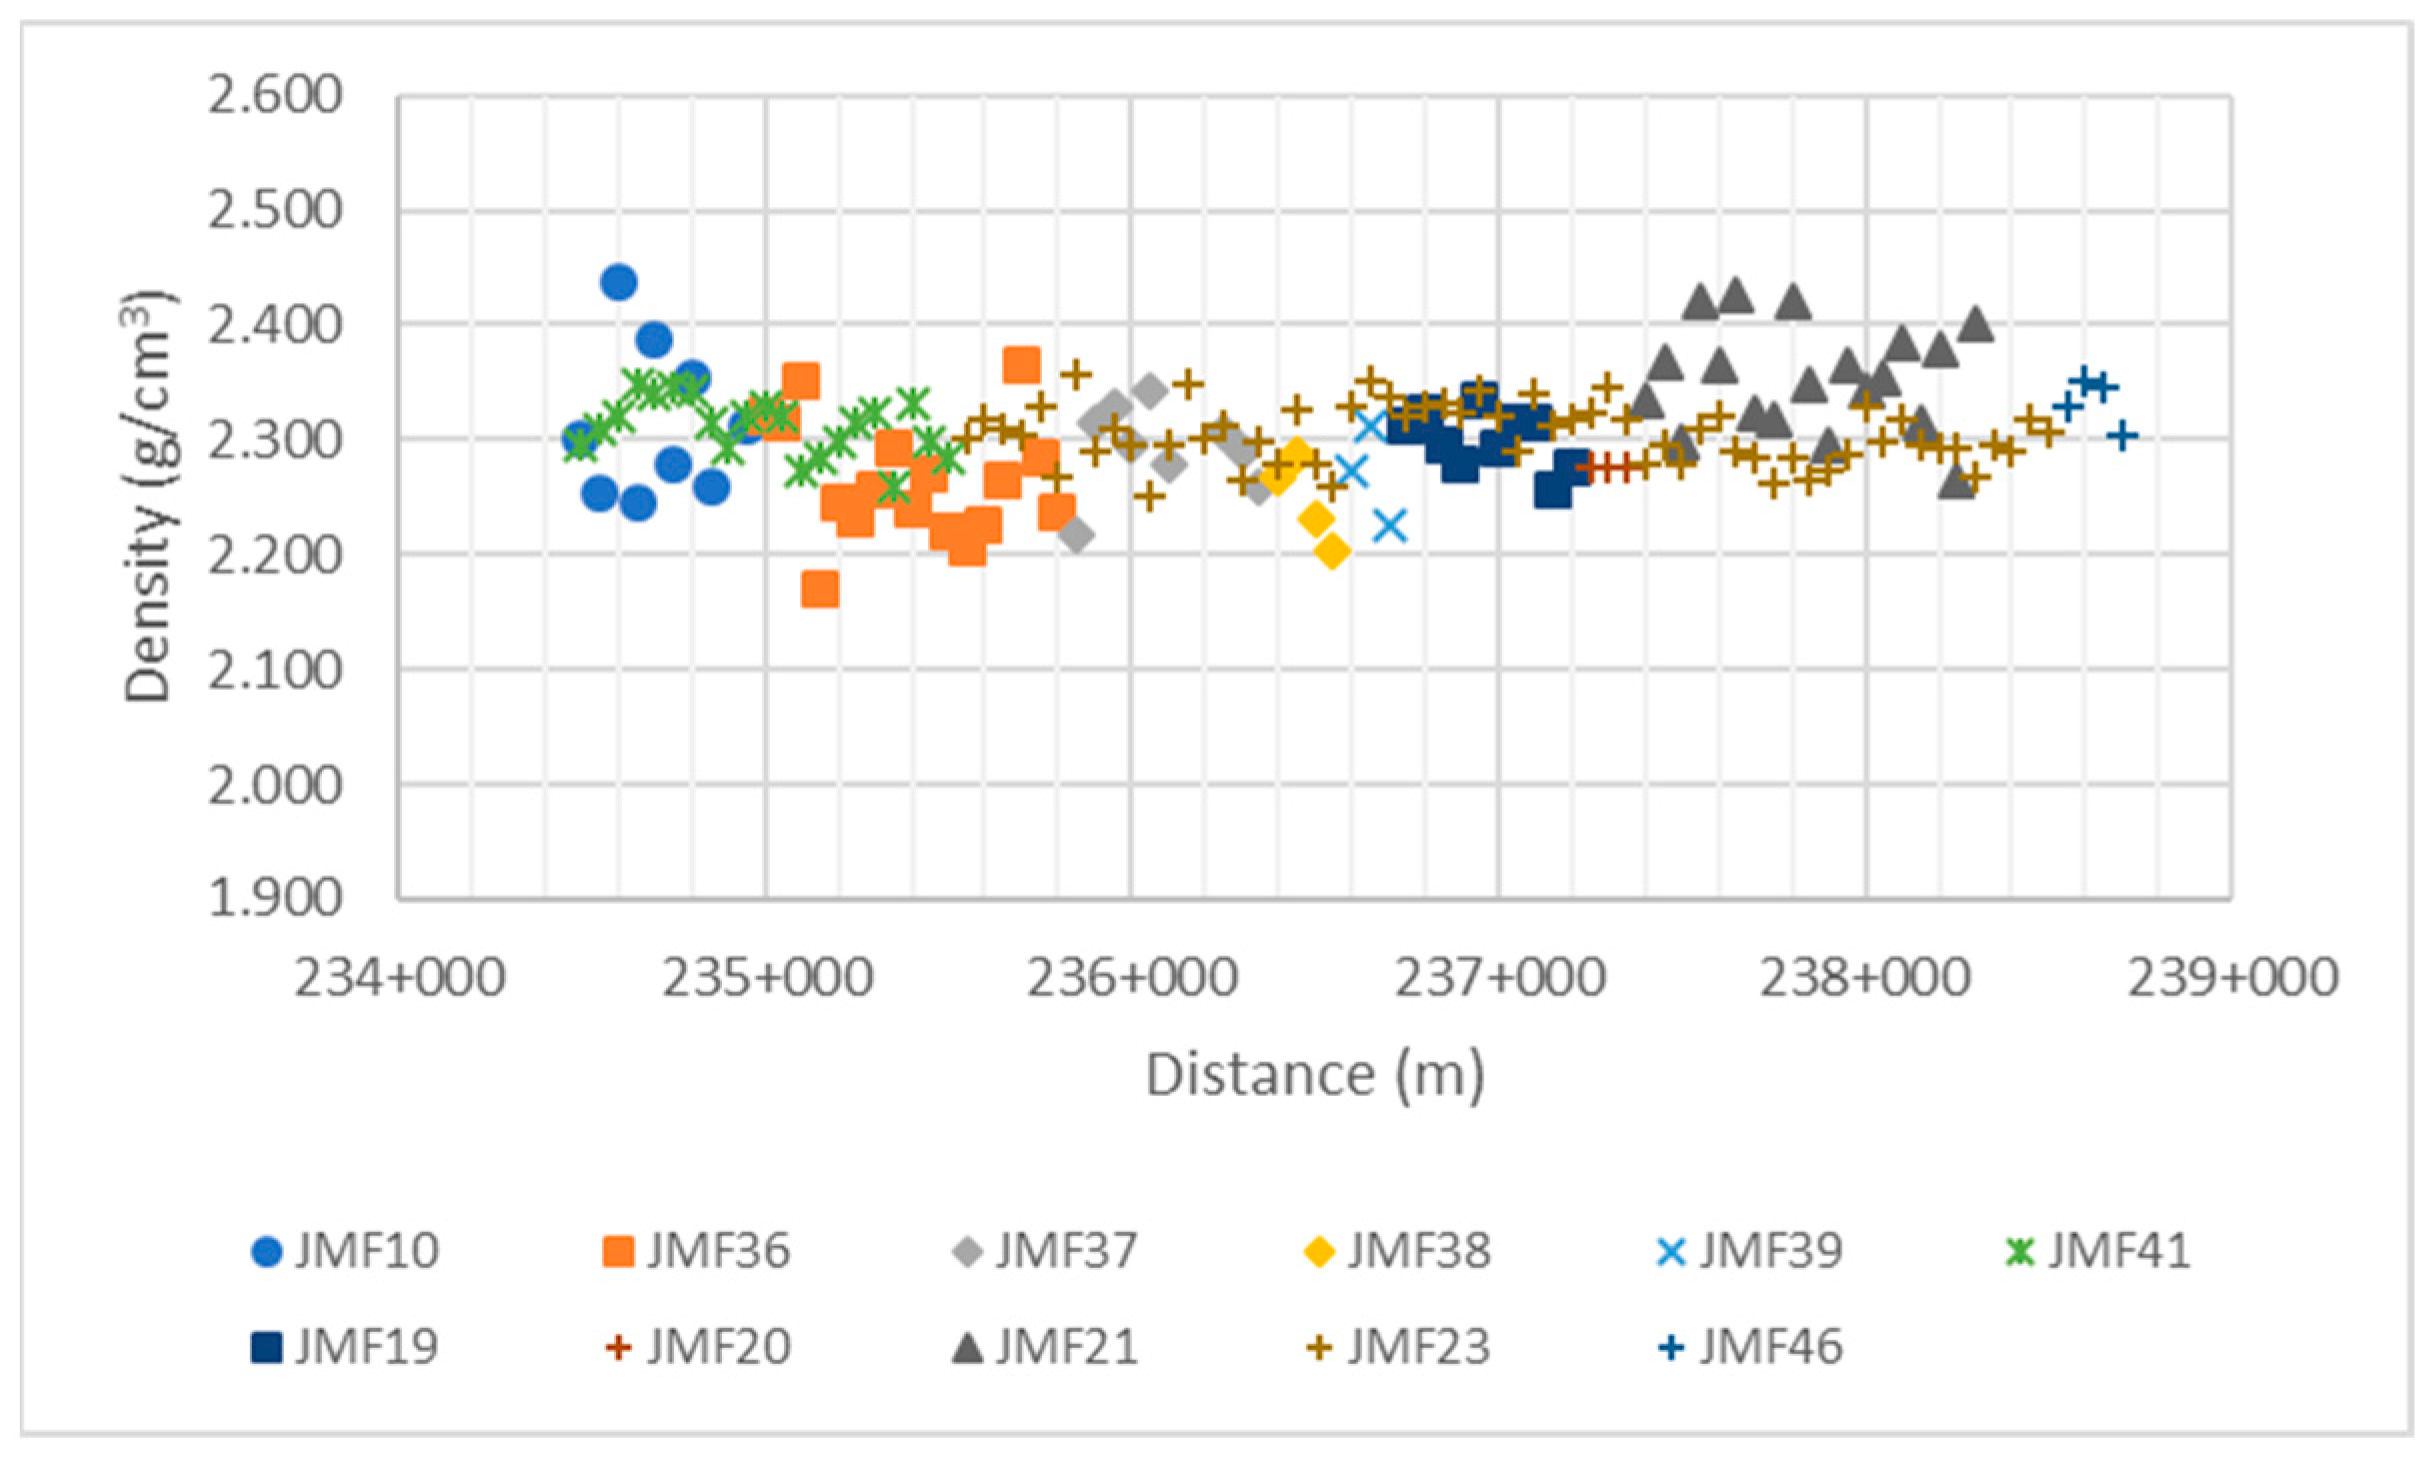
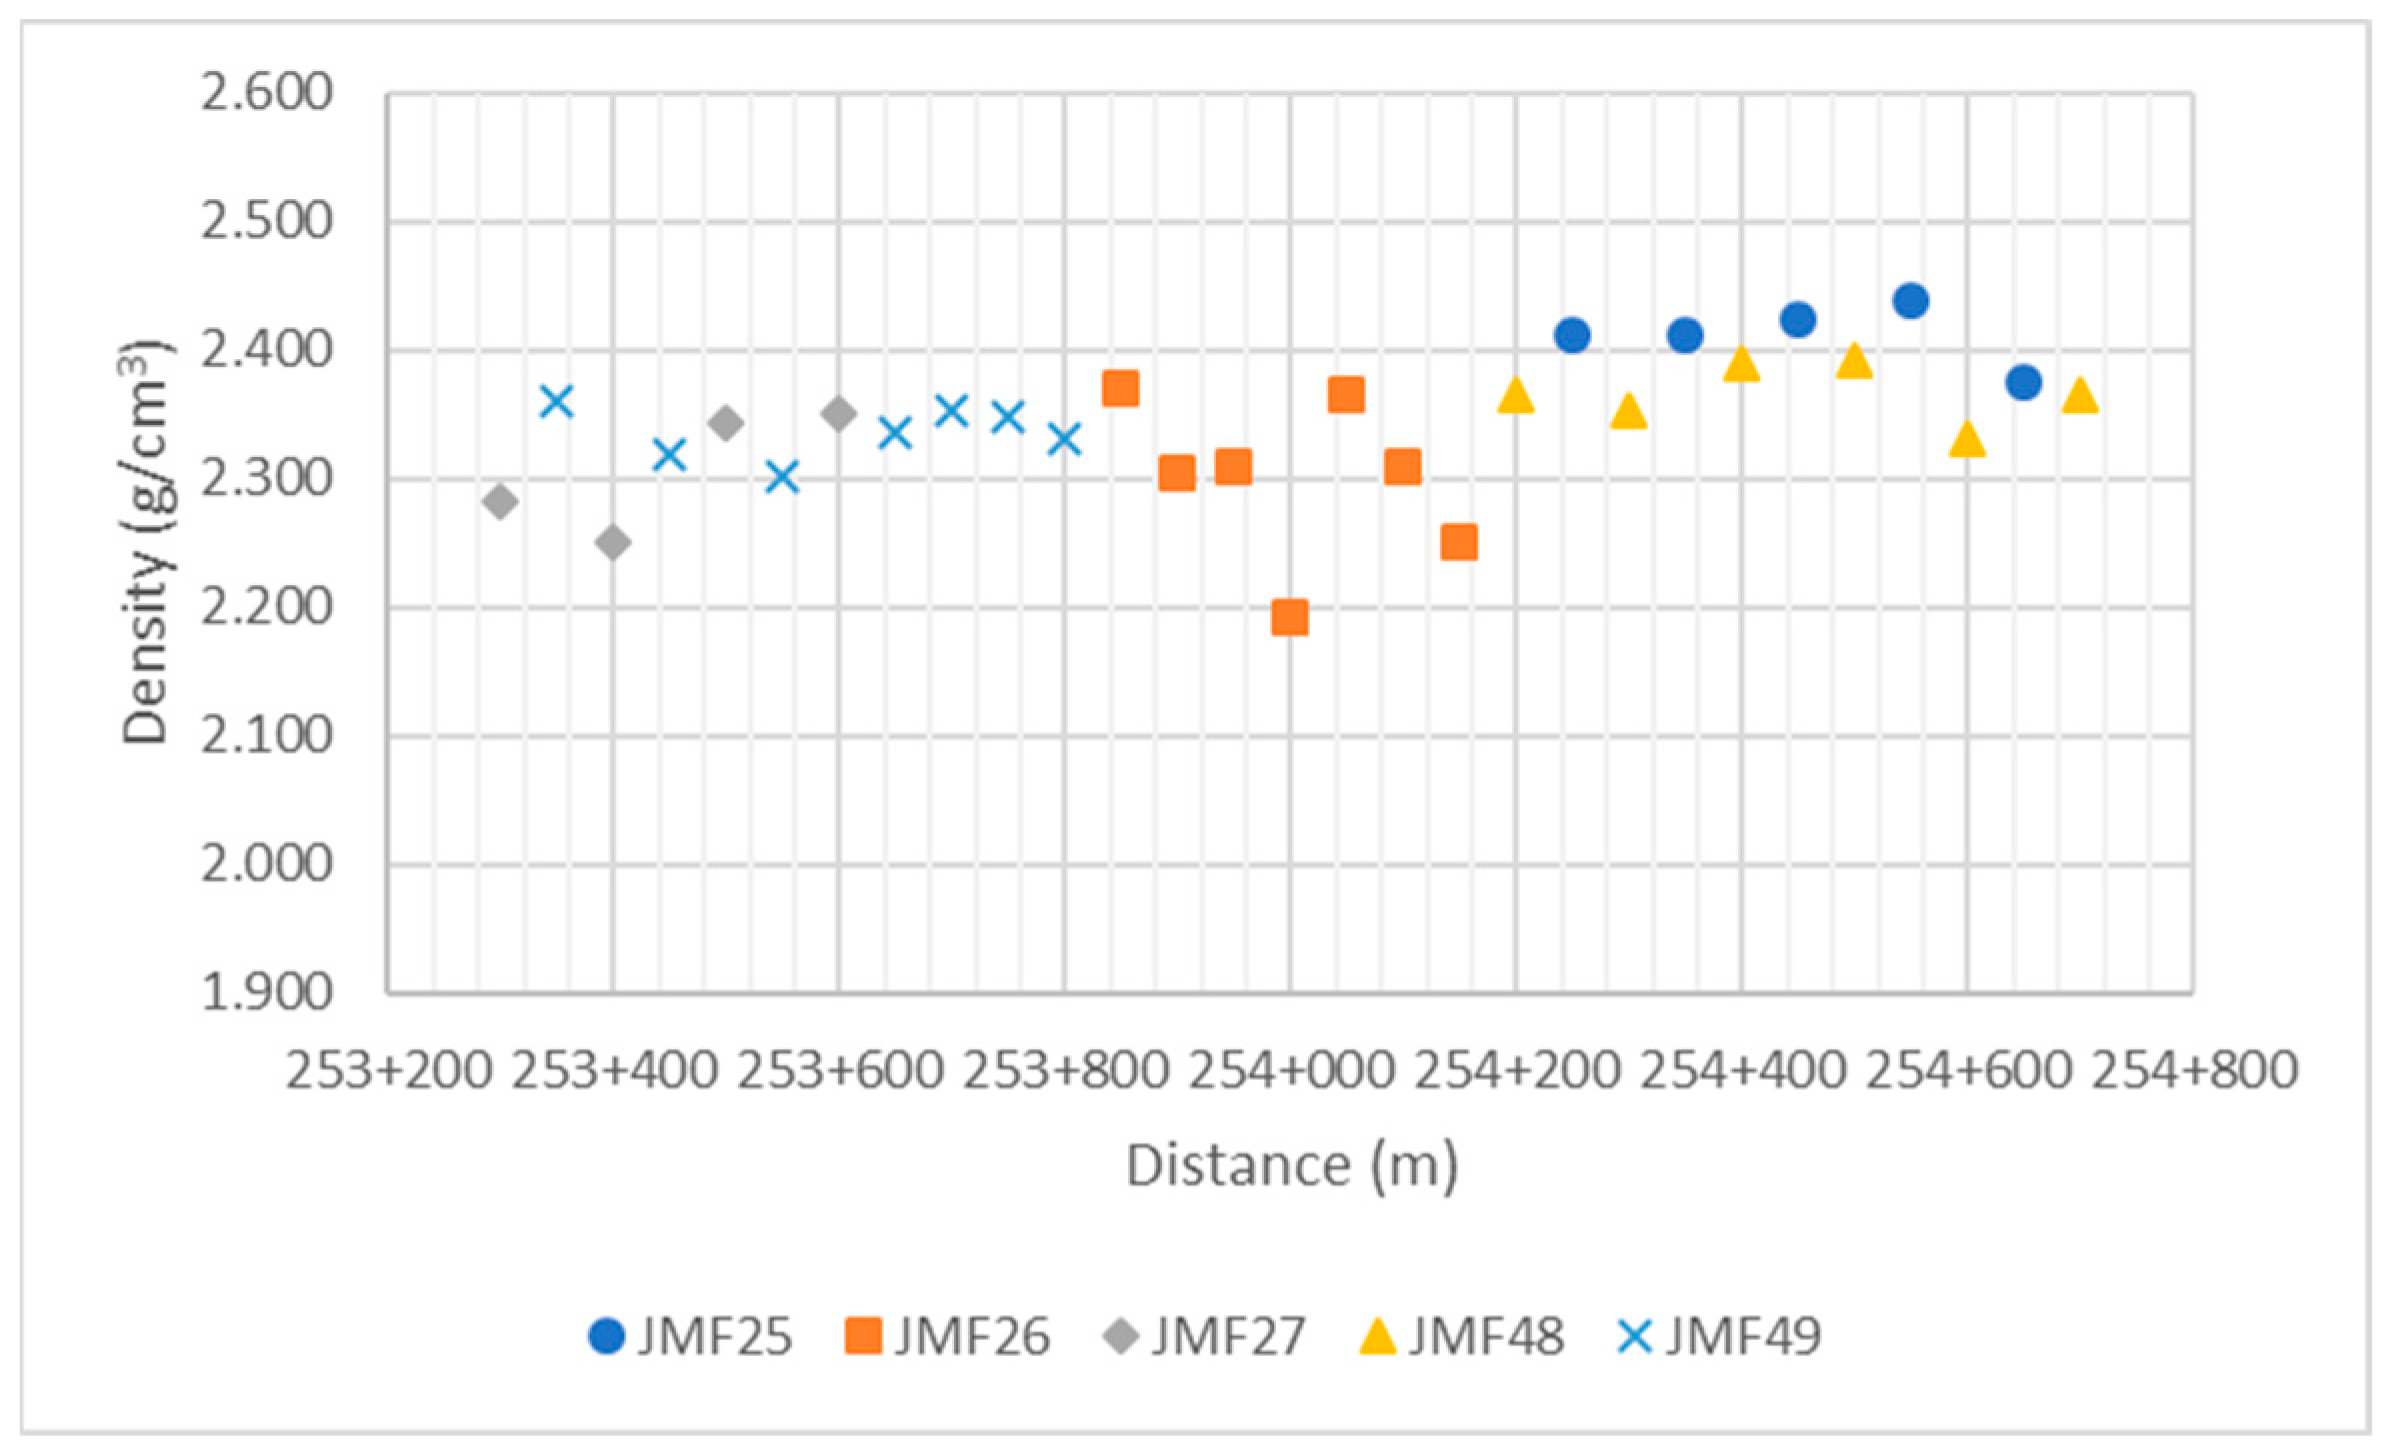
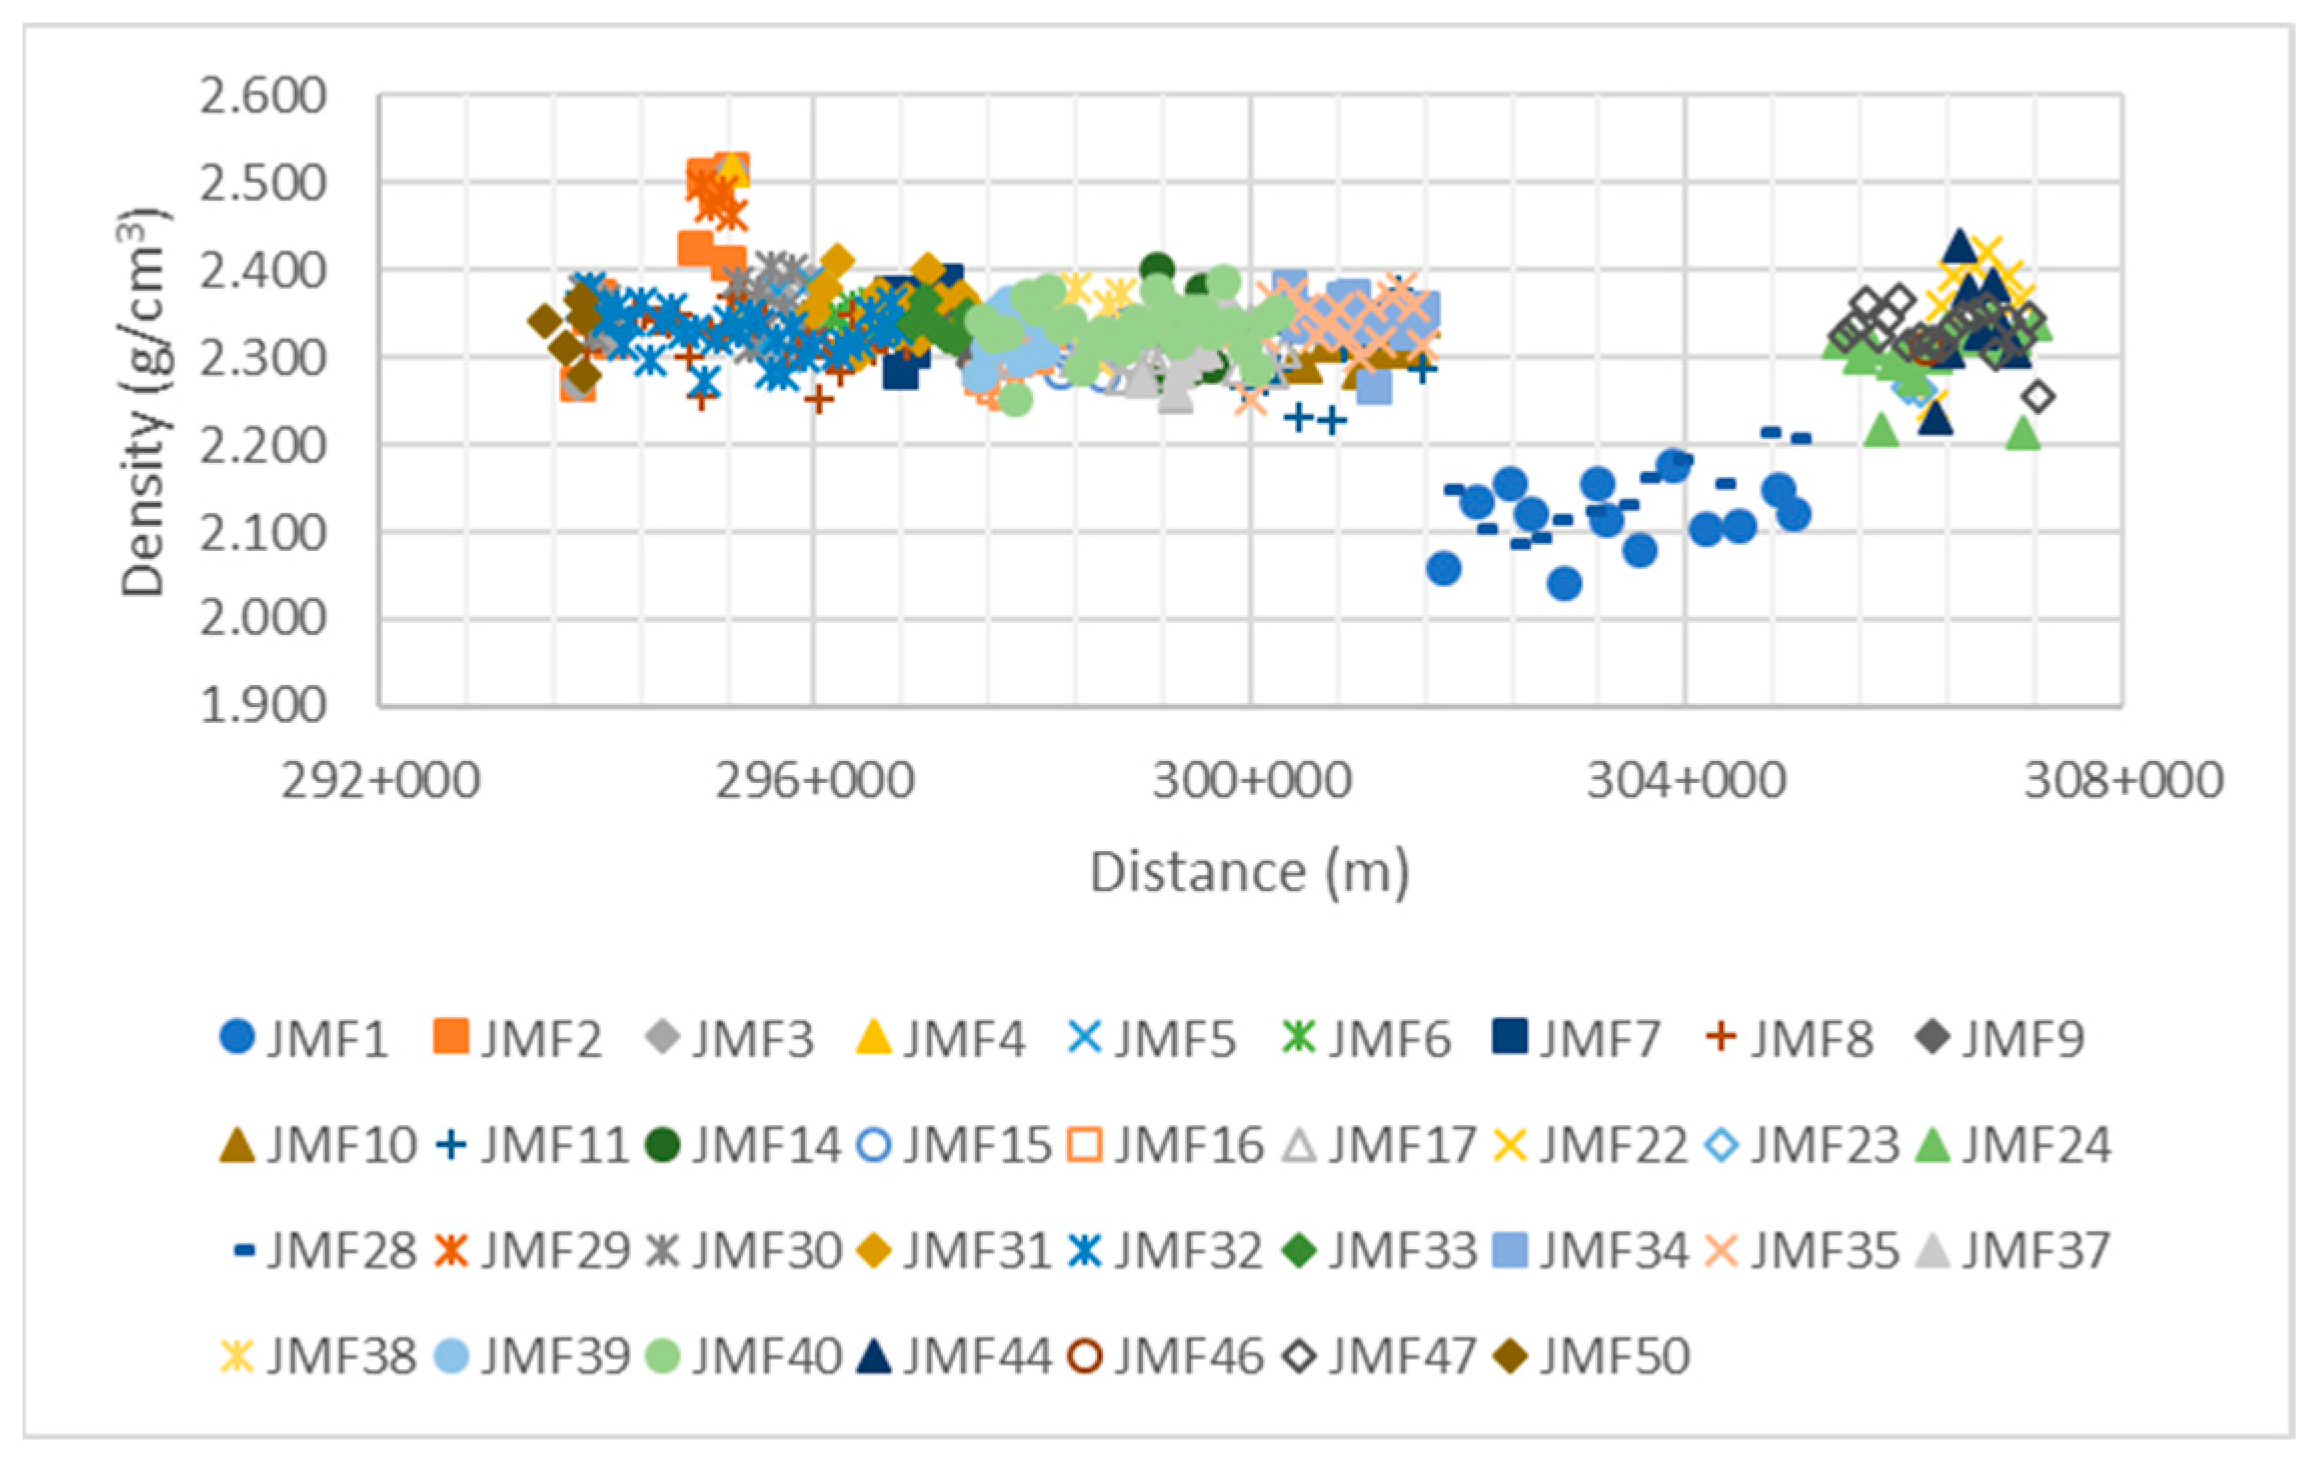
In addition, because the study was carried out in segments of construction work by segments, it was decided to carry out the analysis of the data on the densities of the asphalt mixture by segments, due to the discontinuity of the sections covered, all the works in Body A of the road. It should be mentioned that quality control analyses of the design of the asphalt mixture were carried out every day of production of the plant; in this way, we have 50 job mix formulae (JMFs), i.e., 50 asphalt mix designs, and each one has raw density data of the mixture (Gmb) and maximum theoretical density of the asphalt mixture (Gmm, total mass of the mixture excluding the volume of water-permeable pores). It should be mentioned that more than 50 JMFs were obtained for the preparation of asphalt mixtures, because the conditions of the stone aggregates (granulometry, mainly) and the asphalt to be used changed; although the material bank or asphalt supplier was not changed, production conditions in the plant can change from one day to another, so these characteristics were obtained within the internal quality control process.
It is very important to mention that core extractions were carried out (at least 3 extractions per day for statistical averages) for each day of construction work. The extracted cores were taken to the laboratory to obtain the density parameters of the HMA in order to calibrate and more adequately correlate the results of the EM density gauge.
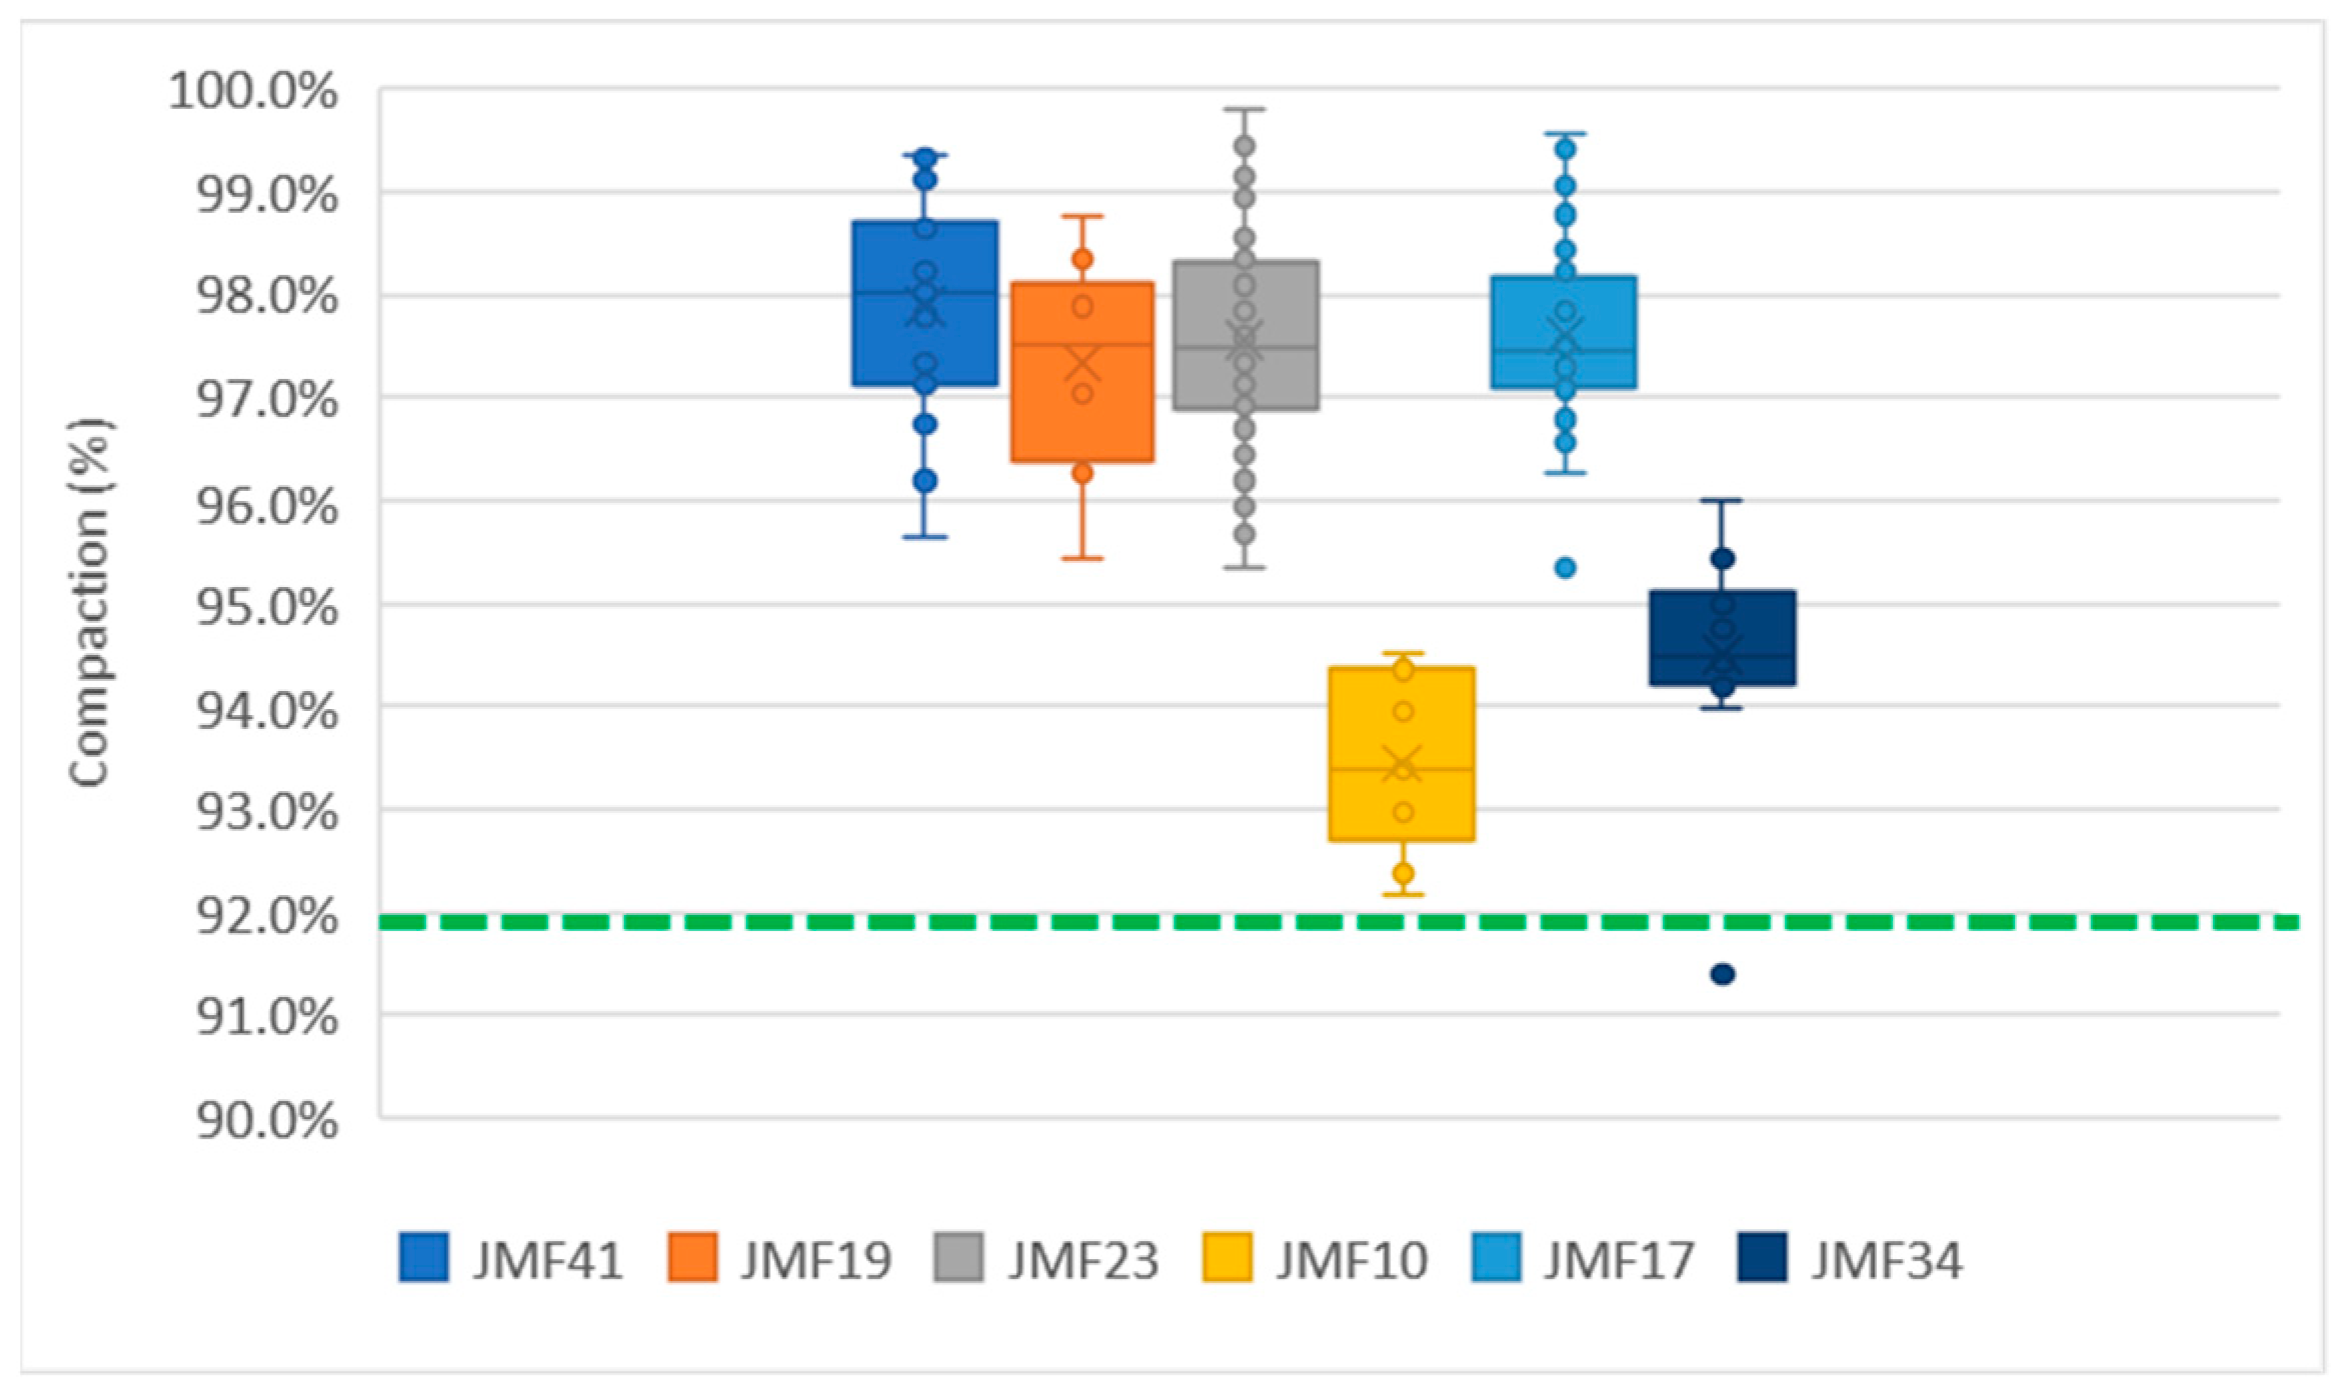
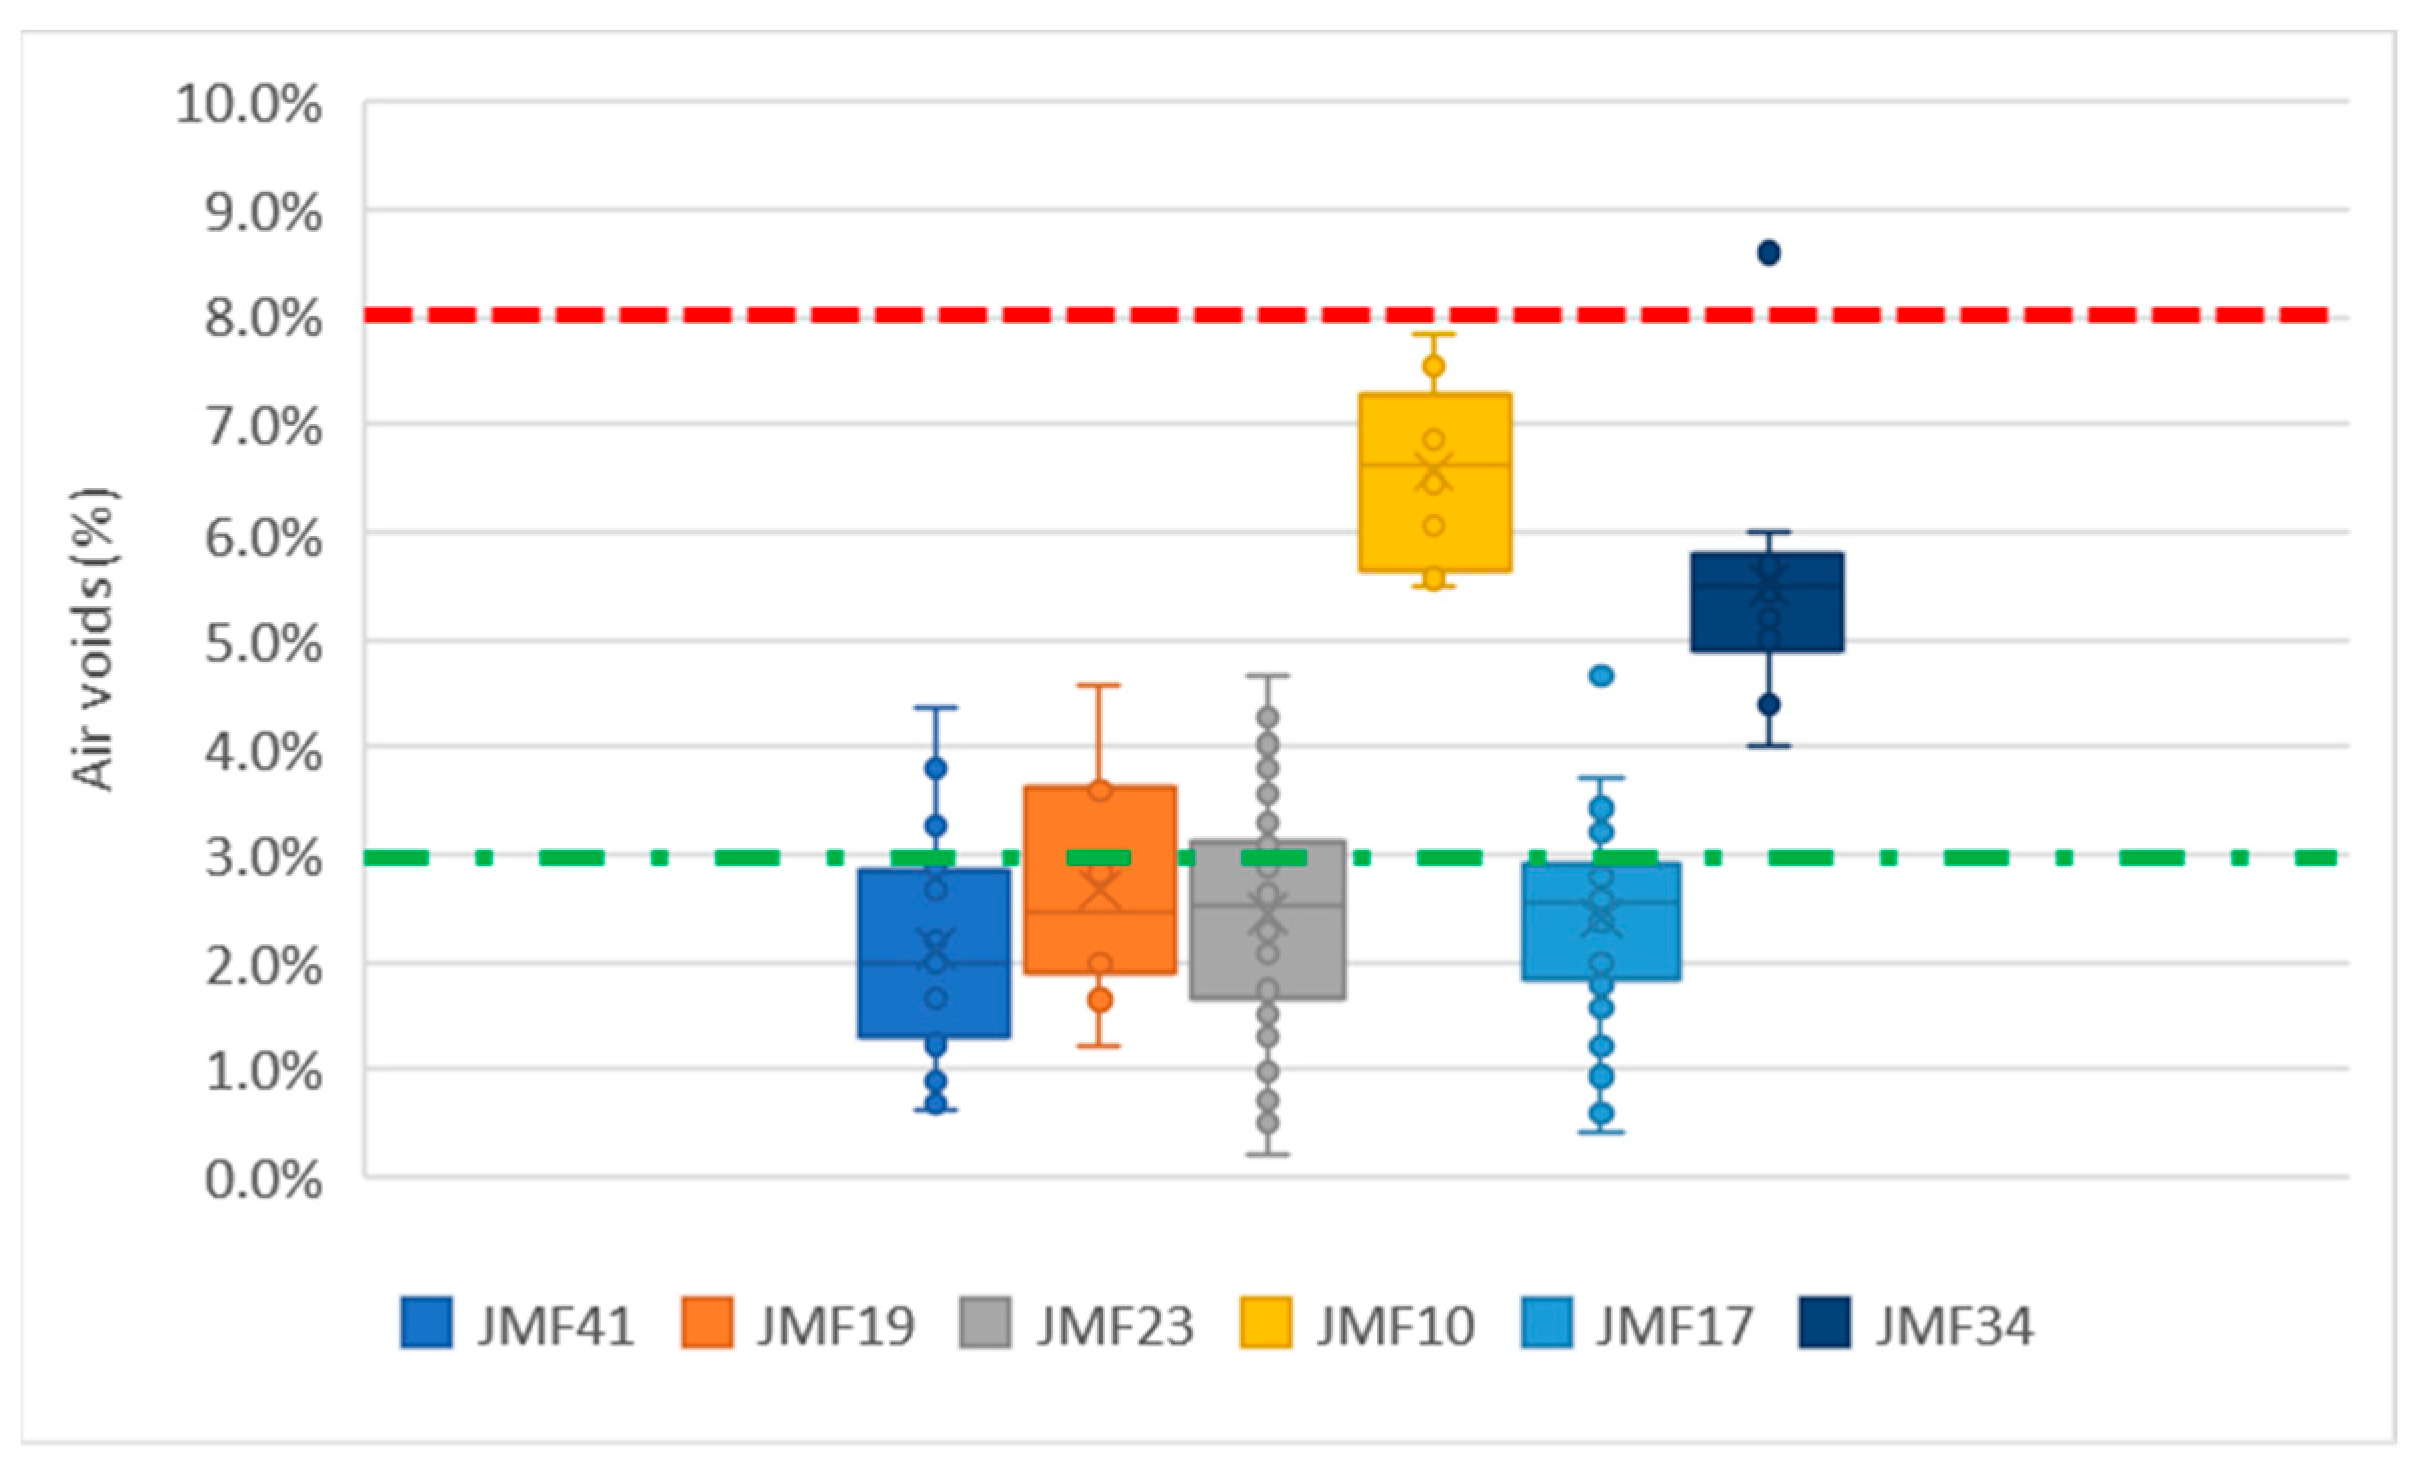
Once obtained the density readings of the asphalt mixture in field to perform the compaction calculation of it, which is indirectly associated with the maximum theoretical gravity of the mixture (Gmm), because this parameter is taken as design data in the laboratory of the mixture, and, by making a direct relationship of the field specific gravity divided with Gmm, it is possible to find the percentage of compaction, and the difference from 100% is the air void content is shown in Equations (3) and (4):
%C = (Gmbin situ/Gmmdesign) × 100
%AV = ((Gmm − Gmb)/Gmm) × 100
As shown in Equations (3) and (4), the calculation of the percentage of compaction of the asphalt mixture is relevant, since this data allows us to know the content of air voids within the asphalt mixture. The content of air voids is associated with the durability of the asphalt mixture and the correct performance of it, and most references consider that this value of air voids should be 3–8% [1,2,3,4,5].

3. Results and Discussion

3.1. Overall Results of the HMA Evaluation

In order to obtain data on the compaction percentages of the asphalt mixture and the content of air voids within the mixture, once field readings have been made with the EM density gauge, laboratory design and core extraction reference data are required (in order to calibrate the device), such as the bulk specific density of asphalt mixture (Gmbdesign) and the maximum theoretical specific gravity of asphalt mixture (Gmmdesign), with which it is calibrated and compared to obtain the degree of compaction and the content of air voids.
Due to the fact that 50 HMA job mix formulae (JMFs) were carried out, of which they were due to the change in the conditions of the materials for carrying out the paving execution, in which the granulometry mainly changed by the availability of the stone aggregate and the attack front at the extraction bank, their physical properties were analyzed, and 50 different Gmm values were obtained. There was a total of 586 readings of density, compaction, and air voids, implying wide dispersion of the results.
Due to the complexity of data interpretation, it was decided to analyze the data by segment and by job mix formulae (designs) of asphalt mixtures, which will be shown in the following illustrations.
It should be mentioned that the climatic conditions under which the data were obtained were in the month of November, for which the average temperature is 15.4 °C, and that the readings were made without the presence of rain, so that dielectric constant adjustment was not necessary.
Segment 1 of the data consists of 11 JMFs for asphalt mixing, covering the distance from 234 + 500 to 238 + 700. The maximum temperature was 27 °C and the minimum temperature was 15 °C. In this segment, 161 readings were taken with the EM density gauge. Given that the core data is the average value of JMFs, the density of Segment 1 shows an increasing trend of 0.01 g/cm3/km with the mileage. The data are shown below (Figure 6):
Next, Segment 2 includes 33 readings with the EM density gauge readings of five JMFs, located between distances 253 + 300 and 254 + 400. For this section, the weather there was a maximum temperature of 27 °C and the minimum temperature was 15 °C.
This is the smallest interval, and representative graphs of the density data are presented below (Figure 7).
Subsequently, in Segment 3, the set of data analyzed consists of 34 JMFs of asphalt mixture with different densities, located between the distances 293 + 500 and 307 + 200. In this part, 392 density readings were taken with the EM density gauge. The density data are shown in the following graph (Figure 8). The temperature conditions for taking this data were a maximum temperature of 27 °C, while the minimum was 17 °C.

3.2. Determination of the Representative Sample

In the research proposed by White (2019), the regional average method of 5 points was used with the electromagnetic densimeter to evaluate the repeatability and consistency of asphalt mixture density measurements in pavements. The results showed a high consistency, since the standard deviation was less than 0.25%. Subsequently, 14 cores were extracted, whose densities were evaluated and compared with the single reading method (one reading per point). The single-reading method showed a better statistical distribution than the five-reading method in the pavement points analyzed. This suggests that the variation in asphalt mixture density within the area analyzed significantly exceeded the repeatability threshold set out in the protocol [38]. Equation (5) was used to obtain a representative sample:
s = N   N 1 K 2 + 1
where the small sample size (s) of the total data population (N), and the margin of error (K), which are usually 5% to 10%, indicate that the results obtained from the sample will have an accuracy of 5% or 10%, respectively. For this analysis case, the result of 5% was 237 data (40.6%), and for 10%, it was 86 data (14.6%); after this, a geometric average was made and this was 162 data (27.6%), so that the sample population of data to be analyzed was close to 162.
For the case study of this research, it was possible to take a representative sample of 24.9% of the total readings, which was obtained by the intentional stratified statistical sampling method, of which the density standard deviation presented by the data families was set as the central value. AASHTO T343 states that the permissible standard deviation for asphalt mixtures should be 0.050 g/cm3. Data families were selected to meet this by reducing the population to six working formulae of asphalt mixtures (JMF).
In order to analyze the 586 readings, it was considered that the mixtures had to meet a minimum of 10 reading data at different points and the standard deviation of the field density data had to be less than 0.050 g/cm3 (less than 1.2% in percentage data, such as percentage of compaction and air voids).
This process is carried out according to the test method for HMA density in the field using electronic contact devices by the AASHTO and that adaptation is being sought by the Mexican Institute of Transport (IMT) to replicate this function Mexico, which they use as a standardization parameter through a correlation factor of the device readings that must have at least 5 test specimens and that the standard deviation of the readings is less than or equal to 0.050 g/cm3 for the equipment to be accepted with readings homogeneous, consistent, and does not require an adjustment factor [25].
Therefore, 6 job mix formulae were chosen, which met the conditions of population consistency—JMF41 (21 data), JMF19 (10 data), JMF23 (60 data), JMF10 (13 data), JMF17 (28 data), and JMF34 (14 data)—giving a total of 146 data in 6 JMF.
Figure 9 shows the density data of asphalt mixtures by JMF, showing only those that met the parameters of statistical repeatability described in the previous paragraph.
The observed data of the standard deviation (σ) of the job mix formulae that indicate repeatability are JMF41 σ = 0.025, JMF19 σ = 0.025, JMF23 σ = 0.025, JMF10 σ = 0.021, JMF17 σ = 0.024, and JMF34 σ = 0.027.

3.3. Statistical Analysis for Method Validation

After obtaining the density data of the 6 JMFs that meet the established criteria for the analysis of consistent data, the degree of compaction is calculated as shown in Equation (3), which are expected to be greater than 92%, because this value is closely linked to the percentage of air voids within the HMA. Most of the compaction percentage data is between 96% and 98% (Figure 10).
After the calculation of the compaction of the JMF of the asphalt mixture, which had consistent results, the calculations of air void content were carried out, as shown in Equation (4) (Figure 11). For a high-performance and durable mixture, the acceptable air void content must be less than 8%; for this research, the acceptable air void content is 3–8%. It can be seen that the averages of work formulae with consistent data are not within the established limits, but in JMF41 and JMF19, only the JMF10 has no point within the pre-established limits, so it is possible to indicate that 5 of the 6 consistent JMFs will be durable and will not have problems with the levels of effort and environmental factors presented [1,2,3,4,5].
For the data obtained in the calculation of air void content, it is observed that compliance is within the acceptance limits (AV = 3–8%). The job mix formulae is as follows: JMF41 9 of 21 data (42.9%), JMF19 7 of 10 data (70.0%), JMF23 37 of 60 data (61.7%), JMF10 9 of 13 data (69.2%), JMF17 20 of 28 data (71.4%), and JMF34 13 of 14 data (92.9%).
In the specifications provided by the high-performance asphalt mixtures design method, it is mentioned that values of the required density are evaluated (degree of compaction with respect to Gmm). Table 5 shows the compaction parameters for roads with medium to high traffic (state and interstate roads) [4].
As shown in Table 5, the number of initial turns (Ninitial = 8), the number of design turns (Ndesign = 100), and the number of maximum turns (Nmax = 160) have to be referenced for the application cycle of the rotary compactor load, which are referenced for the transit type for the design lane [4].
On the other hand, the ratio has an increase of 1% in the degree of compaction, while the content of air voids is decreased by 0.5%.
The t-Student test is performed for the datasets of the population sample in order to assess whether the population average. The t-Student method is used to examine the differences between two small independent samples having normal distribution and homogeneity in variances, so that the data in the analysis is able to perform this method of statistical testing between the sample of the density readings of the HMAs performed with the EM densimeter and the range containing 95% of its population (Figure 12).
In the test performed on the sets JMF41 (Figure 12a), JMF19 (Figure 12b), JMF23 (Figure 12c), JMF10 (Figure 12d), JMF17 (Figure 12e), and JMF34 (Figure 12f), it is seen that the p-value results are extremely small (p < 0.05), which indicates that the evidence against the hypothesis is practically nil. An important detail is that the data are very large, so the results are far from the hypothetical average. Table 6 below shows the summary of the t-Student assessment for the sets.
The p-value analysis is statistically useful to know the hypothesis, and a value of p < 0.05 indicates that the null hypothesis is false, i.e., that the expected values are not within the confidence interval of the parameters established within the acceptance range.
According to the results of the p-value in Table 6, it is feasible to mention that the statistical probability that the values are outside the statistical range of the hypothesis, demonstrating consistency of the JMF.

4. Conclusions

The data obtained from the EM density gauge demonstrated consistent homogeneity across all six job mix formulae (JMF41, JMF19, JMF23, JMF10, JMF17, and JMF34), with all readings falling within the acceptable range of air void content (3–8%). This uniformity indicates satisfactory compaction and adherence to quality standards. Given that each 1% increase in air voids may reduce the fatigue life of hot mix asphalt (HMA) by up to 35%, maintaining this range is critical for pavement durability and performance. The t-Student statistical analysis confirmed the rejection of the null hypothesis for all JMFs at a 95% confidence level (p < 0.05), affirming that the observed differences are statistically significant and unlikely to occur by chance. These results validate the consistency and reliability of the EM gauge as a measurement tool.
The percentage of air voids remains a key parameter in mechanistic–empirical pavement design frameworks, where physical characteristics of the HMA are closely linked to mechanical stress responses. As such, rigorous quality control over compaction levels is essential to ensure structural integrity and long-term performance. This study confirms that the EM density gauge serves as a reliable and effective non-destructive alternative to traditional coring, significantly enhancing statistical quality control without compromising pavement integrity. Nevertheless, a minimum of three cores per section is recommended to establish laboratory benchmarks (mean and standard deviation) for density and air voids, which can be used to calibrate and validate field readings.
The comparative analysis revealed a measurement error of approximately 1.8% between the EM gauge and core sampling, with the correlation coefficient lying within the 95% confidence interval, further supporting the precision of the proposed method. In light of these findings, the Mexican Institute of Transport is encouraged to propose the formal adoption of the EM density gauge within national standards and manuals for non-destructive pavement testing under the jurisdiction of the SICT in Mexico.
Future research should consider the influence of environmental variables such as ambient temperature and humidity during the construction process and investigate their relationship with real-time EM density readings. Additionally, establishing correlations between EM measurements and the mechanical performance of HMA under actual traffic loading conditions represents a promising area for continued investigation.

Author Contributions

Conceptualization, M.A.V.-G., H.L.C.-G., E.M.A.-G., W.M.-M., H.D.-A., J.F.M.-S. and M.A.N.-S.; methodology, M.A.V.-G., H.L.C.-G. and M.A.N.-S.; software, M.A.N.-S.; validation, M.A.V.-G., H.L.C.-G. and M.A.N.-S.; formal analysis, M.A.V.-G., H.L.C.-G., E.M.A.-G., W.M.-M., H.D.-A., J.F.M.-S., M.A.N.-S. and M.A.-S.; investigation, M.A.V.-G., H.L.C.-G., E.M.A.-G., W.M.-M., H.D.-A. and J.F.M.-S.; resources, M.A.V.-G., H.L.C.-G., E.M.A.-G., W.M.-M., H.D.-A., J.F.M.-S., M.A.N.-S. and M.A.-S.; data curation, M.A.V.-G. and M.A.N.-S.; writing—original draft preparation, M.A.V.-G., H.L.C.-G., E.M.A.-G., W.M.-M. and H.D.-A.; writing—review and editing, M.A.V.-G., H.L.C.-G., E.M.A.-G., W.M.-M., H.D.-A., J.F.M.-S., M.A.N.-S. and M.A.-S.; visualization, M.A.V.-G., E.M.A.-G., W.M.-M., H.D.-A. and J.F.M.-S.; supervision, H.L.C.-G., E.M.A.-G., W.M.-M. and H.D.-A.; project administration, H.D.-A. and J.F.M.-S. All authors have read and agreed to the published version of the manuscript.

Funding

This research received no external funding.

Institutional Review Board Statement

Not applicable.

Informed Consent Statement

Not applicable.

Data Availability Statement

The original contributions presented in this study are included in the article. Further inquiries can be directed to the corresponding author.

Acknowledgments

Special thanks to the Mexican Institute of Transportation, the Universidad Michoacana de San Nicolás de Hidalgo, and the Secretariat of Science, Humanities, Technology, and Innovation (SECIHTI) for developing this research, which serves as a preamble to innovation in non-destructive methods of quality control in the field.

Conflicts of Interest

The authors declare no conflict of interest.

Abbreviations

The following abbreviations are used in this manuscript:
HMAHot Mix Asphalt
ESALsEquivalent Single-axle Loads
AVAir Voids
EMElectromagnetic
ADATAnnual Daily Average Traffic
JMFJob Mix Formula

References

  1. Strategic Highway Research Program. Superior Performing Asphalt Pavements (Superpave): The Product of the SHRP Asphalt Research Program; National Research Council: Washington, DC, USA, 1994. [Google Scholar]
  2. Asphalt Institute. Background of SUPERPAVE Asphalt Mixture Design and Analysis; Asphalt Institute: Lexinaton, KY, USA, 1995. [Google Scholar]
  3. AASHTO M323; Standard Specification for Superpave Volumetric Mix Design. Standard by American Association of State and Highway Transportation Officials: Washington, DC, USA, 2017.
  4. AMAAC. Diseño de Mezclas Asfálticas de Granulometría densa de alto Desempeño; Asociación Mexicana del Asfalto, A.C.: Tlalpan, Mexico, 2013; Volume 3. [Google Scholar]
  5. Delgado Alamilla, H. Diseño de Mezclas Asfálticas Densas en Caliente en Función del Nivel de Tránsito; IMT: Sanfandilla, Querétaro, México, 2020; Available online: https://imt.mx/archivos/Publicaciones/PublicacionTecnica/pt602.pdf (accessed on 20 June 2025).
  6. Praticò, F.G.; Moro, A. Measurement of air void content in hot mix asphalts: Method and core diameter dependence. Constr. Build. Mater. 2012, 26, 344–349. [Google Scholar] [CrossRef]
  7. Wang, S.; Sui, X.; Leng, Z.; Jiang, J.; Lu, G. Asphalt pavement density measurement using non-destructive testing methods: Current practices, challenges, and future vision. Constr. Build. Mater. 2022, 344, 128154. [Google Scholar] [CrossRef]
  8. Robert, F.L.; Khandal, P.S.; Brown, E.R.; Dah-Yinn, L.; Kennedy, T.W. Hot Mix Asphalt Materials, Mixture design and Construction; National Asphalt Pavement Association Research and Education Foundation: Lanham, MA, USA, 1996. [Google Scholar]
  9. Dai, W.; Qian, G.; Zhu, X.; Yu, H.; Shi, C.; Zhang, C.; Ge, J.; Xie, T. Research on Void Characteristics During Compaction of Asphalt Mixtures. 2024. Available online: https://ssrn.com/abstract=4625235 (accessed on 20 June 2025). [CrossRef]
  10. Roy, N.; Veeraragavan, A.; Krishnan, J.M. Influence of Air Voids of Hot Mix Asphalt on Rutting within the Framework of Mechanistic-empirical Pavement Design. Procedia-Soc. Behav. Sci. 2013, 104, 99–108. [Google Scholar] [CrossRef]
  11. Praticò, F.G.; Moro, A. In-lab and on-site measurements of hot mix asphalt density: Convergence and divergence hypotheses. Constr. Build. Mater. 2011, 25, 1065–1071. [Google Scholar] [CrossRef]
  12. Russo, F.; Biancardo, S.A.; Formisano, A.; Dell’Acqua, G. Predicting percent air voids content in compacted bituminous hot mixture specimens by varying the energy laboratory compaction and the bulk density assessment method. Constr. Build. Mater. 2018, 164, 508–524. [Google Scholar] [CrossRef]
  13. Tedla, T.A.; Singh, D.; Showkat, B. Effects of air voids on comprehensive laboratory performance of cold mix containing recycled asphalt pavement. Constr. Build. Mater. 2023, 368, 130416. [Google Scholar] [CrossRef]
  14. Castillo, D.; Caro, S. Probabilistic modeling of air void variability of asphalt mixtures in flexible pavements. Constr. Build. Mater. 2014, 61, 138–146. [Google Scholar] [CrossRef]
  15. Zhao, S.; Al-Qadi, I.L. Development of regularization methods on simulated ground-penetrating radar signals to predict thin asphalt overlay thickness. Signal Process. 2017, 132, 261–271. [Google Scholar] [CrossRef]
  16. Zhao, S.; Shangguan, P.; Al-Qadi, I.L. Application of regularized deconvolution technique for predicting pavement thin layer thicknesses from ground penetrating radar data. NDT Int. 2015, 73, 1–7. [Google Scholar] [CrossRef]
  17. Lahouar, S.; Al-Qadi, I.L.; Loulizi, A.; Clark, T.M.; Lee, D.T. Approach to Determining In Situ Dielectric Constant of Pavements: Development and Implementation at Interstate 81 in Virginia. Transp. Res. Rec. J. Transp. Res. Board 2002, 1806, 81–87. [Google Scholar] [CrossRef]
  18. Leng, Z.; Zhang, Z.; Zhang, Y.; Wang, Y.; Yu, H.; Ling, T. Laboratory evaluation of electromagnetic density gauges for hot-mix asphalt mixture density measurement. Constr. Build. Mater. 2018, 158, 1055–1064. [Google Scholar] [CrossRef]
  19. Cui, L.; Ling, T.; Zhang, Z.; Xin, J.; Li, R. Development of asphalt mixture density estimation model applicable to wide air void content range using ground penetrating radar. Constr. Build. Mater. 2021, 293, 123521. [Google Scholar] [CrossRef]
  20. Romero, P.; Kuhnow, F. Evaluation of New Nonnuclear Pavement Density Gauges with Data from Field Projects. Transp. Res. Rec. J. Transp. Res. Board 2002, 1813, 47–54. [Google Scholar] [CrossRef]
  21. Mata, D.; Hanifa, K.I. Evaluation of Non-Destructive Density Determination for QA/QC Acceptance Testing: Research Project Capsule (No. 17-2B); Louisiana Transportation Research Center: Baton Rough, LA, USA, 2017. [Google Scholar]
  22. Xiong, X.; Xiao, S.; Tan, Y.; Zhang, X.; Zhang, D.; Han, M.; Wang, W. Estimation of density and moisture content in asphalt mixture based on dielectric property. Constr. Build. Mater. 2021, 298, 123518. [Google Scholar] [CrossRef]
  23. Plati, C.; Loizos, A.; Gkyrtis, K. Integration of non-destructive testing methods to assess asphalt pavement thickness. NDT E Int. 2020, 115, 102292. [Google Scholar] [CrossRef]
  24. Sun, J.; Oh, E.; Chai, G.; Ma, Z.; Ong, D.E.; Bell, P. A systematic review of structural design methods and nondestructive tests for airport pavements. Constr. Build. Mater. 2024, 411, 134543. [Google Scholar] [CrossRef]
  25. AASHTO T343-12; Standard Method of Test for Density of In-Place Hot Mix Asphalt (HMA) Pavement by Electronic Surface Contact. Standard by American Association of State and Highway Transportation Officials: Washington, DC, USA, 2020.
  26. Araujo, S.; Beaucamp, B.; Delbreilh, L.; Dargent, É.; Fauchard, C. Compactness/density assessment of newly-paved highway containing recycled asphalt pavement by means of non-nuclear method. Constr. Build. Mater. 2017, 154, 1151–1163. [Google Scholar] [CrossRef]
  27. Pellinen, T.; Huuskonen-Snicker, E.; Eskelinen, P.; Martinez, P.O. Representative volume element of asphalt pavement for electromagnetic measurements. J. Traffic Transp. Eng. (Engl. Ed.) 2015, 2, 30–39. [Google Scholar] [CrossRef]
  28. Fauchard, C.; Li, B.; Laguerre, L.; Héritier, B.; Benjelloun, N.; Kadi, M. Determination of the compaction of hot mix asphalt using high-frequency electromagnetic methods. NDT Int. 2013, 60, 40–51. [Google Scholar] [CrossRef]
  29. Al-Qadi, I.L.; Lahouar, S.; Loulizi, A. In situ measurements of hot-mix asphalt dielectric properties. NDT Int. 2001, 34, 427–434. [Google Scholar] [CrossRef]
  30. Fan, B.; Bosc, F.; Liu, Y.; Fauchard, C. Dielectric measurement by open-ended coaxial line for hot-mix asphalt roads: From laboratory test to on-site investigation. NDT Int. 2023, 138, 102872. [Google Scholar] [CrossRef]
  31. Smith, B.C.; Diefenderfer, B.K. Comparison of Nuclear and Nonnuclear Pavement Density Testing Devices. Transp. Res. Rec. J. Transp. Res. Board 2008, 2081, 121–129. [Google Scholar] [CrossRef]
  32. Sui, X.; Wang, S.; Leng, Z.; Gong, M. In-situ density measurement using GPR considering random pore distribution of asphalt pavement. Measurement 2024, 243, 116479. [Google Scholar] [CrossRef]
  33. Leng, Z.; Al-Qadi, I.L.; Lahouar, S. Development and validation for in situ asphalt mixture density prediction models. NDT Int. 2011, 44, 369–375. [Google Scholar] [CrossRef]
  34. TransTech Systems, Inc. Pavement Quality Indicator; In PQI 380 Operator’s Handbook. Available online: http://www.transtechsys.com/pdf/PQI380Manual.pdf (accessed on 20 June 2025).
  35. TransTech Systems, Inc. Effect of Water and Temperature on Hot Mix Asphalt Density Measurement Using Electromagnetic Sensing; TransTech Systems, Inc.: Schenectady, NY, USA, 2003; Available online: https://transtechsys.com/pdf/techBriefWaterTemp.pdf (accessed on 20 June 2025).
  36. Secretaría de Infraestructura, Comunicaciones y Transporte. Datos Viales; Secretaría de Infraestructura, Comunicaciones y Transporte: Mexico City, Mexico, 2024; Available online: https://www.sct.gob.mx/carreteras/direccion-general-de-servicios-tecnicos/datos-viales/ (accessed on 20 June 2025).
  37. Sistema Meteorológico Nacional. Información Estadística Climatológica; Sistema Meteorológico Nacional: Tacubaya, Mexican, 2024; Available online: https://smn.conagua.gob.mx/tools/RESOURCES/Normales_Climatologicas/Mensuales/mich/mes16234.txt (accessed on 26 June 2025).
  38. White, G. Evaluation of a non-nuclear density gauge as an alternate to destructive coring for airport asphalt acceptance testing. SN Appl. Sci. 2019, 1, 921. [Google Scholar] [CrossRef]
Figure 1. Design levels for high-performance dense-grade asphalt mixtures [4].
Applsci 15 07586 g001
Figure 2. Example of the operation by electrical impedance of electromagnetic density meters for the calculation of the HMA [34].
Applsci 15 07586 g002
Figure 3. Reading modes of density in asphalt mixtures with the EM density gauge: types of reading modes (a); average reading mode (b) [34].
Applsci 15 07586 g003
Figure 4. Calibration flow diagram of the electromagnetic density gauge.
Applsci 15 07586 g004
Figure 5. Example of density measurements of asphalt mixture using the EM density gauge.
Applsci 15 07586 g005
Figure 6. HMA density results of the 11 JMFs in Segment 1.
Applsci 15 07586 g006
Figure 7. HMA density results of the 5 JMFs in Segment 2.
Applsci 15 07586 g007
Figure 8. HMA density results of the 34 JMF in Segment 3.
Applsci 15 07586 g008
Figure 9. Field density results of HMA with the EM density gauge of the job mix formulae with statistical consistency separated by location distance: JMF41, JMF19, and JMF23 in Section 1 (a); JMF10, JMF17, and JMF34 in Section 3 (b).
Applsci 15 07586 g009
Figure 10. Results of compaction degree of HMA in the field with the EM density gauge of JMF with statistical repeatability.
Applsci 15 07586 g010
Figure 11. Results of HMA air void content in the field with the EM density gauge of JMF with statistical repeatability.
Applsci 15 07586 g011
Figure 12. Analysis of datasets by t-Student test: JMF41 (a); JMF19 (b); JMF23 (c); JMF10 (d); JMF17 (e); JMF34 (f).
Applsci 15 07586 g012
Table 1. Advantages and disadvantages of readings with the EM density gauge vs. GPR.
DeviceEM Density GaugeGPR
AdvantagesLightweight, easy to use, intuitive interface, repeat reading, temperature correction, low cost (USD 14,000), repeatabilityHigh performance (60 km/h), depth of reading of the entire structure of the pavement
DisadvantagesLow performance, discontinuous readings, reading depth less than 100 mmHigh cost (USD 60,000), uncertain calibration, driver inaccuracy, uncertainty for wave interpretation
Special requirementsCore calibrationSpecial computer for processing, specialized software
Table 2. Values of the materials involved in the asphalt mixing matrix for the calculation of the dielectric constant.
ValueAggregateWaterAsphaltAir
εrn478.5–482.81
vn86%2%9%3%
Table 3. Traffic conditions of the road section under analysis [37].
Side (Body)ADATVehicular Composition (%)
MABC2C3T3S2T3S3T3S2R4Others
A45061.059.47.89.82.413.51.73.90.5
B46180.959.27.69.62.713.71.54.30.5
Table 4. Climatic conditions of the study area [37].
VariableMonthly Average
010203040506070809101112YearAvg
T (°C)13.614.816.518.820.419.817.917.817.816.815.414.017.0
P (mm)9.410.85.09.442.0147.4208.0181.9137.546.08.88.1814.3
Table 5. Different degrees of compaction for the number of gyrations.
Different Gyration NumbersDegree of Compaction (%C) at
NinitialNdesignNmaxNinitialNdesignNmax
8100160≤8996≤98
Table 6. Summary of statistical analysis by t-Student for the JMF.
ValueJMF41JMF19JMF23JMF10JMF17JMF34
Deg. of freedom20959122713
t431.015292.064708.774405.723515.623330.592
p-value3.68 × 10−413.29 × 10−191.18 × 10−1173.38 × 10−261.87 × 10−556.70 × 10⁻²⁷
95% CI2.301–2.3232.282–2.3182.298–2.3112.303–2.3282.298–2.3162.326–2.357
Reject H0TrueTrueTrueTrueTrueTrue
Disclaimer/Publisher’s Note: The statements, opinions and data contained in all publications are solely those of the individual author(s) and contributor(s) and not of MDPI and/or the editor(s). MDPI and/or the editor(s) disclaim responsibility for any injury to people or property resulting from any ideas, methods, instructions or products referred to in the content.

