1. Introduction
The study of biomechanics has paved the way for human movement comprehension assessment and musculoskeletal health evaluation. To obtain more precise information regarding the human body’s behavior during static and dynamic activities, it is necessary to use technologies that measure physical parameters directly in the ambiance in which the activity occurs. In these contexts, sensors have been widely used, offering a quantitative analysis that supports decision-making in clinical, rehabilitation, and athletic performance enhancement [
1].
The sole of a foot is an intermediary surface between the ground and the human body [
2]. It is subjected to different pressure patterns, which are related to temporary or permanent tissue tensions [
3]. One method of assessing these stresses is to measure plantar pressure distribution [
4]. This is a necessary indicator in biomechanical analysis for assessing any dynamic or static activity, and it has become almost indispensable in studies of lower limb behavior. Although plantar pressure data is widely recognized for evaluating individuals with diabetes and peripheral neuropathy, these measurements can also be fundamental in assessing and managing disabilities related to neurological disorders [
5,
6,
7]. In addition, it is a determining factor in populations suffering from conditions such as diabetic foot, plantar fasciitis, bone deformities, and gait alterations [
8]. Apart from the aforementioned pathological conditions being influenced by the distribution of plantar pressure, it is reported in the published literature that this biomechanical parameter also plays a critical factor in assessing the postural condition of the human body [
9]. It is known that an inadequate posture can lead to unequal plantar pressure distribution, thus causing diverse direct musculoskeletal problems. This can be observed in both static and dynamic situations. Therefore, the growing interest and knowledge acquisitions in this area have paved the way for the most diverse diagnosis, physiotherapy, and rehabilitation [
5,
10,
11].
From a clinical perspective, analyzing plantar pressure during different postures and movements allows the detection of biomechanical compensations, which can result in injuries if not detected and corrected in time. Several studies have been published on this interesting topic. Two of these studies, carried out by our research group and already published, are highlighted here. The first examines the differences between the plantar pressure of acrobatic gymnasts when jumping two competition floors [
12] and the other assesses the plantar pressure in five different basketball movements [
13]. One main conclusion that can be drawn from both reported studies is that the asymmetry between the feet creates an increased propensity for injury. The acquired results can be used to develop several approaches and be helpful in the reduction of the occurrence of lesions. Integrating plantar pressure assessment in different postures has become essential to correctly analyzing the individual’s global biomechanics.
Several technologies have been developed to obtain plantar pressure data. These types of equipment can collect the desired data, which is then used for further analysis with proper software. The results are subsequently used to improve clinical assessment and research accuracy. The technologies created have been grouped mainly into two systems: insoles with integrated sensors [
14,
15] and pressure platforms [
16,
17,
18]. Rigid pressure platforms are commonly used to measure plantar pressures to assess foot function during standing and walking, particularly barefoot. They are considered the most accurate method for measuring plantar pressures. In-shoe systems are most suitable for measuring plantar pressures in the field during daily living or dynamic sporting movements as they are often wireless and can measure multiple steps. They are the most suitable equipment to assess the effects of footwear and orthotics on plantar pressures. However, they typically have lower spatial resolution and sampling frequency than platform systems [
19].
Most commercial smart insole solutions utilize pressure sensors, including resistive, capacitive, or piezoelectric sensors. In some cases, these sensors are complemented with IMU. Regarding the fields of application, there is a balanced distribution between clinical use (rehabilitation, diagnosis of pathologies), sports (performance optimization, injury prevention), and research (data collection for scientific studies). Equipment such as commercial insoles, like the Moticon’s OpenGo, utilize BLE to transmit data from 16 plantar sensors and an inertial unit, enabling them to operate for days on a single battery charge due to optimized protocols. This energy harvesting approach extends usability by eliminating the need for frequent loads. Thus, state-of-the-art electronics for smart insoles focus on maximizing the autonomy and reliability of the transmission without adding volume or weight that compromises use during intense physical activities.
Table 1 presents a summary of some equipment available on the market and their specifications.
Although these are distinct systems, the measurement devices share a similar underlying conceptual model that uses a sensor array to measure the pressure exerted in each sensor. These devices allow for the gathering of crucial, leading to a more accurate diagnosis, such as the pressure exerted by the foot (as a whole), the existence of areas that are the focus of superior tensions, the area of contact between the foot and the ground surface and, the center of pressure. Although the operating principle is based on the same fundamentals, there are some differences in the testing methods and data processing, partly due to the specifics of each software. Although several technologies are available for assessing plantar pressure, the effectiveness of each device in accurately capturing postural changes and their biomechanical implications still needs to be fully understood [
4].
In more recent years, there were some innovations, and with that, other solutions were presented, such as a speckle-patterned system for strain analysis, utilizing digital image correlation [
20]; and the insoles with piezoresistive sensors using carbon nanotube conductive films and ethylene vinyl acetate (EVA) foam [
21].
Regarding the smart insole prototypes with a wireless connection, the 3D-printed capacitive insole [
22] and the Polydimethylsiloxane (PDMS)-based capacitive sensor insole [
23] demonstrated a superior performance, making them highly effective for high-precision plantar pressure and gait monitoring applications. The 3D-printed capacitive insole accomplished high scores in sensitivity, stability, linearity, low hysteresis, and rapid and accurate response. These two prototypes provide robust solutions for accurate real-time plantar pressure monitoring.
In recent investigations of prototypes with AI but without wireless capability, the focus was on studying GRF. In one investigation, the ML technique Gaussian Process Regression was implemented in an insole with pressure sensors [
24]. The results were accurate and appropriate for clinical trials and daily life. Another study presented a prototype with 3D-printed porous piezoresistive sensors in a commercial insole and with the employment of Hammerstein–Wiener models [
25].
The various studies incorporating wireless transmission and AI technology revealed significant improvements to a range of fields of knowledge and applications. For instance, the study on low-cost smart insoles employing recurrent neural networks enhanced GRF and center of pressure (CoP) predictions by over 30% compared to traditional methods, promising cost-effective gait analysis in clinical and day-to-day life [
26]. The CapSoles system reached a 95% accuracy in user identification and 82% in distinguishing floor types using capacitive sensing [
27]. Another study involving a sensor insole designed for gait analysis achieved a remarkable 98.75% user recognition accuracy, underscoring its potential for sports and healthcare, where precision is critical [
28].
Recent technological developments of smart insoles have driven significant advances in gait analysis and monitoring of plantar pressure distribution. However, relevant limitations persist in terms of anatomical adaptability, intelligent interpretation in real time, and applicability in real contexts outside the laboratory environment.
The literature reports that most published research is based on limited scenarios and does not consider the range of postures or dynamic situations that can influence plantar pressure distribution. Ensuring the accuracy and consistency of these measurements is crucial, as it directly impacts the validity of the outcomes related to posture and diverse activities. Hurkmans et al. [
29] studied the Pedar
® mobile system, and despite the mentioned systems’ great repeatability, the authors emphasized the importance of correcting minor deviations individually for each insole.
Furthermore, and aligned with the previous study’s topic, Putti et al. [
30] studied 122 parameters of Pedar
® insoles, obtaining a repeatability coefficient of less than 10% in 114 of the parameters (93.4%). Quesada et al. [
31] compared the same system with F-Scan insoles (Tekscan
®) and concluded that Pedar
® insoles have better precision and repeatability than the F-Scan system. Despite that, Quesada et al. [
31] reported that the F-Scan system can benefit some clinical applications. Hughes et al. [
32] analyzed the reliability of measurements acquired by a force platform, stating that reliability varies from parameter to parameter. In the case of peak pressure, the authors obtained a reliability of 0.904 for an average of three attempts. Additionally, the increase in reliability values was emphasized as the number of tests increased, proposing a minimum of three attempts for comparison tests between different individuals. Hafer et al. [
33] analyzed the reliability of two platforms (Emed-x
® and Matscan
®), comparing intra-platform and inter-platform results. For Emed-x
®, a reliability of 0.9 was achieved for 51 of the 56 parameters studied. In the inter-platform tests, reliability was higher than or equal to 0.7 in almost all the analyzed parameters. This study also indicates that the data collected with different platforms is equivalent, sustaining the idea of Hughes et al. [
32] regarding guaranteeing good reliability values with a minimum of three tests. Chevalier et al. [
34] compared plantar pressure measurement with platforms (with and without shoes) and pressure insoles. The authors observed that in the tests using the insole devices and where the participants wore shoes, the results presented a lower average peak pressure than platform tests. They also concluded that these results could be attributed to the higher contact area created by the insole. Although many of the differences between the results can be attributed to intrinsic differences in conditions, Chevalier et al. [
34] determined that the systems affect the results of the measurements, highlighting that care should be taken when obtaining data with these systems and different conditions.
Several studies [
30,
35,
36,
37] have examined plantar pressure assessment, both qualitatively and quantitatively, using insole systems and pressure platforms. However, to the best of the authors’ knowledge, no studies have compared these methods in terms of the values obtained from volunteers.
To fill this gap, the current investigation aims to compare two different plantar pressure assessment devices experimentally: Pedar® insoles by Novel and Physiosensing® pressure platform by Sensing Future. This study aims to provide a scientific basis for selecting the device for collecting plantar pressure data.
It is hypothesized that the Pedar® insole system and the Physiosensing® pressure platform will present significantly different values in plantar pressure measurements, specifically in the parameters of maximum peak pressure (MPP) and contact area, due to the technical and structural characteristics of each device.
2. Materials and Methods
The data collection sample consists of 15 individuals aged between 19 and 24, averaging 21 ± 1.25 years. The group had a mean height of 1.69 ± 0.09 m (m) and a mean Body Mass Index (BMI) of 23.45 ± 4.48 kg/m2. The Ethics Committee of the Polytechnic University of Coimbra approved the study (104CEIPC/2021). All participants were duly informed of the intended objectives and methodology and voluntarily signed an informed consent form.
This study considers two devices, Novel’s Pedar® insoles and Sensing Future Technologies’ Physiosensing® platform.
A test protocol was established that outlined the steps to be taken before the acquisition, the volunteers’ posture, and the acquisitions’ duration and intervals. To ensure that all tests were conducted under the same conditions, each volunteer received instructions from the same researcher on the required posture: feet should be shoulder-width apart, torso should be upright, arms should be at the sides of the body, and gaze should be directed at a marked point located 2 m high and 3.5 m away from the volunteer.
Data collection involved at least five valid acquisitions, each lasting 30 s, with a 30 s interval between each acquisition. All tests were conducted in a laboratory room, with temperature and humidity controlled. The same researcher controlled the data acquisition in all tests.
Table 2 shows technical characteristics of Novel’s Pedar
® insoles and Sensing Future Technologies’ Physiosensing
® platform.
For data collection, both devices used the same acquisition frequency (100Hz). Each device has its software for data acquisition. Despite being different, each software also allows the monitorization of the evolution of plantar pressure through images. This study evaluated only two parameters: the contact area and the maximum peak pressure (MPP), considered enough for the study purposes.
The Pedar® software (novel gmbh, Munich, Germany) includes tools that enable detailed data analysis, allowing the user to study the values for each measurement instantly and automatically calculate the average and standard deviation of several parameters for each trial. Therefore, it is possible to access data relating to the left and right foot regarding the contact area, the maximum force, and the peak pressure.
Standardization is required since the contact area varies among devices and trials. Therefore, new variables were created to calculate the total contact area (AT) by using the areas of the left (AL) and right feet and (AR) as the contact areas of the left and right feet, respectively.
Pedar®’s software also allows visualization of the distribution of plantar pressure.
At least five valid trials were conducted for each volunteer, and the average total contact area and MPP values were calculated.
The Physiosensing
® software allows data collection regarding contact area, MPP, center of pressure coordinates, and average pressure value (MVP), among other parameters not considered in this study. Furthermore, the software presents a document summarizing the analyses conducted, encompassing qualitative (an image of the plantar pressure distribution) and quantitative (calculated parameters) aspects.
Figure 1 shows an extract from this document.
To align with the standardization process used in the Pedar® analysis and to achieve comparable values among both equipment types, the averages of the contact area and MPP of the five tests conducted on each volunteer were also calculated.
The same conditions among all trials were defined in the test protocol and communicated to volunteers. It establishes the steps taken before data acquisition, the volunteers’ posture, and the acquisitions’ duration and interval. A Bluetooth connection was used for the Pedar® and the cable connection for the Physiosensing® system to establish a connection between a computer and the device. For the Pedar® System, the right insole size for the volunteer is determined, followed by the calibration process, which uses a memory stick with calibration data for the insoles. Concerning the Physiosensing® platform, the device is placed on the floor, 3.5 m from a wall. The data acquisition process was the same with both equipment, feet shoulder-width apart, torso vertical, arms along the body, and gaze directed at a previously marked point: 2.0 m high and 3.5 m away from the volunteer. Five valid acquisitions with a 30 s duration and a 30 s interval between acquisitions were collected.
The values obtained in this study were evaluated to better understand the reliability between the two instruments (insoles and platforms). Later sections discuss these results in detail, where agreement on specific parameters is analyzed (MPP and contact area).
All data was analyzed using Statistical Package for Social Science (SPSS
®) software 25.0 (IBM
® Corporation, New York, NY, USA). Descriptive statistics were used to summarize the sample average achievements. The normality of the distribution of the parameters was tested with the Shapiro–Wilk test. Plantar pressure results were compared using Student’s t-test for paired samples. This analysis was complemented by evaluating the effect size using Cohen’s d and Hedges correction. The Intraclass Correlation Coefficient (ICC) was used to assess the level of agreement between the Pedar
® and Physiosensing
® instruments regarding the measured parameters. According to Portney and Watkins (2009) [
38], ICC values inferior to 0.5 (<0.5) indicate poor reliability and suggest the instruments have significant discrepancies. From 0.5 to 0.75 indicates moderate reliability: an acceptable but still limited agreement was reached. From 0.75 to 0.9 reflects good reliability and satisfactory agreement for most applications, and then, higher than 0.9 (>0.9) represents excellent reliability and a high consistency between instrument measurements
4. Discussion
4.1. MPP and Contact Area Values
The number of sensors in each device highly influences the reported divergence values concerning MPP. The Pedar
® system, with only 99 sensors, has a lower resolution and tends to focus on specific areas of high pressure. Therefore, each sensor covers a larger area, which can amplify the intensity of the pressure captured at the points of the most significant load [
40,
41]. This characteristic results in higher values of MPP since the Pedar
® system’s sensors capture the pressure concentration at specific sites without dispersing it as much as Physiosensing
®. Physiosensing
®, in turn, with 1600 sensors, captures the pressure in a more distributed and precise way, softening the pic values due to the existence of a higher-density mesh of sensors. Sensors covering a smaller area distribute the pressure, resulting in a lower average. Therefore, the significant difference observed can be attributed, in large part, to the way each device distributes pressure as a function of the number of sensors [
15]. According to Koch et al. [
42], when assessing plantar pressure using insoles, it is necessary to consider the fact that the center of pressure is not static, so the pressure distribution changes rapidly due to the smallest movements of the human body. Therefore, each of the 99 sensors that make up the insole must be able to recover between exposures. In fact, the Pedar
® system is normally used to read data when the patient is walking, or in any other type of more active movement. However, the tests were carried out with the volunteers in a resting position, which significantly reduces plantar pressure in some areas of the foot, which may explain the differences in MPP.
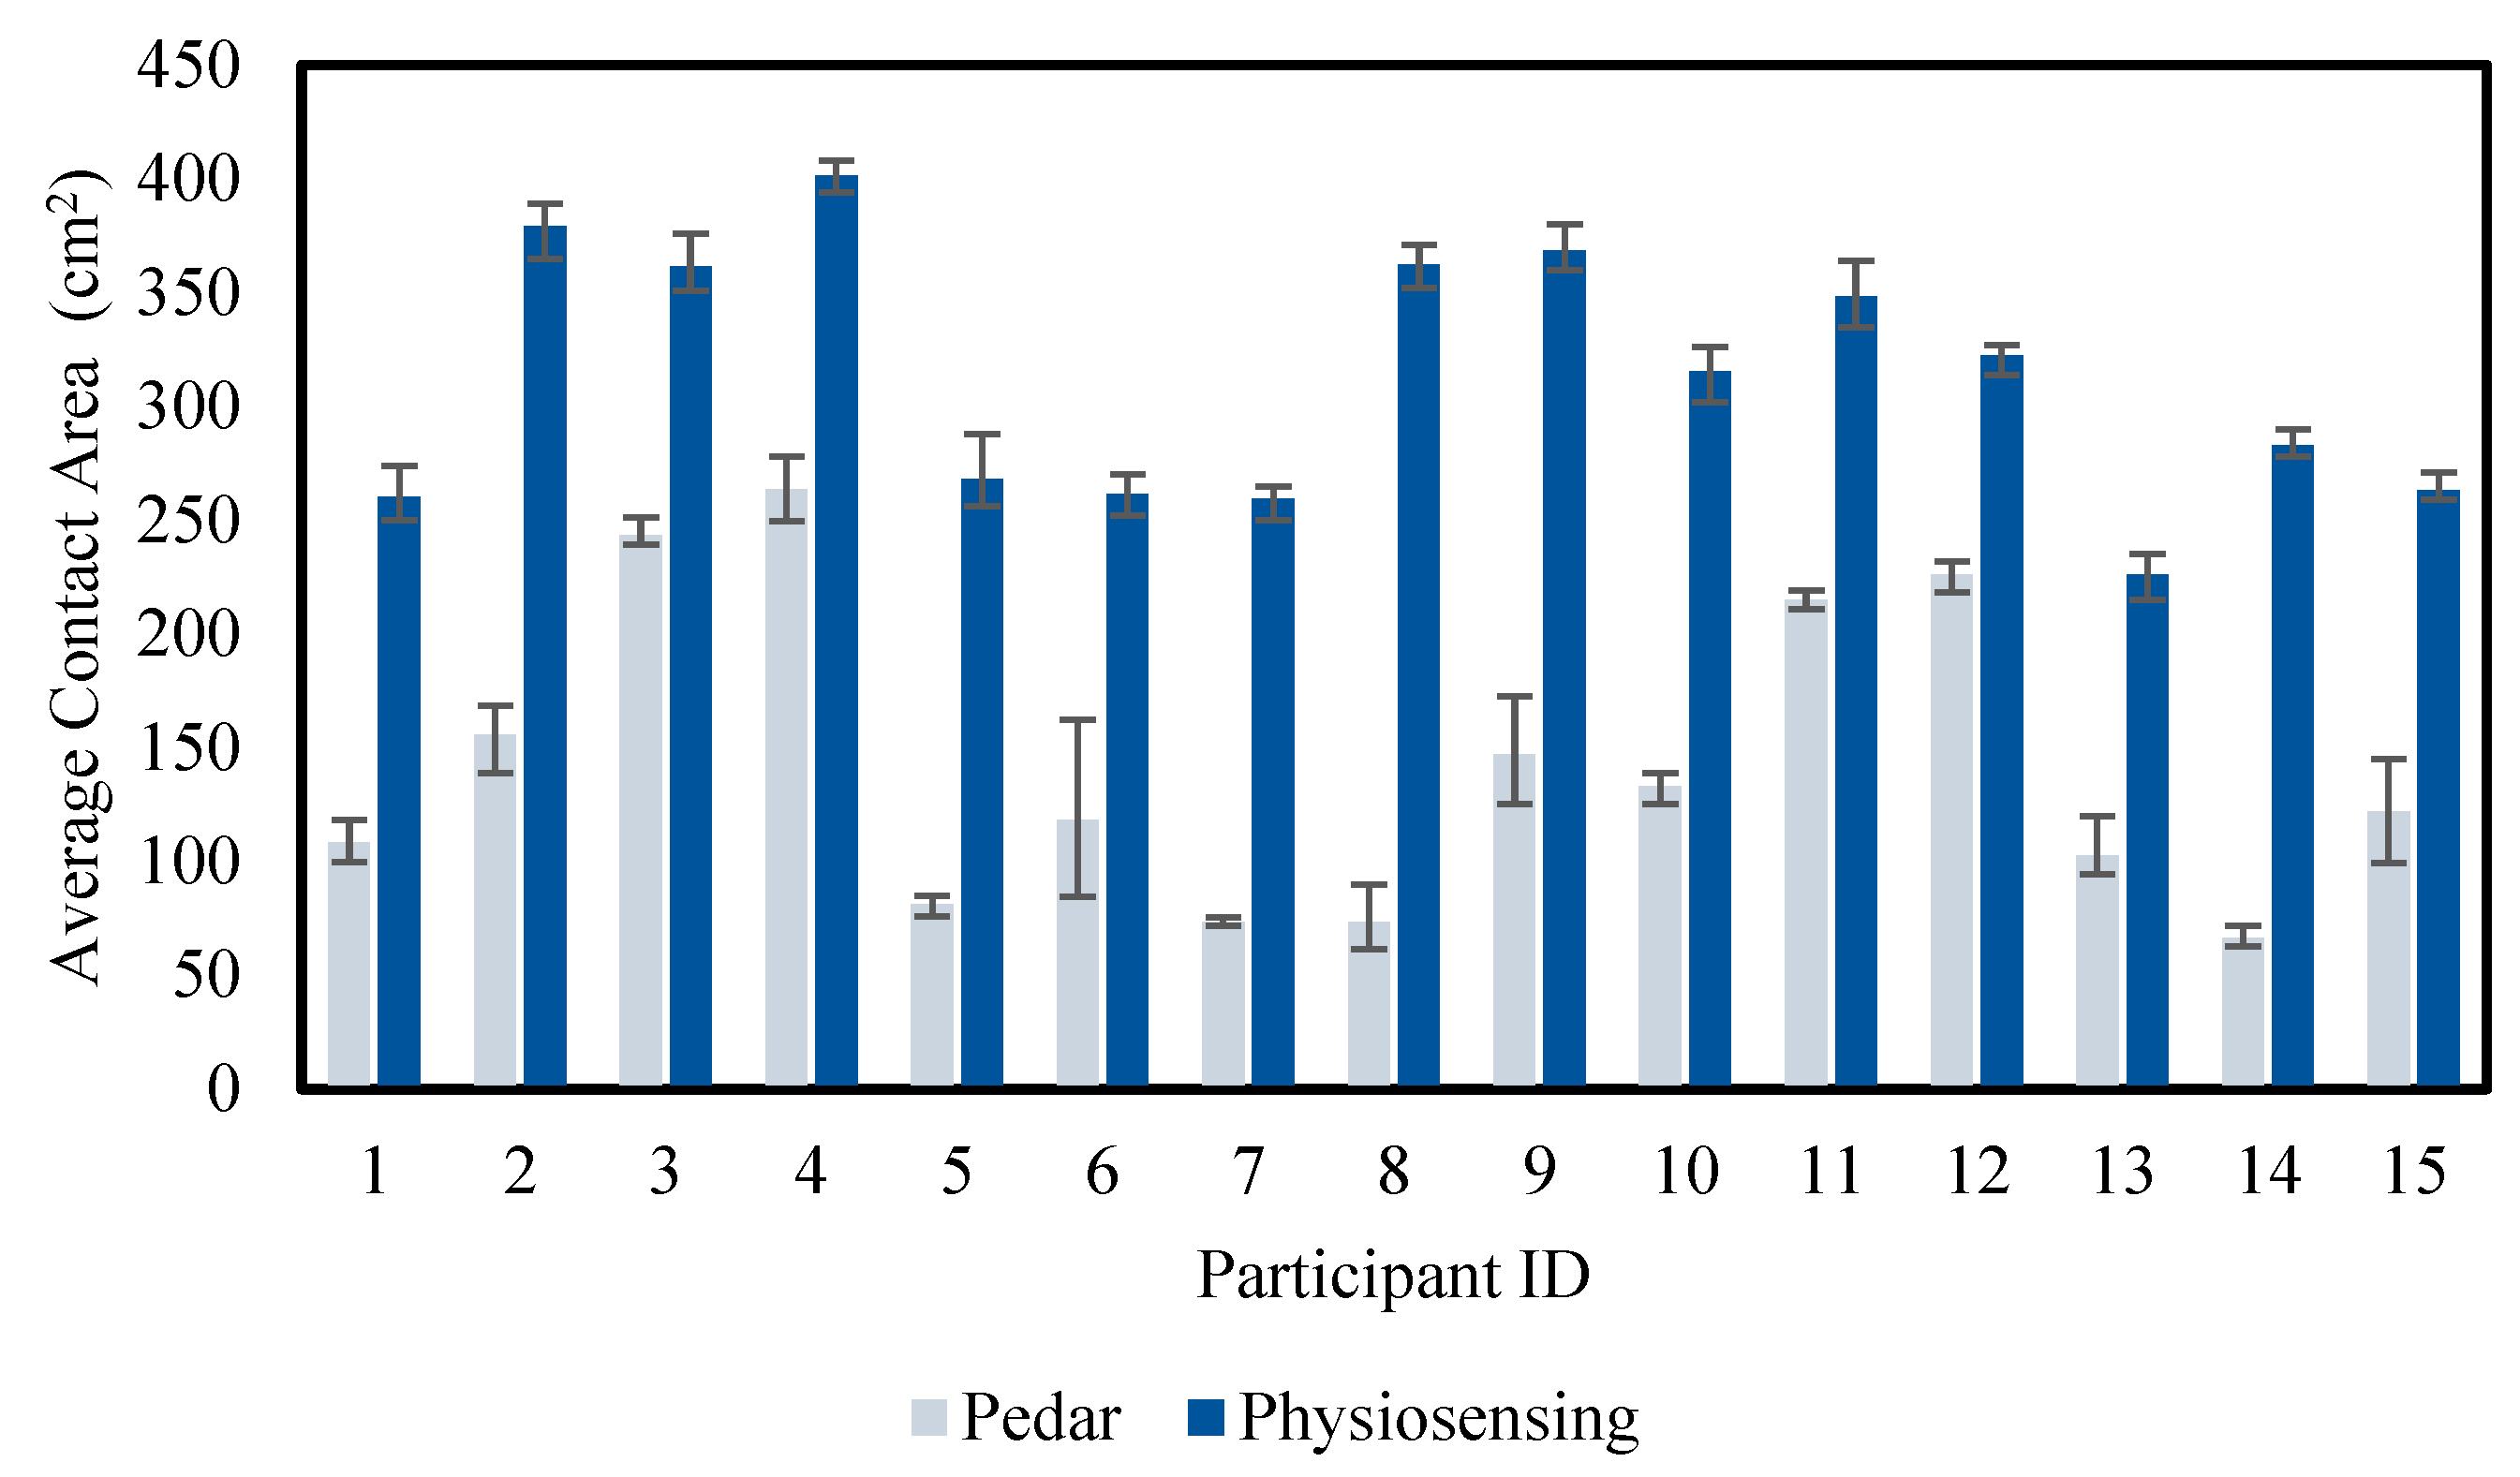
The difference between the contact area values can be explained by the high-density mesh of sensors in the Physiosensing
® system [
5]. With 1600 sensors distributed on the platform, this system can record a larger contact area. Furthermore, this system can even access regions of low pressure that Pedar
® cannot pick up due to the lower number of sensors. In the case of the Pedar
® system, the lower number of sensors means that only areas of higher pressure are recorded. In contrast, lower-pressure contact areas can go unnoticed, resulting in a smaller total contact area. This difference is crucial for applications where full pressure distribution and complete plantar contact are essential, such as postural analysis or balance studies, where the contact area global allows a wider vision of the pressure distribution [
5]. The high density of sensors in Physiosensing
® allows for capturing a more detailed contact area, including areas with low pressure. This result shows that Physiosensing
® is significantly more effective at picking up total plantar contact, which is relevant for studies that require a thorough analysis of the foot surface [
5,
15].
The effect sizes obtained for both metrics reinforce the relevance of the observed differences. For MPP, Cohen’s d and Hedges’ correction indicated a large effect size, suggesting that the difference in maximum pressure measurement between the devices is substantial in practical terms. This magnitude of difference implies that the choice of the device can significantly influence the results in studies focused on pressure peaks, with Pedar® being more suitable to capture these critical variables. In the case of the contact area, the effect size was even higher, indicating a marked difference between the devices. The result suggests that Physiosensing® provides a more complete measurement of the contact area, which is particularly useful in studies that require a detailed analysis of the plantar pressure distribution. This effect size reinforces that the observed difference is not only statistically significant but also has a considerable practical impact, which should be considered when selecting the device for studies involving global analysis of the contact area.
From
Table 6, it is possible to observe that the correlation is satisfactory concerning the α coefficient. However, the absolute agreement of the data falls significantly short of consistency, as the ICC is generally very low. This information agrees with the results of
Figure 2 and
Figure 3 since that is evidence of a clear difference between the obtained values and the different measurement devices. However, despite the data discrepancy, the difference is consistent among the several trials. There is a clear distinction in the characteristics and data export methods among measurement devices, which aids in explaining the difficulty in achieving comparable results. Nevertheless, the data consistency is acceptable, as evidenced by the findings from studies such as those by J. Hughes et al. [
32] and J. Hafer et al. [
33], although the reliability is lower than reported in these studies. The results highlight a low inter-platform consistency for the MPP and the contact area, with ICC values below 0.5. This indicates that the two systems are distinct for measurements of these variables. Cronbach’s alpha coefficient showed better results, especially for the contact area (0.781), indicating a good internal consistency of the measurements despite being only within each system.
Accordingly, the systematic bias in Bland–Altman plots suggests that Pedar® consistently measures higher values than the Physiosensing® device. The wider limits of agreement in the contact area measurement indicate greater inconsistency between the two devices in this parameter. The trend of increasing variability at higher MPP values suggests that discrepancies between devices grow as pressure increases, possibly due to differences in sensor sensitivity at high loads. For contact area, the systematic bias suggests that Pedar® records larger contact areas than Physiosensing®, which may be due to variations in sensor placement, calibration, or pressure thresholds for defining contact. These findings suggest that while the two devices may be used interchangeably for trends, direct comparisons of absolute values require caution, as systematic differences exist.
4.2. Research and Clinical Practice Applications
In this investigation context, it is possible to observe several discrepancies among the parameters and systems. It indicates that both devices have distinct characteristics that can directly impact the system’s applicability in research and clinical practice contexts.
The Pedar
® equipment monitors plantar pressure under movement conditions, allowing a more accurate measurement of pressure points throughout several gait cycle phases and supporting relevant data for dynamic studies [
14]. This feature makes Pedar
® the preferred choice for continuous movement analysis, such as studying the biomechanics of locomotion and the redistribution of plantar pressure in physical activities [
43]. Despite the study being performed with the participants in a static position, the results showed that Pedar
® presents an advantage in collecting the MPP data. This capability can be related to its more sensitive detection capacity in high-pressure regions, which is crucial for a more detailed analysis of the plant pressure distribution in areas of most significant impact. In clinical and research contexts, where the MPP values are essential parameters for injury prevention or clinical procedures, this higher precision capacity of data acquisition of Pedar
® offers more detailed information. Another application of this measuring system is to prevent ulcers in people with diabetes using personalized insoles [
44]. These patients are prone to this condition due to the excessive pressure on specific foot areas, which can be alleviated by custom-made insoles that can reduce the pressure in this critical region [
8,
15]. Regarding biomechanical analysis, this type of measurement equipment offers detailed information concerning plantar pressure distribution during impact activities such as running and jumping [
45]. The maximum pressure location allows the identification of patterns, making it possible to adjust the athlete’s movement, reducing the risk of injuries and improving performance [
46,
47]. From a more clinical perspective, Pedar
® can be used in post-operatory monitorization since it allows close monitoring of the MPP values and distribution. This information assists the physiotherapists in following up on recovery and gradually adjusting the level of support, preventing an excessive pressure appliance before proper healing [
48].
Physiosensing
®, a pressure platform, registered higher values of contact area, which can be explained by its sensor configuration, allowing a more general distribution of the plantar pressure. This is particularly interesting when the outcome needed is a complete representation of the contact area between the foot and the ground surface. For example, in postural and balance assessment for patients with postural dysfunctions or pathologies that affect body alignment, Physiosensing
® data can be used by physiotherapists to adjust exercises or supports that promote a more balanced weight distribution [
49,
50,
51]. Another application is the production of customizable insoles to bring comfort and prevent injuries to its users by promoting balanced pressure distribution. Patients with uneven footfalls or conditions that require additional plantar arch support could be candidates for this approach. Furthermore, it is possible to reduce the risk of imbalance, which is a concern factor for older people and multiple sclerosis patients, for example [
50,
51,
52].
The pressure platform system demonstrates superiority in measuring parameters such as contact area and a lower sensibility for capturing the pressure points. This makes Physiosensing® ideal for studies involving static postures or biomechanical assessments where immobility is necessary for analysis. On the other hand, the insole system, composed of two insoles with sensors, exhibits a lower capacity to measure the contact area and a higher sensibility for the pressure points. The measurement system selection should address the investigation’s specific objectives, depending on whether the analysis demands static or dynamic posture collected data.
4.3. Study Limitations
Studies based on experimental trials inherently present several limitations, particularly when involving biomechanical measurements in human subjects. One primary challenge lies in the complexity of the human body, which introduces significant variability that is difficult to control. This variability affects the reliability and repeatability of measurements, as it is virtually impossible to replicate identical conditions. Factors such as slight changes in posture, muscle activation, fatigue levels, or even emotional state can influence the outcome.
About the Pedar® in-shoe pressure measurement system, additional technical limitations arise. Over time, the system’s sensors may experience sensitivity degradation due to repeated use and the mechanical stress on the insoles. This wear can lead to subtle calibration or response accuracy shifts, potentially affecting data consistency. Furthermore, while the Pedar® system is designed to be portable and optimized for dynamic conditions, such as walking or running, its performance may be compromised when used in static or quasi-static trials. In these scenarios, minimal movement or inconsistent pressure application can lead to less reliable readings, as the system may struggle to capture stable data outside its optimal operational context.
Although efforts were made to mitigate variability by requiring each subject to repeat the measurement process five times per device, perfect repeatability could not be guaranteed. Human movement naturally involves slight variations, and even with consistent instructions, intra-subject variability is expected. These fluctuations likely contributed to some of the discrepancies observed in the results.
Moreover, a significant constraint of this study was the limited sample size. A small participant group reduces statistical power and increases the influence of individual variability, making it more difficult to draw generalized conclusions. This restricts the findings’ applicability to broader populations and highlights the need for further research with larger and more diverse cohorts to validate and extend the results.
5. Conclusions and Future Directions
This study presents a comparative analysis of plantar pressure data collected under static conditions using two measurement systems: the Physiosensing® pressure platform and the Pedar® sensorized insoles. The results reveal notable pressure distribution and measurement variability differences between the two systems. These differences are justified by their distinct sensing technologies, calibration methods, and measurement contexts.
Both devices demonstrated the capacity to capture plantar pressure data during static evaluations. However, the findings suggest that each system may be more appropriate for different applications. These conclusions are limited to static; as such, they should be interpreted cautiously, and further research is needed to confirm these observations in dynamic contexts or broader clinical populations.
From a practical standpoint, this study provides meaningful insights into each system’s specific strengths within biomechanical analysis and rehabilitation. The Physiosensing® platform appears particularly suited for static assessments, offering higher precision and consistency in measuring plantar pressure during quiet standing. This makes it especially relevant in clinical rehabilitation and physiotherapy, where accurate postural and balance analysis supports individualized therapeutic planning and continuous patient monitoring.
In contrast, the Pedar® insole system seems better adapted for dynamic applications, effectively capturing variations in pressure and contact area during movement. These capabilities make it valuable for studies involving walking, running, and other repetitive motor tasks. Its ability to monitor pressure patterns during movement is beneficial for gait retraining, postural correction, and rehabilitation, aiding in identifying pressure imbalances associated with dysfunction or injury. These insights can inform interventions that reduce overload in vulnerable areas and support gradual, safe recovery.
The observed differences between the systems highlight the importance of understanding their technical specifications, particularly aspects such as sensor density, which significantly influence the accuracy of data collection and the appropriateness of each system for specific applications.
In conclusion, the selection between the Pedar® and Physiosensing® systems should be guided by the study’s specific objectives or clinical evaluation. Using the most appropriate device helps ensure the reliability of the data and contributes to a more precise and meaningful analysis of plantar pressure distribution.
Future directions for research should include expanding the participant sample to encompass a more diverse population, such as older adults, high-performance athletes, and individuals with musculoskeletal or metabolic conditions (e.g., diabetic foot). In addition, a longitudinal analysis of plantar pressure across different rehabilitation phases would provide valuable insights into the evolution of therapeutic outcomes and functional recovery. Monitoring these pressure changes over time could support more tailored interventions and enhance clinical decision-making. Finally, conducting a comparative analysis with other commercially available systems—pressure platforms and sensorized insoles—would help broaden the spectrum of available technologies and offer a more comprehensive perspective on their clinical and research applicability.


 ,
, 


