2. Historic Overview of AR
One of the first pieces of equipment that enables a human to connect with the immersive environment is the “head-mounted three-dimensional display” (HMD), developed by Ivan E. Sutherland at Harvard University and described in the paper [
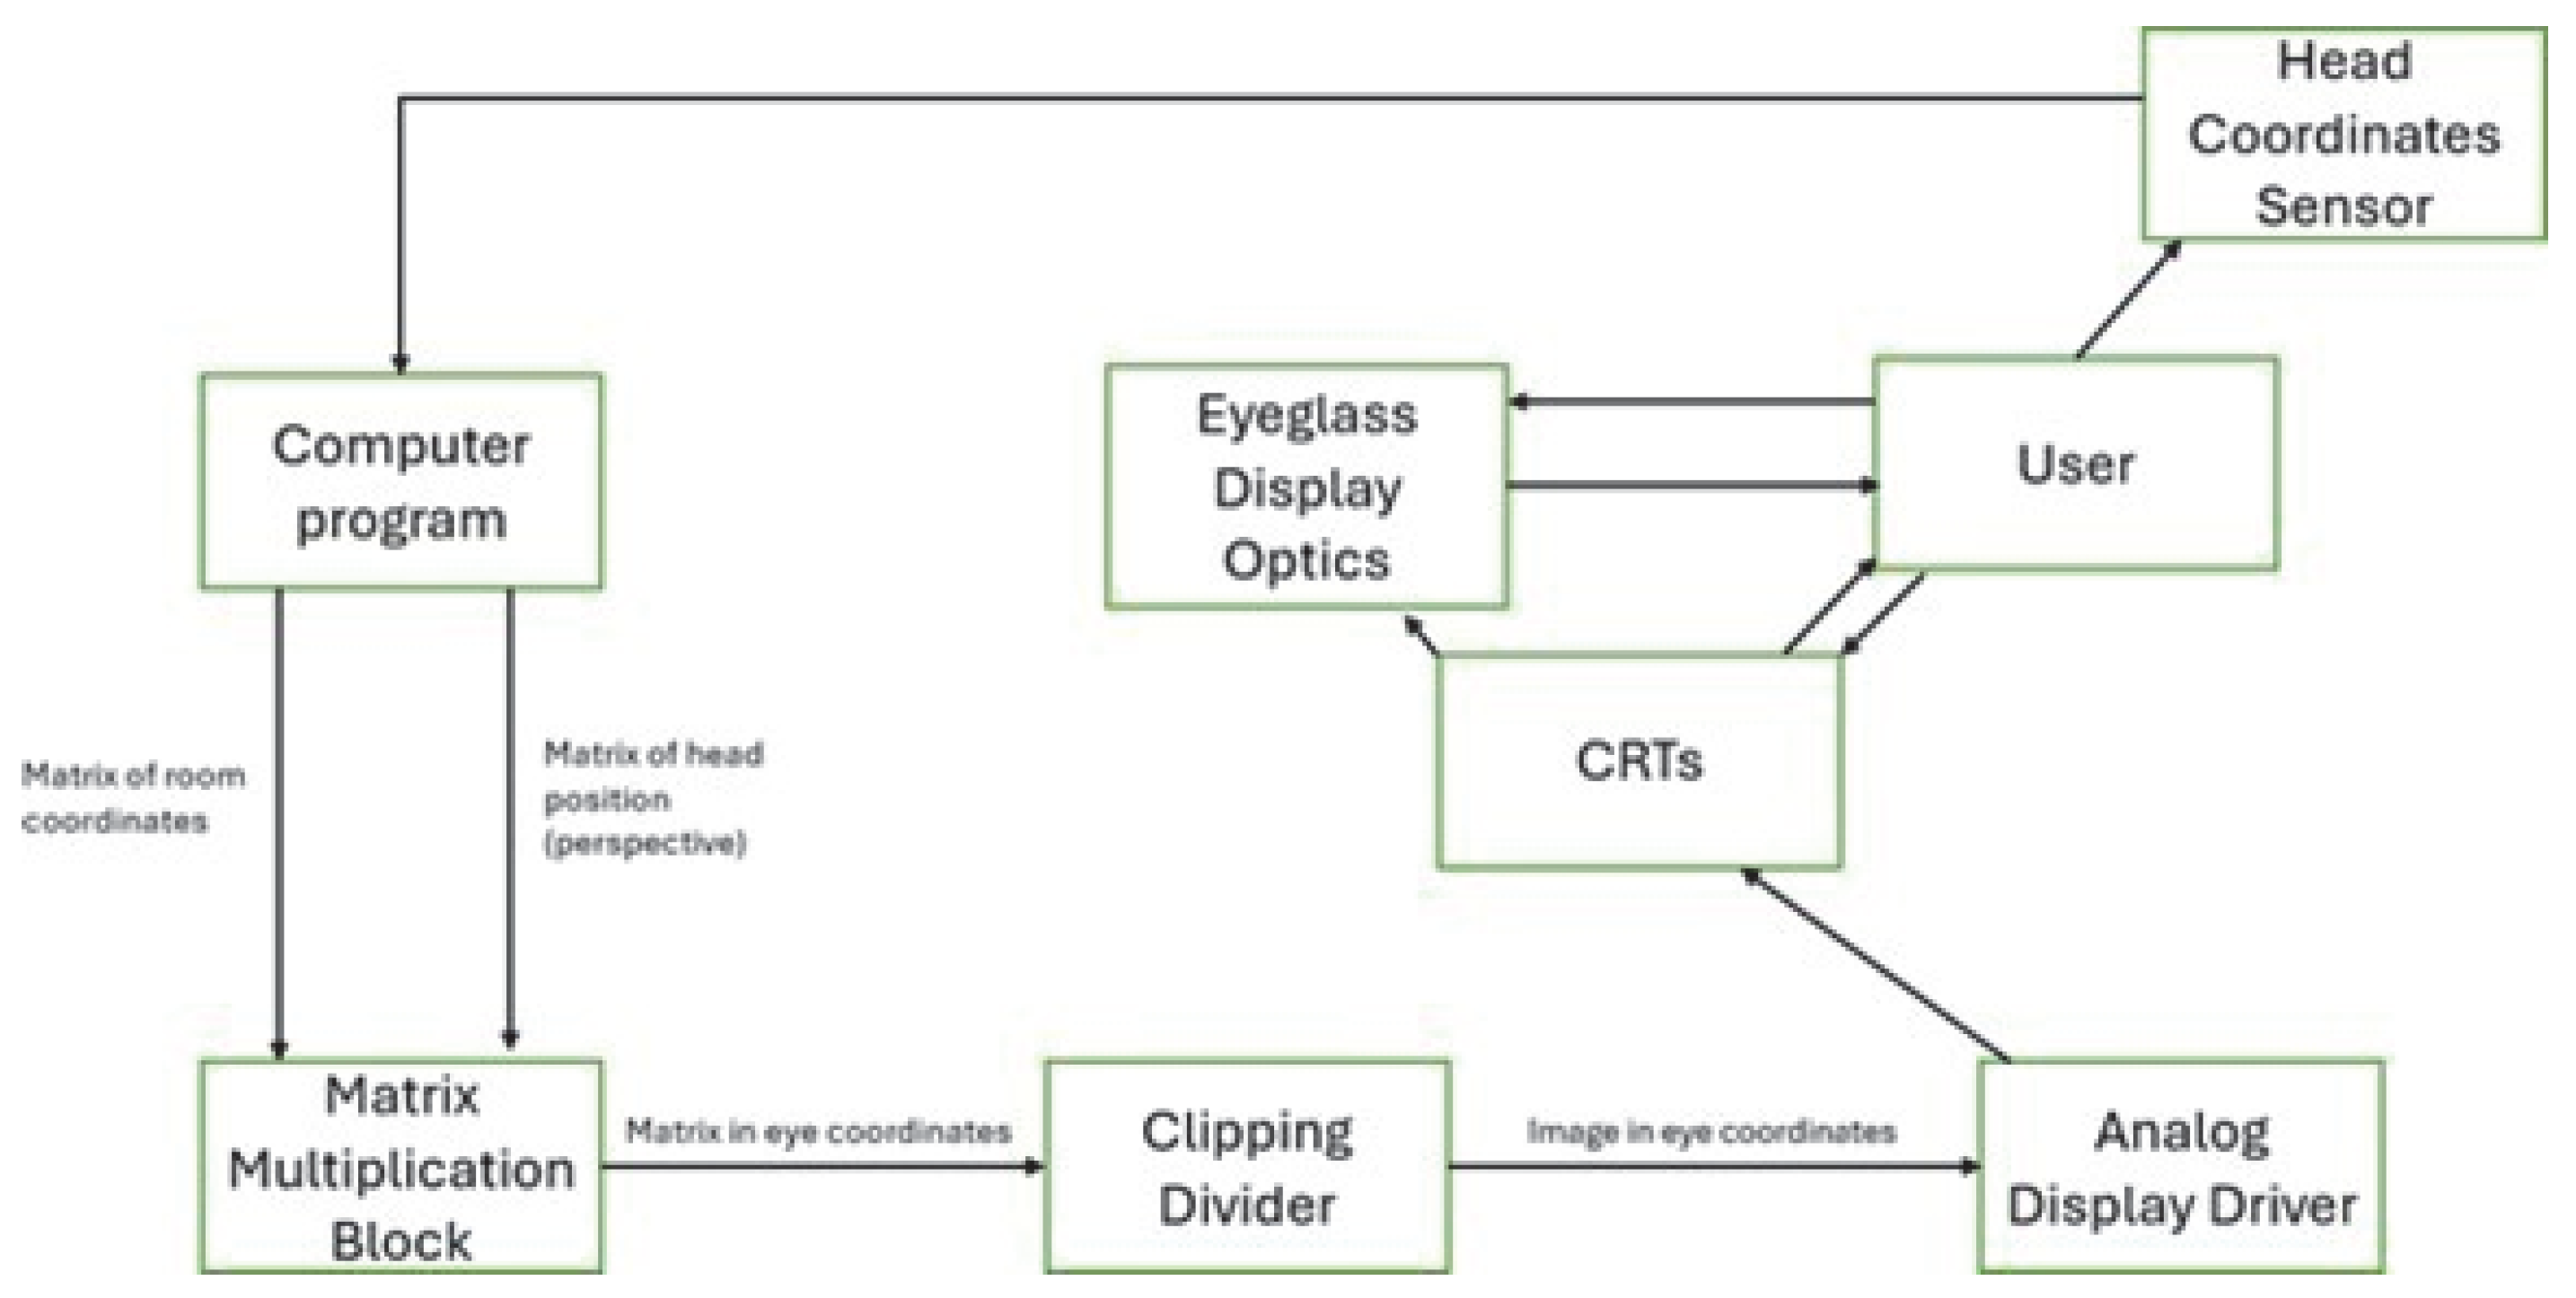
2] in 1963. The system features a unique headset that uses cathode ray tubes (CRTs) combined with eyeglass-like optics to deliver separate 2D visuals directly to each eye of the user. By using the headset, the user has a 40-degree field of view of the image that is presented. Moreover, to ensure the safety of the user, the CRTs are mounted in a metal that is fully grounded. Then, as the user moves their head, a head position sensor, which can be either mechanical or ultrasonic, measures the head position coordinates. Unfortunately, this system does not let the user move freely in the room, and it can only move their head up, down, right, and left. The mechanical head sensor is constructed from a ceiling-mounted arm, and it is allowed to rotate above a vertical pivot. The position of each joint of the arm is measured, and the coordinates of the position of the user are identified. The coordinates of the headset are further fed to a computer that calculates the elements of a rotational and translational matrix of the perspective of the user. This can be performed through perspective transformation, depicted in
Figure 1, by using simple relationships, (1) and (2), to transform from a particular point in space (in this case, the human eye) to a screen.
Together with the room coordinates stored in translational and rotational matrices, the image in the eye coordinates is formed and sent to the clipping divider. The clipping divider has the role of eliminating any outside region that can exist in the image formed previously, such that the correct image is shown to the user. In the final stage, the image is processed by the Analog Display Driver, which transmits it to the CRTs using analog signals. The whole process can be observed in
Figure 2.
Going back further, in the 1990s, the VR and AR applications kept on getting developed better and better because of the fast development in the technological domain. For example, in 1992, the CAVE Automatic Virtual Environment was developed and presented by the Electronic Visualization Laboratory in Chicago [
3]. The system allows the user to enter a cube formed by four screens, on which images are projected. These images are stereo images, and, because of this, the user must wear 3D glasses, creating in this way the immersive experience. This system was initially thought to create a virtual world for scientific research because it was easier and more user-friendly to test different theories and practical applications.
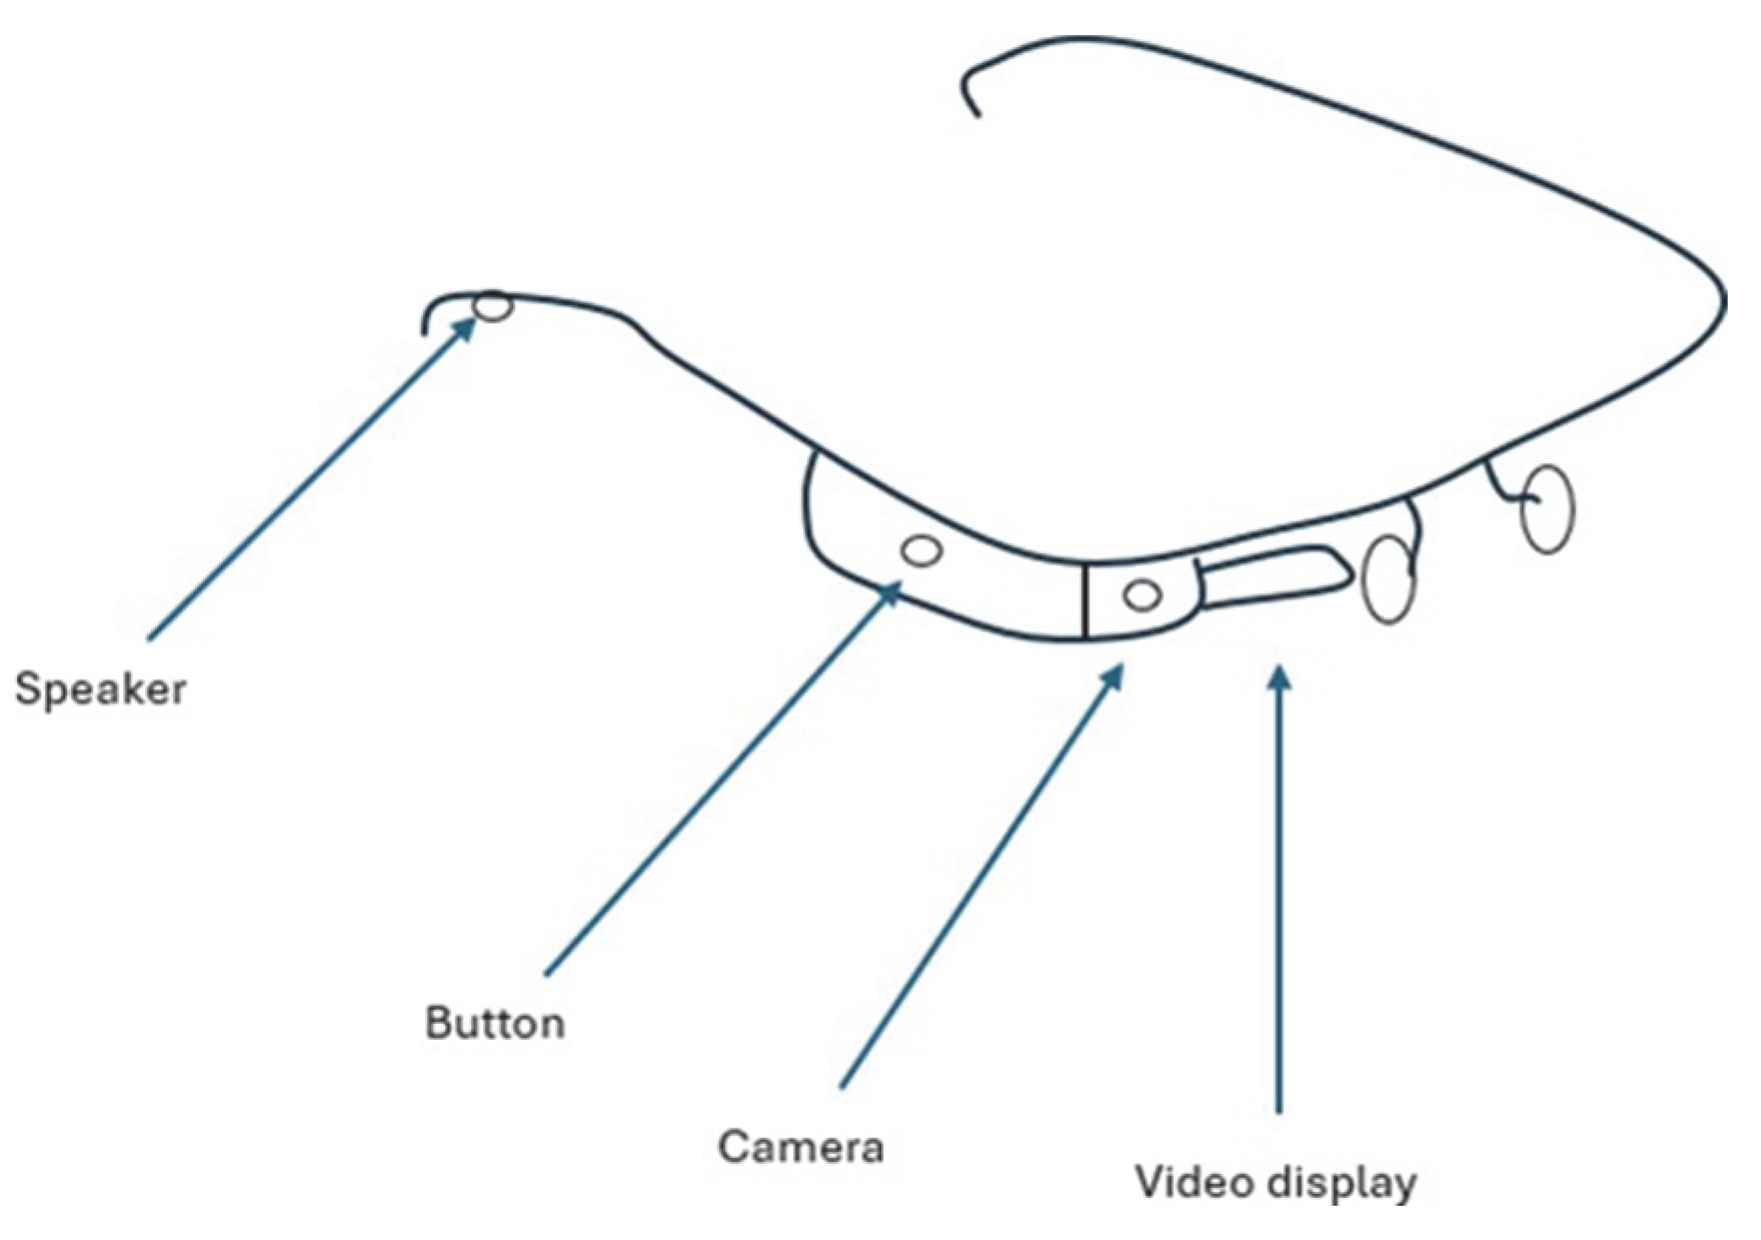
Next, in the modern era of applications in the AR and VR domain are the Google Glasses, which were developed in 2013. The glasses developed by Google are convenient and can even substitute a smartphone because this product is a wearable computing product [
4]. A wearable computing device is a device that is easy to wear every day, on clothes or under them, and has high computing capabilities. Moreover, it allows for interactions with the internet through natural language voice commands or through physical touch of the glasses. The physical components of the Google Glass can be seen in
Figure 3 and are the following: video display, camera, speakers, button, microphone, glass frame, and the glasses.
The benefits of using the Google Glasses include that they are easy to wear and to use, they provide fast access to maps, chats and documents, such that there is no time lost searching them, and they show the information directly in front of the user’s eyes, thus, the user can obtain their information faster. Nevertheless, there are also downsides to using Google Glasses. For example, the glasses are showing the information directly in front of the user’s eyes, and so the information can mislead the user and may not include the environment near them. Also, one of the most important disadvantages is that the private data may be leaked and used in harmful ways.
Since 2013, VR applications have started to be used more than ever in a considerable number of domains. First and foremost, the most approached field through VR is the gaming industry [
5]. In this domain, the most important aspect for having the best quality time using VR is the immersive experience. The immersive experience refers to the perception of players in being part of a different environment than the real world and the feeling that they are present and engaged in that virtual world. This is achieved through a headset that is lighter than the HMD, which permits the player to move freely in the entire room where the headset is connected. Additionally, the player can move in the game by using two Direct Touch Hand Tracking devices, which can sense the movements and gestures of the player’s hands with Infra-Red (IR) and RGB cameras mounted on the headset.
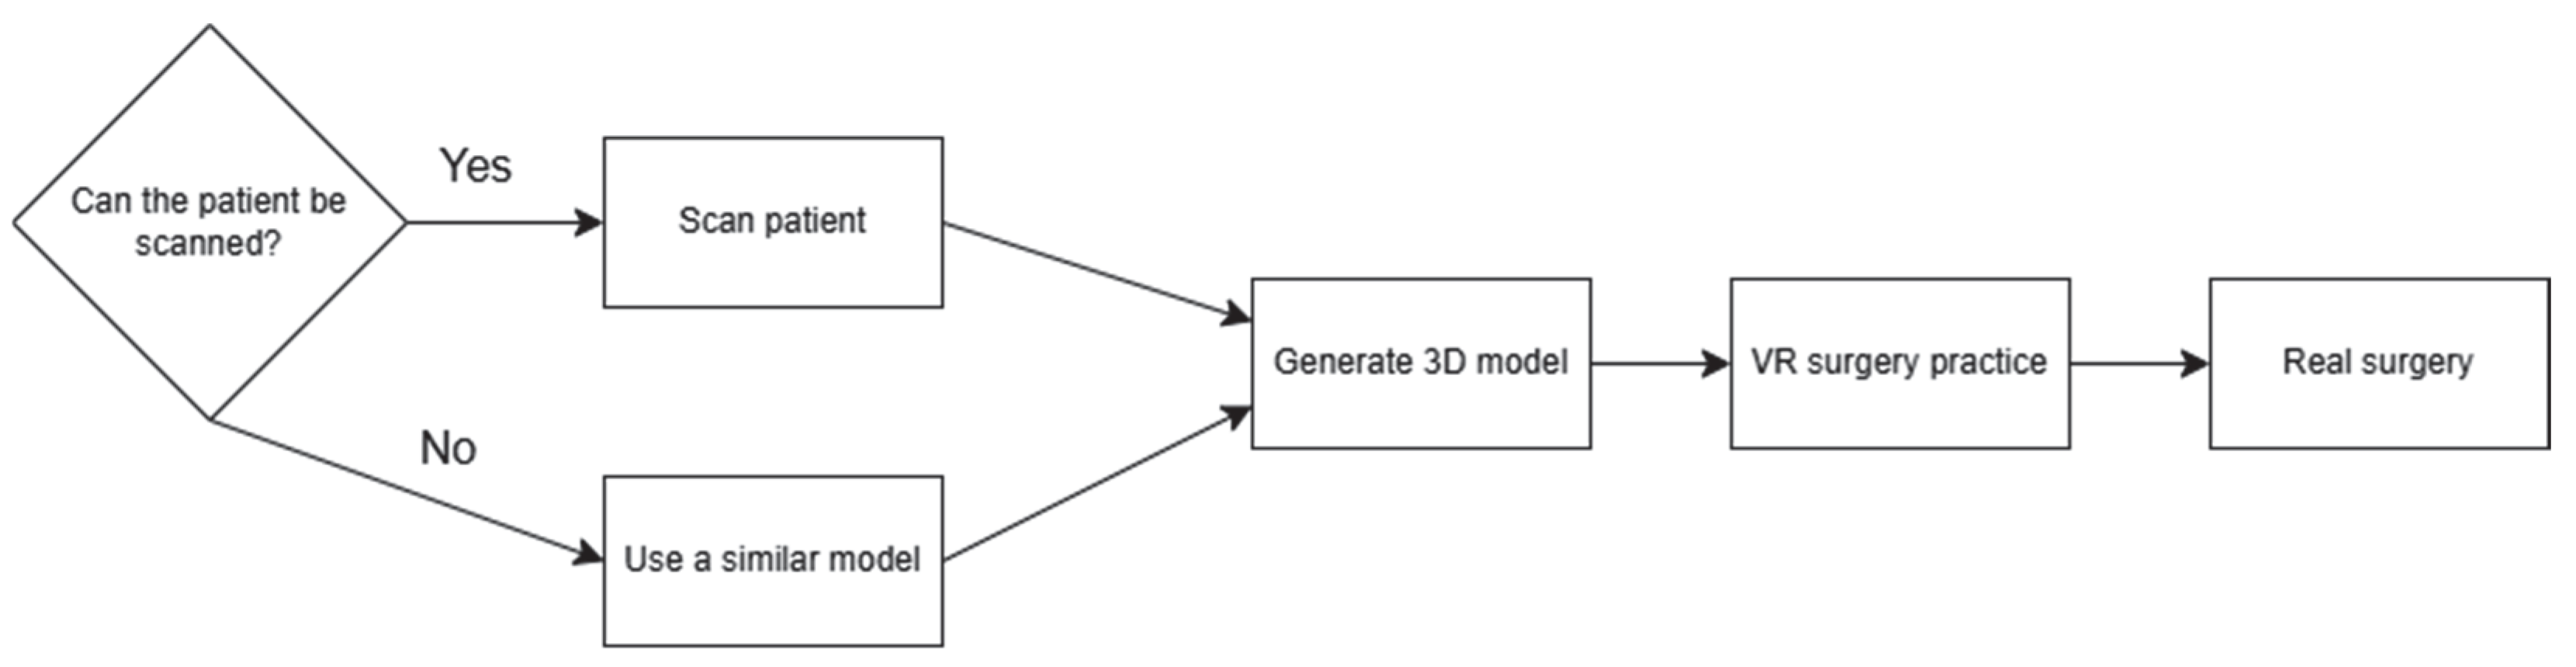
Another domain where VR systems are getting increasingly more attention is the medical domain. The use of VR in the medical domain first appeared in the 1980s [
6], when several applications were developed to train medical surgeons, such that in real situations, the rate of mistakes would be lowered. Then, in the 2000s, the focus of VR in medical situations shifted from surgeons and medical staff to patients by using the VR worlds for reducing the pain during medical operations in such a way that no medicines were used. The patients in such cases were placed in familiar, relaxing environments, “tricking” in this way the pain receptors in their bodies. Nowadays, the VR applications in this industry are used to train and plan a medical surgery ahead of the actual surgery, as described by the flow diagram from
Figure 4.
Similar to the VR applications, and since 2013, the AR applications started to gain ground not only over a significant number of domains, but also over the VR world. AR applications were first developed around six domains: medicine, manufacturing, visualization, robot path planning, military, and entertainment [
7]. In the medical domain, the AR applications are usually displayed by using a simple monitor that is near the doctor, an overlay with a radiography that is perfectly positioned on the patient. In this way, the doctor can perfectly see where the operation should be performed. Moreover, by using AR applications, the doctors do not need to interact with the radiographies or other physical elements that could compromise the sterility of the medical instruments.
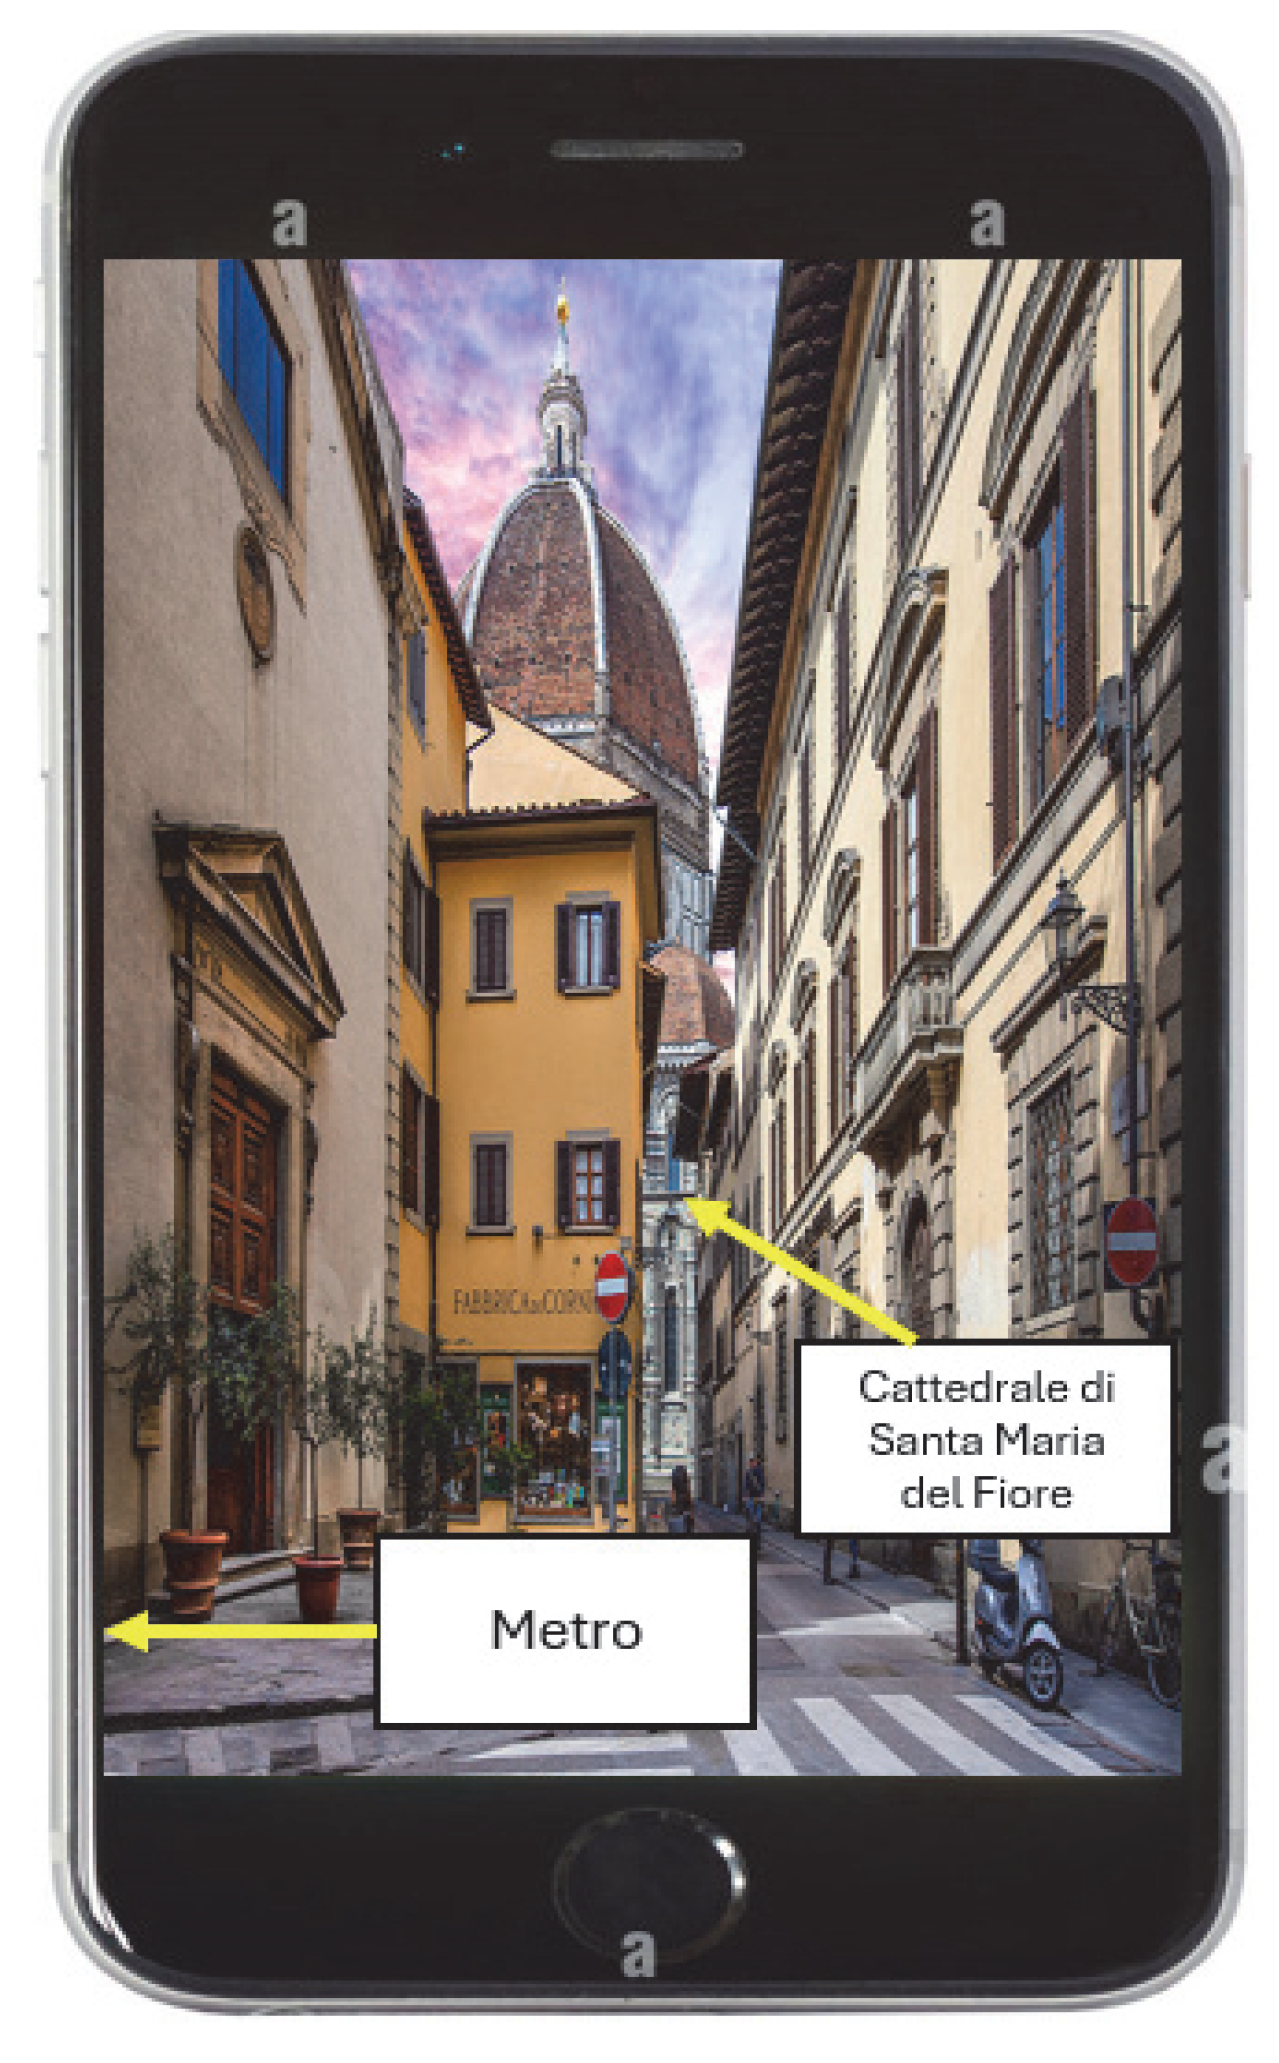
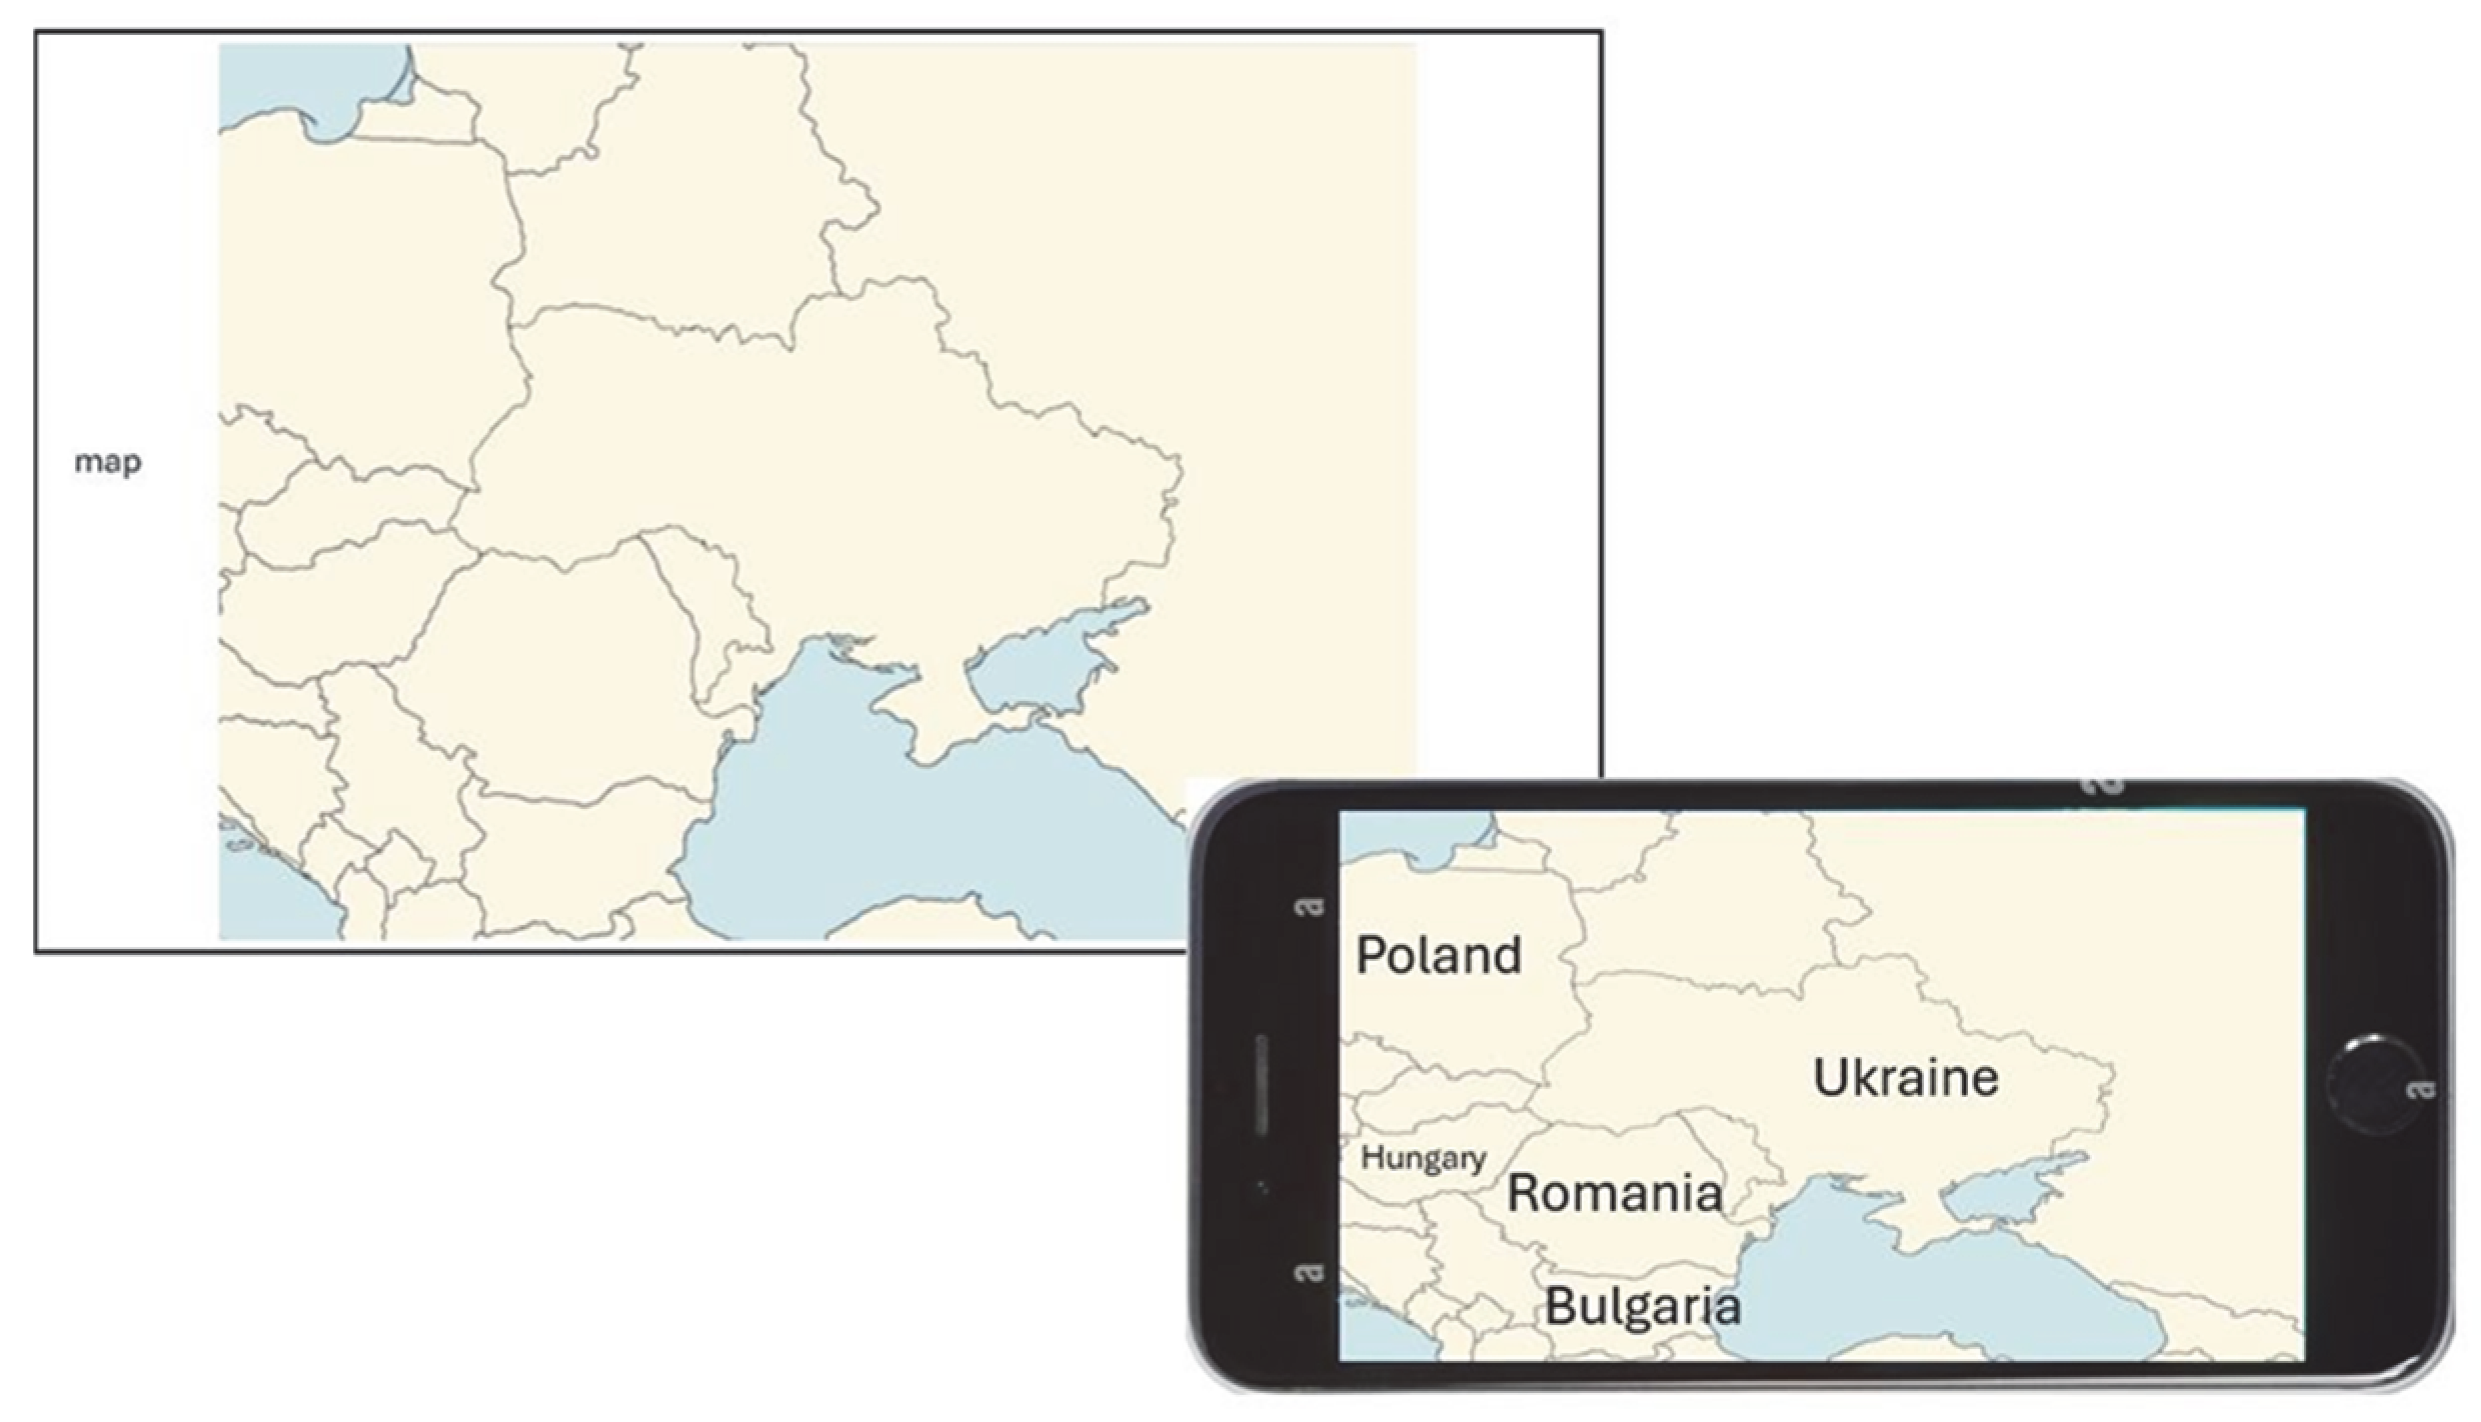
In the tourism domain, because of the development of mobile phones and with the appearance of smartphones and tablets, the AR applications started to be used more and more by tourists. Because of this, for example, the government of Italy and the leaders of the Tuscany region seized the opportunity and developed Tuscany+ [
8], presented in
Figure 5.
The application works by pointing the camera at a landmark within the Tuscany region, and the application recognizes it. Then, after the landmark is identified, the application accesses the internet by navigating to different verified websites, like Wikipedia or Google Places, via the Google Places API (v3) under the Google Maps Platform, obtains information about the respective landmark, and shows it on the screen for the user. Also, Tuscany+ provides the user with routes to the closest metros, buses, and public transportation in general. The benefits of using such applications are the personalized pieces of information that could be obtained to show to the user, and the ways in which the information is transmitted can vary from text to 3D models and videos.
However, even though VR seems to be the best alternative among VR and AR technologies to the real world, it is not as great as it appears to be. There is a need for human beings to disconnect from mobile devices, laptops, the virtual world, and technology in general, and live in the real world by having face-to-face social interactions with other people, such that the users of VR do not get injured or have mental health problems. For example, prolonged use of VR may cause dizziness and nausea [
9] because of the fact that VRs do not simulate head and body movements. So, because people keep their balance through vision and the inner ear, the body feels like there should be some forces and some movements, but there are none. That is why the users of VR headsets, especially the ones who use them to play games, use them on average for 32 min, which is comparable to the longer sessions that can be held on PC.
Moreover, it is important to highlight the fact that, because the users of VR headsets are put in an emulated and isolated virtual world, long use of the headset can lead to loneliness, anxiety, and even depression, as there is no social interaction. Secondly, the users of VR may feel discomfort because of the hard cushions, heavy glasses, or different product issues, depending on the type of VR headset. This problem can lead to different physical effects and pains in the zones where the headset was worn. Also, a lot of pain can appear if the user bumps into different objects that belong to the environment in which the VR headset is used. This can happen because when someone is using the VR headset, they may need to move around or use their hands, without knowing where they are located in the real world with respect to the objects in the proximity. Additionally, one of the biggest problems is the lack of hygiene when using a VR headset [
10]. This can lead to eye infections or even ear infections if the pads around the eyes or the ears are not cleaned because they can develop a bacterial medium. The cervical spine can also be affected by the VR headset by putting a greater pressure on the neck, as the product is quite heavy, weighing approximately 600 g. Lastly, human beings need to fulfil their basic needs, such as drinking water, eating healthy food, socializing with people in real life, and having a sense of connection within the community they live in. Thus, living and developing in a virtual world through a VR headset cannot contribute to these basic needs, and so, they cannot be achieved.
Therefore, because of the disadvantages described above, the world is starting to move more and more toward AR technology, rather than toward VR technology. This is because in the AR world, human beings can freely live in harmony with the real world and the virtual one, being present in both at the same time. Furthermore, the domains in which VR technology was first and often used are starting to be overshadowed by AR applications, as AR applications provide a way to also live in the real world, not only in a virtual, simulated world [
11].
While the historical overview provided an essential foundation in AR and VR, it is important to define how and why certain technologies and applications were selected for detailed analysis. The following choice was made based on a convergence of three main criteria: educational relevance, technological accessibility, and pedagogical impact in geographical contexts. Specifically, AR Sandbox, GeoAR, and other interactive AR systems were chosen due to their ability to prove core concepts in geography education. These technologies are not only actively used in educational settings but also represent the immersion levels and hardware requirements.
Geography was chosen as the central educational domain for this study due to its intrinsic spatial, environmental, and physical dimensions, which make it ideally suited for immersive visualization. Among academic disciplines, geography uniquely combines physical processes, human interaction, and environmental dynamics, areas where AR can significantly enhance comprehension through experiential learning. Furthermore, contemporary education emphasizes learning, where tools like AR can bridge abstract geographical theory and real-world context. Thus, geography provides both an ideal use case and a pedagogical challenge that AR can meaningfully address.
Regarding the criteria for selecting the AR technologies, factors included affordability, deployment in classrooms, ease of use for students and teachers, and the capability to simulate real-world geography. Additionally, peer-reviewed literature, adoption in educational pilot programs, and support from government or institutional bodies helped narrow the selection. Moreover, the psycho-physiological effects of AR use in geography education call for deeper exploration. Early studies indicate that moderate AR exposure can increase cognitive engagement and memory retention while reducing disinterest compared to traditional methods. However, prolonged usage or poorly designed interactions may lead to cognitive overload or visual strain, especially among younger students.
3. Augmented Reality in Education
Although in the second section, different domains were covered for the AR technology, one of the most important domains is the educational one. Education is the process that allows people to acquire knowledge, information, skills, and values, which are helpful to get through life and to engage in meaningful experiences and interactions [
12]. It is an intentional process that usually happens through formal institutions, like schools, high schools, or universities, but can also happen in non-formal ways, like home schooling or even through extra-curricular activities in the community. Moreover, the education of the people in a society is not only an essential tool for the personal development and growth of each individual, but it is also important for the economic and social growth of countries.
Having this in mind, AR applications can help in learning, as they are a new and innovative way for students to interact with the process of learning. One of the advantages of using AR applications in the educational domain is that the systems allow observing and learning abstract topics better and more efficiently by the students [
13]. For example, in the biology field, this type of visualization can help students to interact with a computer-generated 3D skull model, supporting kinesthetic learning. Kinesthetic learning is defined as a type of learning in which students learn from practical activities, rather than listening to course material. Moreover, in the chemical field, students can use AR applications to visualize different compounds and see how these compounds interact with each other. Additionally, the studies in the aforementioned paper show that by using AR applications in the learning process, the students can develop skills related to communication and collaboration. Thus, the students can learn different topics using the technology, but without spending time in front of a screen, as in the case of learning by using a PC. Lastly, one of the most important advantages of AR applications in education targets one of the biggest problems: the lack of desire in the learning environment. The AR applications were found to increase the focus of the students and captivate their attention, in contrast to when students are made to learn and solve different problems by using routine methods and manuals.
Although there are substantial numbers of advantages, there are also a couple of downsides. For example, if the students are fed a lot of information by using AR applications, they could become cognitively overwhelmed and could experience different difficulties. Moreover, the studies supported in the aforementioned paper [
13] state that if the students are not helped in setting the AR environment or if they are not assisted when they first use the technology, the learning environment may be negatively affected. That is why, when the AR environment is set up and first used, it is recommended that a teacher or a supervisor guides the students into using the new system. Furthermore, on the professors’ side, they must adapt to a new way of teaching, and they need to try to minimize as much as possible the conventional approach of teaching. This is usually not happening, especially with the teachers who are included in the older age category, as they are not open to new technologies and innovation in the methods of teaching.
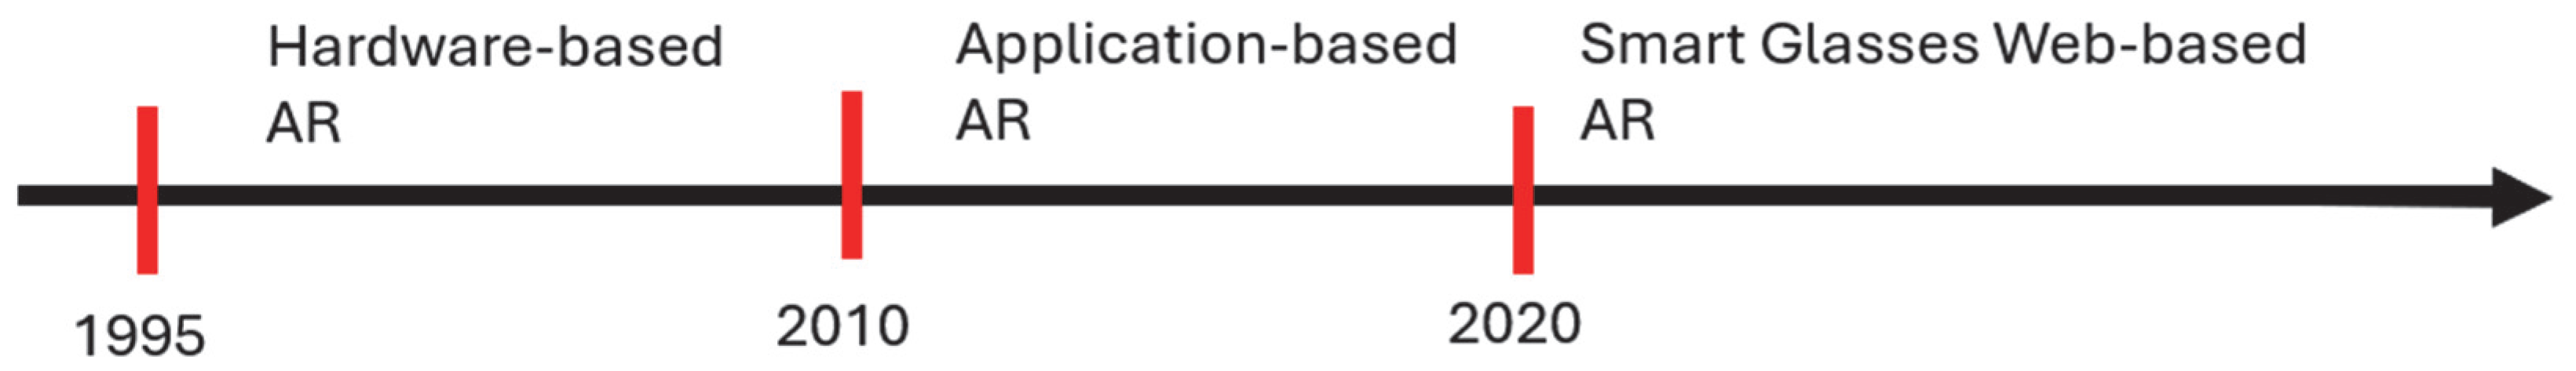
The AR applications in the educational field are divided into three categories [
14], as can be seen in
Figure 6.
The AR applications in the first category, Hardware-based, were used especially in the health domain and in the medical domain and were based on hardware and on devices such as HMDs. The very first AR device was used to teach 3D anatomy at the University of North Carolina in 1995 [
15]. The application was developed in three stages. In the first stage, the AR application had to model the elbow joint and the dynamics of its movement. In the second stage, the application was improved to capture the real scene with the aid of a TV camera, and the image was superimposed on a flat display. Then, in the last stage, the AR device used an optical see-thru HMD, eliminating the need to use a TV camera. An optical see-thru HMD is a head-mounted 3D display in which the real world is also available optically when observing the virtually generated one. The final device was designed to have a tracker, an enhanced reality setup, and an optical see-thru HMD. The tracker is composed of one transmitter and three receivers, each of the receivers being placed on the arm: one near the humerus and two at both ends of the forearm. By placing them in this way, the 3D model can be generated on the computer by taking the position of the sensors.
Because of the complicated hardware, the AR applications were costly, and the universities and schools did not want to invest in such devices. Also, the hardware and the applications as a whole were really hard to use, and would need the users to extend their knowledge too much into this domain to work with such technology. Moreover, the ease of using the hardware was very low, and so, the users’ experience quality was also low. By putting together the disadvantages of cost and usability, it can be observed that the learning process was obstructed by the complexity of the AR applications.
The second generation of AR applications, the Application-based AR, tried to come up with a solution to the problems the AR world met in the first generation. Because of the rapid development of mobile phones and software technologies, the solution was to deploy mobile-based AR applications, such that the applications were accessible to anyone, anywhere. Also, the costs of purchasing these applications were lowered drastically, as there was no need to buy expensive hardware. Additionally, the users did not need to invest a great number of hours into learning how the software works, like in the first generation, as there were available SDKs, game engines, and libraries that eased the learning curve.
Furthermore, in this period, the AR applications in the educational domain began to improve to the point that five directions were proposed: AR books, AR gaming, discovery-based learning, object modeling, and skills training. The most important direction in the educational field among the five directions listed above is the AR book [
16], because of the ease with which, not only the students, but also the teachers, can use the applications to learn and to teach a new domain. For example, one of the most used AR book applications is the MagicBook, developed by M. Billinghurst [
17]. The application works by using a handheld AR display (HHD) that is composed of a switch, a compass, and a camera. After the HHD is turned on using the switch, the device starts and looks for a marker present in the book. After the marker is recognized by the HHD, it is compared with certain templates in the memory of the device, and finally, the virtual object replaces the marker. The role of the compass is to detect the pose (position and orientation) of the HDD and, thus, of the user, such that the virtual object is shown in the right pose, oriented toward the user’s face. One of the most important advantages of using the MagicBook is that it cannot only be used as an AR device, but also students and teachers can read it without using any AR application, being a standalone book.
The last generation is the Smart Glasses Web-Based AR applications. This generation tries to combine three elements: smart glasses, WebAR, and AI. The smart glasses are a type of device, like Oculus Rift or, more recently, Apple Vision Pro, that allows the user to connect to the internet and to visualize all the information, while he can still see and be connected to the real world. The WebAR applications address the problem of AR mobile applications not being downloaded or being uninstalled after just a few uses. Even though, the WebAR applications are slower compared to the dedicated applications, these types of applications have the benefit of accessing an AR application whenever is needed, removing the need of downloading and installing on the mobile phone a dedicated AR application.
Finally, because of the recent expansion of the AI domain, AR applications started to include AI models in the software. By doing this, the applications open up new directions and horizons, enabling the editing of the real world by the user through virtual objects. For example, one of the most well-known and recent devices, the Apple Vision Pro, can be used especially in medical education, for students to learn and train with more practical methods. The device contains a 3D camera that allows the user to take 3D photographs and videos of different scenarios. Through this, the students could use the Apple Vision Pro to learn about different medical interventions and to practice those medical operations.
Recent advancements highlight that AR’s potential is maximized through the incorporation of AI technologies, which allow data analysis and personalized educational pathways. AI can evaluate individual learner preferences and performance, such that it enables personal educational experiences that adjust in real time [
18]. Moreover, in scenarios where AR environments are coupled with AI tools, teachers can receive immediate feedback on student engagement and learning outcomes. This real-time adaptability is very important, especially in classrooms where students’ learning styles and paces significantly vary, so there is a more inclusive educational experience.
Moreover, the integration of AI and AR promotes the implementation of gamification strategies in education. Gamified learning experiences with AR visualizations not only elevate student engagement but also motivate learners to take on more challenging concepts [
19]. These aspects encourage students to take part actively while embedding educational content within their interactive experiences, which promotes deeper learning. As students navigate through gamified AR scenarios, they receive instant feedback, which can help them adjust their learning strategies in real time [
20].
The transformative potential of these technologies also affects pedagogy, requiring professors to redesign traditional teaching methods. The literacy needed for effective use of AR with AI tools is highlighted by researchers who propose teacher training programs to evolve alongside these advancements [
21]. Also, educators need to be equipped not only with technological skills but also with pedagogical frameworks that promote critical thinking and creativity within immersive tools. The shift toward an AI with AR education model, where teaching and learning are united with AI capabilities, represents a crucial evolution in educational methodology [
22].
Unfortunately, challenges are still present in the widespread adoption of AR and AI technologies in education. Issues such as the digital divide, varying levels of technology ability, and the need for supportive infrastructure can hinder implementation [
23]. Nevertheless, as more institutions begin to embrace these technologies, comprehensive strategies to tackle these challenges are underway, promoting fair access to immersive learning experiences.
It is clear from the evidence that AI and AR hold the potential to significantly enhance educational effectiveness through immersive experiences and personalized learning strategies. Enabling students to visualize and interact defines the future of education in this digital age. So, the interaction between AI and AR technologies presents new frontiers in educational practices. As these technologies evolve, it is imperative to keep a critical approach toward their application, ensuring that they serve not only to enhance educational outcomes but also to advance an engaging learning environment for all students.
4. Augmented Reality in Geographical Education
One of the most important subdomains in the educational field in which the AR applications can help the students to learn better and in a more practical way, is the geographical education [
24]. Geographical education is defined as the process of learning the geography subject in a formal way, through school, high school, or college, or in an informal way, through home schooling, family, or society [
25]. The geography topic refers to the study of the lands, the features of the Earth, and the way in which the components of the Earth interact with each other. In the formal way of education, the students who are in primary school learn about introductory notions related to simple orientation and localization, maps, waters and terrains, and how to protect nature. Then, in middle school, the students learn about the movements of the Earth’s crust, the internal and external structure of the Earth, oceans and seas, and economic geography. Finally, in the high school part, the students learn about the detailed structure of the Earth, how the population is spread around the globe, global problems, and the detailed geography of the world’s economy.
For all these topics related to geographical education, the AR applications can come in handy and can help the students and the teachers in their development. M. Rellia [
26] proposed an experiment in which some students learned about animals and plants and their location on the globe in the traditional manner (control group) and some of them used an AR application called ARETE (experimental group). The students were given an initial test, such that a reference point could be set. Then, after both groups learned the topic in their given way, another test was issued. The results showed that both groups achieved higher grades than the initial test, but the experimental group achieved even higher grades compared to the control group. Moreover, the test concluded that the students who used the ARETE AR application learnt and retained the information more easily and held the attention of the students for a longer period of time. Unfortunately, there were also some disadvantages raised by the students, such as a slow internet connection and difficulties in understanding the topic presented.
Another study [
27] proved the advantages of using AR applications in geographical education. In the research, the author involved 24 participants, students, who were divided into six groups of four students. Each of the groups had to complete an initial test about their experience, and then they had to use the FingerTrip application, an AR game composed of robots and tangible maps, to complete some given tasks. After each group completed their tasks, the students received another test to record their experience. The test contained 25 questions that needed to be graded with maximum 7 points: the ease of use of the system (3 questions), the autotelic experience (3 questions), the perceived language (3 questions), the user focus (3 questions), the learning environment for practicing educational robotics (3 questions), pragmatic quality (4 questions), Hedonic Quality-Stimulation (3 questions), Hedonic Quality-Identity (3 questions). The author presents the results of the tests before and after using the AR application, as seen in
Table 1, showing that using the AR application improved the learning outcomes in the geographical domain. Moreover, the students claimed that the use of the AR application helped them understand the details of the geomorphology topic better and more easily and to relate better to different geographical positions.
Another advantage that can be formulated in favor of using AR applications in geographical education is that the users can interact through different types of applications and devices with simulated 3D models of environments and terrains, real or fictional. The students can use these models to observe changes to the topographical map and environment, if some transformations in the simulated terrain occur. Lastly, the traditional way of learning geography is performed through static maps and a few interactive lectures, which could become a cumbersome task for the students to point out regions and different formations [
28]. To overcome this issue, AR technology can overlay the students’ own environment by using an AR application, transforming in this way the static way of learning the topic presented by teachers into a dynamic, interactive learning environment.
One of the many applications in the geographical education field is GeoAR [
29]. GeoAR has the role of teaching the students who are enrolled in middle school about the neighbors of Romania, the countries of Europe, their flags, and the capitals of Europe. The application enhances the learning technique and desire of students by letting them learn through playing. The students can play certain games of guessing the flag, the capital, or the country, which have different levels of difficulty. For example, after a student has perfected their learning in the easy levels, the student is given questions that are “trickier” in the hard levels. In this way, the student can make the difference between certain flags, countries, or capitals that may look the same or have a lot in common. The application also has a functionality, in which if the student does not know some relevant information about a certain country, the user of GeoAR can click on the country flag and it redirects the user to Wikipedia’s page of that country. The Augmented Reality functionality comes within the printed maps that come together with the application. Therefore, on the printed maps, there is nothing written (no country name, no capital name), but only the borders of the countries that act as markers for the application. Then, when the student uses the GeoAR application through the camera functionality, the user can see the map filled with the country’s name, the flag, the capital, and the names of the neighbors. The application has three modules: “Learn Europe”, “Test Your Knowledge”, and “Find Out More”. The “Learn Europe” module is practically the AR part of the application, in which the student uses the camera to discover the countries’ names and flags from a printable map. The second module, “Test Your Knowledge”, includes the questions through which the students learn about Europe. The questions are based on the learning part, where the students firstly learn about the countries of Europe, and then they are assessed with tests and questions, where they need to have a certain score to pass. Each set of tests and questions is attributed to a certain difficulty level, in which the higher the level, the “trickier” the questions become. The last module, “Find Out More”, implements the functionality in which the student can be redirected to Wikipedia’s page of the country they clicked on. Through this, the students do not need to exit the app to go on Google and search for the country, but they can do this directly from GeoAR by clicking once on the flag. In the next image,
Figure 7, a minimal representation of GeoAR is presented.
Furthermore, during the development of the application, the authors discussed with the teachers about the benefits of using AR in education and, in this case, in the geographical education of the students. The professors admitted that the idea of teaching the students through an AR application is better, because the students are more engaged in the learning process without realizing that they are learning. Therefore, the students think that they only play a game, and so they play it till they are the best at that game. Also, they discovered that the “Test Your Knowledge” module brought improvements in the grades of the students because it was not as stressful as it might be when a written or oral evaluation is given as an assignment to the students.
5. User Evaluation Methodologies Used for AR in Education
As AR technologies continue to be integrated into educational contexts, especially in geography, it is important to examine not only the applications themselves but also the methodologies used to evaluate their usefulness. While the previous section highlighted practical implementations such as FingerTrip and ARETE, this section is dedicated to synthesizing the evaluation strategies used across these implementations. The goal is to better understand how educational impact, usability, and user engagement are measured in AR geographical education.
One of the most often used approaches in these studies is the pre-test/post-test evaluation model [
30]. This method assesses students’ knowledge gain by giving a set of questions or tasks both before and after the AR experience. In the ARETE case, for example, students were tested on geography content prior to using the AR application, and the same or similar assessments were repeated after. The comparative results provided a quantifiable measure of content retention and conceptual understanding. This model is particularly useful for evaluating whether the interactive and visual aspects of AR tools contribute to more effective learning compared to traditional methods.
In addition to direct testing, observational analysis plays a significant role in AR evaluation, especially in real classroom settings where student behavior can be watched over time [
31]. During the FingerTrip testing, for instance, observations focused on how students navigated the AR interface, whether they collaborated naturally with peers, and how much time they spent engaging with the virtual content. These qualitative observations can offer insights that standardized testing might miss, such as student curiosity, initiative, or frustration with system limitations. Teachers’ notes, researcher logs, and video recordings are often used to document these interactions, helping to evaluate the perception and flow of the learning process.
Another important aspect of evaluation is the use of open-ended feedback surveys to collect user feelings from both students and teachers. In multiple studies, including those discussed in the ARETE and FingerTrip platforms, educators were asked to report on the ease of integration of the AR application into the classroom environment and whether the system supported or delayed their teaching objectives. Similarly, students shared subjective impressions of usability, immersion, and enjoyment. Although such methods lack the consistency of quantitative tools, they are often essential for finding areas of improvement or customization needs in the AR devices.
Despite the various evaluation strategies used across the presented cases, one common limitation is the absence of a standardized usability framework, which would allow more consistent comparison across different AR implementations. A recommended solution is the integration of the System Usability Scale (SUS), which is a 10-item questionnaire that provides a reliable evaluation of system usability [
32]. Its adoption in future AR educational research would enable benchmarking across studies and ensure that the user’s experience is evaluated thoroughly. SUS also offers the advantage of being easy to implement in classroom environments without significant time loss.
Furthermore, mixed-methods approaches that combine quantitative tests with qualitative feedback are appearing as a best practice. These methods provide a more general picture, capturing both what students learn and how they experience the learning process. For example, a study may report improved test scores while also finding usability issues or cognitive overload that affected learning effectiveness. Combining pre/post tests, SUS scores, and student interviews offers an understanding of the overall effectiveness of the AR system.
Finally, as the use of immersive technologies in education expands, longitudinal evaluations should be implemented. Most existing studies measure outcomes after a single session or short exposure period. However, to fully understand how AR affects long-term retention and motivation, repeated evaluations over weeks or months are necessary. This is particularly relevant for geography education, where complex thinking and spatial reasoning require a sustained engagement.
Thus, the evaluation methodologies used across the AR systems discussed expose a blend of quantitative testing, observation, and subjective feedback. While these approaches have resulted in positive insights, the field would benefit from more structured evaluation strategies, including standardized usability metrics and longitudinal studies. Using such frameworks would enhance both the credibility and comparability of future AR educational tools, thereby supporting their wider adoption in geography classrooms.
6. Augmented Reality Sandbox
Among the various types of AR applications used in geographical education, the AR Sandbox stands out because it is a tactile and visually immersive learning tool. Due to its relevance to topographical modeling and environmental simulations, this application needs its own dedicated section. The isolation of AR Sandbox from other tools happens not only because it is a widespread tool and has unique pedagogical advantages but also because of the substantial differences in how it is implemented and experienced compared to mobile or screen AR systems.
Moreover, this focus is also justified by the development of a newly constructed AR Sandbox system by the authors as part of this research effort, called AR Topography. This original prototype, inspired by earlier models such as Illuminating Clay and SandScape, was built using accessible hardware, such as the Xbox Kinect sensor and Raspberry Pi, and tailored for an educational environment. Its creation provided direct, practical insights into the strengths and limitations of current systems, observed both in the comparative analysis and future development proposals presented in this section. By combining literature synthesis with first-hand implementation experience, this section offers a more in-depth exploration of AR Sandbox systems in education. Therefore, it is not simply a review of existing literature but also contains added value by original prototyping work and hands-on implementation. As such, the AR Sandbox section serves as a bridge between theoretical applications of AR in geography and their concrete classroom implementations.
Even though there are many types of implementations of AR Sandbox, all of them have the same basis: a sandbox that is filled with a material, which can be modeled in any way, and then the topographic map of that formed landform is displayed on top of the material. According to [
33], a topographic map is a map that represents in great detail a certain landscape, using color-coded heights, usually ranging from dark blue, representing the lowest point, to white, representing the highest point on the map. It may also have contour lines that are closed curves representing areas on the map, which have the same altitude. Also, the contour lines must be drawn at a 100m difference in altitude. The differences between the versions and implementations of the AR Sandbox can be observed in how the topographic map of the landscape created is displayed, the computation used for the topographic map, and the moldable material used.
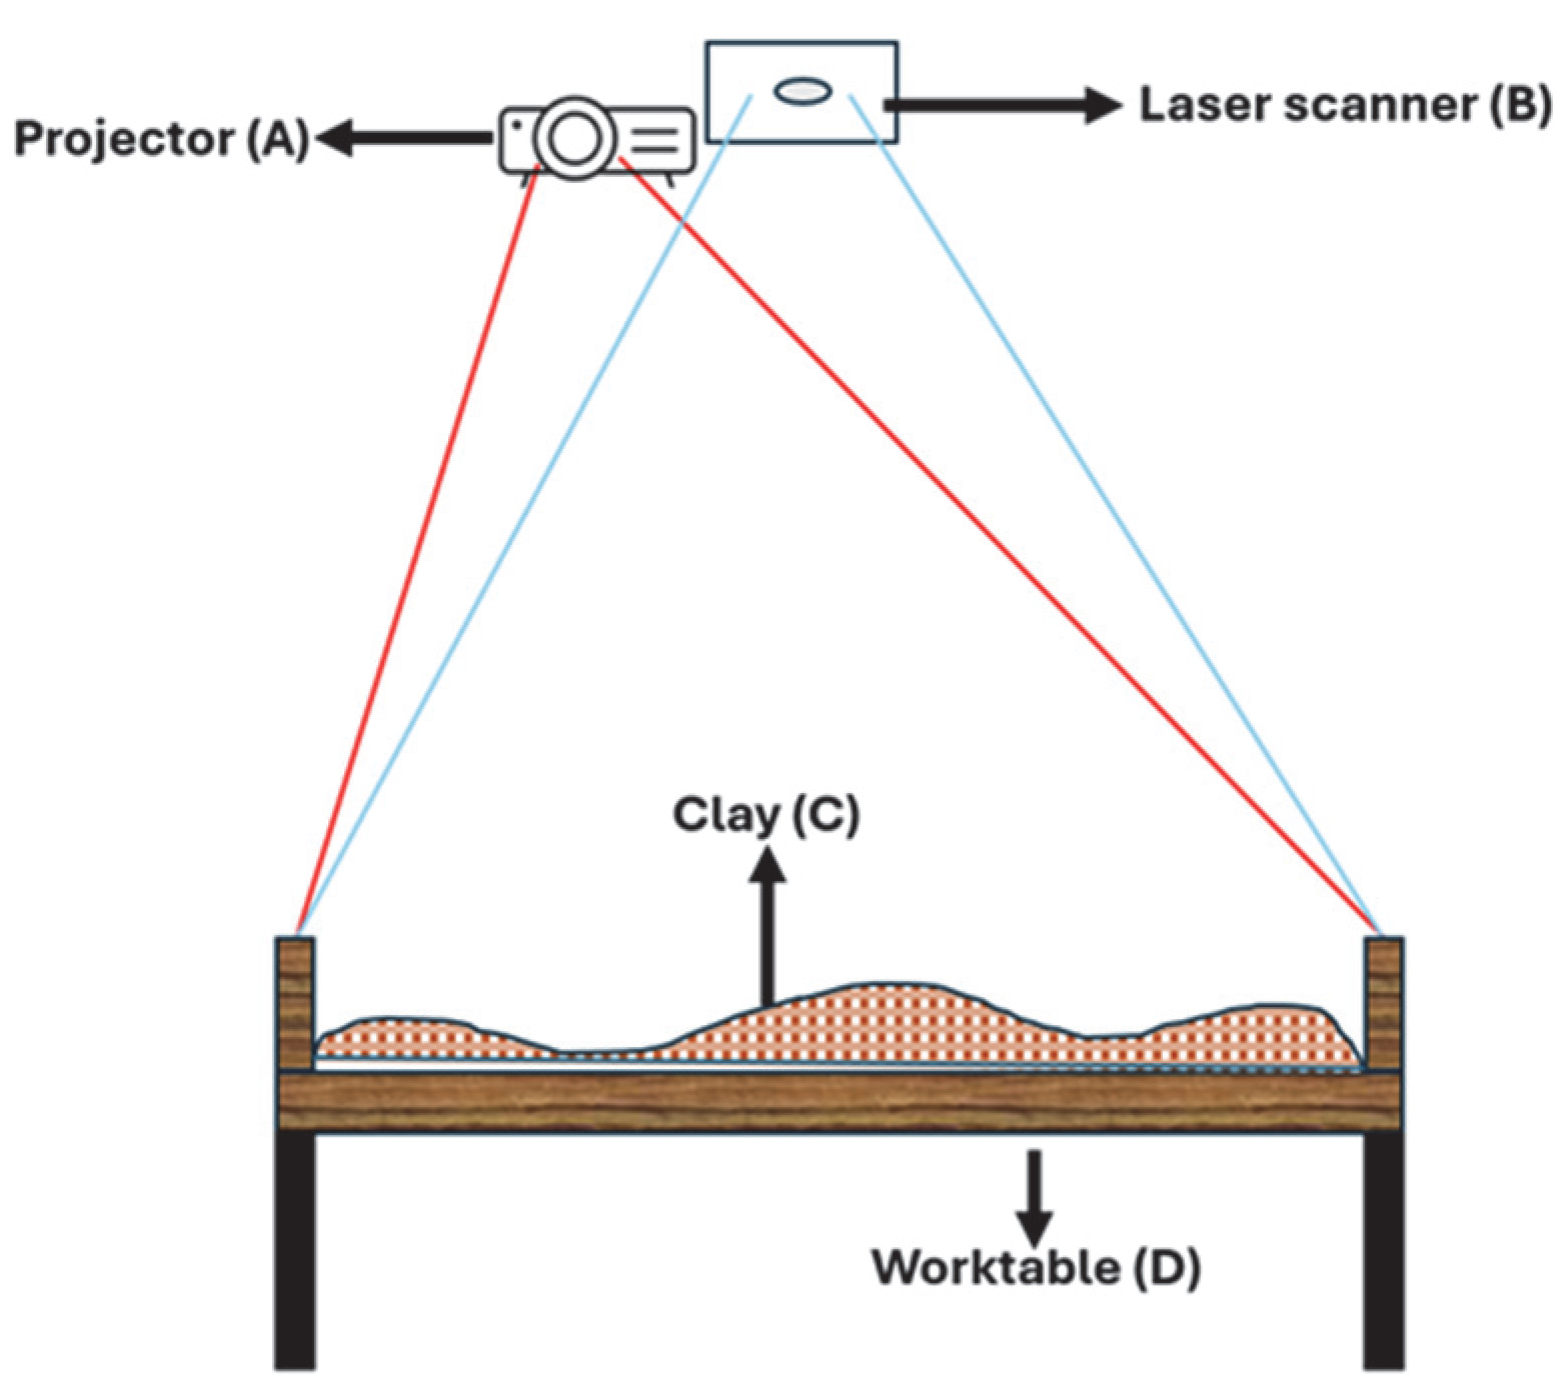
One of the original AR Sandbox versions is Illuminating Clay [
34].
Figure 8 shows a representation of the AR application.
The device enables the user to interact with clay (C), which is a moldable material, within the worktable, represented as D. Then, the geometry and thus, the landscape formed by the user, is continuously scanned by using a laser scanner, represented in the figure as B. The scanned model is sent to a computer, which transforms the landscape into a digital elevation model, which is then projected with the aid of a projector (A), on top of the clay. The moldable material chosen was clay, because the authors stated that they wanted to use a material that is tactile, rich, easy to manipulate, and which allows “freeform landscape manipulations”. For the laser scanning, the authors used a triangulation-based laser scanner, Minolta Vivid-900. The scanner uses a laser sheet to measure the distance from the scanner to the surface. The laser interacts with the object’s surface, in this case the clay, and reflects the laser light. Inside the Minolta Vivid-900, there is the laser emitter and the internal camera that captures the laser that is being reflected.
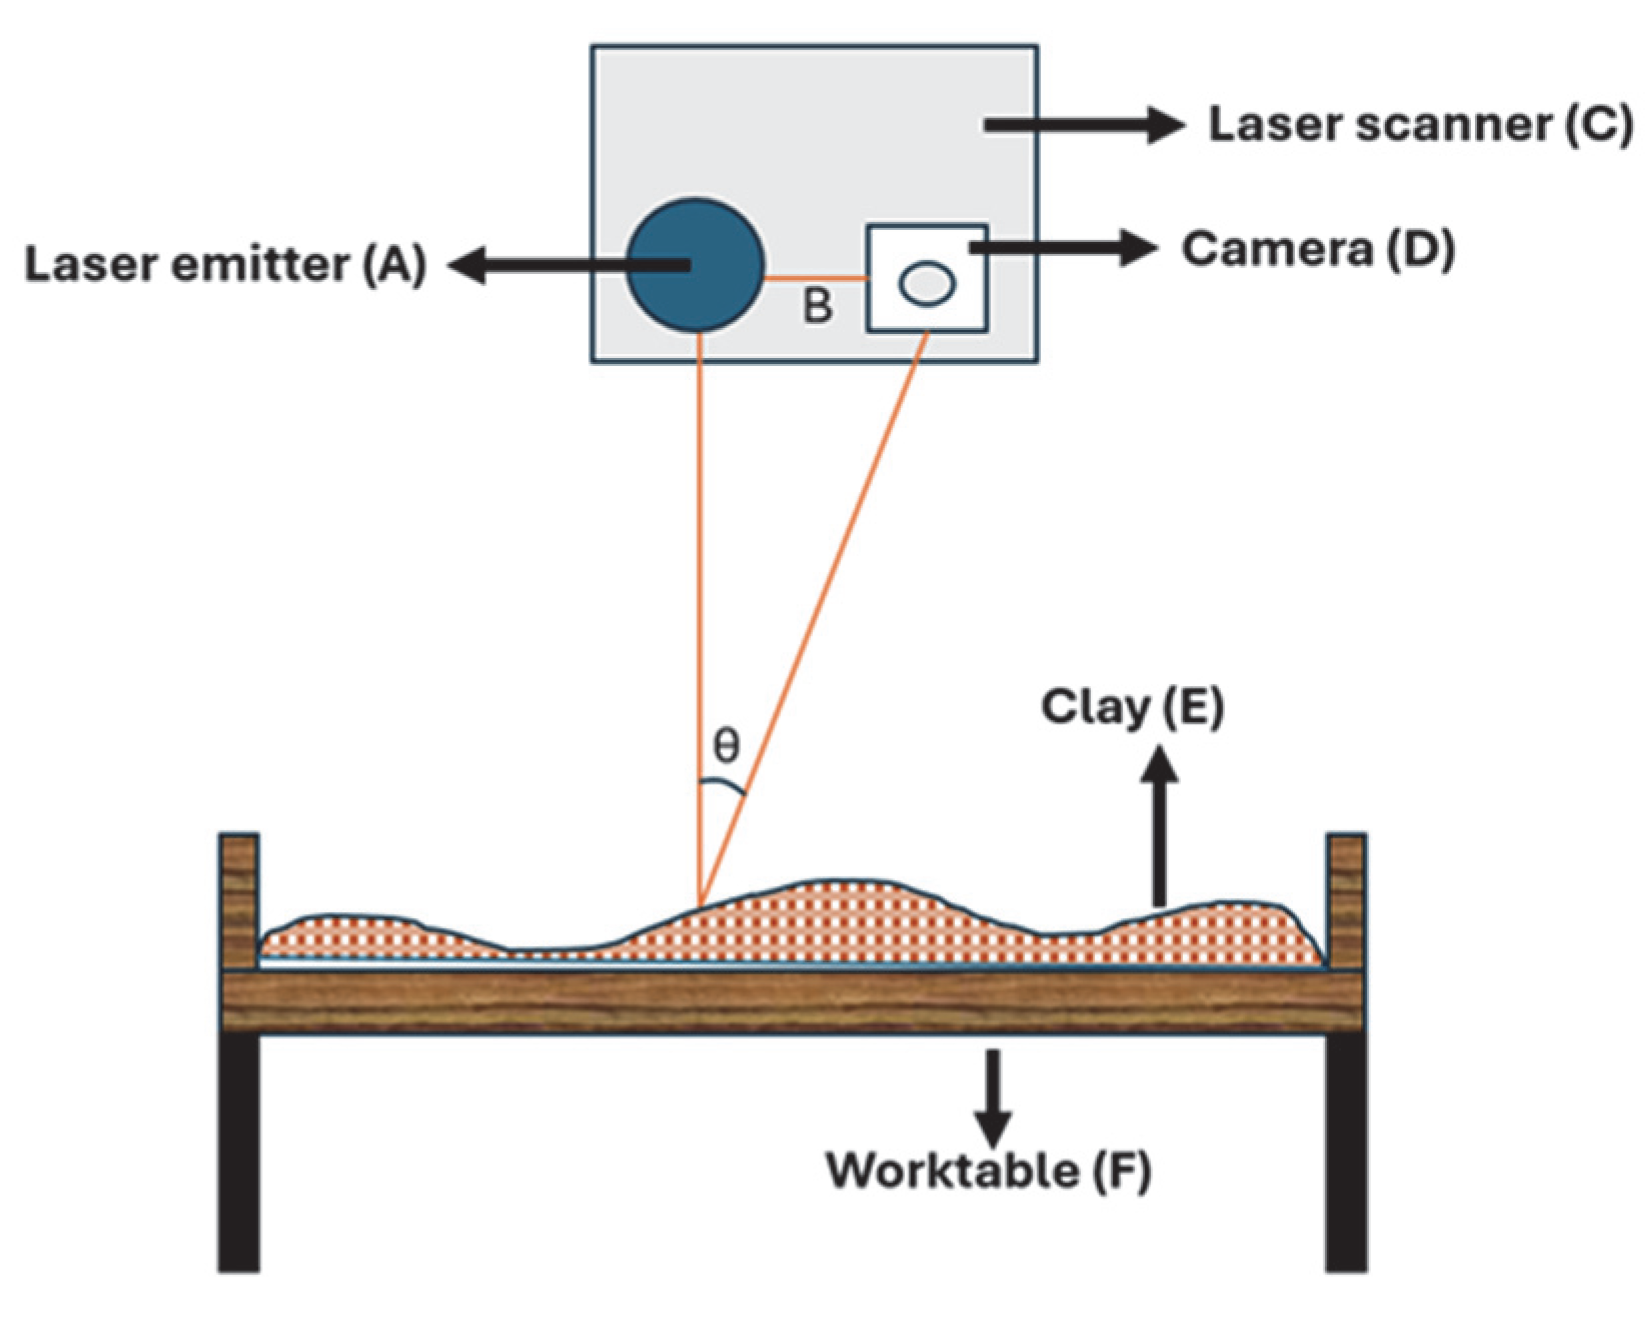
Because the angles and positions of the laser emitter and camera are known, the position of every point in the scanned model can be easily computed using trigonometry. The distance from the laser scanner to a single point on the clay can be determined, by using the following equations, Equations (3) and (4), where B is the distance between the laser emitter and the camera that detects the reflecting laser, θ is the angle between the laser emitter and the clay’s reflected laser, as seen from the camera and ϕ is the angle at which the laser is emitted from the laser emitter.
The angles and distances are also described in
Figure 9, where A is the laser emitter, D is the camera, C is the Minolta Vivid-900, E is the clay, and F is the worktable.
One of the drawbacks described by the author of the paper when using this type of laser scanner is that it was designed to take only single scans of the objects, without the possibility of detecting if the object’s form has changed. To overcome this issue, the authors had to use the software development kit of the laser scanner: Minolta Software Development Kit (SDK). Through this, they could force the laser scanner to scan the clay every 1.2 s, simulating a real-time environment.
The worktable can be anything, ranging from a simple table made of wood to glass, because the area of interest in this case is the model, the clay, which acts as input/output. After the clay is scanned, the model is converted to DEM, which is the Digital Elevation Model. The DEM is the standard used in the geographical science and in topography to store the information [
35]. Using the Digital Elevation Model, the authors managed to implement a couple of functions that the users can play with. For example, the users of Illuminating Clay can read the slope variation and curvature in different points, which were computed by applying two Sobel Filters to determine the x and y derivatives of a certain point on the topographic map. Then, the slope value is shown on the clay by using a color map, where red represents the highest value and purple is the lowest value. Another function is the “Shadows and solar radiation”, which allows the users to observe how the shadows would be projected for different positions of the Sun. Also, it is possible to simulate a whole year timelapse to determine the radiation coming from the Sun at a certain point. This could be useful when the user wants to simulate different conditions for crop management, housing complex buildings, or solar energy collectors. Lastly, the user can use the “Water flow and land erosion” function to simulate the consequences of intervening in the natural environment and how the water would affect the surroundings in that case. This can be useful in case somebody wants to build houses, dams, roads, or other constructions that affect the natural environment. For this, the authors developed an algorithm that computes in real time the local drain direction, but they also used some of the functionalities from the GRASS open-source library.
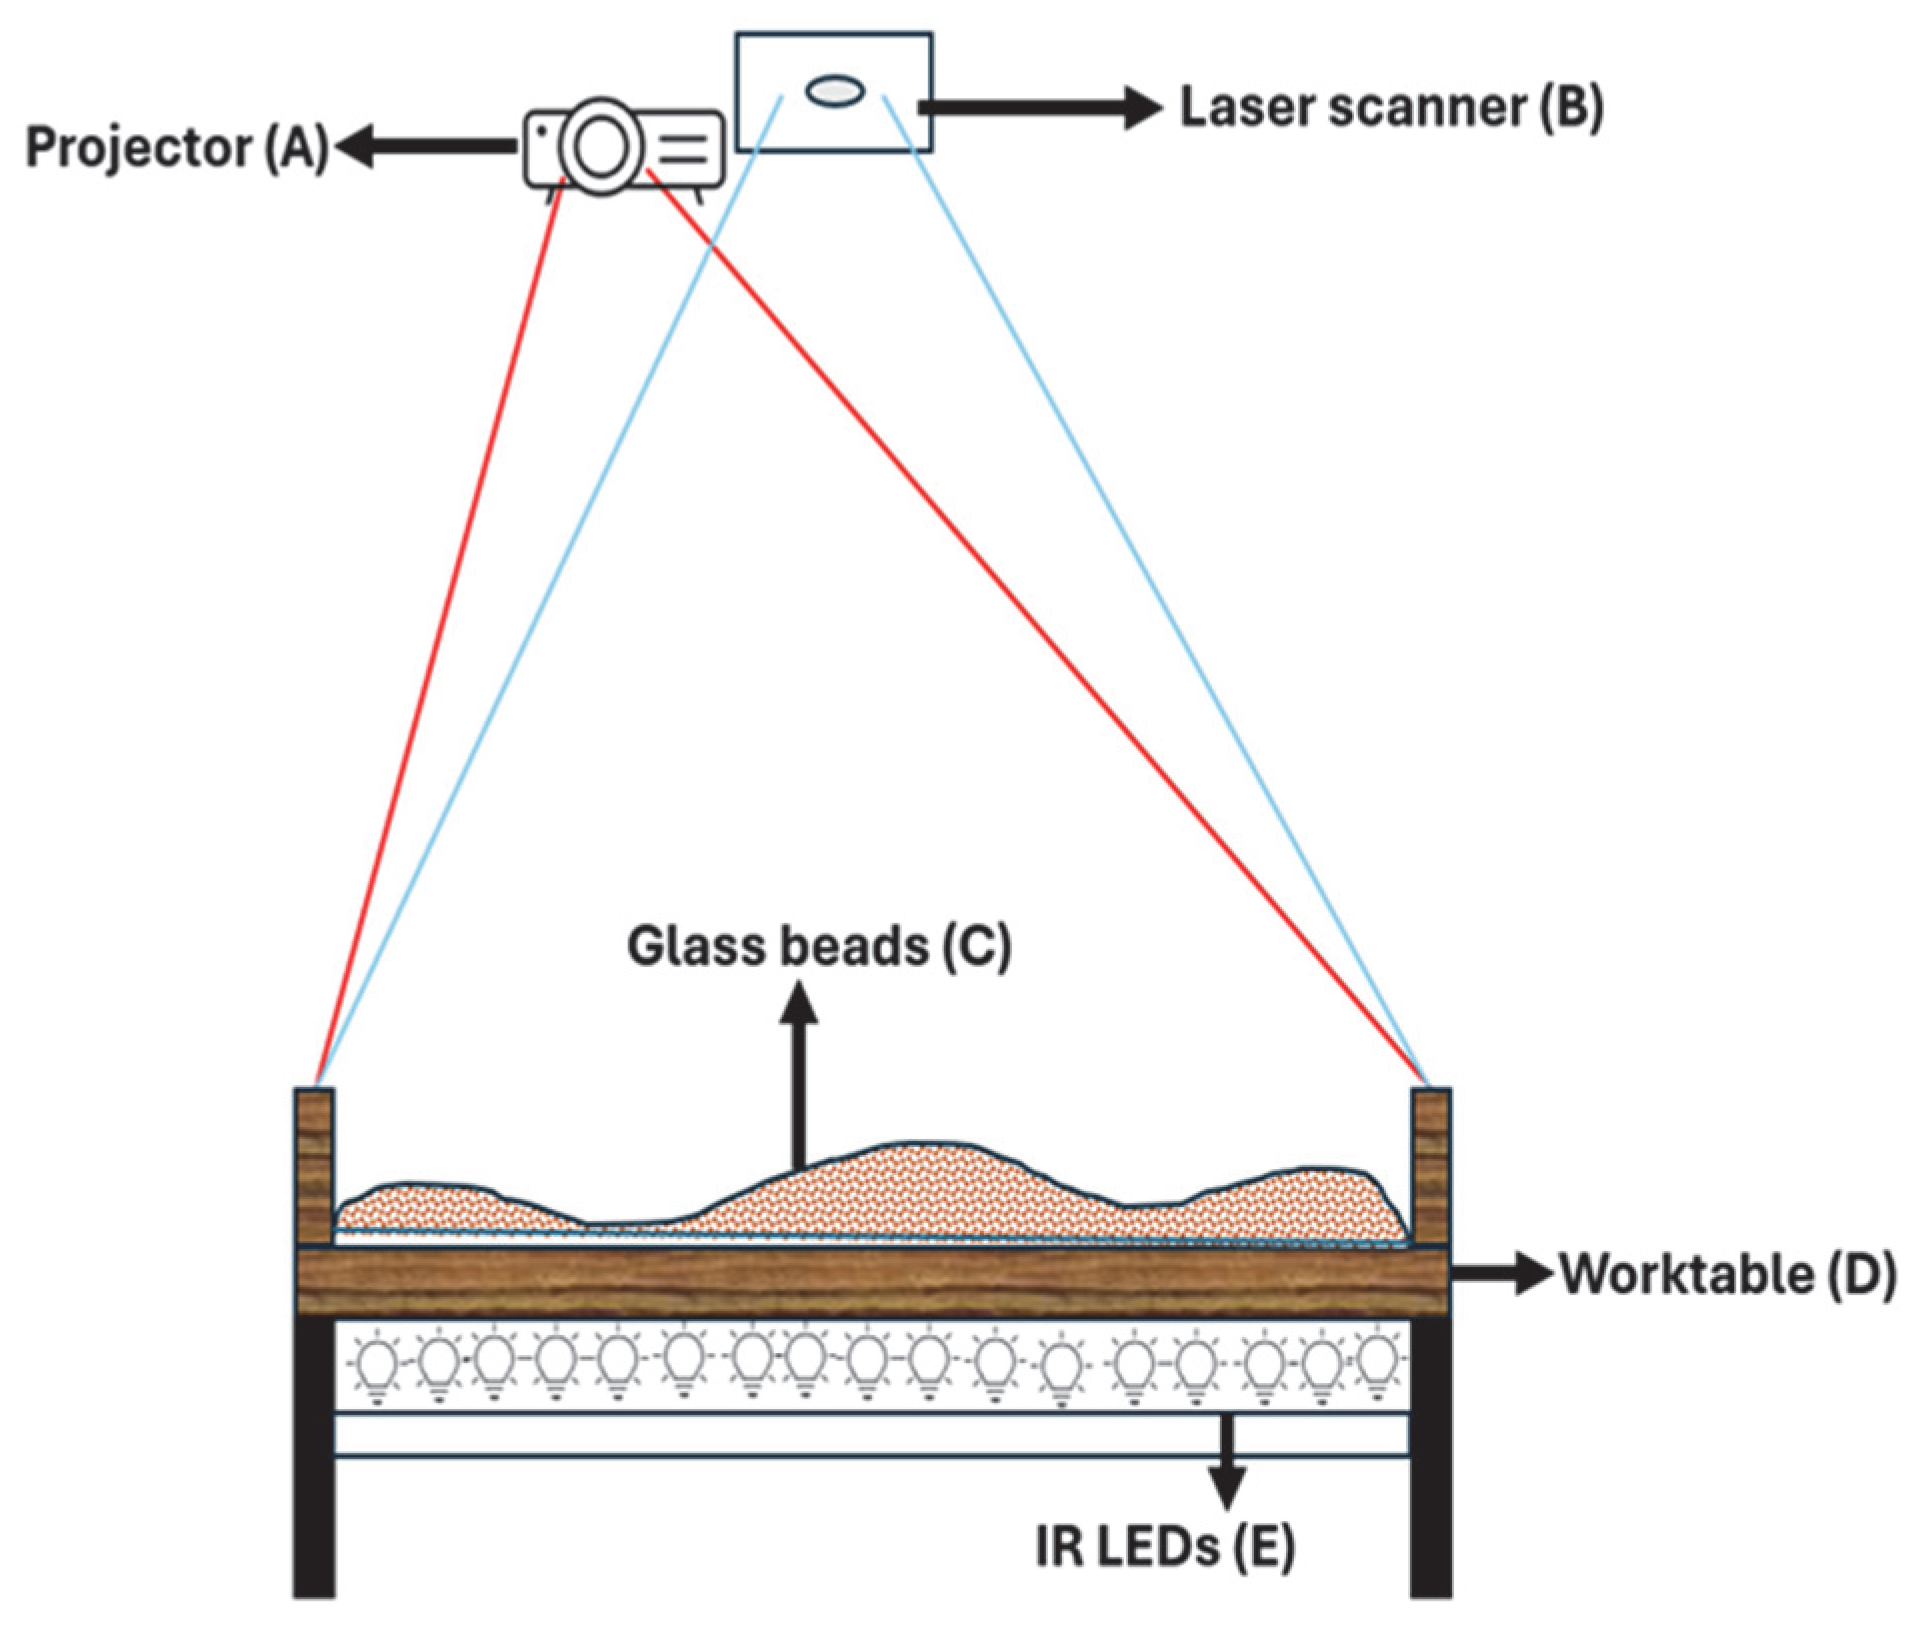
Following the implementation of Illuminating Clay, the same authors, H. Ishii et al., describe another way of implementing the AR Sandbox device. In the same paper, the authors describe the SandScape, which is depicted in
Figure 10.
The device is based on a box (D) containing 1mm diameter glass beads (C), which are lit from beneath with 600 high-power infra-red light (IR) LEDs (E). Also, to compensate for the uneven distribution of the IR light on the boundaries of the box, four IR mirrors are placed in the proximity of the margins. Then, represented as B in the figure, the IR camera senses the intensity of the light that passes through the volume made by the beads. By performing this, the depth of the model can be obtained, as more lit zones mean a lower level and less lit zones mean a higher altitude. Moreover, if for Illuminating Clay, there was practically no need for a box, this time the worktable needs to be adapted to a box of different sizes, such that it can provide a reasonable volume to include the glass beads.
Regarding the other functionalities of the SandScape application, they are the same as the ones of the Illuminating Clay, because this type of application also uses the DEM standard, thus the authors being able to implement the “Slope variation and curvature”, “Shadows and solar radiation” and “Water flow and land erosion”. In the end, the authors of the paper present the future work that can be achieved: as the prices for storage declines and the potential of computing increases, a lot of functionalities that, till then, were only performed in simulations, could be easily achieved through such AR applications, and thus, people will understand the process of changing the surrounding environment.
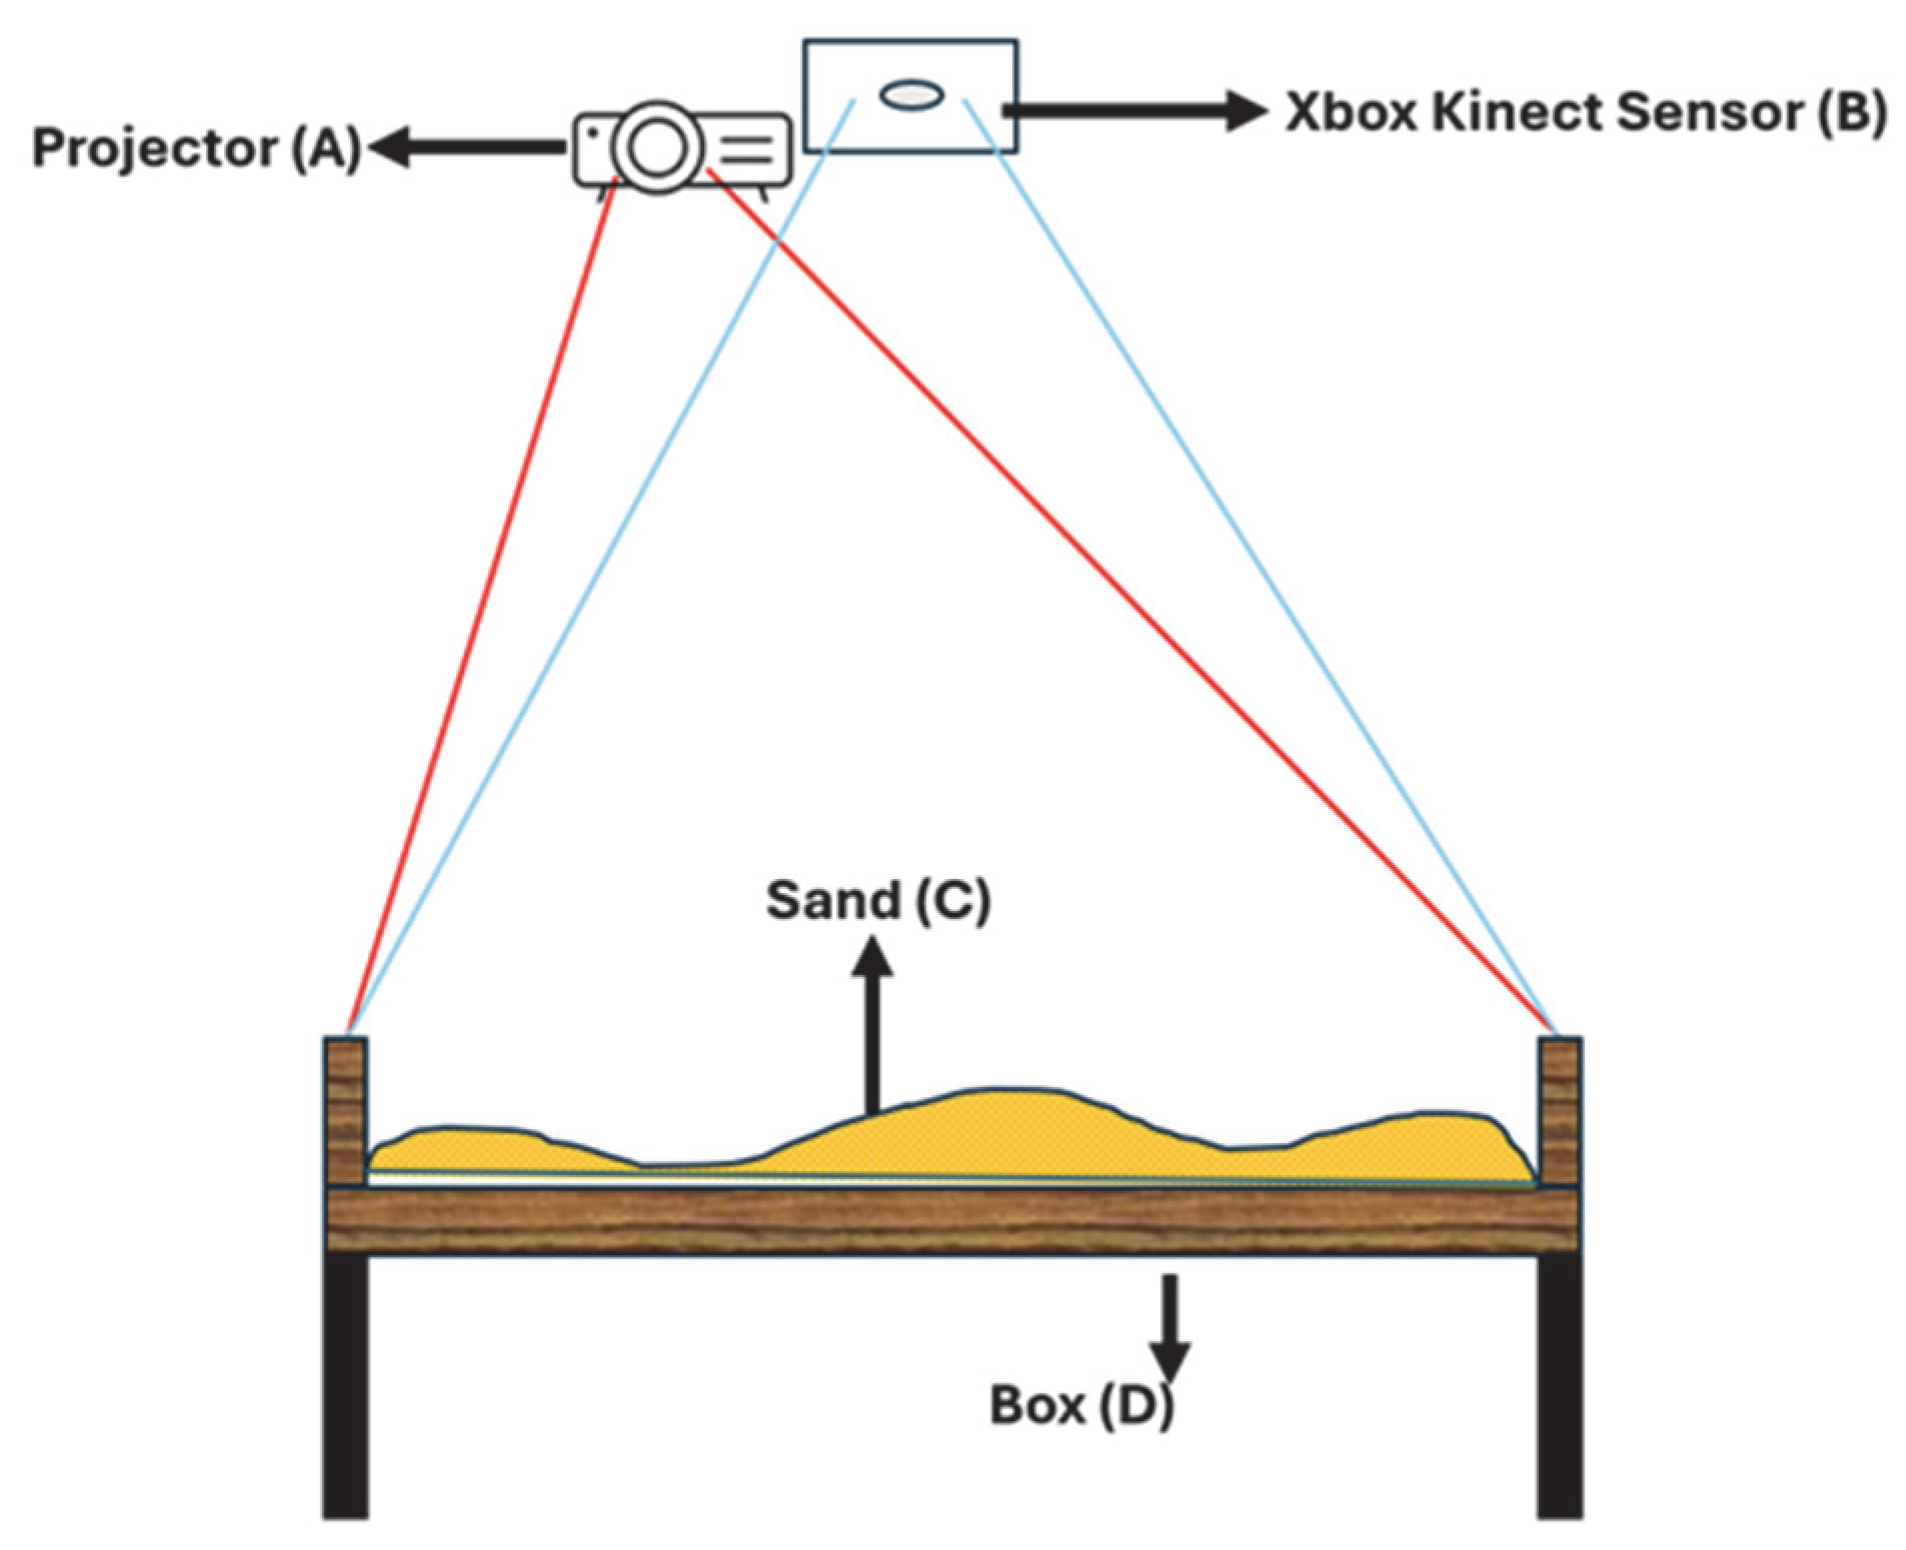
Another way of implementing the AR Sandbox is presented by Sanchez et al. [
36], and it is shown in
Figure 11.
The AR Sandbox is made out of 4 big parts: the projector (A), used to show the topographic map, the Xbox 360 Kinect Sensor (B), used to capture the depth image, the sand (C), which is chosen for being the moldable material, and the box for the sand (D).
The box is constructed out of wood and has no wheels, making it not so easy to move around. Then, the box is filled with the moldable material, which in this case, the authors choose to be sand. The surface of the sand is then transformed into a digital model with the aid of the Xbox 360 Kinect Sensor. The sensor works by sending IR light toward the sandbox, and then the IR light bounces back to the sensor. The received IR light is captured by the IR camera within the same Xbox 360 Kinect and creates a depth image of the landform from the sandbox. Then, using the depth image, a computer determines the topographic map and sends it to the projector. The projector shows the image and permits seeing the different heights by using the contour lines. The functionality that the author implemented, apart from the topographic map being projected on top of the sand, is the possibility to produce rain. By placing the hand over a specific area of the sandbox, this feature allows the water level to increase and collect in that area in accordance with the landscape after a few seconds. Also, the rise of the water level is directly proportional to how many seconds the hand is kept over a specific zone. In order that the authors implemented the real-time water simulation, they had to solve the Navier–Stokes equation [
37], presented in Equation (5), where u is the fluid velocity vector, P is the fluid pressure,
ρ is the fluid density,
ϑ is the kinematic viscosity and the ∇
2 is the Laplacian operator.
Through this type of simulation, the application can produce realistic and high-fidelity flows of rivers and bodies of water.
Having in mind all of these implementations of the AR Sandbox, a number of advantages and disadvantages of using this approach to teach geographical education can be presented. First, the students can use the AR Sandbox to understand complex topographic maps more quickly and how the water would flow if some changes to natural environments were to occur. Also, by using this type of application, the students could save a lot of time, as these simulations would require a long period of time to implement in CAD-like applications. So, through AR Sandbox, students would benefit from an easier way of dealing with and working with topographic maps.
Another advantage of using this implementation of AR application would be that the students interact with the sand in real life and thus, the understanding of what is happening in the created topographic map is deeper. For example, in a CAD environment, this would be difficult to achieve through a mouse and keyboard, as there would be only a computer simulation, not a real, interactive one. Moreover, the AR application can be a fantastic way of improving collaboration between students from different branches of specialization. For example, AR Sandbox can bring together students from architecture, urban design, earth engineers, water engineers, land economics, and many more, as these implementations have a lot of functionalities to offer: water simulations, shadows and solar radiation simulations, least cost of passage, land erosion simulations.
In addition, AR Sandbox could be used not only by students who are learning geography or other subjects, but also by non-specialists who would only want to experiment with the geography field and the creation of topographic maps. People often feel comfortable modeling sand, clay, or glass beads to test their own scenarios instead of using cumbersome applications that are based on CAD. According to [
34], the Department of Urban Studies and Planning of the University of Minnesota used the Illuminating Clay devices to teach a class. After they finished, the teachers were asked about their opinion on the AR application, and they were thrilled. The professors admitted that the system simplified the whole process of teaching, and the basic principles of contour lines, of topography, and how a topographic map was created, were much simpler to explain. Additionally, they observed the fact that in CAD environments, only one student could work on a project. Now, everybody could contribute, facilitating the teamwork.
Also, AR Sandbox, even though it is an AR application, does not use screens, and this could benefit young students, as they are using phones and screens for long periods. Through this, the students can lower their exposure to blue light, which is extremely dangerous to the eyes and to mental health, provoking many cases of anxiety.
Lastly, the students can use the AR Sandbox to make the transition from a static way of learning geography to a more dynamic way. So, through this application, the students can visualize and model the sand to form topographic maps, rather than just using maps that are 2D models.
Of course, like any devices, there are a couple of disadvantages in using the AR Sandbox. First, the students could become cognitively overwhelmed, like in the case of any other AR device. For example, if the students are undergoing fast transitions between the models and they are given a great number of explanations, an overwhelming feeling could be produced because they were used to learning through maps and other didactical materials [
38]. Also, when it comes to details in the water simulation and even in the topographic models, the CAD environments and applications are better and more detailed. This can be a downside if someone wants to work with the AR Sandbox and puts great hope in the details. For example, the water simulations and land erosion are more versatile and easier to follow than those in the AR Sandbox.
Lastly, the students who are not used to playing with AR applications can find using AR Sandbox quite hard. Like for the rest of the AR applications, it is recommended that, for the first time, somebody with experience in using AR applications show the students how to use it and what rules to follow to not break it. By doing this, not only could the new students in AR learn how they can use the technology, but they could also instruct other students during their turns.
In the next table,
Table 2, a short but comprehensive comparative analysis between the three implementations of AR Sandbox, Illuminating Clay, SandScape, and AR Sandbox, is presented.
As can be seen in
Table 2, the maneuverability of the Illuminating Clay is the best among the three implementations, as it requires only a support for the clay. For the SandScape and for the AR Sandbox, because there is a need for a box to sustain the materials used, the authors built a frame. Unfortunately, the frames are not movable, which makes them have a lower maneuverability index.
Regarding the laser scanner used, for implementing Illuminating Clay, the authors used a high precision 3D laser scanner, Minolta Vivid-900. Even though this type of laser scanner is a high-end one, it is amazingly easy to use and to mount, making it a great entry point in the domain of high detail laser scanning. In the case of SandScape, the authors used an IR camera that detects the intensity of the IR light that is being dissipated in the medium used. For the last implementation presented, AR Sandbox, the authors used the sensor of an Xbox 360 Kinect because it is a sensor available to everyone and easily mounted and connected to a computer. All of the implementations use IR light so that the camera can detect the model that is being scanned.
One of the main differences between the three methods of scanning is the accuracy of the resulting model. Because the Illuminating Clay used a high-end laser scanner, Minolta Vivid-900, this implementation has the highest accuracy, ±0.1 mm. Next is the SandScape implementation, being able to have an error of only ±1–3 mm. In the end, the worst accuracy was obtained with the Xbox 360 Kinect, having an error of ±2–4 mm. For testing purposes, the height of the laser scanners was set to 2 m. Also, if for the Minolta Vivid-900 and for the Xbox 360 Kinect only the height would make a difference to the accuracy of the scanned model, the IR camera of the SandScape implementation would vary the accuracy not only because of the height but also because of different factors like: the thermal properties of the material used for simulating the landforms, the quality of the camera or the wavelength of the IR light.
Everyone used a projector to show the topographic map over the material used for each of the AR Sandbox implementations. The material used for modeling and simulating the topographic map was different for each of the three versions. For the Illuminating Clay application, the authors used a clay that is moldable, and it is easy for the students to use. Nevertheless, the clay is easy to break apart and, thus, new clay is needed. For SandScape, the authors used glass beads, which are 1 mm in diameter. Even though this seems like a great option, they might be dangerous to young students as they are easily ingested and could be choking hazards. Moreover, the glass beads could become increasingly more opaque because of the friction from the modeling, and thus, the IR light density would decrease, resulting in erroneous simulations. For AR Sandbox, the authors used sand, which can be a great alternative for both clay and glass beads. It is easily moldable, easy to replace, and not so dangerous to students. Because of the materials used, the robustness of the applications was considered low for Illuminating Clay and too high for AR Sandbox. The materials used to enclose the sand were a box made out of wood, whereas for the glass beads, a glass box was needed. For Illuminating Clay, the material on which the clay stands could be made from anything, as only the clay is captured.
The computing device used for all of the versions was the personal computer, as it had the highest capabilities to compute the topographic map and to implement all the functionalities described. However, these computers are quite heavy and big for AR Sandbox to be an independent unit, which can be used everywhere without the need for a PC.
The 3D model that is transmitted to the computer differs from version to version: for Illuminating Clay and SandScape, the authors used the standard in geology and topography, the DEM model, and for the AR Sandbox, the authors used the depth image and image processing. The number of functionalities implemented is the same for the Illuminating Clay and SandScape, having six functions: DEM, slope variation and curvature, shadows and solar radiation, viewshed, least cost of passage, water flow, and land erosion. In contrast, the AR Sandbox has only one functionality, rain and water real-time simulation.
Lastly, taking into consideration all of the above, the materials used, the laser scanners, the computing devices and the number of functions, the price for the models can be compared: for the Illuminating Clay, mainly because of the laser scanner, the price is high, and it is not so affordable by the schools and teachers. Then, the SandScape version gave up the high-end laser scanner and used an ingenious way of determining the height, through IR light coming from below, which is detected by an IR camera. But, because of the glass beads needed to cover the sandbox, the price for this model is a moderate one. Finally, the AR Sandbox proposed the use of an Xbox 360 Kinect sensor and a box filled with sand, which is affordable to anyone and can be most easily used in schools by students and teachers.
7. Future Developments
Based on the comparative analysis performed in
Section 6, a number of future improvements can be proposed and discussed. First, when looking at the computing devices the Illuminating Clay, SandScape, and AR Sandbox use, it can be observed that all of them use a personal computer, such as a laptop. Because it is quite inaccessible to always have a laptop that can be connected to the sandbox or to leave a laptop connected all the time, it can be easily replaced by a development board, such as a Raspberry Pi. The Raspberry Pi produces several versions, such as Raspberry Pi Model 5, Raspberry Pi 500, which is an all-in-one keyboard-PC, Raspberry Pi Pico, or Raspberry Pi Zero. For this type of application, a more powerful model is needed, because a lot of hard computations must be performed, and it needs to be able to create and display through the projector the topographic map. To achieve this, the Raspberry Pi Model 4B can be used. So, by using this type of development board, the implementations of AR Sandbox become easier to use and to be transported from class to class, without worrying about the computing device, as it fulfils the same tasks as a laptop, having almost the same performance.
Additionally, the water simulations that are implemented as functionalities in the versions of AR Sandbox use the Navier–Stokes equation in real time (Equation (5)). Although by using this equation, the water simulations are highly detailed and have a high degree of accuracy, this can be a heavy task for a laptop, and even a more difficult task for a Raspberry Pi, as it does not have that many computing capabilities. Also, because there are partial differential equations (PDEs), the computations for the Navier–Stokes equation can quickly load the CPU, which is not desired in this kind of application [
39]. To solve this problem, M. Muller-Fischer proposes a solution [
40], where the height map for fluid simulations is based on the heights at each point, which can be obtained from the DEM model or from the depth image. Then, having the heights, the difference between each neighboring point can be calculated, thus obtaining a simulation of how the water would flow from high points to lower points on the map. Of course, this is rather an approximation to the Navier–Stokes equation, but by using this method, the development board or the laptop can compute the water simulation much faster, as this is an iterative algorithm. To obtain the flow of water, Equation (6) can be used, where Height(x,y) is the total height of the terrain at the point (x,y), summed up with the total water height at the same point.
To update the water height map, each of the already available values in the water height map is multiplied by a coefficient that represents the flow speed, determining how fast the water is moving on the topographic map. Finally, in order that there are no negative values for the flow of the water, the whole water height map is checked using the following equation (Equation (7)):
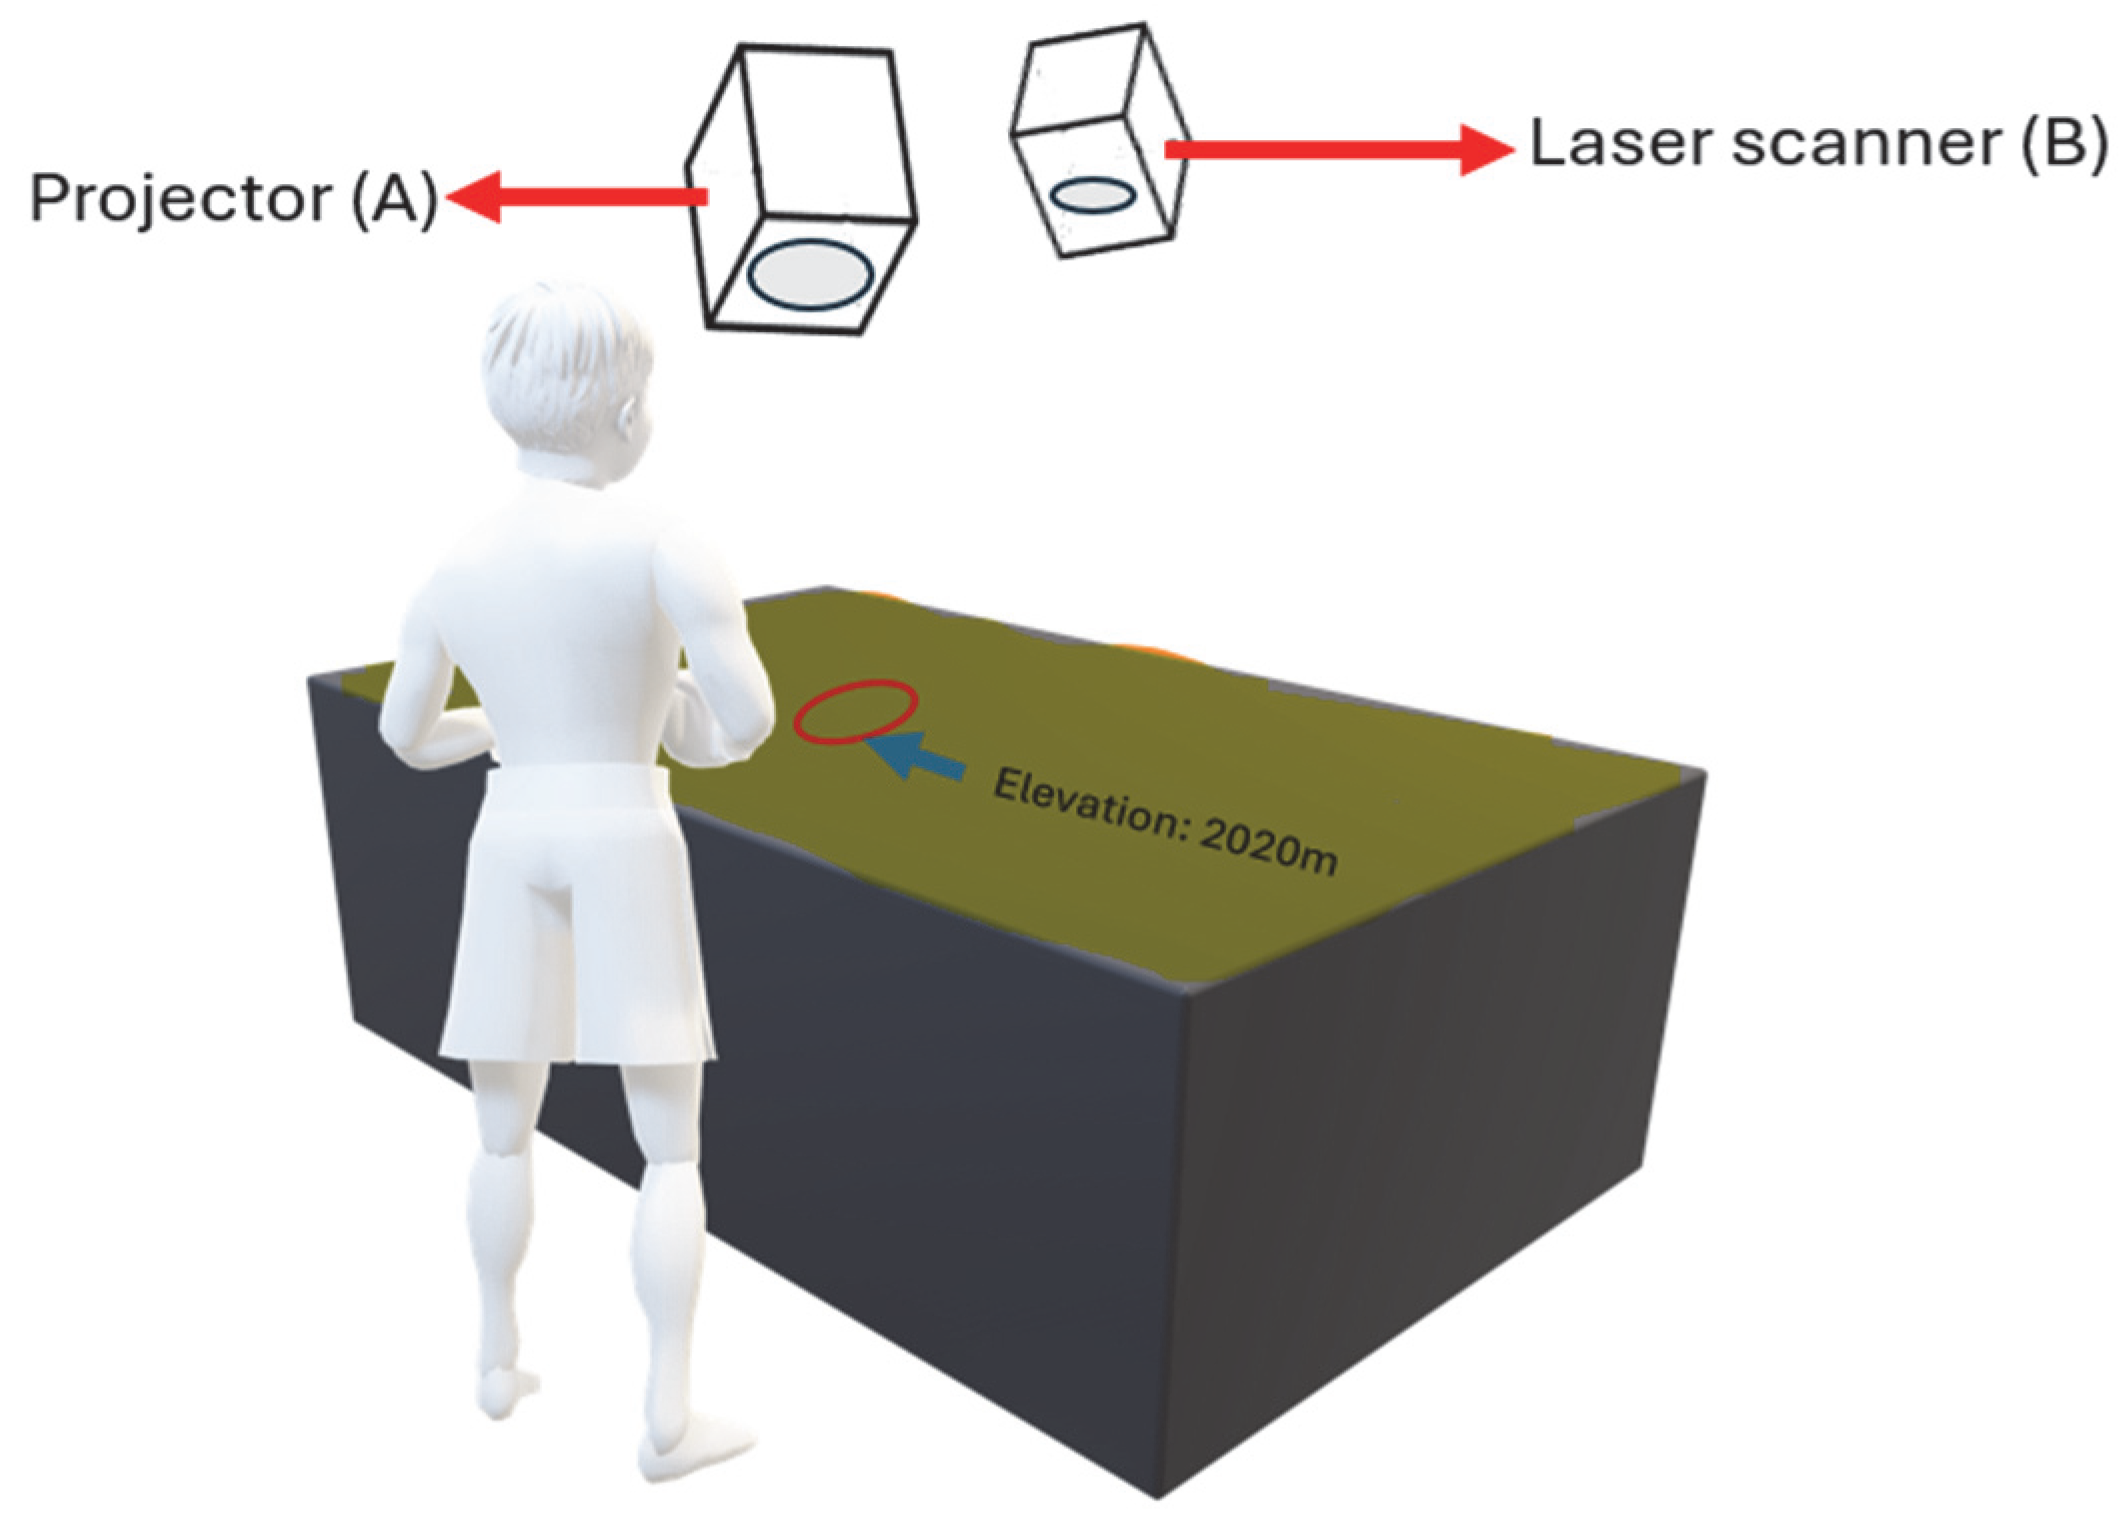
Another improvement that can be brought to the versions of AR Sandbox would be to implement more hand recognition functionalities. For example, if the students or the teacher use their hands in a pinch mode over the sandbox, the camera (B) would recognize the form of their hand and would detect the point that they are showing. Thus, at that specific selected point, the elevation would be shown on top of the topographic map by using the projector (A), as presented in
Figure 12.
Through this, the professors can make their lessons more dynamic and could improve the attention span of the students. Also, the teachers would be able to present to the students more information, and thus, it would be easier for them to remember different information about the topic discussed. Regarding the students, they would be more involved in the subject, and they would work better in teams to find different answers to questions asked by their professor. Therefore, the grades for the geography subject would be improved, and the bonding between the class colleagues would improve.
Also, the material used by the AR Sandbox can be changed to kinetic sand, as this material is very easy to model and does not create any mess. The kinetic sand is a type of play sand that is composed out of sand coated with silicone oil holding its shape when squeezed.
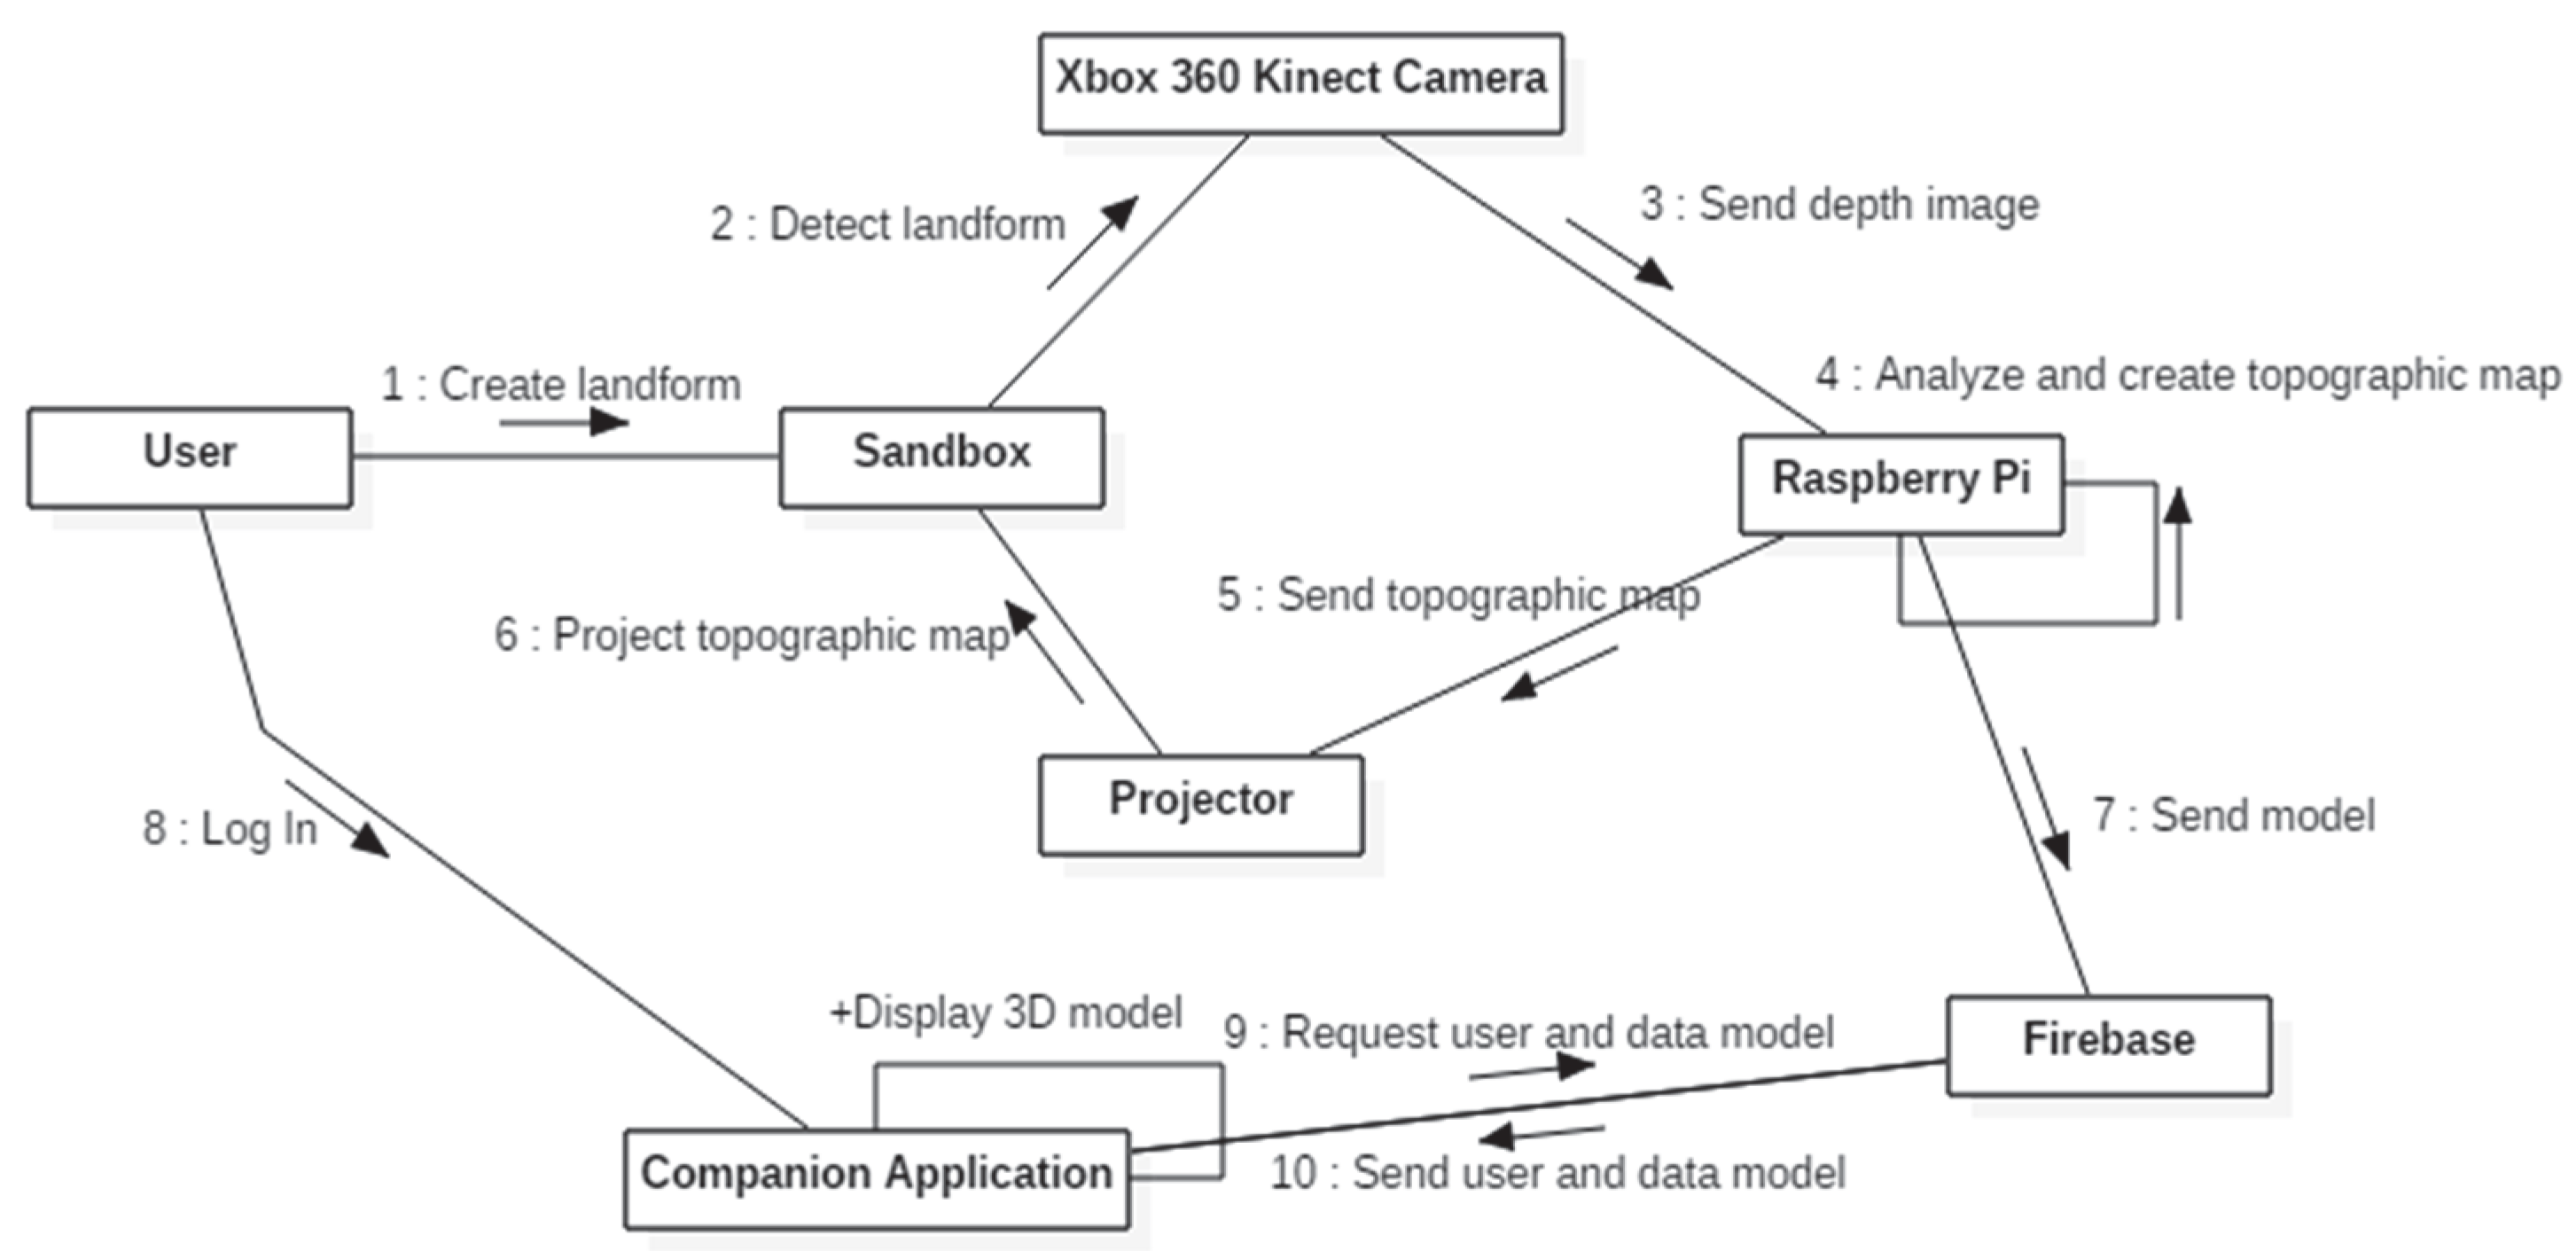
Lastly, the most important improvement to all the implementations of AR Sandbox would be to build a mobile application that allows the students to improve their knowledge about the geographical landforms and the professors to present their subject better. To explain in more detail how the whole system would work, a communication diagram is provided in
Figure 13.
The user starts to interact with the sand from the sandbox by moving with it and playing, creating new landforms. Then, the Xbox 360 Kinect Sensor detects the fact that the form of the sand has changed and captures a depth image. The depth image is sent to the Raspberry Pi, which applies image processing to it. Based on the newly acquired depth image, a topographic map is created and transmitted to the projector that displays it over the sand.
At the same time, the development board sends the topographic map to the projector, and the data within the topographic map is sent to the Firebase, which is a Backend as a Service (BaaS) solution that also includes the possibility to store data and images.
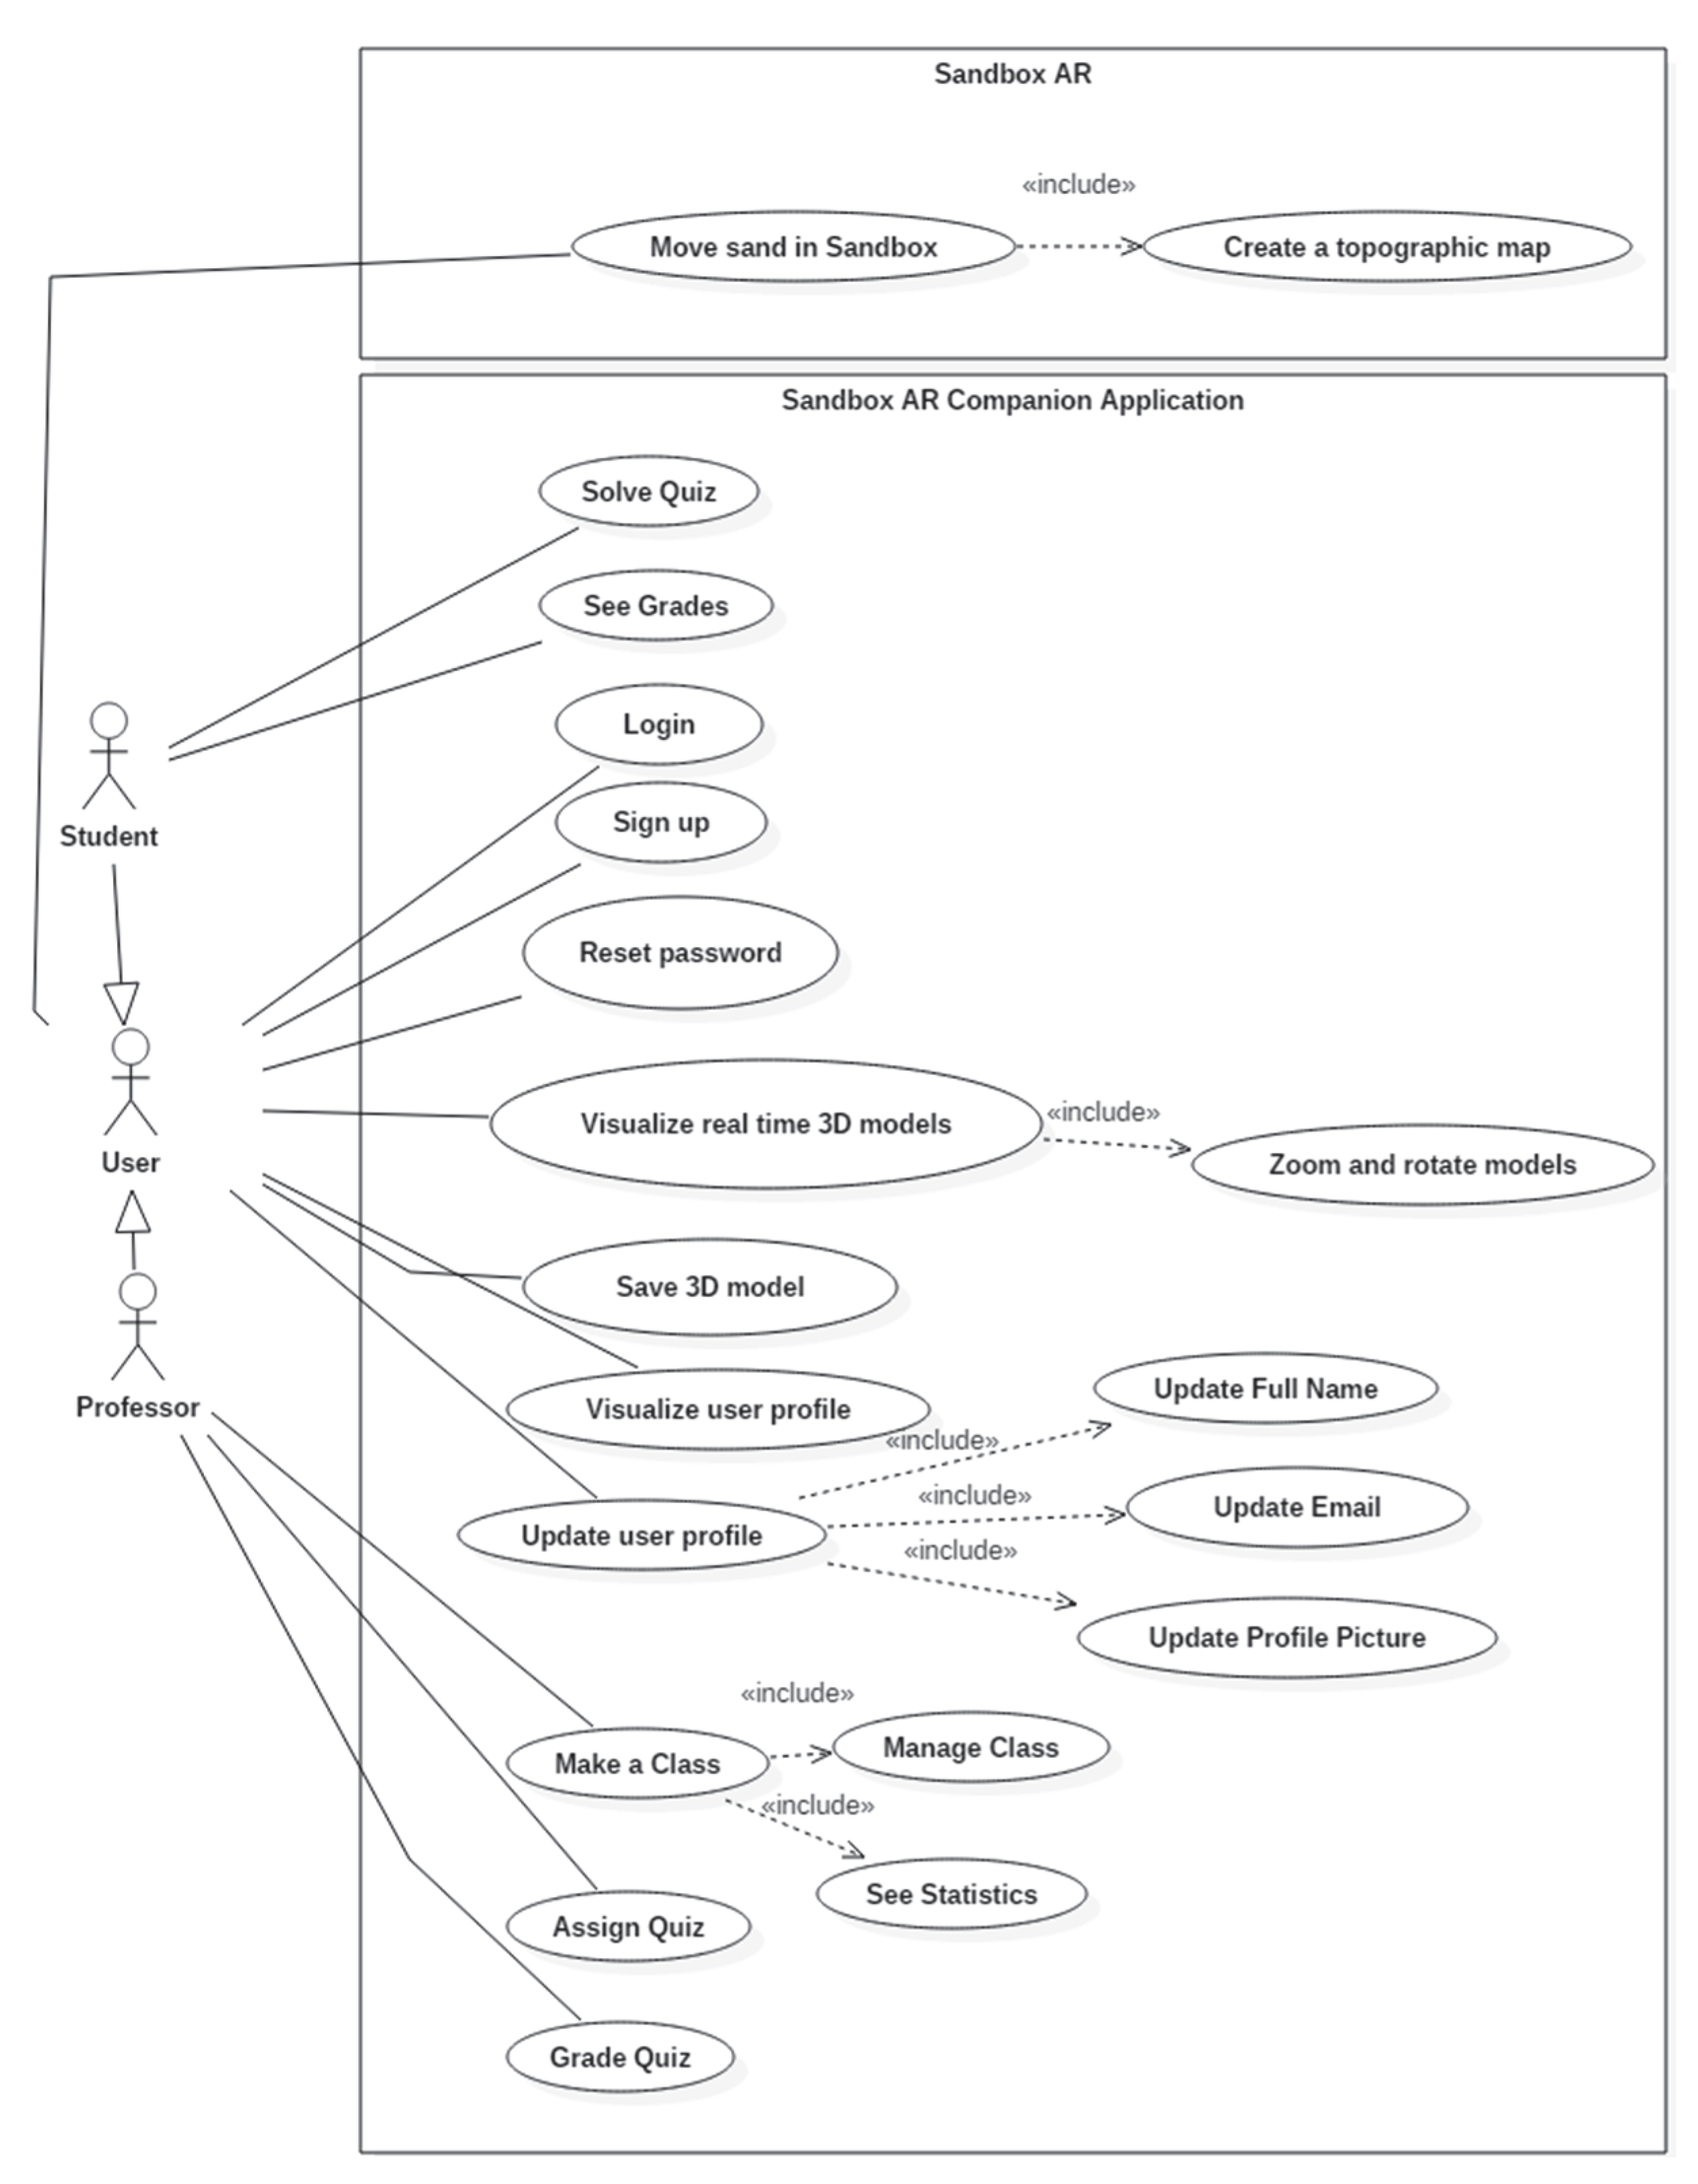
After the user logs into the companion application, the mobile app sends requests to the Firebase to retrieve data about the user and about the live model. Then, after the request is approved, the data is displayed in the application. A normal user can interact freely with the AR Sandbox by moving the sand and, thus, creating a topographic map. Within the application, the normal user can only log in, sign up, or reset their password, in case they forgot it. During the sign-up process, the user can choose to be either a professor or a student. The choice determines the available functionalities. Both types of users can visualize in real time the 3D model of the landform created in the sandbox, move around and play with the 3D model, save 3D models to observe and study them later, and can update their profile, including the name, the email address, and the profile picture. The user type “professor” can additionally create a class within the companion application and manage the class by adding students to it. The students inside the class can be assigned quizzes, and the professor can grade them. Moreover, the application can show the teachers statistics about the grades of the students. The user type “student” can be part of a class and can solve quizzes assigned by their professor. Also, they can see their grades and how the quizzes would be solved correctly.
The next figure,
Figure 14, presents the use case diagram of the application described above.
One of the advantages of using a mobile companion application for the AR Sandbox would be the possibility for students to observe the 3D model generated from the depth image captured from the sandbox in more detail and with more information. Through this, they can see the topographic map created, even though they may not see the sandbox closely. Moreover, the functionality of saving the 3D models for later could be a huge advantage for students, as they can study in more depth and could revise the 3D models discussed in the class. Regarding the teachers, they can use the application to manage the students in the classroom. By doing this, they can assign quizzes to help the students learn better, and the topics can be discussed in more depth. Also, they can follow certain statistics related to the grades obtained by the students, and if they observe some irregularities, they can improve the performance of such students through the AR Sandbox and its functionalities.
However, there are also a couple of disadvantages, like the exposure to the blue light emitted by the screen, which does not have any benefits for any of the students. In addition, there may exist difficulties for students to handle such companion applications, as there may be users at a very young age. Also, the application may not be downloadable or usable on the phones of young students, as they may not possess a smartphone or a tablet.


